western pacific region - wpro iris · top ten causes under which the largest number of eases have...
TRANSCRIPT


WESTERN PACIFIC REGION
DATABANK
ON
RESTRICTED: For Internal Use Only
WHO/WPR/HIN August 1983 Rev/Jun 1984 Rev/Dec 1984 Rev/Dec 1985
SOCIOECONOMIC AND HEALTH INDICA TORS
Manila, Philippines

PREFACE
The Socioeconomic and Health Indicators Data Bank was established in 1979 by the Regional Office for the Western Pacific of the World Health Organization as a basis for studying the health situation in the Region and assessing health trends. In 1981, the information provided by the data bank was corrected and updated and data in respect of thirteen additional indicators were added. An attempt was also made to categorize these indicators. The thirty-one indicators contained in the data bank as of March 1983 were used in the preparation of the report on regional monitoring to be submitted to the Regional Committee in September 1983.
The present compilation of the WPR data bank includes additional indicators relevant to the global and regional monitoring/evaluating of the implementation of strategies for health for all by the year 2000. Responses received from Member States in relation to the Common Framework and Format For Evaluating Progress in Implementing the Strategies For Health For All by the Year 2000 have been used in updating the contents of the data bank in 1985.
In this 1985 version of the WPR data bank, Part V has been added. The global and regional indicators for the 1983 Monitoring Report and for the 1985 Evaluating Report by Governments have been presented graphically, for easy reference.
It should be emphasized that, in spite of the precautions taken and th~ careful screening of data, some of the information may have a relatively low degree of reliability and comparability. In addition the extent of coverage varies among the indicators and from country to country.
In spite of these limitations, this document presents an overview of the regional situation, although it does not provide any indepth description of individual countries or areas. To facilitate its usage, data on all indicators are presented by country/area while data for all countries/areas are presented by indicator.
The data contained in this document are stored on diskettes supported by the WANG Office Information System and can be provided, on request, to those interested.
Any comments you wish to make to improve this document will be greatly appreciated.
Hiroshi Nakajima, M.D •• Ph.D. Regional Director

PART I
PART II
PART III
PART IV
PART V
WORLD HEALTH ORGANIZATION Regional Office for the Western Pacific
TABLE OF CONTENTS
BY INDICATORS
BY COUNTRY OR AREA
GLOBAL AND REGIONAL INDICATORS TO MONITOR/EVALUATE STRATEGIES FOR HEALTH FOR ALL BY 2000
GLOBAL AND REGIONAL INDICATORS BY COUNTRY OR AREA TO MONITOR/EVALUATE STRATEGIES FOR HEALTH FOR ALL BY 2000
GRAPHIC PRESENTATIONS OF GLOBAL AND REGIONAL INDICATORS FOR WPR COUNTRIES/AREAS

WORLD· ,HEALTH ORGANIZATION aea:ioJIal Qffice for the Wutern Pacific
,,"nil_PACIFIC ·ttCION DATABANK
ON Soct~c AlII) .HEALTlilltDlCATORs
PART II BY. COUNTRY OR AREA

WESTERN PACIFIC REGION DATA BANK
ON SOCIOECONOMIC AND HEALTH INDICATORS
PART II INDICATORS BY COUNTRY OR AREA
TABLE OF CONTENTS
American Samoa ...................................................................................................... .. Australia ................................................................................................................ .. Brunei ...................................................................................................................... .. China ........................................................................................................................ .. Cook Islands ............................................................................................................ Democratic Kampuchea ................................................................................. Fiji ............................................................................................................... French Polynes ia .................................................................................................. .. Guam .......................................................................................................................... .. Hong Kong ...... " ....................................................................................................... .. Japan ....................................................................................................................... . Ki ribati ..................................................................................... . Lao People's Democratic Republic ....................................... . Macao ................................................................................... .. Malaysia ..................................................................................................... . Nauru ............................................................................................................ . New Caledonia .............................................................................................. " .. New Zealand ...................................................................................................... .. Niue .................................................................................................................. .. Papua New Gu inea ................................................................................................. .. Philippines ...................................................................................................... Republic of Korea ............................................................................................... .. Samoa ................................................................................................................. ..
Singapore .................. " .......... """ ........................................................................... .. Solomon Islands ........................................................................................... Toke lau ............................................................................................................. .. Tonga .................................................................................................................. .. Trust Territory of the Pacific Islands •••••••••••••••••••••••••••• Tuvalu ........................................ """ ..... ""'I ........................................................ ..
Vanuatu ............. " ..................... "." ........................... 'I" .................................... ..
Viet Nam ................................................................................................................. .. Wallis and Futuna .............................................................................................. ..
Doc 0362H Disk 0016T (AHS-GUH) Doc 0339H Disk 0020H (HOK-PNG) Doc 0340H Disk 002lH (PHL-WAF)
II-i
1 3 5 7 9
11 13 15 17 19 21 23 25 27 29 31 33 35 37 39 41 43 45 47 49 51 53 55 57 59 61 63

WORLD HEALTH ORGANIZATION Regional Office for the Western Pacific
WESTERN PACIFIC REGION DATA BANK
ON SOCIOECONOMIC AND HEALTH INDICATORS
'PART I BY INDICATORS

WESTERN PACIFIC REGION DATA 8ANK
ON SOCIOECONOMIC AND HEALTH INDICATORS
Part I BY INDICATORS
TABLL OF CONTENTS
Ind1cators Number Name
1. Area( in 1000 sq kilometres}
2. Popu la tion
3.. Annual population growth rate
4.
s.
6.
7.
8.
9.
10.
11.
12.
Percentage of population (less than 15 years and 65+)
Urban population
Rate of natural increase of population per annum (%)
Crude birth rate
Crude death rate
Life expectancy at birth, by sex
Infant mortality rate
Total fertility rate
socio-economic indicators for the year 2000
Definition
The area in square kilometres relates to total surface area of the specified geographical units
Estimated total population
Average annual growth rate of popUlation for a given period computed by fitting a trend line to logarithmic value of population
Population aged less than 15 years or 65 years and above as a percentage of total popUlation
Population in urban areas as per cent of total population
Net crude increase of population -the difference between crude birth rate and crude death rate
Number of live births to estimated mid-year total population
Number of deaths to estimated mid year total population
Average number of years a new born can be expected to live under the prevailing mortality conditions
Number of deaths under one year of age among a given population per 1000 live births which occurred among the population
Number of live births - legitimate or illegitimate - in one year per 1000 women of ages 15-49 years whether married or unmarried
Forecast values for the year 2000
I-i
1
1
1
1
2
3
3
3
3
4
4
5-6
WESTERN PACIFIC REGION DATA BANK
ON SOCIOICOJIOMIC AN!) HEALTH ItmlCATOIlS
PART I IY ItmlCATOIlS
TABL! OF CONTENTS (cont'd)
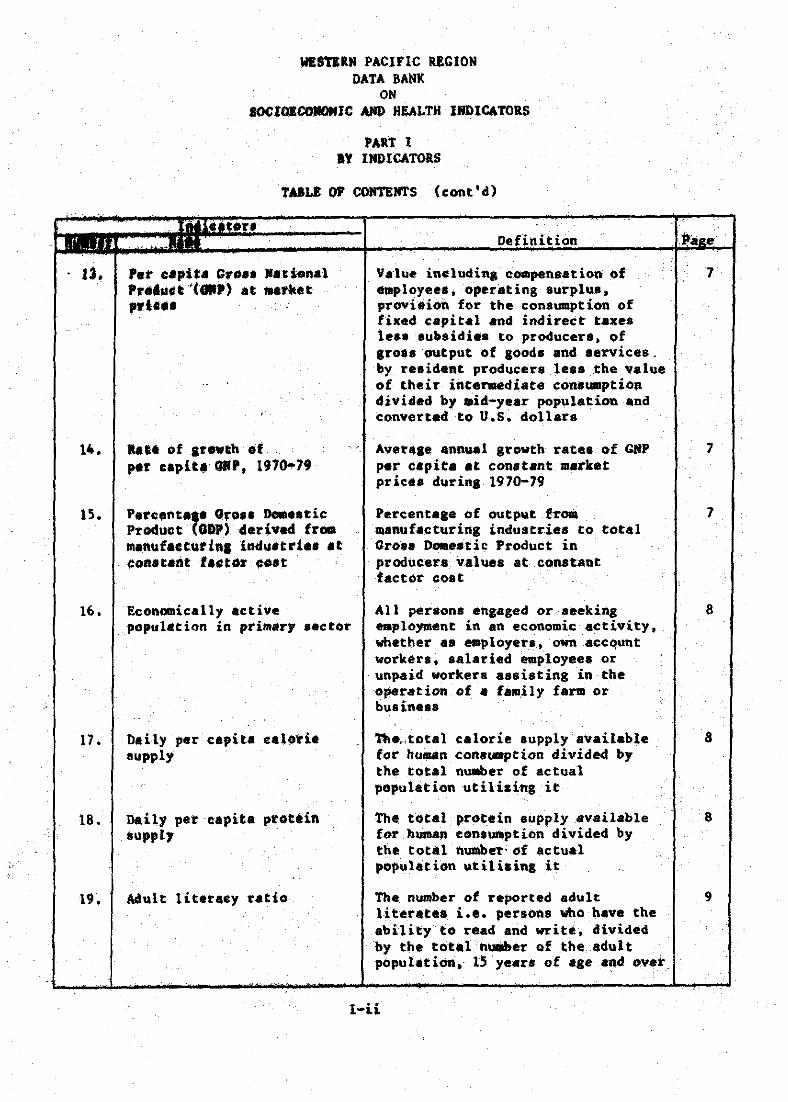
. U. Pat capU. C, .... IInional 'r.luct'(III') at Maritet pd'"
Value ineludina compene:ation of employeea, operating surplus. provieion for the consumption of lixed capital and indirect taxes leae eubsidie. to producer., of 11'0.8 output of soods and services. by resident producera less the "alue of their intermediate consumption divided by .id-year population end converted to U.S. dollars
1_, .. ,. of arewth of
15.
16.
17.
18.
19.
pet' c.pit.OR', 1910-79
p ... ".nta,a Oro .. DoIIeetie Pr.duct Oap) derived fr_ manul •• turi"e indu.tria. at con.taftt t.ceor ~.t
Economically active population in primary .ector
Daily per capita calorie aupply
naily peteapita ptotein aupply
Averaae annual growth retee of GNP per c.pita at con.tanemarkat prices durin, 1970-79
Percentase of output from lIIallllfacturing industries to total ero .. Dome.tic Product in producers values aeconalant factor c:oat
All persons engaged or seeking employment in an economic activity, whether aa employers, own accqunt workers, salaried employees or unpaid workers aS8isting in the operation of /I family farm or business .
'nIa"total calorie aupply available tor human conauaption divided by the total nuaber of actual population utilizing it
The. total procein .upply .available for buman eonaumption divided by the total numbeT'of actual populUion utili.ina it
The number of reported adult literates i.e. persons who have the ability to read and write, divided by the total ItUlllter ofthe.adult population, 15 years of age and over
l-ii.
7
1
7
8
8
8
9

Number
20.
21.
22.
23.
24.
25.
2".
27.
28.
WESTERN PACIFIC REGION DATA BAlIK
ON SOCIO£OONOHIC AND HEALTH INDICATORS
PART 1 BY INDI CA TORS
TABLE OF OONTENTS (cont'd)
Indicators Name
Health budget/expenditure
Health III&npower
Ten leading causes of communicable diseases dIOrbidity
Ten leading causes of mortality
Definition
Government consumption budget or expenditure at current prices for health sector
Number of persons qualified from recognized medical or health institutions and actually working in the country whether in private or 8S employees of an official service or a private institution
Top ten causes under which the largest number of eases have been reported during a given year
Top ten causes under which the' largest number of deaths have been reported during a given year
9
10
11-18
19-27
Cases and deaths for six di8eases under the WHO Expanded Programme on lIIImunization
Number of cases and deaths due to 28-29
Cases and deaths for six diseases under the WHO Annual Communicable Diseases Bulletin
Cases for five disesses under the WHO Monthly Communicable Diseases Notes
Proportion of infants fully immunized against tuberculosis, diphtheria, poliomyelitis and meaalea
Percent. of populat ion served with safe water
Diphtheria. Pertussis, Tetanus, PoliOl'oyelitis. Tuberculosis and Measles ~eported during the year
Number of cases and deaths due to 30-31 causes that are of emerging public healtn significance reported during the year
Number of cases and deaths due to 32-33 causes con.idered a9 of epidemic .igniticance reported during the year
Proportion of infants under 1 year of age who nave been fully immunized against tuberculosis, diphtheria, poliomyelitis and measles
Percentage of population with water laid in tne living quarters by pipes from 8 community-wide system or an individual iostallation such as a pressure tank, pump, etc. inside or out. ide the living quarters but within 100 metres
I-iii
34
35

.,.'
*30.
*31.
I
WESTBRN PACIFIC REGION DATA BANK
ON SOCIOROONOMlC AND HEALTH INDICATORS
PoUT 1 BY IRDlCATORS
TABLE OF OORTBNTS (coat'd)
t'ftdTcator.
Percent of population wi~ adequate .anitary tuiliei ..
Definition
Percentage of population with adequate sanitary facilities in the home or immediate vicinity
Pe.-cent of low birth IIaiahes infant. (c 2499 g)
. Percentage of newborn infants with a birth weight of less than 2~00 grams (up to and including 2499 gre .. >
ltaternal IIIOrtality rate
Legend: .. ••• or blank •
NA .. * ..
Nil
Number of deaths of women while ptegnant or within 42 days of termination of pregnancy. irrespective oftbe duration and the site of the pregnancy. from any cause relates to or aggravated by the pregnancy or its .anagement but not from accidental or incidental cause
Not available/not known Not applicab Ie Additional indicators included .tertiug with the Auguat 1983 issue
Doc 0360H ni.k0018T Doc 00<2811 Diak QOOOK (Leading Causes 'of Morbidity/Mortality)
I-iv
35
36

WESTERN PACIFIC RECION DATA BANK
ON SOCIOECONOMIC AND HEALTa INDICATORS
No. Country/Area
1 American Samoa
2 Auetraha
" Drune. Daru •• alam
4 Chwa
5 Cook 18 lands
1>. Democratlc Kampuchea
7 F'J' 8 French Polynu ••
9 Guam
10 Hong Kong
11 Japan
12 J(lrlbatl
13 Lao People's Dem.
14 Macso
D Haay81a
It> Nauru
11 New Cueoon18
HI New Zealand
1~ Nlue
20 Papua New CUlnea
21 PhihpPlnea
2;'( Repub hc of Korea
l3 Samoa
24 Singapore
25 Solomon Islands
26 Tokelau
27 Tonga
28 T T of the Pacific
29 Tuvalu
30 Vanuatu
31 Vlet Nam
32 Wall is and Futuna
*1981 **1982
***1983 ****1985
Doc 0360H Diskette 0018T
Rep.
hland.
(in Area 1984 Estimated
1000 SQ km) ipopulation ('000)
0.20 35
7 b62. J 15 >.7
5.77 HC>
9 .b00.00 1 024 950
0.24 18***
11S1.04 b 7110 .....
18.27 700
4.00 167-*
O. " ID***
l.0' 5 364
372.31 118 499**
0.72 62
236.60 3 585****
0.02 386***
329.75 D ~u ..
0.02 7**
19.103 145***
:t1>'J.06 j :t;,u
0.26 jWW
462.84 3 252
300.00 53 186
99.02 40 578
2.84 1bJ
0.62 2 50Z*"'"
27.:> 259***
0.01 2
0.70 97
1. 78 142*
.026 8
12.19 130
33Lb9 57 442***
0.255 10**
Part I Page 1 30 Decellber 1985
Annual population Ilrowth ra te (%)
(1984) 1.9
(1962-83) 1.3
I ! ~O"1 2.5
(l979-8J) 1.3
(982) 1.1>
U911Z) 2.9
(1982 ) 1.8
(l977-IIJ) 3.03
09110-113 } 2.2
{19114} 1.0
(982) 0.7
09I1J-1l4) 1. 7
(1985) 2.9
(1982) 2.8
\! ~ol) 2.7
(l9112) 0.0
U~Oj) 1.3
\1'10") 1.1
I L YO" -3.1
(1980) 2.3
11,}0") 2.4
I L~O") 1.,' u9!1lJ 2.1
(19113) 1.1
(1983) ].4
(1983) 1.2
0984) 0.9
(1982 ) 1.9
(1983) 1.5
\1979) 3.2
\1983) 2.34
...

'utI •••• a ' 30 oe ..... r 1985
WESTIRN PACIFIC REGIOI9' DATA BAlIK
ON SOCIOICONOMIC AND HEALTH INDICATORS
, No. Country/Area Percentage of population Year <15 yrs 65+ yrs
1 .. edcan I...,. ... . .. z lIu.ttlua l!llll 24.1 9,.9
) BrUnal paruaaala. 1982 , 38.1 2.9,
4, China 1982 32.7 5.6 " , COOk lalanell 1982 49.8 , 4.0
"
'6 Democratic Kampuchea 1982 33.1 2.3
, 7 PiJl 19112 36.J ," J.J,
II pranch pOlyn.,ie 1'111) 311 0.3
9 ,aua .. I";;! 39.b 1.7
lU Hone Kon. , 1'111' 23.9 ,., f.l
11 .rapa" lliJI!2 V.l 9.5
U Klribat1 19112 41.1 . J.b , ,
'13 Lao People 8 De ... Rep. l'.llll2 43.2 ' , 3.0
14 Macao l'IlU 34.,U 4.U
"I) Malaysta 19Z1l JII.1 J.l --
If> Nauru .... . ... ,.17 New Ca 1 aClon1a 1911:! 31).24 6.2
111 ' Naw Zealand 1982 26.3 10.0
l'JI Nlue 1982 46.1 1l.1l
20 Papua Naw GUloea lY80 41.9 , 3.3 " ,
21 Ph 1.1lpplnel 1911"J 41.'4 J.42.
22 Republic of Korea 1982 31.9 4.1
23 Samoa 1982. 48.2 , 3.2
.24 Slng.pore 1982 25.6 4.9
" ,ll !iOI~n 'alanela IYIO 4Z1.U 3.3 "
241 Tokehu .. , ... '1:7 Tonga Hill H.t 3.3
28 T T of the Pantie bland, 1982 44.3 _ 4.1
2liJ Tuvalu, . /-' 1~19 :0.4, , 4.1
3U Vanuatv .. lYfY 45.4 2.9. '
31 Vut Nam 19110 41.2 3.6
32 lIalIb and Futuna· ... ...
Urban po~ulation Year X
1980 45.7 ,
1'.11111 11';11
1981 59.4
1983 23.5
hllu l,1I.9
1980 l5.0'
191:10 , 37.0
, 19110 ;"11.0 ~
1!J80 , Z7',3 .
11111l ' 1I::1;.u
191:10 111.0
' "ISO ;;1l.1l
191:10 n.D 1'.11110 1I1S.U
hllu :J'JI, .,9
... 191:13 )11,)
1981 83.6
1980 ,20.7 I
1980 20.0
1911U JII.U ,
1980 57.0 '
1983 .2,9.1
19111 101l.0
l~IlU 1\l.U
... 1!1110 Jl.,1!
1980 ' 55.6
... 1979 17.8 ' , 191:11 lll.O
.. .

No Country/Area
1 American s .. oa
2 Au.tralia , Drull.. U •• U .......
4 Chin.
5 Cook hl.neI.
• Deaoer.tic Ka.puch ••
I UJl
8 French Polyne.la
9 GUD
lU Bona long
11 Japan
12 Kiribati
1. LaO Peopl. • D ••• a.p.
14 Macao
15 MalaY'18
16 lIeuru
17 New C.ledOftia
18 Now Z .. larul
1> Nlue
<. rap •• ~ ....... ,n ••
21 l'II'l1pp'"''
22 Repubhc or Xore.
23 S •• Oil
24 Slngapore
25 Solomon hhada
26 Tokelau
27 Toni'"
28 T T of the Pacific Island.
29 Tuvalu
30 Vanuatu
.1 Vlet NalD.
32 Walli. and Futuna
* Penlnaular Mal.Y818 onl, .. 1982
*** 1983 ~/MicrQn •• h
WESTERN PACIFIC RECION DATA BANlC
ON SOCIOEC08OHIC AND HEALTH INDICATORS
Rat. of natuu.l Year incr.a •• of Crude Crude
population birth death % Der annum rate rat.
1984 3.92 39.2 4.3
1983 0.85 15.8 7.6 .. .,.. <.58 28.6 y.oo
1983 1.54 18.62 7.08
1983 1.51 22.5 6.83
1.82 2.5. 45.5 19.6
1984 2.4 29.8 S.~
1983 2.3 30.2 5.5
US3 2.4 2 •• 12 4. 081 lOS. 0.'. 10.' 4.8
1984 0.68*" 12.5 6.2
1978 1.7**" 34.9 14.0
19a, 2.9 46.1 17.1
1983 1.8 23.6 5.8
1984 2.6 11.2 5.1
1982 1.5 19.8 4.5
1983 2.09 26.2 5.8
1984 0.76 16.1 8.5
l.au 2.3 30.3 7.Y
l.a .... o, <.23 35.3 D.lI
"84 2.0 ll •• 7.6-
1984 1.68*" 23.0 6.2
1984 2.6 31.0 7.4
l.aJ l.u, 16.2 -5.3
1983 3.4 44.6 11.0
1984 1.5 22.0 7.0
1983 0.9 28.6 24.1
1981 2.7 31.3 4.3
1983 I.S 26.5 7.S
1983 3.2 45.0 13.0
l.aJ 2.2 ,..3 7.08
. . . . .. . .. .
'Year
1978-82
1982 1984
1984
1981
1982
1976
1980-85
1983
19.'
1984
1978
uao-85
1982
1982
1976
1983
1981
,.84 1978-79
1984
1980
1983
19-84
1983 1983
1984
1982
Part I P.... 3 30 Dee_e. 1985
Li fe expec tancy at birth
Totall Hale Ir ... le
70.1 I 67.8 I 75.5
· .. I 71 I 78 ,0 I 69 I 70
67.9 I . .. I •••
••• I 64 I 70
• •• I 42 I 45
••• I 60.71 61.!r
• • • 1 65.51 67.8
••• I 69.6f 74.5
•• , 112.5 T,8~
." I 74.541 80.11
• • • 1 SO / 54
.,. / 44.6 I 47:S-
65 I. • • I • ••
• •• 1 67.7!* 12.S-
• •• I ••• I • ••
••• 160.. /66.8
· .. (70.8 176.9
• •• I ••• I •••
••• I U-61 I 62 • •• I It-53 I 54 ••• I 62.8 /"" ••
65.9 I 62.71 69.1
••• I 63 I 65
• •• 1 69 I 74
54 I ... I ••
· .. I ••. / ... -50 I ... 1 •••
64}!' I ..• I •••
••• I 57 1 60
... 1 56 I 54
••• I 62 I 66
• •• I ••• / ... U - urban R - T'ural

Part I Pap 4 30 Deceaber 1985
WESTERN PACIFIC REGION DATA BANK
ON SOCIOECONOMIC AND HEALTH INDICATORS
Infant No. Country/Area Year mortality Year
rate
1 American Samoa 1984 5.8
2 Auatralia 1982 10.3 1975-82 ...
. 3 BruneI Darussalam 1 '1t14 12.7 1'175-80
<+ (;hina 1984 34.7 1982
:l Cook Islands l'1tiJ If> .4 1':182
b Democretlc Kampuchea bel 160.u I'1D2
7 Fijl 1':1114 22.~ 1':182
II French PolyneSIa 1983 22.9
!I GUam l!1DJ !I.l
10 Hong Kong 1984 9.1 1983
11 Japan 1':1114 6.0 1':1113 .
12 Klr1bati 1978 87 1982
13 Lao People s Dem. Rep. 1':1114 104.0 19112
14 Macao 198) 14.1
15 Ma1aysie 1982 19.26 1982
16 Nauru · .. 11 flew (;a1840nla hlll;£ :./ 1 • !I.
lti New Zealand 198) 12.54 1.9112 ..
19 NIue · .. 20 Papua New Guinea 1981 72 197)-80
21 Phll1pp1fteS 19114 58 1983
22 Republic of Korea . 1983 34.2 1982
23 Samoa 1'1114 35 1975-80
2'+ S lngilpore . 1911)-11'+ !I.4 l':1ti2 -'.
2) Solomon Islands 1':1114 46.u 1992
26 Tokelau 1':1113 28.0
27 Tonga l!111J 11.1
28 T T of the Pacl fic Islands 1983 17.6
2':1 Tuvalu l':1ti4 4).!> 1':182
JU Vanuatu 1984 75 l'1tij
31 Viet. Nam 1983 33.5 1975-80 j;£ Walhs and Futuna · ..
*Average of Fijian and Indian
Total fertility rate
(15-49 years)
... 1.9
5.1
2.b 4.2· .
).1
3.4·
.- ..
... 1.7
. 1.11 .
4.7 .
5.11
... 3.8
· .. ... 2.0
· .. 6.0
4.50
2.tI
5.91 1.7
7.3
· ... ... ... 2,11+
6.b
5.8
, ..
No.
1
2
J
4
5
b
7
8
9
10
11
12
13
14
15
Ib
17
18
19
20
21
22
23
24
25
26
27
28
29
30
31
J2
WESTERN PACIFIC REGION DATA IIANK
ON SOCIOECONOMIC AND HEALTH INDICATORS
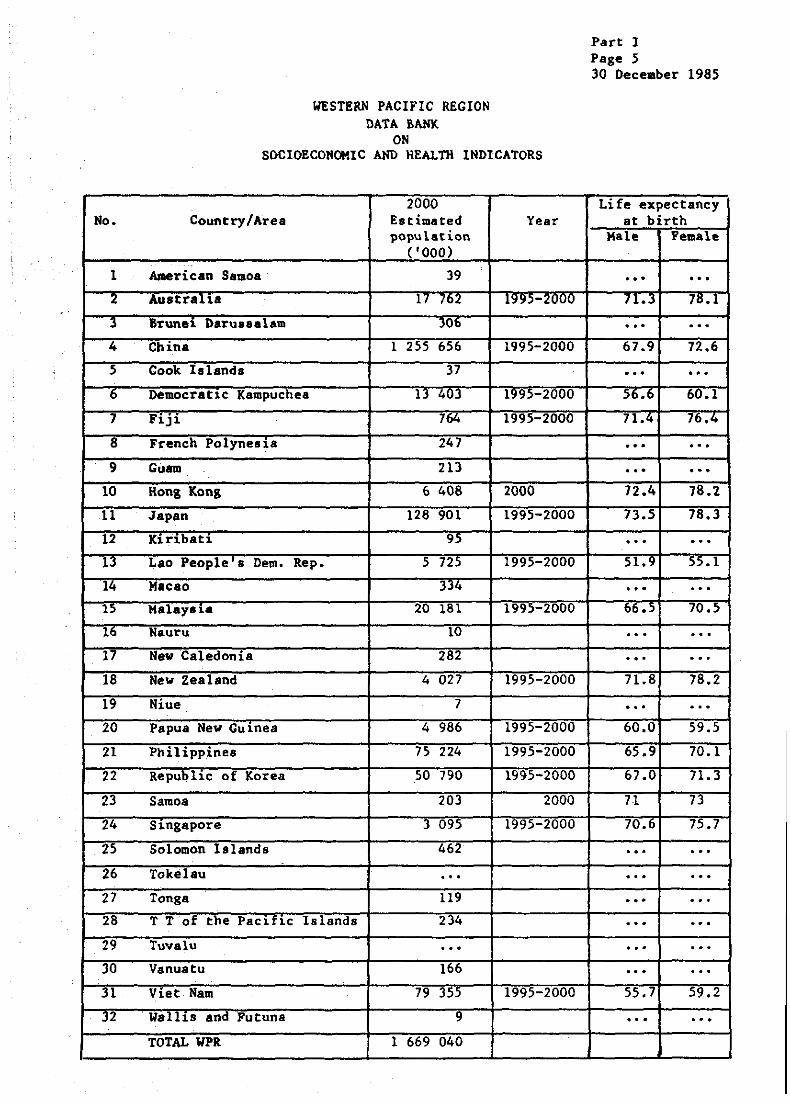
2000 Country/Area Estimated Year
population ( '000)
Alaerican Samoa 39
Australla 17 762 1995-2000
Brune1 Darussalam JOb
China 1 255 656 1995-2000
Cook Islands 37
DemocratiC Kampuchea 1) 4UJ 1995-2000
Fiji 764 1995-2000
French PolyneSia 247
GU81D 213
Hong Kong 6 408 2000
Japan 128 901 1995-2000
K1rlbat1 95
Lao People's Dem. Rep. 5 725 1995-2000
M.cao 3:.14
Malaysia 20 181 1995-2000
Nauru 10
New Caledonia 282
New Zealand 4 027 1995-2000
Niue 7
Papua New GUinea 4 986 1995-2000
Philippines 75 224 1995-2000
Repub11c of Korea 50 790 1995-2000
Samoa 203 2000
Singapore 3 095 1995-2000
Solomon lslands 462
Tokelau ... Tonga 119
T T of the Paclfic Islands 234
Tuvalu .. , Vanuatu 166
Viet Nam 79 355 1995-2000
Walhs and Futuna 9
TOTAL WPR 1 669 040
Part I Page 5 30 December 1985
Li fe expectancy at birth
Male Female
· .. · .. 71.3 78.1
· .. · .. 67.9 72.6
· .. · .. 56.6 60.1
71.4 76.4
. , . · ..
.. , · .. 72.4 78.2
73.5 78.3
· .. · .. 51.9 55.1
... · .. 66.5 70.5
... .. .
... . .. 71.8 78.2
.oO oO'
60.0 59.5
65.9 70.1
67.0 71.3
71 73
70.6 75.7
.oO ...
... · .. · .. · .. · .. . .. .. , ... · .. . .. 55.7 59.2
... '"

Part I Pate 6 30 Decelllber 1985
WESTERN PACIFIC REGION DATA BANK "
ON SOCIOECONOMIC AND ~TH INDICATORS
1995-2000 'No. CoUntry/Area Annual pop'n Year,
growth rate (Z)
" ' '
1 ' " Amedean 8._oa l.OS
2 AUiltralla 0.'1,) l'l'l>-lUUU
3 Bruna1 Darus •• 1am 2.00
4 \;nl.na , ,
0.91 , 11995-7000
> Cook Islands 1.10
Ii DeJlli)cratlc Kampucnea . 1.lIb' l'l'n-WUU
7 Fiji 0.64 1995-2000 . ,
8 French polynesla 1.31
9 Guam 2.58
10 ' 1I0ng Kong 0.59 2000
11 Japan 0.48 1995-2000
12 ((1rlbat1 1.51$
lJ loao People'. Dem. Rep. 1.93 1995-2000
14 Macao O.'1U
15 Malaysia 1.52 1995-2000
16 Nauru 1.03
17 New Caledonia 2.41$
18 New Zealand 0.92 1995-:1000
19 Niue 1.11 .. '
20 Papua New GULnea 2.11 199>-2uOO
21' ·Philippines 1.91 1995-2000
22 Republ1c of Korea 1.18 1':195-2000
23 Samoa 0.9 20uu
24 Singapore 0.87 1995-2000
25 Solomon Islands J.JU
21> Tokelau ... 27 Tonga 1.04
28 T T ot the PacUlc Island. , 2.u>
29 Tuvalu 0.00
30 Vanuatu 1.1$)
31 V18tNam 1.81 1995-2000 ,
32 Wal1l.e and Futuna u.uu
Crude Crude "atura1 birth death ~ncrea.e rate rate Z) per
annum
· .. · .. . .. 1>.1 1$.1 0.b4
· .. ... . .. 11.4 1.7 -0',97
· .. • •• .., 21$.> ':1.':1 1.1$1> '
17 .9 4.8 1.31
... ... ...
... ... .... 11.9 7.8 4.1
14.1 '1.4 0.47
... ... .., 31.9 12.6 1.93
'" ... ... 21.1 5.9 1.52
· .. · .. ... · .. • •• ... 16.u 1$.1 0.79
· .. ... . .. JO,b 9.5 2.11
23.90 6.20 1.77
18.8 6.9 1.19
21 ) l.b
15.1 6.4 0.87
... ... . ..
... ... .. .
... ... .. .
... .. ...
... ... ... to • ,. .. .., 29.0 10.9 l.81
· .. ... ...

WESTERN PAClFlC KECt~~ DATA IW<K
ON SOCIOECONOKtC AND K£ALTH [HO[CATORS
No. Country/An.
1 American S •• aa
2 Au.tnlia
1 Brunei D.na •• d ••
• Ct\lfta , CC)Oit II land.
6 DeIIOCutic: Ka ... pu.:::t-.ea
7 Fiji
8 V-ranch Polynesia
9 G"". 10 Hong Kong
11 Japan
12 Kiribati
13 Lao People's Oem.
14 Macao
15 MalaYlia
16 Nauru
17 New Caledonia
18 He., Ze.14nd
19 Niue 20 'spu. New Guinea
21 l»hi lippines
22 Ilepub li C 0 f Korea
23 S.mOl
24 Sin&apore
25 So10ta0n Is lands
26 Tokelau
27 Ton,a .
28 T T of ,he Pac dic
29 Tuvdu
30 Vanuatu
31 Vi~t M.a.
32 Willis and Futuna
• Oata i. fat 1972-1981 *. nata is for 1910-1911 *** nata i. for 1983 **~Data is for 1982
Rep.
Ishnd,
Pet' capita CMP at market prices in usS
'tear Data
... 1982-83 II 951
19Il10 76H,· \980 290
1984 980
· .. 1980 I 810
1982 4 100
1983 4 000
19S4 5 940·
1980 9 890
1983 47.4S
1984 202
1982 1 sao 1984 I 994
· .. 1983 5 379
1984 5 000
'"
1984 ))8
H y 19B5 556
1983 1 880
· .. 1983 6 441
1983 615+
· .. 1983 3~4 .. 1983 360
19S2 529
1983 500
· ..
+ Per capita- GOP +. (1983) US$1300 - Federated States of Micronesia
Rate of 1C'()\Ieft of per capita CNP, (%) 1910-1919
· .. 1.3
4 •• 2.8
..,
... 3.0
1.8*'*
~.1**
8.5*** 1.9
6.0**
... 15.0
5.4*.w.,;c
· .. ;.7***
0.5
· .. 0.3
3.9
8.1
· .. 6.7
2.1*
· .. . .. · .. · .. 1.8**
'"
'"
Pat't t Page ., 30 Dec_bet' 1985
Percenta&e of Cro •• Domestic Product (COP) h"", m.nuf.c[u~in& at constant factor cost
Yeal: D.IlIta
· .. ... · ..
1980 14.0
1978 5.1
. .. 1980 11.6
· .. · ..
1983 H.9
· .. 1918 41.2
. .. · ..
1980 20.5
. .. · .. · .. · ..
1977 J. J
1983 25.1
1980 29.9
· .. 1980 22.5
· .. · ..
1~79 9.9
. .. · .. · .. · .. ...
(1982) US$9300 - Crosl Island Product per he4d - Northern Karianas

.
?art I Pa,e 8 30 o.cember 1985
WESTERN PACIFlC REGION DATA BANK
ON SOCIOECONOMIC AND HEALTH INDICATORS
Economically active No. Country/Area Year population in the
primary lee tor No (DOD's) Percent in agri- in agri culture culture
1 American Samoa · .. ... 2 Aystralia 1981 379 6.0
3 Brunei Daruasalam · .. · .. 4 China 1980 265 879 59.8
5 Cook Islands ... · .. 6 Democratic Kampuchea 1980 2 522 74.0
1 Fili 1980 . 83 40.1
8 French Polynesia ... -. '"
9 Guam ... · .. 10 Hong Kong
. 1983 30 1.2
11 Japan 1980 6 612 11.0 12 Kuibati ,. · .. ... 13 Lao People'. Dem. Rep. 1980 1 300 73.8
14 Macao ... ... 15 Malaysis 1980 2 216 47.8
16 Nauru · .. ... 17 New Caledonia · .. · .. . .
18 New Zealand 1980 118 9.3
19 Niue · -.. '"
20 Papua New Guinea 1980 1 259 82.3
21 Phi lippinea 1983 10 250 52.1
22 Republic of Korea 1980 5 601 38.6 23 Samoa 1976 2.02 12.0*
24 Singapore 1980 21 2.2 .
25 Solomon Islands 1980 6 30.0
26 . Tokelau · -.. ... 27 Tonga 1976 9 43.4
28 T T of the Pacific Islands · .. · .. 29 Tuvalu · .. ... 30 Vanuatu 1979 41.5 79.0
31 Viet Ham 1980 16 847 70.6
32 Wallis and Futuna ... ... *1970
Year Dailv per capita Calorie IProtein supply supply
. .. ... 1981-82 >2500 99.0
1984 2 959 13.7
1981 2 517 65 .'
... .. . 1977-79 1 767 40.1
1979 2 577 56.8
1982 3 747 118.96
1983 1 905 80
·1983 3 402 99
1975-77 2 847 86.5
. .. .. . 1984 1 842 47.7
1917-79 2 181 57.9
1983 2 000 ... ... ... .. . •••
1981 3 119 97
'" . .. 1975-77 2 247 45
1981 2 637 61.1
1982 2 588 78.3
1984 3 500 41.5
1977 3 074 84.2
. . . ... . . . .. .
1983 2 no ... ... . .. ... .. ,
1979 2 54& &8.4
1983 2000 ... ... . ..

,11'0
'0. Country/Ar •• 't •• r
I AMti'an S&IIIO&
2 A~.tr&lh 1981
J arunai o.ru •• at .. ,,04
• Chin.a , Cook Islanda 1981
• D •• GCr.t~e x..puch.a
7 FIji. 19'~
• Fr~ne" po11netia 19151
• G .... 1981
10 Hon, baa 1'150
U Japaq
12 lC;iribatl 19"
1] l.afl "'.()ph • 0... hp. 1985
I' Hacao \982
" ~.l.y.i.. 1980 16 Nauru
17 Mev Ca}e6ol\u 19'3
1& tte'llll t .. land 1982
19 Niu.e
20 Papua "-v G_il\ea U$Z
" Phi.liP?"LM' 1982
22 aepubl ic of KaTon \979
" s_. 19111t
2' S1na.apQt"e' 198)
" 5010.01"11 hl.nd. 1981
l6 fOhbu 198)
" Tona' ,.,.
,. T l' of tba '.ufi.c IdeAl. .. 1\IYalu \98>
>. Vanuatu.
" Viar Ha- 1983
" Wdli, an6 Futu.na
... C'*Put eel. by MIN **Official ~opulation aaae not ayaitable.
WESTEL~ PACtFl~ ~L~10~
DAtA MIlK
"" SDCIDlCOMOtHC o\MO HI::.AloTM t~DlCA'roas
"",.ltho "'udo « ltd" 1t 'i'er
Ill.racv rH"iI!' Total "ale/f ... l Aa.;Junt
... 1 ... 1 ... ...
... I .. 1 " 981-.H ",. \I m '0.) / ... I ... 19k a. 1f, 01l ". ... , ... , ... ...
11)0 1 ... 1 ... / 19112 :;s, 1 818 ." ... 1 ... , ... ... 7. 1 .. , " 19a1 .. 29 G4& ~21o
!I 1',." ... •••• , ••• 0( ••• 1981 USI 1\ 27 •• ".
.... , ... ., n. 19&3/84 "". 1 931 '" 17. ... , ... 1 ... 1915 ... 95' ... 1 ... 19./11 AS I 600 I\()()
0>1 ••• / ... ... '0/ ... 1 ... 1919 'atee ••
t7 S6S 1210.10
121 ... 1 .. ! 198010 HI I 101 110 "0
'" 1 ... , ... '"
" , '" 91 1982 .C!" I "22 'il90 000
00-'" ... 1 ... \981 KIl_ l ))6.2
... 1 ... , ... 977/78 HZI 402 423
4S I ... 1 ... 19a"., kiNA .. ao. 000 90 1 ... 1 ... \982 • l 12S 6)8 000
... 1 961 aD 1981 lion. • p~ ~l\J
~., 1 , .. , ... 1981: IISI to 16') all
".2/ ... 1 ... 1982" Sf 3)0 &9'0 000
,,-)0/ ... / ... l~a\ "I. 1.0:,! .. / ... 1 "- in-a) WSI 110 2M
... 1 " / n.> 1911/81 TS 1 6blo lH
... 1 ... , .. , l'i18 "" , 160 1<'"
"1 ... 1 ... 1980 AI ,., m
... 1 ... 1 ... lltS} .... lDU at' (100
•• 1 ... , ... IU1 '" ... 1 ... , ... '"
"-a..aed on tnti..aated populahon r.lsin& the &1'0"'<:" rate of tne 198iJ popuhtion ce-nau, •• o.t. i_ for 1932 !/ Tot .. l - 91/&4/32) $pultfRud/Wriu Vnn<:t\
".le - 90/63/S1) F ... 1.- '1/8~/SJ
!:J Hde - aa (Urban) 7t1 (aural)
F ... le- 74 lUrb.n) ~, (Rural)
(E) • £_tilUtoif
•• end~t\'\r.
,,, capLt&
.. . AS '''' a. 12)"
... USll 164.le
... " 102. 'JO
usl " . USO 100 .. , ~6.S Y " 07l
AS 2b.1
... '.tae ••
01.1
HI 12-" ...
f.e" 10 9&6
"ZI 427.6 .,. 100.6
., .. 19.11
P 61.6
Wonl . ,,, .. wsl 30.27
ss Ill ....
511 lZ.2:
WS$ S6.alll
TS \0.80
Un ».> AS ))
"., 2>S.2
...
...
P.n 1 r.,. i 30 December IiI)
A, 1" of total (lIOehance (".[e-buda.et " 1 ust ... '"
7 •• AS 0.811.
~.o ... as 2.14
.. , .. . fl.' H" Z .G4.l
... '" ... •• 0.1980
... .efF 180.42~~)
7.Z us. 1.00
" " US 1.Bl
. .. Y 2.0
H).J AS 1.06
... '"
... tataea, S.4~
•• 0 ., 2.43 .. . ... 7.21 • cr. 170.004])
12.1 ... 2.04
. .. liZ$' LOZ .. , XUtA 1.00
~.n • n.Ll Z.2 Won 990.00
U.S wsl 0.97
3.69 S$ 2.1:. .,. su 1.12
7.17 w51 0.97 U.l 11 1.4)
. .. UU 1.00
1.' .. 1.40
.. . •• tu,07.'.
• . .. ... '"

Port 1 po •• 10 30 O"ember 1985
WESTeRN 'AClfIC ReGION DATA BAlIK
OM SOCIOECONOMIC AND HtALTH IffOICATORS
Heahh Hanpo..-er No. Country/Area Year Medical
Physicia"s. .... in.nt.
HIJTQbe r for N .. b~t 10 000 "00' n
I American 8 • .0. 1984 2~ 7.1 • 2 Au,uaha 1981 27 128 \8.2 .. , J Brunei D.ru ••• tam 1982 107 S.l 94
4 China 1984 921 766-- 8.9 451 690
5 Cook. liland. 1983 18 10.0 .. • DeaocratiC Ka.puch •• ... '" 7 Fij, 1980 284 4.5 34
8 Prench Poly-neai .. 198) 195 11. , ... 9 G .... 1983 83 , .4 ... 10 Hon& IIDns 1983 4 315 1.2 ... U Japan 1983 161 952 14.1 ... 12 kh'ibatl 1980 15 2.6 15
13 Lao People • De •• 'kep. 1984 418 1.0 1 892
\4 Kacio 19.3 '" 1.09 '" n MalAy.i.: Penin.ulu· 1980 3 514 1. 1 1 7.9
$.a.bah . 1917 no 1.4 . .. Sarawak 1918 88 0.1 175
16 Nautu 1971 10 14.J ... 11 Mew Caledoaia 1983 95 6.6 ... 18 New teal.nel 19.2 S 210 11).4 · .. 19 Niue 1980 2 G.7 · .. 20 Papua New·Guinea 1984 283 0.9 336
21 Philippine. 1982 7 378 1.7 ... 21 RepuDlic: of Korea 1983 27 272 S.2 · .. 13 Sarno. 1982 41 J.O I
24 Singapore 1982 2 225 ~ · .. 15 Sol~n Islands 1980 38 1.7 '"
26 TOkelau 1980 4 20.0 ' .. 27 Tonia 1982 41 4.1 16
28 T t of the Pacific 1I1.nd. 1980 46 3.' 46
29 Tuv.alu 19B1 4 ).0 8
30 Vanuatu 1981 22 1.9 19
31 Viet H •• 1981 44 400 •. 0
32 Wallis and Futuna 1982 • •. 0 ... *Ratio per 1 000 ferules
**Include. doctors of tr~ditional Cbi~e •• medicine; doctors of Western Medicine •• enior doctors of [ntecrated Chine.e Medicine and Western "edicine
+Nut8e& aad nu~&es/.idwi~es
Per 10 000 Pol""
1.1
4.7
4 ••
1.I
0.5
2.6
4 ••
0.S7
1.5
1.5
1.0
. 0.1
1.6
3.4
10.0
1.6
PYofes.ional ' nur.inc/.idwifery
pertonnel f(1JIII,bel' PeT
10 000 . DODln
18 5.1
139 434 4] ••
55) 27.6
695 991 6.7
.9 ••• 3
." 1 284 20.5
364 21.8
.0) JO.7
18 479 34.8
333 064+ 27.9 1S4 26.6
6104 14.1
" . 2.44
9 095 '.0
535 6.8
449 l.1
9 12.9
350 24.1
w •••
23 76.7
2 520 1.7
19 11. 1.3
... 345 21.9
10 207 41. J
390 17 .8
. .. 161 16.1
193 14.3
18 22.5
221 18.1
74 600/ 13.1>/ 11 900 4-.9*
4 4.0

*
1.
WESTERN PACIFIC Il£GlON DATA IIAI« OCI SOCIOECOIIOKlC AND I\JW.TH INDICATORS
Ten ••• din& cau ••• of communicable di.Qa&~. morbidity in countries or are •• of the WMO We. tern Pacific lecion
SAIIOA Year OaU
lA_dina cau ••• of infectiou. di •••••• ~r'bidit1 rio. of I.&te per ea ••• 100 000
Gonorrhoe. 1982 62 182 Infantile ••• troenteriti., ho.pita! hed 1982 34 29.3 Leproay) all fOrall 1982 13 38 Infectiou. hep.titi. 1982 10 30 lfuulpo , 1982 8 24 Tuberculosis. all fo~ 1982 4 12 Me.ales 1982 2 6 Fil.ri •• ia, poaitive c •• e. 1982 1 3
Part I Pq.11
]0 Dec_er 1985
Sou.rce of O_ta
13/85
....................................................... - ........••..... _-_ ............... _ ............ ... Year Oata Source of Data
• ........ ~ ......... __ ~ ........... __ ...... ou ...... ~ 2. AllSTIL\LU ........................................................ Ten laadina cau ••• of IIOrbidity lCD cod. No. of Rate per
ca •• , 100 000 Gonorrhoea D98 1982 12 80S 4 06/84 Total .yphi lis 090-097 1982 J 211 1 S.l~Dell. infection. 003 1982 1 866 2 Tuberc~10.i8, all fo~ 010-018 1982 1 363 9 Viral hepati.tie 010 1982 I 046 1 Rep.titis B (Serua)* 010.3 1982 125 5 Q fever 083.0 1982 616 4 Giardini.* 001.1 1982 548 4 Malaria 084 I 1982 437 3 Shigelloais (Shigella infections*) 004 19B2 344 2
Hot DOcifiable in .11 of the States aDd territories of Austral i.
~ ..... -..... ---... -.. -... --.-.-... -.. --.... --............ . ...... - ~ ....... --............... ~ .......... ---3. BRUNEI DIJUIUSALAM Year Dat. Source of Data
~ ................................................. -...... ~-..•... ~.-.. -....•. ~-----... --- .... --.......... ,~ Leading causes of morbidity
Cardiovascular di •••• ~. Ga8troenteritis Upper respiratory infections
19114 1984 19114
1'10. of eases
Rate pet' 100 000
13/85
.......................................................................................................... 4. CHIMA, PEOPLE'S REPUBLIC Of Year Data Source of Data ........................................................ ........ ••••••••••••••••••••••••• aa ............. __ ~
ten leading Cau.e8 of infectious dise •• e. -arbidity No. of Rate per Cases 100 000
Influenz. 19114 3 918 16S 378.2 Dysentery 1984 3 363 983 324.1 Kalaria 19114 903 802 87.2 Viral Hepatitia 1984 696 014 67.2 Me •• 1es 19114 619 709 59.8 Whoopin& couah 1984 21~ 965 20.8 Epidemic cerebra-apin.l _nin&itis 19114 119 912 11.6 Typhoid and paratyphoid fever 1984 99 988 9.6 Kae.arthasic fever 1984 90 936 8.8 Lepto8piroai, 1984 31 016 3.6
Sour~e 13/85; Gove~nt's Report on Eval~.ting Progress in Implementing the Strategies f~r H.alth For All by t~e Year 2000, 1985
06/84: Inforaation furnilhed by the Commonwealth Department of Health, 4ustralia 27 July 1984
o6/84.1~ Semi-Annual Report of waC/Beijing for the period March to August 1985
06/84.1

PaTt 1 Palle 12 30 Deeeober 1985
WlST!R11 PACInc R!GIOII DATA BAlIK ON SOCIOICOllOMIC AHD lIIW.'l1I IMDICt.1'01S
Tin leadina elU •• ' of ea..unieable 4i •••••• .arbidity in countria. or area. of the WHO We.tera Pacific R'li~n
• c·:
Is. Year Data .
'*" t ... , ......... ef aorbidity .
No. of RAt. per c.se. 100 000
lnjuri •• an4 ext.rnal eau.e. 1983 220 1 239 Di ...... of the re.piratory .yste. 1983 208 1 171 Di ...... of t~e dic •• tive .yate. 1983 106 597 Db ••••• of tbe akin and .u~gtaneou. ti •• uel 1,.3 88 495 Dh ••••• of tbo circulatory .y.tea 1983 85 478 Di •••••• of the ienito-urin.ry .ystem 1983 83 467 luieetiad .ncl_ ·,.ra.itic eli •••• e. 1983 60 338 Diae •• el of the mu.cul.r~.keletal .yatem 1983 49 276
I Sy.,toaa au4 ill-4efiaael cOftditioaa 1983 47 265 Di.e.'.1 of the nervou. Iy.tem 1983 46 259
6. Year Dat.
ron l.actina eau'" of morbiclity ICD code Ho. of ea •••
lnflu.a.e 1973 25 753 336 .....,ebiaei • 1973 2 117 28 Typboi4 f .... r 1973 972 II Me •• 1e.* 1973 672 9 Gonococcal infection* 1973 427 6 Srpbili, .ad •• quel •• * 1973 376 5 ""tu •• i,* 1973 372 5 PoliDllJttlitb* 1973 197 3 Chol.r" 1973 159 2 Bacillary d, •• ntery* 1973 131 2
*lIlco.pl.te data
Source of, Pat.
061 lilt and 13/85
Source of Data
11176
_____ _ ••• _._ ••• _._ •• _ •••••• ____ • __ ••••• Ia_ •••• _____ • ___ ••• _______ •
.'
1. PIJI Ye.r Data Source of n.ta ----".=---.... _---_ ... _-_ .. _ .. _-_ .. -.--- .......... _--... ~ .. - .. -----Leading cau ••• of aorbiclity Mo. of aate per
le.piratoTJ di.ea ••• Circulatory di ••••• lajury aDd poiaoaina Geaito""'\lriaary di •••••• Infectl.e .~d para.itic di •••• e~
1983 1983 1983 1983 1983
Cee.. 100 000 13/85
~-----..... ~~-------.... - .... -.. ---.--.. --_ ... _ .... _----._. ~--.. - ........ -8. . PUIICB POLYNlSlA Y... Det. Source of Dota .. __ ._.---_._ .. _--_ ....... _._ .. - .. _ ...... .. ---.... ~-----. ... _ .. _-_ ... _. Leadinc cau.e. ~f .orbi4ity No. of Rata plr
Act,ttil! r'.,p.iratory infection WOund. aocI tr .... Skin aDd .Ubc~tan.ou. layer di.ordeT. Ear aDd "Itoid proce •• di.order. nilorcllr. of the .ye .ad .deeDe Bowel inf.ct~oa (Diarrboe.)
1983 1983 1981 1983 1983 1983
ea... lOO 000
lource 06/84: 13/85:
loforaatioo furui.had by the Mini.try of Health, COok t,l.nd., 12 Nov .. ber 1984 Government', Report aD !vllUitial Proarel. in ~leaentinl tb. Strateaie. for He.ltb For All by tbe Ye.r 2000. 1985
11176: World Health Statiltic. Annual. 1916
13/85
""STOll PACIFIC REGION DATA lillie 0tI locto&COtIOt'UC AND KULTH IMDlCAtoRS
t.a 1 •• diPI c_~ ••• of e~Q,~.bl. dL ••••• ~ ,oc~L4it.y \G eount~ie. or aTea. of tb. WIIO ., .. teo", hdtic a.,i()o'
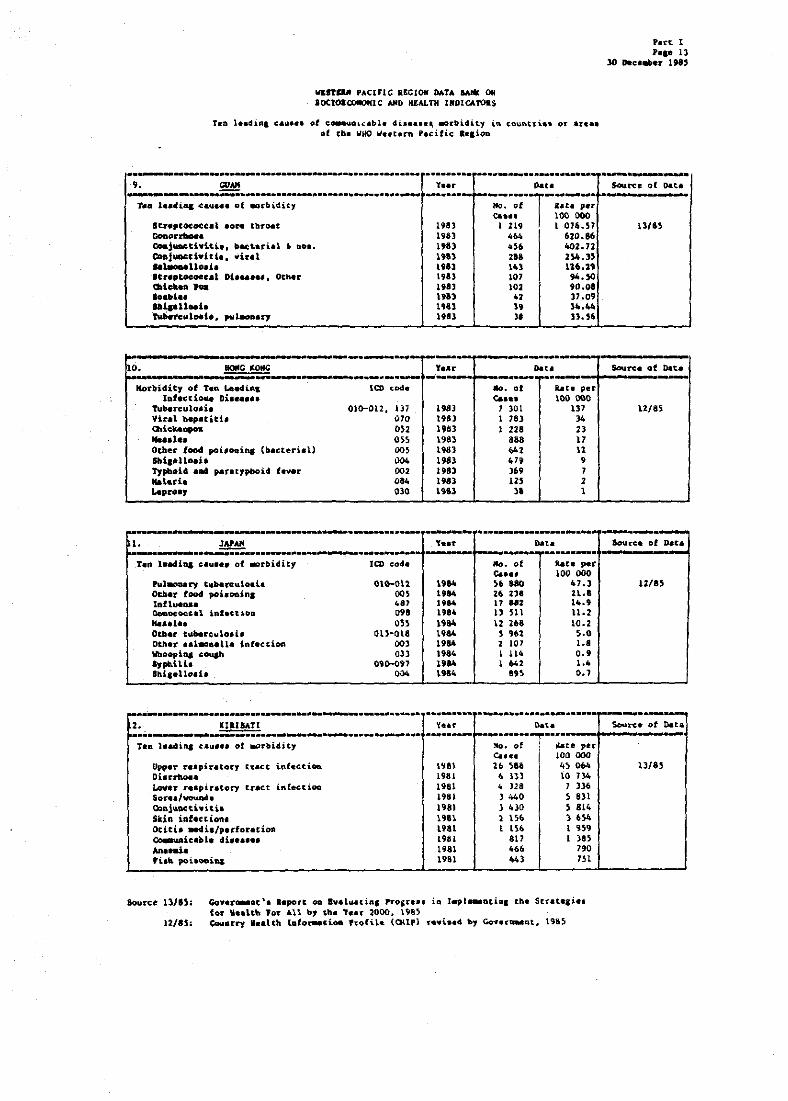
.................. _ ................................. -.. .. 9. ~ ~---....................... ---... --... ----....... ..
Sc.r.pltococ~.l .on tbro.t OOMrrbM_ ooa;uactivit.~'f _act.rial ~ DO •• CODJUDCCl.t,i •• ~ic.l .. t.ouUo.i. Itra,coooccal Di ...... f Other OIIiok.n roa 10."'" Aia_UN" Tukrclatod.. pu laonary
•••••••• -r-..................... . Y •• r Data -·····-f---·-·l----· Ito. of a:.u ,.1" <:a... 100 000 198] I 2'19 1 016.57 Ital 464 I 620.86 1,8) 4IoS6 402.72 19n 21& 2)4.3) 1911 1.4] 1.16.29 191) l07 94.50 Ita] 102 90.08 ni) 42 )' .09 1941 ]' 1 ... " 1911 ]. H.S6
r-- .----.-.----r-- ._-_. O. HOfIG IC.OIIC Y •• r .. " -- _.-.. _-- -- -- .. -Morbidity of Te~ Leadi_, lCD cod. 110. or &.ata pel'
lnfactiaul Di •••••• c. ••• 100000 Tuberculo.i. OHr-OU, m 19S] 1 )01 131 Vir.l b.~titt, 070 1983 1 183 )4
a.i.Ck.opo1t 0)2 1983 1 228 " ..... 1 •• .,) 1983 a .. 17 Other food poi,oains (b.cterid) 00' 19:61 <>4, " Sbi,dloah 004 198) . " • 'typboU ... patat1pboid h1Mr 00, 198) ". 7 Mab.d. 0" 198) m 2 l.epna, 010 1.91l " 1
----_._------- - • .. _ .... _- .. _- .. -------._---I. JAPAfI , .. ,. .. " --_._-....:;;;; .... _ ....... ----_ ... _.--_ ... --to-----..... ---_ .. _-Tara la.dill,l c..u ••• 01 .,rbidity ICD code No. Qf R.ate per
c..a, 100 000 Pvl.oa.ty CubafCuloal. 010-01'1 .. " )6 tao 47.3 Oeb.l' tNd poi.ODin, 00' .. " Z4 Zli 2.l..' lnflueu. •• 7 ,. .. 17 &12 lit.' QoQococ:~.1 iAtactlOD 09. 1984 1) 511 11.2 ....... 1 .. .5) I'" 12 U& 10.2 Ot_.r t~barcu'a,i. Oll-QU, 19 ... ) 961 S •• Other .... 1.a •• l1. infection 003 , .... 2 107 1.8 Vboopi", couah 0)) 1984 I '" 0.' .,phlU. 091)-097 19" 1 .. , 1.< 8taiae11CJd. 1»4 1.9&. .,) 0.7
'.("t. t 'a •• 13 30 Dec •• er 1 ,.,
----l.lt6S
Sourc. of Dat. •
11/8S
---Soulrca of Data
1:/85
~ ............. --......... -.. -.-.--........ ----...... .... -_ .... -.. •........ --... _. ~-.. ,. KIIIBATI " •• r Ilat. ~ .... - --_._ .... _-_._._ .. _--_.- . --.-_._ .... ---ro ••••
-TeD badi.ftI eau ... of ""rbicht1 '0. of ! Kate pu Cue. I lOO 000
Upp.r r •• ,ir.tory C'u,et infectioa. t'i81 26 sea I ., ...
DiurtLo4l. 1981 • III 10 714 Lover r •• piratory tr.ct iftfectioo 1981 • 128
I 1 ))6
Sor .. /vouQh 1981 J 440 5 831 Ooa.j\l'I'Ct.h~tia 1981 ] ItJO S 814 Skin i,nfectiOftt all , lS' I ")4 Otiti, .adia/p.rfor.,ion 1981 1 lS' I. '159
eo..uAic.bl. di' •••• ' 19l1l 8" 1 l8S .... ..;. 1981 <., 7.0 riP, poi'ooiq 1981 443 751
Source 13/151; Goy.~a..at". Report oa Iv.l~tia. pro,re" iQ 1.,I ... atial the Sttat.aie. t~ B •• ltb 'or All b, ,be '.a~ 1000. ~985
12/8S; C:OUury a •• leta la.fo..-ci40. '~ofiL. (OU,} 1' .. vi •• 4 bJ GCt .... l' ... Qt. 1.9&5
500",. of Dat.
U/8,

".t 1 ',_ !," 14 ,. ... -, .,., NlSTIIJI 'Aclrte 1IC10ll DAtA aAJtl OM tOC10aCDllOtUC AIID tlUl.TIt l_CtlCAtoU
Te. 1 •• 4ini cau ••• ot ,a..uaic.~l. 4 ••••••• .arbidity in count~i.. ow .~ •• • , ~ WjO W •• tera P.eific a.lioQ
tt~ 1"'~ •• u." oC .ot~iait, • CO , ... ~. of Cue. '00
,lU-4.,,, ••• i.t .. tl ... l iQhcCioo. ... .. .. 500 22) 1 ")11 toll..... . "1 ,,.. l6 ,,,2 918 "hew ... 1910 IS n. "" O,~.r .i...... of lu .. ~ .. .- 9 9Z1 264 'tr"~IC~,.l tOr' tbwa.t .04 .url'h~ 034 19 .. , Ul Itt .... i..fi. 00. I ... . '" U8 1., •• ,i .. 1 i.t.cti ... ~ f~ .t~.~ .~, ... 001 .. .. 5 '19) .~ . • ld,.11 .. 1, ... .... " 16' Ul hl ... ,,_ Whrc"lGlll. Oil .... 4 5-81 .22 ,.....,., o"ani .... ,.iH •• 4116 _ . ... • JOa m
~.<I'ci. •• . - • • . - • •• --'fie Y,ar Do .. , ---. ... , .... "it:, .t '., .. li4U"4i ..... ~ Mo. ot ''-' .... t. per
c. ••• .00 000
'"l .. " tub,rc"l •• '" 1981 45) U!J .. , ••• 1 •• 19t) .14 n.o 1.laCt'~ '.p.'itL, nl) 111 5'.5 typIIO'''' ,.~~ 198) ,04 34.1 _.
1981 I. 3.' 'II.rieaU .. 198-l • • •• Ge .......... 1 .. 1") .. ..) 1'at .... \983 1 •••
~-'!-------'!--.. ----.--.--- - .. _----s. KAUrll. _ 'Ie4r Do,. ~-.-~.,..-,,....~""-.--~ ... - -_.-
teo. luodiq e ..... of wwb:i.4lt)' LCD 1ii04. No. of a.t. pel' c.~ •• 100 000
.. 1\1f" .84 19&3 19 019 12a.so N'Te_loti, 0 .. 1983 9 361 61.17 .
,.. ... 1 .. .j~ 1983 91U 62.92 CoDocMeAl iaf.e,ioa .. 0" 1981 it 16' 12.11 -. .72 II., 3 SOl n.l0 'hal ..... dtl, .7. 1.11 1 ,.. n.ll Glickear- 053 II., 1 .00 21 •• ' ~l.n 001 1963 Z 19S 1'.13 Ty,t.oi4 fnn .oct ,8"-'1"0'4 f .... r 00: 193) 1 9S1 13.19 O'~'T food poi.oni .. (be~c.ri.l) OO~ .98' 1 ~12 10.69
------_. " •••• ____ • ___ .. ..-__ • ____ • __ .. _rt,, ___
•• lUll.., Y ... .. ,. • p ------..... -~-. .,....- .... ~- -_ ....
T ... ladioa cay", of ... bUit, 1m lI;ood" Il10. of lac. ,.r c. ••• 100 000 ...... .6' 1010 III 1 )10
CoooC"t'bC't*a 0" 1980 ;I .... lIep .. tiei •• .iral 'J, •• 070.3 19-80 ., 575 ..... 1 •• .» .,.. 10 '" Syphili. 090-0'91 19 .. • 110 Stli.eUo.h .... '98. • .. Coc\j.aactiYiti. 311 1910 ~ .. Pin poiaooa"" msa 1980 5 60S Nepatiei •• vir.l eJ'. 4 070.1 I"" • ~'. la1.o .. 11a iftfeetioa (.~.r tbaD "....,id) 003 'M. • I.
CQuJlltry butb 1.tol'Nti~Q Profih (an .. .) red,ed. 1983 sov.rc. 12/13; Il/as, GQva~Dt· ... ,art oa £v.luatie, 'rO.~ ••• ia ~l .... tina the St~at •• i ••
fa.- ... lth hC' .ul It, to , .... 3000. U!&S c.uDtry ,...1n 1"' ..... 'i" Prof". (CIt") r .... ' ...... , COYtT"'ot, 1984
12/81
---Ih~. of .... U/l5
--Source ot IMc.
12/84
.$Durie of Oat. •
14/10
U/I4, n/.a, Soutb •• cific 1p, ... LoLo.ical aad W.alcb totQ~cio. S.rwLC_. AnAuIl "pore lito

WIISTUN PACIFIC R6GION DATA 8AHK ON SOCIOECONOMIC AII1l IllAl.TH i"DiCATOas
Tea leadina cau ••• of ca..unic,ble dise ••• , .o~bidit1 Ln countTie. or .T ••• of the ~ ~eaterR Pacific •• ,ion
~7. ~~. La.dina Clu,., of .. roidity
Acute r.'piratory infectione Infectiou •• nd par •• itic die.a ••• 1njury and poi.onine Di •• ,s •• of the nervou. system and .enae or,.ns Disorder. of .kin and aubeut.ne:ou. 1.ayer. Di •••••• of di&eetive .yetc.
Cau ••• of .orbidity in public bo.pital.
Ooeplieacioms of prelhaDcy, childbirth .nd the puerperium
Hali,u.nt neopl •••• Re.,ir.tory 4i.« •••• Arthritic dia ••••• I.cbaeaic h.art dialale
Y.ar
198] 198] 198] 1983 1983 1983
y."r
1983
1983 1983 19&3 1983
Data
"0. of Rate _~~r eates 100 000 ... . .. ... ... ... ...
... ... ... .. . ... ...
Dat.
Ho. of bte pe~ C .... 100 000 10 818 I 11
24 431 20 088 15 393 13 221
r.r-t I P_,_ 15 )0 Ooc __ • 1985
Source of DIIt.
13/85
8our¢. of
13/85
~ ................ -................ -.......•.............. ......•.• . ................... --- .. --......... .--9, ~ Ye.ar nata Source of Data
~ ....................... -................ --.•...•......•• _ .... _- .-_. __ ...... __ . ~---.--Ten leAdin, c.u.e. of aorbi4Lty leD code
tnflue"_ [nte,tinal p.r •• it" ... unlpe-cified Mea.le. StTeptoeoccal lore throat aDd .carlatina Olic'kellpox Gonococcal infection Viral hepatiti. Other food PQi.onina (bacterial) Lepro., Meningococcal infection Kenin&itia due to ent_t'ovi~us Filarial- iBfcccioa and dracanti.,i.
487 129 OS5 034 OS2 098 070 005 030 036 041 125
1980 1980 1980 1980 1980 1980 1980 1980 1980 1980 1980 1980
No. Qf R.t. per c..e. 100 000
880 27 278 12/81 9S 2 945 21 651 14 434 11 341 8 248 3 93 2 62 1 31 1 31 1 31 I 31
~ ........................................... -...... ~ ... . ..... ~ ... ..•...•.•.••••.. --..... ~ ....... O. PAPUA NEW GUINEA ~ .............. -..... -................................. .
Ten leadine cau.e. of .orbidity*
Influenc. lliarrnoea Gonorrhoea Mea.le, Syphili. Pertuasi. Piabel Tetanus PoliOll.yelitis
*Notifi.ble di.e •• e.
Year .•.•.....
1983 1983 1983 1983 1983 1983 1983 1983 1983
Data _ ... _-_ .. _._--_ . Mo. of late per c..e. 100 000 68 917 2 lSI 50 186 I 566 11 085 533 \0 023 312 5 900 184 2 656 83
464 14 39 1 8 0'1
Source 12/81: Governaent Responses to World Health Statistics Annual Questionnaire on Carta in Cau.e. of Infectious and Pere.itic Diseases; and on Muaber of Death. »1 Caule
13/85: Govera.eot's Report on £Yeluetin, Proares. in lap'e.~nting the Strateaiee fo~ Keatch For All by the Y •• r 2000. l~S~
Source of Data .-----
13/8S

.
hC't 1 , ... 1. " ........ 1915
Wlmu PACIFIC UC1011 DAT4 WI OM IOCJDI.:x.»aC AIlP HUl.TIo IMDlCA1'OkS
tea l.adia, cau ••• of ~Lcabl. dl ••••• , .. tbi.ity LO couGcri •• or '~e. 0' dM. MaD " .. t..n fecit ie: .. ,i._
1"'""-- • .-- --_ .. .-... - .... _--~1. n1.Ll'!:Ula. , .... .., .
• • ••• -'tea 'ell4bta U'Mo4llt of "nidlt, Bo. of .. t. ,e ... '"-t'ti ...... ,. .......
c. .... 100 000 .. - I ... SSI '58 1 016.4 ............ "" Sit 002 fSt •• lotl __ '''' 416 634 730.,
"".-i, tte" &" S81 3)6.6 td.1i'C\I1~t •• aU 'OI'M '''' )'0 U] 26].) tlant-ili " .. 110 101 206.1 kciDar .. , ... I) 1001 U6.1 ..... t .. "" till 285- U6.l. .. U ... b'C .... ' .... , ... 16 90) 500.4 tatlCt~ ... ,etiti. 1914 1) 010 28.3
~~ ..... --.-------.... -... -tt; WU!!<lC or lOUA . " .. ,. .... - .. - -- -- _.
-.th 41'-. ••• ~.iQ& .oTbid'CJ 110. of bte per c. ••• 100 000
Uppar ~.,i.r.tofl trAtt 1981 ... Oth.r ~ta of tb. 'i., •• ti~ _,at .. 1981 .,. Ot"l' pa.,t. of the ,...pir.rot7 .,et. 1981 ... Ai" .1Id ... utaaeou. t b ..... 198) .. , tWil d.it, • • "UQf')t ,la"' .... j .... 1981 ... I,.. ..... ne .... t9l) . .. ,..,1 •• a.it.l GTI •• a 1913 ... !tu'culNUlatal .',u .. &ad cOI\DIcti.,. ti .. "e lta) ... Heatal .i.order. 198) . .. .. ~ ..... atol. p.,oca •• t,1.) ...
.. .. ._-,. !I!!II!! , ... .... -t .. , ••• itt. AaU ••• of .or~i'ity 1 .. .... 110. of bc_ .,.r ..... 100 000 lulu ... 411 .m '1 8'12: ,. DOD.S Other cu. ....... of tlta t'a.,'ntH7 .,.UfI >Z 1912 2 175 1 111.' "-rr-.. •• ,r •• ~d '.faccl ... (Gbl1d-.4u1r) 00'-.1 1.9" .00. 1 '".1 CIOa.}\UU:t bit h 111.) 1912 1 \66 7 "19.5 0(...... of othar perCe of di, •• ti.. .,at ..
~I 1982 au Sll.S
Sian •• .,-pc..- aM ill-ufio1!4 c.oadel_. "12 Stl nO.9 Iac •• ci .. l 1.Iettiou •• i ...... ., 1911 <0. n6.] oh ••••• of e)liD •• "bc:vt.aaoua tb'\MI. ., 196t <., ]U.S 1.IaDcile Diartbo •• OO~'i nllz )7, 1)".3 Gpo" YOU ..... ad. iDjUrJ' 01 bloo4 "n.b 198' )1. J:l~.O
---.---- -- ......... _.- ---.-t'"'~--.---.-.-•• 1111QA1011 Y •• r .... _. ---- _. ... 1 ••• U .... en ... of .orltU,i.cJ leD code ... of bee ,.t'
ea ••• '00 000 Abo ... t1 •• 6)t)-6]9 (98) .. . lacr..:-C'aaial iajlu, • ,S< 19'1 ... M'_ ." 1783 ... IftteecLftAl iafectiool 009 196) ... Clrriar or .... ,.ct •• carriar VOl 1'911 ...
af iftfa~ti08' .i ...... <::ah ... et ,.. \983 ... Ga.nllil .,-pc._ aoct ill~fioa' coadit.ioa. , .. 1983 . .. &C~, •• ".QCi~itia SO. 198) . .. Dl"'t_a .. llicua .>0 19lJ ... ".,,",d014. 45> 1'81 ...
WP. Dua I.'" \lpe.c.4 ., Q.D1",i.. 198J ~t'ce 12/.3: 13/'5: Co¥'~at~. "po~c Oft Iw.l~cinc tC'oara •• ia l.,l .... tin& ch. St~.('li ••
for .... h ... '01' All ", Ca. T •• r 2000. 198!io
Sourte of D,u.
mas
~". O1t Dau
1l18S
lOuR. of n.c.
11/83
--Source of 0.,.
ll/'S

lIES'rUJI 'ACIPle UCtON D4TA aAMK OM SOCIOlCOllOKLC IJfD iUW.TK IMDlCAl"OlS
r.a leadiDI tau ••• of co..unicab1e di •••••• .arbiditJ io counerie. or ar ••• of the WHO W .. ten .. dUc ... ion
'al"t I Pap 17
]0 h¢..o.t 1915
." -_ .. - ---- .. -.. -------... -----.r------.... -.. ---r--........ .S. SOLCllOll tSl.AlU)S - -----Ledi., c.un of .orbWit1
... laria Inn ..... Cocjuacti vi&:b Diarrho.a - cbi\dreo .04 riu1u ot.rrboe. - lofaoe. .... al .. TubereulOlib
• -------.. _--------ZO. n>U .... - --Tn leadia, cau ••• of .ocbt4ic,
Di ...... of tb. r .. ,iuto.., ,yn_ Dl ...... of tb. dia •• eLva .,at .. Di ...... of the .Ilia Di ...... of ebe au.acu,loau 1.t&1 .,.t. lQf.ctiou. -.d par •• itic 4i ...... 111-4.fintd coaditioa. Di ...... of the ""ova a,at. Di •••••• of the &.oito~riDary .,.t .. Dl ...... of the eQdocrina .y.t .. Dt ...... of tha circulator, .y.t ..
---7. ,.,..,. .... T .. lM4ioa c.u. ••• of MrbUity
I.tlue .... Coojwac::thitia Ga.tro~t.riti. [nta.tile diarrhoea -.. II"OAeM ,1lIIu.o"h Adult tuuho .. Otic"" ,Oil Kaeet •• (Mo~billi) Loba~ fnlucaooh
taflUlae c.atroeateriti_. pr •• ~4 inf.cttou. Coojuocd .• i.tb GoOOrtMl a..tti •• i.. Diarrhoe •• pr •• u.ed iDf.ttio~.
- ebildr.o/adult. OlicuOPOK aap.tlti. - ~ir.l. type ~ phb pohoaiq Streptococcal .or. tb~t/.c.rl.t f.ver
.-
-----
r.ar .. t. --r--Mo. of bt. par Ca ... 100 000
19B3 84 526 )2 63).5 1983 )5 ... 13 162.2 \983 8 758 3 38\..50 1983 1 \14 1 225o.S 19:83 Z 486 ~S9.1 198) 91' 1S4.8 198] ,., 147.5
---- ---l'.r .. .. --... of bt. 1"111' ea ••• I 000
\91) 603 JOI.$(J ..., 3,. 171.0 1913 3). 169.$ 191] , .. "'.0 1911 U. 119.S 1'" 'OS 102.5 198) 11, 5.6.0 1911 10' :52.5 198) 60 JII.O 198) 4S U.,
-y.ar .... JIo. of bt. per c. ••• tOO 000
19&1 a 118 8 92.4 1981 , S24 5 616 1981 2 340 2 )79 1981 14H 1 1t1S 1981 1 )62 1 389 1981 1 120 1 119 1981 "" "0 1981 )02 )01 1981 '07 190 1961 .. 8 171
Mo. of bt. per c. ••• 100 000
SO. len.) 34. '230.9 152 101.0 ., SO.) .. 80 S3.7
01 60 40.2 April 1985 60 ItO.l
" 16.8 11 11." \3 8.7
Sou"e 1]/8", GoY.r~Dt·. "port 00 Iv.luatlns 'rolr •• , LO ~l"'Dtiaa the Stratelie. for ... lth 'or dl by the Yelt' 2000, 19B5
06/10; "port of u.. lUahtry of He.all tor 1980
Sou:ree of Daea
1l/850
Souf'C' ot Data
U/Is
Scw.rc. of Dat ..
06/80
13/85

,
hct. I
t'L!!...r198' 1118_ .... ClflC _lOll MTA IAIIK 011 SCIClOBOOMOIC1C AIIJ) HlW.TH 11l1llCAtO&II
Taa l •• diaa cau ••• of co..uaielbll di •••••• .oroi.", 1ft couQcri •• or 11".' of tbe ~ W.,tern 'acific ..,ioo
-------------------.----------... a.~ .......... ....
30.
. Icu.te -t".piratoq iGfMtiODI Di.trhoe.l di ...... Qjhj~th1tU Bltlll illfftU .....
"adill& ".ule. of Iootlll.elit,
SkiD iofectioaa a..pi •• tory di ..... Hal.ru 1,. __ .1' coa,dici ... Di.artlMlu
Ion ...... Di_rtb".l di ..... o, .... t.ry 11&1 .... An:bropDd_me "-""acio faver --..,.." coull> .... d •• APe IWpa CIllo_ap""
...... - .. .... ,... --~2. IIALIoIS _ rcrrUIIA
leD coli_
470-476 009
084 061 0)3 ass 072 052
III-
- - ....... - ....... . .... Tao 1 ... ' .. e.u.e~ 01 .. r~idity ICO colle
Iafl ...... 487 Me •• l •• O'S CoDjuPCtiv$,til 372 0. ...... 061 Be.ati.ti., vi.ral .no- " 010.1 BnbUh 0900091 ~"ulo .. i't ,lIi_ry 010-012 _IOL .. u 006 OoIIottfloU 098 Lep .... , o.~" __ tic fevu, aut. l~3n
1983· 1983 19113 1981
Y ...
1983 1981 19,3 1983 1983
1980 1980 1980 1980 1910 1910 1980 1"0 1980 1"0
--Y.ar ,...--
19110 1"0 1980 19110 19$0 19$0 1980 1980 1980 1980 .1910 ,.
110. of Ca •••
wo. 0' ea •••
" .
110 .. of ea •••
)71 262 349 914 U5953 91 928 68 990 67 318 57 991 51 443 23 386 19 752
.
Dat. --
Dal-.
Rata per 100 000
.. ,
'" ... ... '." .
.... per 100000
691 651 253 171 12. 125 \08 98 44 37
-_ .. llata -. 110. of Rata poi ..
ea.e. 100000 2 307 21 l61
342 3 167 191 1 769
, 21 194 , 4 37
) 28 3 28 1 9 1 9 1 9 1 9
~.rMe.t:·. lePOl"t ft '''.l ..... c' .. Pro,,.e •• in l8pl._ntillil thl Scraee,i •• for .. alta For 4U \)1 tII"t .. r 2000, 1915
loucce of ~t. ...._ .. _ .II1II'
13/85
13/85
12/U·
c. -..... ~ Source of·.o. t .. ~----.......
14/80 :
.
. S .... tu ute,.
12/83. 14/80:
CoUDtry ".1tb Inf~tloD Prof,le (CRl') ravi •• , by Oov.roaent. 1981 .Dd 1983 Soutb '.cillo I,id .. ioloaieal .~ aellth lafor.Atioa "TVi~.J ADn~.l • .,ort 1980

WlSTaaN PACIFIC alC10N DATA IAMl OM SOCIOIIXlllOIIlC UD 1IL\J.T1\ INDlCATOlS
reQ l •• diaa ~.u ••• of .artality in coua'~i~. or ar ••• of tbe WHO Ve.tern Pacific ••• ioa
__ • _____ ......... ____ ._ •• ___ .... _ .. n. ___ •••• ___ •• _ •••
1. AlGIatCA1l UI4OA. , .. _-_ .... _ .. _ .. _-- _._----
Ten le.dina cau. •• of-~rt.litJ (Q) cod.
Di..... of the heart 390-398, 402, .0 .... 29 Accidente aad edver.e effect. Kali,DaDt n.op1 .... Chronic ob.tructi •• pul.onary _ti ••••• Cer.brov •• culer di ••••• Diabeti ... llitu. Certain conditione ari.inc
itt th. peria&cal period Pne..-oDie .ad infl .. e:D&& Cona.~lt.l •• o.alt •• Ko.ici'.
2 •. ~ Ton l •• dina cau ••• of .ort.lity
Acute .,ocardi.l iafarction Ce~~brov •• cul.r di.ea.e Otber i.chaeaic beart di ••••• Maliaaanc neopla •• of traeb ••• broQcb ....
&ud lUD, Other fo~. of b.art di ••••• 415, Motor •• hicl. tr.ffic accident. HalieD_ac aeopl ••• of colon Bronchitia, e.pby .... aQd. aatb .. Mati&naQt neopl ... of £ ... 1. br ••• t Pat:u.ooi.. Atberolc lero.i,
1,
Leadina c.u ••• of .ortalicy
Cardiove.cul.r di •••••• RDad c~.ffic: accident.
1!800-19'9 1'0-208 490-496 410-43B
2S0 760-179
480-481 740-1S9
1960-1978
leD code
410 430-438 411-414
162
416, 420-429 810-819
153 .90-493
174 480-486
440
"'.'1' ~.--
1982 1982 1982 1982 1982 1982 1982
1982 1982 1982
Y •• r
1982 1982 1982 1982
1982 1982 1982 1982 1982 1982 1982
rear
1984 1964
I
-._-110-. of Deattle ... ... ... ...
... ... ...
... ... ...
No. of Death. 23 161 13 977 9184 6031
5 JJ7 3 364 2 708 2 359 2 il7 I 995 1 6n
Mo. of Death.
Oat.
Data
_.-a.te per 100000
82 SS.2 46.2 2B.3 23.9 16.4 16.4
11.9 11.9 B.9
Jlat •. ~ 100
153 92 61 lS
40 22 18 16 13 14 11
Rate per 100000
ParC I p .... 19
30 Deu"'or 198~
.._ .. -._ ......... SOUred of o.t.
---------1318S
Sour<:t: of Ddt.
06/84
Source of
ll/8S
~ .......... -....................... -.... -.... -.--........ -.----_ .... _._.-.. -_ .. _ ... _- --------.. 4. CHINA, PEOPL&'S RltPUBLlC 0' V.ar Data Sourt:e of n.c. ~ .. -..•.... -............... -................... -...... ---- ----.-.- ---------.... ---------1---._------
MortalitJ froa tan infectiou. di ••••••
I - Epid •• ic car.bro-.pinal -.ninlici. Kaeaorrha,ic feVer "*.,1 •• Ipidemic .ne.pb_Iitil a Viul bepatitil Leptoapiro.h Diphtheria Whoopina CO"lb Typnoid .ad p.r.typboid fever In.fluea..a
1984 1964 1984 1964 1984 1964 1984 1984 1984 1984
NQ. of IWte per Death. 100 000
S 935 0.6 2 92~ 0.3 2 906 0.1 2 l6S 0.2 2 0,0 0.2
7'5 0.1 372 0.03 )ll 0.0) 2>2 0.02 202 0.02
Source 11/8~; CoY.~...at'. "po~t on tvelu&tial 'roar ••• in l.ple.enting the Strategie. for Health Por All by the Y.ar 2000, 198'
06/14,
O&/ij,.\ ;
ldforaaciOD '"rni.bed bJ th. eo..onw •• lt~ DepaTt .. ot of Health, Au.trali., 27 July 1984 S..i-Annual leport of WkCfleljin, for th. period ~rch Co AUlu.t 1985
06/84.1

Ma6TBaa rA~lrl~ IICION DATA a~l ON 'OC:IOl~C AlII) UALtli IllDtCA10IS
TaD 1 .. 4i .. ~.u ... -of aortlli~y lQ cowaerl •• or are •• ot ._. WIG W .... ,. P.cific ... loe
te1t 'MU", ••••• of _rtaUt,
Dla ...... f circulatory """ oj ....... f ~. r •• piracory ".t •• ..... 1 .... Bd .... ina aDd .. e.~oli. di •••••• 511ft .... ad il1-4efiaed coaditioG' ca~ •• iQ e0a4ition. oriaiGatina io poriDaCol poriod 1_'''"", ,ad pac •• itl. 'i ...... ll\lld ....... bpi", Di ...... • 1 tho ''' •• ei •• """ ni ...... :.r tbe ~rYOu' .,.c ..
V.ar
1983 19J3 U83 1983 i91J3 UIIl un 1983 U83 1913
Mo .. of Death.
42 20 l3 10 10 5
" " 3 2
»at.a .... lOG 000
237 1U
7J 56 56 28 23 23 17 11
- ... _--- .... _ ..... _._---jlS._---~-.~.-6. ~tlC UoIIPU .... !". 1ear Data
t--.. --........;:;-~ ........... = •• _-- -. i--------- --:--T.o l-eadiaa c • .aa •• -of _rtalicy ICD ..... 110. of Ia.e per
Death •. 100 000 Ql,oLer. 1974 1. 0.2
06/84 ..,4 13/85
Sourc~ of Data
11/76
...--.................. _ •• __ ...... .,...-••• _.'-... - ........... .-...-••.•••• - ........ rr--. 7. PUI Y .... Data SeNrc_ of 1>ata ~--........ -...... --.......... ---...... • .... ---- --..... --- .._ ....
Ten 1 •• diQ& cau ••• of _reality 110. of aate per Death, 100000
Cire~l.torr di •••••• 1983 ... . " 13/85 Heopl •••. 1983 ., . . .. Ielpir.to~ di ...... 1983 . " ... 11l.fec.t,ive a1Ul par.aitic 4i •••• e. 1<)83 ., . ., . O"I •• t~'V. di ••••••. 19&3 . . . ...
~'. ' . ~ Year Da •• Sourc. of Data
Leadift, C.V.I. of ~rtality 1915 1m code 110. of aa .. ;:or Death. 100
C.r4i.o .... cul.r "i ...... ,. 390-459 1981 71 46.1 13/85 T_* 140-239 U8) 47 28.1 and 111-definod .,.ptoao 78Q-799 1983 ]4 20.4 06/85 .ad motbid eo~itioQ' COaditioal with ori.iD 760-779 ,1983 33 19.8
in tb. periJlatal poriod a..piratory di •••••• 460-519 1983 24 14.4 bternal c ..... ,of iajul'J' and pohoaiq 1800-199' 1983 22 13.2 Oi ...... of the urVOUl .Ylt. aDd no-Jl9 1983 19 11.4
•• '08. oqua Di .... !' .. of the 1'Q.it.oud.u.~ .. ,It. 580-429 1983 16 9.6 lofactiou. anA p.~.itic di •••••• 011-139 1983 IS 9.0 Di ... , •• of the 4i ... tiv. 'Ylt .. 520-529 1983 14 8.4
Source 06/84; 13185,
l.DfotlUtioa fvni.b_ ltJ the mail't7 of N •• 1th. CooJl Illand's. 12"-, ...... r 1985
11/76, 0618S.
OW ....... M._l• "pDTt 00 a".l.aatiaa '"oar ••• in l.pl ... ntia., the S:J::r.t .. i. ••
fer ... It.1i,... ~"If; ~ ... l.I' ~OOO. 1985 WO<1d hdtli ... d.H ... _1, .197. _cry ""1th ltifqtMU .. ,"fi~ •. (CJllIl ~"'~.")I" Gov_mlo!nt, ,.n85
WEST&aH PACIFIC REGION DATA BANK ON SOCIOlCONOKIC AND KlALTK IMDlCATO&S
tea lead ina cauae. of mortality in countries or area. of the ~ Weltern Pacific Re,ion
P.rt I P ••• 21
30 !)ec"'.' 198)
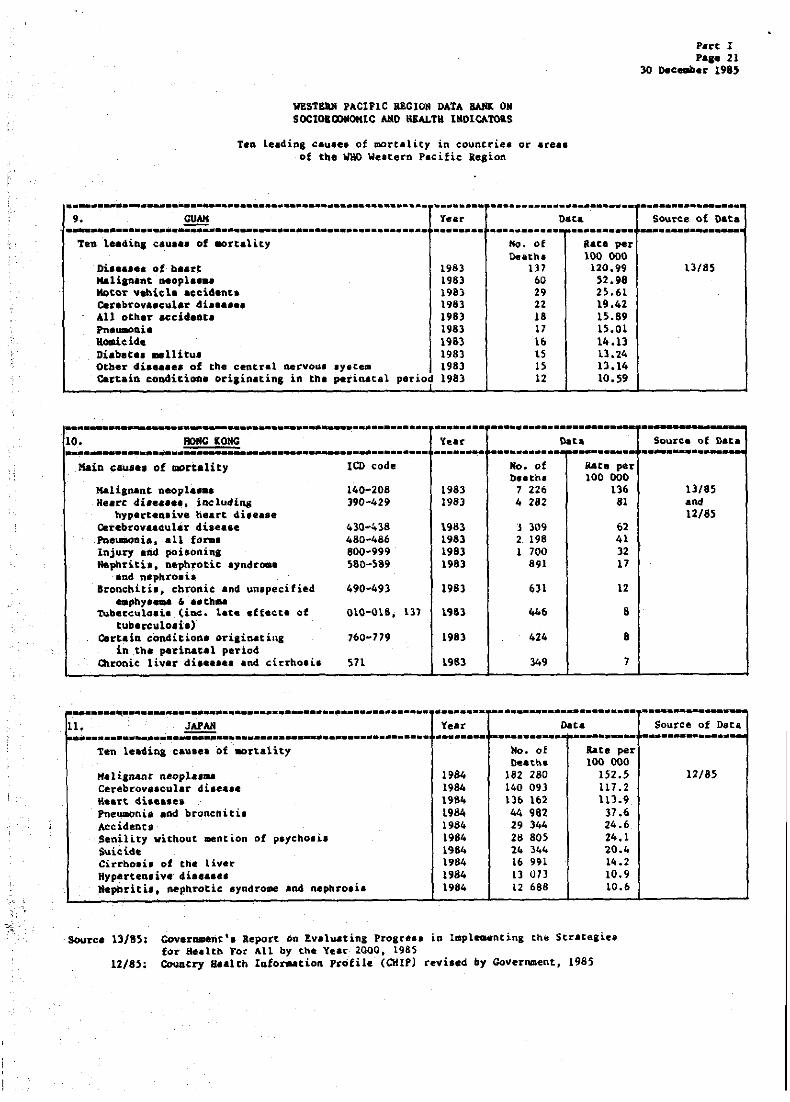
....... ~ ......................... ----......... --...•... -.. . ...... . ........................................ 9. ~ r.ar D4ta Source of Data .................................................................. .•..•...... .......... ... ...... -. .. ... Ten leadint c.u ••• of .ort.lity
Oi...... of be.rt Haliananc neopl .... Motor vehicle accident. Ce~.brova.cul.r di •••••• All othar .ccidaota Pnau.onh _.ddt Di.beC .... llitu. Other di •••• e. of the central nerVOd. .y.tem Ca~tain co04itioal oriainating in the petin.cal period
1983 1983 1983 1983 1983 1983 1983 1983 1983 1983
.......................................................... . ...... . 10. HONG KONG Year ..... _ .. __ ... _- .. ............................. . ...... .
Main cau ••• of mortality
Mal isnent neop1 .... Heart di.ea •••• includin,
hyperten,ive heart 4i.e •• e Oerebrova.4ul.r di •• a •• PDeuaonia •• 11 forma Injury end poisoninl NepbTiti., nepbrotic .yndroae
.nd n.phro.h Bronchiti., chronic and un.pecified
eapny .... , •• th .. ~b.rc~lo.i. (i~. late effeet. of
tuberculo.i.) Certain. con4itiorl' or111Mting
in ,the parinaea1 period Chronic liver 4i •••••• an4 cirrho.i.
ICD code
140-208 390-429
43Q ... 4l8 480-486 800-999 580-589
490-49)
OlG-OI8. I))
760-179
Sll
1983 198)
1983 1983 1983 1983
198)
1983
1983
1983
Ito. of gate per !)eatl .... 100 000
137 120.99 13/85 60 52.98 29 H.61 22 19.42 18 15.89 17 15.01 1& lit .13 15 13.24 15 13.14 12 10.59
....................... --Dot. Sourc:.e 01 Data ............ ~ •.•....••. .. _._ ..
No. of Kata per b.atn. 100 000
7 22& 13& 13/85 4 282 81 and
12/85 j 309 &2 2 198 41 I 700 32
891 17
6)1 12
446 8
424 8
349 7
.--..... ~.-....................................... -..... . •••••••• ra····· .. ••• .. •••••••••• -.--'-----., U. JAPAN Year Data Source of o.ta ................... ;;;;; ................................. . •••••• - !'-._ •• __ •• ,.. ••••• --I-----._ .. -
'ten leading, eaua.a of IIOrtality
HalilR4nc neopl •• ~ Cerebrovlecular die •• e. t\e.Brt <lit ••• ea Pneumoni •• ad broncniti. Accidenu Senility without .ention of peychoei. Suicicht: Cirrbo.i. of the liver Hypertenlive' die ••••• Jephriti •• nephrotic eyndroee and nephroei.
1984 1984 1984 U84 1984 1984 1984 1984 1984 1984
'No. of ltate per Deat.ha 100 000
182 280 152.5 140 093 U7.2 1)6 162 lll.9 44 982 37.6 29 344 24.6 28 805 24.1 24 344 20 •• 16 991 14.2 Il 0]) 10.9 12 688 10.6
Source 13/8~; Covera.en~t. aeport On Evaluating Progress In lapleaencing the Stratecie. for Healtb For ~ll by the Year 2QOO, 1985
12/8); COuntry aealCh IQto~cioR ptofile (CHIP) revi.ed by Government. 1985
12/85

IIISTUiI PACIPIC UCIO. DATI. &\11K' 011 SOI:IOl_HlC 'AlII> IlBALTH IIlDICA'IOas
'tea 1 •• d'_ eH .... of lIO't'tality ia countr-ie. or .ru. o,f' ._. IfIIO It .. t ... PI.iti.leat""
.. )~'" ..... iii ."IOonllity leD co4e 110. of DI.ath.
, "' ..... • t'e'.' part. of di, •• ti •• ", , 530-)79 1980 15 Mt_'''.b C1l0_018 1980 14 .. ,." ... l ~f.ctiou. 4i •••••• 001-009 1980 13 Gtklr .l ...... of' r •• pi~.tory .,.tea 466. 480-)19 1980 11 OI ... r .... cular dile ••• ,.30-438 1980 1 ~ ... ,.rt ... cl ..... u .800-£848 1980 1 111. ••••••• f tI\& .no .. , .yat ... 320-359 1980 6 Df,. •• f "' __ rl- ·circul.tion and .~r f.,.. .f, ... rt 4i ••••• 41S-429 1980 6
,lIIonJ.t'_J ",fi_~e""l" 260-269 1980 S ~, i_j.,l,., •• rl, ca.piicltioft. of 9iil-929,
UII_ 958-959, "0-995 1980 5
aate 100 000
26 24 22 19 12 12 10
10 9
9
Y ..... O.ta
TOft It ..... cau ••• of ... tllity Y~.'f No. of .&te pel' Death. 100 000
IUlnta 1971 208 1 Urlobto8.~itl'-lripp.. paeUOADil 1911 56 2 ar.e.t ••• i .......... 1971 48 2 T~.~evlo.i ••• 11 fo~ 1911 45 1 l>i.r'h ... 1971 44 1 Prt"~"~'t, 1971 38 1 Av1c .. l.ao.u/Alul_ia 1971 31 1
". Keftinio .... .ce"'.litt. 1971 29 1 ·IDj"rb. 1971 20 0.7 Cho\ic,ltiti./Cholilitbi •• t.l.i •• bo.i. 1971 16 0;5 Del. caeplleatiou 1971 16 0.5
U/as
al'D.ta
12/83
~ .........•. ~ ............ -...... -..... ~............ ........ ~ ..... -............ --.~ .. --..-. ...... --. . 1.4.- ~, " .. _ ,, __ ,: lear Date Source of Data . r-.................... _ ••• __ ••• _,._ •••••••••••••••••••••• ~ ••••••••••• -.-••• ,.---- _ ........ - ... -"""1
_-Tea. le.d.in. cau.a.u of _rtality t~~ c~,. No. of .at. per
Senility without .. ntien of p~yehQ8i. Ger.brov.~ul.r di,e •• e t~befCul.ll. of f •• piT.tory .y.t •• Hal i,nallt ".0,1. •• of h"&Ch ••• '
broecbu. .114 1 una Mali,nant "Mlopl ••• of oth.-r end
u"l,.ciU", .ite. Jronehiti., .-phy .... and •• eh .. Z.cb ... ic h .. ~t di,e ••• .,,.r,an,\vI .iae ••• ~~t. tel,i.ato" _inf.ctL~.
'i1\<t4!4i ... '_Uu",,_ .• 11'1 ;~i, ·.--:iJi •••••• of 'tb.- .~~.l'i.'J
... t •• lol •• , ... o.,i n.d ..
A1l6· Io8S A6 ASI
'A93 1083 1082 '1089-92
"'1186
1983 1983 1983 198)
1983
1983 1983 1963 1983
1983
,,',.
De.the 113 168 94 76
69
St S1 Sf>
-",;;. ,",,-. Sl
38 ", .
100 000 14.5 n.5 . ·ti.li
5.2
4.1
4.0 3.9 3.8 3.5
t.r.
IouYo. UJ8S: ,aoverntltlnt1e Meport OD Ival .... cina l'tbgte •• in laplen.entiRJ the Strae.,i •• for llealtt> for All by the Y.ar 2000, 1985
12/83, Country Health Info ....... ioo Profile (QllP) r .... loed, 1983
13/85
I
.!
WlST&aM PACIFIC aEGIOR DATA BAfiK ON SOCIOICOllOKIC AND 1IIW.T11 INDICATORS
Ten lead ina caua •• of .ore.lity in cO~Dtri •• or ar ••• of cbe WHO We.Clro Pacific ae,ioa
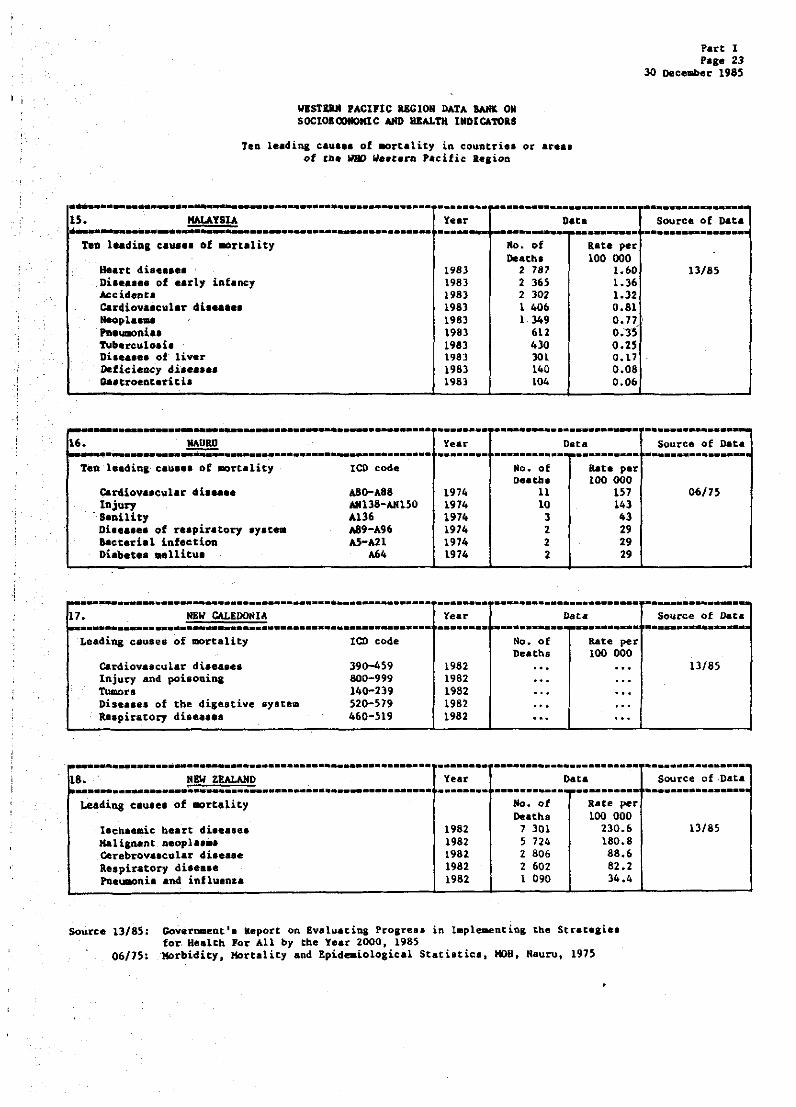
teD laadiPI elua •• of .ore.liey
Heart dia ••• I. Dil •••• 1 of .arly infancy Accident. C.rdiova.cular di •••••• NeGpl .... ralumoni •• Tubereulolh Dil •• '.1 of liver Deficiency di •••••• ealtroeDtlritb
~ ......................................... ---......... . 6. ~ ~~ ... -........................................... -... .
Teo'l •• dine CIU'" of ~rt.lity ICD code
C&rdiova.cular di ..... Injury
. 80Dility Di •••• e. of r •• piratory .yat .. &actari.l infection Di.bet .... llitul
ABo-AS8 AII138-AII150 A\36 AB9-A96 A5-A21
A64
Year
1983 1983 1983 1983 1983 1983 1983 1983 1983 1983
........ Yeaf ........
1974 1974 1974 1974 1974 \974
Mo. of Deatbl
2 787 2 365 2 302 1 406 I 349
612 430 301 140 104
Data
. ..................... . Oat. ...... -.. -.-~-•........
No. of Rate per D •• cb, 100 000
II 157 10 143
3 43 2 29 2 29 2 29
Part 1 Pal. 23
30 December 1985
Source of Data
13/85
................. Source of Dat. -........... -----
06/75
~ ...... -... --............. -...... --.. -.. --... -----.---.-. .. _-_ .. - _ .. -._._--.... -........ _-----...... ----17. NEW CAlEDONIA Year Data Sou~ce of Data ~ ......... --............................................. .
Leading causes of mortality lCD coGe
Ca~iov.scular diseae.a 390-459 Injury and poiaouing 800-999 TuIIIOra 140-239 Dise.eee of the disestive .yatem 520-579 1teapiratory dis ••••• 460-519
~ ... -......... -......................................... --18. ~ ...... --................. -... --........... --.. --.. ----.-.
Leading eau.ea of ~rt.lity
laebaemic heart die.ale. HAliCn.nt n.opl .... Otrebrov.lcular 4ile •• e Re.piratory die •••• rueuaonia and influenza
._ ...... -_ ......... ~ ....... -. 1982 1982 1982 1982 1982
.... - .. 'fear ........
1982 1982 1982 1982 1982
No. of Deaths
Rate per 100 000
..... _ .. __ .... -.. _ ..... Data . ... -.. --... ~ .. --.. -...
Mo. of RaCe per Death. 100 000
7 301 230.6 5 724 180.8 2 806 88.6 2 602 82.2 1 090 34.4
Source IJ/8S: Government's keport on Evaluating Progress in t.pleaenting the Scrateaies for Health Por All by the Year 2000, 1985
06/75: 'Morbidity, Mortalicy and Epideaiological Statistic., HOH, Nauru, 1975
... _ .. ----13/85
.-..•........ _ ... Source of ·Oata . ......... _---.
13/85

'M I r.: .. , .... ..1ft .. 'acnle IIGIOM DilTA JAIl' 011 _lOl~CAIID HIW.'tJl lMPlCAtoU
..... 1 ... , ......... f .ftaUty ia cO\Intri. •• -0" _rea • • f ' ...... lleace,,'uUi •• ','Oft
.. ..... f .ruaa,
==:!:. .. .. ," "'.~'''''''Kl.r ....... ... , .......... ' .. IUlrt ft.,,"h ..., .... ..... ;.UII" .,. .. lIhh
All." AII""'t ...... 'tr ....... , •• ".11". ,.dhlll' 11 ...... 0' ........ llitu. IIuOIhel .. l1li4 Df .b .. , ,.. •• ' .... IIl.h ... Uea'~ ........ ., I ••• t'
T •• 1 ... , ... IU ••• af , ••• ltuliea.l .. rtallt,
"'-lIla 1M1.". C.~~.i. UMUi ... - ,ub ... 1 ,n'" Mlr.ulo.h " 1M .... "h III •• fia.. 'It.ltiaolin, •• ti •• Pi •••••• or 'ul ....... ,. "N"lotl.1\
.a. oth" h •• 't .1 •••••• Soptio ... ia _ .. i. lito •• 1Id .,., .... of ill-d.fiao' oolldicioD'
- ',Oft.hltl ••• bro .. lc lad ........ ifi •• .... hy ..... a" •• t_
Ten l •• d'nl cau ••• ~f .. rtality
I'III_Dla. HIIlYt .h ••••• ~~.,.vID.t •• all raroo 01 ••••••• f tha ••• oul •• 'J.t •• Klli,-.nt a •• 'I .... 01" ...... Md.i~to lv' ......... aftd a.hlr IlUt.ltloaal •• flel ... L •• lMul •• .. ,btlti .... a.pbreti •• ,.. .... ao4 "'-' ••• 1
•
1979 1919 1979 1919 1979 197. 1919 197.
'1979 1,19 1979 1979 1979 197. 1979 1919
19&3 191] 19&3 198' 1t8] tta3 191]
198] 1913 198]
Y •• r
1'84 1984 1984 1984 1984 1984 1'84 1984 1984 1984
10. of Death.
~ ]
2 2 1 1 1 1 1 1 1 1 1 1 1 1
No. of Duth.
1 292 421 402 299 271 222 178
155 132 99
No. of Dlatbt 41 5U ]2 426 28 161 21 047 16 090 14 776 8 946 7 140 5 221 4 504
Oat •
100
Data
Pat.
loa 81 54 54 27 27 27 27 27 21 21 21 U 27 27 27
Rate 100
36.8 12.0 11.5 8.5 7.7 6.3 S.l
4.4 ].8 2.8
16.8 13.4 9.8 .. ~
I .. rc. 12/8], Cou.ttY He.lth 1.f ..... loo Profil. (CHIP) reyl •• d bp Dovera.ent, 1983 13/851 Govlr_n.· ..... n ........ luati'" ProSre .. in Il1p1_Dtioe the Strate,i ..
far ... Ith POt All ~, tbl ' •• r 1000. 1985
loul'ce
12/63
Sollt'Clft er!-.
1l/8S
Sourc_ Data
11/85
I ,

..... !'IO rACl1IC UCIOII DAtA .... CM IOC10lQ)tIJMlC AMD 1lLfJ.'N UIDIc.atoll.
teft l •• diaa e~ ••• of .o~t.lit1 in couQtri •• or .r ••• of tba WHO y .. t.ra P.c-ific .8,i.OQ
Part 1 P ... as
10 Dlcatlber 1915
r .......... •••• ...... ·, ........ • -.. --.. --•• --•• ~ .......... r-..................... . ...... ... 2. IfrO.Lle 01 10UA Y.at o&t. Sourc. of Dat.
1--".. . ••• ------•••• ----. ~--.. r___--..... I"'""-.---~--... -Mat_ 4L •••••• c.u.iq ., .. te!ie1 110. of lau JMlr
a,puc. ... h. 4i ..... Cerebrowe.eul.r di ••••• Other eccit •• , •• iocludiQ& 1., •• U*Ct, Ali .. Kaliaa-t ,,"pla" of naa.eh Chtooic- li~r 4i ••••• and eirrboai. Tr.aaport 4i ••••• tuberc:.,loaia Suici" ..... U-inflicUd i.njury l¥OOCbitl. cbrODi~ aDd ~p8ci.fi..d
.... , ..... Ad "I~
19U 1983 19a} 199) 1'111) UU 19a1 198) 1983 198J
- - -.. --- . -_ ...... _-3. ...... Y •• r -- ... _----T •• 100410& ...... of _rt.Ut, "" ....
Ii .... .,-pro.. .... I11-d.U .. 4 c.Dltdir..hu •• 1912 PM ...... 12I 1962 rut.o_t:7 drculatn , odM:r torw "urc db 28 1982 .01.ool .. aod toale .ffect " 1981 HJperteaat •• di ...... 2. 19'2 1.~b.e.ic ... ~, di •••••• U 1982 ~Ut. bat ill - d.fiD.d c.r.bro ••• cul&~ ZtJ lta2 lat •• tiDal iaf.ctiou. di •••• e. 01 1982 Oaroaic. liv.r 4i ••••• and cil'rbo.i. " 1982 Di...... of otber ,. .. n of 4ia'" i •• .,..t .. ,. .9U
Duth. 100 000
.-._--Dat. -.-r----
10. of lau per Deacb. 100 000
69 43.6
" 15.9 '3 Ift.6
" 1).9 18 11.4 II 10.1 11 lO~' 17 10.1 15 '.5 13 8.2
-----.-_ .... .... _-._-- ---r-------.----24. SIHGAPOU Y •• r 0. .. --- --------~.-f-- ---T.1i l.alii ... c.ua •• ~f .ort.lit, I-Li..t No. or
I&t68 D<t.tb. 100
Come ... 11- 22 198) ... II' lach.a_ic ... ot~ar beart 4' •••••• ) ZO. 1I.-11 I'll ... la8
) l>. J. PM~t.. 17 1983 ... .. Car.brov •• cul.r di •• ~ •• ,. 1981 '" 58 o\c.ci4 .. u. poi.oniDa eDd. violeu. 'S2-:U 1983 '" OJ Di.b.t .... llitU4 ZJ 1983 '" 15 Ii.,bri,i. an4 nepttro.i. .J 198J '" Il Hyperc .. eiv. di ••••• J. 198) '" \I Tuberculo.i. , 19S} ... 9
. Iroachiti .... pbJ .... aDd •• tbae " 1981 ... ,
Il/8S
.-Source of .. to
11/83
Sou~ce of Dat.
u/n
• -------.-_.---_ •• ---.--••• -.---- _ ..... -r--.... -........... --.... --• .... ----s. SO~ ISLAiDS Y •• r Dat. S~rce of O.t. --- -------... -.-.- ~· .. ·--~-----.. T··--····- .. _-_. 1Aa.iq. CIlUII .. of _Ttdic,. 10. of a.te pee-
".pir.tory .i •••••• Hdad .. Heul .. HeoiftCit.i. Di.rr~oa.1 di ...... lied!! iDjuri. •• Cool_aitel a~li •• ArIo_.i. M;cidat.
1982 \911 1.982 \912 1982 \982 \982 \982 19U
ne.th. 100 000 12 4.'
S 2.0 S 2.0 10 1.6 10 1.6 2 0.8 Z 0.8 1 0.8 Z 0.8
Sovree 13/850;. CoY.~~Qt'. "po~t oa ' •• l~lina V~olr.a, La t.pl ... fttiaa tbe Str.teaie. for lIe.ltb '01' .\1 by tbe Yur 1000. 1915
lUll: ... lMu Bau u.pd..at.ed '" CLOJo\p'., 1981
13J85

,
" ;
IIIstulI rt.ClP~C UCIO" Dt.T~"_ OK SOCIOJOO_IC .... !lULT" .1"'1!iA~
Teo laadiag cau ••• of GO~t.lity i~ countries or are •• o~ ~, ~ W •• t.m '.cifi .... ioo
D.t.
." .. i~uo.,. .,ft .. circ~1.t6~ .,.~ ..
1983 In:! 1983 1983
Ro •. of' Oe<iltha
3 3 1 1
.. t. ,.. 1000 1.' 1.) 0.5 0.5
~ ........ -.... ............... --. ... '" ........ - -.-----~ . F" . .. y ... Dat. I-'-.. ~~., ... ~ ",.~, .~--.~-................... ., ~ ----._._--
Tel> 1 .. 4i", "I!f'~ lit lIO~telity* tal. cod. 110 • of late per , J. .' __ •
n.ath. _ 100000 """"Ji~io. ,.."".p~ic '1"dr_ .od ... ,brOllb 350 1980 22 22 ~l. 321 ~9ao 17 17 I!i""~~.~ .. n h ... , 181 uao 16 16 t,,~~, n..rt di~.~ •• 27 1980 13 13 44uc. .,oc.~iol 270 1980 12 ,12' "01-",000 ••• 1 i.f ... U .... 036 1980 10 10 "".roV"~"l.r .It .... 29 uao 10 10 SfPtf..ua!. ' 038 Uto 8 8 1Itn::".h. di ..... 26 uao 8 • ~ At pfOp~... of r ... l. D .... t 113 1980 7 ';r ,." ... ,-,:.114 tm. effocCl S] 19ao 7 7
•••••• • - I ...... ............ . ..... ,~ . -...... ~!: ........ ~!!!l.!!!!1O!!..!JI.!t;cm~~:. ... ~. l.ar Data
= •• --- -..... --. ---Leadi", .'U •• ' of "".to lity ." 110. of hte pel' IIeath. 100 000
Die ••••• of the -beart 1983 ... 47.0 c.nclr 19'3 .. , 32.8 OlroClic. ob.t:ruCC.;':vl pu,l .. ury di ...... ' 1983 ... 26.1 Cerebrova.eular di •••• e 1983 .. ', 21 .. 6 ' Influo .... Ad po.~ia 1983 ... 21.6 ni4J~.oe.l dh ..... 1983 ... 19.4 ' , .. ~td.nt"" 011 ty, .. 198] ... 17 ... 9 Pr...cLlri t1 1983 ... n.9 &04i40 1983 ... 14.2 Di_ .... -Ultul
0' 19B3 .. .. , 1).4
eo.",h 4 ........ ••• Iy inf .... ' 1983 ... 10.4
·-·-..... -·~-..... --··---........ -,--··-.... -.. l·~····· --.-.... --.-~ ,9. ~ Yeer Oota -...... -... ~ ... ~----.... -.-........ ----- -.--- _ .. _ .. _- ..--Loa4i", cau ••• ot ... ~t.Ht, 110. of Rata per
o.at60 . 100 000 ;-1)1 •••••• 01 c_r4i.ovuc.ul .... y.t_ . 198)..... ... 1'U~.rY illf •• no .... in.lud,i", put .... ..., tIlDncalo." 1983 ;.. .,. Still birth and pe"Qat.l d •• Cb 1983 '" Liver d1..... 198) .•• Otreb-rov, .. tul.r 41.1... \983 '"''
Source 13/8S: Cove~Gt'. Report on Bvalu.tiaa Proare •• in tapl88eDtiDI the 5tr~t.ai" for Bealth Po. 1.11 by the Ye .. 2000, 1985
06/80: lleport of Cbe l\iftiot.y of .. elt" fo. 19ao
So,,"rc. at Data
~-,
06/80.
" ..
Source of hea --13/85
. Souree of Data -----"i 13/85
,

j
l •
~-:, l"
WEST&aH PACIFIC REGION DATA 8AMK OH SOCIOEOOIlOKlC t.ND IIIW.TR IIIOICA1"O&S
Ten leading tautes of mortality in countries or area. of the W80 Western P.cifi~ R.,lon
Part I page 27
JO Dec_aT 1985
, _................... .. ............................ .••..•.• r-...................... _ ............ -. ~O. VANUATU ~e.r Data Souree of Data ~-----------.•..•...• - ......• -.- .... _-1---._ ..... ~-.. - .. - -.---,----1
Leadioa cau ••• of .art.lity No. of aate per
Pneuaoni. and otber ~ •• pir.tory di •••••• Gaatro.ftteritie Malari. cancer TuIN:~culo.i.
~-----.-.. ------... ----...... -.-., ~1;· SOCIALIST IU!PUBLIC OP VIET NAIl
r--.--~-"""---.. - .... --...... ~ ........ reu leadina eau ••• of .oreal it, IQ) code
&o.teriti. AS Avitaaino.e •• other nutritional deficiency A65 Bacillary d,.entery aDd ..oebi •• ia fA .Tuberc.ula.i. of r •• piratory .y.tea Ai> 1I&1ad ... All Oc_r 4i ....... of dt.c •• ti". .,.t~ .\104 Otolera Al . Viral eoeephalicia A27 Other eliee •••• of re.·pi't'.tory .yet .. A96 Otber fo~ of beart diae •• e -
rr----------- = ••• ---------.-•• ---~2. IW.LI8 AND FtmJIIA ~--~~~-- .. _--_ ..... - .. _.
ten le.4lua cay ••• of .arc.lity lCD cod..
Birth inJu.ry. etc Heart dia.a •• Pneu.onia Avitaainose •• etc Kalignaat aeopla_ Sy.,ptou J etc Conl~nital auoaalie.
1983 1983 1983 1983 1983
.... _ .. Yea:t .. -_ ... 1980 1980 1980 1980 1980 1980 1980 198iJ . 1980 1980
Death. 100 000
~ ...................... Data . - ........ . .... _ .
No. of aate per Death. 100 000
2 003 4 1 45& J I 347 1 1 093 2
826 2 7H I n4 l 694 1 515 1 496 I
.... --~--... -.-.. -... -Y.ar Data -- -- -110. of Rat. p.r
Death' 100 000 1972 18 180 1912 10 100 1972 8 80 1972 7 10 1972 5 SO 1972 5 50 1972 " 40
Source 13JS5:
11{83: 11/75:
eovern.ent'a Report on £Valu.cine Progre •• in l.pl..-nting the Strategies for Health For All by tbe Year 2000. 1985 WPIl Oac. 8&nk updated by waC/Ranoi, 1983 fiftb "port on tbe World Health Situation 1969-1912. WHO, 1975
13/85
~ .... -... -... ~ Sou~e of nata .._._-....
12J83
Source of Data -- -11{75

,
'Itt 1 P4l' 18 30 iII.iia~ .. 198~
WlSTERH PACIFIC REGION OATA BAlIK
ON SOClOECOtlOMIC ANI> "EAUH INlIlGATOIIS
Six 4i.ea.el under thl WHO Leaflet on ChildhoOd Co.municable Disea.e. ~umul.tiv. total, of c •••• and deaths fra. ~eporc. received for the y.a, 19 __
• &.tiut~ C~.u1ative number.of di ...... population DIP"THERIA PERTUSSIS TETANUS
110. II." Year { ',<IOO} Cues D •• thl C, .. e. Deacha- .; ea •••
U (l) Cl) (4) ( 5) (6 (71
1 AliItic4n 'attlO. 1984 35 0 0 0 0 0
2 AIi.tulia 1982 \S 176 1 u 19& ) 11
3 & .... n.i llat.UIl .. 1981o 269 0 · .. 0 · .. 0
4 ct\ina 1984 \ 051 551 1 418 372 215 965 333 .. . 5 .Cook 111 ...... 198] 18 ~ 0 0 0 0
6. _utic XAillllilCh •• 19114 7 \4' . ... · .. . " . .. ... .,' Fi]l 1914 .700 0 ... 5 · , .. 1
8 Ptench PolYh"1.· 1984 160 0 0 0 0 0
9 au ... 1984 119 0 0 0 0 0
10 Mona I(ona 1984 5 364 0 0 18 0 46
11 Jap.n 19'3. 119 .). :CO 0 2 459 12 56 11 Kuibati 1983 61 0 · .. 0 · .. · " lJ Lao ~eo91. s __ De ... n .. ~ 1984 4 315 )0 17 1 813 14 Jl
}' !IAe.o . ' 1984 J09 0 0 0 0 6
l~ Malaysia 1984 15 20. 17 3 57 2 · .. 10 Nau •• In2 7 0 0 0 0 0
17 New Caled,01\):a 1984 152 0 · .. 9 · .. J
I~ Mew Zealand 1984 1 250 2 ..... ... " . 7
19 . Niwe 1982 ) . . . ... . . . · .. · .. 20 Papua New Guinea 1983 1 508 0 · .. 2 &56 .. . 39
II Philippine •. 1964 53 395 2 995 260 19 869 251 1092
tl Republic of ~rel 1984 40 )78 16 0 1 854 0 5
n S ...... 1984 161 0 0 0 0 0
24 hrt,.pore 1984 ,2540 1) 0 '" ... . .. .25 Solomon IslaM. 1984 269 0 0 0 0 3 .
26 Tollel4u 1984 3 0 · .. 0 · .. 0
21 Tonga 1984 96 0 0 4 0 I
28 1T of the Pacific hlend. 1984 149 0 · .. 451 ... 0
29 Tuvalu 1984 8 0 0 0 0 0
30 Vanuatu 1984 130 0 0 238 2 S
31 Viet Naill 1983 57 642 1 480 ... 92 · .. 18
n Wallis and Futuna 1984 10 ... · .. . " ... ...
lIe.to. .1
0
5
. ..
... o ..
.....
. .. 0
0
29
46
... 111
3
· .. 0
., .
. ..
. .. · ..
~044
0
0
· .' 0
..... 4
1
· .. 0 ,
, , 4
...
.. .

Part t Page 29 30 December 198
WESTERN PACifIC RECIO~ DATA BANK
ON SOCIOECONOMlC AND HEALTH IHD1~TORS
Six. diuases under the WHO Leaflet O~ Chi ldhoo<l LQrlU'ftuni.':.lble Oiseases Cumulative totals of ~ale. and deaths from reports received for the year 19 __
Count"/At'eA !.t itaated Cumulative nu.ber of diaea.e. popuhtion POLIOHYELlT1S 'tIlBERCULOS IS IIBASLES
No. "- Year ('000) Cal •• (ll (2) . 0) (4)
1 AlDerican Sa.04. 1984 JS 0
>2 Au8tralia 1982 15 17b 0
3 Brunei Daru ••• l •• 1984 269 0
• China 198. I OS! 551 I 626
5 Cook hl.nel. 1983 18 0
6 Deaocratic Ka.puchea 19S. 7 149 ... 7 Fiji 1984 700 0
8 French Polynesia 198. 160 a 9 GUAII 1984 Jl9 0
10 lIong Konl 1984 S 364 0
11 Japan 1983 119 259 0
12 Kin.bati 1983 61 0
13 Lao People'. Oem:. Rep. 1984 4 315 13
14 Macao 1984 309 0
IS Malaysia 1984 15 20. 2
16 Nauru 1982 1 0
17 New Caledoni. . 1984 152 0
\8 New Zeahnd 1984 3 250 ... 19 Hit.l~ 1982 3 ... 20 Papua Nev Guinea 1983 3 $08 8
21 Phl.lippines 1984 53 395 140
22 Republic of Korea 1984 .0 578 0
23 Samoa 1984 163 0
24 Sinsap:ore 1984 2 540 2
25 SoLOftlOn hland. 1984 269 0
26 Tokelau 1984 3 0
27 Tonga 1984 96 0
28 T T of the Pacific lalanda 1984 149 0
29 Tuvalu 198. 8 0
.30 Vaauat" 1984 130 0
31 Viet Nu 1983 57 442 23
32 Wallis and Putuna 1984 10 ...
• i .... poTted c •• es b the number of tuberculo.is patients .aged S years and above e confirmed in laboratories d incomplete
Deaths C •• e. O • .ach. ea.ae, (5) ( 6) (7)
0 10 0 0
... \169 63 '"
... 249( 90)a ... 556 50 ... . .. 619 709
0 29 I 4
... ... ... ...
... 165 ... 827
0 6816Gel ... 113
0 5. 2 10.
0 ) 843 .20 678
0 63 789 5 329 7 281
." ... ... 0
0 6 528 35 924
0 671 61 110
0 ... . .. 8 147
0 8 0 1
. . . 112 . .. 19
... 404 5 ...
... Id ... 0
... " 208 . .. 10 023
81 140463 14 812 61 285
0 136372b 3 611 2 246 0 33 4 0
0 2 143 159 2411
0 532 I 238
... 0 . .. 0
0 46 5 5
... S8 ... 0
0 9 0 0
0 189 22 1 634
... 631 ... ~SI
... 14 .. . 4
Oe.th.
0
5
'" 2 906
0
'" ... ...
0
2
47
'" 6
0
3
0
.. .
... 0
. .. I 598
0
0
7
0
'" 0
'" a 0
...
...
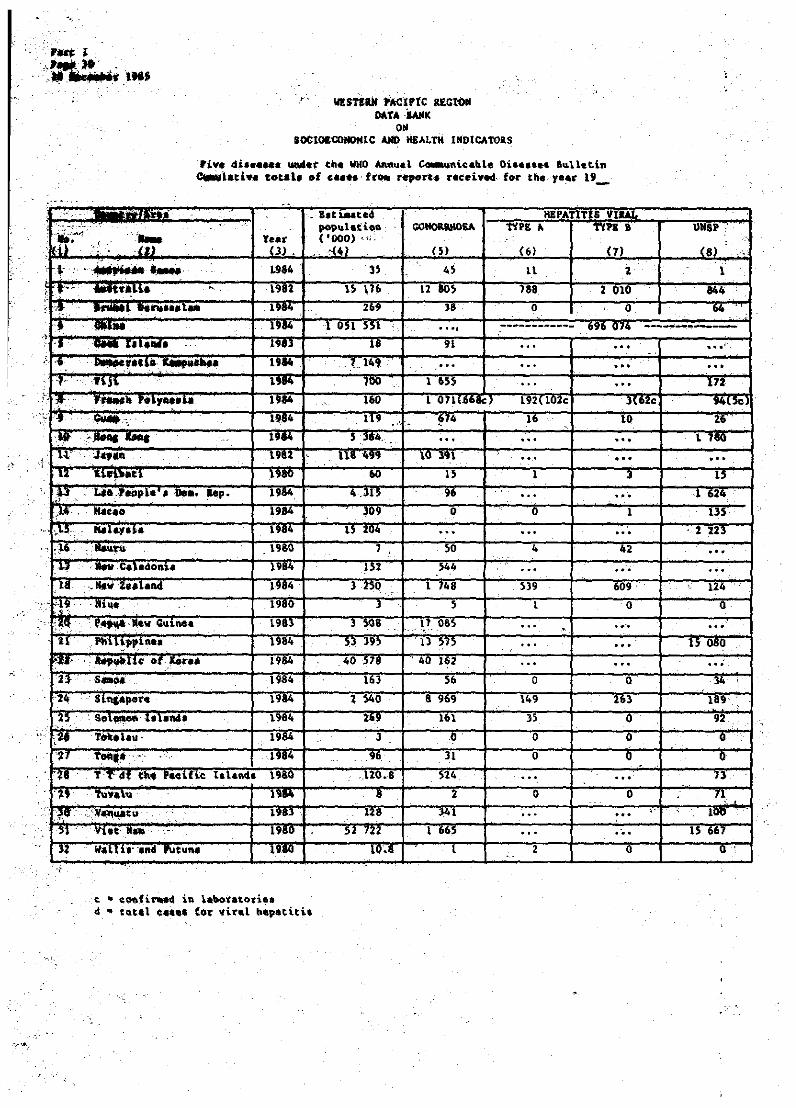
'"
. t, WlST,aII mute Rl!Cl'OtI DATAWK
O~ IOCIO&CO_IC AlII) IfiALTli INDICATORS
'ive di ...... ua4et tne WHO ARau&l ~~ic.ble Oi ...... 1~11eLift ~"l.tiy. tout. of , .... ' fl''' retort .. r.e.i ..... · for the. Y*:l1' 1'_
; ~,.' ,', .
:' .'.- ....... . i .~
'",.~. '~~.,' .•. _- .....
, !,IIi, _,0 ' .. :~~.' :'1,\6_ I~"" . 111·,"-1i
, ,'" J~ .. . ni~.· .
..
,
': ... 1.~ '. .~ .,~" ",&1,.- '
.
11 " ,c'
1'Ho '. of .. x-raa
no' ·5 ....
. :24 "
,2'.··· .. , .....
",~ TblIellu,
'11 T"".,.'" ..
..
1981
19.,.
1984
1'''' 19'"
19"'.
I'''' 191~
,1980
1984
1984
19BO
I ....
1984
1984
.198.
19&4
198.
1984
1984
lala"". 1960
l'U '.
1980
19'.
~ • coofi~ in \.~t.to~ie. d • CQt.t e •••• COf vir.l h.,etiti.
" .
188 2 010
, 0 ',. 0
.091 074 II 91 ... . ..
. l.l~' ... . . . . .. . . . . .. 192(102c 3(62c
119 ,'1" ~14 16 10
5 384... .., .. , ... . ... HI .99 10 19.1 ... ...
110 1) 1 J
~ .• " 96 ,., ... 30.9 0 o 1
U 204 ... .. , .... 1 , 50 -4 Ii2
15%54.4 . .. . 3250 .. 1 748 H9 . 609·
1 ) 10
1 )0' . l'.O'" .... .. , 53 395 II 575 . . ..
.40 578 40 162 ... 163 56 o 0
2 )40 8 91;9 149 263
%i9 Iii 3> 0
3 .0 o 0
, .96 ]1 o 0
. ,lIO.8 )14 ... . .. • 2
, ... . 341 ... ..." )2 122 I 66,
.10.8 I
., .' . ...
.., 15
1 624
US
'2 223
... " 124'
o
." BOSO
92
o , 0
'. 11M,.
\) 661
Q'

WESTERN PAClFIC RECION DATA &AHK
ON SOClOECONOHIC AND HEALTH INDlCATOttS
Part I Page II 30 Dece.ber 1985
Five di •••••• under th. WHO Annual C~unic.bl. Oil •• ' •• Bulletin Cuaulatlve total, of c •••• fro. repo~t. received fo~ the ye.r 19 __
Count Ar •• Elti •• ted . population SYPHILIS TRACHOMA YAWS 110. - Ye.r ( • 000)
W (2) () (4) ( 8) ( 9) (0)
\ Mieri!:an Saao. 1984 35 0 a 0
2 '"",trali. 1982 15 176 3 211 I '" , .runaL D.ru •• al .. 1984 269 7 a a 4 '''''tna 1984 I 051 551 ... . .. " . 5 Cook [alond. 198) 18 ... · .. · .. 0 ~er.tic Kaapuebe. 1984 7 149 · .. ... '" 1 FIji 1984 700 518 73 a
• Yrench Polynesia 1984 160 29H291c) 1 0
9 Cu ... 1984 \19 1 a 0
10 Hone Kon, 1984 5 364 · .. · .. · .. 11 ~.p.n 1982 \18 499 1 659 17 · .. 12 Kiribati 1980 60 1 · .. a 13 Lao People s Dea. Rep. .1984 4 315 63 343 · .. 14 ...-cao 1984 309 a 0 a IS Kf,lay.,a 19014 15 204 · .. ... ... 1. . .auru 1980 7 8 · .. 0
17 II .. Caledonla 19014 152 7\4 · .. · .. 16 "W Zealand 1984 ) 250 77 · .. ... 19 "lue 1980 3 0 ... a 2u ".pu. Nev Guinea 198) 3 508 5 900 · .. · .. 21 Pb1hppine. 1984 53 395 J2 · .. · .. 22 Republic of KOTe. 1984 40 578 7 543 · .. · .. 23 S .. oa 1984 163 I 0 0
24 Sinaapore 1984 2 540 1 29) ... · .. 25 Solomon IIl.nd. 1984 269 0 0 23
26 Tokelau 1984 3 0 0 0
27 Ton,a 1984 96 0 1 0
18 T T of the Pacific Isl.nd. 1980 120.8 a ... a • 9 Tuvalu 1984 8 a 0 a
30 Vanuatu 1983 128 a 5 492b
Jl VutN .. 1980 52 722 616 1 069 808 · .. 32 lI.ili. and Futuna 1980 10.8 2 · .. 0
b very .uch over-diacnoa.d c confiraed in laboratories

rart 1 PIICe 32 30 Dec_ber 1985
WESTERN PACIFIC lEO 10K DATA BAlIK
OK sOCIOtCOKOHIC ANI) NEAL'i'H INDICATORS
rive di •••• e. under the WHO Monthly-CD Not •• Cumulative tot.l. of c •••• and d.athl'fra. report. r.ceived for the year 19 __
Count"' I Area t.tiaated Cumutative nuDber of dile.,ea popolation CHOLERA DFIDHP ENCEPHALITIS
~. ~)" Year ( '000) c •••• Death. C •••• Deatb, Ca, •• hath. (l (2 (3) (4) (5) (6) (7)
1 """,ricen a_o. 1984 3S 0 0 0 0 o . 0
2 _ Au.~~ralia 1982 1$ 116 1 · .. 216 • • 0'
221 . .. 3 8Tunei Deru ... l .. 1984 269 0 ... 0 · .. 0 · .. 4 Q\iaa 1984 Ion 551 1 676 10 0 0 26 259 2 365
5 Cook lalanel, . 1983 18 0 0 0 0 0 0
6 . o.-oc.rat-ic ltaapuch •• 1984 7.149 .. . · .. ... . " '" . .. ., . 7 'iji 1984 700 .. . · .. 190 · .. 1 ., . 8 Fre1JC-h Polyne.ie 1984 160 0 0 453(1 cJ .. . 3 · .. 9 Gt.1.a • . 19 ... 119 0 0 0 0 0 0
10 Ilona Xoal 1984 5 364 1 0 .. . · " .. . ... 11 J.pan 1983 119 259 J5 .. . . .. ... "26 ., . \2 ltJ,ribati " 1980 60 0 () 808 0 0 0
13 Lao Poopl. a Dam. Rep. 19 ... 4 315 0 · .. 22 14 4 0
14 llacu 1984 309 0 0 0 0 0 0
15 Malay.ia 1984 15 204 67 I 702 5 ... 45 8
16 Hauru. . 1980 "7 0 0 538 . .. 0 0
17 "Nfl,V·Caledonia 1980 152 0 0 631 0 0 0
1& Hew 'Z.ealalld 1984 3 250 ... · .. 1 . .. . .. ., . 19 Niue 19110 3 0" 0 618 4 0 0
.
20 P;"pu_ Mev Guinea 1982 3 329 . .. ... . . . · .. . .. . .. 21" Pllllippillea _ 1984 53 395 988 43 2 545 89 .. . ., . 22 Republic of Korea 1984 40 518 0 0 0 0 0 0
23 S.oa 1984 163 0 0 0 0 0 0
24 Sina_pore 1984 2 540 39 8 86 0 17 3 ..
25 SQilOllllon bland. 19.4 269 0 0 0 0 1 1
26 ' Tokelau. 1984 3 0 · .. 0 .. . 0 · .. 27 Ton._ 1984 96 0 0 180 0 0 0
28 T T of tn. Po(ific IIland. 1980 120.8 0 · .. 0 · .. 0 · .. 29 Tuvalu 1980 7 0 0 0 0 0 0
30 V"auacu. 1984 130 0 0 0 0 1 0
JI Vut lam 1982 55 955 57 · .. 31 913 · .. 1890 · .. 32 Wallie and rutuna 1980 10.8 0 0 1 0 . 0 O·
c • confirmed in labor.torie.
...... ,"
:;
"I "

WESTERN PAClnc REGION DAU BAlIK
ON SOCI01!COHOHIC AJIl) IlUI-TH INDICATORS
Five diee •• es und~T the WHO Monthly CO Notes
tart I Page 33 30 Dec.llb.~ 1985
Cu.ulative total. 4f e •• es and death. fTom Teporta reeeived for the yea4 19 __
popul.tion 'iTv.~
MEN: ITIS PIAGII8
l~' ~~ ;;~r ('OOn) Cue. (S)D • .,h. C •• e'~ (6) D.ath. C .... (7) Death.
1 Alaeriean S .. .,. 1984 3S 10 632 0 ) 0 .. . · .. !2 1982 IS 1)6 \ 601 · 39 · .. 0 I)
13 Brunei .1 ... \9114 269 0 :l ~O · .. 0
[4 Chino 1984 1 0)1 »1 I J918Ib' 202 1119912 5935 0 0
IS COok I1lanel. Ull' U ) 101 0 0 0 ., . · .. ,. 1984 ) \49 . . · .. .. . · .. . .. . . 7 Fiji 1984 70D 71 IH · .. -U)"
'" · .. · .. 1 8 'rancb 1984 IOU 9.7> · .. 2)0(1+6<) '" 0 0
iJ Cu ... 1 1984 119 1 60. 0- 15 0 0 0
10 Rona; IoRg 11984 5 31>4 . . . · .. 8+ Ii 0 0 . 11 Japan ·1983 119 2)9 2. 143 · .. 15 · .. · .. · ..
·U 1980 60 38 IU. 3 31 1 0 0 -13 Lo"- roop"" 0... Rep. 1984 4 315 82 -l>~6 ~4Q1; 144 · .. · .
14 Maceo • 1984 309 0 0 1 1 0 0
15 19<14 I) <04 ... ... · .. · .. · .. · .. 1& NAur\l 1980 7 0 0- 0 0 0 0
Tl New 198() 152 2)4 0 2 0 0 0
18 lie" ..... no 1984 3 250 ... · .. 34 3 · .. ... 19 Niue 1980 3 698 0 I I · .. · .. 20 Papua N ... Guin •• , 1982 3 J29 4J 90' · .. · .. · .. ... · .. 21 Phi. 1984 53 395 1416 634 » -935 2 106 676 · .. · .. 22 of I(or •• 1984 40 578 ... ... · .. 0 0
23 Samoo 196' IbJ ; "b. 0 59 6 0 0
24 1984 2 ,.U 11) .... 0 6 ... · .. 0 0
25 193" 269 45 349 -15 19 I 0 0 -26~ • ou.au 1984 J 8) .. . · . 0 · ..
27 Tona· 1984 9" 20 116 0 4 4 0 0
28 T T of the Pacific \980 l>U.' \. Joo ... 19 · .. 0 · .. 29 Tuvalu 1~"U 7 J 876 ~ ~O ~ 8 3 0 0
)0 "unu 1.114 130 o . 0 116 11 0 0
)1 Viet N .. 1982 55 955 362208 · .. 2 403 · .. --Wi
32 ~ IIel H.- and Futuna ' 1980 10.S I 695 0 0 0 0 0
c • confir.eo in labor.tQrie. + • cerebrospin.t aeniugitis and meninaoeoccal infections

.,
.: .-
WlJT&~ PAClllC R£GION I».U _
ow loctoCCOIIOiltc IoIID IltALTII IlIotCATOIlS
. ,ProportiQrl of _ i?,f_"'tl ~.r 1 -1*.' of ale iIbo -bav. b •• n fl.llly l .... l&d 'ilia" '."4.., .. t .. i.,dipbthoda'. po!ioooy.Hti. aDd _ .. 1 •• , 1.83/84,
, P. ., ,.' ,
, ~ "I ,..:~ ,.- • 90,
, I
J ,lit_I 96
" ,lllIi'" , , ...
" _a , ' 95,15· " '. , '" 1 PiJI 98.8
*, "' ... ""ana 9'
" -, ! ,'11 ... "'''''''. , 91
~ , 84.6!f
, ' ./. :, , 11"_ . __ y •• " 111111;1; ~.,. ,;.~ ,"
'l~ ,~ •• ' ," . ,l~ ~ ••• _ ••• , ".J 18 III'.~~, ,
: 11 "' .. 'a--, ..... _~.'R'~ , ... ,19 Rib." . '100
zu rap..- ftw "u.n •• 61
,21 ,PlliI'.rr .. '. ,21, of ~< ... 100
, ,,~l, s_. ".17 24 , 7b
, , "
n III."". , 87
, U, ; " '. ,
27 1: .... p 80 i
:Zat 'tot the h 'r<, 101 __ ' n TU.nu ' , 100
Jfl 68
'31, net .... , )O~10 "
" ,32 1oI«11 ... ...s 100 ." ,. *,,1 - •• i~ lal,ndj 1S1 - out.r i.Sandl
riDiphtlieria- tet,,,,,, ... vboopin& cou," ;.. .. a.h, • ....... ,earl old '~~lphth.~i. - cet.nu. , !I 1912
)!I 1981-84
, '
I)I'T III !'QLlO III
",
,
"
80.4 81.1 , , ,
, ,
84 90,0
' '
'" 5'.0 54.!> .. ; 73.68 " 71.90
7.5 7 •• 1
46 ,44
61.0 62:4 54.25 54.7
84"·" 86
,
16 82
21 18
12.1.
' ',"
24.6
,
,
, '
11.l1
-;.X 78,.1
,
65
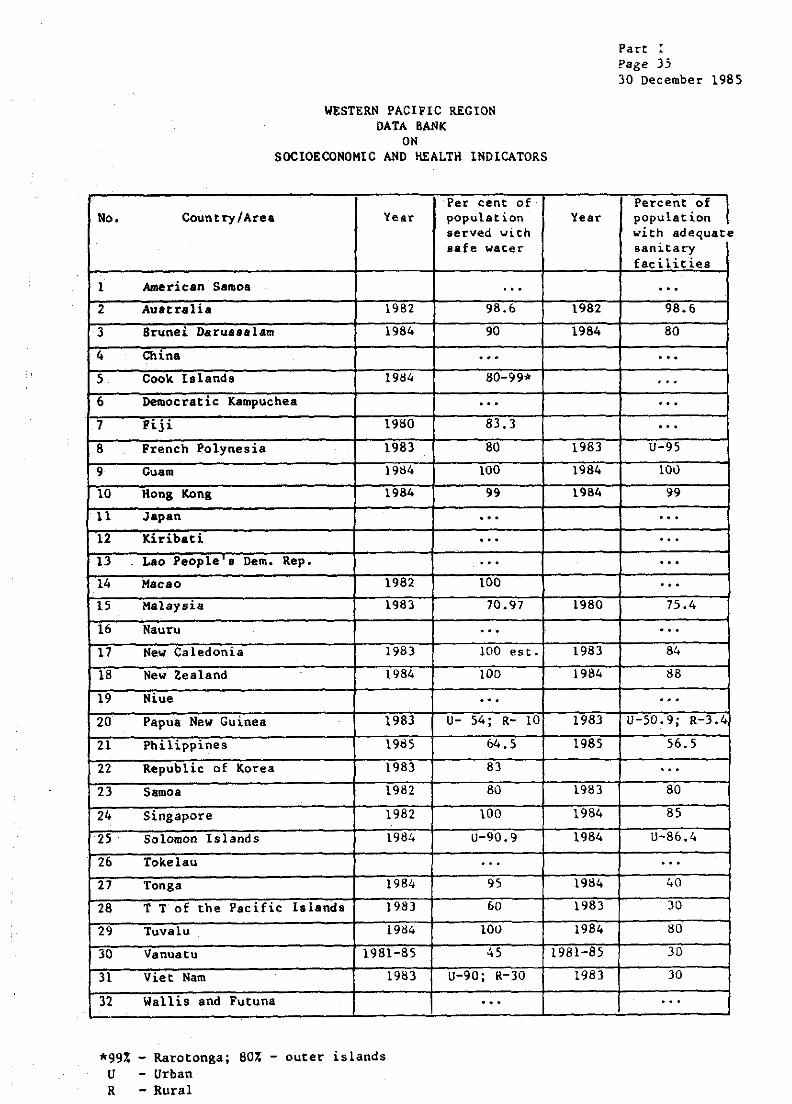
No.
I
2
3
4
5
6
7
8
9
10
11
12
13
14
15
16
11
18
19
20
21
22
23
24
25
26
27
28
29
30
31
32
*991. u R
WESTERN PACIFIC REGION DATA BANK
ON SOCIOECONOMIC AND HEALTH INDICATORS
Per cent of· Coun t ry I Area Year population
served \oIi th safe water
American· Samoa ... Australia 1982 98.6
Brunei Darussalam 1984 90
China · .. Coolt lslands 1984 80-99*
Democratic Kampuchea ... Fiji 19t10 83.3
French Polynesia 1983 80
Guam 1984 lOa
Kong Kong 1984 99
Japan ... Kiribati ... Lao People • Oem. Rep. · .. Macao 1982 lOa
Malaysia 1983 70.97
Nauru · .. New Caledonia 1983 100 est.
New Zealand 1984 100
Niue ... Papua New Guinea 1983 U- 54; R- IO
Philippines 19<>5 64.5
Republic of Korea 1983 83
Samoa 1982 80
Singapore 1982 100
Solomon Islands 1984 U 90.9
Tokelau ... Tonga 1984 95
T T of the Pacific Is lands 198) 60
Tuvalu 1984 100
Vanuatu 1981-85 45
Viet Nam 19!13 U-90; R 30
Wallis and Futuna '"
- Rarotonga; 801. - outer islands - Urban - Rural
Year
1982
1984
1983
1984
1984
1980
1983
1984
1983
1985
1983
1984
1984
1984
1983
1984
1981-85
1983
Part I Page 35 30 December 1985
Percent of I population with adequate sanitary facilities
... 98.6
80
· .. · .. . .. ...
U-95
100
99
.. . · .. · .. ... 75.4
· .. 84
88
... U 50.9; R 3.4
56.5
... 80
85
U-86.4
.. . 40
)0
80
30
30
...

.. ".
~,
.~ .
"Y, • J .
It
5 ..
"6
7
"~" .
9
WESTERN PACIFIC REGION DATA 8ANl<
ON SOCIOlCOllOMIC AND HEALTH INDlCATOB.S
.',-" Percent of low birth weight I1Q1Jn try I Are a infants ( $ 2499 2raJIIs)
'tear Data
.,b.1l lilllllloa 1982 2.6
·~'''r.na 1919 5.8
lIJu"ej: l)jIrIJU.l_ 1984 10
lna ... . . ~~ hiands 1984 2.0
'l)Qocrat{c j(lIIIIpuchea ... -'Vi '.J 1979 13.9
. TnnFI! Polyneaia 1984 . ,
7.3
filii!!! 1983 7.6
Maternal mortalit, rate
'tear Data
••• .
. 1982. 0.10
1984 0.46 . . ..
1980-84 1
. .. 1982 0.032
... 1983 0.314
10 .HoIIl !Will 1984 Kaltii-3.6; Fema 1E!-4. 7 1984 0.06
Lt· 'japan 1984 5.4 1983 0.204
n Kl.y:iDati 1979 18 ... "
-13 ~"l1eo, ltii • 8 Dem. Rep. 1984 30-40 .1984 0.02
14 ~Fao 1984 6.6 1982 0.4
15 Hala"i. 1982 10.0 1982 0,50*
16 .· .. -' .. "ru . . " .. .. . 11 !lew Cd.eton ... 1984 7.2 (est.) 1984 1.6
I , 18 !ltiw -Z .. land 1982 ).2 1983 1.6 19 '. l'liue .. , ...
;20 Papua NeW Guinea 1979. . 25.0 . .. 21 . PIlth~pine8 1983 15.4 1984 0.8
22 Republic of Korea 1981 9.2 1985 0.34
23 Sallloa . 1983 2.4 1983 0.4
24 SUaapore 1982 8.0 1983 0.2
25 . ,Solomoll Island, . 1984 0.1 . ,. ... 26 Toli:ebu 1973-74 4.0-6.8 1983 0
21 '.- Tonaa 1984 <2.0 ... . 28 T T of the Pacift.c blanda 1979-81 6.0-1.4 1982 1.57
29 'rl,lvalu 1983 3.0 1983 2.5
30 Vanuatu 1983 4.66 1983 1.07
31 V1et Nam 1984 25 19B3 1.1
32 Wallis and Futuna ... ... *Peninlular Malaysia only
,
-

Part II 'ase 1 30 Detember 1985
WESTERN PACIFIC &EGlON DATA ~ ON SOCIOECO_IC AlII) I!JW.TH INDICATORS
IndicatorC.) for: Year Data Source of Deta
1. Area (in 1000 .q. ta.) 1981 0.20 12/83
z. , 'OUO) '""" n LJ/8S
J. ADDual growtn rote ,., 1984 l.~ U/~5
4. or - 1... than 1) yea .. · .. - .,. ye.r. · ..
,. uroa. \., I~80 45.7 03179
6. Rate of of IX per aDD ... ) 1984 1.92
1. Crll4t birth rate 'per lUOO 1~1I<o 19.2
8. crude d •• th ra •• 'per looo ..... ~ ••• U.." "1:14 4.' 9. Lite et outn - :rot01 (;::~,'! 1918-1982
~~:! - Hale y.ara> - Fe .. le Cyear.) 15.5
~O. Infant rate (per 1000 Uve 1984 ).~
Ill •. Total rate IWOOIen 1)-49 year., '" lIZ. for the year zuuu
"al , ·UUU} lU<JU ,. Lne at outn ... 10 ;' ...
- V_Ie " ... Annual growth rate, (11 1.05
Crude birth rate lper 1000 ... Crude death rate (per 1000 ... Kate or " per ann ... ) ...
In. PeT marke t C~O .. at pT1ce. IQlPI(USil ...
114. Kate ot growtn or per capita GHP '<J ... 115
• fr ... lOro .. DoM.nc :' (GDP)
_. at cOnatant factor coat (Xl '"
~6. Lly .ctlve pop in .ector
- _er ,. "0' I' OUO) ... -. 1D •• , IXI
111. DaUy per caplta supply ... '.' ,s. · .. 110. 0811y per caplta protOln aupply ,gr_} ... ~9. ....un ,. rate - Total '"
- Male ... - Fe .. le ...
~O. Health
- l\aouut ... - Per cap.ta .
- Aa " or total oUCIget
Source 13/85: Government'. Report on &valuatina Progre •• in laplementina the StTategie. for Health Por All by tbe Year 2000, 1985
03/79.1; World Population. hend. and Pro.pects by Country 1950-2000: S~ry Report of the 1978 ~.e.'~Dt, UN, 1979
13/85
11/85
1J1G)
ll/85
Uf05
03179.1
03179.1
03/79: Urban, Rural and Cicy Population, 1950-2000, ~ A.aea.ed in 1978, UN, 1979 06/84: Info~tion furni.bed by ... rican Sa.o. Health Planning and Oevelo~nt Agency,
16 Noveoober 1984 06/85:
12/83: 12/84:
14/80:
Cove~nt'. aeply to Cu.ulative Totals of C.'e! and neaths fra. 18 Selected Die.a.ee for the Yeara 1983-84 and up to July 1985 Country Health IDfo~tion Profile (CHIP) revi.ed by Government, 1982 and 1983 Govern.eot leapon.e. to World Kealth Stati.tica Annual Que.tiono.ire on Kealth Manpower, 1984 South Pacific Epide.iolo&ical and Health Info~tion Se~vice, Annual Report 1980

Part II rage 2 )0 Dee_e~ 1985
WESTE .. PACIFIC REGIO. DAtA &Aft[ ON SOCIOBCOilllllIC /\lID IlULTR IJlDlCATOIS
~--......... = •• -.=-------.----.. --~.-. r-"'-ladieator(.> for: AHDlCAlI SAIIOA Year Data
•• t .. _ ...... --_.-. .-........... - ..... h. Health _power _or ht.io pel'
10000 PhY'iciana 1984 25 1.2 Medical a •• iatantl 1984 4 1.1 Prof ••• ional Mur.iua/Midvif.1'J PereODDel 1984 18 5.1
~2. I.e.dina caua •• of iDfectlou, ell ....... IIOl'bidity No. ot lace per C .... 100 000
Gonorrhoea 1982 62 182 Inf_Atile ••• troenteriti., ho.pitalb .. 1982 34 19.3 Lepro'7, .11 fo~ 1982 Il 38 Inf.ctioul hep«titi. 1982 10 30 -po 1982 8 24 TUberculoli. t all for.a 1982 " 11 " ••• l.e 1982 2 6 Pilari •• ie, pOliti •• c.'e, 1982 I 3
~ .. Teo leadiaa cau ••• of _rtal1ty 1"" code How of kate per Death' 100000
Oheaae of the b.al't 390-398. 402. 404-429 1982 ... 81 Aceideotl and .dver •• efflct. BCClO-E949 1982 '" 55.2 Malip81lt neapl .... 14<1-208 1982 ... 46.2 Chronic obatructive pul.oaary di ••••• ~90-49i 1982 ... 28.3 Cer.brava.cular di ••••• 430-43. 1982 ... 23.9 Diab.til .. 11itu, 250 1982 ... 16.4 CertaiB eonditiOQa ariliaa 76<1-77? 1982 ... 16.4 ill tho periaatal period PaOU8Oni. aDd iafluea •• 4110--487 1982 ... 11.9 Coca.ait.l .aa.ali •• 760-759 1982 ... n.9 Hoaiciu 11960-1978 1982 ... 8.9
'4. ~ •••• end d .. tb._fO~ 01" db._ und.r th. WIlo-.I'1 C •••• neatha
Dipl1theri. 1984 0 0 Pertu •• ia 1984 0 0 'tetanu. 1984 0 0 Poliallyeliti. 1984 0 0 Tuberculo.iI 1984 10 0 "e •• 1.1 1984 0 0
5. c.... for diee.,.. uader the WHO Anaul CD Bulletin C •• e.
Goaorrhou 1984 45 Hep.atiti. viral - Typ4t A 1984 11
- Type I 1984 2 - 11115P 1984 1
Sypbilli. 1984 0 Tracha.a 1984 0 y .... 1984 0
6. Caeet and death. for I1X d1 •• a.e. ....der the WHO Monthly CD Note. Ca.e. D.atha
~oler. 1984 0 0 Denaue fevIII!!'r/DHF 1984 0 0 Eneepb.liti. 1984 0 0 Influenza 1984 10 632 0 Keninaitia 1984 7 0 Plague . 1984 ... ...
~7. Proportlou of lutanta under ooe year or a,III!! Who have beea fully i.auaized .&aiaat tuberculoai., dipbtheri •• polio.yeliti. aDd __ a' 1 •• 1'84 90
BCC DPrIlI Polio 111 Meal1e.
128 • Per ceDt of populAtion a.ned vith •• ft v.tel' ... 9. Per cent of popul.tlOft with .... ~te •• uUary
facilities ... ~O. Per ceot of low birth _.,ht .araot. , "" '47> , ..... , b .. , 2 ••
~l. M.tt;rnal .ortah.ty rate .. ,
Source of Data
06/84
13/85
13/85
06/85
06/85
06/85
13/85
1"0'

Part rr Pale J 30 'December 19:8S
WESTE~ PACIFIC RECIOR DATA BANK ON SOCIOECONOHIC AHJ) HLUTH 1I1DlCATOaS
1"'------ ------ - . .. ---.... -.... ~--........ ----..... --------... ---.... -Indicato't'(a) for~ AllStJALIA YeaT Data
~---.-------.. -----....... -.... .. -... _- ....... _ ...... _ ....... 1. Are. (iD 1000 aq .... ) 1984 ) 682.3
z. E ........ t ... pop,,'at,oD ,'UWI 1'" 15 379.
3. Annual population growth rate (Z) 1982-1983 1.3
4. Pereenta,. of popul.t~oo - lea. than 15 yean, 1982 24.7
- 6S+ ,. •• ra 1982 9.9
5. Urban popu1.<1on (Z) 1981 85.8·
o. bt. of natur.l locrea •• of POPUlatl0Q (I: per .nn ..... ) 1983 0.8S
7. Crud. \)1.rt'h r.t. 'per luuu popul.uoDJ 19.1 13.8
6. Crude d.eth rate (pe< 1000 popul.ti .... l 1962 7.6
9. Lifo ..,..t.nC7 .t birth - Tot.1 ~7··ra! - 11&10 (y •• ra) 1982 71 - re .. Ie (years) 1982 78
10. Inbnt acrt.hty rate lper 1000 hve birtha) 1982 10.3
1. iotAI fertility rate (women 1.5-.1,9 yeara> 1975-1982 1.9
12. Soc~o-econODle ladle_torI for the year 2000
Eatl .. ted pOpulatlon. I 'OOO) 2000 17 762
Life expectancy at birth - Hale lye ... 1 1995-2000 71.3
- Fe.ale (years) 1995-2000 78.1
Annual population growth rate, IX) 1995-2000 0.93
Crude birth r.te Ipor 1000 populat,ol11 1995-2000 15.1
Crude death rate (per 1000 pOpulation) 1995-2000 8.7
Rate of natural lncre.ae (% per annum) 1995-2000 0.64
13. Per Caplta Cro •• National Product (GNP) )982-1983 at .. rket ,rice. (UsS) 11 951 or
(A') 10 522
!11t • IlOte or growtb or per oopH8 "NY \ OJ I"U- h.J I.T
15. Pereentale Croaa Doaeatic: Product (CDP) derived from .. Qufacturins at eonstant facto~ eoat (%) ...
1 •• r;conomlcaUy achve pop In prl"ry •• ctor
- NWllber in agriCulture (' 000) 1981 379
- Percent in .griculture (%1 1981 6.0
17. Daily per capita calorIe supply (calorlea) 1981-1982 exceeds 2 500
18. naily per capita protein supply (&t'_J 1981-1962 99.0
19. Adult hteracy rate - Total - Hale 1981 88 - 'eaale 1961 82
20. Rea1tb budget/expend,ture
- Aaount \t.$.) 1'.1-1,"2 11 1 ••
- Per capita \t.$ I 1981-1982 744
- ". • of total budget 1981-1982 7 .6
Offici.1 Exchange Rate: 1 US$ • Ai 0.88 (1982)
Source 13/8). Goveru.ent's Report on Monitoring Proar ••• in I.pleseoting the Strategies for HFAlZOOO. 1983
03/79.1: World Populatioa Trende and Pro~pect8 by Country 19~O-20QO;
06184
10/82: 12183:
Su.aary Aeport of the 1978 ~.e .. ment. UN. 1979 lufoTa&tioa furni.he4 by the Co.-onwe.lth Depart.ent of Health. Australi •• 21 J"ly 1984 1982 !SCAP Population Pat. Sheet Country Health lafor.ation Profile (CHIP) ~e~i.~d by the Government. 1983
Source of Data f-----06/84
00/84
06/84
10/82
06/84
06/84
06/84
10/82
06/84
06/84 06/84
06184
06/84
03179.1
03f79.1
03/79.1
03179.1
03/79.1
03179.1
03179.1
06/84
06/84
06/84
06/84
06/84
06184
13183 13/83
06184
06184
06184

•• rt II ..... 4 ~ D....... 1985
W!$T!lN PACtFtC alCIO" DATA IAKK 0" SOCIOICO_IC AlII) IlJALTH IIIDICATOas
~ ... ~.~~~ .. ~ ............ -.-.. ---~ ....... -..... --.. ----........ -------......... -.. _ ...... In4 •• ,tor(,> for. AUSTRALIA Y •• r Data
~~ ..... -.. ~ .............. -.............. -........ • ......................... _ I" ' .' ., ....... . ', _ .. - <,~ . _or lado per bt. fl'~H~ uA...,...r
10 000 J'fJydcian. 19ft 21 128 t8.2 ~ic.l •• ,iataat' 1981 ... 'r~~e,.i~.i NUT.ina/Midwifery Peraonn.l 19f1 139434 4l.4
z. r~ ·1.~~~!l8 Uu ... Of aorb1d1.ty lCD code Mo. of Rate ,.~ C'.e_ 100 000
C«'Orrhoea 098 1982 12 805 4 Tot,l .y-philb 090-091 1982 1 211 1 S.l~ell. iufectiOftI 00) 1982 I 866 2 Tubereuloai., all fora. 010-018 1982 I 363 9 Viral b.petitb 010 1912 I 046 , H*~tici • • (Setu.)* 010.3 1982 725 5 Q l,ver 083.0 1982 616 4 Ghrdi •• t.- 001.1 1982 548 4 Halaria 084 1982 437 3 Sh ice 11 oa i. (Shilell. infection.·) 004 1982 344 2
IU. Ten leading cauae. of ~rt.llty leO oode Mo. of aate per Death. 100 000
Acute _70cerdial interction 410 1982 21 161 153 C_rebrov •• cul.~ di ••••• 430-4l8 1982 U 977 92 Other ilcha .. ic b.art dia •••• 41\-414 1982 9 184 61 M_li,nant neopla •• of trachea. bl'ORChul 162 1982 60)1 3~
and luna Other for... of h •• rt di ••••• 41.5, 416, 420-429 1982 5337 40 Hotor vehie1. t~.ffic accident. 810-819 1982 l 364 22 HaliaaaQit IIMpl ... 01 c-olca 153 1982 2 708 18 Ironcbicb, _ph,. .... ad •• th .. 49tJ.493 1982 2 3~9 16 Kali~nt neapl ••• ot {e .. l. br ••• e 114 1982 2 137 \J Pn8UllOft i. 480-486 1982 1 995 14 Athero.eleroail 440 1982 1 653 11
4. Cuea aDd 4~~~ for aia due •• e. under tbe vao-EPI Cau. ne.th,
Dipbt'het'i. 1982 1 -Pertu .. i, 1982 196 3 Tetan", 1982 11 5 Po lioaye li ti. 1982 - ... Tuberculoa La 1982 1 169 63 Hea.le. 1982 ... 5
S. O •• e. for d1 ...... UDder the wtIO Annual CD .ull.tin C,lIee
Gonorrhoea 1982 12 805 Hap.dtb .h'.l - Typ. A 1982 788
- Typ. I 1982 2 010 - DN5P 1982 844
Syphilli. 1982 3 211 Tr.tba-ll 1982 I Y.wa 1982 ...
6. eaee. abd death. for 81X d1 •••••• \lbdel" the WHO Monthly CD Bot •• C •• ea De.tha
o.oler. 1982 1 ... Dengue fever/DHF 1982 216 ... Enceph,ilitia 1982 221 ... Influence 1982 I 601 ... Henilllitie 1982 39 ... PI·SU- 1982 - -
27. Proporhon <!' 1~.nu UDder ODe ". ... of .,_ ""0 bave been fully t..uailed •• aiD'~ tuberculoei., diphtheri., poli~eliti. and .... le.
BCe DPT In Polio lIt He •• lea
". Per cant of pOpul.UOII •• rved wHh •• t .. v.ter 1982 98.6
9. Per cenc of populacion with .deq~te .an1tary facilitie. 1982 98.6
po. Per cent ot low bu'dl vei&ht infan .. \ ,Z,9'8r_) 1979 5~~ .
1'1. Maternal -art.lity rate 1932 0.10
.... __ ... _ .. -SourC:411 of Oat. . ....... _ .... -
06/84 .
06/84
06/84
06/84
06/84
06/84
13/83
13/83
13/83
06/84

Part II Page 5 30 Deeeaber 1985
WESTERII PACIFIC REGION DATA IIAIIJ( ON SOCIOBCOMOliIC AND HEALTH INDICATORS
.) for: Source of
t. Are. (in tOoo .q. ~.) 1984 5.77
69 70
at urket price. (usS) (8$)
1984 7 676* or 16 427
- Kale - Feaale
Official Exchange Rate: US, 1.00 • R$ 2.14 (1984) * Per capita CDP
Source 13/85,
03/79.1' 03/79 06/8S,
07/81, 12/81,
Government'. Report on Evalu.ting Progress in Impleaenting the Strategies for Health For All by the Year 2000, 1985 S~ry Report of the 1918 A •• e.sment. UN, 1979 PAD Production Yearbook 1979 Govera.ent'. Reply to Cumulative Totals of C •• es and Deaths from 18 Selected Diseases for the Yean 1983-84 and up to July 1985 1981 World Bank Atl •• Government Responses to WHSA Questionnaire on Caules of Infectious and Para.itic Disease. and 00 Number of Deatha by Cause Coveroaent'. Reply to EPI Health Information Sy.te. Questionnaire. 1982 Country Health Infor.ation Profile (CnIP) revised by Governaent. 1982 and 1983 Country Health Inform.tioa Profile (CHIP) revised by Government, 1984
12/83
13/8S
12/82.2, 12/83, 12/84, 14/83, 1983 World Population Data Sheet, Population Reference Bureau Inc., Washington. DC

Part II Pale 6 ]0 Dec_e. 198~
.,UTlD '",CIFIC UGIDti DATA lWII Oft SOCIOlCOllOlUC AltD IIlALTlI IllDlCAlOU
..... -- ------.-----•••••. -- --- r--•• - ...... ----.-••• Inclicator(a) for: BRUllll DAIlUSSAUIt Y.ar Deta
Data ---_ .. _-_ .. _ . 1-------.-----_ .. _ .. _ ... _ .. _---_ .. _- ---I. ~.lth aenpower -.. Ratio per 10 000
Pb,a ic i ... 1982 107 5.3 ~dieal ••• i.t.ata 1982 94 4.7 Prof ••• toaal Mur.iGI/Ki4wifery PeraOOD.l 1981 553 27.6
~1. Leadina cau •• , of .orbldlty 110. of Rat. pe.r c. ••• 100 000
OIrdlov •• cul.r di •••••• 1984 . . . ... ~.cro.Dt.riti. 1984 . " ... Upper re.pir.tory iDfectio~. 1984 ... ...
~3. lA.dlna ceu •• , ot .,rtality Mo. of Rate pel' Deaths 100 000
C8rdiovalcular dia.a ••• 1984 ... ... Road traffic accident. 1984 ... ...
4. Case. and de.tbs for aix diaeaa •• under the WBO-IPI ea.e. Deatb.
Dipbtberia 1984 0 ... Pert ..... i. 1984 0 ... Tetaa. .... 1984 0 ... Poli(8)'.11ti. 1984 0 ... Tubercu.lolil 1984 249 (90)* ... He ... l •• 1984 556 ...
I'. ca •••. for cU~ ••••• under the WHO AIlnuel Q) lulletin ea •• ,
CollOrrhoea 1984 38 Rep.-eith viral - Type A 1984 0
- Type B 1984 0 - UHSP 1984 64
S1Pbillh 1984 7 Tracboea 1984 Q
Ya". 1984 0
F6. caaes and d.aths for 11X di.ea,e. UDder the IiHD KoDt~11 CD Note. ease,
Qlolera 1984 0 Denaue fever/oar 1984 0 E.ncephalitis 1984 0 Influesa U84 0 Meaiqiti. 1984 3 Pl·sue 1984 0
z7. Proportion of infanta under ooe year of age who nave been fully i..unized a,ain.t tuberculoai., diphtheria polia.yeliti. and .ea.les 1984 96
BCC ,
OPT III Polio 111 Mea.les
8. Pe< cent of population .erved with aafe vater 1984 90
9. Per cent of population with adequate .anitary 1984 80 facilities
O. Per cent of low blrt.b vei,ht infanta ( ~2499 araMI> 1984 10
1. Mat.ro.al .. rtality rate 1984 0.46
. _ .......... -Source of
.. _-_ ..... 13/85
13/85
13/85
13/85
06185
06/8$
13/85
13/85
13{85
13/85
13{85

WEST£&H PACIfIC REGION DATA BANK ON SOClo&OONOMlC AND IlEALTK INDICATORS
Part 11 Page 7 30 l)eci!:llber' 1985
~-~ .. ------...... --.... --.. -... -.-.-.. -.-.-.---.-...... -..... _-- ... --_ ........ __ ...... . ..... --.. -.-Ind.ic,ator(l) for'. CHIMA Year Data Source of Data
~ .... ---................ ~ ....... -...... -... -.... -.. -... _-111_--- -_.--_ ........... ---.. ---............ 1. Ar.a (in 1000 .q. lao.) 198) 9 600
2. Eatimated population ( 000) 1984 1 024 950
3. Annual population grovtb rate (1) 1979-83 1.3
4. Percentage of population - less tnan IS y~aC8 1962 32.7
- 65+ ,eara 1982 5.6
5. Urban populatIon II) 1983 23.5
6. Rate of natural iucre •• e of population (% per annulAr- 198) 1.54.
7. crude bIrth rate lper 1000 populatioQ) 198) 18.62
8. Crude clnth rate (pe< 1000 populatioiii) 198) 7.08
9. Life expectancy at blrtb - Total (ye ... ) 1984 67.9 - Kale <,ear.) · .. - 'eu1e (,.au) ...
O. Iufant -.ore.hty rate (per 1000 hve bIrth.) I ... 34.7
1. Total fertihty rate (VOGIen 15-49 yeara) 1982 2.6
2. Socio-ecoao.ic lndieatorl for the year 2000
Eat~ted pOpulation, ("000) 2000 I 255 656
Life expectaucy at bir'th - 11&1_ (yean) 1995-2000 67.9
- Feaale (year'; 1995-2000 72.6
Annual populat10u ,rowth rate, (1) 1995-2000 0.97
Crude birth. rate lper' 1000 population) 1995-2000 17.4
Crude deatb rate (per 1000 population) 1995-2000 7.7
Rate of natural increaae (% per an.mlla) 1995-2000 0.97
3. Per Capiea Gro.s National Product (GNP) at market price. (US,) 1980 290
4. Rate of grovtn of per capita GNP (1) 197()-79 2.8
5. Percentage Gro •• Co.estlc Product (COP) der'ived from manufacturing at constant factor cost (X) 1980 34.0
6. Iconcm1c.l1y activa pop in pr1"ry .ector
- RuOIber in .... c"lt"re ( 000) 1980 26' .79
- Percent 1n .,t1cultur.-CU 1980 )9.8
7. Daily per capita calorie supply (calories) 1981 2 517
8. I>&ily per capit. proteiD .upply (g'''') 1981 65
9. Adult literacy rate - Total · .. - Kale - Fetaale
O. Health budget/expenditure
- AJaOunt · .. - Per capita · .. - As % of total bwSget · ..
Source 13/85: Gover~eDt's Report on Iv.lusting Progress in laple.eDting the Strate,iea for Health Por All by the Year 2000. 1985
03/79.1:
03/80: 03/83:
03/84: 06/84:
06184.1: 06/85:
07181: 10/82: 14/82 :
World Population Trend. and Prospect. b, Country 19S0-2000; Suamary IePOr't of tbe 1978 Aaleslment. UN, 1919 rAD Production Yearbook 1980 A Sector weview: The Health Sector in China, Volu.e 11: Statistical Annexe. (Report So. 4664-CKA), The World aank. 20 AUgust 1983 1984 United Nationl ~orld Population Chart Statistieal Yearbook of China. State Statiatical Bureau, people'. Republic Of China, December 1984 Seai-Annual Report of WRC/Beijing for the period Harch to August 1985 Government'. kep1y to Owaulative Totals of eases and Deaths from 18 Selected nilea.e. for the Year' 1983-84 and up to July 1985 1981 WOr'ld Bank AtL •• 1982 8SCAP Population Oata Sheet ~ey Indicators of Developina Ke.her Countries of ADB, April 1982
0~/84
13/85
06184
10/82
10/82
06/84
06184
06{84
06/84
l3185
13{85
10182
03184
03/79.1
0)179.1
03/79.1
03/79.1
03/79.1
03/79.1
07/81
07/81
14/82
03/80
03{80
03/83
03/83

,
..
Part 11 Pace 8 30 Deceaber 198~
IlESTUIf PACIFIC RECION DATA ..... ON SOCIOEOOIlOlCIC AND UEALTlI INDICATORS
.................................... . ........... ,..,.~ -- r-.......................... ~ ........ ~ •••• Indicator<,> for: ~ Y •• r Data ............................. ~ ............... ~~ ~~-. ... - .... _._._._. •••
1. Hedth INftpower Mtdlber
Phyaiciatla 1984 923 766" . Medicd ••• beaut. 1984 457 690 Profel.lonal Murlta,/Midvifery PcrlOGftel 1984 695 991
~z. Ten Ieadina cauee. of :lftl:ect:101J. due •• e. morbi4ity Mo-. or C ••••
Influenza 1984 3 918 16~
Dyuntery 1984 3 363 983 Malaria 1984 903 802 Viral He"acid. 1984 696 074 Hea.1 •• 1984 619 709 \rft\oo'Pinl ~ouah 1984 215 965 Ipid .. ic c.~ebro-epiQ.1 .. oin.itia 1984 119 912 Typhoid end paratyphoid fever 1984 99 988 K •• .arrha.ic ' .. er 1984 90 936 Lepto.pirotlie 1984 37 076
n. Kortaht, 1'1'''- tell ~nl.ctiou. dis ••••• Mo. of Death.
Epid.~ic cer.bro-.pinAI .. ningLti. 1984 5935 HA~rrh .. ic fever 1984 2 925 He •• le. 1984 2 906 Epide.ic encephalitie B 1984 2 365 Viral hepatith 1984 2 050 Lepto.piro.h 1984 145 Diphthet'ia 1984 312 Whooping coulh 1984 333 Typhoid end pa"atyphoid fever 1984 252 Influenz. 1984 202
4. l; •••• and de.t~~_for lix diu •••• under the WHO-EPI Ca.e.
Diphtherie 1984 3 418 Penu •• ie' 1984 215 965 Tetanul 19.84 · .. Po liollll)'e Ii t ia 1984 I 626 Tuberculoaia 1984 · .. " ••• 1 ... 1984 619 709
1'" • C •••• for du ••••• under the ·WHO Annual CD »ulletin Cuee
Gonorrhoea 1984 · .. Hepatitie viral - Type A ) 1984 )
- Type B ) 1984 ) 696 074 - UNSP ) 1984 )
Syphillie 1984 · .. Ttach..- 1984 ., . Ya". 1984 · ..
"'". C.ses alld deatbt for ,1K dia ••• ea under the I WHO Monthly CD Notes C.aell
Cholera 1984 1 616 OF/DHF 1984 0 £ncephelitie 1984 26 259 In flue ....... 1984 3 918 165 Meninaiti• 1984 119 912 PI.gue 1984 0
21. Proportlon ~f in~&nt8 under one y •• r of a,e ~o ~.y. been fully i-.uQi •• d again.c tubercula.i •• diphtbe~ia, poliomyelitis .~d .e.,le.
Bee · .. DI'TIII Polio III Hea.1.e8
pa. Per cent of popu;lat:um lerved wl.th •• fe "ate'l' ., . 1"9. Per cent of popubtion with adequate •• R1t.ry
facUities ... O. Per cent of low birth vetght lnfann , ,,2499 , ..... } · .. 1. Maternal .rt.uty rate · ..
* Includu doctor. of Tr.dUloDal ChiDe •• Jled.f.c::ine. doctor. _of ..... tem Hedicine t
.enior doctor, of Intelrated Chine.e He4icine 'and w..tero Medicine.
Ratio per 10 000
8.9 4.4 6.7
hCe per 100 00
378.2 324.7
87.2 67.2 59.8 20.8 1\.6 9.6 8.8 3.6
i.&ce per 100000 0.6 0.3 0.3 0.2 0.2 0.1 0.03 0.03 0.02 0.02
n •• th. 312 333 ...
50 ... 2 906
Des.the 10 0
2 365 202
5 935 0
Source of. Data .. .............. 06/84.1
06/84.1
,
06/84.1
06/85
06/85
06/85
i

WEsttlJl PACIFIC RECI0N DATA B.uat: ON SOCIO!COlOOllIC AHJ) lIEALTH INDICATORS
Part II Pa.e 9 30 Deceaber 1985
~ ..... -----.. --.................. --.... --.... --.. -.. -.. -....••......... -..... --........ r-••• _ ••• -_.-Indicatod,) for. COOl< ISUNDS Year Data Source of D&t4 ........................ --.................. --_ ......... .._ ...... - --...... -....•...•. _ ... _ ... --
1. Area (in 1000 .q. lui. ) 1981 0.24 12/83
I Z. E.t1mated populat1on {'OOO) 1983 18 13185
3. Annual populatioa Irovth rate (%) 1982 1.6 13/85
4. Percent.ge of populat1.on - le •• than 15 years 1982 49.8 10/82
- 6~+ year. 1982 4.0 10(82
5. Urban populatl0n ll) 1980 29.9 03(79
6. Rate of natural increa.e of populotioo II per annua) 1983 1.57 13/85
,. Crude bl.rth rate \per lOW populatLOnJ 1983 22.5 13/85
8. Crude death rate (per 1000 popuhtionJ 1963 6.83 UfOS
9. L1.fe ezpectancy at buth - Total (,eu.) 1981 · .. 13(85 - Male (yean) 64 - Female (Yf:ars' 70
O. Infant mortality rate (per 1000 live births) 1983 16.4 13/85
1. Total fert111ty rate (women 15-49 y.ars) 1982 4.2 10(82
2. Socia-economic indicators for the year 2000
Est1mated populat10D, "UUUJ 2000 37 03(79.1
LIfe expectaDcy at bIrth - Kale (y •• ro) · .. - F ... 1e <,earo) · ..
Annual population growth ~ate, (tl 1995-2000 1.10 03179.1
Crude blrth rate (per 1000 populotl0n) · .. Crude death rate (per 1000 population) · .. hte or natural Increase tl per annum) ...
13. Per CapIta Gro.1 Hotional Product (GIIP) at: market price .. (US$) 1984 980 or 13/85
(MZS) 2 DOO
4. Rate of arowth of per cap1to GNP ll) . .. U. percanta •• Gro •• DomeltLc Product \cal' J d.enved
from manufacturing at coa.taat factor tOlt eZ) 1978 5.1 14/82
16. Econo.lcal1y active pop Ln prl .. ry sector
- Number 1n agru::ulture l' 000) · .. - Percent in agriculture (%) · ..
17. Dally per capHa calorn supply (calorLes) ... 18. DolBy per capita protoin lupply (gr ... ) · .. 19. Adult h.teracy rate .. Total 1983 100 13/85
- Hale · .. - Female
O. Health budget/expenditure
- Amount (USS) 1982 2 838 625 12/83
- Per capita lUSS) 1982 1 164.78 12/83
- AI • Ot tot., Duo,e, 198Z- 13.9 12/83
Source 13/85: Govern.ent·. Report Ob Evaluating Progre •• in Iaple.enting the Seracecie. for Health for All by the 'teu 2000. 1985.
03/79.1:
OJ/79: 06/84 ; 10/82; 12/80; 12/83: 14/82 :
World Population Trend. and Pro_pectl by Country 1950-2000; Su..ary Report of the 1978 A.lelsment, UN, 1979 Urban, Rural and City Population. 1950-2000, a. ~ses&ed in 1978, UN~ 1979 Information furnished by the Ministry of Health, Cook Islands, 12 Noveaber 1984 1982 ESCAP Population Data Sheet Government Reports on the Number of Cases of CD Country Health InforDation Profile (CHIP) revised by Covernaent, 1982 and 1983 Key Indicators of Deyelo~ing Heaber Countries of ADS, April 1982

Part IJ P~8e 10 30J)~c.""er 1985
lCSTllIII PACltlC aiel"" DATA 8AIQt all SOCIOICOllOlfl~ 4IID lIJ4I.l'II IllllICATOas
r···~-"···-"--·"--··""· .~".IN!'."".~.",." •• " •• I11,.. ......... --....... - ....... ___ ~._ ..........
Indi.ator(.l forI COO! ISL+!b8 • taar Data Source of Dat.· ~ ........ -P!!I~II!'~-'" _ .- ...... - =;=-.................. 10---- .................... -pl. liealtll ~"GItt.~ . Rwober .... tio peT
10 000 Physicia11l 1983 18 10.0 06/84 . "-dic.t ••• i.t~t. 1983 4 2.2
--'-Prpfe~.ioc.l .ur.iQgJ~dvifery Per,oonel 1983 69 38.3
2. "on 1.,.<110$ .,,, ••• of _rb1dlty No. of Rate per Ca.e. 100 000
Ip,ju'ti!l' and •• t~u'llal .caul.' 1983 220 1 239 06/84 and Di,ealea of tbe T •• pi~.tory .ya~e. 1983 208 1 171 \3/85 Dit,~.e, of th. 4i, •• tive .,.t .. 1983 10. 597 Dia.sl!I's of the .kin aDd .~cut.neou. ti •• ues 1983 88 495 .~ise •• e. of the circql.tory .y.t~ 1983 85 478 Di.e.~e .• of the ,.nito-urinary .,..t .. 19S3 83 467 Infectiou8 .nd p~T •• i~ic; db ..... 19113 60 338 Di.ea8 •• of the au.cular-.kelet.l 8Y'C" 1983 49 276 Syapta.a and ill-d.fioed conditiOD' 1983 47 26' Diee ••• s of the Qervou •• y.te. 1983 46 259
23. r •• leadin8 .a\!fe. of ioortaUty Ho. at a .. te per neach. 100 000
Dia ••••• of ¢ireulatory .yaCe. 1983 42 237 06/84 and Di.eae •• of tbe re.piratory ay.te. 1983 20 113 13/85 Neopla •• 1983 13 73 Endocrine and .-Cabolie di ...... 1983 10 56 S,.,t~ and ill-defined ,conditioa. 1983 10 56 Cert.in coadttlon. orilinatina io peripetal· ,.rio4 1983 5 28 Infectiou. ~ "f.aitic di ...... 1983 4 23 Inuri.. and pO~'OQiua 1983 4 23 Di •••••• of the di, •• tiv. '7.t .. 1983 3 17 Di •••••• of th, n.rvoua eyet •• 1983 2 11
4. Ca.e. and d •• th. for .ix due .... under the WHO-IPI C ..... Deathe
Diphtheria 1983 0 0 06/84 and Pertullia 1983 0 a 13/85 Tetanu. 1983 0 0 Polioayeliti. 1983 0 0 Tuberculoeis 1983 29 1 Mea.le. 1983 4 0
f5. Cases fOT di •••••• under the WIlO AnnU4l CD Bulletin C.e.e
Gonorrho.a 1983 91 06/84 Hepatith viral - Typo A 1983 · ..
- Type a 1983 · .. - UIISP 1983 · ..
Syphilli. 1983 · .. Trech-<*'! 1983 ... Ya ... 1983 · ..
~6. C.ses and death' for SIX dI8eac •• under the WHO Konthly CD Notea Caee. Deaths
O\ol.r. 1983 - - 06/84 Dengue f.ver/PHF 1983 - -Encephalitia 1983 - -Influeo&a 1983 5 101 -Meningiti. 1983 - -Plague 1983 · .. '"
27. . Proportion of infanu under C)Qe y •• r of. tS' who have been fully i-.uniaed _,ainat tubercula.ia, diphtheTi •• poli~elitia and •••• 1 ••
BCG )
Dn III ) 1984 95 ( .. 1. i~land) 13/85
Polio III 1 75 (outer uland,) Heasle. )
8. Per cent of populatiOl1 5erved with •• te w.~.r 1984 BO-"~99* 13/85
12 9• Per cent of facilities
popULation with adeqt.lllte "'U.t4;,ty ...
flO. Per cent of low birth We1ght lnfanu l iii 24,9 Cr_1 1984 2 13/85
I. M .. ternal mortality r.ue 1980-"" I 13/'-5
*99% - Rarotonga: 80% - Outer i.land.

WESTERN PACIFIC REGION DATA BANK ON SOCIOICOllOllIC AND H£ALTH INDICATORS
.----------_._--_._----.-_ ...... _ ... -•..•••....• .. -.... _-Indicator(.> for. DEMOCRATIC K.\KPUC1!U Yflar Dflt& ._--.--_ ....... _ .... _._ ...... --._ ..... --._. __ ._._._.-. ---.--_._-. _ ... -._ ......
1. Area (in 1000 oq. ta.) 1981 181.04
2. E.n .. tea pop"latl.on, I'UW} I •• , 6 700
, '. AnnU81 population arowth rate, I" 10.2 2 ••
i ". Percentaa_ or pOputCt1Oft - Ie •• than 1;, year. 10.2 JJ.l
- e.,+ yeau ,..2 2.> ,. uroan poPULat.on ,., ... u D.D
6. Rate of n.tvral increa.e of populau.oa U per annum) 1982 2.59
1. Crude bath rate I per 1000 popuIauon} 1 •• 2 4>.>
•• C~ude death rate \per 1000 populatlon} ho, 19 ••
•• LIte: expectancy at Dlrtn - Total \year.~
- Hale (years> 1982 42 - 'emale (yean) 1982 45
O. Infant aortality rate (per 1000 live birth.) 1982 160
1. Total fertility rate (vomen 15-49 ye .. l) 1982 5.1
~2. SOCio-eCOAo.1C ladlcatorl for the yec< 2000
E ..... t.d populat1on. (' 000) 2000 13 403
Lire expectancy at birth - Hale Iyeanl 1995-2000 )6.6
- , ... 1. (ye.r,) 1995-2000 60.1
Annual population growth rote, Il) 1995-2000 1.86
Crud.e bl,rtb rate (per 1000 populanon) 1995-2000 28.5
Crude death rate lper 1000 populatiQn) 1995-2000 9.9
Rate of natural l,nCrea&e (1 pel" aMUII) 1995-2000 1.86
I'" Per Cap1ta Gro .. Hatlonal Product "GNP} at market prices CUSS> ...
114• Rate of growth of per cap.t. GNr ,., ... ~5. Percentage C't'o.s Dotaestl.C Product (GDP) den.ved
from aanufaeturing at constant factor cost (%) ... 16. Ec~oa1cally aetlye pop 1n pr1aary sector
- Number In asrlculture l"QUO) 1 •• 0 2 522
- Percent ln asrieulture l~' 1980 74.0
~/. Dally per caplta_C&lOr1e supply, \Cal0rlea) 1917-1979 1 767
B. O.ily per capita protein supply (gra.uJ 1917-1979 40.1
9. Adult 11teracy rate - Total ... - Hale - Female
O. aealth budget/expenditure
- AlIount ... - Per capite ... - A. , of total budget ...
Source 03/79.1: World Population trend. and Pro_peets by Country 1950-2000: Summary Report of the 1978 Assesement, UN, 1979 FAD Production Yearbook 1979 FAD Production Yearbook 1980 Official Netional Publication 1982 !SCAP Population Dat. Sheet World Health Stetistics Annual, 1976
Part 11 Pa,. 1l 30 De« ... r 1985
-_._._---Source of Dat. . .................
06/7S
,0182
10{82
10/82
10'.2 , .. , .. 10(82
lu,82
10,.2
10/82 10/82
10182
10{82
03/19.1
0>,7>.1
03179.1
03{79.1
03179.1
03179.1
03/79.1
0".0
03/00
03{79
03179
03/79: 03/80: 06/75: 10/B2: 1l/76: 14/83: 198) World Population Data Sheet. Population keference Bureau Inc .• Washington, DC
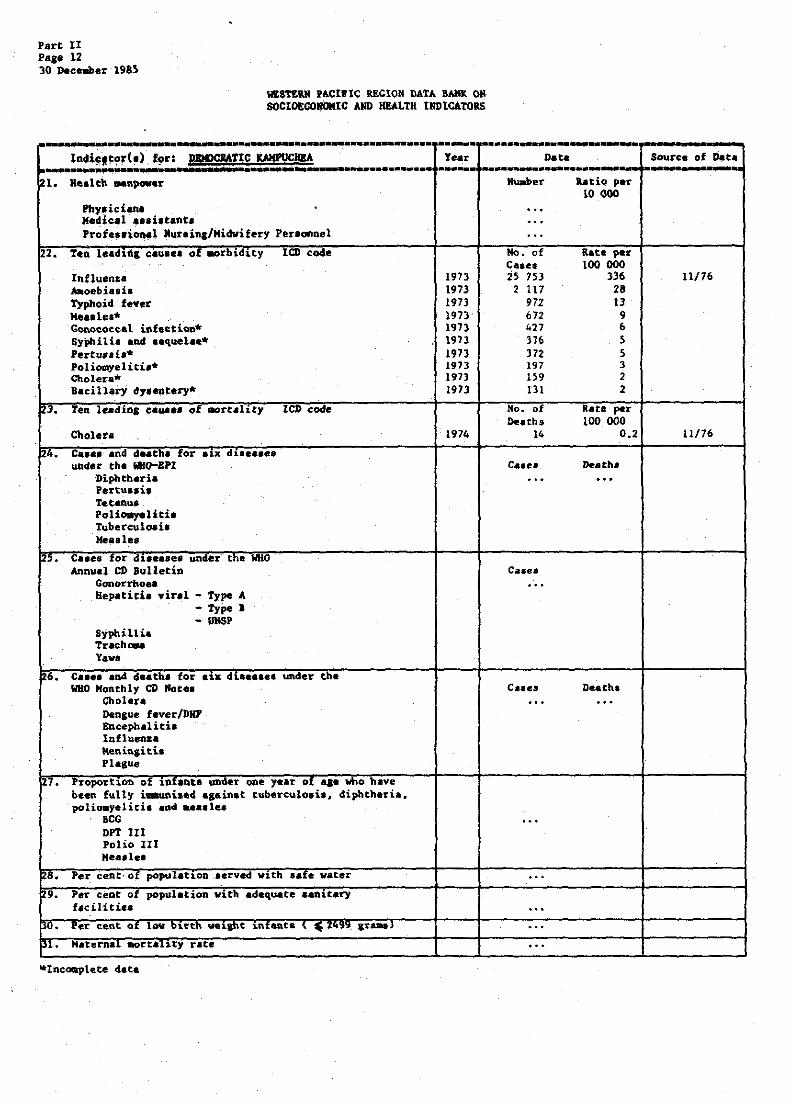
Part II Pale 12 30 ))e •• mher 1985
Heal tb MnpoHr
Phy.ician. Medical ••• i,tant,
WESTEaM P~CIWIC RECION D~T~ RANK ON SOCIOlCO_IC AIID KULTIi tNDtaToRS
Year
Pr~fel'iOfttl Mut'ina/Midwifery Per.annel
.... d.r the Io1I<rEPI -Diphtheria ,ertu.,i. Tetao.u .. PoliOilyelitb Tuberculo .. b He ... le.
1973 1973 1973 1973 1973 1913 1973 1913 1973 1913
1974
C •• es is 153
2 117 972 672 427 376 372 197 159 iJl
Deaths 14
C ... e.
Annual CD Bulletin Case. Gonorrhoea Hep.tidl viral - Type A
- Type I
syphillu T'E'ac.hoaa Yaw.
WHO Monthly CD Hote. Choler.
- UHSP
Dengue fever IDU Eucephal itia Influenza Me.ninaiti. Plague
""e been fully i.-uni •• d ... in.t tuberculo,i., diphtheria. polia.yeliti •• dd •••• 1e.
IICG DPT tIl Polio III Mea.lel
l4Iciliti ••
'*IncOlRplete elate
Data
btio per ~O 000
100 000 336
28 13
9 6 S 5 3 2 2
per 100 000
0.2
hath.
Death,
Source of Dat.
11/76

Part 11 Page 13 30 Deeembe~ 1985
WESTERN PACIFIC REGION DATA 8AKl OM 50CI0£<:O_IC AND HULt1! INDICATORS
~ ....... --.. -.-....................... -... -........... -.. --_._ ... _- ._---_._._._ ... _ ...... Indicator(.) for: I'lJI Ye.r nata
~ ....................... -... ---.-..... -.-.-... --.... -.... ..... _ .. . .... _._._ ... -_ .. _._ .. I. Aroe. (in 1000 .q. ka.l 1981 18.27
2. ~.t1 .. teG pOpul.t1on, '"UINJ ,."" 7uu
J. Annual popul.t1on ."owth r.te l'J " .. lo.
1 4 • Percent •• e af population - Ie.. tn,.n .I) ye.r. ... 2 36.3
- 6). y.ar. 1'.2 J.J
,. un.a pOpul.tlOo IX} "00 l1.U
i 6. Rat. of n.tural iDc ..... of population II per ann ... I 19"" 2.4
1. Crud. butn r ... lp .. lUUU popuuuon) 19"" 29.8
1 B. Cnad.. d .. tb rate l.per 1000 popul'ahOftJ I .... , .. 1 9 • Lite expectancy at I:J.lrth - Total {yeara! 107. . ..
- Mal. (year.) 60.7 - Fea.1e (year.) 63.9
o. Infant mortality r.te (per 1000 live b1rth.J 1984 22.5
1. Tocal fertll1ty r.~e (vomen 15-49 year.) 1982 ).4*.
12. Socio-econo.ic indieator. for the year 2000
E.t1 .. ted pOP~l.t10n, " Ouu) 2000 764
Life expectancy .t birth - H.le {y .... , 1995-2000 71..
- '.lINh ~ye.rs' 1995-2000 76.4
Annual populatioa I~ovth rate, tIl 109>-2000 0." CTud. buth rate (lJer 1000 populatLoa.) 1995-2000 17.9
Crude d •• th race (per 1000 popuhtlOftJ 1995-200u 4.8
aate or natural 1nc:rea.e !"I per annua) IY',-'UW I.Jl
11. Per Capita Gra. ••• clonal Product lCHP} at .. rkec price. (US$> 1980 1 850
114 • bt. of .rovtb of p.r c.pita eNP 1%/ 1970-1979 3.0
1>. Perc-.nc ..... GeM. ~.t1c Product: uour} aerlYed fr~ .anufacturina at con.tant factor coat (1) 1980 11.6
'0. ~oao.1C.'~Y .~t~v. pop lft pCl. .. ry •• ctor
- Nu.oer 1ft *.rlculture ""UUU} 1 •• u 83
- Percent in &,riculture (~) 1980 40.1
17. n.tly per eap1ta caloc\e supply. \calOt'1ea} h7. 2 577
18. Daily pel' capita protein 81.1pp1y ~gr ... ) 197. 56.8
19. Adult literacy rate - Total 1976 79 .. Male 84 - ., .... \IIt 74
o. Health bud •• t/expenditur.
- Amount <FS) 1983 <9 04' ".
- Per cap1ta <n) 196J 42.90
- AI • 0' totar ~u.,.t ...
-----._.-----_ .. Source of Data .. ..... _._ ....
12183
lJ/05
U/.,
10/82
10/.2
14/OJ
IJ/.'
13/85
u/.,
I".,
13/85
IO/B2
03179.1
03179.1
03179.1
OJ17 •• 1
03179.1
03179.1
UJ/ 79.1
!JIB5
07/.1
14/82
03/80
03/'0
13/85
13/'5
13/85
12'0'
12/85
Official ExchaOSe rate: US$ 1.00 - F$ 0.7980 (1980) *Average of Fijian and Indian
Source 13/85:
03/79.1:
03/80: 06185:
07181: 10/82: 12/82:
12/83: 12/85:
14/82: 14/83 :
Coveraaent'. Report on Evaluating Progre •• in lap1e.enting the Strategies for Health fo<r All by the Ve.r 2000~ 1985. World Population Trends and Prospects by Cauntry 1950-2000: $u ... ry Report of the 1918 ~.e.s~nt~ UN, 1979 FAD Production Yearbook 1980 Cavero.ent'. Reply to Cu.u1ati~e Total. of Cas •• and Deaths from 18 Selected Dileasea for the Years 1983-84 and up to July 1985 1981 World Bank Atla. 1982 ESCAP Population Data Sheet Covern.ent Response. to ~orld Health St.tistie. Questionnaire on Health Hanpover Country He.lth Info~tion Profile (CRIP) revi.ed by Covernment. 1983 1985 Country Reviev for the Heeting of the Country Oper.tiona Com.ittee, WHO, Henil., 11-») Hoveaber 198) Key Indic.tor. of »~v~Jopin. ~.b~r Countriea of ADI, April 1982 1983 World Popul,.tion Oat£ Sheet, Popul.tion aefer~n~e Sure au Inc., Wa.hintton, DC

Part n Pas_ 14 30 Du_r UU
Io£S'l'E1UI PACIFIC lEGION DATA aAIOt 08 SOCIO£CO_IC .IlIIl IlEALTIl INDICATORS
......... --... _.-----_ ..... _-IQdicator(.) for' fiJI Y.ar ._-----...... --.. .. ................................
l. Hulth ... up_~
Phya;'ciaaa 1980 Medical a.ai'tant. 1980 Prof ••• ional Nur.i .. /Midwif.ry Pel'lonnel 1980
fl2. I.e.ding cau •• a or: .orb141ty
Respiratory di ...... 1983 Circulatory di.eae. 1983 Injury and poi'oniua 1983 Gehito-urinary di •••••• 1983 Infective and par •• itie dh ... e. 1983
u. rea le:adllll cau ... or .ort"lltr
Circulatory di ...... 1983 Veopl ... 1983 Respiratory di ...... 1983 Infective ead par .. itic di •••••• 1983 Diaeative fli ...... 1983
p'4. Ca.e. and dutna ror .u due •••• urul.r the WIIO-EPI
Diphtheria 19810 Pertu •• b 1984 Tet&llua 19810 POlioayeliti.. 19810 TulMrc::ulOi it: 1984 Mea_I.e 19810
5. Case. for die.a... ~der the WHO Ann".1 CD Bulletin
Conorrhoea 1984 Hepatitis viral - Type A 19810
- Type. 1984 - UNSP 19810
SJP/IUli. 19810 Trac:h-.. 1984 y ..... . 19810
20. C •••• • ft~ _ c!e,!~~ for "Ill' di •• a.e. under the WHO Mooch ly CD IIot ••
Cholera 19810 D ...... fever/DIIF 19810 Eneeph.lith 1984 Intluea. 1984 Melliqiti. 1984 Plasue 19810
27. Proportion of .nranU u .... er one yur of aC. ':'''0 hove been fully i..uAised a.aiDet tub~rculQ.i •• diphtheria, poliOllYelieb &Ad .... lee
BCG \983 DPT IIX 1983 Polio IU 1983 He •• 1 .. 1983
28. ter c.nt otpopulauOQ •• rved with .af. ",.ter 1980 ... Per cent of population vath Idequate ,anIta", f.cUitie.
30. Per cent of I .... birth vei.ht infonta ( ,2499 sro .. ) 1979
31. Katernal wortalit1 'f.t. 1982
.............. _-----... eft • "II ..... -nat. Source of Data -_ ... _-_._- --.-------
Nu.ber Ratio per 10 000
2810 4.5 12/82 34 0.5
1 2810 20.5
No. of Rate per Ca.es 100 001) · .. · .. 13/85 · .. · .. · .. · .. · .. · .. · .. · .. No. of Rate per 'De.th. 100 000 · .. · .. 13/85 · .. · .. · .. · .. · .. · .. · .. · ..
c..e. neatb. 0 06/85 5 I 0
165 827
Cases 1 655 06/85 · .. · .. 172 518
73 0
Casee Death. · .. ., . 06/85 190 · ..
1 · .. 71 153 · ..
197 · .. · .. · ..
98.8 13/85 80.4 81.1 24.6
83.3 13/85
. .. 13.9 13/85
0.032 13185

Part 11 Pale 15 30 De •• mber 1985
WESTERN PACIFIC REGION DATA 8ANK ON SOCIOECONOMIC AND HEALTH INDICATORS
Indic.tor(,) for~ .~ Year
1. Area (in 1000 sq. km.l 1981
2. ( '0001 1983
3. Annual &<lNth rate. (ll 11 917-1983
-. of - 1... ch.n U yUrt 198J
--- 65+ y •• " 19U"
). Urban :ioa \XI 1980
6. Root. of of populetion (1 per enn"",1 198J
1. Crude birth rate (per 1000 popullttonl 198]
•• Crud. d.ach rate <per 1000 :ionl 1983
~. ~1te aC bucn - Total ~Y"U} - Male (year.,)
. - 'e.-Ie (ye-'ra)
10. Infant 'F race (per 1000 live 1983
ll. Total .•• '"7 rate I_a 15-49 ye ... )
.u. for - the year 2000
Es' C'OOOY 2000
Life 'r' at birth - lIale 'y"'" - F .... l. 'F
Annual growch race, (X)
Crud. birth race <per 1000
Crud •• eath raco (per 1000
..... of U per .nn ... )
113. ::r ... ~:~~a p~~~:: (£111) (VU) 1982 (franca CFP)
114. Race ot Irowcn af per capit. eNP (II 1970-1977
11), ~ro" """"'otic \GOP} frOlll ~ ... u. at cOtlstatlt factor cost (x)
I'b. lly active pop in , • , uctor
- Hu"er in _&. «01)/))
- ia (%)
117. Ddly per capita supply ,) 1982
118. Daily per capita supply (grau) 1982
119. Adult _, raU - Total 1983 . - Male
- Fe: .. l~
~Q. Health ... au;;c ... - Per capita <US$} 19IT
- ... ~ ot cotal """get
Det.
4.00
16'
>.UJ
38
0.3
".U
'.J 30.2
).5
... 65.S 67.8
22.9
.. , 247
...
... 1.]1
...
...
4 700 0'1'
848 000
1..
...
.. 3 747
118.9'
~~~:;~:~w 91f85183
... 198
... Offieial Exch.nge rate: US$l~OO· franc. cr. 180.42~53 *Speak/Read/Write Preuch
Source 13/85:
03/79.1:
Goveru.ent's Report on Evaluatin& Progre •• in I.ple.enting Strategiea Sealth for All by the Year 2000, 19850. Wo~ld Population Trends and Prospects by Country 1950-2000. Suamary Report of the 1978 A$se.8.ent. UN, 1979 Govern.eDt~' Reply to Cuaul.tive Total, of C.ae. and Deaths fro. 18 Selected Diseaae. for the Years 1983-84 and up to July 1985 1979 World Bank Atl •• WHO Se.inar on Fin.neina Health Develo~Dt, June 1982 Country Health Inforaation Profile (CHIP) revi.ed by Coverneent, 1983 Country Health Info~[ioD Profile (CaIP) reviaed by Covernaeat, 1985
Source of o.ta
12/83
13/85
U/O)
12/85
13/85
14/83
1.>/"
Il/8S
IJ/8}
Il18}
13185
03{79.1
UJ/I~.I
13/85
07179
!JIB5
lJ/~>
UfO'
12[82
06/85 :
olf79: 12/82, 12/83: 12185 : 14/80: 14/83:
South Pacific £pideaiolo&ical end He.lth Infor.ation Service. Annual Report 1980 1983 World Population Data Sheet, Population Reference Bureau IDc.~ W.ahington, DC
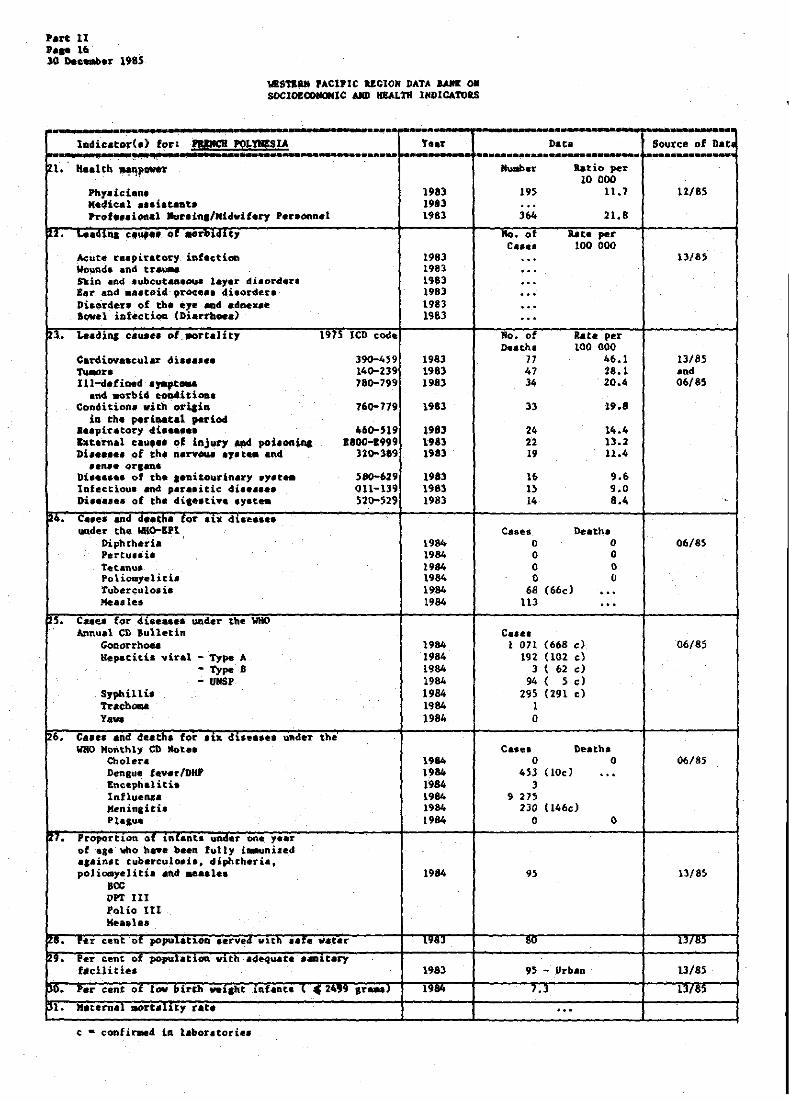
Plrt n P ... 16' 30 o.oODbo. 1985
II£STUII 'Acnlc UCION DATA un 011 SOCIO£_lC _ 1lEAL1'II INDICATORS
T ... -f.> for: ~ Year
~I. ' 1I •• lth "'liP"""
PhYlicianl 1983 M.4ical ••• iataat. 1983 Prof."ional IUrlin./Midwifery Plrldftn.t 1983
1'" c • .., .. or
Acute re.piratory iftflctioa 1983 WOQQda and trau.a 198] Skin and .ubcutaaloul layer dilord.rl 1983 lar and aA.toid-prGee •• di,orders 1983 Disorders of the eye aad adnexa. 1983 lowel iQf~ctiou (Diarrhoea) 19l1'
~:l. ca.,.". -. 1975 ICD code
Cardiov •• cular di •••••• :~.
1983 Tu.,rl 1983 Jlt-.lefi.ed l,.apt_ / . .,..,.. 1983
Ind .arbi' coD4itioal Condition. with oriala / ..... '" 1983
1ft tho pori ... al period a •• pir.to~y .t ...... un-<lo 1983 hurnol •••••• 0' IftjlW)l ..,.t po100.'''' 19&3 Di' ••••• Qf thl n.rv~ •• ~.t •• and 1983
.en •• Qrl_. Di •••••• of tb ••• Di~oQrin.ry .y,t ..
~il-i;9 1983
lafectiou. and p.ra.itic di •••••• 1983 Di •••••• of the diCe.tiv. .,..t .. ,,'rn; 1983
,... ~:::::: :::1 fo~ al¥
Diphtheri. 1984 Pertu.d. 1984 t.t.nu. 1984 Po liolllyelith 1984 Tuberculo.i. 1984 Meulu 1984
~,5. ~:1 f~ B.n.tin under tb. WHO
Gonorrhoea 1984 Hepatitia "irat - 1')pe A 1984
- type B 1984 - UIISP 1984
Syphilli. 1984 Tr.c:hou 1984 y .... 1984
l.. ~.~':~~l~.:':"~:~ .1K .od .. the
Cholera 1984 .Dengue f,ftr Iv.., 1984 Enc:eph.1iti. 1984 Influenl' 1984 Heninaitb 1984 PI.cue 1984
". -Y', 0' ....... one ,r;:~ of •• e who h .. e been f~11y i.-un .,.in.t tuberculo.i., diphtheri •• poJiomyeliti. and .a •• 1 •• 1984
JCC OPT III Polio III ' Mea.le.
n. • .. cene ox oerve4 WltO uxe .... or .... lO. ;:~i~~~.:' wH. '/
1983
P'" Yer .e.t ot , .... Olren w.",t , 4 , .. ,. Ir_' l~'"
pl. rat.
Data Source of Dae..
_.r Ilatio per 10000
195 1I.? 12/85 · .. 364 21.8
110 of bt. per Ca.e. 100 000 · .. 1l/85 · .. · .. ...
· .. · .. No, of bte po< neath, 100 000
71 46.1 13/85 47 28.1 and :l4 20.4 06/85
33 19.8
24 14.4 22 13.2 19 11.4
16 9.6 U 9.0 14 8.4 -
eaaea Death. 0 0 06/85 0 0 0 0 0 0
68 (66.) ... Il] ...
Cue. I on (668 c) 06/85
192 (l02 c) J ( 62 .J
94 ( SC) 295 (291 oj
1 0
e •• e. De.th. 0 0 06/85
4l) f JOel ... J
9 21S 230 (l46e)
0 0
95 13/85
"" 13185
9S - Urban 13/85
7.J 13(8'
...

Part II Pa,e 17 3D Dec-.ber 1965
WESTEIMPACIFIC RECION DATA BAMk OM SOCIOECO_IC AIQ) HEALTH INDICATORS
,.------.. __ .. _-_._._-_ ......... _ ..... _ ....... --.... --......... -- .. _--...... _--Indicator(s> for~ 'Year Data Source of Oat. ~. ........................................................ •....• _.- . ........ --_ ......... 1----------
I. Area (in 1000 aq. ka.) 1981 0.55
•• ,;. haatea: populatlOD. I·OUII' ,.0' IU
,. Annual populat10G &~ovth ~ate (X) 1> ..... 1>0' '.2 4. PeTcentaae of populatlOQ - Ie •• than I:) ye.n 1.82 39.6
- b)+ year. h •• 1.1
,. uro .... populanOl1 14' "'U ., .. •• Rate of natural lDcreue of populatlOQ u per annual 1.83 <.~
7. Crude b1Tth rate (per 1000 populatlon) 1983 28.12
8. Crude death rate (per 1000 populationJ 198J 4.08
9. Li fe expectancy at blrtb - Total \year.? . .. - Hale (y.an) 1983 69.6 - 'emal. (year.) 14.5
10. Infant mortality rate (per 1000 live birth,) 1983 9.1
11. Total feTt11l.t,. rate \wc.eo l:>-'l'.f' yean) · .. 12. Socio-ecooo.ic indicator. for the year 2000
Eat1 .. ted POpul.tlOD, l· UUUJ 2uuu .lJ
Life expectancy at birth - Male Cy.ar., · .. - F ... 1. ly.aro, · ..
Annual population ,rowth rate. CI) 1995-2000 2.58
Crude b1rth rate 'per IUIIU popu!anon) · .. Crude death rate (per 1000 populatlOD) · .. Rate ot uture, lncre.ae U per annUWI} · ..
13. Per Capita c~o •• National Product (GNP) at market price. (US$) 1983 4 000
'1~. bte ot ,rOWeD Df per capita CHP u) I.",· 1., >.1
15. Perc.enta,e Gro •• no.e.tlC Product {COP} derived fro. manufacturing at constant factor co.t (X) · ..
16. Economically .ctlve pop in pr1mary aector
- Nuaber in agriculture l OOOJ ... - Percent in agriculture (I) · ..
17. Daily per cap1t. calorie supply (calorie.) 1983 1 905
16. Daily per capita protein 8upply ~,ra .. } 198J 80
19. Adult Ilteracy rate - Total 1 •• J 96.4 - Male 96.4 - Fe .. le 96.5
20. Rea1th budget/expenditure
- Amount IUSS, 1983 11 270 406
- Per c.apita IUSS) 198. 100
- A •• or tot .. bUGget 100. 7 ••
Source 13/85: Covernaent'. Report on Evaluatins Progre •• in I.ple.enting the Strateaiea for Health For All by the Year 2000, 1985
()3/19.1:
Ol/79 : 06/85 :
07/79: 10/82: 12/8l:
World ~opulation TrenG' and Pro.pect. by Country 1950-2000: Su..ary Report of the 1978 A.ae.sment, UN, 1979 Urb_o. Rural and City Population, 1950-2000, as Aaaea.ed in 1978, UN, 1919 Govera.ent'. Reply to Cumulative Totals of Casel and Deaths from 18 Selected Dise •• e. for the Year'-' 1983-84 and up to July 1985 1979 World Bank Atla. 1982 ESCAP Population Data Sheet Country Health Infor..tiDD Profile (CHIP) reviled by Government, 1983
13/65
U/O'
IJIO'
10/82
lO/S2
UJ/I'
IJ/O)
Il/85
11/B5
13/85
Il/85
0>119.1
Ol/79.1
13/85
Uff f.
13/85
13/85
13/85
12/8l
12/8,
12/0J
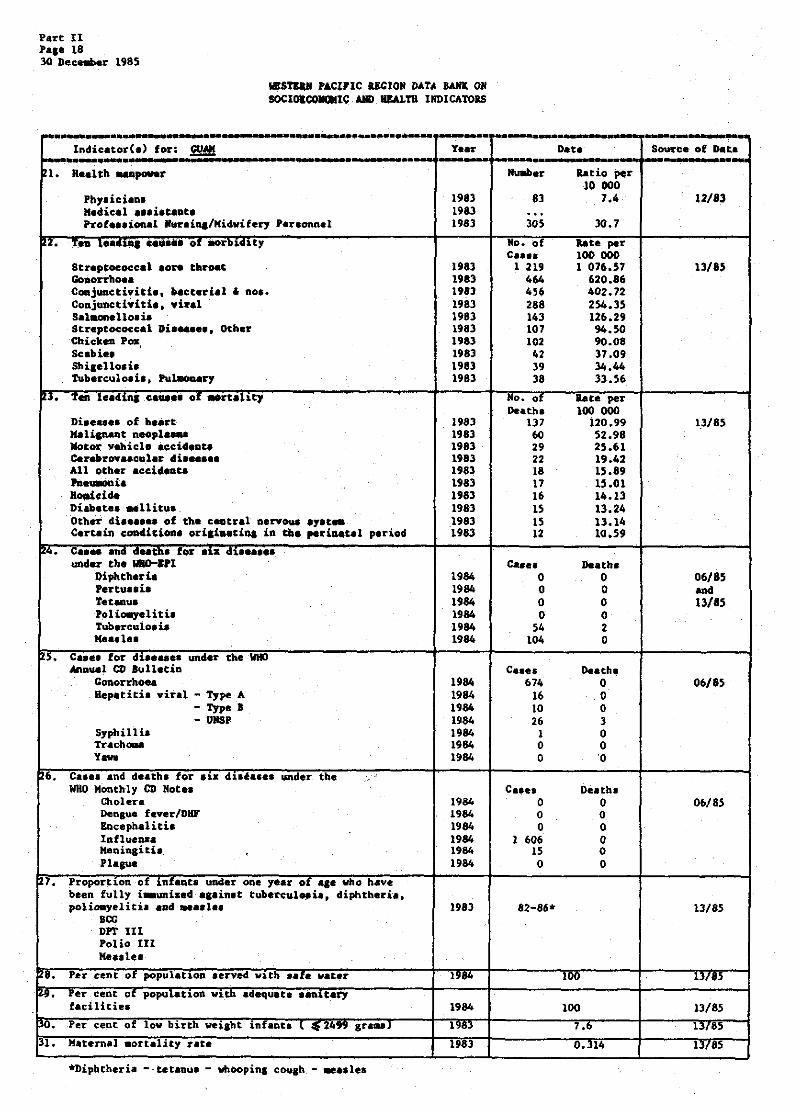
Payt II Pale 18 30 Dec_or 1985
NESf1a8 PAClFIC lEGION DATA BANI ON SOCloa~lC AIID IIJAl.TB INDlCATOIS
........ -.... -_._ ..• -_ ................. __ .. .--r--. ---IndicatorCe> for: !l!!B! You - ... - ...... -.- -- --_ .. --
I. a.a1th __ r _.r Ph,.. ic: ilnl 1983 83 M.dieal ••• i.t«Ate 1983 ... Profe •• ional Nur.ina'Midwifery Peraonnel 1983 305
~ .. TO" 10 •• 1" ....... 01 ... r ... 1tJ Mo. of C ••••
Streptococcal Ion throat 1983 1 219 GoDoryhoe. 1983 464 Caajunctiviti., ~ct.ri.l • no •• 1983 456 Conjunctiviti •• Yi~.l 1983 288 Salaon.Uo.ia 1983 143 Str.ptococcal Oi ....... Otb.~ 1983 107 Chicken Pox, 1983 102 Scabie. 1983 42 Sbiaellolb 1983 39 Tuberculoeil, Pu~ 1983 38
u. 'len le.di ... ca ..... or .. rlal.I, No. of De.th.
Di.e.... of h.art 1983 1)7 Ha I ipant n8Op1 .... 1983 60 Mot~ vehicle aecid.Dt. 1983 29 c.r~rov •• aul.r .1 ...... 1983 22 All other accidenta 1983 18 Pne8ll)D.ia 1983 17 Bo,aicida 1983 16 Di~.te ... llitul. 1983 15 Other eli...... of the cntl'.l a,rvo.aa .,..~ 1983 15 C.ruin c0l\4iciOlll. ori.1ntiq ia the periH"1 period 1983 12
~4. c .... and d~,!!~ for .ta cu .•••••• under tho lIIID-lPI C ••••
l)iphthada 1984 0 'ertu •• i. 1984 0 t'eteDua 1984 0 Polioayelitia 1984 0 Tuberculo.ia 1984 54 Me •• le. 1984 104
s. C •• e. for di .... e. under the WtI)
Anaual CD .ull.tia C •• eli Cononhoea 1984 674 8epetiti. viral - Type A 1984 16
- Type B 1984 10 - OIISP 1984 26
Syphillia 1984 1 TracbOlM 1984 0 Y .... 1984 0
6. C •• es and death. for alS dl.' •••• uneler tbe WHO Monthly CD Note. C.'.I
Cholera 1984 0 Deaa"" fever IDIIF 1984 0 Encephalitil 1984 0 Influenaa 1984 1 606 Meningiti. 1984 15 Pla",e 1984 0
7. Proportion of in~.nt. under one year of &.e vho have been fully i_un bed acain.t tuberc:ul .. ia. diphtheria. polio.yeliti. aad .... 1 •• 1983 82-86*
BOO DPT III Polio III Ke •• le.
lB. P .. cent of populau.on .erved with •• te vater 1984
flI· Per,cent or populatioa v1th adequate •• altar,. facilities 1984
1'0. Per cent of low bi~th wei,bt infanta l ~ 2499 gr ... l 1983
31. Maternal .ort.lity rate 1983
*Diphtheria -·tetlnul - vhoopin& COUlh - .e •• les
---~ D.t. Sou'r'ce of hta --Ratio pt)r 10 000
7.4 12/8)
30.7
bte pey 100 000 1 076.57 13/8)
620.86 402.72 254.35 126.29 94.50 90.08 37.09 34.44 33.56
late per 100 000
120.99 13/85 52.98 25.61 19.42 15.89 15.01 14.13 13.24 13.14 10.59
Death. 0 06/85 0 ancI 0 13/85 0 2 0
Death, 0 06/85 0 0 3 0 0 0
Deatb. 0 06/85 0 0 0 0 0
13/85
100 13185
100 13/85
7.6 13185
0.314 13/85

WESTERN PACIFIC REGION DATA BAHl ON SOCIOECONOIIIC AND lIEALTN INDICATORS
Part II Paae 19 30 December 1985
Indicator(.l for: Year Data Source of Dat.
1. Area (in 1000 aq. ka.) 1.05 12/83
- Male - F.ule
.. Per capita CDP
(us.) (IQ(S)
(X)
5 940* or 46 418
21.9
95.4 77.9
13/85
13185
12185
Official !xehanca Rate: US$I.OO· HKt 7.81 (1984)
Source 13/85:
06/85:
12/83: 12/85:
Covera.ent'a Report on !valuating Progre •• in Implementing the Strategies for Health For All by the Year 2000, 1985 Gov.ra.ent', Reply to Cumulative tot.l. of C •• e •• nd Death. froa 18 Selected Di •••• e. for the Year, 1983-84 and up to July 1985 Country Health Infor.ation Profile (CHIP) reviled by Covernment. 1983 Country Bealth Info~tion Profile (CHIP) reviled by Covernment, 1985

Put II .... 10 ,. ~~r 1ge'
... tIP P>CUIC RlClO11 _ ..... OIl IOCIOSCO~C: .., HUlft ·1_ICA'fOlS
,.------ . -. __ .-IAdI'e.~61'(a) f.::
- !l!!!!i -1. t(t.Iiltil _poIIff
Phydc:iuu Medical a •• i.t •• ," 'rof ••• ioaal JureiQa/KidwiferJ ter.onnel
'. MorUtity of "f ... Le .. , ... leD cod. tafHtiooa Dit .....
l'ubcrculoei. 010-012, 1]7 Vir.l he,.titis 0>0 .
Chick_poz 0>2 ., ... 1 .. 0» Otb.r food poiaoqiq (bacteri..l) 00} Sili_Uods 004 1)rphoid .1lI puaryphoi. 'ov .. 00' ... l .... ia 084 Lepr"" 0)0
'. tl&ill ~.~ •• of .. 'Ctali t, . ICC co4a
... li .... t .eop .... 14<>-'oa Ht.ut th ..... , iDc.h4h. 390--429
h1peJ't_ei". heart di. ..... C.rctar ...... cular db .... 430'-'31 ~i.,.n f~ .1CHo" I.Ju#7 ... poi.a.iaa ........ ..... dth. ",..l'otiC .,..~ ''''''"'If
..... ph":Mh Irooc:llhh, cltrooic aadl .. ",cit'" 4900-49)
..... , .... '" ath_ ruM""l"" (ir.c. laU eftetot. .f 010-1>1'. \17
MHcul"") Cert.ia ca04itioo • • ri.ia.t~ 160--719
b tke- ,.r~ul .-dOil o,l"GDic linr ........... cirr ...... HI
1". (; ......... eath. t • • ~a tI ........ ..ser the ,.,..."
DipbthaS'b hrt ••• is T.t_1IS polio.yelit.it tub.rculo. a. ..... 1 ••
n. "' .... _ I~r ~i~..... .*" PIe _ __ 1 CD ,ullltti.a ..... -... Ilcpatlti •• it'.l - Type A -.....
- IJlISP SyphilU. TTachc.a ....
OlD. ~~ •• ,_~.d."cn. tOI' • I.Z dL ....... uaclcl' tb • WIlD MDathl, CD .ou.
Cbolera Deaaua fe.el'/DHF loe.ph_Uti. lafheu. .. i_Citu 'lqu.
<T. ~ropot'tl.oa. ~t Lnt.nt. uader OM ' •• 1' ot .,e whO' h.-.... full,. i~ni&ed ... i .. t tuberculosi., diphth.ri •• ,ol~eHt:i • ........ 1 •• -DPI'lll
'.olio lU ........ ... rar ~ .. t of, pop"l.tlOD .~ ."th •• 1. v.t ....
Z9. P4~ ctQt of ~l_tiOQ v~tb .~Y*C • • enitary laciliti ••
,U. 'ar ,c_t of low hrtb .",i .... t iRreaU ( E 24" Ir .. J
n. Hateraal aorunty rata
*Medical ... iatant •• Ta dot applicable to BOftI~0ft8· • • 'tuatioa **C.rebro.,in.1 __ i ... _ti. aad _aiD&oc..:caJ iafectiana
.... 1983 1983 1 •• 3
198' 1983 1911 191' 1983 198) 1ge3 1983 1983
1911 1913
1'" 1911 1M1 1983
1M'
1m
1'81
1983
1984 1.84 19 .. 19" .,84 19 ..
I." 1'" I ... 19" 1'" 1.84 \984
1'84 1.84 19 .. 1'" "14 1'"
1983 1983 1983
.... 1'84
1'" ,. ..
-----Pd. So.;IIl'CC 01 o.t • _.r latio per
10000 4 las I.t n/.s
l' 419 34.'
.~ of late ,.1' C .... 100 000 I lOl 131 12/85 1 '" 34 1 128 21
.11 17 642 12 .,. 9 '09 7
'" 2 )1 1
110. a- a.,. per h.thi 100 000 1226 \l0 IlII' ... 282 81 ...
nilS , '09 " 2 19a 41 1 700 ..
191 11
611 1. ... 8
• '4 • 34. ,
..... hach • 0 0 06'"' 18 0 oDd
•• 29 13/8' 0 0
7 .. , 420 6" 2
c •••• .. , O~/.S ... ... 1 ·180 ...
... . .. e ..... Death.
1 0 06/8.5 ... ., . .. . ., . . .. ., . ... 0 0 0
91 ll/85 .. 90.0
• • llI.'
99 ll/85
].6(loy.).4.7{C,il. 1>,., • ••• m.,
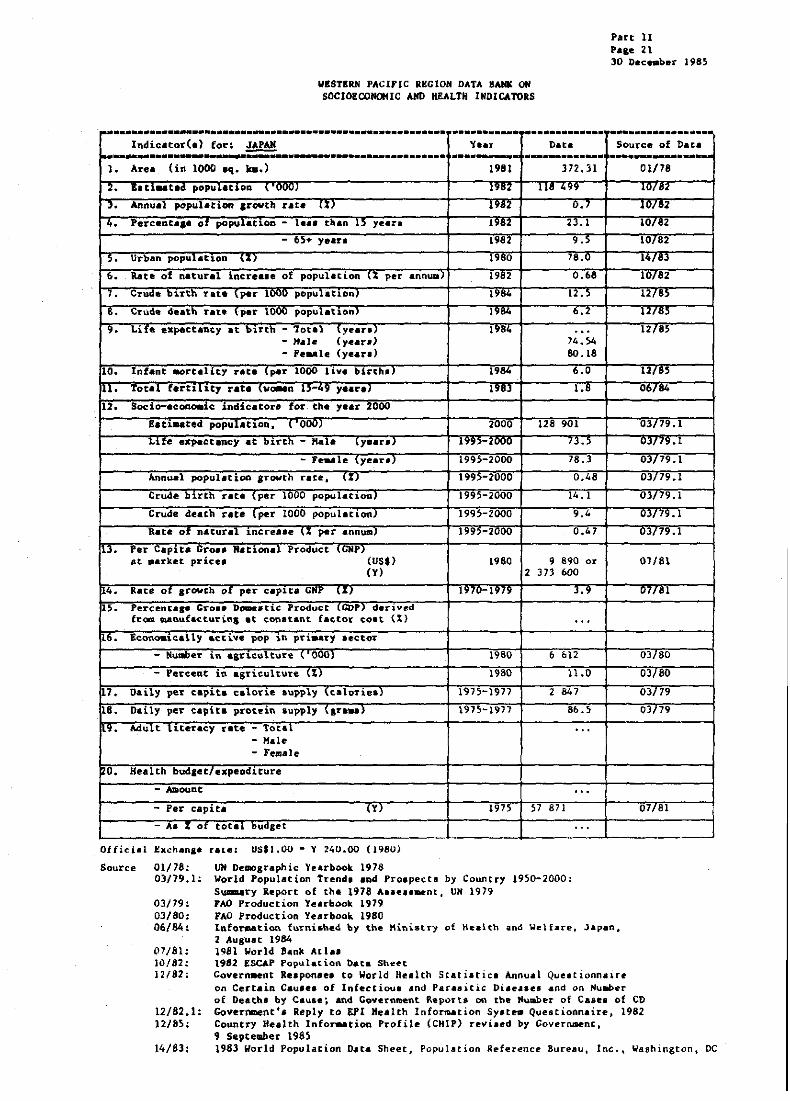
WISTIRN PACIFIC RHGION DATA BANK ON SOCIOEOONafIC AND HEALTH INDICATORS
Part II Pale 21 30 Oec .. ber 1985
~ .. -.--.. -.-.. --........... -•..•..•...•... -•..•..•..•..•. ....... _._. . ............ . .... _.--._ ....... Indicator(.) for~ ~ Va .... nata Source of Data
~ .. -............................ -----........... -.... -... .... ._-_ ....... 1---------..... 1. Area lin 1000 oq. Ica.) 1981 172.31 01/78
2. •• U .. t •• popu,o .. o. I ·UW) "'2 I, .... lut.'
J. Annual population ,rovth rate IV 1'02 0.1 Ju/.2
4. Percenta,_ of populatl0D - le •• than U year. 1982 2].1 10/82
- 65+ yeau 1982 9.5 10/82
,. Urban populatlon \~} 1 •• 0 78.0 1.,.,
6. Rate of natural increa •• of popul.cion II per annUlI) 1982 0.68 10/82
1. CTude: bl.1'th rate {per 1000 populiltlon) 1984 12.' 12/85
•• CTude death Tue \ per 1000 popuhtlOn} I ... 6.2 I.,., 9. Life expeetan~y at blrth - Total ,y .... ? 1.84 ... 12185
- H.l~ (y~au) 14.54 - Fe .. 1e (year.) 80.18
10. Infant .ortalit7 nte ,"par 1000 li.va bil'ChiJ 1984 6.0 12/85
II. Tot01 torUnt, roto IW_n 1>-•• y.orol 1 •• J 1.. 0., ..
12. Socio-econoeic indicator. for the year 2000
E.tlmated populatlon. ( 000) 2000 128 901 Ol{79.1
~lfe expectapcy at birth - Mal. lY'OUI 1995-tuuu 7].5 v,,, •• 1
- Fe.a1e (yeer.) 19H-20oo 78.3 Olt79.1
Annual population ,rowth rate. (%1 199~-2000 0.48 Olt79.1
Crude buth rate (per lOuO populatloaJ 1995-2000 1-4. 1 01,79.1
Crude death nte lper 1000 population) 1995-2000 9.4 03/79.1
Kate 01' natural 1ncrease ,~ per annUCQ} 1995-2uoo 0.47 Ol/79.1
.ll. Per Caplt. eroaa " .. tional Product tGNP) .t .arket prices (US,) 1980 9 890 or 01161
(y) 2 373 600
114 • Rate of growth of per ,apH. GNP (I) 1970-1979 ] .. 07/81
15. Percenul_ eros. DOIK_tic Product (CUP) d.rived tr~ ~nufacturial at constant t.,toT coat (X) ...
6. leona-ie.t1y .cti~e pop in pri •• TY sect~
- Nu1llbe.r in &St'1culture ~ 000) 1980 6 612 03/80
- Per¢ent in aSTiculture: (X) 1960 11.0 03180
i12 • Daily peT capita caloTie supply (caloTies) 1975-1977 2 847 03/79
t8. Oaity pe\" eapita pTotein supply (ar ... ) 1975-1977 8b.5- 03/19
~9. Mult lLteracy rate - Total . .. - Hale - Female
o. Health budaet!expeadlture
- Mount ... - Per capita (YI 1975 57 871 07181
- A. % of total budg.t ... Official Exch .. na. rue: ustl.OO· Y 240.00 (1'180)
Source 01/18: 03/79.1:
03/79 : Ol180: 06/84 :
"'181: 10/82: 12182:
12/82.1: 12185:
14/8l:
UN Demographic Yearbook 1976 World Population Trends and Prospect. by Country 1950-2000: S~ry Report of the 1978 A •• e •• .ent, UN 19}9 PAD Production Yearbook 1919 FAa Production Yearbook 1980 Infor.ation furnished by the MiniatTY of Keai~h and Welfare. Japan. 2 ""ugu.t 1984 1981 World a.n~ At1 •• 1982 £SCAP Pop~l.tiQR n.t. She~t CoYernlHnt Response. to World Health Sc:atiUic. Annual Quutiolmaire on Certain Cau.e. of Infeetiou. and Para.itic Di.ea.e •• nd on Huaber of Death. by C.u5ej and Govern.ent Report. on the Number of Caaes of CD Government', Rep11 to EFt Health Info~tion Sy.te. Q~e8tionn.ire. 1982 Country Health Info~tion Profile (CHIP) revi.ed by Covernment, 9 September 19a5 1983 World fop~lation Oat. Sheet, Population Reference Bureau, Inc., Washington) DC

Part II 'ale 22 30 Dec.~.r It85
WESTIlM fACIrIC RECIO" DATA BANl OM IOCI.coate AlII 1IIoU.1'I llllllC4!OJtS
. _ ...... --_ .. • • -.-----.--------,._._ .. _-_ ... -. __ . Jndicator(,) for: JAPAIt Y •• I' D.t.
~ ........... -.. ~ --_ ...... _-----..... _-.. ---------1. Health .. D ...... r "-ber Ratio per
10000 Phy. Ie i .... 1983 161 9)2 14.1 Medical ."i,teat. 1983 ... -Prof ••• lunal Nur.iDe/Hidwifery Per.onnel 1983 33J 064* 27.9
2. Ten leadiat cau ... of .orb~dlty leo cod .. No~ of a.te per C •••• 100 000
PulmOn.ry tubercQl0.i. 010-012 1984 56 880 47.3 Otber food poi.onina 005 1984 26 238 21.8 Influenza 487 1984 17 882 14.9 Conocoecal infection 098 1964 13 511 11.2 tte .. lel 055 1984 12 2&8 10.2 Other tuberculo.ie Oil-OI8 1984 5 962 5.Q Oth.r •• laonell_ infection 003 1984 2 101 1.8 Wboopina couah 033 1984 1 1\4 0.9 SyphUi. 09()-097 1984 I 642 1.4 Shi&ello.ia 004 1984 895 0.7
3. Ten leadi11l cau ••• of .artalicy Mo. of ... to peT De.th. 100 000
Malignant n.opl .... 1984 182 280 152.5 Cerebrov •• cul.t di ..... 1984 140 093 117.2 Heart 4b ••••• 1984 \)6 162 113.9 Pneu.ania and broachici. 1984 44 982 37.6 Accidenta 1984 29 344 24 .. 6 Senility without .. ntion of p.yeboab 1984 28805 24.1 Suici4e 1984 24 344 20.4 Cirl'hoail of the liver 1984 16 991 14.2 Hypertenaive dia ••• ea 1984 13 013 10.9 ~phriti •• nephrotic ayndrome and neph.l''' it 1984 12 688 10.6
4. Caees and death. for .ix di ...... under the WHO-E.l C •• ~. Death.
Dipht:heri. 1983 20 0 Pertu •• i. 1983 2 459 12 Tetanu. 1983 56 46 Pol iOtlyel itia 1983 0 0 Tubercu 108 ia 1983 63 789 5 329 Keaal.s 1983 7 281 47
5. C •• ea for dis.a •• a under the WHO Annual CD Bulletin C ••• s
Gonorrhoe. 1982 10 391 Hepatieie vir.l - Type A 1982 .. ,
- Type. 1982 .., - URSP 1982 ...
Syphilli. 1982 1 659 Trad,OCN 1982 17 Yawl 1982 .. ,
~6. Caaes and de.ths for .ix die •••• a UAder the WHO Monthly CD Mote. C.,es Deaths
atolen. 1983 35 ... Dengue Il!Yer /DJfF 1983 . " ... Encepb .. liti. 1983 26 ... lnflueua 1983 26 143 ... Meninaitie 1983 15 ... Ph&ue 1983 ... ...
7. Proportion of inf.nca under one year of .a. who have been fully i..uniaed .,ain.t tuberc~lo.i •• diphtheria, polio.yeliti. and .... le.
BeC 1982 84.6 Dpf III Polio tIl Hea.lee
28. PIer c~nt or popul.u.on ..rved With •• re v.ter ... 9. P~r tent of population with .dequ.t ••• nit.ry
faci lit i.u ... flU. rer cent 01 lOW IHrtn Wllht 'nlant. ~,'4" ,r ... ' .... > •• 31. Haternal .art.lity rate 1983 0.204
*Nuraea an4 nuree-aidwive.
.. _ ............ Sou.rc. of DaCa .......... -.
12/85
12/85
\lIas
12185
12/82
12/85
12/82.1
12/0'
12/35

WlSTEaJ PACIFlC RECION DAtA RAHX ON SOCIO&CORCl4IC AXD HEALTlt lNDICATOas
Part 11 P.ae 23 30 Dec .. ber 1985
,.-- . _- .. _ .. ....... --........... ._--r----=---- --_.=-_ .. Indi~.cG~(,) fori ItIaINTI r.ar D.te Source of Data
1--=- = -----_. . .. _--._.--._-... _. ... _---- .--.. --"- .------_ ........ l. Area (ia 1000 .q. bo.) 1981 0.72 12/83
2. E. U .... teci pOpulaCloa, (OW) 19154 6' 03/84
3. Annual population Irowth raU' II) 1983-84 1.7 13/8~
4. Perceat ••• of populatlon - 1... [han 15 yeu'. 1982 _I.I 10/82
- 650+ , •• 1". 1 •• 2 J •• lUI'"
5. Urban popubtlon (XJ 1900 37._ 0)/79
6. Rate of natural incr •• ae of population U peT annua:) 198) \.7 13(85
1. Crude buth rate \per Ivuu popuhtLonJ 19/' J4.9 10/82
•• Crude deatn rate \per 1000 populae"onJ H,_ 14.0 1010"
•• Lite expectancy at b"th - Tot.l ~Y'."I )970 .,. 10/<2 - Mde (years) 50
- Feule (yeau) Yo
10. Infant aortal1cy rate (per 1000 liY~ buda) \918 87 13/.3
L1. Tot., rertLuty rate \"0.8n ,,-'tY y.aru .. ,' 4.1 lU,""
12. Socio-.eon~it iDdie.tora for the year lOou
lacuaated populatlon, \ '000) 2000 ., 0./1 •• 1
Lue expec::t&Dcy at butn - Male < y .. r " · ., - Fe .. le <y.ars} · ..
Annu.l populatioU growth Tate. (II 1995-2000 1.58 03/79.1
Cruel. bl:rth rate \per 1000 populattofll .. , Crude death rUe '-per lO~ populatJ.onJ .. , 'Rate of natu.ral \ncreaae (Z per annw.) ...
1,. Per Caplta Uro.a Kational Product (GNP) at market pric.. (US,) 198) 41.45 r 13/85
( At) 50.3
'1 •• aat. 001' growt.n os: per caplta vlU' \_J LY/o-U/I 6.0 07(79
'U. Percenra,e Gro .. Dcae.uc Product (CDP] der:l.ve4 fr~ m&Dufacturina at constant factor coet (%) 1978 47.2 14/81
16, £conoalc&111 active pop 10 prl .. ry .ector
- lIhImDer 1n .,r1culture \ ·UUU) · .. - Percent in .,riculture tl) .. ,
11. naily per capIta caiot'ie supply (calOrlu) ... 18. Daily per caplt& protein .upply (sr ... J . .. 19. Adult Ilterac:y rate - Total 1984 95 \J185
- Male · .. - Fe .. le ...
20, Health budget/expenditure
- Aaount <A$) "62 1 600 000 \<102.1
- Per capUa IAJ! 1962 lb. ) 1".2.1
- ,M Z of total bud,et 1 •• < ,O.J 12(82.1
Offic:ial Exchange rate: US*I.00· A$I~06 (1984)
Source 13/85: Government', Report on Ev.lueting Progress in I.ple.enting the Ser.cecie. for Health for All by the Year 2000, 198~
13/83:
03/79.1:
03/79: OJ/8I. : 01179: 10/82, 12181;
12/82: 12/82." 12/83: 14/81:
Government'. Report on MODitoring ProiTe.s in laplementing the Strate&iea for HFA/2000, 1983 World Population Trend •• n4 Pro.~ce. by Country 1950-2000; Svaqary Report of tbe 1978 A •• e •• -ent. UN 1979 Urban. Rural and Ciey Populacion, )950-2000, a. A.ae •• ed in 1976, UN, 1979 United ~.tioQ' World Population Charc, 1984 1979 World aank Atl •• 1982 ESCAP Population D.t. Sheet Government re.pon.e. to Wo~ld He.lt~ Staeistice Annual QuestionnaiTe on Health Manpower. )981 Governaen['. Report. on the Nu~er of Ca.~. of CD WHO Seminar on Financ1na Hea1ch Development, June 1982 Country Health lnforaation Profile (CHIP) revi •• d by Covernment. 1981. 1982 and 19S3 Key Indicacora of Developina Kember Countries of ADB, April 1981

1?'art 11 Page 24 30 Daceohe~ 1945
WlSTElN PActFIC REGION DATA IAHl ON SOCIOI_tc AlIIl IIU~TIl INDlCA'rOaS
r----.- - .. _----- _ .... ----- ... _---tndiea~o~(.) for; ItUl!§TI Ye.r Dato Sourc.
~- -- .. _------_. .. -- _._--_.-~1. He.ltb .... pover Maber bt. per
10 000 ?by. ida .... 1980 IS 2.6 Medical a •• i.tant, 1980 15 2.6 Frot ••• ioaal Hurliaa/MLdvifery 'e ... ,oan.l 1980 154 16.6
2. 'ren IUdi" C.u ••• of IIOrbidity Mo. of bte per Caaee 100 000
Upper y .. piratory tract infectioo 1981 26 '88 45 064 Diarf'hNa 1981 6 333 10 734 tower re.pir.cory tr.ct inhction 1981 4 328 7 336 Sor •• /vO\I'Ilda 1981 3 440 5 8)1 Conjunccivitit 1981 3 430 5 814 SII;in infectiou 1981 2 1S6 3 654 Otitis ~i./perfor.tioa 1981 I 156 1 959 C~nic.bl • • i •••• ea 1981 811 1 385 An ... i. 1981 466 790 Fiah poi-aoa.inl 1981 443 751
3. Tea lea'illl cavae. of IIOl't .. lity ICJ) code "0. of .. te per Deach. 100000
Disease. of other p.rt. of dice.tiv. .y.tett 530-579 1980 15 26 'l'u~rculoaia 01g..018 1980 14 24 In'testinet i~fectiou.a di.ease. 001-009 1980 13 U Other 4i •••••• of re.pir.cory ,y,t .. 466, 480-519 1980 11 19 C.reb~ov._cul.r d1 ••••• 430-438 1980 1 12 t~an.port accident. EIIOD-£648 1980 1 12 ni ...... of the nervou' ay.t .. 320-3S9 1980 6 10 Oil of pulaon.ry circulation .nd
other fo~ of heart di •••• e 415-429 1980 6 10 N~trition.l d.fici.nciea 26g..269 1980 S 9 Oth~r injuri •••• arly co.plication. of t,..u..w
910-929, 9S8-959, 990-995 1980 5 9 4. C •••• .nd d •• t~~ tor a1. di ••••••
under the WHo-apt c •••• o..thl Diphtberia 1983 0 · " PertuI.b 1983 0 · .. TeUtlu. 1983 · .. · .. Polioeyeliti. 1983 0 · .. Tuberculo1 it 1983 · .. · .. Headel 19&3 0 · ..
I2S, Calel.for dl •••••• under the WHO Annual CD lulletin Ca.ea
Con.or.-ho.a 1980 15 HeJNIt"ici. vir.l - Type A 1980 I
- Type B 1980 3 - UIISP 1980 15
Syphilli. 1980 I Trachoaa 1980 · .. y .... 1980 -
fl6. C •• ea and death. for .i~ dil •• IC' und ... the WHO Kontbly CD Notea c ••• , Duch,
Ch.ol.r. 1980 - -Dengu. fev.,./DHF 1980 8<J8 -Enc.ph.lith 1980 - -Influenu. 1980 38 109 J Henillliti. 1980 1I 7 Pla_ 1980 - -
1. Proportion of infant. und.r one y •• r of _Ie who h.~c been fully 1..uai&ed a,aiaat tubercul~i •• diphtheria, polia.yeliti •• nd .e •• le. . ..
BeG DPT III Polio 111 }IIe.alt!.
8. Per ceot or: population .erved wlth I.f. v.tel' . .. 19. Per e.ent of population ws.ttt. .tlequate •• ultery
facilitie. < ... ~O. Per cent of low birtb ~ilbt infon .. I ,2499 gr ... ) 1979 18
31. Maternal .oft.llty r_te . ..
of Data ' ,
U/81
13/.5
11/8S
13/8S
12/82
12/82 .
13(85
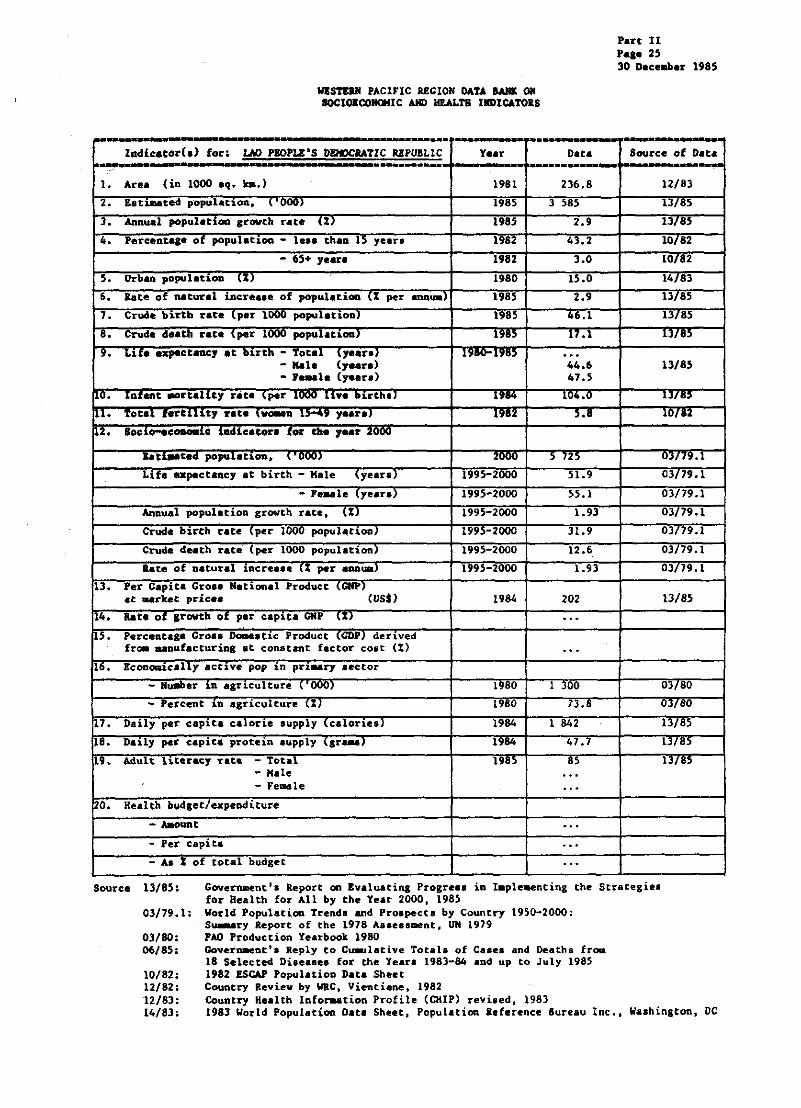
WlSTEIJI PACIFIC Ri!CION DAD ..... 011 BOCla.CO_IC AND HEALTH IJlDlCATOIS
Part II Pa,a 25 30 Dacellba. 1985
--- = .. ---- . ladicatorC.) for: LAD PIOPLE'S DENOCIAT~C RlPUBLIC rear Data Source of Data ---- -------
1. Area (in 1000 oq. .... ) 1981 236.8 12/83
2. E8tlJUted populauon, ("000) 1985 3 5~5 13/85
3. Annual populat1oa Crovth rate U} 1985 2.9 13/85
4. Percttnuge or populatl.OD - Ie •• thaD I) yeore 1982 43.2 10/82
- 65+ yearl 1982 3.0 10/82
5. Orb ... population \~, 1980 15.0 14/83
6. late of natural increase of populatiOll (I per ..... _J 1985 2.9 13/85
7. Crude bntb rate \por 1000 populaUool 1985 46.1 lJ/85
8. Crude death .. to (per louu popul.e.ODI 198) 17 .1 lJ/O'
•• ...... xpocta"'7 at Dutn - Total ,YOUOI l.aU-I'" · .. - Kala (y .... ) 44.6 13/85 - 1' ... 1. (years> 47.5
10. la .... t _rcanty rat. (per lOUU U.a Dirthll 1984 104.0 IJ/a.
u. Total •• rtUUy rat. I_a ., ..... yaarOl 1982 5.8 10/82
U. B001_0_0 ladlO.tor. for tho ,.aar ."""
""t_t04 POPUllt1on, VOWI ZOW , 12) UJIJ'.1
Life expectaftcy at birth - Kale Iy .... ) 199r2oo0 51.9 03179.1
- Fe .. 1e (ye.re) 1995-2000 55.1 03/19.1
Annual population growth rate. III 1995-2000 1.93 03/79.1
Crude b>rth rote (per 1000 populauoo, 1995-2000 ll.9 03179.1
Crude death rate- (per 1000 population) 1995-2000 12.6 03179.1
late of llatural increase (% per aGDua) 1995-2000 1.93 03179.1
13. Per Capita Gros. National Product ~GNP} at .. rket pric.. (V5j) 198Jo 202 13/85
i,4. Rate of srowth of por cap .. a GNP II) · .. 15. Percentage ero •• no.e.tlC Product (CD') derlved
fro. .. nufacturing at constant factor cost (X) · .. 16. ECOD~c.11y actIve pop in pr1 .. ry sector
- MUSber 1.11 agrlculture ("000) 1980 I 300 03/80
- Percent in .,riculture {Il 19.0 73.' OJ/80
17. Dally per caplt. calorle supply (calOrlesJ 1984 1 842 13(85
18. Daily per capita protein supply ~&r ... } 1984 47.7 U/8,
1 •• Adult 11terac,. Tate - Total 19., .) 1>1.' - Kale · .. - Female · ..
O. Health budgee/expenditure
- Allount ... - fer capita · .. - Aa I of total budget · ..
Source 13/85: Gove~ntl, Report on Evaluating Progre., in I.ple~nting the Strategies for Health for All by the Year 2000. 1985
03/79.1:
03/80: 06/85:
10/82: 12/82: 12/83: 14/83:
World Populatioa Trend. and Prospecc, by Country 19S~2000: Su..ary Report of the 1978 ABae.,ment, UN 1979 PAO Production Yearbook 1980 Govern.ent's Reply to Cuaulative Totals of Caaea and Deaths fro. 18 Selected Dise •• e. for the Yeara 1983-84 aDd up to July 1985 1982 ESCAP Population Data Sheet Country Review by waC. Vientiane. 1982 Country Health Inforaation Profile (CHIP) reviaed. 1983 1983 World Population Data Sheet, Population Ie terence Bureau Inc., Washinlton, DC

Part 11 .&.. 26 3D Do.o.b •• 19.5
lamu .AC:InC 81(;10" OATA _ OH SOCI08C011OHIC AND IUW.TII IHOICATOlS
jIII--••• _----_ •. - - .. ______ ._ .. _ .. e l.dieator(.) forI .Lte 'lOlLl', DlMDCaATIC RlPU8LIC y-
~e~e ..... -_._ ... .. __ . ---~I. H •• lth __ t
Phy.ie.iau: 1984 Medie..t ••• i.taat. 1984 Prof ••• iaa.l IUl'liac/Hidvif.ry Per.onnel 1984
oz. TOft 1 ............. or ... D.4.t7 ICD code ..... 1'
111-d.ti0t4 iat •• tln.1 'nteettoa. 009 1980 IDlluen., 481 1980 Ha1.ri. 084 1980 Oth.~ di •••••• of 1un. 518 1980 Streptococcal lore throat an. aC'l'lltina 034 1980 Altoebi •• la 006 1980 lat •• c1ftl1 infection. dUI to oth.1' 01"_"''' 008 1980 Sbicelloail 004 1980 Pulmonary tuberculolia all 1980 Pneumoni., or, .. i •• un.,ecifi.d 486 1980
, 23. Ten leUt ......... of ... t.ht7 '.a ..
Mahrt. 1971 Uri-bronchiti'-arippe. pDlu.ofti. 1911 H,plrt.naive di ••••• 1971 Tubll'cu!o.i. -.a11 for.. 1911 Diarrhoe. 1971 'r ... tul'ity 1971 Avit .. iQo*"/Aaa.~. 1971 Meninao-eacaphaliti. 1971 l'l1ljuril. 1971 Cholicy.titil/Cholilithia.i./cirrho.il 1971 Del. coaplic.tion 1971
24. C •••• 'Dd de.thl_for .1X d.u ••••• uad.r the WHO-IPI Y.a ..
Diphtheria 1984 ',rtu •• iI 1984 Tet ...... 1984 Polio.y.litia 1984 Tuberculo. b 1984 He'11., 1984
!Z>. 1,;.... tOt' ch.I •• '-.' under the WHO Annu.l CD Bulletin Year
Gonorrhoe. 1984 Hep.citia viral - Type A 1984
- Type B 1984 - UHlP 198.
Syphillia 1984 Tr&ChOlU 1984 Yaw- 1984
,
,Z6. C •••• 'na _ 'OeaCn. [or IU dia ••••• u.der tho WHO Monthly CD Not •• V.ar
Chole.:, 1984 Detqve feverJDHF 1984 Bnc:epb.ditia 1984 Influenza 1984 Heninaitia 1984 PllgUi 1984
21. Proportlon or "Dranc. under on. ,.ar of ••• Who have been fully i-.uni •• d. '1linlt tub.rc:ulOlia, diphtheria, palioay.liti •• ad .... 1 ••
BOG DPT til Polio 111 H, •• l ••
za. Per cent 01: PGpulati.Oft '.r"ed tilth •• r. "et.r ,
29. P.r cent or population with ad.quate "IQUary faciliti •• ,
130• Per cent or low birth _'ah' Inr .... ( C 2.99 ..... ) Ita.
1.1• Maternal -.ort.uty I'.te l~""
-_e. • •• Dot. Sourci of Dat ---_.t .. tio pet
10 000 418 1.0 13/8S
1 892 4.4 6 104 14.1
Ho. "f- bt. per C .... 100 000 50 223 1 337 12/83 36 742 978 25 .,. 688
9 928 264 7 HI 192 6 667 178 5 793 154 4 768 127 4 S87 122 4 308 U5
No~ of Il&te per De.ch. lOa 000
208 7 12/83 56 2 48 2 45 I 44 I 38 1 31 1 29 1 20 0.7 16 0.5 16 0.5
C •••• Death. 30 12 06/85
1 813 14 31 18 13 a
6 528 35 . 924 6 .
Ca ••• 96 06/85
I 624 63
l4l
C •••• Deathe 0 06/85
22 14
• 0 82 66
404 144
. ..
,
. ..
... 30-40 13/8S
0.02 ll/85

.
I.
2.
3.
4.
5.
6.
7.
8.
9.
10.
11.
U.
13 •
14.
15.
16.
17.
18.
19.
O.
IIISTIIII PACIFIC Rl!CION DATA BANI: 011 SOCIOIC:O_IC IoJII) IIULTR INDICATORS
Part II P ••• 27 30 Deceaber 1985
---- ------ -----.--------_.--=--_ .. ------Indic.torC.) for; ~ Y.ar Oat« Sou.rce of Data --- --- • ----- ~. ----. --An. (In 1000 oq. k..) 1981 0.02 13/85
Eat ... ted papu 11 hon (' 000' 198] 3 •• 13/85
Annual populatloo arovth rat. III ly82 2.B 1]f85
PerceDt .. a of popul.tlon - 1-'.. tli-. ... J Y"" 1980 l4 10/82
- 6S+ y .... 1980 4 10/82
Urboo population (X) 1980 98.0 10/82
Kate of natural incre •• e of popubt1oa n: per ennla) 190> 1._ 13/0'
Crud ... rth ro .. Iper 1000 POPUIOUOD) 19_J 2J •• 13/.,
Crude d •• tn rote lpor l00lr populotlooT 198] 5.8 I"., Life expect.DCY at b1rth - Toter -(ye.r.~ 1982 65 13/85
- Jt.1. (y .... ) ... - P .... I. (year.) ...
Infant ItOrtality ro .. (por 1000 live buth.) 1983 14.1 13/85
Total fornhty r.t. ( ..... n 15-49 y .... r ... Socu .... c ...... ic ladicator. for tho ya .. 2000
soU .. Cod pop.".UOD. ('OOU) 2000 Jl4 03/79.1
Life expectancy at b1rth - Kal • (y .... ) ... - 1'_10 (Y'o,,) · ..
Ann~al population growth rat.. r%) 1995-2000 0.90 03/79.1
Crude D1rth rot. Iper lUOU popul.tlOn) · .. Cruda death rot. (per 1000 populotionl ... Rot. of ootural .ncr •••• (X por ..... _, ...
P.r Cap1ta Cro •• »attona1 Product (QfP)
. at .. rket pric.. (U5*) 1982 1 500 13/85
aate 01' arowth oJ: per capita QlP ("') 197o-197y I).u 07'''1 Percent.g. GrD •• Doae.t1C Product (CDP) derlved fro. aanufacturina at con.tant factor COlt (X) · .. SconGa1cally aet1ve pop 1n prl .. ry .ector
- "ldIlter 111 a'l'1culture (·000) ... ~ Perceot 1ft &cr1culture tlJ · ..
O.i1y par capl.ta celoT1_e aupp1,. (calor1 •• ) 1977-1919 2 181 13/85
Doily per capita protein .uppl1 <,r ... ) 1971-1919 57.9 13/85
Adult literacy rate - Total 1982 90 13/85 - Male ... - 'eule · ..
H.alth budaet/expenditure
- Aaount (Poeac .. l 1979 17 565 124.70 12/8]
- Per c.pita (huc •• ) 1979 63.3 12/83
- A.X of tot.l budg.t ... Official Exch.nge rate: US$ 1.00 - Pataca. S.4S (1982)
Source 13/85:
03/79.1;
06/85:
07/81 10/82 12/8]
Government'. Report 00 IvalUAtinl 'rolre •• in Lapleaenting the Strategies for Heal th for All by the Year 2000. 1985 World Population Tread. and Prolpect. by Country 1950-2000; s ..... ry a.port of tbe 1978 A ....... nt. UJ 1979 Gov.rnaent'. aeply to Cu.ulative Total of C •• e. end neath. frQa 18 Selected Di •••••• for the Y •• r. 1983-84 and up to July 1985 1981 World Bank Atla. 1982 ESCAP Population Dota Sbe.t Country S.alth Iufor.ation Protile (CHIP) r.yia~ by Cover~nt, 1983
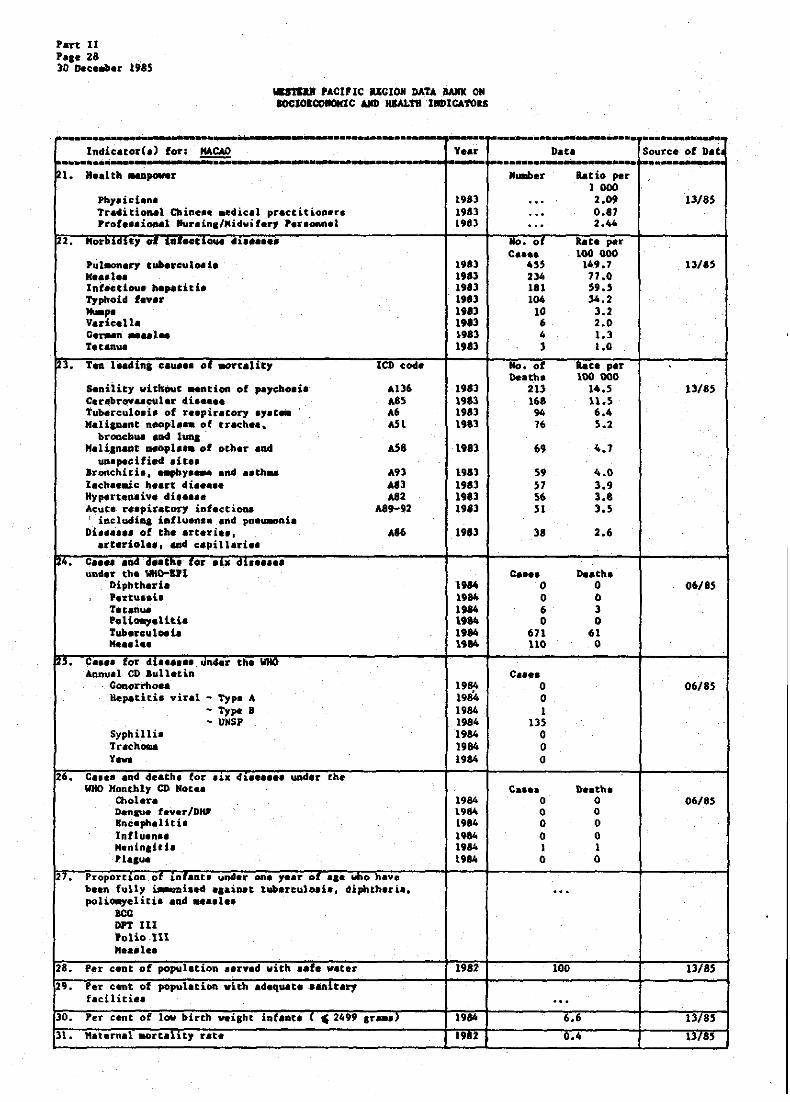
Pan;: II PII«" 28 )0 Deco_or 1'85
1iUTD1I 'ACrr IC 1IIC10lI DATA BAlIK ON aoc:lOlCO~C AIID 1tJAL1'II IIlDICA'I'Oas
~-.-.. - ...... -- tb. .. --_ .. lneticator(.) for; ~ Ye.,1' .... _---- -- - -= - --I. H •• l th flllDpower
Phy. ic ian. 1983 Traditionat Chine.e aedic.l practltl0a.r. 1983 Ptof ••• ioaal ~r.inl/"idv'fer, P.r.onn.l 1"3
2. Morbi.U, _ '.8'HUOU .........
Pul.an.ry t~rGul~il 1983 K.a.t •• 1983 Int •• tiou .... ,..&:itb 1911 Typhoid f.v •• 1,.3 -po Ita] V.ricell. 1911 aeran .... 1 .. 1983 Tlt.n\lll lta3
~]. Till l .. d ini: ca.,.I' or 1IOl'tahty I.CD code
Senility without "dtion ot .. ,choli. AIl6 1983 Carebrev&acular di ••••• AlS 1983 Tuberculo.i. of 1'1.,irlcory .,.c .. 1.6 1983 kUan_nt n_,la •• o.t trache •• AS1 1981
bronchua and 1--a NeU._lnadt .. Iopl ••• of ocher and AS8 1981
un' pacified .it •• arodCh{t{ •• --.hy .... .nd •• th .. AU UIl l.cha • .ic h •• rt di ••••• A'] 1983 Hypert_ .... iv. eli ••••• Al2 1981 Acute r •• picatory lnf.ctiona 0\89-92 1"3 r iacludina i.fluen.. and pnlu.onie
Dia ... -••• of the .rceria •• 1..6 1983 .rt.rioh., aDd c:.pi ll.ri •• ... C ........... '"._"O • • UC dU •••••
Uftd.T tb. WKO-tll Diphth.ria 1984
, "'I'tua.h 1984 T.t.nua 1984 ... Ii_.llt" 1984 Tub.l'culo.te 1984 M ••• 1 .. 1'84
2>. c.... for .l...... .n4e. th. WHO Annu.l CD Bull.tin
Gonorrhoea 1984 llep.atiti. viral ~ Typ. A 1984
~ Type B 1984 ~ DNSP 1984
Syphill ia 1984 Tr.choma 1984 y .... 1984
26. c •••• end de.th. fo~ .1K dl ...... undar the WHO Honthly CD Not ••
Olol.r. 1984 Den.,. f.ver/DHP 1984 Inc.ph.Uth 1984 Inllu.n .. 1984 M.Rin.hh 1984 Pl.,u. 1984
27. Proport1on of lnf.nU und.r 0111' ,..1' of '1' who h.". bean full, ~i •• d _1&iD.t tUbereuloai' J diphth.ri •• polio.yeliti •• ad •••• 1 ••
ICC DPT III 'olioUI Meaale.
28. -Per cent of population .arv.d with- •• f. vater 1982
29. ~er cent of poJNlation with .d .... llIt ..... it.ry f.dliti ••
30. '~r cent of low birtb weight inflat. ( ~ 2499 , .... ) 1984
31. ",t.rn.l .ort_lity rat. 19U
_._._----... -Dat. Source of D.t ...... • --fa--
.. ....".r a.tio per' 1 000 ... 2.0' 13/85
... 0.81
---- 2.44 .
No. of bee par c •••• 100 000
45S 149.7 13/15 234 11.0 181 S9.5 104 "'.2
10 ].2 6 2.0 4 1.3 , 1.0 .
No.Of Ratl per Death. 100000
213 14.S 13/85 168 11.5
94 6.4 I
76 5.2
69 4.7
59 4.0 H 3.9 56 1.8 51 3.5
.
38 2.6
c. ••• h.-tb. 0 0 06/8S 0 0 6 , 0 0
671 61 110 0
C •• e. 0 06/85 0 1
13S 0 0 0
Ca ••• ne.th. 0 0 06/8S 0 0 0 0 0 0 I I 0 0
. ..
100 13/85
. .. 6.6 13/85
0.4 Ul8S

WlSTIaM PACI'IC •• GION DATA lARk ON SOCIOlOO_IC AMP BlALTH IMDlCATOIS
Part II Paae 29 )0 Dtce.oer 1985
. -----...... --.. ~.-------.... --... -. . .. --_ .. __ .. _ ..... _._ .. _ .... _.--- ..... __ .. lndicator(.) for~ HAUYSU. Y.ar Dau Source of Data --_ .. _- --- . _-- -- - ......... --I. A .. a. U" 1000 .q. D.) 'enin.u1ar 1981 131.59 12/83
Soboll 1981 73.71 S.ra"ak 1981 124.45
I 2. Ea t luted: popu laC lOG ('(JQ(J) 1984 I> 204 13/0,
I ,. Ann ... l populltlOil ...... th ut. (II \, .. 2.1 12/114
1 4 • rercentaae of populauOQ - 1 .... Chan " y ... u 1~82 18.1 'U/ ••
- 65' y .... 1>.2 '.1 10/82
>. UrOan populO.,on .. , 1~80 19.~ 12/84
1 6 , Rate of n.tural J.nc:r ..... of popul.t10ft. (I pel" a""val 1 .... l.' 1".)
I. •• ud ••• rto ut. <por ,uuu pOpu .... Oftl •••• lI,> lJ/B>
1 0 • ~.ud. G •• t. rot. <por low popuUt1011' 1984 5,1 Il/B)
9. Lit. expoct.acy at bir," - Total ~y .. u! '" - Hale (year.) 1987 67.7"* 12/84 - re.ale (y.ar.) 72.5"*
~u. ,,,bnt IIOrtahty I'ate \per luw l1ve outhaJ 1'02 ',.l' 12/84
1. total rerhl1ty rat. (.,0.1'1 I)..,., ,.ara, 1982 3.8 10/82
n. Soci .... co ..... l. ln41catorl. for til. Y'" %000
&.t1_to4 populaUon, < 'WV' lUUU lU 101 .''''.1
LUe expectancy .t birtb - Mal. <yea .. , 1 •• >-2000 bb.> 03/79.1
- F ... l. (1 •• ro) 1995-2000 10.S 03179.1
Annual populatioa .rovtb ~at.* \~, 199>-.000 1.,2 03"~.1
Cr ..... b .. th r.t. {per 1000 populo.ioa} 1995-20OO 21.1 03{79.1
Crud. dotb r.te (po. 1000 population' 199>-2000 S.9 0,,79.1
Rate of a.atura! incl' .... ~l ptlr ana ... , 1'''-2000 1.52 0317,,1
13, Per C.p'" G~o •• N.uon.l Pro<luct (ClIP) at •• rket pric.. (US,) 1984 1 994 or 13/85
(Ml) 4 68S
I., Rot. of ,rowt. o. per t.p". GNP (X) 1'.2 5 •• 12/84
IS, 'ercent .. e Gro •• eo.e.tic Product (CD~) derived from .. n~facturina at con.tant factor co.t (I) 1980 20.5 14/81
l., ,"cOno.lcalJy ae.tlve pop &.0 pn .. l')' .eetOl' .
- Nu ... r .n .,r,culture ('000) 1980 2 21_ u>,ou
- y.rcant 1n .,rlculture \~I ... u 01,0 ">/OU
1. Daily per capita calorle aupply {cUoue.} 1983 2 000 1318)
18. Datly per .eplta protein .upply (ar ... 1 .. , 10. Adult hter.c)' rate - ToUl l.lIO R~~6 13/85
- *1e u-sa; - '.Mle U-14, R-59
FO. Health bud.et/expenditure
- AItouat (11$ ) 1984 1 101 810 440 12184
- Per capua ("'). 1984 72 ...... 12/84
- A. % of total bud,.t 1984 4 12/84
Offic:.id Ixchance Rate: US.}.OO· Hi 2~.l (984) U - Urbani R - Rural *Offieial Population I ••• not Av«ilable.
**'eninauler Haley.ie only ***8 ••• d on •• ti.-ted population u.inl the .rowrh I".t. of th. 1980 population cen.u ••
Sou'ree 13/8S~
0317'.1:
03/80: 06/81 :
10/82 12/83 12/84 14/81
Govern.ent'. Report Oft IV41u.tinl Prolrea. in l.pL ... ntinl the Strateaie. for ae.lth for All by the Year 2000, 198~ WOTld Population Trend. and Pro.~ct. by Country 19So-2000: S~ry Report of the 1978 A ....... nt. UN 1979 rAO Production Y.arbook 1980 Cov.r~nt'. Reply to Cu.ulativ. Tot.le ot C •••• aDd Death. fro. 18 Selected bi •••••• for the Y •• r_ 1983-84 and up to July 198~ 1982 IICAP Population O.t. Sheet Country He.lth lafo~tion Protile (CHI') revi •• d by CQv~r~entl 1983 Country He.lth Informatioo Profile (CHIP) revi •• d by Covern.eot. 1984 Xey Indicator. of Oevelopina ~.b.r Countri •• of ADa, April 1981
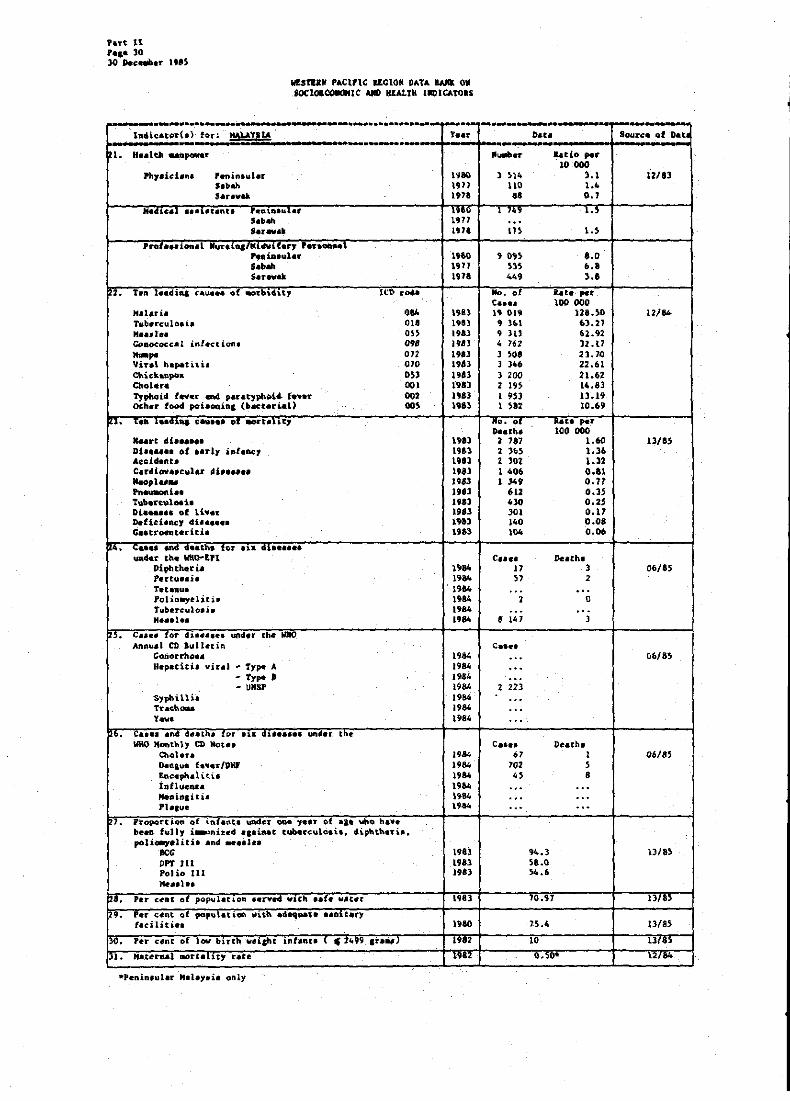
Put n ,.,. 3Q 10 Dec .... r ttlS
Wlstl'H 'ACI'IC lEGION DATA IAIK OM SQCIOICOldtlC AltO KULt1I. UIOICATQIS
~ ................... --. • . --._ ........ _-- --- ---_._-r--In,ic.tor(.> for: Ml.\'rIU Year D"tII Sourc. of Oat .- -_._ ... _- ---I. Health .... poIIN.l: .-... .. tio ,.1'
10000 Pla:r.ichn. 'enin.ul.r .. 80 ) ". 3.1 12/83
,.bah 19)) 110 I.' Sar.vu 191. .. 0.'
HaGlC.' ••• iIIltant. -: •• uaa",la., ::;~ 1 , •• I.'
'abah ... Sar.a. 1.911 '" I.>
'n,. .. lon..l .U'UUI't~l~'t.C',. fen ... ' PealD.aul ... .,"" , o,~ 8.0 .. bah 1911 ", b.B SerWAk 191& 4'9 l.t
•• r.n l •• diaa (_~ ••• of _"built1 lCD t04. No. 0' R.t. ,. .. C •• e. 100 000
H.tari. .... I'll l' 019 12B.50 12/84 Tub"re-ulo.'. Ot. 19S) • )6.1 6).2' ..... 1 •• 0» l.ll 9 JU 62.92 ~~occ.l inIaction. .'B )9o!1 " 762 ll.t? -po 072 1981 1 ~o, 21.10 \lin' "epatil" .'0 1941 1 l66 22.61 Chick.enpox .» 1941 ) 200 21.62 Q;olua 001 19a1 2 I9S 14.83 Typhoi.d. filY.r aM pnat,phoi.tL. f ...... 00' 198) 1 9SJ ll.19 O,h.r food poiaonift, (bactartal) .. , 19.) 1 ~82 10.69 .,. L •• , •• d1 .. c ..... OIl .ort.Uq. ~D. ~, ~~t. per
Deach. 100 000 Kurt _" •••••• l"al '2 787 t.60 13/8.5 Dh ..... of early iltt.DCI' 19a1 '2 '6S 1.36 Acciddt. t981 1 30t 1.32 Cal'diov .. culu di ...... 1983 1406 O.al "'0,1., .. Ull 1 "'9 0.11 I'nau.ol'll •• 19U 6U 0~3S
T.,.n\JIlod. 19a1 61. 0.2' DL ...... of li~." 1983 JOI 0.17 Defiel.ftC, di •••••• I'll 14. 0.0' c..troeat.ritia 19&3 104 0.06
14. c; •••• ~ ~~ •• t~~_for UK dte ••••• under the wac-Irl C .... De.th.
Diphtherial 1984 17 , 06/85 P.rtuui. 1984 " 2 Tetenull 1984 ... ... Folio.-y~l:i.ti. 19M 2 0 tuberculo.i. 19" ... . .. M •• IIle. 1984 • 147 J ,. c •••• lor di.~ •••• und".. the WHO
AnRual CD lulletin c •••• Conort'ho •• 19 .. .. , 06/3S Hepatitb viral .. Type A 19 .. .' ,
- ty .. , 1984 , .. -- UNSP I'" 2 223
s,phillill "54 ... Trac:ha.a I'" ... y-. 198/0 . ..
~o. ~a.a. and ~.ath. lor • u; al •••••• undar th • Death. WHO Monthly t1) Mot .. C ••••
0.01,,1'. " .. ., I 06/8S D.nl~ f ••• r/Otil I." '.2 , Eftc.ph_titi. t'"
., • hlllle ... _ 1914 ' .. ... ".ai"litie \984 .,. .. , Pt.,UII 1984 .. . ...
1. PrO\JOrtion of i.ft~.ut. URdu one .,..1' o-f .a_ ""0 na". be.ll- fully i~niud .,.iMt t"l:cu1oai •• 'iphthni •• poli~liti. and .... 1 ••
ICG 1983 94.' 13/85 DPI' III 1983 S8.0 Pol io III 198) >4.' Me ... h.
,.. Por C",ftC of pop'-ll.uon •• r." With •• f. w.c.r 1981 "o.n 1,,8>
9. Per c."'nt at pa,~d.tioa .no th •• ~ .. te nIDI Cu), taci Uti •• 19"" 15.4 13/85
lO. reI' c.nt of low bil'ch w"pc ,nh"ra ( .. 11099 Ira") ".2 10 ll,., 1. .... t",ns.al 1IOt'~.lIt' r.~e "I> .. , .. t2/14
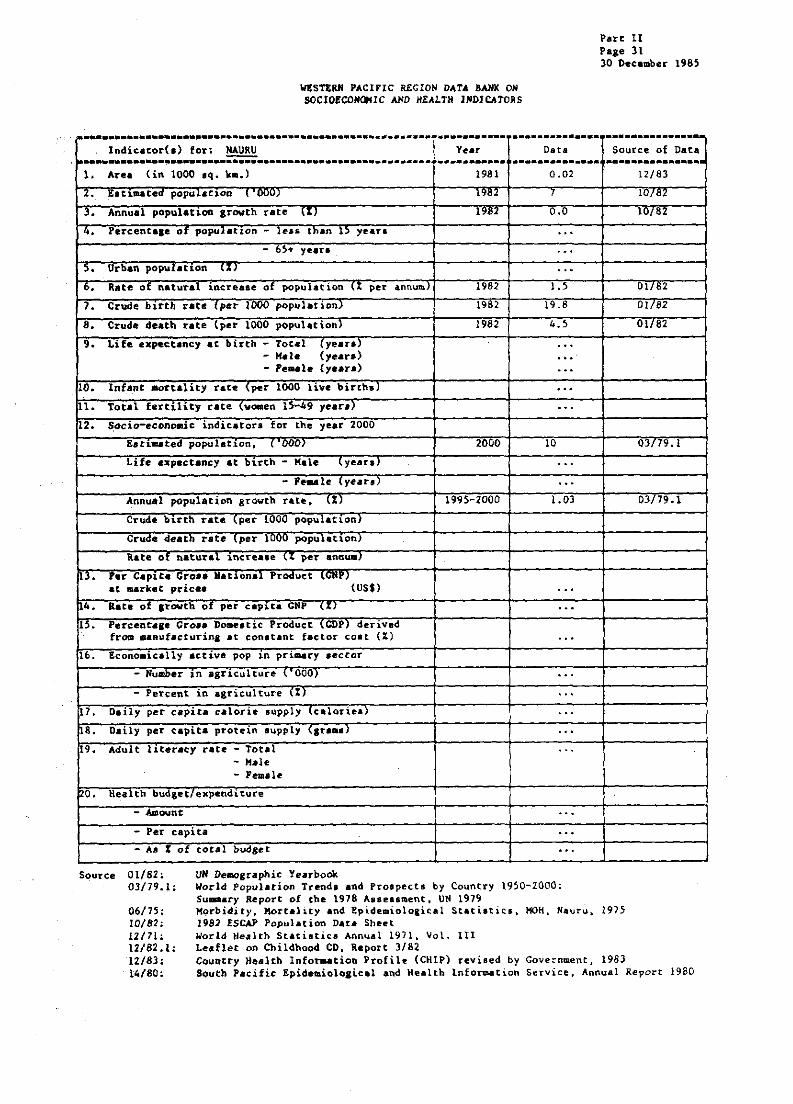
~STERH PACIFIC RECION DATA 8~ ON SOCIOfCOHOKIC AND HEALTH IHDlCATOiS
--•...•...... --.... ~ ............. -.-.-.-•....... -.-.....•.......•.... ............•. . Jndicacod,) fol'o NAURU 1 Year Data
. ~ .......... -.. ~ ...... -.. ;;;;; .... --.. -.-...... -.-.... --.- .....•..... .............. L Area (in 1000 .q. k •• ) 1981 0.02
I ". EaU.matea popuLatlon (. VOU) 1982 7
I 3. Annual popul_t10B growth rate tl) 1982 0.0
I 4. Percent_Ie of populatlon - leu· than 15 ),e.ra ... - 6~. yean · ..
" urban pOpulation .. , ... I b. Rate of natural inc:r~a8e of population (X per a.nnum) 1982 1.5
7. Crude bu·th rote (pn 1000 populo" •• ) 1982 19.8
8. Crude deatb rate (per 1000 popul.tion) 1982 4.5
9. Life expectancy at birth - Total (Y""') ... - Hale (year.) ... - Pe .. le (y •• r.) · ..
10. Infant aortality rate (per 1000 live birth.) ... n. Total fertility rate (women 15-49 ye.,,) · .. 2. S;ocio-econo.ic indicators f.T the yea&" 2000
E.t~ .. ted populatlon. ( 000) 2000 10
Life .xpeetancy at birth - Hale lyear.J · .. - Fe_Ie lyear,Y ...
Annual population growth rate. eZ) 1995-2000 1.03
Crude: buth rate \per 1000 populauonJ
Crude death rate \per lUQU populaUonJ
Rate of natural l.ncreau (% l>et' anaUID)
~3. rer Captt. Gro •• National Product lGMP). at market pric.a (US$) .. ,
1,4. a.te of I't'owth of per capl.ta GNP (X) · .. 15. Percenta,e Cro •• J)oae.tic Product (CDP) derived
tro. manufacturina at conatant factor coat (%) .. , 16. Econoaically active pop 1n primary .ector
- Number In agriculture (.' 000) ... - Percent in agriculture (%) ...
17. Daily peT capita calorie supply \caloriea) ... 8. naily peT c:apita pt'otein supply (Ira •• ) ...
19. Adult llter.cy rate - Total ... - H .. le ... Female
O. Health bud,et/expendlture
- Amount '"
- Per capita ... - A. % ot caul 't>udget . ..
UN DeDO&raphic Yearbook SOUTce 01/82: 03/79.1; World Population Trend. and Pro.peets by Country 1950-2000;
Su ... ry Report of the 1978 A.8e •• ~ent, UN 1979
Part 11 Page 31 30 Oecembe&" 1985
. ............... Sou&"ce of Daca
. ................ 12/83
I07lf2
10/82
01/82
01/82
Ofr82
03/79.1
03/79.1
06/75 ; 10182; 12/71; 12/82.1; 12183; 14180;
Morbidity. Mortality and !pide~iolo&ical St.ti.ti~a. MOH, Nauru, 1915 1982 ESCAP PopulAtion D.r. She~t World Health Stari.tics Annual 1911, Vot. 111 Le4fl~t on Child~ood CD, Report 3/82 Country aealth Infor..tion Profile (CHIP) revised by Gove:nment. 1983 South Pacific Epidemioloaic:.l and Health Inform.tion Service, Annual Report 1980

P ... t U Pa,. 32 30 Dec''''''' 1985
WES~RN PACIFIC RECION DATA RANK ON SOCIOECONOMIC AND HEALTH INDICATORS
~ ................. -................. -........... -•.......•..... -.~.-- .............. -........... Indicatod.) for; NAURU 'lear Dat .. ....................... ;;;;; .................................. ~ ... _- ..........................
1. Keal th manpower N\lIDber btio per 10 000
Phyaician. 19H 10 14.3 Medical •• ti.t.nte 1971 ... Prof ••• ionel Mu~'i .. /Midwif.Tl rara01\l\al 1971 9 12.9 ... un I •• din, .'U." of .0rbUlty ICD cod. 11<>. of Rat. ,.~
C •• e. laO 000 Denlue 061 1980 538 1 310 Gonorrhoea 098 1980 51 699 Hepatitis, vir.l type B 070. ) 1980 42 51S Heaalell 055 1980 10 131 Syphilia 090-097 1980 8 110 Shigellosis 004 1980 6 82 Conjunctiviti •. 372 1980 5 68 Fiah pohoniDJ ~S.2 1980 5 68 Hepatitis) viral type A 010.1 1980 • 59 Salaonella infection Cother than typhoid) 003 1980 I 14
3. Ten l.adina cau ••• of .ort.lity leo code No. of Rat_ per D.ath. 100 000
CarcSiova.cul.,. db •••• A.0-A88 1974 II 151 Injury ANll8-ANISO 1974 10 143 senility All6 1914 l 4l Di.e •• e. of re.piretory .y.t .. A89-A9~ 1974 2 29 Bacteri.l ipf.ction AS-All 1974 2 29 niabet •• ~llitu. A64 1974 2 29
4. ~ •••• and d •• th.~for .b: du ..... und.r tho WHO-EPI C •••• De.th.
Diphtheri. 1982 - -Pertu •• h 1982 - -Tet.nu. 1982 - -Poliomyel1ti. 1982 - -Tub.reulo,i. 1982 8 -He .... le. 1982 1 -
~,. C •• es for dll ••• e, under the WHO Annual CD Bulletin Ca.e.
Gonorrhoe. 1980 50 Hep.titi. vir.l - Typ" A 1980 4
- Type S 1980 42 - UNSP 1980 ...
Syphillit 1980 8 Tr.chom. 1980 ... y,,,. 1980 -
26. Cases and de.tba fol' aur; dUe ..... under the WHO Monthly CD Notell Cues Death.
Choler. 1980 - -Denlue fever/DllF 1980 518 '" Eneephaliti. 1980 - -Influenza 1980 - -Meninaiti. 1980 - -Plague 1980 - -
7. Proportion of infant. under one year of .,. who have been fully i-.uni&ed a •• inlt tube-reulo.i., diphtheri<l, poliomyelitis and .... le.
BCG DPT III ... Polio 111 Kea.lea
8. Per ~ent of popul.tlon .erved WIth a.t. water ... 9. Per CeDlt of populatiOll with .dequ.te •• nltery
hc;.ilitie. ... pO. Per cent 01 low birth weicht (nfont. \ ,2499 ara_1 . .. pl. Maternal morUl1ty rate ...
.._---_ .. Source of Oat. .. _-----
12/71
14/80
06175
12/82.1
14/80
14/80
.

WESTEaM PACIFIC REGION DATA BANK ON SOCIOECONOMIC AND HEALTH I~DICATOaS
Pert II Page 33 30 December 1985
....... _ ..... _ .. _ .. __ ....... _ .. _.--.... _ ....... --_._- ....... _._ .. ._--_ ........... Indie.to~(.) for: WEW C4L£DO"LA Year Dat. Source of Data ........... _ ............................................. ............ . ...... - ...... --...........•.
I. Area (in IOOOoq. ~.) 1983 19.103 12/85
2. Bltl.aate:d populatl.on (Ooo) 1983 145.364 13/85
3. Annu.l popullt10ft .r~th raU (l) 1983 l.l 13/8>
". rercant&le 01" pop'''.CLOD - , ••• tnan .I'> y •• r. ... , J .... u/., - 6S. yean 1983 6.2 12/85
,. Urban pOpulOt1.. \Xl I •• J , •• > 121"
6. ltate of natural increa •• of populotion II per annUlI) 1983 2.09 13185
I. ~.uo. o .. t. rat. !por .uuu popu •• non, ... , "c." .2,.,
•• Crud. d'ath .. t. (per 1000 popuhuonl 1 •• , 5.8 !lIS>
•• 101u expectancy at •• rto - Tot.. 'y.a .. ) I.,. ... IJ/O' - H.le (y.ar,> 60.8 - Fe .. l. (y.ar.) 66.8
10. Infant IaOrtllity rate (pel' 1000 liv. birth_) 1982 21.9 13185 '11. Toto! futility .au Iv.-n 1>-" y.aral · .. 1< • Soelo-eCortOalC 1ftdloCator. ror th. ,..ar 20uO
11t1 .. ted populauon. I 'OOUJ 2000 282 OJ{79.1
Life expeetaacy at blrth - Kale Iye.nl · .. - Femal. IY ••• II · ..
Annual populat1on growth rate. (XI 1'9'-2000 2.4. OJ179.1
Crude b1rth rat~ \per 10uO populatLonJ · .. Crude deeth rate (per 1000 -popul.tion) · .. Rate. ot natural lncrea,e (l" per an.num) · ..
13. Per Cap1ta Cra.. D~.tlc Produet {CDP} at .arket price. (US.) 1983 S 3'9 Or' 12/aS
(Franca CFP) 914 4~3.29
114 • Rot. of ,rowth of per cap'" CD> 1%) 1981-1 •• , ~.9 ~1982 12185 5.7 (1983
115. .fer-cent«se firo.' Do-me.t1C. PrOduct lCDP, denve4 fro. manufacturina at con.tant faetor COlt (X) · ..
116 • !cono.lCally • ctl.ve pop in prl"ry _ector
- Nu"" 1R a,r1culture \"UUUJ .. -- Percent in agriculture l%J .. -
17. Daily per capita calorie .upply {calorie.) ... 18. Dail)' pe. c.apita protein .upply (,1' •• ') .., I •. Adult llttrr4:cy r.te - Tot"J 19'J 92 13/85
- Male 93 - Fe .. le 91
O. Hedth budlet/expenditure
- Mount (F. eFP) 1982 1 622 990 000 12/83.1
- Pet' capi ta IF. CH) 1982 10 966 12/83.1
- .... % of toto' .udget .. ., 1.21 12)oJ.l
Offici.l Exchange rate. ust 1.00· P. CFP 110.00433 (1982)
Source 1318S:
03/79.1:
12/83: 12/83.1:
12/8S:
14/80:
Governaent's Report on Ev.1uacing Progre •• in Implementing Strategy for Health for All by tbe Y ... r 2000. l-98~ World Population Trend. And Pro.peen -by Country 1951)-2000: S~ry R&pcrr of tbe 1978 A.,e.sment. UN 1979 Country Health InfQ~tion Profile (CHIP) revised by Government. 1980 and 1983 S~ry Report on ~e.lth Activities Carried Out in Nev Caledonia and Dependencies in 1982 (34th kegional Coamlttee Meeting. 1983) Country Health Infor.ation Profile (CHIP) reviaed by Dr Petrinsky (WHO Consult.nc), 1985 South Pacific Epide.iololical and Health Infor.ation Service Annual Report, 1980

'.rt 11 h." 34 30 OocoDbo. 1985
~sTla~ PACIFIC REGION DATA BAMK ON SOCIOICOIlClllIC ~ HULTH INDICATORS
Indicato~(a) for; Year
Health manpowe'C'
Pby.ician. 1983 Medical ••• i.t.Qt. 1983 Prof"liOGal NUl'tiA.IHidW'ifery P4!rlonnel 19U
Acute re.piratory iat.ctiona 1983 InfectidUa .Ad paraaiti,C:: db ..... 1983 Injury and poi.onina 19U Di ••• , •• of the Q.rYOU' aYlt .. and a.n,. orlan, 1983 Di.order. of .kin aDd auhcutaneoua layera 1983 ni, ••••• of 4ll~.~i.".1.t .. 1983
Car.4iov.'C:Uolar di .... '. 390-459. 1982 Iuju~y and ~oi.oaina 800-999 1982 Tuaoro 140-239 1982 Db •• ,.a of the die •• eive, .,.n .. 520-519 1982 ••• pi.racor), dh ••••• 46o-S19 1982
under t~. NHO-EPI Diphtheri. 1984 Pertuui. 1984 ret",u. ~984 Poli_yaliti. 1984 Tubercula. iI 1984 Meaale. 1984
Annual CD Bulletin ConorThoea 1984 Hepatiti' viral - Type A 1984
- Typ •• 1984 - UllSP 1984
Syphili. ·1984 Tr ... ch~ 1984 Yaw. 1984
WHO Monthly CD Hot •• Cholera 1980 nengue ffWer/DIfF 1980 Encttphaliti. 1980 Influenza 1980 Meninliti. U80 PI_SUoe 1980
been fully i .. uni.ed .,aia.t ~61i~eliti. and •••• le. 1983
BCC DPT III Polio III Mtta.lelf
• 6, •• ra.old
Data Source of
Number Rat~o per 10 000
95 6.6 13/8~
350 Z4.1
por C •••• 100000
13/a~
13/85
C •• e. D •• th. 0 13/85 9 3 0 ...
112 19
Ca ••• ~ 13/85
714,
C •••• n.ath. 0 0 14/80
631
274 2 0 0
98* 13/8S

WIlT!," PACIFIC REGION DATA IAN¥ OM IOCIOECO_IC AMD HULTM IMDlCATORS
lndicator(.) for: Yu:r
I. Are. (i. 1000 .q ..... ) 1981
<. r-r •• _ "uw' TII!4
J. ....nu.1 r a.OIIth ute (1) 1984
•• 01 POPUUttOR .... Ch.n l) y ... s 1982
- 65- ye ... 1'82
,. UrD.n :lOR ,., \'81
6. Ra .. of of (1 per ann",,) 1984
7. Crude birth .. to (per lOaD tio.) 1984
8. Crude d .... rat. \ par lOUIJ popul.uonl 1984
,. LifO up.ct.ncy at buth - Total '~"rI) 1983 .. Mal. (y •• n) - F ... l. (year.>
,10. InUnt ... '" raCO (pe. 1000 liv. birthsl T98J
11, Total fortUity •• te \v_n 15-49 y .... ) 19-82
.12. for the y ... 2000
popu . ( '000) 2000
!.U. • t birth - M.I. (y .... )
- F ... ,. Iyens) l'
Annu.l popul.tion Irowth rate, (1) 1995-2000
Cruel. birth •• te (per 1000 pOpUl
,crude " •• th rate (per 1.000
... te 0' ." .. ra, • , .. ••• \1 par .nnUIII) 1'95-2000
lJ. .er C.~'" Ii~O" ,<ill.} (US$) at .. rket prle •• 1984 (HZ.)
14. R.te of Irowth of per cepite GMP II) 179
IS. .-"' ..... :~~, "ro.~ .. : •• _ .... ".n~·f~c~~P) "'Ii)' 16. • ctive pop in •• ctor
- Mu.ber in ••• \ . 000) 1980
- In ••• I~) -1m 117. D811Y per c.p,u IUPP'Y \CUOU .. / 1981
18. .auy per cO]>1<. r lupply llU'" 1981
n. Adult 1l '1 raCO - Tot •• 1982 - Hale - Female
20. Health .. , "ure
- AIIIou., (M2$) 1981
- Por «pito (NZ$) 1981
- A. ~ o' total-budl"' 1981
Officiol Exchanc •• oto' US. 1.00· M2. 2.04 (1984)
Dua
269.06 --, l)~
1.1
26.3
,1).0
-g).6
0.76
16.1
8.5
... 10.8 76.9
12.54
2.0
4 027
71.0
78.2
0.92
16.0
S.I
0.79
5 000 or 10 200
0.5
... US
9.3
3 119
97
80-97 .. , ...
1 3S0.2iD
.21.0
12.1
Part II P ••• 35 30 D.c •• ber 1985
Source of Data
12/83 -un, 13/85
10182
10/82
12/83
1:J785
13/85
13/85
13/85
13185
10/82
03/79.1
03/79.1
03/19.1
03/79.1
03179.1
03/19.1
03/79.1
13/85
07/S1
03/S0
·OTrso 13/85
13/85
11185
12/03
12/0.
12183
Sourc. 13/85: Government', aeport on Ivaluatina Progre •• in l.plementing the Strateaie. tor He.lth for All by the Ye.r 2000, 1985
03/19.1:
03/80: 06/85:
07181 : 10/82: 12/83,
World Popul_tion Trend. and Pro.pecta by Country 19S0-2000: Su..ary aeport of thl 1978 A' •• llnent, UN, 1919 FAD Production Yearbook 1980 Govern.ent', aeply to Cuaulative Tot41s of C •• e. and Death. froa 18 Selected Di •• a.e. for th. Yeara 1983-84 and up to July 1985 1981 World Sank Atla. 1982 ESCAP Populotion D.,. Sheet Country H •• lth Info~tion Profile (CHIP) revil.d by Covern.ent. 1983

Part II P.ge 36 30 Decemb •• 198'
WESTERJI PACUIC RECION DATA BANX ON SOCIOECONOMIC AJID HIALTH IHDICATOas
......... ---.~ ..................................... -.. --......... ~--... .......................................... Indic;ator(e) for: NmI ZULAJID ' .. ar Data Source of Dat .............. --.......... '. . ................................ lOa ••••• . .......................... r..-------
21. Health .. npower HuM.r Ratio per 10 000
Pby. ic ian. 1982 5 210 16.4 12/83 Medical ••• iltantl Pcof ••• ioaal Mur.iftlfKidvife~y Pel'aOftn.l
2 •• C.y ••• of ..... diey .ft publ.c hO.pl •• I. No. of Rat. per C •••• 100 000
Complication. of precnancy, childbirth 1983 70 818 2 211.0 13/85 and the puer,.ri~
Ha1i,naDt ncop1 .... 1983 24 437 762.9 Reepiratory di ...... 1983 20 088 627.2
,
Arthritic di .... e. 1983 15 393 480.6 lachaemic h.art di •••• e 1983 13 221 412.8
23. LeadlDS t.u •• e of .ort.hty No. of Rate peT De.th_ 100 000
lachae.ic heart di •••••• 1982 7 301 230.6 13/85 Malilnant neopl .... 1982 5 724 lBO.8 C.r.b~ov •• cul.r di .... e 1982 2 806 . 88.6 aeapir.tory di ••••• 1982 2 602 82.2 Pneuaoni. and influenca 1982 1 090 34.4
24. Ca... and d .. tb. for .i:ll dl ••••••
•
undo. tho WRO-IPI C •••• D.atb. Diphtheria 1984 2 06/85 Pertu,.h 1984 . · .. . .. Tetanu.t U84 7
,
poliOll,eliti. 1984 · .. ... 'ruberc::ulo.ie 1984 404 5 ;
H~ .. le. 1984 · .. · .. 125 • C •••••• rdi .... !. under tho WHO •
Annual CD Bulletin C .. e. Gouo'C'rho.& 1984 1 748 06/85 Kepatith viral - Typo A 1984 539
- Typo I 1984 609 - UNSP 1984 124
Syphillh 1984 77 'fl'ac:hOllll 1984 · .. Y.w. 1984 . ..
~ .. C ..... nd de.the for 81. dL •••••• und.r tho WHO Monthly CD Hot •• c •••• Death.
Choleta 1984 · .. . .. 06/85 Denau. fever/DHl 1984 1 " . Eneeph.liti. 19B. · .. · .. Influenza 1984 · .-. · .. "enin,iti. 1984 34 3 PI·aue 1980 · .. · ..
7. Proportion of infante under Ode y •• r of ace who h.ve been fully i .. unized .,ain.t tuberculo.i., diphth.ria. poliomyeliti. and .... le.
BCC 1983 · .. 13/85 DPT III 1983 73.68 Polio III 1983 71.90 Me •• le. 1983 71.33
Z&. Per c-ent 01 populatlO111 •• rved with a.f. vater -- 1'84 100 Uf8S
". Fer cent of poPulatioa vlth .dequat ••• nltary facilities 1984 88 13/85
lO. Per cent of low birth weiaht inf.n •• I .: 2499 IU") 1.82 5.2 13/85
Ill. Hat .. rn.l • orUhty r.tee U8 • 1 •• 1l/8S
1

WESTIaN PACIPIC REGION DATA BANK ON SOCIOEOONOMIC AND HEALTH INDICATORS
Part II p .. ge 37 30 ~c:eaber 1985
~ ..... -........ -............. -.-.. --........ -.--.. -............ ------ ._ ..... _--~---..
IndicatorC.> for. !!!!!! Year Oata Source of Dat ~ ................ --..... ------.. ----............. -.... -.. _ ..... -_ .. . •........ -.- ---_.-
I. Ar.. (in 1000 .q. kM.) 1961 0.26
2. Eltuutea pOpUlation ( '000) 1982 J
3. Annual populetlOft Irowth rate 1%1 IY.2 -J.I
4. Percenta,e of popu1aUon - le.. than n year. lY.2 46.1
- 05+ year. ly., 6.b
,. Urban popUlet.o. ~., hou 2u.7
6. Rate of natur.l ~ncre •• e of populat ion (1 pn ann\Jal) 1980 2.3
7. Crude blrth r.t. {per 1000 populoClonll960 1980 30.3
8. Crude death rat. (p.r 1000 populatlon) lY.O 7.J
•• Llte expectancy at blrth - To~.l \y •• raJ ... Ow Hala (y.au) ... - , ... 1. (y •• r.> ...
10. Infant eortaUty rato Ipor 1000 liv. birth.1 . .. 1,1. Total fortillty rU. ~w_n 1)-49 y .... , ... 12. Socio-econoaic indicatora for the y.ar 2000
Eau .. tea popu,atl0t'l, ,. UW) 2000 7
Lifa expectancy at blrth - ~1. ~Y"U} ... - Pa .... ,y .... , .. ,
Annual population growth r.te, ,;, 1995-2000 1.11
Crude bi.rth rote ~ per lUUO popul.uonl ... Cl'ude death rate \per 1000 populauon) ... aate or natu.ra" lncrea.e \4 per annWDJ ...
,,3. Per Capita C~o •• National Product (CNP) at market prica. (USS) ...
,~. '-bte ot .,"ovth or: per capu. eNP UJ . .. 1). Percenta,. Gro •• Do.a.tie Product lCD') d..rived.
from .. n~f.cturin, at eon.tant factor co.t (I) ... 16. &coftOGlcally actlvI pop in primary .ector
- Hu.er 1n aarlCu}ture \ 'UUU} ... . - Percent In agrlculture (%) ...
1'" DOllY per caplt. caloru 'UPP'Y \CaIOrlea) ... ~8. Daily per capita protein lupply ~lr,"J ... ",. Adult llUr .. cy rate - Total ...
- Male - FUUlle
O. Health budget/expenditure
- Amount 1M2., 1.71-1~78 402 428
- Per capita (NU) 1971-1978 100.6
- ~ % of total budS" ... Officiol Exchong. rot.: U5$1.00· NZ.l.02 (1979)
Source 03179.1: World Population Tread. and Pro_pectl by Country 1950-2000; Sw.mary Report of the 1978 A •• e •• eent, UN 1979
12/83
IUI.2
101.2
10/82
10/82
u3/19
101.2
10/82
10/82
03179.1
03179.1
06{79
06179
03179: 06/79: 10/82: 12180:
Urban. Rural and City Population. 1950-2000, ., AM.e,.ed in 1978, UN, 1979 a.ti~te. of Expenditure and Reve"ue 1978179, Niue
12/ao: 12181 :
12/82.1: 12/82.2, 12183:
1982 ESCAr Population Data Sheet Government Respons.s to World Health Stati.tics Annual Questionnaire on Health Manpower, 1980 Covern_ent Reporta on the N~er of Ca.e. of CD. Govern.ent Responles to World Health St.ti.ti~. Annual Que.tionnai~e on Certain Causes of Infectious and Parasitic Di.e •• es~ and on N~.her of De_tha by Cau •• Leaflet on Chi14hood CD, Report 3/82 Government's Reply to !PI Health Info~tion System QueBtionn.ire, 1982 Country Health Infor.ation Profile (CHIP) revised by Government, 1983

'an 11 ,.,. 38 30 o.ce.b.~ 1915
iEStIRJI ,,,,el'le RlCtOI Dl.1'A JANJ otI SOCIOlOOIOUC AIID 1tUJ.'fII tltOlCAtoas
r" .............................................. ladie.tOT(.> fon !!!!! , ...
r··---·-·-----~--.. -·-.. ". Meal th ""power
",y.ieian. 1;910 Me4!tal a,.i,tante 19110 Prof ••• ion,l Nur.in,/Midwifery rct'acm.oIt 1 "10
22. T.n l •• dlll' caue" 01 .,tPld't, (.cO ,od.
l\\fl~",". .87 1980 I.t •• tinal para,iti'. un.,.cifi~ ,,9 1980 •• a.1., 0" 1980 St~.ptococ¢.L .ora thyo.t .Dd .cal'hti. ... 0)4 1910 Chic .... ,. 0" "10 Gonocoec.l ial.ction 0" 1980 Vb.t h.palhb .7. 1980 Other foo4 poilonin, ("'acc.rial) OOS 1980 wpro., 0)0 .. 80 Meaiaaococcal int.ctio. 016 I." Meai.,iti. due to .nt.roviru. "7 "10 Fil.ri.l i~factiOQ .nd 4racooti •• i. US .. 80
". t'o ladl." taue. Clf lII.ona1.uy
'.e'*"lia 1919 [nfluaQ&a. au..i •• 19" Cer.bro-va.culat di ••••• 1919 Acci4ent-drOVdin, 1979 c..tro eatarici. 191' N.op .... 1919 a.art failure 1979 IrOllChitia 191' ... '- 19" upt.1xia 1979 A.candiD, ttanaver ••• ,.litis 1919 Pel'itoaith 1919 _ ..
1979-Diab.t •••• 11itu. 1979 CuD.hot wound of ch.at 1979 "oto~~.hiel. a~ci4.nt- (;1'\iah i ... j~ry of cheat 1.19
,". C •••• ad du.th. for .b 4i. ....... under the WHO-IPI
J)i~tb.ri. 1912 Pertu .. i. 19&2 taeanutl 1982 roHa.yeliti. '98' Tuberculo.i. 1n2 N .. ,l •• " ..
S. C .... tor di! ..... VIi"'." the UNO .
M\au.l CD· hl.luia Cc:inorriUJ •• ,.80 " .. aeit'" vir.l - Ty ... 1980
- Ty .. , "10 - UIIIP 1980
Syphilli. 1980 l't'acho.a "80 .... 1980
•• C.... .nd death. for al. d ••••••• UDder th. WHO Monthly CD "o~as
Choler. 1910 DeD&u, feYer/DHF 1980 Ecl.uphal it.h 198(l
Intl'uenu 1980 HeDin,iti' 1980. PI.Sua 1910
7. Propottion of inf.nt. uftder ona ,.ar of a.a Who b,ve b ... fully i~ni •• d ',sinat tubercu.oaia. diphthat'a. polioayaliti •• nd .... 1 ••
ICC 1911 OPT [ll 1982 Polio 111 1981 "fla.l ••
~8~ 'ar cent ox populauon ,aaryad vuh •• f. vat ... - urban - '-101".1
•• h:r cant of populatioa with .~~t • •• nitary f"iUti. •• .
O. Per ClBftt of low birth vei,ht: inhnt. ( ,2499 ,ra .. ) S. Nateraal ItOrtalu,. rat. ..
.,
- .... Sourca of D., • -_ ... -. luio PH 10000 , 6.7 12'80 ...
" ".7
Mo. of bu ptlt Ca'''' 100 000
8.0 21 2111 12/81 oS 2945 ., 651
" 4,.
II 141
• .n ) 93
• 62 1 )l
I 1I 1 31 1 II
Ito. ~f lau ,.1' Deeth.. 100 000
• 108 12/81 ) ., , 54
• 54 I 21 1 21 I '1 I 21 1 21 1 21 I 11 1 21 1 .1 I '1 1 21 I '1
C •••• Death. '" ... 1218' .. . ... ... . .. ... ... ,. . .. - -
Ca ••• I 11180 1 ---... -
Ca. II. Deatb. - - 12/&0
U. • - -6 •• -
1 I ... ...
100 12/82.2 7.S
79.1
... ...
. ..
... '"
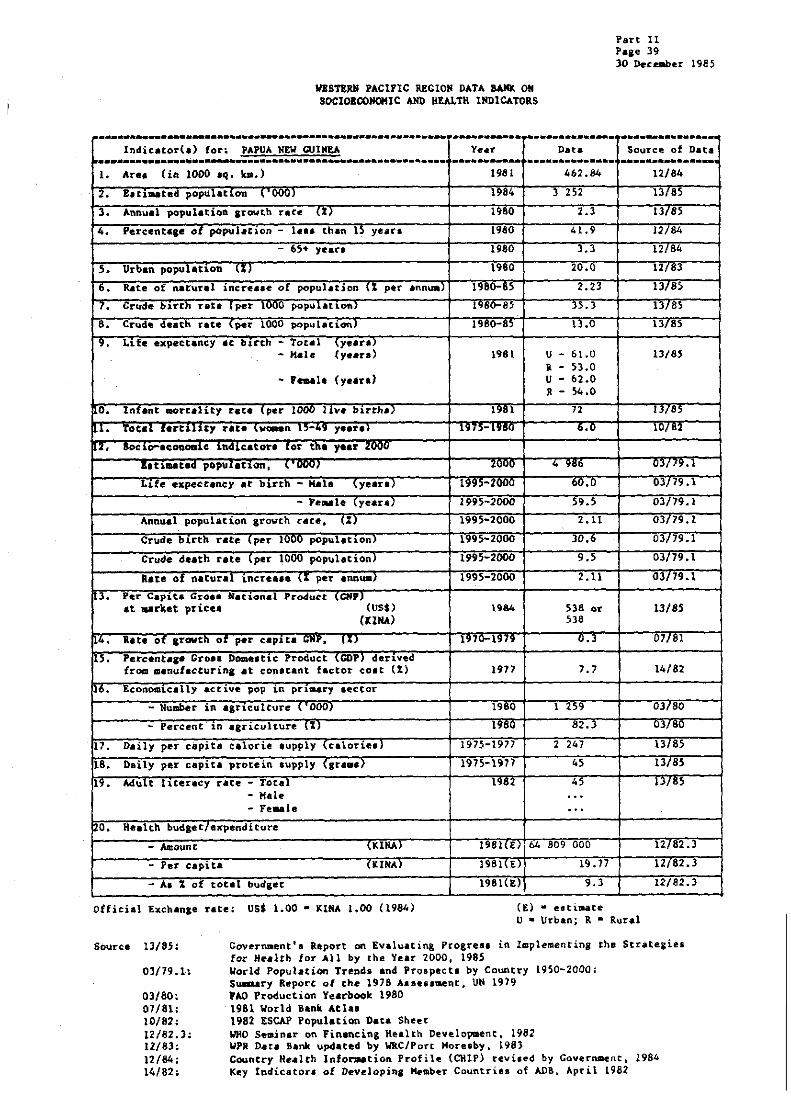
W1STERN PACIFIC REGION DATA BANK OM SOCIoaCONOMIC ANn HEALTH INDICATORS
Part II Pale 39 30 Decaaber 1985
..... -............... _ ........ _ ..... _---...... _---_ ..... ----.. ---.. ,.-.--.... -.~ ..... --......... Indic.to~(.) for. PAPUA NEW GUINEA Ye.r Data Source of Data ....................................................... -.. _---- ...... _ •...... ...... _ ......
1. An« (in 1000 aq. k».) 1981 462.84 12/84
2. EUlIutod populatlon 1'000) 1984 3 252 13185
i J. Annual population Irowth raCe (l) 1980 2.3 13/85
4. Percent«,e of pepul.Clon - leu than 1) years 1980 41.9 12184
- 650+ yean 1980 3.3 12184
5. Urban populaU.oll (X) 1960 20.0 lUB)
6. Rate of narural increa.e of populotion (1 per annua) 1980-85 2.23 13/85
7. Crude bIrth rate lper lUOU popuUtlonJ 1,"0-85 35.3 13185
8. Crude death rate (per 1000 populationl 1980-., !J.O 13/85
9. L1fe expectancy at birth - Total ~ye.ra! - Hale (y •• r.) 198\ U - 61.0 13185
a - 53.0 - , ... le (yu .. ) u - 62.0
a - 54.0
O. Infant .ortality r.t. (per lDOO I,n birth.) 1.01 72 u,85
u. roe .. rutu .. , .... \ .. -.n ,,-•• y"'01 ''''-1'80 6.0 10/02
U. .oc " .... ooo .. 1c 11\410.to.. [0' tho y ... <uuu
a.Hmot •• POPUlOtion, ( '000) 20UO •• Ob u>/I •• l
Life expe~t.ncy at b1rth - Kele Iyearl) 1."'200U w.O 03179.1
- F ... l. (y •••• J 1995-2000 59.5 03/19.1
Annual population growth race, III 1995-2000 2.11 03(79.1
Crude bl<th rot. (per 1000 popdot.on) 1995-2000 ]0.6 0)179.1
Crude de.th rate Ipe. 1000 populotionl 1995-2000 9.5 03179.1
aate of natural lncrea.e (1 per annual 1995-2000 2.ll 03179.1
3. Pe~ Capita GrG •• kacional Produ~t {GNP}, at .. rket price. (US$) 19&4 538 or 13/85
(KINA) 538
~4. 11. t. of &rowth ot per c.p ... eNP. (I) 1010-1919 0.] 07,.1
15. Perc*nt ... er.,.' Domeltlc: Product {CDP) derlved from .enufacturina at eonatant factor cost eX) 1977 7.7 14/82
I •• Economl.cal1y active pop in prlaary s~ctor
- Number in &sru:uiture ( 000, 1980 1 259 03/80
- Percent in aericulture (I) 1980 82.3 03,"0
11. Daily per capita ce10rie .upp1y {calories) 1975-1971 2 247 13185
18. Daily pel' capita protein supply (gr ••• 1 1975-19H 45 13/85
19. Adult llteracy raCe - Total ... 2 45 1>105 - Hale ... - Fesale ...
~O. Health budget/expendi turf
- Amount IKINA) 1981<£1 64 809 000 12/82.3
- Per capi ta (KINA) 19811E 19.77 12182.3
- As % of totd budget 198!C£I 9.3 12182.3
Official Exchange rate: US$ 1.00· KIKA 1.00 (198~) (E) • utiaate
Source 13/8;:
03/79. h
03/80: 07/81; 10/82; 12/82.3; 12/83; 11184; 14/82 ;
U • Urban; R • Rur«l
Covern.entla Rtport on Evaluatin& Prolee •• in Implementing the Strategies tor H •• lth for All by the Year 2000, 1985 Vorld Population Trend. and Prospectl by Country 1950-2000; Su.mary Report ot the 1918 A.se •• ment~ UN 19'9 'AO P~oduction Yearbook 1980 1981 Wo~ld Bank Atlls 1982 ESCAP Population Data Sheet WHO Seminar on Financing Health Development. 1982 WPR Pata Bank updated by WkC/Port Hore.by, 1983 Country Health lnfo~tion Profile (eMIP) reviled by Govern.ent. 1984 Key Indicators of Deve1opin. He_ber Countries of ADS. April 1982
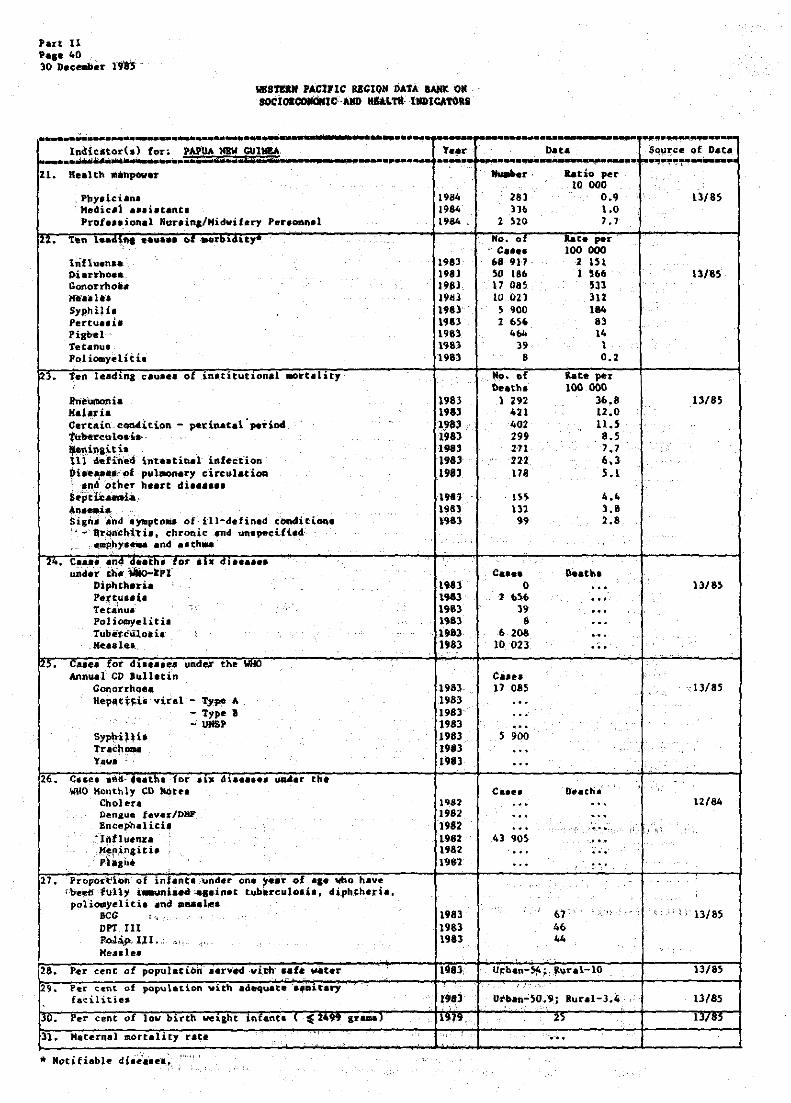
Part 11 'ai_ 40 30 Docember rm-
WBSTZIB PACI'IC RlCIOH DATA ~ 0_ SOCI08C111tci1110-UO _~Tl' lDtcATORS
.......................................... ;, _ ......... -Indic:Uor(.) fC:)I·. PAPUA lQ!\/ CUllllA, l.er
~ ........ ~ .. -.... ....... '.*4 •• ~ ... JiliU III. ,.,_ ..... - -~ .. H. Heal th •• hpowel'
, Pby.ichn. 1984 Medic,l ... htant. 1984 Prof ••• ionel Nur,in.'Midvifery Peuonn.l 1984
I'" ~." l .... ~ ..... u ........ n ..... yw
lrifluen •• 1983 'Diarrho •• 1981 Conorrho~. 1961. .... 'u1 .. 198J Syphilh 19&1 Pertu",h 1981 Pi-g-b-el . 198) 'tetanus 1.8) p,oliomyelitie 1983
23. Te. Ieadina c.uae. .f in.titution.l .ort.111:, , fne'umonia 1983 Malaria 1983 Certain,c0U4ition - patinet.l "period 1_98' t-ubtTc.ulo.·". ' 1983 ':e:p.i~8i~~. _, 1983 n 1 6efi"n'e4- i-nt •• tin.l illfecfion 1983 D-i.-e· .... :''Af pulBlOMl'y e'ireulation 1983 ~ and' other h •• rt die ..... S."ti.i:_ .. 198)
~nft1lli •. 19~3 Signa a'nd ',-y.pto .. Of ill-defined cbftditiCM\. 1981 ." ... " ~rQndth i., chronic _.nd un.,.citLed
: .'a,phy.... .nd •• th" 20. C~.~. _ .,~G .~~~.th. _ro .. Ii'. di ••••••
under th. 1IIo-IP1 Diphtheria 1983 'e(tuu" 19113 Tet.~u" -. 1983 Poliomyeliti. 198J l'ube't€.uoaia It83
.ka.i._., 1983 . . .
25. C •• e •. fot du .... e. undu the WHO Annu.l CD lull.tin
Gonorrhoea 1981 Hep.t;~h . viral ---Ty,pe " . 1983
- Type I 1983 .; I1I1SP 1983
Syp~inh 1983 Tr.chOlll 1983 Yaw. 1983
26. C.ses .~d'.e.th. for ,1.)1 .:h •••••• ",a4I.r tho WHO Monthly CD )lot ..
Cholen 1982 Dengue teYer;/DHP 1982 Encephdith 1982
.:lntlufua 1982 '~fI,in,iti. \9&2
, P-Hllit. 19&1
21. Propoct'ioh' of inhntt ',under one )'tat' of a,_ who have I be~:- -,1ul1 'J i ...... niaft ,,...,inet tubltreu-lo.h. dIphtheria, pol'iOlllyelitia and .... le.
BCC " ' 1983
DPT III 1983 P.o.1~ 1l1.., \ta3 He ... lea
28. Per cent of popu 1 at Lon' aer,,·..-d -vi.ttr I.f. ""'er 1983.
29. Per c.nt of papu latio-n \fitll adequate .,iutarj· fat:iliti.es f98l
pO. Per cent of low b~rth wel&ht 'Rf.nto \ lI! 2499 gr ... ) . 1~1'l .
31. Haterna) mortalhy rne
---_._-- .......... ~ ...... --. Dat.
~.-.--.............. -.. - SQ~rce: of Oats_ ~.".~~,..-......,;.
..... r, ltatio per 10 000
281 0.9 13/8S ))6 1.0
2 520 1.1 .
No. of ·bt. per' C .... 100 000
68 911 2 IH SO 186 I '66 1l/85 11 085 531 10 021 1U
S 900 184 2 6,. 83
41>'0 14 )9 1
8 0.2
No. ef late pee" Denh. 100000
1 292 16.8 1"85 421 12.0 402 1I.S 299 8.S HI 7.7 n~ 6.3 178 5.1
I~~ 4.4 III 1.8 '9 2.8
.
C •••• o..thl 0 · .. 13/8)
1 b)6 · .. J9 ...
8 · .. , . 6 208 . ..
10 023 · .. Cue. 17 085 d3/85
· .. · .. ...
5 900 · .. · .. . ,
C •• e. D •• tha' . ,
· .. · .. 12/84 · .. . .. .. . , .. _ ..... d . , ,:
41 90S · ._. ... .' .' . ... .
61 ;', -" . ~ -, 'i' ,I, 1l/85 46 44
' UJ:'b.n-~;. ,~u'ra1-10 13/8S
" '
U-tban":SO.'§!; Rurol-3.4· " 13/8S
.. 25 13/8S
' ....

WESTERN PACIFIC REGION DATA BANK ON
Pan: II Page 41 30 December 1985
• SOCIOECONOMIC AND HEALTH INDICATORS
......................................................... . ......... . ............... ..•.......•....• Indicator(,) for~ PHILIPPINES Year Data Source of Data
~ .. ----.. -----..... -.-..... -.-...... -...... -•.•.......... _._.-._ ... _ .......... --.. - --....... _---_ .. I. Area (in 1000 aq. kID.) 1981 300.00 12/83
2. Estimated populatlon (. 000) 1984 53 186 13/85
J. Annual population growth rate lXI 1984 2.4 13/85
4. Percentage or popUlation - Ie •• than h yeau 1983 41.34 06/84
- 65+ year. 1983 3.42 06/84
5. Urban populatlOft {~, 1980 39.0 14/.'
•• R.te 01: natur.l incr •••• or populauon ll. per annus} .... 2.4 Ill"
,-. Cr .... blrth rat. {par 1000 populat,on' 1984 31.6 13/.,
8. eruG. d.ath rata Ip.r 1000 populationl 19" 7 •• l}fU5
9. Ltte expectancy at Dlrth - Total ly.ara! ,. .. .., - Hale (yearl> 62.8 13/85 - Fe .. le (y.arl> 64.6
10. Infant mortality rat. {per 1000 hve buth.} 19a4 58 13/8,
U. Total fertihty rate {w_n U-49 yoaral 198} 4.50 06/84
12. Soeio-economic ludicatora for the y.ar 2000
E,Umated populatl0n. l 000' 2000 75 224 06f84
Life expectancy at birth - Hale ly.arol 1995-2000 65.9 03179.1
- F .... I. (year,) 1995-2000 70.1 03179.1
Annual population Irovth rate, 1995-2000 {Xl 1995-2000 1.91 06/84
Crude bIrth rate {per 1000 population} 1995-2000 23.90 06f84
Crude death rate {per 1000 population) 1995-2000 6.20 06/S4
Rate o-f natural lncrea.e ex ptlr annua1 199)-2000 1.77 06f84
13. P.~ CapIta Groa. National Product {alP} at market price. (us$) Hay 1985 556 or 13/85
(P ) 10 072
:14. aate of ,rowth of per cap "a GNp \11 IY70-197Y J.Y 07181
15. re~cent.&e Cro •• Dome.tlc Product {CDP} derIved from •• nufacturinl at con.tant factor coat (X) 1983 25.1 06/84
16. ~conomlC.lly a~tlY. pop 1ft prImary .ector
- Number 1n agrlculture l 000) 19B] 10 250 06/84
- Percent in a,rlculture (Xl 1983 52.1 06/84
17. Dally per capIta calone lupply lcaloriea} 1981 2 637 13/85
la. Dally per capua protein supply llr ... , hoi 07.7 13/8)
19. Adult l.ueracy rate - Total 1982 90 11/85 - Hale ... - FelU1e ...
20. Health budget/expenditure
- Amount IP} 1982 3 125 638 000 12/83
- Per capita ep) 1982 61.6 12183
- As % of tocal budget 1982 5.23 12/83
Official Exchange Rate: US$ 1.00 • P 18.11 (1984)
Source 13/85:
03/79.1:
06/84 :
06/85:
07/81; 12/83: 14/83:
Governqenc's Report on Evaluating Progress in Implementing the Strategies for Health for All by the Year 2000, 1985 World Population Trends .nd Prospecta by Country, 1950-2000! Summary Report of the 1978 A,ses.ment, UN. 1979 lnform.tion furnished by the National Economic and Development Authority, Philippine., 29 October 1984 Government's Reply to Cuaulative Totals of Cales and Deaths from 18 Selected Oi.easea for the Ytarl 1983-84 and up to July 198~ 1981 World Bank Atl •• Country Health Information Profile <CHIP) revised by Government. 1983 1983 World Population Data Sheet. Population Reference Bureau Inc., Washington. DC

Part 11 Page 42 30 December 1985
WlSTERH PACIFIC REGION DATA 8AMK ON SOCIOICO_IC AIIP HEALTH II1DICATOIS
.............................................. ~ ..................... ~ ..................... Indicator(.> for~ PHILIPPINES Year Data ..................... .--...................................... foo-· .. .....................
1. H •• l th unpO'IIer NUliber a.tio per 10 000
Phy.ician. 1982 7 378 1.6878 Medical a .. i.tanca 1982 · .. Profe •• ion.l Nur.ina/Midwifery Per.onnel 1982 19 114 1.2655
p2. Ten leadlna -eau'.1 of lDotbldlty No. of Rate per C.le. 100 000
Bronchiti •• ..pby .... an4 •• th .. 1984 552 958 1 036.4 Diarrhoe. 1984 512 042 959.8 Influ.nza 1984 416 634 730.9 Pneumonia 1984 119 587 336.6 Tubercololia , all fo ... 1984 140 463 263.3 Kalari. 1984 110 307 206.8 Accidentl 1984 83 407 156.3 Mea.le. 1984 67 285 126.1 Malilnant neopl .... 1984 26 90S 50.4 lnfectiou. hepatiti. . 1984 IS 080 28.3
3. Ten le.din, caule. of aortality No. of Rate per Deatha 100 000
PneulIloni •• 1984 47 513 89.1 H.eart dile.I .. 1 1984 12 426 60.8 Tuberculo.i., all fo ..... 1984 28 161 52.8 Di •• ale. of the va.eular .yet •• 1984 21 047 39.4 Malienant n.opl .... 1984 16 090 30.2 Diarrhoea. 1984 14 776 27.7 AccidenCe 1984 8 946 16.8 '"vit •• in.o ..... and othe~ nutritional 4.fici.n~ie. 1984 7 140 13.4 Heaalea 1984 5 221 9.8 Nephritil and nephrotic .yndrODe and nephro.ia 1984 4 504 8.4
24. Ca.e. and deeth. for lix dis.a •• 1 .
under the WHO-EPI* C •• ea Death •. Diphtheria 1984 2 995 260 PertuI.i. 1984 19 869 281 Teeanul 1984 ) 092 1 044 Polio.yeliti. 1984 740 81 Tuberculoaia 1984 140 463 14 812 Hea.lea 1984 67 285 2 598
!5. easel for diae.lu un4er the 'WHO Annual CD Bulletin Ca.el
Gonorrhoea 1984 Il 575 Hepatitil viral - Type A 1984 · ..
- Type a 1984 ... - UNSP 1984 15 080
Sypbilli. 1984 72 TrachOlU 1984 · .. Y.v. 1984 · ..
6. Cases and deatha for au: diaea.e8, under the WHO-Honthly CD Note. Cas •• Deaths
Cholera 1984 988 43 Dengue fever/DhF 1984 2 545 89 Eneephaliti. . 1984 · .. . .. Influent. 1984 416 634 8 935 Meningitis 1984 2 106 676 Placue 1984 · .. ...
7. Proportion <!t In~.nt. under on .. ye.ar of a,e who h.ve been fully imauniaed a,ain.t tuberculo.i •• diphtheri., · .. pOliomyeliti. and •••• le.
acc DPT III Polio III Helele.
8. Per cent of popuht ion aerved With •• fe water 1985 64.5 .
9. Per cent of population Wlth adequ.te .aftlt.ry hcilities 1985 56.5
O. Per cent of low birth weight infane. ( .2499 ..... ,) 1983 15.4
l. H.ternal morta 11 ty rate 1984 0.8
_ .... Source of Da't ._ ....... ....,.
06/84
1)/85
•
1)/85
13/85 and 06/85
06/85
06/85
11/85
13/85
13/85
13/85

WEST!~ PACIFIC ~GION DATA BANK ON SOClO'CO~IC AND HlALTH IftDlCATORS
Part 11 Page 4) 30 December 1985
~ ••••••• a ....... _._._._ ....................... _._ •••••••• ........... . ............. ................ Indicator(l) for~ REPUBLIC OF KO~ Ye-.,. Dau Source of Data ....................................... ~-....•...... -.-.. ........ --- .............. . ........•......
I. Area (in 1000 oq. km.) 1982 99.02 12183
z. E.ti~ted populat1on ( 000) 1984 40 5)8 13/85
3. Annual population crowth rate (~) 1984 1.57 13/85
<. Percentage Of populatlCm - 1e.. th.n D yeer a 1'~1 31.' 10/82
- 65+ yuu 1982 4.1 'UfO'
>. urDan populaC10n "" 1980 5) .0 14/83
6. Race ot natural iocr •••• of populaUon (I per .nnl,llllJ 190z 1.6. 12/.3
I. ,".0' .,rtn rat. <per wuu popu.ot."", ..... 1J.U IJfO)
•• Crud •••• tn rate < p.r 10uu populonon' t .... 6.' Il/.S
9. Life ex~ct.ncy at btrtb - TOUl ~y.ar.? 19)11-1919 :~:~ 13/85
- Hale (ye.u) - Fe_Ie (Y •• u) 69.1
10. Infant taOrtdity rate (per 1000 1i\(e birth.) 1983 34.2 lJ/BS
ll. Total fertility rate (women lS-49 y .... , 1982 2.6 10/82
12. Socio-econo.ic indic.tor. for the ., •• r 2000
E.t~ .. ted pOp~l.tlon. \"UUVj 2000 50 790 03/19.1
Life up •• uney at bLrtll - lIal. (y.otl) 1995-~000 6),0 03179.1
- F •• al. (yeo.,) 1995-2000 11.3 OJ/19.1
Annual population growth rate. {XI 1995-2000 1.1. OJt19.1
Crude birth rate (per 1000 population) 1995-2000 18.8 03/79.1
Crude death rate (per 1000 population) 1995-2000 6.9 03/79.1
Rete of natural 1ncre.'e (~ per AnnUlb) !99S-2000 1.1' 03179.1
Il. Pel' Cap It. Gro •• Hauonal Product (Q4PI at IUrket priee. , (US,) 1983 1 880 13/85
.~. Reta of grovth of par .0pH. " •• '" "'''''1>'' •• 1 U"81
'U. Pet'centa,. Gro •• DoIM*uc Product lGOPJ derlved from m.nufactvrina at con,t.nt faetor co.t (Z) 1980 29.9 14/62
16. Iconoaically active pop 1n pr~ry •• ctor
- NUJlDer 1n .a:r1cuJture \" WU) 1980 5 601 03/60
- Pucent in agriculturo (I) 1980 38.6 03/80
1). Daily per c.apita calorie Bupply (c.alorie.> 1982 2 588 13/85
18. Daily per caplt. proteln .upply lira .. ) I •• , )".J 13/0>
. 19. Adult Ilteracy I'ate - Total . .. IJfOS - Male 19/9 96 - Fe .. le 80
20. H.,.l th budget/expenditure
- baunt (Wonl) 1981 175419m 06/81
- Per capita (Wonl) 19.1 4 523.6 u6/"1
- Aa % of total budget 1981 2.2 06/81
Official IKchanae rate: US, 1.00 • Won 890.00 (1984)
Source 13/85:
03/79.1;
03/80; 06/81 : 06/85;
0)/6[; 10/82; 12/82.2; 12/83; 1~/82 ; 14/83,
Cov&rnment'. Report on !valuetinl Proarels in Implementing the Strat~gie8 for He.lth For All by tbe Y~.r lOOO, 1985 World Population Tread. and Pro.pectl by Country, 1950-2000: Su.a~ry Report of the 1978 A ••••• menc. UN. 1979 FAD Production Ye.rbook 1980 Offici.l National Publieatioa Gover~nt·. Reply to Cu.ulative Total1 of C.le. and Dtaths from IS Selected Di.e •• ec for the year. 198)-1984 and up to July 1985 1981 World B~nk Atl~. 1982 £SCAP Population D.t~ Sheet Government', Reply to !PI He41tb InfonDation System Questionnaire. 1982 Country Health Infor.ation Protile (CHIP) revised by Government, 1983 Key Indicators of Developing Member Countries of ADB. April 1982 1983 World Population D.t~ Sheet, Population Reference Bureau Inc .• Washington, DC

Part 11 Paa. 4ft 30 bee.~er 1985
WElTE.M PACI'IC IIGIOM PATA BANK OM SOCJOICO_JC AIID HU~rH IMPJCATOU
He.l th ruanpOlMr
PhYlic.i.n. Medie.l ••• i,teate Prof ••• ional Nu~.in&/Kidvifer1 Peraonnal
Upper re'piratory tract Other parta of the diae.tiye .y,tea Other part. of the r •• pir.tory ,yat •• S~in and ,ubcutan.D~' tia.ue. Oral cavity, •• livery .l.nd. and jav. Iy. end adn.xI. Fe~le senital or,ana Muaeulo6keletal .,.t •• and eonnective ti.aue Mental disorder; t'T and maatoid proce.,
Hyperten.iva di ••••• Car.brav •• cul.r di ••••• Other .ccident., includina lete etfact.· .... in' H.ll.nant ftaopl ••• of .to.ech ChrOAic liver di •••••• nd c!rrho.i. Tr.n.port di ••••• Tuberculo.i. SQicid • .ad .,If-inflicted injury Broachit!. chronic and unapecified
emphy .... and alth ..
under the WHO-IPt Diphtheri. .I'ertuuh Ter.nul "01 io.yel it i.,. Tubf!rc:ulo.ia Meute'
Annual CD lulletin Gonorrhoea Hepatiti. viral - Type A
- Type a - UMSP
Syphill.ia Trac:hClllla Vava
••• WHO Monthly CD Note.
Cholera Dengue fever/DHF Encephaliti. Influenc. Henin.ith PI •• ue
b •• n fully i.auni&ed e.aine' '~berc~10.i., diph'~."., pOlio.yeliti. and .... le.
ICC . DPT III Polio 111 He.sle.
r;'I-~;f pt)IJUlal iOIl vi rh ad_quat ... a,,1 r •• r f~d\itiu
Year
1983 1983 198)
1983 1983 1983 1983 1983 1983 1981 1983 1983 1983
1983 1983 1983 1983 1983 1983 1981 1983 19&1 1ge1
19810 19810 1984 1984 1984 1984
19810 1984 198. 1984 19810 19810 19810
1984 1984 1984 19810 19810 19810
1982 1982 1982 1982
H"er
17 772
Calli.,
C •• e. 16
I 854 5 U
136 312 2 246·
C •••• 40 162
7 543
c •••• 0 0 0
0
Dat.
a.tio per IP OOP
5.2
per 100 000
Dellth. 0 0 ()
()
1 611 C
Deat.h. 0 0 0
0
100 61.0 62.4 4.9
Sourc' ot Data
Ill8S
13/85
13/85
06/85 and 13/85
06/85
06/85
12/82.2

PaTt 11 Po,. 45 30 l)eceaober 1985
~---.-----Indicetor(e> tor:
WlSTIlRII PACIPle RiGIOB DATA BAlIk OM SOCIOlCO_IC I.IID IlULTB IIDIc;,.roU
_. =-_._ .... _. -Year -----
Data SOUTce of Data ~ _ .. -- ...................................... -----~.-----r--.---1. Are. (in 1000 Iq. ka.> 1982 2.84
t. Z.tu .. te<! POpuhUOD 1'000) 1984 163
I ~. Annual population Ir~h rate I'J 1981 2.1
I'" rere ... te,. o. popu .. nOD - 1"" thin ., y •• r. 1.82 48.'
- 65+ y •• r. 1982 3.2
). Urben pofIUUtlOD U.} 19B] 29.1
6. lat.. of Gat,,!'.l lAC""". ot 'Popul.t ioo \.~ peT ennuaJ 1984 2.6
I. .. rUG. outn rato ,por 1UUU pop .... uon' 1"'4 J I.u 8. Crude death rate lper lOUD po .... lo •• o .. ' 1984 I.'
9. Lire expectaDey at b1rth - Total ~ye.r.! 1 ..... . .. - ",,1. (y .. n) 63 - Fe .. 1_ (y •• r.) 65
O. lnfant aortal it,. rate (per 1000 live birtha) 1.8- J)
I. Total fertility ret. Iv ..... 15-49 y .... ) l.n-l,au 5.91
12. 5oc1O-•• _" i .. dl,.'on for tho YO" 2000
..e._ted ,op."aUOII, 1'000) 2000 20J
L1f. etpectCACY .t b1fth - N«le ly .... ) ZOOU 71
- , ... 10 Iy.'u/ 2000 73
bnual popul.t~on growth ~.t., tJ} 19.,-2000 o.~
Crude birth rat«- lper luuu population, 2000 21
Crude d .. th •• t. Ip.' 1000 popul.tion) 2000 5
Rat. of utur.el lncr .... U; per annu.) 2000 1.6
Ill. p .. C.pit. Gun "a<tonal Prod...,. 1/1111') • .... ket ,rice. (usS) ...
(wst) ~4. Rate of ,rwth of por •• p>ta CMP IU ... 1>. "ercenta,_ Gro •• no.a.ttC Product lCDP) der1vect,
fros 5aaut.cturin •• t COb.tant factor co.t (Z) .. , lib. lconoml~.11y active pop 10 prl .. ry .ector
- Nuaber in .,rlculture \"UUU) 19/. 2.02
- Percent in .'t'lcultur-e (%) 1970 12
11. Oatly per C.plt. cal0rl. lupply \c810r' •• ) 1964 ] 500
I, •• Dauy per capita prot~tn eupply lCr ... ) IY ... 4'.' 19. Adult literacy ra,e - Total 1964 > 95
- Kale ... - Fe .. le '"
O. Health budaet/expenditure
- Aaount ,WS., 1 ••• 4 ,.5 VI>
- ".r eap1ta IWS,) 1982 30.21
- AI % of toUl budcet 1982 11.5
Offieial I.chana_ rate; US$l.OO· WS'O.97 ()980)
Source 13/85:
03179.1:
06/85:
10/82: 12/83:
Covera.ent t• Report Oft Evaluarin3 Prosr ••• in l.pl.-eatina the
Str.t~,i •• for H •• lth for All by the Year 2000. 1985 World Population Trenda and Proapeet. by Country, 19So-2000; Su..ary Report of the 1978 A.ae .... nt, UN, 1979 Government's Reply to Cuaulative Totals of C •••• and Deaths fra. 18 Selected nise.,e. fo~ the Years 1983-84 .nd up to July 1985 1982 ESCAP Population Data Sheer WPI Data B.nk updated by CLO, Apia, 1983
12/83
13/85
1~/85
lO/82
10/82
12/83
\3f85
"/8'
1J,,)
13/85
13/83
12(8.
0](79.1
Q~(7Y.I
03(79.1
0"179.1
03(19.1
03179.1
03179.1
12/63
12(83
1.,oJ
13/85
IJ/.)
13/65
11'03
12/83
11/83
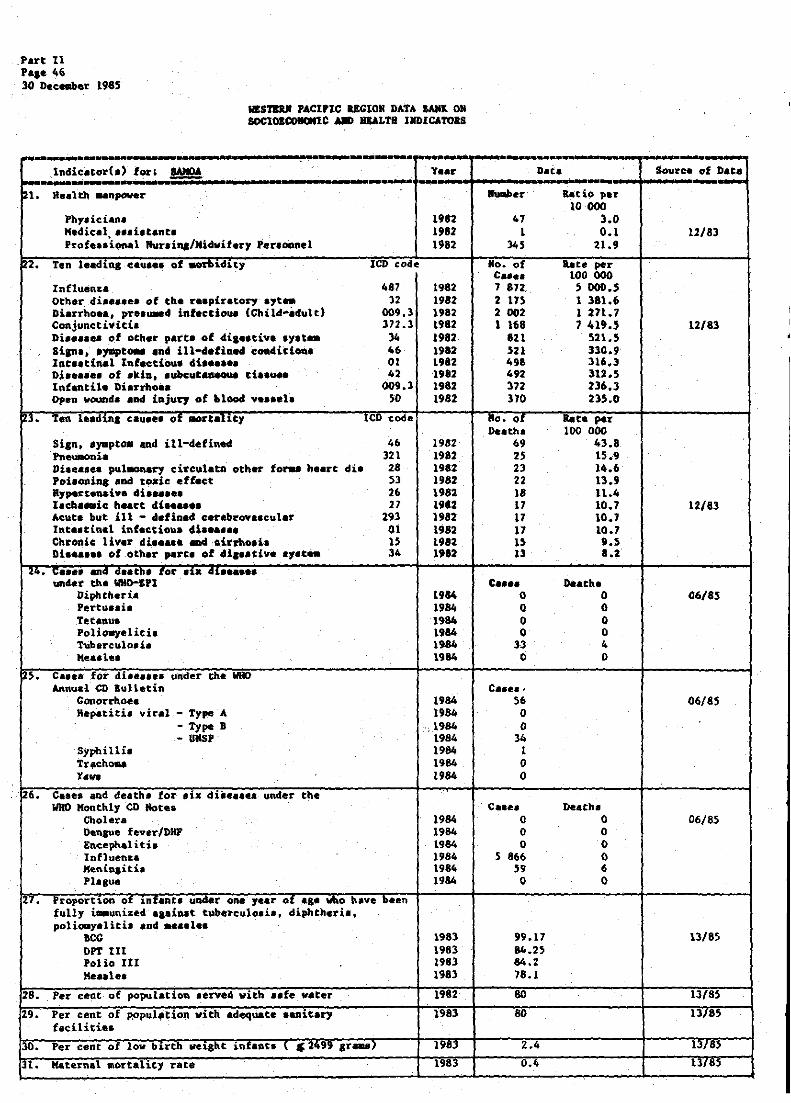
Part tl PAle 46 30 Dec_er 1985
IiISDRJI PACIFIC IEGIOH DATA IAIIIl OR SOCI01~e MD IllALTII IIlDICATOas
r---..... -_ ••••• _=._- !' • ----rr'--Indic.tor(.) lor: IWIOA Y.ar 1--------.... - « --pl. Heal tl'I .. npaver
Phy.ician. 1981 Medic.l ••• i.tent. 1982 P~ofe •• ional Nur.ina/Hidwifery 'er.onnel 1982
2. ren 1 •• dlUa eau ••• of .ot'D1dlty JeD code
Influ.en&.& 487 1982 Other di •••• e. of the r .. pir.tory .,t .. 12 1982 Diarrhoea, pTe.u.e' infaetiou. (Child-adult) 009.3 1982 Conju,nc::ti'tlitb 372.3 1982 Di •••••• of other part. of di, •• tlve .yat .. 34 1982 Siano, t7lPtoao lad ill-defiaed coadicioa. 46 1912 Int •• tiaal Infectiou. 4i •••••• 01 1982 Di •••••• of .kiu. .ubcut.aeoua ti •• u.s 42 1982 Infantil. Diarrho •• 009.3 1982 OpeD wound •• Dd iRjUr, of hlood v •••• l. SO 1982
~l. Ten lead,ns ca •• eo of _taUty leO cod.
Si .... ')'IIptOll ""d ill-defined 46 1982 PneUJaOlli. 321 1982 Diae"el pul.onary eirculatn other fo.,... h.art die 28 1982 PobOllina aDd toxic:: efflct 53 1982 RJperteaaive di ...... 26 1982 X.eta.me: h ... C't d'M .... 21 19.2 Acute but ill - •• fined cereb~G¥ .. eul.r 293 1982 Int •• tin&l inf.ctioQ. d1 ...... 01 1982 Chronic liver di ..... ODd .'rrhooio IS 1982 Di •••••• of other ,.~C. of .l ••• civi 'Yle .. 34 1982
24. c.... IDd d •• t~~ . ~or .1>. di •••••• unNt' thl WHO-SPI
Diphtheri.a 19&4 Pertu.,i. 1984 Te.tl"U8 1984 Poli08)'elieil 1984 Tubercula.!. 1984 He.al.1 1984
.S. C •• ea- for dh ••••• under the lIIIO Annull CD Bulletin
Gonorrhoe:l 19&4 Hepatiti, viral - Type A 1984
- Type B •. 1984 - UtiSP 1984
Syphillio 1984 TrachOlU 1984 y .... 1984
26. C •• e. and de.atha for .ix di •••••• under the WHO 1I0nthly CD Hote.
Cholera 1984 Denpe f~ver'DBP 1984 Ence.phalitis 1984 Influenza 1984 Keniqiti. 1984 Plague 1984
lI. Proportlon ot uranU unaer one ye.r ot as_ vtt.o h.ve been fully i-.unized a.ainat tuberculo.i., diphtheria. poliomyeliti. and ••• ale.
BeG 1983 DPTUI 1983 Polio III 1983 He.ale. 1983
28. Per ceot of populatiOQ •• rved with I.fe w.ter _ 1982
29. Per cent of p,opul.tioQ vith adequate .aaitary 1983 facilities
30. Per 'Cent of low butll "USh. in •• nt. \ ~ 2499 8r-> 1983
n. "-tern.l _ort.lit, rate . 1983
--_. -D.C. .. Source of nata
" -...... er lati9 par 10000
41 3.0 1 0.1 12/83
345 21.9
110. of bte per C .... 100 000 1 872 5 000.5 2 115 1 381.6 2 002 1 271.7 1 168 7 419.5 12183
821 521.5 HI 330.9 498 316.3 492 312.5 372 236.3 370 235.0
110. of Rate per Death. 100 000
69 43.8 2$ 15.9 23 14.6 22 13.9 .
18 11.4 17 10.7 12/83 17 10.7 17 10.1 U 9.5 13 1.2
C •••• Outhe 0 0 06/8S 0 0 0 0 0 0
33 4 0 0
C ••••• 56 06/8S 0 0
34 1 0 0
Caae. Death, 0 0 06/85 0 0 0 0
5 86/1 0 '9 6 0 0
99.11 13185 84.25 &4.2 78.1
80 13185
80 13/85
2.4 13/85
0.4 ll'~'

,
WESTERN PACIFIC RECION OATA lANK ON SOCIOICO_IC AND HEALTH INDICATORS
Part II Page 4' 30 Dec_r t985
~·········"··"··"····················""·············t· ......... .. _---_ ... - . ................ IRdicatorh.> for; SUfGA,POR£ Year Data Source of Data ........................................................ . ......... _ ............. .................
I. Area (in 1000 .q ...... ) . 1982 0.62 12/83
I •• l:.t1l .. t.d popul.Uon ('OOO) 1983 2 502 13/85
3. Annual population growth rate (%J 1983 1.1 13185
4. percenta,e, of populatlon - leaa th.n l~ year. 1982 25.6 10182
- 65+ ),e,u. 1982 4.9 10/82
,. ur'an popu,atl0n 1<) lOel lUO 1410'
6. aate.. of natural ifu:r •••• of pcpuht ion (% pctr annum) 1983 1.09 13/85
1. Crude buth nt. (per 1000 populotlop> 1983 16.2 13/85
. e. Crude d.a.h rcta lper 1000 populatioo) 1983 >.3 IJ185
9. LUe npecuncy at birth - Total (y •• <o) . .. 13/85 ... Hale (y •• .,.a) 1980 69 ... Fe .. l. (y •• r.) 7.
,10. Infa'Rt IIOrtallty rate <per 1000 !Lva hrt.a) 1983-84 9.4 13{SS
u. TOta, ••• t111ty rate Iv .... " 1)-4' y .... ) 198Z 1.7 10/82 ... Socio-ecoac)lll~ inClic.ator. for the year 2000
I.t~ted pOp~l.tlonl ( 000) 2000 3 095. 03/79.1
Llf. expectancy at birth - Male (y .... ) 1995-2l1OO 70.6 03/19.1
- ' .... 10 {y ... s> 1995-2000 75.7 03/19.1
Ann~l population grOW'th rate, 1995-2000- (%J 1995-2000 0.87 03/79.1
Crude birth rate lper 1000 population) \995-2000 15.1 03/79.1
Crude death rate (per 1000 population) 1995-2000 6.4 03!?9.1
Rate of natural lncre •• e ~, per annuat) 1 • .,-2000 0.87 03/7'.1
U. Per C.p1t& Groa. Mational Product (GIIP) at market prices (US" 1983 6 441 or 13/85
(8$) 13 783
1". Kat. of arowtll of pe. c.pte. GNP (XI 1.70-1979 ,,;,~ O?l81
1,. Pere.nca._ Cro •• no...tl~ Product tCDPI d.r~v.d fTom maftutacturina at eoa'tant factor COlt (X) 1980 22.S 14/82
16. EcoROmlcatly aetive pop in pr~ •• ry .ector
- Nu .... 1n .'<'culture < '0(0) 1.80 21 0"00
- Pereent in acric:.ulture l%J 1980 2.2 03/80
17. Dally per capita c«lorle 8upply (,«lortes) 1977 3 074 13/85
18. Doily per capita protein supply (grau) 1977 64.2 13185
19. Adult literacy rate - Total 1983 85.2 13{85 - Male ... - Fetuale .. ,
20. Health budget/expenditure
- bount (S$) 1982 330 890 DOD 06/82
- P~r capita (SII 1982 132.99 06/82
- A. % of total budget 1982 3.69 06/82
Offici.l Exch •• ge Rate' US, 1.00 • sa 2.14 (1984)
Source 13/85:
03/79.1:
03/80: 06/82> 06/85,
01/81: 1O/8h 12/83: 14/82 : 14/83:
Government's Report on Evaluating Progress in Implementing the Strategies for HeBlth for All by the Year 2000, 1985 World Population Trend. and Pros~ect8 by Country. 1950-2000: Summary Report of the 1918 Alae.ament, UH, 1979 lAO Production Yearbook 1980 Annual Report of Mini.try of Health, 1982 Government'. Reply to Cu.ulative Totala of Case. and Deaths from 18 Selectee Diae •• e. for the Years 1983-84 and up to July 1965 1981 World Bank Atl •• 1982 ESCAP Populatio'R Data Sheet Country Health Inforaacion Profile <CHIP) revised. 1983 Key Indicators of Developing Kember Countries of ADB. April 1982 1983 World Population Data Sheet~ Population Reference Bureau, Inc., Washington, DC

Part It '_ae 48 30 Oo,-.h •• 1985
WlSTaR •• ACIFle JlCIOIO DATA _ 011
SOCIOS_IC AIID HEALTH INblCATOU _._-_ .. • ---- •• T ••• __
-.~-.-- .. _-.... - ........... _-Indicator(.) for: SlMCAPOaJ Y.ar nate Source of Oat..
~ ............................. --.......... ~ ................... ~ ~-.... ......................... ._ .. _----21. H_alth .. npower Nu.b.~ aatio p~r
10 000 Phy.ic:ian. 1982 2 2Z5 9 06/82 Medieal ••• i,tant. 1982 · .. Prof ••• ional Rur.iQl/Hidvifery Penon.net 1982 10 201 41 .. 3
22. Ten. 1.&,hn, ceu.e. of aorbiduy ICD code tie. of late per C .... 100 000
Abortion. 6)0-639 1983 ... 13/85 Intl'acl"ani.al inj." M8). 1983 · .. A_th_ OU 1983 . · .. Inte.tinal infection. 009 19a) · .. C.rri.~ or .ut,.cta4 carrier VOZ 1983 ...
of infeetiou. di •••••• Cat"ract 366 1983 ... General ')'aIpt~ end i.ll-defined e ond it i ORa 180 1983 · .. Acute .ppendiciti. S4C 198) · .. niabetea aellitu. 250 1983 . .. Ile.orrhoid. 455 1983 ...
3. Ten l.adiftl cau ••• I)f .ortllUt)' '-Li.t No. of late per D.ath. 100 000
C.nc:er 11-22 198) ... U6 13/85 l.ch ••• ic and other h.art dh ..... ) 29, 31-33 1983 ... 108
) 3S, 36 Pne~ni. 37 1983 ... 60 Cerebrov •• cul.r di •• a •• 34 1983 ... 58 Accident., poi.onin, lind viol.nce 52-H 1983 ." 43 D'i.bete ... Uitu. 23 1983 · .. IS Hephriti. and •• phro.i. 4) 1983 ... 11 Hyperten.i •• di •• a •• )0 198) ... II tubereulo.i. 2 1983 ... 9 Bronchiti., .mphy .... and Uth .. 39 1983 ... 7
24. C •• e. and dellth. fo~ '1$ dull ..... under ch~ WNO-EPI C •••• Peath.
D'iphtheri. 1984 0 a 06/85 Pertuuh 1984 ... ... 'ret.nu. 1984 ... .. . Polio.yel itie 1984 2 0 Tubecculoli. 1984 2 143 159 Me •• l.a 1984 2 417 ]
S. C •• e. for di.e ••• a under the WHO Annu.l CD Bulletin C •• e.
Gonorrhoea 1984 8 969 06/85 Hep.titi. vi'ul - Type It 1984 149
- Type B 1980 26) - UlISP 1984 \89
Syphilli. 1984 I 293 TrachotM 1984 ... Y.w. 1984 ...
Z6. C.te. and d •• tb. tor • 1X d,u"... UWler tile WHO Monthl)' CD MGt •• c •••• De.th.
Cholera 1984 39 8 06/85 Dengu. fever/DItV 1984 86 0 £nce:phal ith 1984 11 3 Infhaen'u 1984 71S 440 6 Henin.ida 1984 ... ... Pl·I"· 1984 0 0
~1. ProportlOft (Jt ur .. nt. undeT one y .. :r 01 11._ Wl\O heva b •• n fully i .... nh.4 _,einat tub.rculo.h. diphth.'d., polia.yetiti. lind .... 1 ••
BeG 198) 7. 13/85 DPT III 1983 84* folio III 198) 86 H,. ... l ...
'd. r.r ~'t!'l\( o( pUpuSII! il~n .tcorv4fd wi.th •• t.. "'ate, 1~"2 100 n/8S ~. Per cent of population 'with adequate .anitery 1.84 as DIBS . hcilitiu
O. Per cent of low bIrch V«laht .nfan .. ( ~ 2499 Item,' 1982 8.0 1l18~
I. Meternal aortality rate . 1983 C.2 !J/8S
*Diphtheri.-tetanu.

WESTERN PACIFIC RECION DATA BANX ON SOCIOECONOMIC AND HEALTH INDICATORS
Part 11 Page 49 30 Dec:~r 1985
......................................................... .•.... _. . .•...•.•. _ ... -.. _ .....•.•. _ . lndieator(.) fort SOLOHON I SLAHDS Y •• r Data Source of Dillil
~ ............................................... -........ . .....• _. .. _-._-- .... ........... I. Ar •• (In 1000 oq. kll.) 1982 27.5
, 2. E.[~ •• [.d pOpul.t10n. \ OOU) I,., 2)9
3. Annual population arowth ute, (X) 1983 3.4
4. Percenta,e of popu lahon - In. than 15 year. 1976 48.0
- 65+ y~.n 1976 3.3
" Urban populatlon (Xl 1980 10.0
6. Rate of natural inc~e •• e of popubtion ex per annu.) 1983 3.4
7. Crude blrtn nte lper lOW popuiltlon) 19.3 44.6
, '. Cruae death rllte \per lUUU populaUon1 .,., 11.U
I 9. Life expectancy at birth - Total (yea.,) 1983 54.0 - 1'111 Ie (yean) ... - re ..... le (year.> ...
O. Infant mortality rate (per 1000 live birth.> 1984 46
I. Tot.! fertl.hty rate (voaren }5-49 y •• raJ 1982 7.3
Z. Soc1o-eeohoaic indicator. for the year 2000
i.tlUtad populorl.,." \ 'UIIU) 2000 462
L~fe expectancy at birth - Male (yeon) ... - Feute (yellru ...
Annual population growth t'ate, (XI 1995-2000 3.30
Crude b1rth rate \per 1000 population) ... Crude death rate (per lOw population) ... ltate of natural lncreaae (% per annu.) ...
n. Per Capite Cro •• National Product (QfP) at $Arket price. (current prices) (USS) 1983 615* or
(Sal 547
14. lUi .. or growth or per <apH. GIIP l'l h7z-1'81 2.7
1>. Percentale Cros8 noae.tlc Product lCDP) c1erl.ved fro. .. nufacturing at conatant factor coet (%) ...
116 • Iconomlcally setlye pop 1n prlmary •• ctor
... Nuaber 1ft aaruulture \ -UUUJ ".u • - rercent 1n agr1culture U) I'BO )Y.U
17. Duly per caplta calorIe lupply lcalor1e.} . .. 18. Daily per cepit. prote1n aupply (swa .. ' ... 19. Adult hteracy rate - Total 1983 25-30
- H«le ... - 'e.ale ....
pO. Health budaet/expenditure {c:entral loverruDent}
- Aaount (51'1 1901 3.05 m
- Pet' c:apita (51$1 1981 12.2
- A8 % of toUI budget 1981 8.8
.Per capita GOP Offici.l Exchange Rate: us$ 1.00 • 51* 1.12 (19B3J
Sourc.e 13/85:
03{79,
OJ/80: 06/85:
12/82:
Covern_ent's Report on Evaluating Progre •• in I.pleAenting the Strateaie. for Health for All by che Year 2000, 1985 World Population Trend •• nd Pro.pect. by Country. 1950-2000; Su~ry Report of the 1978 Aa.e •• ~nt, U~, 1979 FAD Produ~cion Yearbook, 1980 Gover~nt's Reply to Cu.ulative Totilis of Ca.e. and Deaths fro. 18 Selected Diaea.e. for the Yeare 198)-84 and up to July 1985 Government Responses to World health Stati.tica Annual Qu~stionnaire on Heal th Manpower. 1982 Country Review by CLD, Honiara. 1983 Country Health InforGBtion Profile (CHIP) reviaed, 1983 WPR Data Bank updated by CLO, "oni.~ •• 1983 and 1984
12/83.1
\J/85
I3t8S
12f84
12/84
12/84
13/85
13/85
1J10'
13{85
13{85
Ut83
12/04
03{79
13/85
12/84
OJ/'U
UJ/BU
13/85
12/83
12183
12/83
12/83: 12/83.1 12/84: \4/80: South Pacific Epide.io1ogica1 and Health Information Service, Annual Report 1980

Part 11 Pa.e 50 30 !lee_er 198~
WlS1!.. PACIPIC RECI0N DATA BAMk ON SOCIOlCO_IC /dID HEALTH IMOICAroJS
... --_ ............. ------..................................... ----ladi.atGr<.) for: SOLOMDH ISLANDS Year ................. " •• ...... ---...................... .. __ .. 21. Health aaftpowa~
Physiciap 1980 Medical ••• i.tauta 1980 Prof •• sional Huraiaa/MidvifaT7 , • .,IOftftel 1980
'n. L ••• '.,. .au ••• oL ... rDl ... y
~l.ri. .
1981 Influenz. 1983 ConjunetiYitia 198J Diarrho.. - ~b114r.n aad: .dulce 1983 Di.rrhoea - iDf_nt. 1983 M ••• l •• 1983 'TubeTculo.ia 1983
~3. Leadina: cau ••• of .ort.lity
Reapiratory diee •••• 1982 Halari. 1982 Heade. 1982 IHninsith 1982 Diarrhoe.l di.e •••• 1982 Birth injurie, 1982 Coaaenieal ano.alie, 1982 An.nt. 1982 Ac:eidenta 1982
~4. Cue. and death. for al.X dl. .... a •• under the IiltD-EPI
Diphthe'l"u 1984 Pertu •• ie 1984 Tet.nu. 1984 PoliOtl)'eliti. 1984 Tuberculo.i8 1984 He.,le. 1984
25. C •• e. for d1 •• a.e. under the WHO Annual CD.Bulletin
ConQrrhoe. 1984 Hep.tith v'ir.1 - Type A 1984
- Type a 1984 - UNSP 1984
Sypl1ill i. 1984 TrachOlU 1984 'tav. 1984
26. C •• es and de.th. for .ix di •• a.e. unde~ the WHO Hoathly CO Mot ••
Cholera 1984 Deneue fever/DHF 1984 Enceph.liti. 1984 Influenza 1984 Hel1inliti. 1984 Plague 1984
121 • ProportlDn ot lnt.anta under one ye.r Of _,_ WhO have been fully i.-uniaed '.Aia.t tuberculo,i., diphch.ria. poli~.liti. and ~a.l •• 1984
BCG DPT III PoliD III Heaale.
28. P •• cent of populatlon aerved with •• fe w.ter 1984
29. Per cent of populAtiOrt. witb adequate •• nit.ry b.cilit.iu 1984
JO. Per cent of low birth weilht infanto , '" 2499 grams)
.,1. M.ternAl u.ortal1.ty l'.te 1984
r-...................... -.-.-.--~ Data Source 'of nata ....................... .. ---------MUllber Ratio per
10 000 38 1.7 12/82 -
390 17 .8
NG .• or ... t. par c .... 100 000 84 ~26 32 635.~ 13/85 l5 644 13 762.2 8 758 3 381.5 3 174 1 225.5 2 486 959.8
919 354.8 382 141.5
Mo. of late per neatha Ll00 000
12 4.8 U/85 5 2.0 5 2.0 4 1.6 4 1.6 2 0.8 2 0.8 2 0.8 2 0.8
c •••• hAth. 0 0 06/85 0 0 3 0 0 0
532 1 238 0
Cue. 161 06/85 3S 0
92 0 0
2J
CaBea De.th. 0 0 06/85 0 0 I 1
45 349 0 19 1 0 0
87 13/85
90.9 - Urban 13/IIS
86.4 - Urban IJ/85
... 0.1 1l/8S

,
tart n P.ge 51 30 1)..,.III>.r 1985
WlST!lI< PACIFIC RlGIa" DATA BAllI( ON SOCIOlCOMOHIC AND KEALT~ INDICAtORS
~ ........................... -... ----.-.... -.... -.--.--.--- .......... . -.. _ .. _---- ._ ....... _-_ . In4icotor(."· fon TOK!lJJJ Year nata Source of Data
~ .. -..... -....................... -.... -.................. ---_ .... ... _ .. _--- ......... _--1. Area (in 1000 .q. k..) 1981 0.01
2. Eatunated populauoR, ( '000) 198. 2
3. Annual popul.uon Jl'owth rote. (X) I • ., 1.2
, 4. 'ercenule of POpI.I1U10n - h •• than 15 ye.u ... - 6$+ year. . ..
5. Urban populatlon (~} ... b. Rate 01 Datural in(;t"eate of populaUOl'l (1 per annUID) 1984 I.S
1. Crude b1<th rote (per 1000 populotlon) 1984 22
8. Crude deatb raCe (per 1000 population' 1984 7
9. Life expeetancy at bIrth - Total (ye.ra) ... - Itole (y .... ) ... - '~ .. le (ye.ra) ....
10. Infant IIIOt"taUty rate (per 1000 live birth.) 1983 28
11. Tot., t4lrtlllcy rate (women 1)-4,' ~.l'a) ... !12. Soclo-economtC lndlcatora for the y.al' 2000
KaCl .. tN population, ('000) .. , L1fe ~.~ct.ney at b1rth - Kale (Y"") ...
- F .... l. (y .... ) ... Annual po~ul.tioQ growth rot •• (%) .. , Crude b1<tn rate (per luuo populatlanJ ... Crude death rate (per 1000 papul.tion) ... bre of nAtural lnu·e •• e {% per annum) ...
ll. Per Capita Gro •• National Product (eNP} at .. rket prices (USS) ...
:14. II<Ite Or growth at per cap'" GNP (oj . .. :1>. Perc4!nt.a.ge Gro •• Docaeauc Produce {GnP} det'lved
fra. .. nufacturing at COR.t~nt factor coat (t) ... 16. Eeonomlcall, actlVe pop ln pr~ry sector ...
- Nuaber in agricul ture 1 000) ... - Percent 1.1\ all' u::u 1 ture (%) ...
11. Daily per capita calorie supply (calorie.) ... 18. Dally per capita proteIn .upply (Ir ... ) ... 1'. Adul t lit~r .. cy rare - Totd 1983 99
- Hale ... - Feaale ...
20. Ke"lth budget/expendltuTe
... Amount (wSS) 1982-198J 170 284
- Per eapita (WS$) 1982-1983 56.8*
- A •• a' total bu.get 1982~r98J 7.11
Offici.l Esche .. e rat.: US*I.00· US$0.91 (1980)
*Computed by Hlk.
Sauree ll/es:
Ob/83: 06/85:
12/82 :
12/83:
Covernnent's Report on Evaluating Progress in Implementing the Strategies for health for All by the Year 2000, 1985 Report of the Ad.iniatrator of Tokelau for the Year Eoded 31 Karch 1983 Governmentls Reply to Cu.ulacive Toeals of Ca.~s ano Deaths from 18 Selected Oile •• tl for the Years 1983-85 and up to July 1~85 Covern.ent Re.ponae. to ~orld Health Stati.tica Annual Queationnire on Health Manpower, 1982 Country Health Information Profile (CHIP) revised by Gover~"c. 1983
12/83
!J/85
1>/"5
13/85
13/1f5
13/85
13/8S
n/~~
06r83
06/83

Part II P.s- 52 30 Dec ... ber 1985
WESTER" PACifiC REGION DATA BAN~ ON SOCIOECONOMIC AND HEALTH INDICAtORS
r···· .. ·· .. ·········· .. ·· .. · .. ·········· .. ······•···········. . ........ Indic.tor(.) for: TOKELAU Year
~ ........................ --.................................. ••.•..... 1. Heal th manpower
Physicians 1980 Medical a •• i.tant, 1980 Profe •• ional Nur.ing/Midwifery Penonnel 1980
2. TeQ le4~hQC cause. of .ot'b141ty
Dieaue. ol the r •• pirator, .,.te. 19S3 Di •••••• of the dig.stive .y.t .. 1983 Die •• se' of the .ld" 1983 Di.ea.el of the mu.culo.k.letal .y.t .. 1983 Infectiou. and par •• itic di.e •••• 1983 Ill-defined conditione 1983 Diua ••• of the neTVo", ey.t_ 1983 Di.ea ••• of the aenito-urinary .yste. 1983 Diee .. e. of the endocrine .y.tea 1983 Di.ea.e. of the circulatory .y.te. 1983
12] • Le.4ina c.u.e. of'.or~.lity
Dieea.es of the t'elpiratory sy.t .. 198) nilea.e' of the circulatory .yet •• 1983 Neoplaetic dieeae.s 1983 ~.rin.t.l di •••••• 1983
4. t;; •••• and d.ath. for I1x du ••••• under tb. \alO Child.bood Coaaunicable Di ••••••
Diphtheria 1984 Per'tu .. ia 1984 Tet.nu. 1984 Polio.yelitis 1984 Tuberculosis 1984 H •• ,l •• 1984
5. C •• e. for dieea.ea under the WHO AnnUal CD Bulletin
Gonorrhoea 1984 Hepatitia viral - Type A. 1984
- Typ. B 1984 - UNSP 1984
Syphilli. 1984 Trachcaa 1984 y ...... 198"
26. Caeu and deaths for SlX disel.e. under the WHO Konthly CD Notel
Cholera 1984 Dengue fever/ONf 1984 Enc::ephditia 1984 Infloenu 1984 Meningitis 1984 P.taaue 198'
27. ~roport1ot\ of 1nfanc, unde:t one ye8t' of ase ...tlo have • •• fully immunized a,.inst tuberculo.i., diphtheria, poliomyelitis and •• a.1e.
BCG DPT III Polio III "ea. Ie.
28. Per cent of popuhu.on .erve4 WIth .afe v.ter
29. Per cent of populat ion with .dequate .anitary facilities
30. Ptr- cent of low birth weisht infa.... \ C 2499 ar.I .. > 1973-74
31. Haternal .orcahty rate 1.3J
. ....................... ------Data Sourc.e of ,Oat -....................... .._--
Number Ratio per 10 000
4 20.0 12/82 ... ... No. of Ilate per Cue. 1 000
60) 301.50 13/85 3S6 178.0 339 169.5 186 143.0 139 119.5 205 102.5 112 S6.0 105 S2.5 60 30.0 45 22.5
No. of Rate per Deaths 1 000
3 1.5 13/8.5 ) 1.5 1 O.S 1 O.S
C •••• Death. 0 06/85 0 0 0 0 0
Ca ••• 0 06/85 0 0 0 0 0 0
Caae. Deatba 0 06/85 0 0
83 a 0
... 12/85
... " .
4.0-6.8 13/85
0 13/85

WESTIIH PACIFIC REGtON DATA &AHK ON SOCIOICONONIC AHD HEALTH INDICATORS
rart II Page 53 30 December 1985
........................... _ .....•.....................• . ...•...... ._ .......... ................. lndie.tod.) fOr'I Y.ar Oaca Soure. of DaCa ~
~ ............................ --...•.•................... -........... . ............ ................. 1. Ar.a (in IUOO Iq. 100.) 1981 0.10 11/.2
2. l,ti .. t.4 populatlon. (' 000) 1984 91 13/85
J. Annual populatlOft arovth rate, l" 1984 0.9 13/.5
4. 'ercenta •• of populatlon - 1 ... than l~ year. 1982 )9.1 10/82
- 6S+ y.an 1982 ). ) 10/82
5. Urban populatlon U) 1980 3[.8 12/83
6. Rate of natural inc rea •• of populatlon {t per annum} 1983 0.9 13/85
7. Crude birth rate lper 100u population) 198) 2S.6 D/85
8. Crude death rata (P«1' 1000 pop .... lation) 198) 24.1 1)/85
9. Life expectancy at barth - Total ~)'.an~ 1964 60 1l/85 - F.aale (year.) ... - 1U1e (yeau) ...
10. Infant .art.lity rate (per 1000 live birth.) lilltJ 11. 1 D/85
I. Total f .. rtlllty rate (woaen 1 ')-49 yeara) ... 12. Socio-economlc indlcatorll for the year 2000
Eatlaated POpUlatlon. ~'OOO) 2000 119 03/79.1
Life expectancy at birth - Hale (year.) · .. - 'elD&le ~yeer.) · ..
Annual populatlon arowth rate, (U 1995-2000 1.04 Ol{l9.1
Crude butn rate 'per 1000 populatlon) · .. Crude death ute (per 1000 popula,tion) · .. Rate of natural increase ~% per annum} ...
l. Per Capita Gros. National Product ~GNP) at market prices (U5$) 198) 354 or 1l/85
(T$) 41u
14. Rate of growth of per capita GNP l%J . .. 15. Percenta,e Gro •• Dome.tic Product ,COP} derlved
from manufacturin& at con.tant f.ctor co.t (1) 1919 Y.9 14/l:\;!
16. Econoilltcally active pop in primary .ector
- Number in &ancultufie ('OOO) 1~1t1 • OJ/SO
- Percent in &,riculture lX) l't16 43.4 OJ/80
11. Dai ly per caplts calol"ie supply (calori •• ) 198) , 15u 13185
18. Daily per capita protein aupply (sr ... ) ... 19. Adult 1 iteracy rate - Total . ..
- Kale 1976 19 1l/85 - Female ll.5
O. Healtn budget/expendit .... re
- Amount (T$, 1981182 1 664 12\ 06/81
- Per capita ( Tt) 1981/82 16.80 06/81
- o. % or tot .. ' bud"ut 19KI/82 11. ) vet/toil
otticial Exchanae bte: 1 USi • T$ 1.450 (984)
Source 13/850;
fJ)119.1:
0)/6U: 06/80: 061S1: 06/1)5
101Sl: 11/82; 1218): 12/84 :
Covernment'. Report on Itvaluatins Pr<Jgl"ells in Itllpl~menting the Strategies for "ealth for All by the Year 2000, 198~ World Population Trendll "nd ProjectlJ by Country 19>0-2UI)0; Summary k~port of the 1918 A •• e •• ~ent. UN, 19J9 FAD Production Yearbook 1980 Report of the Hiniscry of Health tor l~ijO
keport of the !'linistry uf H~alth tor 1981 Government', Reply to Cumulative Totals of Cases and Deaths from 18 Selected Dilleues for th.e Years 1983-84 and ~p to July 1985 1982 ESCAP Population Data Sheet World Health Statistics Annual 19t:1~j Vital Statilit~c:. ..tnd Cau,es of Death.s Country Health Information Profile (CHIP) revised by ~overnment. 1983 Government Responus to World t'ealth. Statillotics Annual l.lUestionnaire on Health "anpower, 1984 ley Indicators of Developina lternber Coulltriu of ADB, April 1982

.
Part II p .... 54 ]I) J)o_er 1985
YlSTERJ PACIFIC lEGION DATA BAJ& OR SOCIOI~IC &lID IlEALTH IIIDICAlORS
~ .............................................. . .. _ .. _e. Jndie.tor(.) fo~~ TONGA Year
~ ... --.......... ----.... ;;;:: ....... --....... ---.... -......... -- •• 21. H.al th aanpovcr
P11yli ic ian. 1982 Medical a •• i,tant. 1982 Profe •• ional "ur.ina/Midwifery Per.annal 1982
2 •• Ten l.adina eau.e. of IIOrbldlty
Influenza 1981 Conjunctivitia 1981 Caltro-enteritb 1981 Infantile diarrhoea 1981 DenSM: 1981 Ironcho pneu.onta 1981 Adult diarrho •• 1981 Chicken pox 1981 Ke •• l .. (Morbilli) 1981 Lobar pa.WlGal. 1981
~ .. Ten l .. dinl e& ..... or .,tuh.,.. ICD code
Nepbriti •• D.p~rotic .,adra.. .nd nephro.h 350 1980 Pnewaooi. 321 1980 Diabete. mellitu. 181 1910 leehaeaie heart dlie .... e 27 1980 Acute .yoeardi.1 270 1980 Heninsoeoce.l infection 036 1910 Cerebrov •• cul.r die •••• 29 1910 Septicaemia 038 1910 "ypertenaive 4ia.a,. 26 1980 Halignant naop1 ... of f ... I, br •• ,t 113 1980 Poi.onina and toxic affect. 53 1910
~ .. c •••• _!I'd d •• t~~_ror ,1K 01 ••••••
under the WHO-I'l Diphtheria 1984 Pertu .. ia 1984 Tet.nul 1984 Poliomyeliti. 1984 Tubereulaai. 1984 H ••• l .. 1984
25. C •••• _ t~r cU~.a •• 1 ,",tier the WHO Annu.l CD lutl.tin
Gonorrho •• 1984 Hep.titie viral - Typo A 1984
- Type B 1984 - UMSP 19114
Sypbillil 1984 Trachoma 1984 y .... 1984
26. Ca.ea an4 4eath' for .iK di.e •••• under the WHO Honthly CD Not ••
Cholera 1984 Denlue fever/DHF 1984 Eneephaliti" 1984 Influen&1 1984 Heninlitil 1984 Plalu, 1984
27. Proport1on of 1n1:8D[8 under on. year of ai' who have been fully ia.unized a.ainlt tuberculolia. diphtheria. poliomyeliti. and .... h. 1984
BCC DPT III Pol io III He.alea
B. Per ceot of population .e~ved with •• fe water 1984
9. Per cent of populatioa with adequate •• nltary facilities 1984
flO. ler cent of low birth weight inf~nt. ( ~ 2499 graml) 1984
131 • Haternal mortanty rate
*Medically certified
Data Source of Deta --_.--_ .... R..-bel' bUo pe't'
10 000 41 4.1 12/114 16 1.6
161 16.1
MOa of Rate per C •• e. 100 000
8 778 8 924 06/80 5 524 5 616 2 340 2 379 I 451 1 415 I 362 I 389 I I~O. I \39
410· 488 302 307 187 190 168 171
NOa of Rate per D.ath. lOa 000
22 22 06/80 17 17 16 16 13 13 i2 12 10 10 10 10 8 8 8 8 7 7 7 7
C •••• neath' 0 0 06/85 4 0 I 1 0 0
46 5 ; 0
c •••• 31 06/8;
0 0 0 0 I 0
Cue. D •• th. 0 0
.
06/85 180 0
0 0 20 116· 0
4 4 0 0
80 13/85
9; 13/8;
40 13/8S
< 2 13/85
...
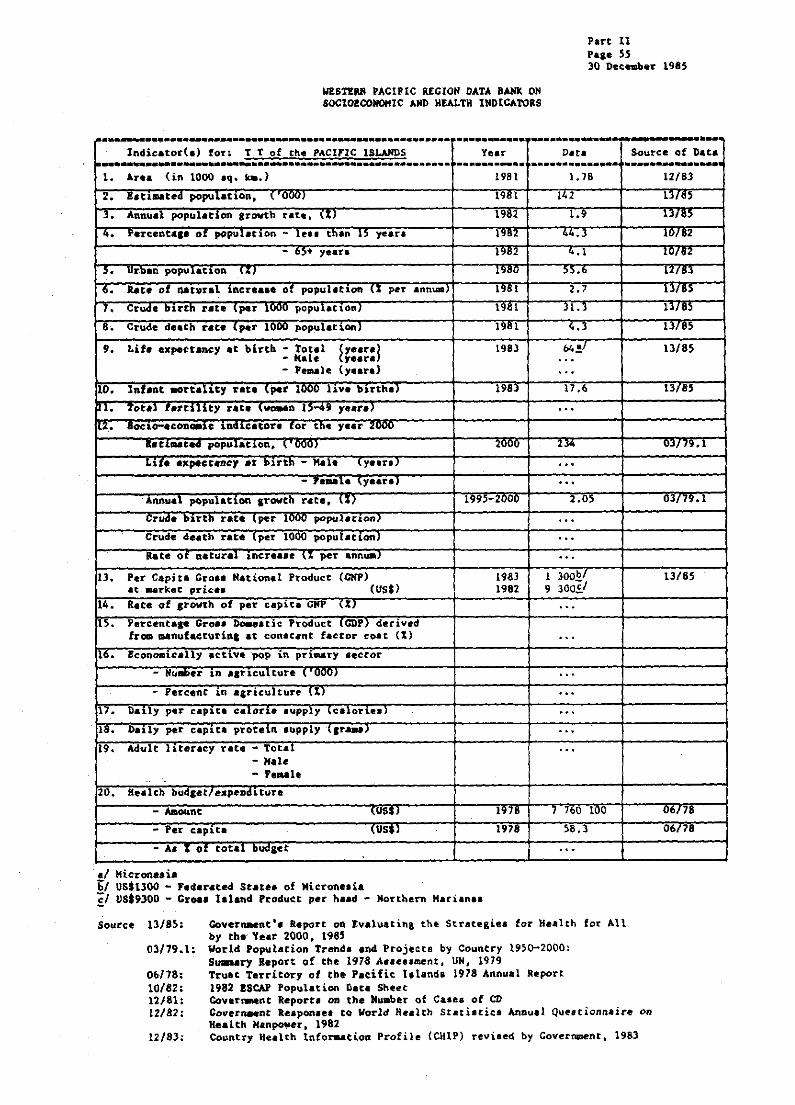
Parc II 'age S5 30 Decnabel' 1985
WESTERN PACIPIC REGION OATA BANk ON SOCIOICO_IC ANO HEALTH INDICAtoRS
~ .. -----....... ---..... -.-........ -.............. -....... ........... .. .............. --lndicator(.) for. T T of the PACIFIC ISLANDS Year Dn'a Source of O.ta ~ ... --.......... -... -......................... --... -..... . ... _._ .. . ...•.••... ~. .. .... __ ... -
1- Ar •• (in 1000 .q. ~.) 1981 1. 18
2. I.tu .. ted popul.tlon, ('000) 1981 142
3. Annual population arovth rate. (XJ 1932 1~9
~. Percenta,. 01' popUlatlOn .. leal ttlan l~ yean 1982 ".3
- 65+ y.ar. 1982 4-.1
5. Urb.n population (l) 1980 55.6
6. bee of natural in.er ••• e of popuhtlon U pe-r annUlI) 1981 2.7
1. Cr .... DlCth rote .por lWU populOUOn} 1981 31.3
8. Crude de.th r.t. (por 1000 population) 1981 4.3
9. Life expeerancy at birth - Tot.l ~y •• rol 1983 b4~1 ... Hate ye.r. , , , - '.lUle (yeara) ' ..
10. lnf ... t urc-Uty .. to (por 1000 I ... DlCth.1 198:r 17 .6
11. :rota1 rortnuy uto \_n I''''" y •• n) · .. ,12. loe,o-a.on_" ,n41 •• toro for tho y .... uuu
.. u ... t ... popu'Atlon. \. 000) 2000 Z14
Lita axpo.t.ney at !>arth - IIola (y •• ro) · .. - 7 .... 10 Iy •• rol '"
Annual populatlon Irovth r.te, II) 1995-200~ 2.05
... rUDe Dutn rota .por 1uuu population} ... Crude death rate (per 1000 populationl ... hte or natural lncr.a,e \1 per ann_) '"
13, Per CapitA Cro •• National P~odu~t CCHP) 1983 I 300£1 at .arket pric •• (US$) 1982 9 300,£/
14. R.te of growth of pet' capna GNP (.to) · .. IS. Percent.,e Grol. I>o.e.tie Product (CDP) derived
from aaftufactut'inl at con. cant factor coat (X) ... 16. Economic.11y .ctive pop in prl.-ry lector
- Nullber In 'Inculture ('000) · .. - Percent 1ft .Criculture {X) ...
11. n.11y per capna celon,e luppl)' 'cdol'l,es) . .. 1", .Duly per caplU protein 'upp1y (sr .... > ... 19. Adult Ilteracy r.t. - T.u1 . ..
- Hale - '.aale
20. ft.alch bud,et/e2peoditur.
- Mount "" .. , 1978 7 760 100
- 'Per c..pUa IUS$) 197e 58.3
- Ao I or tot&! bwset ... ·.1 Hicrone.h hI US$1300 - Federated St.te. of Microne.ia £/ US$9300 - Groa. leland Produ~t per haad - Northern Hari.na.
Source 13/85:
03/79.1:
06/78; 10/82 : 12J81 : 12{82:
12/83:
Govern.ent'. Report on Evalu.ti~& the Stratesie. tor He~lth for All by the' Ye.r 2000, 1985 World Population Trend. and Projects by Country 1950-2000: Suam.ry leport of the 1978 A •• ee.ment, UN, 1919 Truat Territory of the Pacific t.landt 1918 Annual Report 1982 !SCAP Population Cata Sheet Cov.r~nt Report. on the Mumber of Cases of CD Covern.ent iespon.es to World He.lth St.tiatics 4nnu«1 Que.tionnaire on He.lth HanpOVel", 1982 Country Kealth Infor..tioa Profile (CHIP) revised by CoverRDent. 1983
12183
13185
-1116)
IOTW-2
10/82
12{83
III 8)
11/85
13/85
13/85
nrS5
03/79.1
03/79.1
13/85
06178
06n8

'Put 'II Pale 56 30 net-.oor 1985
NESTE.. PACIFIC IECION DATA ~ OR SOClOECO_lC AlII) II!A~TH IIIIlICAtoU
............................................................ ----- ,. ...................... --lndie,tod,) _for: T T of the PACIFIC I$LANDS Y ... r O&ta ............................................................ .. _--~ ... -.--..... -..
1. H.edth .. npover "UIDber aatio per 10000
Phydden. 1980 46 3.4 Medical a,.i.tanta 1980 46 3.4 Profe •• ional Nur.ina/Midvjf~ry Per.onn.t 1980 19J 14.3
2. Ten lead-lna reported , ..... 01 norifiable dt •••• e.· Mo. of aate "r c •••• 100 000
Influenza ) $S6 393.3 GIstroenteriti., pre.u.ed infect lOU' ) 344 230.9 Conjunctivitis ) 1$2 102.0 Gonorrhea ) 87 58.3 "-D.biuia ) ". 80 51 .. ) Dian'ho.a. pr •• ~d infe,tiou. ) of 60 40.2
- children/adult_ ) April Chickenpox ) 19&5 60 40.2 Hepatitie - viral, type It ) 25 16.8 Fhh pobortin., , 17 lI.4 Streptococc.l .ore thr-oat/ac:arlet fever I l3 8.7
p. Leachal c"u ••• 01 .Ct"t.llty Ho. of Ilate per Death. 100 000
Di.e.sea of the he.rt 1983 ... 47.0 Cancer 1983 .. , 32.8 Chronic obatructive pul.onary db ••••• 1983 . .. 26.1 Cerebrova.eular die.a'e 1983 ... 21.6 Influenca and pneu.ofti. 1983 ... 21.6 Di.~~ho •• l di •••••• 1981 ... 19.' Acc:idenU, .U typal 1983 ... 11.9 PrelUturity 1983 ... 11.9 Suicide 1983 ... 14.2 Diabetes mel1itu. 198) ... 13.4 Certain di •••••• , urly infancy 1983 ... 10.'
~ .. Ca.e. and d •• n., for eu dUe ..... under the WHO-BPI C •••• Death-.
Diphtheri.a 198. 0 ... Pertusais 1984 4S1 " . Tetanua 1984 0 ... Po liOllY.Ii t h 198. 0 .. , Tuberculosi. 1984 88 ... Hea.I.e. 1984 0 .. ,
~,. Ca •• s for dl.e •••• under the WHO Annual CD Bulletin Ca.e.
Conorrhoea 1980 524 Hep.tid. viral - Type A 1980 .. ,
- T1Fe J 1980 ... - IJIISP 1980 13
Syphill i. 1980 -'.
TTacllOQl:a 1980 ... Ya ... 1980 -
p6. C •• e. and death. for ILX dL.e., •• Vftd.~ the WHO Monthly CD "otee e.a •• 'D •• the
Cholera 1980 -Den.gue fever/DKP 1980 -tneeph'lith 1980 -lntlueft .. a 1980 16 )00 ... Heninaitil 1980 19 '" Plasue 1980 -
21. Proport 10n of lntaaU under one ye.r ot ai_ VhO .... ve been fully i .. unized _.aina, tuberculo.i •• diphthed_, poliomyeliti •• nd •• aalee 1981-84 30-99
BeG DPT III Polio tIl He •• le. .
8. Per cent of populatlon lerved wLch ,.f. v.ter 1983 60
p9. Per cent of population vlth adequate .a"ltary facili.tiea 1983 )0
pO. Per cent of low birth ve~.ht inhn .. , C 249 ...... , 1019-8l 6.0- 7.4
pl. M.t.rn.~ ~rta'lty r.te 1902 I;,)
._ ...... _.-SOUTC* of Du.
1--•• _."---
12182
1l/85
•
D/8S
13/85
12/81
121SI
13/S~
!J/BS
I3/8S
13/85
13/85

WIITIJM PACIFIC REGION DATA BANK ON SOCIO&COROKIC AND HEALTH lNDICATORS
Part II 'a,,, )1 30 llec",ber 1985
. r .. ····_··_·_ .. ·_··_······_····_··· __ ••••••••••• ..... -... .._ ......... - ................ Indicator(,) for; Yea'r nata Source of DaCa !!!2!:!!
~ .......................... --............................ ........... . .•........•.•. . __ ._ ..... --I. Are. (in 1000 oq. b.) 1982 .026 12/83
l. I,ttl_teo pOp~1.tl0n, I 'UW) I .... 8 1){85
3. Annual po~ul.tion arowth ute. (tl 1983 1.5 13/85
1 4 • Ptrcenta,. ot populat1on - Je •• chan )' year. In. 33.4 10/82
- 6S+ year. 1979 4.1 10/02
>. Ur.an popula"on 'il · .. 6. Rae .. of n.tut.) lnt'r .... of populaUDI\ (1 per annum) 1983 1.5 IJ/8)
7. CruGe Dlrth ute (por IDDU populaUonl 19.3 2 •• 5 1"8' 8. Crud. d.ath rat. (per 1000 populotion) 1983 7.5 ,,,0> •• LUe expectancy at Duth - Total (y.a .. 1 1'83 · .. 13/8'
- "ale (y.an) 57 - Fe.ale <yeIC") 60
10. Infant .artality 'rate (per 1000 live birt~s) 1984 45.6 13/85
tl. Total f.rtlHty rate (v_n 1>-4. ye.n) 1.82 2.0+ 10/62
12. SocLo-econoaie 1ndicator. for the year 200u
~.tl~tect populahOft a ( 000) · .. Lif. expectancy at birth - Kale ( yeanl · ..
- 'e.,1. (ye4r.J · .. Annual popullt10n arowth rate, II) 1995-2000 0.00 OJ179.1
Crude bHth rate (per IUUU popuUtlonl ... Crude death rate (por 1000 populltionl · .. Rite of natut'al 1nCTea •• \~ pel' armum) · ..
13. Per Capita Croae kationa! Product U:'P). 1983 360 13/85 .t market prit.. (ust) or
(Auet.t) 4)0
14. Rate ot growth of per caplta eNP 1" · .. 15. Percenta •• Cro .. Domestic PToduct ~CD'} denve<l
fra. .. nufacturina at con.tant ractor co.t (Xl · .. ,16. Econ~1cally active pop ln prl"ry •• ctor
- Hu~.r In .Srlculture ( Ooo) ... - Percent 1n a&rltultUI't! (%) · ..
17. Dally per caplta e.lone auppl, (calonu) · .. 18. Dally per clpita protein 8upply llr ••• ' ... 19. Adult hterac), rU:. - Totll 190J 9, IJ{85
.. Hale · .. - Fe .. le · ..
20. Health budget/expenditure
- Alliount (Au .. " 1980 243 135 06/82
- Per capita (Au.t$) 1980 33 06/82
- A. x 0' totO! budS" 1980 7.8 06{82
Source 13/85: Governeent'. Report on Ivaluating Progre •• in t.plementing the Stretecie. for Health for All by the Y.ar 2000, 1985 World Population Trend. and Prospects by Country, 1950-2000. Su..ary Report of the 1918 Assessment, UN, 1919
03/19.1:
06/82 : 0&/85:
10/82; 12/83; 12/8):
"iniatry of Social Services, Health Diviaion Annual Rerort, 1982 Covernment'. Reply to Cuaulative Tota1a of Case. and Deaths from 18 Selected Di.e •• ea for the Year. 1983-&4 and up to July }985 1982 ESCAP Population Det. S~eet Country Health Inror.ation Profile (CHIP) r~vi.ed by Covernment, 198) Covern.ent Re.pon.e. to World Health Srari.ric. Annu.l Que.tionnaire on H •• lch Kanpower. 1983

Part n Pa,. 58 )0 /Ieee .... ' 1985
WEST!lN PACIfIC RECION nATA lANK ON SOCIOKCO»QNIC AND HEALTH INDICATORS
~ ... ----............... -............. -............. --........• -- r-._-tndicatorh) for: TUVAJ-U' Y ....
~-.-••• -----.... --...... -=:;;; ............. -----................ ~ .... -~1. ".alth .. npower
Phy.ieia,... 1981 Medical ••• i,tant. 1981 Profe •• ion.l Nur.inc/"idvif~ry Per.oonel 1981
122 • Leadlna -caua •• of .orbldUy
A,ute respiratory infection. U8) Di.rrho •• l ,db.a.e. 1983 Conjunetivith 1983 Skin infection. 1983
13. leadina: e.u ••• of .ortaht)'
ni.e •••• of c.rdio~a.cular '7.t.- 1983 Pul.an.ry infectiort8, includina pulaonary tuberculo.i. 1983 Still birth and perinatal death 1983 Liver die.a •• 1983 Cer.brov •• cular dbeae. 1983
fl"· C •• e. .nd death. for Qnder the WRO-IPI
.n duea.e.
Diphtheria 1984 P.rtu •• h 1984 Tet.nUII 1984 PoliOlly.litia 1984 TQb.l"cul0.iI 1984 Hea.l •• 1984
I'''' C .... ror du ••••• under the WJIO Annual CD BUi-U.tin
Conorrhoe .. 1984 Hepatiti. viral - type A \984
- typo 8 1984 - UNSP 1984
Syphilli. 1984 frachCMU 1984 y .... 1984
IZo. (; •••• and d.atne fOI'
WHO Monthly CD NoC.' .I~ dl •••••• und.r the
Ololer. 1980 Dengue fove./DIIP 1980 Eneephalith 1980 lnfluenu 1980 Henin&itie 1980 P1_,ue 1980
27. Proportion of infant. under one ye.r of a,_ who have b.en fully i-.uni£ed alain.t tubereuloai&, diphthetb, polia-yeliti. and a&a.lea
PPT III 1983 BCC 1983 (!ootio tlI 1983 Me. •• le. 1983
28. Per cent of population .erv-eeI VI ttl I.te ",.ter 1.84
29. Per cent ot populltion vith .adequate- •• nU.rr faci litiea 1984
30. Per cent of low birth veiah' inr.nta \ C 2499 " ... J
1983
'31. ".ternal_mortallty rate 1963
........................ ~ ............... D.U, Source.of Data :-.. __ ... _----... ....... -.. -
Number RAtio per 10000
4 5.0 22/83 8 10.0
18 22.S
No. of Rate ,e'f' C •• e. 100 000
.
· .. . .. 13/85 · .. ... · .. · .. · .. · ..
No. of Rate per Death. 100 000 · .. · .. 13/85 · .. ...
· .. · .. · .. · .. .. . ... C ..... De.th.
0 0 06/8S 0 0 0 0 0 0 9 0 0 0
-'
C •••• 1 06/85 0 0
71 0 0 0
C •••• D •• th. 0 0 06/85 0 0 0 0
3 876 0 8 3 0 0
76 13/85 toO 82 65
100 13/85
80 Il/B5
3 13/85
2.) 13/8'

Part 11 Page 59 30 December 1985
WESTERN PACIFIC REGlON DATA 8~ ON SOCIOECO"OMIC AND HEALTH INDICATORS
IndicatorCe> for: Year Data
I. Area (in 1000 .q. km.> 1981 12.19
2. Eo " ... t •• «on, ('000) 1984 llO
1. Annual tion arowth rat., (I) 1979 3.2
~. or I ... t.an I> y .... 1979 45.4
- 6h y.a .. 1979 2.9 ,. Urb.n popu •• tion (X) TIn 17 .8
6. Rat. ot nuur .. incr .... of popu'."on (X po< .nn .... ) 1983 3.2
7. ..ruo. Dlnn ron \ per 1000 _, "OR' , •• J .)
•• Crud •••• t. rate {per .000 ,tonI 1983 II
9. ~1ta at .mn _ ~:::. ;~' :; 1'.' ... 56
- F ... le "7' 54
ilO. Infant rat. (par 1000 livo birth.,) 1984 75
Ill, Tot •• ., rota (wOllen 15-" y .... ) 1983 6.6
IU. tor the yo .. 2000 E •• _ " ('000) '2000 166
Life .t birth - K.l0 ly •• u) ... - Fo .. l. 'T .. ,
Annual rot., (I) I' 1.83
Crude b .. t. rat. (por 1000 popu] ... .. rUd. d •• tn rat. (per IUUU ... Rate of Duur ..... (1 per annum, "
U. Per ';';k;t ,,~o .. (GIIP) (US$) at prl.c" 1982 529 or
(VAru) 42 320
14. Kat. ot ,rowtn o. por c.pt fa GNP ( .. 19~v"" loS
l>. from Gro.~ DOID .. tic Product (CDP! derived :turina a' constant factor coo, (1) ...
16. active pop in • T .ector
- Nu""" tn .,ricultur. l'OUU) 1979 41.5
- in '0' (X) 1979 79
17. Daily per cap "a •• ' .upply .- , ) 1979 2 546
10. Da"y per capi ta .upply (BraU' I.,. 68.4
... Mult 11 rote - TO'al .. , - Hale - Fe.al.
20, He.l th
- (F"H) 1981 280 019 000
- Per cap;'a (FNH) 1981 2 295.2
- A. 1 of totol budget ... Official Exchange rate: US$ 1.00· VATU 107.40 (1984)
Source of Data
12/83
13/85
06/84
06/84
, 06/84
00/84
11/85
U/.,
13/85
-137.,
13/85
06/84
03/19.1
03/79.1
13/85
12/84
12/84
12{84
1l/85
IJT.,
12/84
12/84
Source 13/8S: Covenaent I 8; Re_?Ort on Evaluating Progress in Implement ing the Strategies for Health for All by the Year 2000. 1985
03/79.1: World Population Trends and Projects by Country 1950-2000: Su..ary Report of the 1978 A8.eesment. UN, 1979
06/84: Infor.ation furnished by the National Health Office. Vanuatu, 7 August 1984 06/85: CoveT~ent"8 Reply to Cumulative Totals of C.les and Death. from 18 Selected
Di.e •• es for the Year. 1983-84 and up to July 1985 12/82: Covernment Reapon ••• to World Health Statistics Annual Questionnaire
on Health Hanp~wer. 1982 12/83: Country Health Information Profile (CHIP) revised by Covernment, 1983 12/84; WPR Oaca Bank updated by CLO, Vila, 1983 and 1984
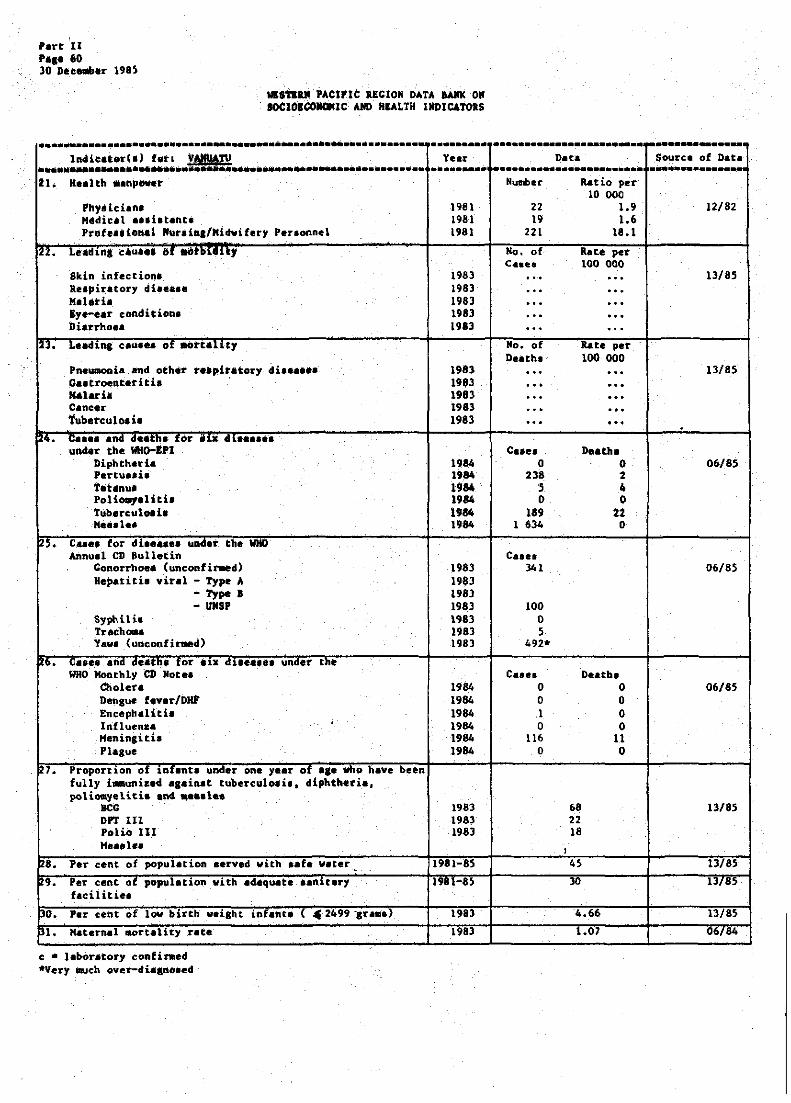
'.rt 'II P... 60 30 D •• labo. 198~
.. snlll P4CIFIC RlCIOH D4TA _ ON 1OC10lCOlQMIC AND HIALTH IMDIC&TOtS
H •• lth .Itlpwer
'hylllcio •• "edit.l I •• i.tant. Ptuteijio"_1 Jur.ina/Midwifery Pe".onnel
Skin infection. Re.piratory diaea •• MIi.ti. Eye-ear condition. biarrho.a
Pneumonia and other r •• pl~.tory di •••••• C.attoentetiti. Mo1ui. C.ncer TuberculOi b
under the Diphtheria Pertu. •• i. Tltinul PoB_olitb Tuberculolil Hea.le.
Annual CD Julletin Conorrhoea (unconfir.ed) Hepatitia viral - Type A
- Type J -IIMSP
Syphilh Trachaaa Yaw. (~nconfirmed)
WHO Monthly ·CD Hot •• <!holera Dengue t4ver/DHf Eneephalith Influenza Heningitis Plague
fully i .. unizld I.ain.t tubercula.i •• polia.yelitia .04 •••• 1 ••
BeG DPT 111 Polio III Heaele.
c • I.bor.tory confir.ed -Very wuch over-di •• no.ed
Yelr
1981 1981 1981
1983 1981 1983 1983 1983
1983 1983 1983 1983 1983
1984 1984 1984 1984 1984 1984
1983 1983 1983 1983 1983 1983 1983
1984 1984 1984 1984 1984 1984
1~83
1~83
1983
nat. Sou'Z'ca of Data.
Number Ratio per 10 DOO
22 1.9 12182 19 1.6
221 18.1
13/85
Death. 100 000 13/8$
Ce.e. D •• the 0 0 06/85
238 2 , 4 0 0
189 22 1 634 0
C •• es 341 06/85
100 0 5
492*
C •••• Deatba a 0 06/85 0 0 1 0 0 0
116 \I 0 0
68 13/85 22 18

WESTERN PACIFIC REGION DATA BANK ON SOCIOECONOMIC AND HEALTH INDICATORS
Part II Page 61 30 December 1985
~ ...... -................................................. . .......... --........•.••. • •••••••••••••• Indicator( I) for: SOCIALIST REPUBLIC OF VIET HAM Year Oat. Source of Oata
~ ........................................................ ......•.... . ............. . ..... -..... -I. Ar •• (in 1000 oq. ~.) 1981 331.69 12/83
2. EIUmated population. ( 000) 1983 57 442 13/85
J. Annual populaUoa arovth rate. (1) 1983 2.3' 13/",
... Pereentase or popuutlon - Ina than 1) yeau 1980 41.2 12T8Y
- b)+ ye.rl 1980 3;6 ,2/83
,. Uroo. population ,., 19S1 19.0 14/83
6. Rate of natural iQcre ••• of population U per annwn) 1983 2.2 11185
1. Cru •• bLrt. rot. 'per 100U popuLouon, I'.' 29.3 Ilr8S
•• Crud. d.ath rate (per 1000 popuhuon) 1983 7.08 13l8S
9. Lite expectency et birth - To,oI Iy .... ! 1982 ... 1l/85 - Hale (y.an) 62 - Fe .. l. (y •• rl) 66
10. Infent .ortalit7 rete (por 1000 live bir,h.) 1983 33.5 13/85
U. Total fertility ro'e (v_n 15-49 yoer.> 1975-1980 5.8 P/S3
12. Socio-ecooo.ic indicator. for the y.ar 2000
E.ti ..... populatlon, I 000) 2000 79 355 03!?9.1
101re expecteDcy at Dutn - Mal. (y .... ) 1995-2000 55.7 03179.1
- F ... lo Iy •• ro) 1995-2000 59.2 03179.1
Annual popul.tioo arowth rate, l%J 1995-2000 I.S1 03{79.1
Cr"". birth ra .. lpor 10uu POPulO',on) 1995-2000 29.0 03/79.1
Crude de.th r ... (per 1000 POPUlo',on) 1995-2000 10.9 03/79.1
late or natural 1ncre ••• U per aMu.} 19.5-2000 1.81 03/79.1
u. Per Capi,a G~o .. N.,ional Produe. (GNP) .t •• rtlt pfIC., (US,) 1983 500 13/85
I~. bt. 01 sr_tn or per eap:a.ta (;IfP U,} ..,
15. Percenta.e Cro •• nOM,he Product (CDP) denved from aanuflcturina It con.t.nt factor COlt (%) ...
16. leona-lcally Icttve pop 1" prlmary lector
- Nu,,",er ,. aaneul,ur. (' 000) 19S0 16 847 Ur83
- Percent in oldeulture 1%) 1980 70.6 12/83
17. Dilly per caplta calone lupply (calo'fLes) I.S3 2 000 13/S5
18. Deily per capita protein luppl,. llra.l) ... 1 •• Adu! t 11 terecy rate - Total f983 96 13/85
- 'Male - , ... 1.
20. Health budget/e.penditure
- Amount ... - Per capit. . .. - A. % of total budget 1.81 6 12/83
Source 13/85": Covernaent'l Report on Evalulting Progr ••• in I.plementing the Str.tegiel for K.alch for All by the Ye.r 2000, 1985
03179.1:
10/82: 12/81: 121S2 :
12/83: 12/S3: 14/83:
World Population Trendl and Prolpeets by Country. 1950-2000: Su.aary Report of the 1918 A.leulIlent. UN, 1919 1982 ESCAP Population Data Sheet Covernaent Report. on the Humber of Caaes of CD CovernMnt'l Response. to World Health Statistics Annual Questionnai're on Health Manpower, 1982 Country Health lnform.tion Profile <CHIP) revised by Government. 1981 and 1983 WPR Data Bank updated by waC/Hanoi. 1983 1983 World Population Data Sheet. Population Reference Bureau. Inc •• W.lhingtoD. DC

'.rt 11 .... 62 30 De ...... 1985
.-naII .ACUIC UCIOil DATA ... 01 IOCIOB~C AID Il&ALTB IIQ)ICA!Olll
lndlcotor(.) fo •• t.a\"
ch ..." ...... ,,,y.lcla,,. 1981 Medical ••• i.tant. 1981 P~of ••• iOp.l Nur ... 19a1 Hidtdv •• 1981
tnflue"u 470-474 1980 Dia~l'ho •• l 4i ..... 009 1980 Dyo ..... ,. 1980 Malaii. 084 19aO Arthropod-borne hae.orrha.ie r ..... r 061 1980 ~oopilll eouah Oll 1980 H •• ilei 055 1980 APC 1980 -po 072 1980 Qlickenpo¥ OS2 1980
Interitie AS 1980 Avita1!l!inoee. 6 other nutl'itiotUll cleficieac,. A6S 1980 B.cil1.ry 4,.entery and a.oebi •• i, A4 1980 Tubereul~l. of .. e.pi .. alory eyat .. 106 .1980 Mahria All 1980 Otb.r di •••••• of dl ... tivi 1,lt •• 10104 1980 Cholera AI 1980 Vir.l .nc.phelici. 1027 1980 Other di •••••• of r .. ,ir.to~ .,..t. 1096 1980 Other fonu of hurt J.84 1980
und... the WHO-IPI Dlphtbo.1o 1983 Pertullb 1983 Tetenu. 1983 Poliomyelitil 1983 Tubereulo.ia 1983 Meaale. 1983
.Atuwel CD Bulletin GonOrrhoea 1980 Hepatiti. vl~.l - Type A 1980
- Typo. 1980 - UHSP 1980
Syphill ia 1980
_0. 44 400
74 600 13 900
eo ... 371 262 349 914 135 953
91 92a 68 990 67 318 57 991 S2 443 23 3a6 19 752
Death. 2 003 1 4S6 1 341 1 093
826 115 114 694 SU 496
C •••• 1480
92 18 23
631 SSI
C •••• I 665
15 667 616
TrachOlU 1980 1 069 808 Yaw. 1980
WHO Monthly CD aDt.1 C •••• Otolera 1982 57 Denaue fev.r/DlIP 1982 31 973 Encephaliti. 1982 I 890 Influea.-"I 1982 362 208 Heninaitil 1982 2 403 'Plague 1982 146
01\8 y .... i-.uni~.d a.aia.t tub.rculo.il.
polio.yeliti. and .. aal •• 1983 BOO DPT IU Polio tIl )Ieall ••
*.Itlo per 1 000 fe •• l ••
Data of Data
a.tio Per 10 000
8.0 12182
13.6 4.9*
100 691 12/83 '651 253 171 128 125 108 98 44 31
100 4 12/83 3 3 2 2 1 I 1 1 1
Deathl 13/85
n/81
(6)
n.athe ... 12/81
50-70 13/85
30 13/85

WESTERN PACIFIC RECION DATA BANk ON SOCIOECO~lC AKD HEALTH IHOICATORS
Pan: 11 Page 63 )0 Deceaber 1985
~ ... -.. -........ -.--.---.--.. -------... -............ -.... .......... .~ .. -.......... . .............. Indicatod.) for~ WALLIS AIID PUTUIIA Year Data Source of Data
~ ............. --................ --....................... . ..••..... ..•.•.......••. . .............. 1. Ar •• (in 1000 aq. ka.) 1981 0.255 12182
2. B.t~t.d popul.tlOft, \. 000) 1982 10 12182
J. Annual population &rovth rate, (X) ... -. r.n." •••• OE p.p .. l.hn - ,... • ... 1\ ., yea .. ...
- ~)+ y.an · .. ,. uroon popu1.UOII (I) ...
1. 6 • Ic •• ot n ....... l .ncr .... of popoloUon (I p.' annUlI) ... 7. Cr ..... blrtb rato Ip •• lOVe populot,onl ... 8.
9.
10.
~l.
12.
11.
,'4.
IS.
1 ••
17.
18.
19.
20.
~ru" do •• n .... 'par luw populo., •• , · .. Life expectAncy at blrtb - Total (yeara?
- Male (yeareJ ... - Fe_le (:y •• r.) ...
l"font ....... Uty rate (por 1000 llvo buthl) '"
Tou ••• rt111.y .at. Iv_o 1)-49 yun) ... Socio-econo.ic indicator. for tbe year 2000
Eah ... ed popuhuon, ( 000) 2000 9
Llf. expec:tAD_C1 at birtb - Total ly ..... 1
- H.u IY.oro, ... - Pe.a1e (ye.reJ ...
Annual popu lat lon Irowth rate. l~) 1995-2000 0.00
Crude -birth rate \ per IOuu popula:tl.on} ... Crude deatn rate (per 1000 populaUOO) ... Kete of natural in~r ... a n per ann.,.) ...
Per Cap1ta ero •• NatIonal Product (eNP) at IUrket pri.ce. (US,) .. , K.te or Irowtn or pe. cap, •• "nr, ,~, ... Percenta,e Cro •• DOIDea"r:ic_ Product (CDP) derived from •• nufacturinl at con.tant factor co.t (Z) ... !conomlcal1y act1ve pop In prl~ry .ector
- Number In .agrICulture ('OOU) ... - Percent 1n ., .. culture 'X, ...
Dally per capita calorle .upply \cotlora.ea) .. , Daily per capita protein .upply (11' ••• ) · .. Adult ltteracy rate - 'total ...
- Hale - Pealle
Realth buda.et! expenditure
- Mount ... - Per capita ... - A. % of total bud,". ... 03/79.1:
11/75: 12/81: 12/82, 12/82.1: 12182.2: 12/83:
World Population Trend. and Pro.pect. by Country. 19S0-2000: Su ... rY-Repert of the 1978 A ••••• ~nt, UN, 1979 Fifth Report on the World Health S~tu.tion 1969-1972, WHO, 1975 Gov.rn.ent Reporta on the Mu.ber of C.... of CD COUQcry Health Infor.ation Profile (CHIP) raviaed. 1982 Leaflot on Childhood CD, Repor. 3/82 Covernaent ' • Reply to !PI Healtb Information Sy.tea Questionnaire, 1982 Govern.ent Response. to Wo~ld Health Statistic. Annual Questionnaire on Health Manpower, 1983
03(79.1
03/79.1
14/80: South Pacific Epideaiolo,ic.l and Health lnfor .. tion Service, Annual Report 1980

"art 11 Po.. 64 30 OO •• 8b •• 1985
WllTER. PACI.IC JIG ION DATA IANR OM aoctOiCOllCllltC AIIIl I1RALTII IIID1CATOR8
tor:
"el1th .. npow.r
'hy.iei .... Medicil I •• i.tlnt. Profe •• ional NUT.ial/Midwifery 'erlonaet
Il\f1\&8,,;'. Mel.l •• Conj"nc t i vi t 11 Denlu, Hepatiti •• virll type A Syphilh Tuberculo.i., pul.oalry _oebiasi, Conorrhoe. Lepro.y Iheu.atic fev.~. acute
lirth injury. etc Heart di ••••• "'_i. Aviea.iao •• a. etc Malian_DC neopla .. 8yaaptOlU. et.c Congenital 1D0001ie.
under the WHO-BPI Diphtheria 'll'tu •• i. Tet.nul Po!ioeyaHtia Tuberculo.ia Kea.I.1
Annual- CD Bulletin Gonorrhoea Hepatitis viral - Type A
- Type B
Syphillh TrachOllA Y.".
WHO Monthly CD Note. o.olerA
- IlNSP
Dengue fever/ORr Enc.ph.titie la.fluen&1 Meninaitia, Pla,ue
one Y •• r'
fully i..unized e •• ia.t tuberculOli •• poli~eliti. and •••• 1 ••
BCG DPT III Polio III Hea.te.
487 055 372 061 070.1
090-091 010-012
006 098 030
390-392
Year
1982 1982 1982
1980 1980 1980 1980 1980 1980 1980 1980 1980 1980 1980
1912 1972 1972 1972 1972 1972 1972
1984 1984
1980 1980 1980 1980 1960 1980 1980
1980 1980 1980 1980 1980 1980
1982 1982
Nuoober
4
4
Ca ••• 2 307
342 191 21
4 3 3 1 1 1 1
Death_ 18 10 8 7 ; ; 4
<:a.e.
14 4
Ca.e. 1 2
1
CA •••
1
1
695
100 72.1
Source of kc.
Ratio per 10 000
4.0 11/81
4.0
100 21 361 14/1IO
3 167 1 769
194 37 28 28.
9 9 9 9
100000 180 11/75 100 80 70 SO SO 40
Death.
06/85
12/81
Death. 12/81
12/82.2

WORLD HEALTH ORGANIZATION Regional Office for the Western Pacific
WESTERN PACIFIC REGION DATA BANK
ON SOCIOECONOMIC AND HEALTH INDICATORS
PART III GLOBAL AND REGIONAL INDICATORS TO MONITOR/EVALUATE STRATEGIES
FOR HEALTH FOR ALL BY 2000

• SOCIOECONOMIC AND HEALTH INDICATORS
PART III GLOBAL AND REGIONAL INDICATORS
TO MONITOR/EVALUATE STRATEGIES fOR HEALTH fOR ALL BY 2000
(a) Health policy indicators
(b) Socioeconomic indicators
TABLE OF CONTENTS
Indicators
Health for all has received endorsement as policy at the highest official level (Gl)
Mechanisms for involving people 1n the implementation of strategies have been formed or
Page
I
strengthened, and are actually functioning (G2) 1
At least 5% of [he gross national product is spent on health (G3) 1
A reasonable percentage of national health expenditure is devoted to primary health care (G4) 1
Resources are equitably distributed (GS) 1
Defined strategies for health for all are accompanied by explicit resource allocations (G6) 1
Defined strategies for health for all need external resources (G6) 1
The needs for external resources of defined strategies for health for all are receiving the sustained support of more affluent countries (G6) 1
At least 80% of local communities at all levels have well-established voluntary and formal community organizations, which are committed to continuous primary health care action programmes (Rl) 1
The community contributes in cash and in kind to health or health related action (R2) I
The percentage of population served with safe water in the home or within 15 minutes' walking distance is 100 (G7.1. l) >,-c,.,. Z >
The percentage of population with adequate sanitary facilities in the home or immediate vicinity is 100 (G7.1.2)
The adult literacy ratio for both men and women exceeds 701 (Gil)
The gross national product per head exceeds US$500 at 1980 market prices (G12)
The daily fer capita calorie availability exceeds 2500 calo~le8 (R3)
2
2
2
2
The daily per capita protein availability exceeds 70 grams (R4) 2
lII-i

WESTERN PACIFIC REGION DATA BANK ON SOCIOECONOMIC AND "EALTH INDICATORS
PART III GLOBAL AND REGIONAL INDICATORS
TO MONITOR/EVALUATE STRArEGIES fOR HEALTH FOR ALL BY 2000
(c) Health Status and Quality of life Iii'dTcators
(d) Indicators of the delivery of health care
Tt.BLE OF CONTENTS (Cone' d)
Indicators
- At least 901 of newborn infants have a birth weight of at least 2500 grams (G8.1)
- At least 901 of children have a weight for age that corresponds to reference values given in Annex 1 to Development ot Indicators for ~onitoring Progress Towards Heslth for All by the Year 2000 (CS.2)
- The infant mortality rate for all identifiable
Page.
3
3
sub-groups ia below 50 per 1000 live births (G9) 3
- Life expectancy at birth is over 60 years (GlO) 3
- Katernal mortality rate is below 3 per thousand live births (as) 3
- No cases of diphtheria, tetanus, whooping cough, mea.les, poliomyelitis and tuberculosis occur (&6) 3
Primary health care is available to the Whole population with at lea.t the following:
The percentage of deliveries by trained health personnel ia 95 (G7.4.l)
The percentage of children immunized against diphtheria, tetanus, whooping cough, measles, poliomyelitis and tuberculosis is 9, (C7.2)
Local health care, including availability of at least 20 essential drugs, within one hour's walk or travel is 100% (G7.)
The percentage of children up to at least one year of age given routine child care by trained health personnel is 100 (G7.4.2)
The percentage of pregnant women with at least three visits for antenatal care is 100 (G7.4.1)
The population growth rate is reduced to less than t:t (an
4
4
4
4
4
Doc 036lH Disk 002SH
III-ii

• 8 • U
]
~ J j.~ • ~ ... . • co ... ~.~
.... .w·~ .. t ~ .. ~ j 0 CUA
i~il ..... :~ :: ~:;::ii j E e • CI: •
u " .... ,. .. J
.!: e .~ -:1 ; .- : i! Y'" ge: · ~ . ~.~ -1-=-:",£ ... · . ~ ::.:e:!t:' _ ... c
'(; "'::oc.::! Ii !~i~ ...... .. I li.·~1! I:' ~ _oil 11 ~~;~!~
- . · -. I:: ~ ii J : ..... II"~ [j § I!I 1-0 ~IS ,. \I t 101
• i~ !12 ~ • g
=£ ::
~~ .: ... -.-.-.~
~
4 ~ 1 .. ~
§ ::1 .~
~ " -" q.! . .. .. • , ~
-0 ... ', .. :'8!'Ot'~ ~ ..... " .. J ....
e3~:';:~ u _ a..~_
'" ... :t .. 1 .. 1,,0.0l! .. -'=_ ...
[~ ! i'l:-i. § ~]: r-,. !!I aU
, ... e. .; ,,~. ........... • r 0 •• e
~ - 1II .... .Ii: ... ...
:·"i;:o~ • .!"g ". ".0"1:1,"' ____ ...... ... I ...... 0. .... 1 .. ::o~ tot .. -a .. I .... o .. gu:t
........ O.IICI .........
i.l h ~ .. § ..... -..... .c-=;;t'fi·.~-.... u"O ... : ... II CI ............. ...... _.#0_
• -• • t l:' ~
J
I~ •
j ,
,
I II •
~
~ :
~ •
, I'
•
~
~IJi~l,l~ !I~I~I,
• I- I'
, , , , , , ,
I , , ,
I- , I-
, , , , 'I' , , , ,
I- I' I- , I' I'
I~ 1-:
r;~ I- I· I·
~ I" I~
~~~;~~il I' I' I' I'
I- I- I' I' I' I'
I- I' I- I'
le[gl
I~I~I "1~1l;
I~~I I~ 1~1~1~1~1~1~1~1~1~'~~E l~ I" .
• j
Pan. [It fap 1 )0 Decellber 1985
.~
• t r
• o
• .. : j :..; :! • .. . 08 'Ii:;: · " •• • 1.: .... ... ~ 0': _ UIJ :
" .. '::.0 .-" .. -" " • • ~~
" ... -:: --!J ~" -. u_ · .. .. .. • · ~ • • -. " . ~~
il r u 0;:; -. o ¥ • • .-H
• ~ .!;. • • 0-. ... u. I:: OA ~ A • • . . ii :~
i~ · ,

Soc i~conOlDit indicator.
Count ry Or area
SOCIOECONOMIC AND K£A.L'tH InDICJr.1OU
ITh" perce1.taae of the /'the per:(:entace of pClPU-I'tht adult literac.y 1'. ate for lerved wic;h ute letioft 'Wit.l\ dequat.1' botl! ... n .ft4 wo-n \!iJ:cede
- _.-.- "a .. ";"~"''' in 70 ;;t;;-,;- the ho.e 01' vithi~ 15 .iaut •• ' valkina di.taoee Che ho.!' 01' i-.-dilte i. 100 vic.iaity i, 100
..illJl. 'it>. J (RJ)
~1= r1t ~ . ~" ! ::: • " i ~
Ime d~il' ~I' up p~ot'll.. '.,
'0 sr-
_1 .. 1 I-:::-,...., ..... ":T~~'*,-==,-+.=-r.-'(¥C .1.2) IMte .. f"ftd Dcot. of with
nit
11>"0' Molt Totdl Kele
t'at. IDatal .-., snita ClIP n ... un lOlita, o-Uy.per ceR\t& .... .."I'_I!! , oe:e1one a\lppl, cepi ta prot.ia
1. ME_lCAJt SNfOA CUsA) 2. Auetnlie J. BRUNEI tMlUSSAUJ( ... CHIMA P~ti S Uf S. COOl. l! S ~_ n.a.-.." . .",,. ••• _ .... h
1. .-:-9. ~. h.8l
Fm !.!ill. illil
t T OF fACJrJC IS (USA) I - 1{\96) 9. TUVALU O. VAtruAT1 1. VIET N. 2. _Willi.
,~::! .1984
\9, 'ff1
(1983: 1984
~484J
'-'-
7ri
-as -] .• +
180
~ -
., ., ... (.
Male_ of cQUntri .. in elpitel JeUu, "fer to thon .0 hne .~baitted a report on Ivaluating Progre., ic lmpl.~ntin& Str.teiY for Healtb for Atl by th~ Year 2000, 1985.
"CD' ·*Kah - Ul'b.n (a8), lu ... l (76) ._. The CMP i. DOt a r.liable in4icator for Kiribati
m I
•
• I 0'&$ .ill!l ill!J
, ":1
~
a' bl ) I )00: (1962:)9 _100:
, ... le .: Urban (74)~ Rural <S9) U - Urban. I - lural
lin~e about 7SZ of the popula.tio1l live .ubdat~e lih.
.t Federated Stet •• of Kicron •• i. hi "Cro .. tsland 'ntdut;:t" )HII' head" lIo'rthuD HIIrhn .. il '9% - .. r~tonaa. 80S - outer ieland.
. "84 19.1 ...
• , • I •
· , • . . .. · ,. · 1971
+I!IDif ill.L
• .,,1, . .. ...
2 959 • .. 14 : 511 · • "ll. . .. . ..
, · • • ) 161 • 19&Z I 90 + 19 l , + 19)
I .... 71 ·
"'I II'm 1981 mii fi9ii; iI.17
11 .6. -

I·
1<:
•
Part. 111 P.... 1 30 o.c'-'t' 1985
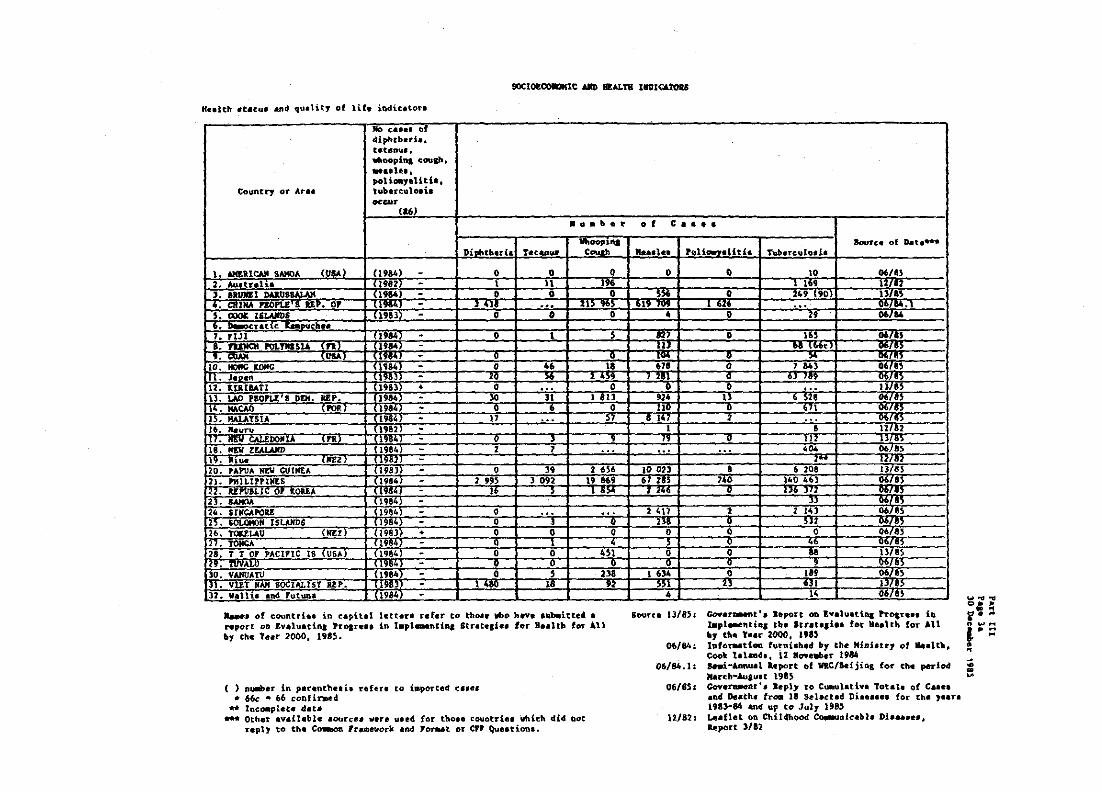
Heelth statue and quality of life iadic.tor •
Collfltry or A.t-.a
., ,...... tlf cUphther:le. tataau" tlhaopinl coulb, .... lu. poliClllJeUth. tuberculo.b ..... ,
(I')
$OCtOI~lC AID S!ALT'B IlfDlCAtou
• . . b e ~ 0 f C.... I ruuuao -c;'-;;;'" I Ita •• l ...
• SAMOA ( trSA ) 2. Au.tuli. ,. llual DUUS~ •. dUia PIOP1.EItF. or s. moe lSJ,.AIIl)S 6. o;;;cl'uic .... "ch •• 7. rUI ;. FUlIOI PO\.y.uu In, . awi If SA}
o. NOItC KOfIC 1. Juan 1. ,{nut .l. 1..AO no 4. ~CAO S. MALATSI
~
CALfDOll. I • MEV z.!A1AIfD 9. 'hu.
REP.(po
(19") mm
~f:ii
• 11
_t ,,~ ) 091
;: •• I. •• l. s.
~An ~ ;:r.-
-l~l +
..... of countries in capit.l letter. ref.r to tba.e Wbp hwve .~~itte. a r.,ort OD Evaluatina Proar ••• in t.pl ... ntiaa Strete.i •• for H'alth for All " the leer 2000, 1985.
( ) D~.r in parenth ... i. refer. to i_ported c •••• • 66c • 66 ronfin.ed
.. Incoaplata data *** Other ,v.ll,ble aourc •• were UI.d for tho •• couotri •• which di4 aot
npl, to the Co.aon lr_work and Yorut or Crt Qu •• tion ••
o
Soune 11/8~;
06' .. , 0&/84.1 :
Oti/85 :
12/821
Jouu. of DIIt ..... :t.l.
o ••
eo.en:.et'. a.port 01\ 1 •• luaU. P'f'~'l'." iQ ~,l~tlDI lh. 'tr.t"l •• for .e.1th for All by the y~.~ 2000, 19'5 Info~t{OQ fu~ni.h.d by th~ Hiai.tr1 of ... lth_ Cook hind_, 12 .gye_er 1984 se.i-AsmWll a.port of VIlC/laijiQI for tl'l. period Mar~h-Au.u.t 19B5 eovera.eot'. lep17 to Cumu\ati •• Total. of Cae •• .ad Death. fro. 18 Sel.clad Di •••••• for the J •• r • 198)-84 &n4 up to Jul, U8' ~afl.t on Childhood C~olc.~l. Di ...... . Report 3/82
W~~
i~ s ow~ 'II:;: • " ~ w ~

,.rc III
'." . 30110 __ illS
! i ~ ~ u
I H
~
~ • • 5 ~ • J ~ • !: = .• -• .. • 5 ~ 0
• ! • .. i
• t 0 .. • !: U • • "
.lI
! • l: ! w
! 0 • .. 8 W .. :. .. • .. II w
t 0 Ii o-.. i~ 0
U iI: Xl
w
= .. ~ .. =::: :. · .. wo u~ • ~5 ~M • • .. . -:0"' · .. ... .5~ • • · .. ~. .. .. u •
f:' • • .~
~~
: ! Ii
• w • B x J g o~
!! 0 . . • ~;:
~ .. ! ...
~ ij 0 ~
MW
~§ :: r: ~ .. • • . ... ." 1= . .. .. r _w .. .. . .
• ~.
·;::.:~c':; -::13 0
-• ,.. ~.a: tOl'\~ :; I -a ~ I '8 :. :OM i .... ~,<G;;: , , , , , , , 1~111·
•
WORLD HEALTH ORGANIZATION Regional Office for the Western Pacific
WESTERN PACIFIC REGION DATA BANK
ON SOCIOEOONOMlC AND KEALTK INDICATORS
PART IV GLOBAL AND REGIONAL INDICATORS
BY COUNTRY OR AREArO MONITOR/EVALUATE STRATEGIES POR HEALTH FOR ALL BY 2000

WESTERN PACIFIC REGION DATA BANK
ON SOCIOECONOMIC AND HEALTH INDICATORS
PART IV GLOBAL AND REGIONAL INOICATORS BY COUNTRY OR AREA
TO MONITOR/EVALUATE STRATEGIES FOR HEALTH FOR ALL BY 2000
TABLE OF CONTENTS
American Samoa ...................................................................................................... .. Australia ................................................................................................................ .. Brunei China
........................................................................................ .. .. .. .. .. .. .. .. .. .. .. .. .. .. .. .. ................ flo ...................................................................................................... ..
............................................................................................................ Cook Is lands Democratic Kampuchea .......................... ". .............................................................. .. Fiji ............................................................................................................................ French Polynelia ....................................................................................................
................................................ flo ........................................................................ .. Guam Hong Kong .................................................................................................................. Japan ........................................................................................................................ .. Kiribati ........................................................ .. Lao People's DetDOcr.atic Republic .................................................................. .. Macao ........................................................................................................................ .. Malaysia .................................................................................................................. .. Nauru ........................................................................................................................ .. New Caledonia ........................................................................................................ .. New Zealand .............................................................................................................. Niue ........................................................................................................................... Papua New Guinea .............................................................. flo ................................ ..
Ph i 1 i pp ines· .... ,. ...... ~ ................................ " .............................. ~ ............ " ...... " ...... .. Repub 1 ic of ((orea " .................... 4O ........................................................................ ..
Samoa ........................ flo .............................................................................................. ..
Singapore ....... flo ...................................................................................................... ..
Solomon Islands ...................................................................................................... Tokelau Tonga
...................................................................................................................... ..........................................................................................................................
Trust Territory of the Pacific Islsnds .................. Tuvalu .............................................................. .. .. .. .. .. .. .. .. .. .. .. .................. .. Vanuatu ................................................................................................................... .. Viet Nam ............ flo ...... " ............................................................................................ ..
Wallis and Futuna .... " .......................................................................................... ..
Doc 0341H Disk 0024H (AMS-PNG) Doc 0435ll Disk 0024H (PHL-WAF)
IV-i
1 3 5 7 9
11 13 15 17 19 21 23 25 27 29 31 33 35 37 39 41 43 45 47 49 51 S3 55 57 59 61 63

WEST&aJ PACIFIC REGION DATA BANK ON SOCIOECONOHIC AllD H[ALTH IHDICATORS
Indicator(.) for: AMERICAN SAMOA
.) Health policy indicator.;
- Healtb for all ba. received endor .... nt .I. policy at the bi,h •• c official leval (Cl)
- Mechani ••• for involvinl people in the implementation of .trateci •• have b.en formed or strengthened, and are actually functioninl (C2)
- At lea.t Sl of the gro •• national product i. 'pent on health (Gl)
- A rea.onable percentage of nation.l he.l~h expenditure i. devoted to pri.ary health care (G4)
- Resources are equitably di.tributed (G~)
- Defined .t~.teli •• for health tor all are accoapanied by e~plicit re.ource allOCation. (C6)
- Defined .trataliea for health for all need external re.ourc •• (C6)
- The needs for external re,ources of well-defined strategie. for he.ltb for all are receiving sustained support from more affluent countries (C6)
- At lea.t 80% of local communities at all levels have well-e.tabliahed voluntary and formal community organizations, Which are committed to continuou. primary health care action programme. (Rl)
- The community contributes in cain and in kind to health or health related action (R2)
(b) Socioeconomic indicatora:
- The percentage of population served with a.f~ ~.ter in the home or within 15 minutea' walkins distance i. 100 (G7.1.1)
- The percentage of population with adequate •• nitary facilities in the home or immediate vicinity i. 100 (G7.1.2)
The adult literacy rate for both .an and women exceed. 701 (Gll) (Totall HI F)
The gross national product per head exceeda U5S500 at 1980 market price. (012)
'Dle daily' per capita calorie availability exceeds 2500 calorie. (R)
The daily per capita protein availability exceeds 70 gr .... (R4)
196)
1963
FY 1985
FY 1965
1963
198)
198)
1963
1963
Data
•
•
•
•
•
•
•
•
Part IV P.lle I 30 December 1985
Actu.l} Data
Y ..
Ye.
9.2
10.3
Yes
Yes
Ye.
Yes
Source of data
13/65
13/65
13/85
IJ/6S
13165
13/85
13/65
13/85
13/65
Notes; The number in parentheses show the nu~ber given to the indicator in th~ global indicator list (Global StratelY for Health For All by the 'tear 2000, WHO, Geneva. 1981 ("Healtn For All" Series No. J). pages 75-76).
+ Yes No No information/not available
Ha Not applicable
Source l3/85: Government's Kepo~t on Evaluating Progress in Implementing the Strategies for ~YA/2000, 1985
O~/8>: Government's Keply to Cumulative Totals of Cases and Deaths from 18 Selected Diseases for the Years 1983-84 and up to July 1985

Pa.rt. tV Paae 2 30 December 1985
~STEaN PACIF(C lICIDM DATA BAHK ON SOCIO!coaoHIC AND IUW.TH IMDlCATOaS
Indioator(o) for: AI\lRlCo\ll SAIIOA
(c) H •• lth at.tu •• nd QUAlity of life indicator.:
... At le.lt 90' of ~rn infant. ba~. a birth veilht of at l ••• t 2S00 Ira .. (C8al)
... At 1 ••• t 90' of children. "ave • weipt for a._ that corr •• pood. to ref.rence value. ,iven in Annex 1 to Develo,..nt of Indicator. for Monitoring Pr0lr ••• Toward. a.alth for All by the l"T 2000 (GB.l)
... The infant .ort_lity rate for all identifiable • ub-,roup' ia b11~ 50 per 1000 live birth. (C9)
• Life expectancy at birth i. over 60 year. <CIC) (Totall "' F)
- Maternal .artality rate i. below J per thou.and live birtn. (as)
- No ca ••• of diphtheria, tetanu., vhoopin& co~¥h. .ea.le •• polio.yeliti. and tuberculo.i. occur (R6)
(d) ,Indicator. of the delivery of health care:
Primary health care i. available to the whole population witn at l.a.t the follovinl:
- The percenta,. of deliverie. by trained he.lth per.onnel i. 9S (C7 .. 4.t>
- The percentaae of children i .. uni.ed ... inat diphtheria, t.tanu', whoopioa COU&h, .... 1 ••• po1i~.liti. and tub.rculooi. io 9) (C7.2)
Local he.lth care. iacludin& .vailability of at 1 ••• t 20 e •• ential drus" within -one hour'. walk or travel i. 100: (C1.l)
... The pe~enta&e of children up to at 1ea.t one year of a,e ,ivan routine child care by trained health perlonnel i. lOO (Cl.4.2)
- The percentale of prean.nt woaan vith at leaat three vi. it. for antenatal care ia 100 (C7.4.1)
- The population grOWth rate i. reduced to le •• than 1% (R1)
Year
1981
1984 .
1978-82
1984
1984
1984
1984
Data
.
+
•
+
+
'H ••
5.8
Total ... 70 • .1 yr. Hale - 61,.8 yr. '.aa1e- .15.~ , ••
'Tuberculolia 10
90
100
1.9
Source of Data
13/85
13/85
13/85
13/85 and 00/85
13/85
13/8)
1)/85

Indicator(l) for: AUSTRALIA
WESTIRII 'ACIFIC UGIOII DATA IWIl 011 BOCIOI~IC AIID IIlW.TH INDICo\TOaS
Data
Part IV P&Se 3 30 Dec_. 1t15
Actu.l Data
Source of Data
a) Health poliet indicator.:
- Health for all ha. received endorleaent a. policy at the hiahelt official level (Gl)
- MeChani ... for involving people in the i.ple.antation of Itratelie. have been formed or .trenatben84, and are actUAlly functioning (C2)
- At le.it 5% of the aro •• national product i •• pent on health (e3)
- A rea.onable percentase of national health expenditure i. devoted to pri .. ry health care (C4)
(in tbe fo~ of health centre., clinicl, ca.ualty dept.)
a.laureel are equitably diltributed (CS)
Defined Itrateaie. for health for all are accompanied by explicit r..OUrce allocationl (06)
Defined Itr.t.ai •• for bealth for all ne.d external r •• ouree. (C6)
- The need. for external re.auree. of well-defined .trateai •• for health for all are receiving eUltained lupport from .are affluent countries (G&)
- At lea.t 80% of local ca.aunitiea at all level. have well-eatabliabed voluntary and formal community organizatioal. whicb are ca.aitted to continuoul primary health care action programme. (al)
- The community coatributel in calh aDd in kind to health or health related action (12)
1980-81
1980-81
1980-81
1982
1982
1982
1982
1982
1982
1982
•
•
+
•
• NA
NA
IIA
•
HA
Y.o
Ye.
7. 51
30-601 of atatel territory expenditures
Y ••
The aituation io AUS would. .eet th il level of coaaunity participation
1l/83
13/83
06/84
13/83
13/83
13/83
13/83
13/83
13/83
13/83
b) SocioeconOMic indicator.:
- The pereentase of population aerved with •• fe water in the h~e or withiD IS .inutea' walking di,t.nce i. 100 (G7.1.l)
- The percentlse of population with adequate ,anitary faci1itie. in the ba.e or i-.ediate vicinity i. 100 (G7.1.2)
- The adult literacy rate for both .. n and wa.en eKceads 70% (Cll) (15 year. of a,e) (Totall HI F)
- The cro •• national product per head exceeds US$~OO at 1980 market price. (Gl2)
- The daily rer capita calorie availability exceed. 2500 calor'" (a3)
- The daily per capita protein availability exceed. 70 gu... (114)
1982
1982
1981 • •
1982-83 •
1980-81 •
1981-82 •
98.6 13/83
98.6 13/83
Total 13/83 Hale 88% FelUle 82%
USill 957 or 06/84 A$ 10 522
exceeda 2500 13/83 calorie.
99 ,ra., 06/84
Note.: The nuaber in par.nthe ••• snow tbe n~er given to the indicator in the gLobal indicator list (Global Strategy for Health ror All by the Year 2000, WHO. Cenevi. 1981 (tiHealth 'or All" Serie. No. 3)-,-pase. 75-76).
• '"
Yes No No information/not available Not applicable
Source 13/83:
06/84:
\2/82 :
Government's Report on Konitoring Progress in Implementing the Strategies for KlA/2000. 1983 Information furnished by the eo.monwea1th Depart.ent of Kealth. Australia. 27 July 1984 Leaflet on Childhood Communicable Diseases, Report 3/82

h>:. to PatI·4 :10 llec."', 1915
~&'T&" PACIFIC RECIO" DATA &ARK OM ,oeIOII_IC AlII Ii&ALTH llIDICA'IO&S
Indic.to.(I) for; AUSTRALIA V •• r .. c) 1Ie.IEh atatua .Dd sualitz of life iAdicator.:
- At Ie.lat 901 of a_born infanta NY •• 1919 birth .. l&bt of at I •••• 2500 a'''' (eI.l)
- At 1 •• et 90& of children ba ... w.i,ht for ale 1982 that co~ •• poad. to rae.renee valu •• I' •• n in Anaex I to llev.lopoent of 104ic •• o •• for _ito.i", Proa •••• T ...... 4. llealt" fo •• 11 b, tb. Y." 2000 (eI.2)
- '!'be lDfaat _~t.lity raCe for dl identifiable 1982 lub-aroup. ·ie bel .... SO pe. 1000 live bi.ch. (et)
- Lif. up ... ta"", .t bi.tb i. ov •• 60 ,.a," (CIO) 1981 (TotaIl K/ r)
- Maternal .oreality rat. i, below 3 per 1982 tbou.and liv. bi.tb. (1$)
- No c •••• of diphtheria, tee-RUI, whooping COUlft, 1982 .... 1... ,o1io.r.11ti. aDd tuDarculoei, occur (16)
d) Indicator. of the 4elive£[ of health ear.:
Primary health care i. available to the Whol. populatioQ with at _l .... t the fol1011'i.,
- the percenca,. of deliveri,. by ,raiaed 1982 ",altb p.raoon.l ia 95 (07.4.1)
- The percent •• e of children ~UAi .. 4 &&Ainat 4iphtheria, tlt.OU •• Whoopiaa cGUab ..... 1 ••• poli..,.litia .Dd tube.culo.il l' 95 (e7.2)
- Local he.lth care, includina availability 1982 of at I ••• t %0 •••• nci.l drua', ~ithin One houri. walk or travel i, 100% <C1.l)
- the percent.se of cbildren up to at l ... t 198t one year of a., aiVeD routine cbi14 care by trained .... Itb por.oonel i. 100 (01.4.2)
- The pereenca,e of prelDaac wo.en with ac l, •• e 1982 three viaiee for &Otenatal care ia 100 (G7.4.1)
- The populaeioft Irovth ia reduced to 1982-83 1 ••• thaD 11 (17)
Actual ~u.ce Data lleta ~f Do"
+ 94.2 13/83
+ A"er ••• unit. 13/83 would ... t 'ebe eel.renee v.lv..
I
• 10.3 06/84
Total 13/83 • ltal. 7I,..a .. + , .. al. 78 y ....
• 0.10 06/84
- diphtb •• ia t n/82 tetaua 1 .... oopi"'· co", ..
1:: tubarcul.oa.iI polioaJeliei, Ill:
- 98.6 13/83
...
- 98.6 13/83
- 98.6 13/83
- 98.6 13/83
- 1.3% 06/84 .

IIIBrIU PACIFIC UGIOli DATA IWa 011 8OCIOloo.oHlC AIID IlULT8 IHDlCATOU
Indicoto«o) for, IlUHlI DAaUSIALAM
~.) Health policr indic.tor.~
- Kealth for .11 Ra. received eftdorle.eat al policy at the biab.at official level (GI)
- "-chani ... for involving people in the i-,l ... ntation of atrate,ie. have b •• n to~d or atrenaeh .... , .Dd are actually functioaina (G2)
- At lea.t 51 of tbe Iro •• national product i •• pent on bealth (G3)
- A rea.ooable percenta,. of national h •• lth .¥p.a4itu~. i, devoted to pri.ary b •• leh cara (G4)
- ... oure •• are equitably diltribute4 <GS)
- Defined o.r.t.,i.o fOr b.olth for oIl or • • cc~oi" b1 explicit c..ource .11oeationa (G6)
- Defined .trat •• ' •• for h •• lth tor .11 a •• d aaclrnal 'C'e,O\Irc •• (G6)
- The need. for external re.ourca. of well-defined .creteIL •• for health for all are receivinl au.tained .upport from .ore affluent countries (Co)
- At le.lt 80% of local co..uniti., at all level. have well-eatabliahed voluntary and formal co .. unity orcaniaatioaa. Which are comaitted to continuous primary health eare action proSr ..... (&1)
- The c~Qity contribute. in ca.n .04 in kin4 to health or health related action (&2)
b) Socio.c._OIIie iQcUcatora;
- The percenta •• of population ,erved vith 'If, vater in the ho.a Or vithiD IS aioute.· Wilkin, di,taDce i. 100 (C7.1.1)
- Tbe percentaae of population with adequate .anitary facilitie. in the hoqe Of ime.diata vicinity io 100 (07.1.2)
- Th. adult literacy rate for both .. n aad voaen exceed. 70% (GIl) (Tota11 K/ r)
- The Cro •• Dational product per head eKc.eds USS~OO at 1980 .arket price. (GI2)
- l'he d.ily fer cl2;ita calorie Iyailability eKe.ed, 2~OO calorie, O13)
- The daily per c.·eita protein Ivailability exceeds 70 ,r ... CIl4)
Yaar
1984
1984
1984
1984
198~
1984
1984
1984
1984
1984
1984
1984
Data
•
•
•
•
-
• • • •
•
•
Part IV PO'. 5 JO 00<_ ... 1985
Yel
Y ••
8
No
90
60
Actusl Data
Total - 80.3 Hale - ... Female - ... US$ 7 676* or
B$ 16 ~27
29S9 calorie.
73.7 gra ..
Source of Data
13/85
13/85
13/85
13/85
13/85
13/85
13/85
13/85
13/85
13/85
13/8S
13/85
Jot.a; The number iD parenthel.1 sbow the n~.r given to the indicator in the global indicator list (Global Stra,elY for Ilealth For All by the 'Ye.r 2000. WHO, Geneva. 1981 ("Kealth For Alltl Series No.3), po, •• 75-76).
+ Yet No "0 information/not available
HA Not applicable • Per capita COP
So~rc.e 13/85: Govermaent ' • Report on Evaluating Progress in t.plementins the Strategies for BFA/20GO, 198)

.
'.I't tv ..... 30 Doc ..... r 1985
.,.STUII 'AcIne IIIICIOfl 110\"" ..... K 011 aOCIOEOOIONlC AIID IIIAI.,.H lKOlC&toas
. , .. lndicac.o-r(.) for; _1 DAJUlSSoIUJ4 Ye.1"
,,1 ".lth atat". au 9_1i,~', ea, lU. lG4icato'Ce;
- At le.at 901 of .ew~D ietaot' haw. • 19k • birth weilbt of at l ... t 2500 ,r ... (C8.1)
- At l ••• t 901 of cbild~eQ have a wei&ht for .,e 19k -that corre.pooda to ref.reoce valu •• ,iven in ADaex 1 co o. .. lo,.ent of ID4icator. for HoDitol'iftl Pr0lrel. Tovard. S .. lch for All by tho Yoar 2000 (C8.2)
- th. intant .art.lit, rata for all iet.neifiabl, 1984 • .ub-arouptl 10 below 50 por 1000 livo birth.«II9)
- Life •• pectancy .t birch io 0 ... 60 yoa.. (CIO) 19k· • (Tocal( K/ r)
- Naternal .art.liey raCe i, b.low 3 '11' 1984 • thou •• nd live bircho (RS)
- 110 cal'. of ctipbtb.r.ia. tet •• u., whoopiq cou,n. .... I ••• poliooyolitia oDd tuba.oulooi.
1984 -oo.v. (16)
~) lndic&coc. of tbe de!iverz of bealCh'eac.,
Pri.ary health c.~e i •• ~.ilabl. to tbe ~ole .
populatiOil with at l ... t the follOllina.;
- Ibe perceata._ Df deliveri.. b7 trained 1984 -h .. lch poroonaol io 9' (al ••• l)
- the percentaa. of chil~r.n i..uni&ed ..-inat 1984 • diphtheria, t.t ....... oopina coup ..... 1 ••• polLo.yalilil lad tub.~cul0.i. i.·95 (01.2)
- LocII health care, i~ludina availability 19k -of at 1 ••• t 20 •••• ati.l dru,I. witbin on. bour'. walk o. t.ovot i. 100J (e1.3)
- The perc eDt ... of ChildreA up to at 1 •• " 1984 • on. ye.T of ••• liven TOQtina e_ild oar. by trained h.alth poroo ..... 1 h IOU. (e7.4.2)
- Tbe perc.Dc •• e of preineDt ~n witb It 1 ••• t 1984 • tb~le vi,it. fOT aat •• ltal co.o i. 100 (e7.4.1)
- The populati"" ITOllth rate ie reduced' to 19k -10" thoa 11 (a7)
( 1 nuabe. in po •• ntbe ..... fo.1 to i.,orco ••••••
Mtual ; ;tource Dat. Dat. of Data
. ,
!Ie 13/85
85 13/85
l2.7 13(85
Total - 10 yro Il/a5 KA1. - 69 yra , ... Ie - 10 yro
0.46 13/85
Tuberculo.it 249 (90) III 85 Ilea. hI. 556
82 13/85
, 96 13/BS
96 13/85
.
100 13/85
100 U/8S
2.5 13/85

WESTERN PACIFIC iEGIOM DATA BAlIK ON SOCIOZOOIIOtUC AND lIJIALTH 1.DlColro~S
a) Healch policy indicatore:
Kee1tb fo~ all ha. received endor .... nt •• policy at tbe hi,he.t official levil (Gil
Mechani, •• fo~ invo\vina people in tbe ~pl"'Qt.tiOD of 'trltaai •• have bela for.ed or Itrenatb,nld. aad are actually functionina (C2)
At le •• t S% of the Iro" oation,l1' product i. spent on health (03)
A rea.onable percenta,_ of nltional health expenditure i,- devoted to pru.ary hedth care (C4)
- Resource. are equitably distributed (CS)
- Defined .cr'-tl.i •• for bedth for all are acco.paDied by explicit re.ource allocation. (Cb)
- Dlfined Itr.t •• t •• for health for .11 n •• d Ixtarnal rlutut'c •• (06)
- The ne.dl for external re.ourc •• of well-detined Itrlt_&1.. (or health fo~ all a~. T.~.ivina auacained .uppoct fco • .oca .ffluant countria. (G6)
~ At l'.lt 80Z of local.ca.au~iti •• at atl level. bave well-eatlbli,hed volun~.ry aad to~ .. l community Oraani&lcionl. whi~h are c~i~ted to coatinuoua primery h •• ltb care action pro&r ..... (Rl)
- The eom.unity contribute, in calh and in kind to health or h .. ltb r.lated .ct~on (R2)
b) Socioeconoaic indicator.:
- The percentl.e of population lerved witn .afe water in tbe ho.e or within 15 minut.,' walkin, 4i.tance ia IDD IG1.1.\)
- The perceGcaae of population witn adequate •• nicary faciHtiea in tbe hODe or i.-diate vicinity ia 100 (07.1.2)
- Tbe adult literacy rate tGr both .en and women exceed. 701 (011) (Totall HI F)
Tne ,ro •• national product per nead exceeds US$saO .t 1980 .arket price. (012)
The daily per capita calorie availability exceeds 2500 calorie. (Il)
The daily per capita protein availability exceeds )0 Br ... (R4)
1984
1984
1984
1980
1981
1981
•
•
+
•
+
Yes
Yea
Yea
8)
Part IV Page 7 30 December 1985
A.ct~l Sourc. Oata of Data
13/85
13/85
13/85
U/85
US$ 290 ()7!S\
2 Sl7 calories 03/83
03/83
Note': The nu.ber in parentneaes show the nuaber given to the indicator in the global indicator list (Global Stratev for Health For All by th~ Year 2000. WHO. Geneva. 1981 ("Healtn ror All" seriea No.3), p., •• 75-76).
• Ye5 No No infor.atioa/not available
NA Hot applicable
Source 13/85: Covern~ent's Report on Evaluating Progress in Implementing the Strategies for HFA/2000, 1985
Ol/B3: A Sector Revie~: The Health Sector in China. Volume 11; Statisti~al Annexes (Report No. 4664-CHA). The World sank, 20 August 1983
06/84: Statistical Yearbook of China 1984, State Statistical Bureau, feople's Republic of China, December 1984
06/84.1: Semi-Annual Report of ~RC/Beijing for the period HArch-A~gust 1985
07/81: 1981 World Bank Atla9
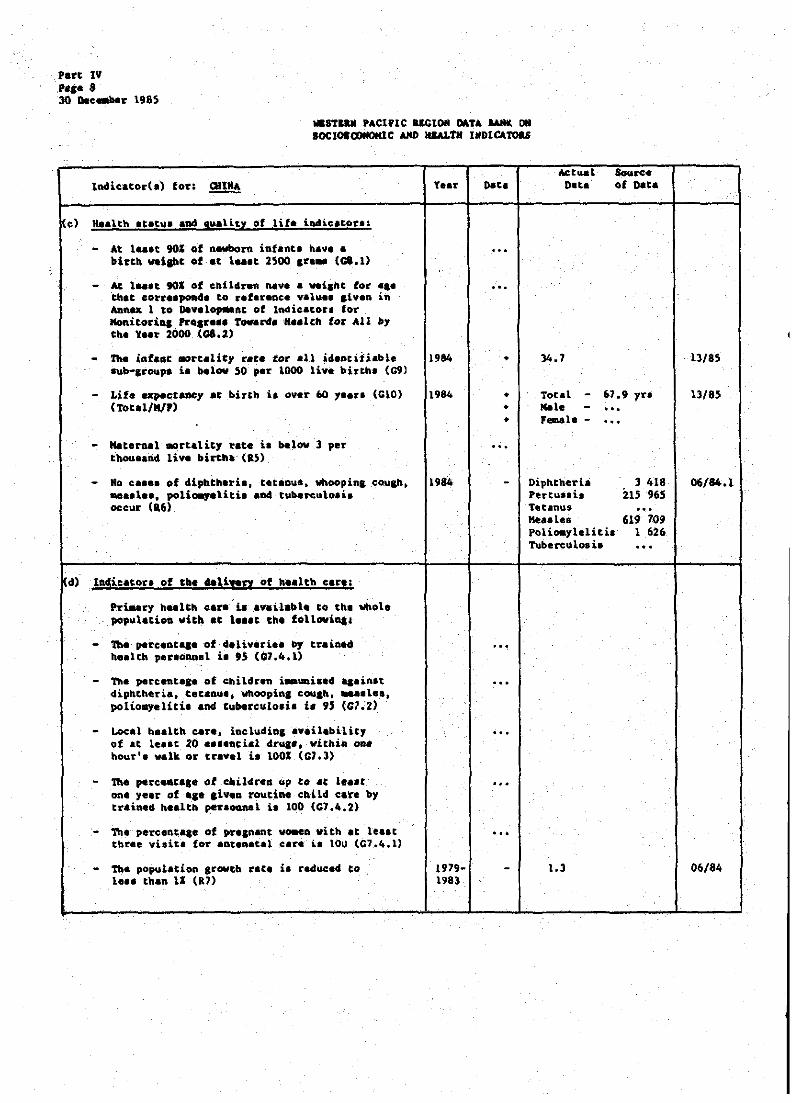
P.~t IV 'oi- 8 30 Doe_T 1985
.. STUll PACtnC UCtOil ot.TA _ 011 BOCIOlCOflOHlC AJlD IllAl.fII IMDtco,roa.s
..
ladicatoT(O) fOT. CHIH4
- At l •• ,t 90S of newborn inf.Rcl have • biTth .. libt of .t 1 ... t 2500 & .... (01.1)
- At l ... t 901 of cnildr.n Rave • ""ahc for _,_ thlt corr •• p~. to raferenc. v.l~ •• alvIn in Annex 1 to Dlv.l~Rt of Indicator. lor MonitoriDI Ir.lr ••• r~rd. a •• lch tor All ~y eh. Y ••• 2000 (01.2)
V.ar
- The intent .arc.lic, rate tor all identitiable 1984 lub-,'f'oq,. ia below 50 plr 1000 live birth. (G9)
- Lif. expectancy at birch i. over 60 , •• r. (C10) 1984 (Totol/MI')
- Maceroal .arc«lity rate i. below 1 per thou.aad li-. birth.· (RS)
- No e •••• of dlpbtn.ri' l tet.nus. whoopia, cou&h. 1984 .a •• l." polia.,etiti •• 04 tuberc~lo.i. occur (I')
D.C.
• :l4.1
• . Total -• Male -+ Female -
...
- Diph.theria Pertu .. i, Te:tanu. MeaaLea
61.9 7ro
'" ...
3418 it5 965 . .. 619 709
Polioaylelitia 1 626
d) I!tic_core of ,be dali!!EY of healtb care:
hi .. ry hulth cara- b ... il.ble to the 'Whole . population vith at la .. e en. follow'GI'
- The percent ... of deliverie. by t~.ioed h •• lth par.onnal i. 9S (07.4.1)
- The percent ... of children i .. UDiaed .. ,inet diphtheria. tee.au •• whoopia. couah ..... 1 ••• poliollYeliti. and Cubarculo.i. to 9J (C7.Z)
- Local health car •• iocludiol availabilit, of at le •• t 20 e ••• aci.l dru._. vithia one ho~r'. walk or travel i. 1001 (el.3)
- Th. ,etceac... ot ebi14rem up to at I ••• , ona yeer of a.e liveD routine cbild care by train4d he.lth per.oanel i. 100 (C7.4.2)
- The percentaa. of ~.&nant wo-en with at le.lt three visit. for aDtanatal cara i. 100 (07.4.1)
- fbe population acowCh rata i. reduced to 1 ••• tnan 11 (R1)
.
1979-1983
'"
...
Tuberculoa b ...
1.3
13/85
13/85
06/84.1
06/84

IlESTIWI PACIFIC REGIOil DATA BAIIt 011 SOCIO£COIfOKIC AlII) IlEALTli INOICATORS
Indicator(,) for: 00Dl ISLANDS
.) Kealth policy indicator.:
Health for all h&a received .ndo~ .... nt •• policy at the ~iah •• t official level (GI)
- Mechani... for iDYo1vial people in the impla.ea.tatioa of Itrateaie. MV. beea- fonaed or: .treDltb.a.ed., aDd are actul1.y functioriin, (C2)
- At 1 ••• t 51 of the 11'0" national product ia spent on health (C3)
- A , •• eouable perceataae of national bealtn .Kpeadit~r. i. d.vot •• to pr~ry bealth eIre (04)
Resource. are eqQitably 4iatributed (CS)
DefiDed Itratea1 •• for health for .11 are acco-paai •• by' explicit r •• ouree allocationl (C6)
- Defined Itrace,i •• for h •• lth for all need external relource' (C6)
- The need. for laceroel ,e.oure •• of w.ll-dafined Itl'&ta,i •• tor h •• lth for all are r.ceiviQl IUlelined IUPPOrt fro. more .fflueat countri •• (06)
- At t ... e 801 of local c~itie. at all level I have wel1-eltabliabed voluntary and fore.l community organic.tioa •• Whicb are eom.itte4 to continuoul primary health care action progr.~. (Rl)
- The eo.munity contribute. in ca.h and in kind to bealtb or be.lt~ related action (a2)
- the ,.rcanta •• of population ,.rved with •• fe water in the bom. or within IS .inut •• ' walkina diatance is. 100 (C7.1.ll
- 'l'be perceatase 'of population with ac!eq"ate .anitary faciliei.. in tbe ho.e or i~di.te yicinity i. 100 (<:7.1.2)
- The adult literaey rate for both .. n and women exceed. 10% (Gll) (Totall HI F)
- the gro •• ~tion&l product per bead exceed. U5$500 at 1980 .ark,t pricel (GI2)
- . the daily ger capita calorie availability exceeds 2500 cal0.,e. (13)
- The daily per capita protein availability exceeds 70 graml 0.4)
1984
1984
1984-85
1984-85
1984
1984
1984
1984
1984
1984
1984
1983
19114
Data
•
•
•
•
•
•
•
•
•
•
...
...
Part IV hp 9 JO IIoc_. 1985
Actual oata
Yea
Yes
1l.O
No
Yes
Y ..
y ••
No
Yea
99-larotonga SD-outer i,lanell
Total - 100 Kale - '" Fe..:le - ... US$ 980 o. IIZ$ 2000
SOUTce of Data
13/85
13185
13/85
13185
13/85
13185
13/85
13/85
13185
13/8S
13/85
13/85
13/85
Hotea: The number in parencb •• es show the number liven to the indicator in the global indicator list (Global Stratel! for Health Por All. by the Year 2000, WHO, Geneva, 1981 ("liealth For AU" Series No. ), pal.' IS-16).
Source 13/85: GovernMent l, Report on £valu8tina Progres •
.
.. Yes - No
No info~tionJttot available MA Hot .pplicable
in ImpleaentiDI th~ Strategies for HFA/2000. 1985 06/84: Infor .. eion furniShed by ehe Kiaistry of Health,
12 Noyeaber 1984 • Per capi ta COP
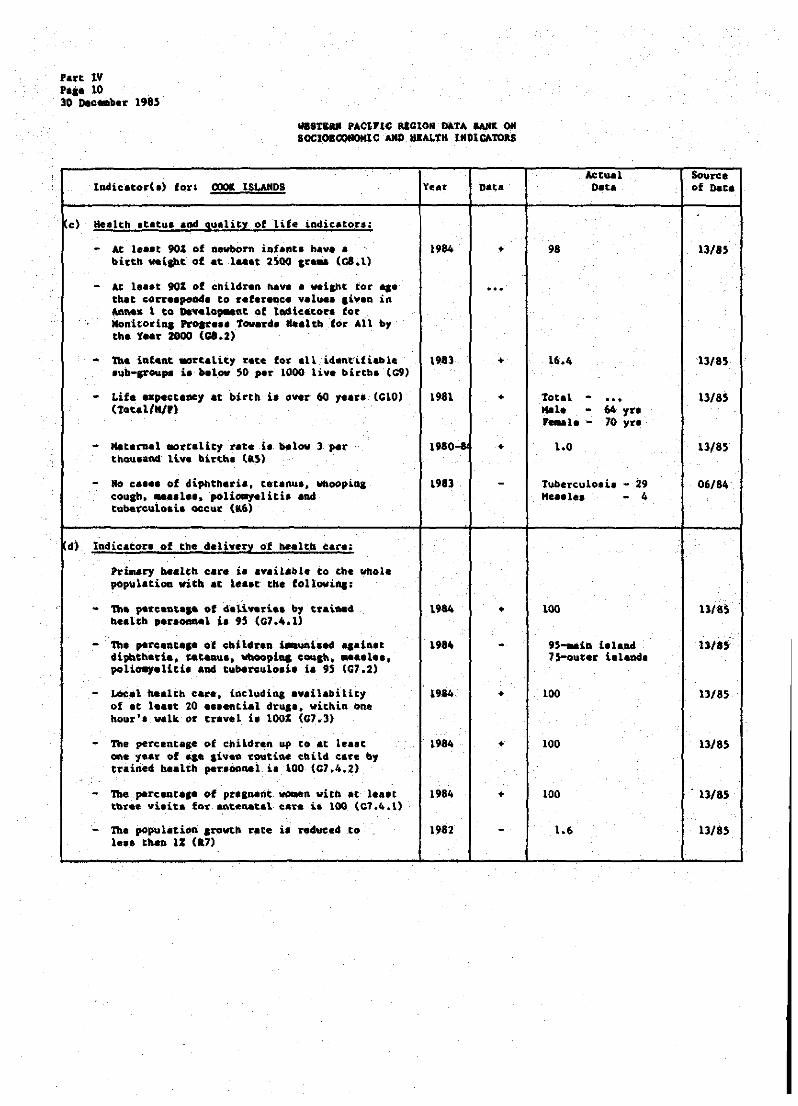
,
.
Part IV Pal. 10 30 OIc_bn 1985
~T&oa PAClFIC RlCION DlTA ... ~ ON SOCI08~C dO IlEAl.fK INDlCA'I01tS
lnelic_tort.) fo:r:- COOIt ISLAlfDS Yellr nata
0) aealth .t.tu. and gualitz of life indie.tor.:
- At l ••• t 901 of newborn iqfanta have • 1984 • bi.t~ weiSht of at l ••• t 2500 It ... (CI.l)
- At l •• 't 90% of children l\ave • _i&bt EOI' ... ... t~t co~c •• poa4. to ret.reac. valu.' .i~.a ift AftfteK 1 to o.¥elo,..ut of tadle&corl to~ Nonitod", PrOtr ... f ......... lIallth for All b, tho Yoa. 2000 (CI.2)
. 'l'be iaf&a.t. Mrtality rete for all i4.nt"i.fiable 1983 + Iub-srOUPl i. below ~O par 1000 live birtbl (C9)
- Lif ... peotOlley It birth i. ova. 60 y.... (al0) 198\ • (Total/lt/F)
- Maternal 1IOrtality rate h "low 1 ,.1' 1980 .... • thou.and Ii .. bi.th. loS)
- 110 c •••• of diphtheria, ce'canu., WbOOpiDl 1983 -COUCh ..... 1 ••• polio.yeliti. aad I tubereuloaia occur (a6)
d) Indicator. of the deliverl of heal th eate::
Pri .. r,y bealth care i. avail&ble to the whole populatioa witb .t l •• ae tbe followi .. :
- \'be pe"CMl,." of 4a1.i.,.ri •• bJ ttai.:Mcl 1984 • b •• lth p ••• OOft&l i. 95 (a7.4.1)
- The par~.llt ••• o't chi ldran '-""bed ... 11\1t 1984 -dlpbtb.rl •• uUn., vboopl .. eMlh, .... 1 •• , polt..,.liti •• ad tuba~ul0.i. io 95 IG7.2)
- Local bealth cara. idClvdina availability 1984 • of at 1e •• t 20 •••• nti.l drus., within One houri. V41k or travel i. lOO~ (G7.3)
- The percentage of child'ren UfI' to at le •• e 1984 • Oftt year of aae liv.~ ~~tia. cftil4 care by trained health peroonnel i. 100 (a7.4.2)
- Tbe perceat.,. of pr'IPAnt WODen with at l •• a, 1984 • tb-ree vi. it .• fo1' aateutal. car. i. 100 (C7.4.1)
- Th. popu lotion &to"'~ rate il redUCed to 1982 -1 ••• tbaD II (&7)
Actual Sou..,. Dot. of Dote
98 13/85
16.4 13/85
Total - ... 13/85 11111. - 64 y ••
''''la - 70 yro
1.0 13/85
tuberculo.it - 29 06/84 He.,l •• - 4
100 U/8S
95-..iD to iand UltS 7Muter ialude
100 U/85
100 13/85
100 . 13/85
1.6 13/85
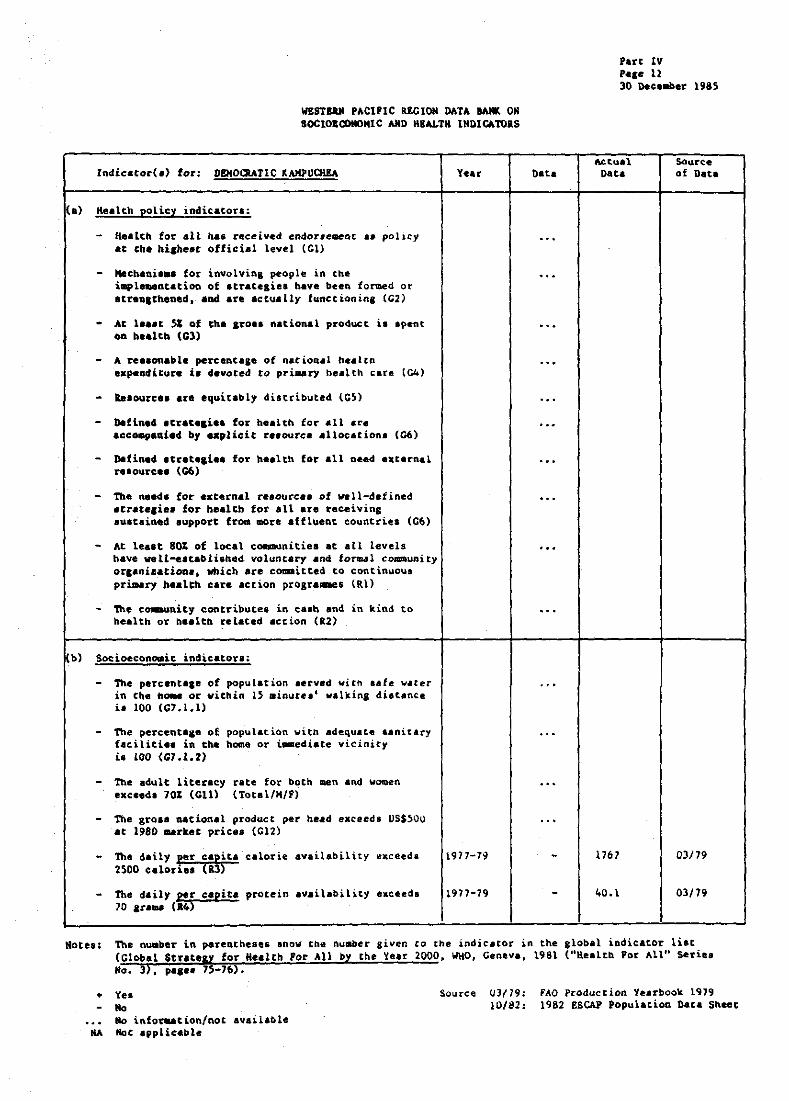
WESTIRM PACIFIC REGION DATA BANK ON SOCIOECONOHIC ARD KiALTK INDltATOaS
Indicator(.) for: DEMOCRATIC KAHPUCHIA
(al Health policy indi~.toT':
K.alth for all has received endor.eaeQ[ •• poliey at the hi,be.t offici.l level (CI)
- Mecbani ••• for involvinl people in the impl ... ntatioQ of .tratelies bave been fo~d or Itr.Althened, and are actually functionin, (e2)
- At 1 ••• t 51 of the aro •• national product i. apent OD heAltb (Gl)
- A rea,onable percenca,e of natioA.l he.ltn expenditur. i. devoted to primary he.lth ~.re lG4)
a..aurea. are equitably distributed lC~)
Defined .traeali., for he.lth fo~ all are acco.,anied by .. ,licit r •• ourca allocationa (CO)
Defined .crete.i •• for he.lth for .11 aeed .~C.rn.l relource. (G6)
- The need' for externcl re.ource. of well-defined .trate.i •• for health for III are receiving IUltained aupport from mare affluent countri~a (C6)
- At 1ea.t 801 of local coamunitiea at all levels bave well-e.tablished voluntary and fo~l community orcaniz.tiona. which are committed to continuous pri~ry bealth eare action prQ&ra-.e1 (Rl)
- Tht c~nity contribute. in ea.h and in kind to health or h •• lth related action (R2)
b) Socioeconoait in4icatora:
- The percentale of population aerved with late w.ter in Che no.e or within 15 minure.' valkins di.t.nee i. 100 (G7.1.1)
- The perceat_Be of population with adequat4 •• nitAfY £lci1iei •• in tbe home or i.-edtace vicinity i. 100 (G7.1.2)
- The adult literacy rate for both .an Ind w~en exc •• d. 70% (Gil) (Total/H/F)
- the groa. national product par head exceeds US$~OO at 1980 .. rket prices (G12)
- The daily per capita calorie availability exceeds 2500 ~.lori.. (83)
The daily per c.pit. protein .v.ilability e&eeed. 70 au" (114)
1917-79
1977-79
Data
1767
40.1
rart IV P.se 11 30 De~ • .b.. 1985
Sou.rce of Data
03179
03/79
Notel; The nu.ber in parentheses snow tbe nu~er given CQ the indic.tor in the &lobal indicAtDr list (GlObal Strate,y for He.lth Por All by tbe 'tear 2000, WHO, Cent"'., \981 ("Health. Por AU" seriea Mo. l). p •••• 75-76}.
.. YeA No No infor.ation/not available
HA Hot .pplic«ble
Source (J3/19: 10/82,
fAO Production Yearbook 1979 1982 ESCAP Population Daca Sheet

'al"t IV .... ~ 30 Doc_b.or 1985
II!STIIU PACH1e ~~'!I4tA, _ 011 8OCIOlOOllOllIC AIIII 1IIAL'fII INDICAtoRS
104i ••• orlo) for: DEMOCRATIC KAMPUCHBA
e) Ilealtb ttatu. aDd su.lity of life iOdicatoru
- At 1 ••• t 90' of nevborD infantl ~ve I birt. woilbt of at l •• ot 2500 Ir ... (08.1)
- At l •• at 901 of children hive a weilht for .1. that corr'.poftd. to referencI valuee elveR in Annex 1 to Dev.lopadnt of Indicator. for Ho,nitoring Pro,re •• Tow-.rd. H.alth for All by the Ye.r 2000 (08.2)
- the ia.famc tIOn.alit.y rat.e for all i4-efttiti.abh!! . lub-,I'OUPI ia , .... low SO per 1000 live birth. (09)
- Life- e.pectanc, at birth i. oval' 60 year_ (CIO) (Total/K/')
- Hatemal .ort.lity rata i. belav 3 par thouo.D4 live birth' lt5)
- No c •••• of diphtheria, tetanul. whoopia& eouan • .... le.. poli~eliti. and tub.~10.il OCCUr (a6
d) In4ieatora of the delivery of health care:
Primary health care i. available to tbe WhQle population with at Iealt the fol1oviaa:
- me percen~aae of 4eliverie. by traineo he.lth pe~.oan.l i. 9S <Ol.4.tl
- The percent •• e of children i .. uRi.ed •• ain.t 4iphthetia. t.t ....... whooping coup ..... 1 •• , poli~.liti. and tub.,culo.ia i. 9S (Gl.2)
- Local health car., includinl av.ilability of at l.a.t 20 •••• nti.l drua., within one Rour' ••• 1k or travel i. 1001 (el.3)
- The percenta,_ of children up to at 1e •• t one y.ar of .a. liven routine child- cere by tr.ined healch pe~,oDnel i. 100 (C7.4.2),
- the pe't'¢eata,e of pregnan.t VOlIn vith at l ... t, -three vi.itl for antenatal care LI 100 (G7.4.1)
- The pOpulation arowtb rate i. reduced to 1 ••• thaD 11 1.7)
Y.ar
1982
1982
...
...
1982
fot .. l -~le - 42 year. '~l. - 45 y.arl
.
10/82
10/82
10/82

WEST!&II PACIFIC REG 10M DATA _ OK SOCIO£OOIIOlIIC ""0 HEALTH INDICATORS
Indicatot(.) for' !!d!
- Health for .11 ha. received endor .... Q( •• policy at the biab •• t official level (Gl)
- Meehani... tor inyolvina people in ~h. impl ... ntation of .trateli •• have b .. n fonaed or Ittenath_ned, and are Actually tunctioninc (el)
- At le.lt 5& of tbe aro •• national product is .pent on health (C3)
- A rea.cnable percentl.e of n.tioaal he.lth expenditure i. devoted to pr~ry health care (C4)
- Relourcel are equitably diatributed <CS)
- Defined I,r.t •• i •• for health for all are accoapanied by explicit r.aouree allocations (C6)
- Defined Ictate,ie. for bealth for all Reed external reaoure.s (Gi)
- The need, for external r.lourees of veil-defined Itr.teaie. for bealen for all are receiving IUlt.ined lupport from .ora affluent caunetie. (G6)
- At l ••• t 80% of 10cIl communi(i •• at &\l lev_l. have w.ll .. etabli.bed voluntary and to~l co~unit1 or.aRis_tiona, ~ic~ are co..itted to continuous priaary h.altb care action pro,ramme. (tl)
- 1he c~uGity contribute. in ca.h and Ln kind to health or health related action (a2)
(b) Socioeconomic indicator.:
- The perceDtase of population served with safe ~ter in the home or within IS .inute.' walkiol di.tanee b 100 (C7.1.1)
- The percentase of popul.~ion vitn adequate •• nitary faciliti •• in the hoae or i-.ediate vicinity ia 100 (07.1.2)
- The adult literacy raCe for both .. n and women neeed. 70% (Gll) (Tot.IIHIFl
~ The gro •• national product per held exceeds US'SOO at 1980 .. rket pric.. (G12)
The daily per capita calorie availability exceeds 2500 colori •• (13)
- The daily per capita p~ceLn availability exceeds 10 IIU'" (1l4)
v •• 'I'
1984
1984
1984
1984
1984
1984
1984
1984
1980
1976
1980
1979
1919
•
•
•
+
•
•
+
+
+
•
Part IV p ... 13 30 Jlec_er 1985
Ye.
Ye.
Ye.
Ye'
Ye.
Ye.
Ye.
No
83.3
Total - 79 Hale - 84 Feaale - 74
ust 1850
2577 calories
Source of Data
13/85
13/85
13/85
13185
13/85
13/85
13/85
13/85
13/85
13/85
13/85
13/85
Motes; The nuaber in parenthe.e •• hov the number liven to the indieatot in tne global indicator liat (Global Stratell for Heatth: For All by the Year 2000, WHO, Geneva, 1981 ("Health For AU" Series No.3), po ••• 15-16).
+ Yes - No
"0 in£orm.tion/not available NA Not applicable
LJ/8S; Government's ~port on Evaluating Progress in Implementing the Strate&ies for RFA/2000. 1985
06/85. Gove~nmentl. Reply to Ou.ulative Totals of C8a81 and Deaths fro. 18 Selected Diee •• e, for the Year. 1983-84 and up to July 1985

'art IV p .... 14 30 Dec_~ 1985
WESTI" PACIFIC RIGID" DATA BANI ON 5OCI01OO11OII[C AIIII IlUl.rH 1110lCAl!)U
.
(~) Health atatu. and au.lity of life ln4icatot.~
- At l •• at 901 of newborn infant I n.ve • birtb woi&ht of at l ••• t 2500 sro.. (Ga. 1)
- At l ••• t 901 of children have a W8ilht for ase thlt correspond. to refereace valu •• liven in Annex I to nevelopaent of Indicator. tor Moaitorinl ~oar.a. Tow.~d. a •• lth for All by th. Y.ar 2000 (Ga.2)
- 1be infant .ortaltey ~t. for .11 idlACifi.Dle oub-aroupo to b.l .... SO per lOO() live birth. (C9)
- Lil. expectancy at birth il -o~at 60 y.ara (GlO) <:rou1/lI/p)
- Materaal _realic1 r&Ca it balov- 3 par thou.aD4 liv. birth. (&5)
Year
1919
1984
1976
1982
- No ca ••• of dipbtbaria, ceeeau., WhOOping cough. 1984 .... le •• polio.,aliti. aDd- tubercu\~.i. occur (a6
.
(d) Indicatora of the delivery of h.altb clra'
Priaary healtb clre i. available to the wnol. population .itb At le •• t cbe followina;
- Tne pe~cental. of deliveriel by trained hoalth p.~oonnol i. 95 (07.4.1)
- the percent ... of children u..uni •• d .. ainet dipl\tMl'ia. c_C",_e t wtJoopiDC coup ..... 1 •• , po1i~01itio aad t~.rtul0.i. io 95 (G7.2)
- Local he.lth eare, iacludin& avail.-biLity of at le •• t 20 ea •• atial drualt vithia one bou~'1 walk or travel i. 100% (G7.J)
- Tbe percenta,e of Children up to at 1 ... t one y.ar of ... ,ivem ro~tiue ch~ld eare by tr.inod h •• 1tb por.ooa.l i. 100 <07.4.2)
- The percentace of praSAaat voaen with at lea.t three viait. for aOCaDatai care i. 100 (G7.4.l)
- The population arovth rate i, reduced to 1 ••• thaa 11 (&7)
1984
1983
1982
1982
1982
Data
•
• • •
-
•
•
86.1
22.S
Total 1\&1.
Act"al Data
- ... - 60.1 yo
female - 63.9 yro
0.032
Whoopia& coup 5 Tuberc:ulo.t. 165 ,.,.-.1 •• 827 Tetea.ua 1 ..
97.6
24.6 - ~a.8 raace
100
1.8
13/SS
13185
13185
13/85
06/85
13/8S
13/85
13/8S
13185
13/8S

\/ESTERN PACIFIC il£GION MTA IIdIr. 011 SOCIOE<XlIIONlC AND lIULTI! IMDlCATOIlS
Indieltor(.) for: FliNCH POLYNESIA
(a) Kealth policy indicator.:
Health for all ha. rec~ive4 endorsement •• policy at tbe hi&beat official level (Cl)
- Macheni ... for involvina peopLe in the ~ple.eQt.tiou of .tEat.aie. have heen formed or Itranathaned. and ate actually tunctioninl (C2)
- At l ••• t 5% ot thl aro •• national ptod~ct i. apent OD heolth (e3)
- A r ••• on.bll plreanta,. of nationll h •• lth expenditure i. devoted to pri .. ry health care (CA)
- ie.Durc •• are equitably di,tribut.d (CS)
- Defined ,tratt,i •• for he.lth for all Ire aCCOMpanied by explicit re.Ource Illac.tiona (G6)
- Defined .trateli •• for health for all need external resour(:.es (C6)
- The need. for external re80urces of v.ll~defined strategi •• for health for all are receiving .~t.ined .upport from .are affluent countries (06)
- At lea.t 80% of local comaunitie. at all level. have vell-eatabliahed voluntary .04 fo~l co.munity oraanizatiOQ'. whieh are c~itted to eontinuoua pri .. ry h.alth care action proara.me. (al)
- The c~UDity contribute. in ca.h and in kind to health or bealth relaced aetion (12)
b) Socioeconomic indicators:
- the percenta.e of popul.tion aerved with .afe water in tbe ho.e or ~ithin 15 .inutea' walking distaace i. 100 (C1.1.1)
- The percent'ae of population vitn adequate •• nitary taciliti •• in tbe home or i ... 4iate viciDity i. 100 (C7.1.tl
- The adult literacy rate for both .en and vomen exee.da 70% (Gill (TotaI/K/P)
- The ,roa. national prod~t per head exceed. USS500 at 1980 m.rket price. (e12)
The daily eer capita calorie availability exceeds 2500 calor... (&3)
- The daily per capita protein availability exceeds 70 8um. (114)
Year
1984
1984
198)
1983
1983
1983
1983
1983
1983
1983
1983
1982
1982
1982
Data
+
•
+
•
• +
•
•
Part IV P .... lj JO Dee_e. 1985
Actual Det.
Yea
Yes
1l.55
41.4
Ye.
Yes
80 - 90
so
95 (urbu)
Source of oat.
13/85
13/85
lJ/8S
13185
13185
tll85
13185
13/85
13/85
I3/SS
• Total - 91/84182* 13185 Male - 90/83/81 ' .... 10- 91/8~/83
• US$ 4 100 or 13/8~ franes CfP848 000
+ 3741 calorie.a 13/85
• 118.96 BU'" 13/85
Motea: The nuabe~ in parenthe.e •• how the nu.ber ,iven to the indicator in the global indicator list {GloDal Stratep for Health For All by the lear 2000. WHO, Cenev. , 1981 ("Health. For All" Series No.3), palea 75-16).
+ '{es
No No info~tion/not availabLe
NA Not applicable * Spe6k/read/write FreneR
Souree 13/S5; Government's Report on Evaluating Progress in Implementing toe Strategies for SFA/2000. 1985
06/S5; Government'. Reply to Cumulative Totals of ca.es and neaths frOG 18 selected Di.eaaea for the Yeara 198)-84 an~ up to July 19S~

'art tV .... 16 30 IHo_T 1985
lIIIaTlIII PAC1FIC IIGIOil DATA _ 011 SOCIOlOOllOlIlC dD IlEALTH lNDlCAtoas
ladie.tor(.) tor. rUNaI FDLYMISIA
ee) Healtb atatul .nd suality of life iadicacort:
- At le •• t 90% of newborn infanca bave « birth ... 1.",. af a. 1 .... 2500 , .... (Ga. I)
- At la ... 90' of ebild •• n 1\& .... a vei,ht for a,. that corr •• poade to referanee valu •• ,iveo ift Anne. 1 to Develo,..nt of lndic.tor. fo~ Monitorina hoar ••• Towarda He.l th for All by tho Y ... 2000 (Ga.2)
1984
- lbe infaat .orealiey r.te for .11 identifiable 1983 aub-sroup. i. below SO per 1000 live bircn. (09)
- tif ••• ,ectancy It birtb i. ove~ 60 year. (ClO) 1980-81 (Toed/NIP)
- Natern.l ~rtalit, ~.t. i. below 1 par thou.a" Ii .. birth. (IJ)
No c .... of di~btb.~la. tec.nu,. Wboopinl COUlh. •••• 1 ••• poli~.liti •• Ad e~.rcul~i. occur (16
(d) lnditatora of_ tbe delivery of ~.lth care:
Priaary b •• lt~ care i. available to the Wbole population with at le •• t the tOllowina:
- The percenta,e of dsliverie. by traine4 health per.ODD.l •• 95 (G7.4.1)
- The perceatlle of children ~uni&ed a.ainel dip~tberi •• cet.nu •• Whoopi~ coulh ..... 1 ••• polia.yeliti. aDd tuberculo.i. i. 9S (C7.2)
- Local h.alth care, ineludina availability of at l.a.e 20 .a.enti.l dr~I" witbin one hour'. walk or travel i. 1001 (G1.l)
- the pe~cent .. e of cbildren QP to .t 1 •• ,t on. y.ar of _,. ,iven routine child care by traioed h •• lch per.oARel i. 100 (C7.4.2)
- Tbe pereent... of prelDant woaen with at lea.t threl vi,it. for aAtenatat eare i. 100 (C7.4.1)
- Tbe population: I1:'OWCb rate i, red.\aCed. to Ie .. th ... 11 (a1l
*66c • 66 coafir.ed
1984
1984
1984
1984
1984
1984
1977-83
.
Oat.
+
+ +
+
+
•
•
92.7
2Z.9
Tocal - ••• Klle - 65.5 yTI , ... le - 67.8 yr.
TUberculo.i. 68(66c)* Mea.le. 113
100
95
80
100
100
3.03
Source of Date
13/85
13/85
ll/85
06/85
13/85
13/85
\3/85
13/85
13/85
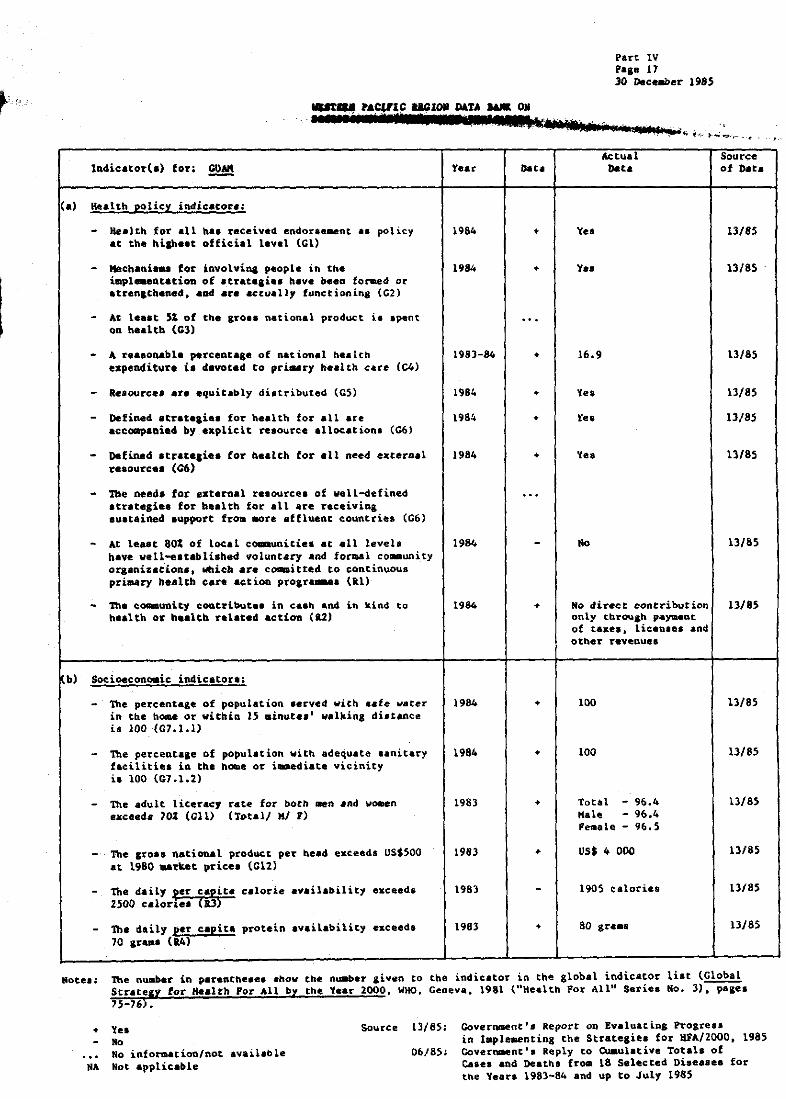
Part IV Page 11 30 Dec_er 1985
__ .ACUIC IIIGIOll DArA _ ON
·11I111'J:r P _. Ittll:1;W.'!lH
lndi.ato.(a) fo.; ~
- Health for all ha. ~.c.ived endor .... nt •• policy at the hiah •• t offic:ial level (cl)
- Mecheni ... for involviaa people in the iapl"'Qtet1on of atratl,i •• have beaa for.ed or atren,tbened, aad a~. aClu.l1y functionina (G2)
At leaat 51 of the 11'0 •• national product i •• pent on bealth (G3)
A r.a.onable percentage of national he.lth expenditure i. devoted to prL.lry health c4te (C4)
- Relourc •• ar. equitably di.tributed (CS)
Defined atrat.aiea for health for all are aceompaDied by •• plicit reaource allocationa (C6)
- Defined atrateaiea for bealth for all need external re8ource. (G6)
- The needa for external relourcea of well-defined .treeegiea for h •• ltb fnr all are receiving luatained support fro. acre affluent countries (G6)
- At least 80% of local com.unitiea at ell level. bave well-eltablilhed voluntary and fo~l community oqanizac:'ion •• wbieb are co.aitted to continuous priaary health care action proaraa.ea (al)
~ Th. eo.auuity cout~ibut.1 in cash and in kind to bealth O~ h.alth ralated action (82)
(b) Socioeconomic indicator.:
- lbe percenta,_ of population lerved with .ate water in the hODe or within 15 .inute.' walkin, diltance i. 100 (G7.1.1)
- The percenta.e of population with adequate aanitary facilities in tbe bome or immediate vicinity i. 100 (C7.1.2l
- The adult licerac, rete for both ~n and woeen exceed. 701 (GIl) (Total/ K/ Fl
- The ItOI. national product pe~ nead exceeds US$SOO .t 1980 .. ~k.t ~.ic.. (GI2)
The daily ,er capica calorie availability exceed. 2S00 cal0.1 •• (83)
- Tbl daily per capita protein availability exceeds 70 , •••• (14)
Year
1984
1984
198)-84
1984
1984
1984
1984
1984
1984
1984
1983
1983
1983
1983
OoC.
•
•
•
•
•
•
•
•
•
•
•
•
Yea
Y ..
16.9
Ye,
Y ..
Ye.
No
a au I, :;u-li .........
/tJ:;,tu.al DaCa
No dir.ct cantribution only thr~.b payaent of taxea. licenael and otner reveQu.,
100
100
Total - 96e4 Kale - 96.4 Fe_Qle - 96.5
usS 4 000
1905 calories
Source of nata
13/85
13/85
13185
13/8S
13/85
13/85
13/85
13/85
13/85
13/85
13/85
13/8S
13185
13/85
Hotea~ The nuaber in parenthese •• how the number aiven to the indicator in the global indicator list (Global Strategy for ,...ltn For All by the Year 2000. WHO, Geoeva. 1981 ("Health For All" Series No~ 3)~, 75-16).
.. Yes - No
e •• No information/not .v.il.ble NA Not applicable
Source 13/8S: Covernment's Report on Evaluating Progres, in laple.enting the Strateaiea for BFA/2oo0. 1985
06/85; Government', Reply to Owaulative Total. of Ca.e. and neatns fro. 18 Selected oi8e.8 •• for the Years ~983-84 and up to July 1985

.
'.~t IV ,,,"18 30 /lec_ber 1985
" • _!"J5X),t,:j" .. "1IB5._ ... CtlIC· UGIOII /lATA _ OIl SOCIOlO)llOIIlC AIID lllALTa lIIDIC&1OIlS
Indicator(a) forI ~
.. ) \ llealth Itatu. and quality of life iltdieatora:
- At. l •• u. 901 of nellborn infanta twve a birth ~ailbt of at 1aaat 2500 cra .. (G8.1l
- At l •• ,t 901 of cbildren hIve • weilbc for .,. that corre.pood. to rarerenee ¥.l~ •• ,ivan in Anne. 1 to De~.l0pe8Dt of La4icltora for Honitorina Procr ••• toward, "alth fo~ All by the Y.ar 2000 (G8.2l
- The infaot dOrtality rate for _11 identifiable lub-ar'oup. i. below )0 per 1000 live bi~tb. tC9)
Life. upec:taney at birth i., O'H'l' 60 ,.&'te {C1G) (Totd/K/F)
- Materaal .orta1it7 raCa i. below l per t_aa1lll li ... Ioinha (as>
- No c .... of diphtheria, tet.nu •• vhoopina cou&h , .... 1 ••• polia.y.liti. an4 tubereulo.t. GCcur (R6
(4) Indicator. of the delivery of he.lt~ eare;
Pri .. ry he.lth care i. avail.ble to the whole population with At leaat the fo11~1 .. :
- ,The p.~c.ntaae of d.li~eri •• by trained _.alth.p ... _l is 95 (Gl.4.1l
~ Tbe perceQtace of children L..unised .. ain., diphtheria, tetaoua, wbOOpia, COUlh, .... 1 •• , pol.iomyelitb .• rut. tubercula.i. is 95- tG1.2)
- Local be.ltt.. care, iftC.lu4iac avaUabili.ty of at l ••• t 20 •••• nti.t drul" lIi·~iq 1)1\.
boU~I. walk or travel i. 100% (G7.J)
- Tbe percentage of children up to at lea.e one y.ar of ... liven routine cbi14 care.by t •• ine4 heoltn p •••• nn.1 i. 100 (Gl.4.2)
- The percentage of preenant women with at 1 ••• e ttiree viaiea for antenatal care b 100 (C7.4.1J
- the population arowtn rate i. reduced to Ie.. tl\&" It (1.1)
( ) number in parenthe.i. refer. to u.ported cases
.
Year
1983
198)
1983
198)
1984
198J
1983
. ,
1983
Da ..
•
•
• • •
+
•
92.4
9.1
lotal
Mt ... 1 Data
Kale - 09.6 years Peaale - 14.S ye.rs
0.314
Tub.rc~loai. S4 " •• al.. 104
99.9
82-86 rana"
100
911
2.2
.-;;,
SOUTee of Data
13/85
13185
13/85
13185
1318S
lll8S
13/8~
13/8~
13/8S
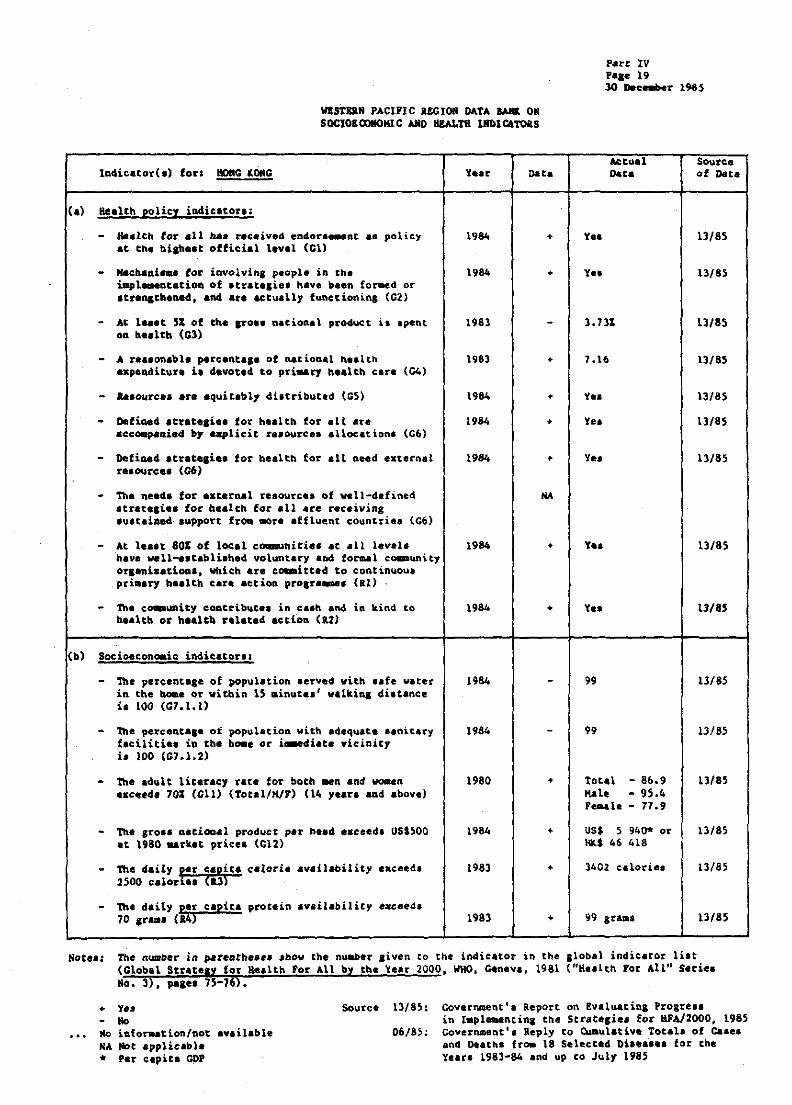
WlSTIIlH PACIPI C UG 1011 DATA ...... ON SOCIOItCOllOMlC o\IID IlEALTII lJmlCATOU
Vear Data
- Health tor &11 baa received endor .... nt •• po1icy at the hi,b •• t offieial level tel)
- Hecbani ... tor involvin, people in the i.,l ... ntaciOft of 'trace,ie. have b.en foraed or etreRlch.ned. and ar. &etually functionin& (02)
- At l .. 't 51 of the Iro.1 national product i •• pent on health (G3)
- A re •• onable percenta,. of national ~ •• lth expenditure i, devoted to pri .. ry health care (G4)
- ... ourc ••• re equitably di.tributtd (GS)
- Defiaed .t~.te.i •• for health for all are accoapaaied by .. ,licit re.aure •• allocation. (G6)
- Defined etrate,i •• for health for all need external r •• ourc. •• (G6)
- The need, for esternal resource. of veIl-defined Itrate,ie. for b •• lth for all A~e receiving .u.teiDed .upport fro. .are affluent countrie. (CO)
- At leaat 80% of loeal ca.aunitie •• e .11 level. heve well-..tabli.he4 voluntary aDd formal caa-unity orleni •• tioa •• whi~h are caa-itted to cootinuou. pri •• ry h'alth ear •• ction prolr ..... (11)
- the ca..unit1 cQnC~ibute. in ea.~ and in kind to he.lth or b •• ltb rtletad ~tion (a2)
(b) Socio8eonoaic indicator.:
- The percenta,e of ~pulltion lerved vith I.fe water in the boa_ or witbin 15 .tnute.' vllkina di.cance io too (G7.1.U
The percencI.e of population wit~ .dequ.te .anitary fac\litiel iQ tha bo.e or i ... di.te vieiaity to 100 (G7.1.2)
The adult liceracy rate for boch ~n and ~n •• < •• d. 701 (GIl) (Total/H1F) (14 year. and above)
- The Iro •• aatiODal product per h •• d e.ceed. U5&500 at \980 .. rket pric.. (e12)
The daily ear capiea calorie availability exceed. 2500 calor... (IJ)
The daily per tapita procein availability exceeo. 70 in, .. (14)
1984 +
•
1983
1983 •
\984 • 1984 •
1984 •
1984 •
1984 +
1984
1984
1980 •
1984 •
1983 +
1983 •
Part IV Paae 19 30 Dec"'..r 1985
Actual 00 ..
Y ..
Y ..
3.131
7.16
Y ..
Y ..
Yeo
Y ..
Y ..
99
99
totd !lal. ' .... 11:
- 86.9 - 9~.4 - 77.9
USS 5 940* or HItS 46 418
99 gralla
Sourc.e of Data
13/8S
13/85
13/8S
13/8S
13/85
11/8S
13/85
U/8S
U/8S
13/85
13/85
13/BS
13/8S
\3/85
13/85
Hote.: The numoer in ~r.Dtb •• e •• bcw the nuaber liven to the indielcor in the Ilobel indic.t~r li.t (Clobal StrltelY fol' Redth For All by cbe "'.ar 2000, WHO. Cene"" 1981 ("HeaLet\ For AU" Serie. Mo. 3). pa,.' 75-76).
+ Yes No
Me infor.ationfnot available NA Not .pplicable • 'er capita CDP
SOurce 13/85: Covernnent ' , Report on Evaluaeina Progre •• in tapla.entina the Scrate,ie. for RFAJ2000, 1985
06/85; Government'. Reply to ~ul.tiv. Totala of cases and neath' fro. 18 Selected 'DiI •• -••• for the te.r. L983-84 and up co July 1985
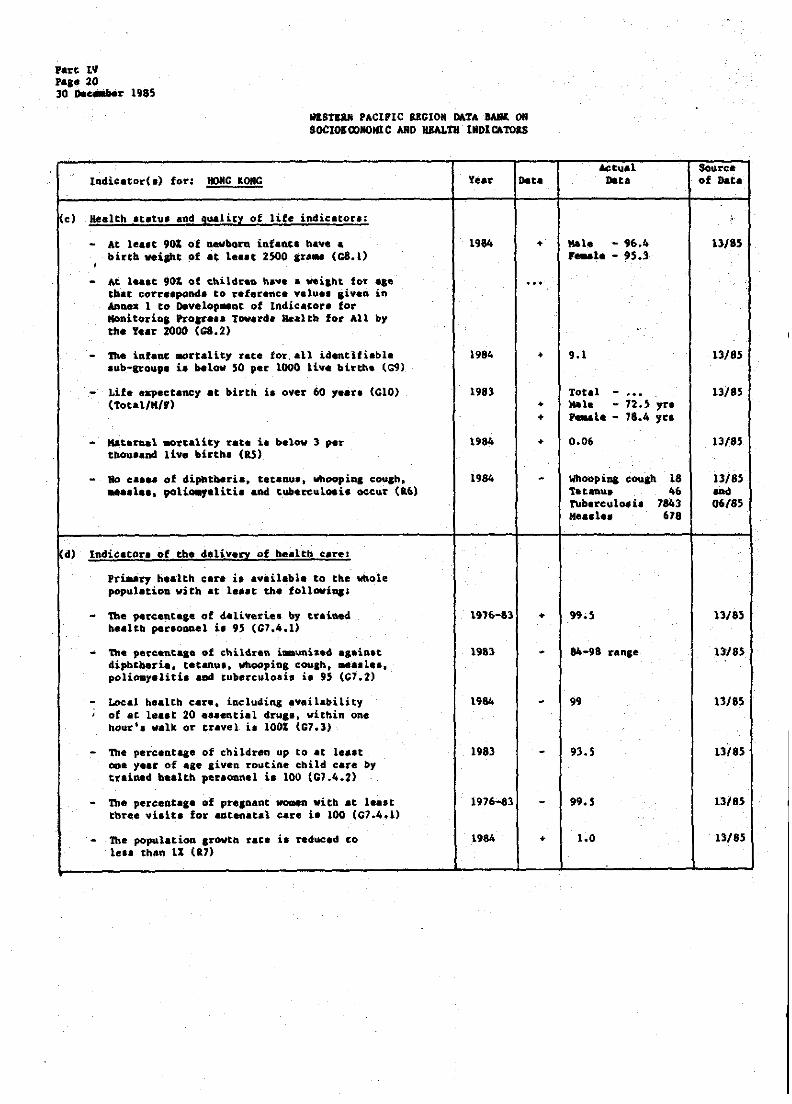
.
'.~t tV Pa,_ 20 30 lIe~r 1985
YlSTIlN PACIFIC aEGION DATA BARl ON SOCIOIOONOIIlC ABD IlJALTli tNDlCATOas
Year Da .. Actual
lleta
c) Health Itatu, and quality of life indicator.:
- At lea.t 90% of a.evbora, la.faa.c.1 have. birtb veilht ~f .t 1 ••• t 2500 Ir ... (GB.1)
I
- At l ... t 90' of cbild~.Q nlve • ~iaht for a.e tbat corr •• poada to ref.rence valu •• liven in APnea 1 to Develop .. nt of Indicator. for Monitorial tro~ ••• T~r4 • .. altb for All., the '.ar 2000 (GS.2)
- Tne infant aort41ity rate for .• ll identifiable aub-arou,. i. below 50 per 1000 live bi'rthe (C9)
- Life e.peetancy .t birth i. over 60 , •• r. (CIO) (Total/K/F)
- Mataraal ao~t.lity rate i, below 3 ,er thou.and live birthl (as)
- ao c ..... of dipbtblria, tetama_, whoopina couCh, .... 1 ••• poU . .,elitil ud tubere"loai. occur (1.6)
d) Indicator. of thl delivery of bealtb c.re:
.rwry h.alth caU i. a.,.nabl. to the whole popul.tiou with at le'lt the follawiQll
- the 9.~~.nt.,e of daliverie. by tcaia.4 he.ICb per.oDD_l i. 9) (G7.4.1)
- The ,e~c.nt ... of e~ildr.n i .. unize4 •• aina, dipbc~r", tetanu., wboopia8, coulh., .... 1 ••• polio.,.lit1 •• Dd tuberculo,i. i. " (C7.2)
- Local health care, iaclu6ina availability j of at l ••• t 20 •••• nti.l dru,., within one
ho,,~'. walk or travel i, 1001 (e7.])
- The percentaae of childrln up to at l ••• t ooe y •• r of 4,e liven routiAe child care by t.aiaed health per.oan.1 i. 100 (C7.4.2)
- The percentaae of pre,nant ~ with at l ••• t tbree vi.it. for a4tenat.l care i. 100 (G1.4.1)
- The population Crowtb race i. reduc.d co I... chan 11 (17)
1984
1984
198)
1984
1984
1916-83
1983
1984
1983
1976-33
19M
+
+
• +
+
Kale - 96.~ 1'_1. - 95.3
9.1
Tot.l - ~ •. Kal. - 72.S yr • ,...1. - 78.4 yea
0.06
Whoop iq coup Tatanu. t\abercul""it Me •• 1 ••
18 46
7843 678
+ 99.S ,
- 84-98 ran,e
99
93.5
99.'
+ 1.0
Source of Dat.
1)/85
13/85
13/85
13/85
13/85 ODd 06185
13185
13/85
III 85
13185
13/85
13185
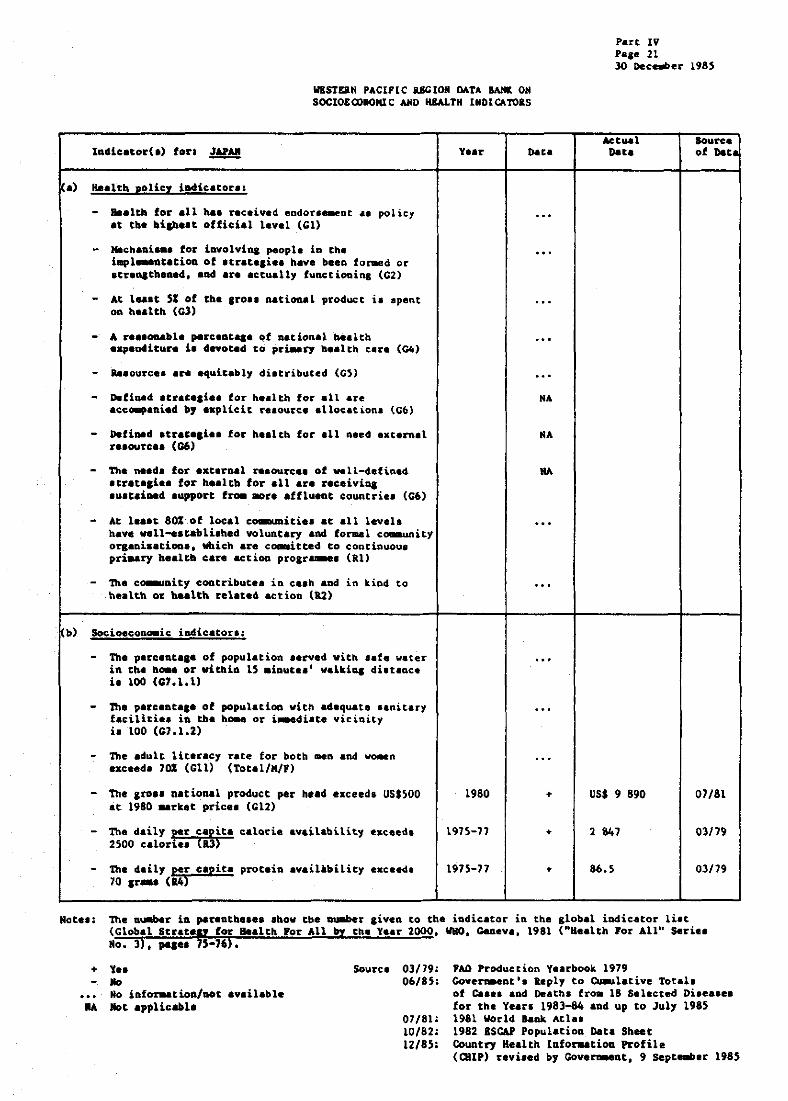
Part IV Pe,. 21 JO Dec_or 1985
WESTERN PACIFIC alGIOI OATA BAHl ON SOCIOEOOIOIIlC AIIo Il&ALTH INolCATOR.S
(al Health policy ladieatorl:
- .. altb for all ba, receiv.d endorle.ent •• policy .t tb. blab •• t officiol l.vel (Gl)
- ~chani ... for iovolviaa people in the impl ... atatioo of Itrateli •• have been fo~d or .tren,ch.ned, aad are actually functioning (e2)
- At l ... t 51 of th. aro •• natiOQ.l product i •• pent 01\ hoalth (Gl)
- A raa.oaabl. ,.~ceDt ... ~f national bealch ex,lnd'ture 1. d .. oeed to prt..ry health clre (04)
- o.fiqad Itra, •• i.1 for he.lth for all are acco.pla.iact at, •• plicit t'.lourCI Illocation. (G6)
- Defined Itrl'I,'.' for h.alth for all naed axternal r •• our ••• (06)
- n.a na.dl for Ixternal relourc •• of well-4efinlc1 .trltl.i.e for h.alth for all are rlceiviaa .u..taiaed .upport fro. aora .ffluent countrie. (C6)
- At 1 ••• , 801 of local ca.munitie. at all level a ha .. vell-e.t:abliahed voluntary and formal ca-unity oraani.ationl. Which are e~tted to continuou. priaary bealtb care action progr ..... (kl)
- The ca..unlty contribute. in ca.h and in kind to nealtb or healtb relat.4 action (tl)
b) Socioecono.ic indicator.:
- The pareant ••• of population .erved vith .afe water in the ha.e or within 15 .inute.' walkiGi di.tanc. io 100 (C7.1.11
- Thl percent.,. ot population with adequate •• nitary facilitia. in th. ho.e or i..-diate vicinity i. 100 (G7.1.2)
- The adult literacy rate for both .en and wo.en exceed. 701 (Gil) (Tot.l/M/Pl
- The ,ro •• national product per head exceed. USSSOO at 1980 .. rk.t price. (G12)
- The daily per capita calorie availability exceeda 2500 calori.. (R.l)
- The daily per c.pita protein availability exc •• d, 70 Ir •• (14)
Yell' o.t.
NA
1980 •
1975-77 •
1975-77 •
ktual o.t.
US, 9 890
2 1147
86.5
Sou.rce of o.t,
01/81
03179
03/79
Note.: The nu.ber in parantb ••••• how tbe ou.be~ eiven to the Ladicator in the global iodicator lilt :~~?-=:==::::~c:i*..::==:...:p",0:.:r...!:A"-1.:.1....::.,-,t::h::e:.....:Y"o,,,.,,-r....:.200=0~, WHO, eea.eva, 1981 ("Health Fo~ All" Serie.
+ Yea 110 No iDfor.at~A/DOt available
lit. IIot .pplicobh
Source 03/79: 06/85:
07/81: 10182: 12/8S:
FAG Production Vearbook 1979 Coveraaent'. Reply to cu.ulative Total. of C.aea and Deaths fra. 18 Selected Dia.aa •• for the Yeors 1983-84 and up to July 1985 1981 World 800k Atl •• 1982 ISeAI PopulatioQ Data Sheet Country Health IDfo~tion Profile (CHIP) revi.ed by Govern.ent, 9 Septe.ber 1985

.
'art IV .... 22 10 o.e_r 1915
IIIIsruJI p"ClfIe IIG1011 lIfo"a _ 011 ' __ C AlII) IIIAI.11I lJIDICUVU
Indieacor(a) for. 8l!! Y •• r Data
(e) Health atatua a04 gua1itl of ~if. iadicacora:
· At l .... e to% of nevbora int.oca ... .,. • 1984 + birtb weiabt of at 1 ... , 2500 ,r ... (ca. 1)
· &e l •• ,t 901 of children have. weiSh' for 'Ie ... tbat corr •• poada to refereace valu •• ,iven in ADDea 1 to o.valo,..Dt of Indicator. for lIOaitoriac Pro_, Tow.re. Healtb for All by tbe Y •• r 2000 (ca.2)
· 'DIe iaf.nt .,rtalit1 rate for ,11 i4e..-tUi,laile 1984 + .ub~ ... p ... below 50 per 1000 li". birtb. (1:9)
· Life allpectaae1 at birtk i, oYer 60 , •• 1'& (CIO) 1984 (Total/II/,) +
+
· Maternal IIOrulle; rate i.a below 3 per 198) + ,hou'end u."" birth. (15)
· Ro c .... of d.l,htberia, tet'''''' ..... oo,iq; couaft. 1983 . .... 1 ••• poll __ lith end t".rculooh occur (&6
.
(4) ladle.tora of tbe delive£! of health care;
Pr~ry health care i. available to Cbe Whole populatioD with .~ l ••• t the followl ...
· The percenta,e of daliveri.. by traiaed ... bealtb peraoaDel i. 9~ (C7.4.1)
· The parcaDt.,. of childreD L..unis.d ... in.t ... diphtberia. tetaau •• wboopiaa cou,h ..... 1 ••• poli..,.litil and tub •• euloai. ia 95 <C7.2)
· Local bealtb care. inclu4iDI availability ... of at l ••• t 20 •••• nci.l druca, witbiD on. bo~r'. walk or ~r.v.l i. 1001 (C7.l)
· the p.rceGc", of cbi14ren up to at 1 ... , ... oa.e y .. r of a •• aivlo routi" cbild care by train-d h •• ltb ,.1'100 .. 1 i. 100 (C7.4.2)
· 'lbe perc*"caa' of precunt WGMn vitb at l ... t ... three vi.ie.' f~ lateDatal cara i. 100 tG7.4.l)
· The population ,rawtb race i. reduc .. co 1982 + 1 .. , thaD 1% (17)
Act ... 1 _rca
Data of Da~
94.6 12/85
6.0 11/85
TOtal - ... 12/85 *1. ·74.54.' .... , ... 1 •• 8O.16,..r.
0.204 12/85
Diphth ... ia 20 06185 r.rt.ala 2 459 TetaAUa 56 Polioayelitio 0 Tuberculoeio 63 789 Meaal •• 7281
.
0.7 10/82

WESTUN PACIfIC \!£GIOII DAtA _ ON SOClOlOOllOKlC AND I\I!ALTII INOtCATOItS
lndicator(.) for: ~IIlIATI Year Dat.
<.) Kealtn policy indic.core:
- Healtn fo~ all hal ~c.iy.d .n4or .... nt •• policy .t tn. blab •• t offi.i.l lev.l (Gl)
- "-chani... for involvlna people in tbe Lapl..-otacion 41 .tratesie. bave ~ •• n fo~d or atreoltbened, ah4 are actually tunctionin& ee2)
- At I.ale 51 of the aro •• national prod~t i •• pent on bealth (Ill)
- A re •• OG&bla perc.at ••• of n.tional he.ltft expenditur. i. devoted to PTi.ary health care (04)
- Reaource. are equitably diltributed <C5)
- Defiued acrate,i •• for healtb for all are accoapaDled by aaplicit r •• ource allocation. (C6)
- Defiaa4 .t~&t •• i •• for h •• ltn for .11 n •• d •• ternal r •• oun .. (06)
- The need. tor asternal reeource. of wel1-defiaed acrate.i •• for h •• ltb for all are reeeivins auatained aupport fro • .ore affluent countrie. (06)
- At lea.t 80% of local co.aunitiel at all level, nave wel1-eatabli.ha4 voluntary and fo~l community oTaa4i&atioaa, wbich Ire coaaitted to tontinuou. pri.1I&'f')' " .. ltb car. action prGlt' ..... 01,1>
- The comaUAity ~ontriPu' •• in c •• n and in kind to h.alth or h •• lth relate •• ctiOD Ca2)
- the percentac. of population .erve4 witb aate vater in the ha.e or within 15 ainut.,' valkiua diatance is 100 (07.1.1)
- The percenta,e of population with adequate •• oieary facilitie. in the boae or i..-dia'. viciAlty i. 100 (07.1.2)
- The adult literacy rate for boch .en And vo.en exc •• d. 701 (Gll) (Tot.l!K/F)
- the ~O •• D4ti .. al product per bud Gceeoa USS500 at 1980 .. ~k •• tric.. (GI2)
- 'l11.. _ dai~J Nt caDit. e.lol'ie availability exceed. 2500 ~ .. y. ••• (1.)
- 'lb .. 4ail)',1 .... ~r~:.!I:!!! pc-otein .v.ib,bUhy exceed. 10 .r_. U""
1984 +
1984 +
1984 +
1984 •
1984 • 1984 +
1984 +
1984 +
1983 +
1911 +
19S4 +
1981
Part IV Pa.e Z3 30 Doc_er 1985
Y ••
Yeo
10
10
Ye •
Ye.
Y ••
Y ••
95
Y ••
Total 1141.
Aetud Dat.
95
Female -
US$ 41.45* or M 50.l
Source of Do ..
13/85
13(85
13/85
13/85
13/85
13/85
13/85
13/85
13/85
13/85
13/85
13/85
Notes; the number in p&~entne.e. show the number given to tne indicator in the slobal indiCAtor list (Global Straten for Iie.len POl" All by the Year 2000, WHO, Geneva, 1981 (Uliealth 101' All" Seri.es fio. 3), p •••• 75-16).
+ Yel No "0 iofo~tiOD/not available
KA Mot applicable
Souree 13/85: eovernment ' , Report on Monitoring Progress in tapl..eocing the Strate&i •• for "'A/2OGO, 198~
* this ia not & reliable indit.tor for Riribati sinee about J~~ of the populatioa live IUbsietence life.
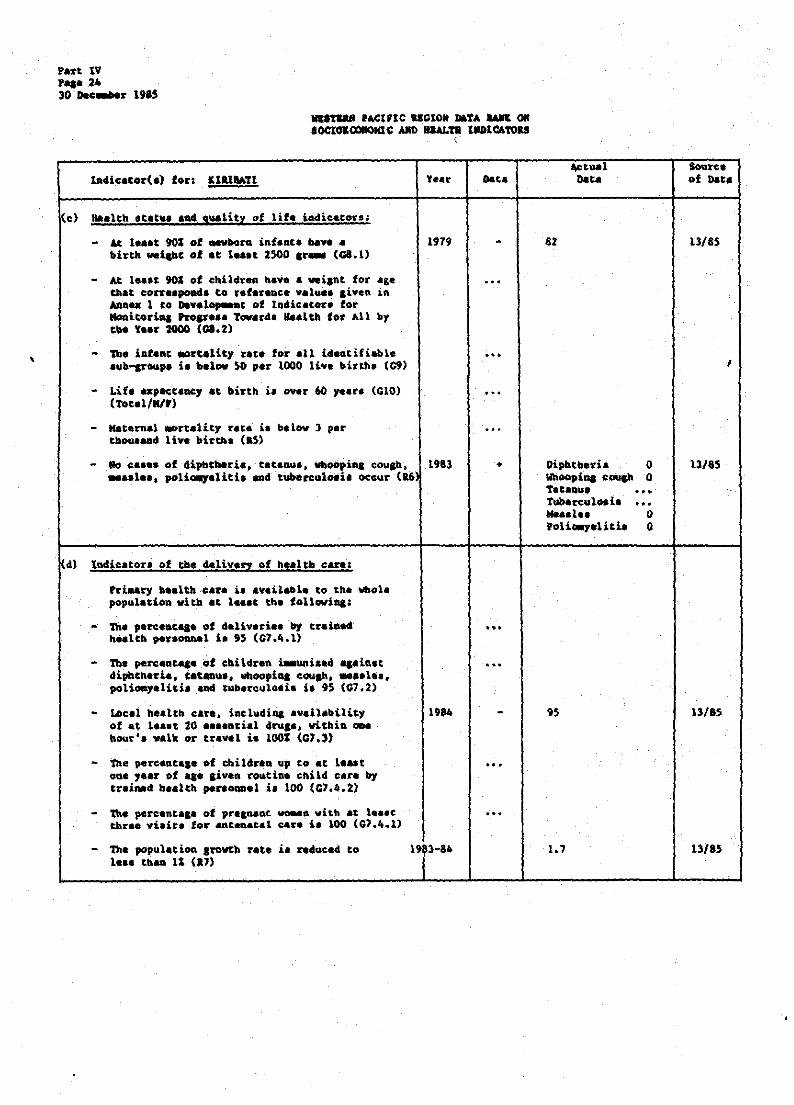
,
Part IV 'q. :l4 30 __ r 1985
_ '4ClF1C ISC10M _Tot. _ 011 .0000IClOIIOMlC AMI! UALft tIID1CA'l'OU
c
lA4icatar( a) fol': UllllUl Yeaf' Data
(0) ~.lth .t.tUI a .. Sua1itl of life iadicators:
- At l ••• t 901 of tlillWMra in-f.a.ta baft • 1979 -birth ... 1. .... of at luot 2500 &r_ (GIl. I)
- At 1e •• t 901 of children bave • wwi.nt for Age ... that corr •• p004. to ,efarenee ~.lu., ,iven iB AnI .. 1 to DaY.~c of Indicator. for _itor'" "'oar ... Tovar4 • .,..lth for All by .... Y.ar 2IlOO (08.2)
- the iAlaat .o~t.lity rate for .11 tdeatifi~l. ... lub-aoOUPO i. balow SO per 1000 liYe birth. (~)
- Life aapacteoc1 at birth i. over 60 ,.at. (GIO) ... (Total/Kl')
- Katernal ~rt.lit1 rat_ i. below J per ... tbou.aad Ii •• birth. <as)
- Ro c. •••• of dipbtheria, tet ...... ftoOpiq couch. 1983 • .ao1a., poll __ litb ... d 'uberouloda occur (R6
.
d) Indicatoro .. f ~. 4eliveEZ of he.lth care:
'ri .. ry health o.ra it avatlaol. to the whole poPQla'ioo vitb a_ 1 .... ,h. loll~i ...
.
- The ,erc.~t ... of 4elivari •• '~ cralG6d heal.h ~roonn.l i. 95 (G7.4.1)
... - 'rile pe .. aa_ .. _ of .IlUdren u.uniaa4 qaiaot ...
4ipbctl.l'u. tet_u., vboopi .. e.OUlh •••• 1 ••• palioay_li,i. and tube.cQla_i. i. 9S (G7.2)
- LDc.l h •• lt~ eare, includina .v.il.bility 19" -of at l ••• t 20 •••• Deial 4eu,., viCbia OD. boo.'. walk Dr t.aval ia 1001 (G7.)
- The pereanta.e of children up to at l •• ,t ... oDe , •• r of as. liven ~~tiua Child car. by .rainad be.lth ~"00D.1 i. 100 (G7.4.2)
~ the percentaae of preaGan( WGeeO with at ' ••• e ... thr •• yi.it. for attteaaeal car. i. 100 (G).4.1)
- The popula, loa INvth 1_ •• t~ao IS (a7)
rate iI ndt.aeed to 19r-a.
AIe,,,,,1 SOurce Data of Dat.
82 13/85
,
Dipbtberia 0 13/85 \/hoopi.. couch 0 tataQu. . .. Tubereulo.i • ... Nead •• 0 .oli __ U'la 0
95 13/85
1.7 13/85
,

llUTa. PACIFl C UCIOll Dl.T4 ... 011 SOCWIOOIIOII1C .... 1> IllALTK IIDlCArolS
Dau
(.) aealcb poli¢l indi~ator.;
- Health for .11 baa r.~.iv.4 .ado~''''Qt ., policy at tho hilb •• t offi~i.l levol (Gl)
- Mechani ... for 1nvolviaa people in tbe i.,la.eotatioa of atrat.,t •• b.ve be.n fora.d or .trenathene4, ,ad are ectuall7 fUActioaina (Gl)
- At 1 ••• t 51 of the Iro •• n.tional product ia .pent on h_dth (63)
- A re._ooabl. percentaa_ of national h •• lth ~p.b4itur. i. devot.d to pr~rJ b •• tth e.re (C4)
- aelourc ••• re equitably di.tribut.d (CS)
- Defined ,trat •• ie. for health for all are accompaaied by explieit re.ource .ll~atioft. (C6)
- Defined .t~.t-a1 •• for be.lth for all need &Xt.rnal ra.Durc •• (G6)
- lb. need. for external ce.ouree. of well-defined .trateli •• for b.,lta for .11 are recei.in& .u.t.ine4 lupport fra. more .fflueQt cO~Gtriel (C6)
- At ie •• t 801 of loc.l eoaaunitiea at all level. have weU-e,tabliabe4 voluntary and fo~l eoaaunity oraani&ationl. wbieh are comaitCed to contiououa pri .. ry be.lth care action proar..... (Il)
- The co..uoity cOfttribut-. in c.,n .ad in kipd to health or he.ltb rel.ted .~tioG (12)
- The p.r~.Rt ••• of pOpulacion •• rve4 viCb •• te v.c.~ iu the boa. Qr within l~ .iDut •• ' valkiGi di.t8ft~e i. lOO (1l7.l.t)
- The perc.u~.,. of population vitb adequat ••• aitary faciliti •• ia the bo.e or i ... diate vicinity i. 100 (67.1.2)
- The adult literacy r.te for both .en .ad woaen e~c •• d. 70% (Gil) (Tot.l/KlF)
- The ceo •• national product per b •• d exe •• d. US'SOO at 1980 .acket price. (GlZ)
- The daily per capita ~.lorie availability exceeda 2500 •• lori.. (&])
- The d«ily per capita protein availability .~eed. 70 gr ... (a4)
1984 •
1984 •
1984 •
1984 •
1984 • 19&4 •
1984 •
1984 +
1984 -
1984 •
...
198~ -
19&4 -
19&4 -
1984 -
Part IV ,.. :5 30 J)ac_er 1985
.. t .... l oat<
Y ••
Y ••
5
50
Y ..
Y ..
Yea
80
60
20
Tot.1. -MAle -F ..... l. -
US$202
8~ ... ...
1842 calorie.
41.71raas
Source of Dat.
l3/8S
13/85
13185
13/85
1)/85
13/85
ll/65
13/85
13/85
13/S5
l31&5
!l/8S
13/85
l3(85
Notes: the nu.b.~ in "~.Gchc.e • .nov cae nuaDer given to the iGdicacor in the global iadieator list (Glob .. } StE.e.v for Healtb '01' AU by th. '&tiro 2000. WKO, Ge:aeva, 1981 ("Health POt' AU tl series No. 31, p.,e. 75-76).
+ 'Ye. 110 50 iQfo~tiou/Got .vail.bIe
NA lot applicable
Source 13/85: Covern.ent'. Report on Evaluating Progress iD ~pl ... ntiQg the Strate&iel for 8FA/2000, 1985
06185: Gover~atl. aeply to Ow.ulative Total. of c. ••• aDd De.th. froa 18 Selected Di.ea ••• for the Year. 1983-84 and up to July 198~

'are IV , ... 26 30 INC .... ~ 1"5
1I&1T11UI 'AClne &&GlOM \lATA ..... Ill! SOCI0.COIOIIlC A1II) a.J.rB lIDIGtoTOU
Iuie.toTh) fN' LAD PIOPLI'S DIMOCIATIC 'IPUI~lC f.~r Data
(e) lIe.lta. atat.ua aM 2a1it:r: of 11f! indieator .. : .
- . At 1 ... t 901 ot _no 11lfaoto II .... <I 1984 -birth .... ipt of at 1 .... 2500 Ir ... (G8.1l
• - At l •• ,t 901 of- 'Cbi14ftD tl.I .... -Wi,ht. for .... ... tbat corr •• pooda to reference value. civen in AIm" 1 to De:velopM:"t of Iodice,,,,,. for MoDitoriD, ~olra •• Toward .... lth tor All by tb. y •• r 2000 (ca.2)
- Tbe iaraRt .ort,lit, rat. tOt ell identifi.bl. 1984 ~
.ub-araupa i. b.low SO p.r 1000 1iv. birth. (G9)
- Lif. ..,eetaftC1 at bir~h i. aver 60 ,eer. (ClO) 1980~n
(Total/111r) --,. lIIa ..... 1 .,-reality ,rate i. below 3 ,.1" 1984 +
tbouaaD4 ll~. birtb. (as)
- 10 ca ••• of dlphtheri&t tee.nu., WDoopin, cough, 1984 -.... 1 ••• polio.r.litia &n4 tub.rc~10.i. occur (16)
.
(d) In4ic.tore of the 'eliv«IX of b •• ltb c.~.:
PrL.ary ~ •• ltn care i, ev.il.bl. to t-' ...... 10 population witk &C 1 ••• , tb_ followiaa=
- 1b. parc.me... of d.l •••• i.. b7 t.aiD.d ." bultll ""~'ODDe1 to 95 (07.4.1)
- til. ""~"Dt ... of cI\U4 ........... 1_ a,dAn ... tlipbtbe.,i •• t.taftua, _oopi. coup, .... 1 •• , roll_.lit" .04 tube.culooio i. 9~ (07.2)
: - Local healtb c.re. i .. clo4 ...... i1ability 1984 -of at 10 ... 20 ...... tial 4 ...... vitl>i" _ hour'. val_ or tray.l i. 1001 (07.3)
- 11>. "" ..... t ... of chtldr ... u, to at l ... t ... oae rc&l' of a.a ,ive. ~ti .. chil4 C .. H b, tubed huttl> '.UODDel .. 100 (07.4.2)
- Tbe percefttace oC.pr.I~Dt vo.ea with at l •• at ... <br .. vi.ie. for .. tODat.' •• r. i. 100 (01.4.1)
- 'lb. popu 1....... ,r"w". ret. La reduced to 1985 -le .. tit .. 11 (17)
Act ... l So,,". Data of Dat.
60-70 13/"
104.0 1318S
Total .... . .. 13I8S Hala ~ 44.6 yro .... t. - 4J.S yr.
0.02 13/85
Diphtheria 30 06/85 'ertu_i. 1 au Tetat.ll". 31 poU_eUth 13 TuN.ft.uloei.. 6 5~8 Hu.l •• 924
•
66.7 13/85
.
2.9 lSI'S
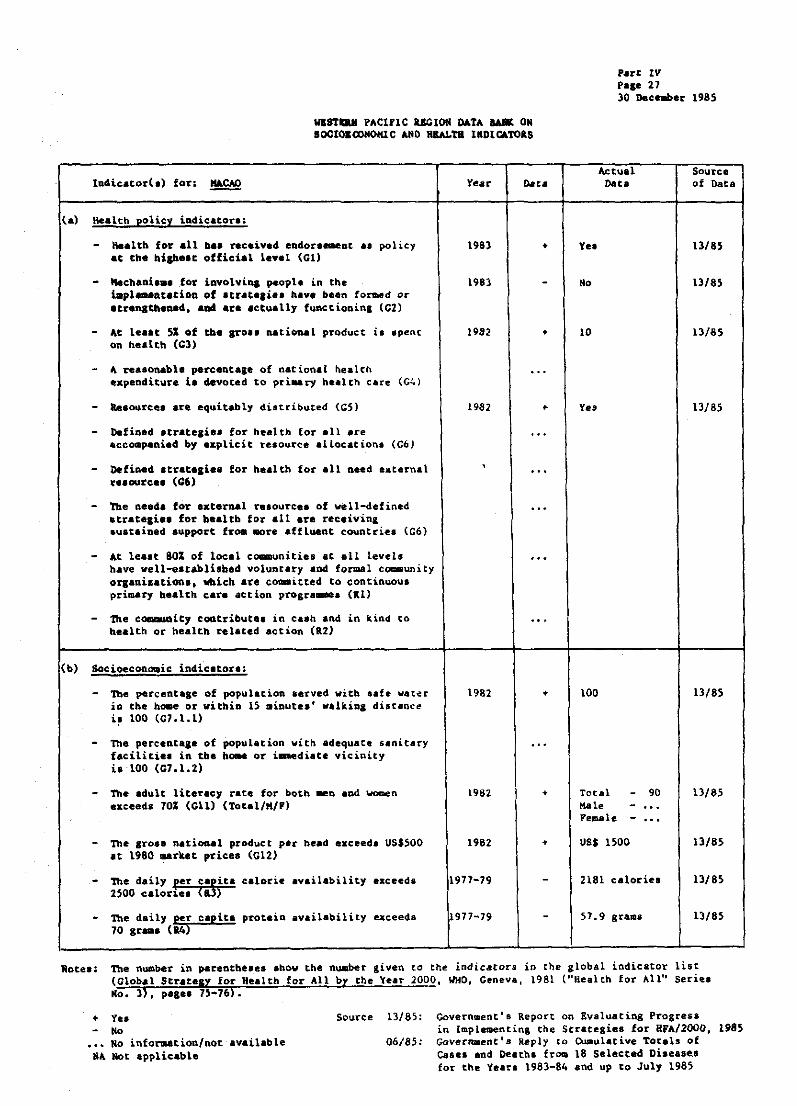
WlSTIWI PACIFlC il&GION DATA 10\& ON BOCla&COIIOIUC AND lI&ALTB UDICATO~S
In4ieacor(.) for~ ~
ta) aealth policy indieatorl.
a.altb for .11 b., received endorl.-eat 8' policy It the bien •• t officiol 1 ••• 1 (GIl
- Mechani... for iavolvioa people in the impl~Qt.tion of Jtrate,ie. havI been to~d or Itrenatbeoed •• 04 are actually funccioninl (e2)
4t l •• at SI of the grol. natioa.l product i •• penc on health (G31
~ reasonable percentale of national health ~xpeaditure i. devoted to pri .. ry he.lth care (G~)
- ae.our~e. are equitably 4iatributed (CS)
- Defined Icrateli.1 for health (or .11 are 4ccompaaied by explicit resource allocacionl (G6)
Defined acrac_aie. for he.lth for all need I.tarnal fe.ourCI. (C6l
- the need. for external re.ourc •• of well-defined _trat_ai •• for h.altb for all are receivin& .ustained .uppo~t fro. ~r' affluent countri.a (C6)
- At leaat 80% of local coamunities at all levels have vell-eatabli.bed volunta~1 aDd fo~l community organi.ationa. which are com.itted to continuous primary health car. action progra..ea (al)
- The comauGity coatribut.. in caah and in kind to health or health related action (R2)
(b) SOcioecOAaqic indicator.:
- The percent_ge of population served with •• fe w.t~r 10 the ba-e or vitbio 15 minute.' walkiol di.tanee i~ 100 (Gl.l.lI
The percentasa of population witn adequate sanitary facilities in the ha-e or i.mediate vicinity ia 100 (Gl.lo21
- The adult literacy rate for both .eo .ad women eaceoda 70% (GIl) (Tot.l/M/PI
- The Iro •• national product per be.d •• ceeda US$500 It 1980 market prices (G121
- The daily fer ciJita ealori. availability eKceeds 2500 calor1e. ( )
- The daily per capita protein availability exceeds 70 gro ... (14)
Vear Dats
198) •
198) -
1982 •
...
1982 • ...
...
...
1982 •
1982 •
1982 •
1971-19
1971-79
Part IV PaSe 17 30 Dec_er 1985
Actual Data
Ye.
No
10
Yes
100
Total -Hale -Female -USS IS00
90 ... ...
HSl calorie.
51.9 grams
Source of Data
13/8S
13/85
13/85
13/85
13/85
13/S5
13/8S
13/8~
1)/8~
Rote.: The number in pareacbel.e. abov the number given to the indicators in the global indicator list (Global Strat.17 for Health for All by the Year 2000, WHO, Geneva, 1981 ("Health for All" Series No.3). paa •• 7~-161.
+ Yea No No inforaation/not available
NA Not .ppIic.bIe
Source 13/85: Government's Report on Evaluating Progress in Implementing the Strategies for HFA/2000. 1985
06185: Govern.enc's Reply to Cuaulative TOtals of CIsel and Deathl from 18 Selected nilea.e. for the Yearl 1983-84 and up to July 1985

Part tV Page 28 )0 »eceabe. 198~
WlSTS" PaCIFIC RECIOR DATa IANI OR aoclOBalIIOIG.C AlII) IWILTil tllJ)lrAtou
I Indicator(.J tor. ~
(c) Health .tatul and quality of life indicator.:
- At le.at 90' of newborn infant. b.~. • birtb wei&ht of at lea.t 2Soo sr ... (08.1)
- At le •• t 901 of cki14~e~ have a w.tabt fo~ a&e that correapo~d. to reference valu •• liYen in Annex 1 to Develo~c of Indic.,orl for Konitoriq !roar ... ",owatiSe Keelt.b. for All by tbe Ye •• 2000 (CS.2J
- Tn. infant .art.tity ~&te for all identifi.ble lub-,roup. i. ~.lov 50 per 1000 live birth. (C9)
- Life expect.acy at birtb i. over 60 ye.r. (ctO) (Total/II/F)
- Maternal .artalit, raCe i. below ) p.r tbou .. nd liv. birtb. (IS) ,
- No c •••• of dlpbtberia, taealW., 'Vb.oopiq cauSh ..... 1 ••• polio.y.liei. and tub.rculo,i. occur (&6)
(d) ladicatore of ,be 4elivary of health care:
Pr~ry b.a1th care i. available to che whole population witb at 1 ... t tbe folloviaa;
- Tbe ,.rcen~ ... of .eU. .. ri •• by trained h •• ltb paT.oaaal i. " (G7.4.1)
- The perceatase of children u..ubized a,ain.t diphtheria, tet~u.t Wboopina COUlh •••• Il.a, poli~_}iti. and tubeTculo.i. i. 95 (Cl~2)
- Local health ura, iDClu4iPl avaUability of at le.et 20 .aaential d~a •• witbin Oft. houri. walk or travel i. 1001 (C7.3)
- The perc.Gt.~e of children up to at le.lt oue year of I,a aivea routine child care by trained h.altb per.ORnel i. 100 (G1.4.2)
- The percentase of prlanant wa.an witb .c l.a.t tbree vieitl for anteDatat care i. 100 (C7.4.1)
- The population arowth rate i. r •• uced co le .. tb ... 11 ·(17)
Year
1984
t981
t982
1982
t984
t98l
Data
•
•
•
+
'"
'"
t4. t
A.ctul Data
Total - 65 y .... r. llate - ... , ... 1. ...
0.4
Diphtheri. 0 Tuberculo.i. 671 llea.1.. tl0 Tetanu. 6 I/hoopin& couSh 0 Polia.,eliti. 0
2.8
Soq,l'C.
of Dat.
13/85
U/8S
13/85
06/85
13/85

P.art IV Pap 29 30 !lec_ 19.5
W!STIU PACIFIC II.BGIOII DaTA _ 011 SOCIOIIXlllOIilC AIID IIEAl.TB IIDlCATOIlS
ladicator(a' for: MALAYSIA
<.) Health policy indicator ••
- Health for .11 bal received 8ndorl-.eat •• policy at the hleb •• t official level (Gl)
- Mechani... for iavo1vina peopl. in the i.,l...otatiOQ of atrate.i •• have b.en fo~4 O~ .t~.natbene4, and are actua11y functiob1n& (e2)
- At l •• at SI of tbe Iro •• national product i •• pent on health (Cl)
- A r ••• aa.bl. percenta •• of national n •• lt~ e¥peaditure i. devoted to pri.ary health care (C4)
- a..ourc •• are eq~it.bl, di.tributed (CS)
- "Defioed acr-ate,i •• for bealth for aU are accompanied by eaplicit resource allocations (G6)
- Defined atrateai •• for bealth for all need external re.ource. (C6)
- The need. fo~ ext_raal ~e.ou~c •• of welt-defined .tratesle. for b •• lth fo~ all are r.caivinl .u.raiaed .upport f~ .are .ffluent countrie. (C6)
- At lea.t 8~ of local tomqunitie. at all levels have well-e.tabliahed voluntary and for.al community or,ani&atioa., Whicb are comaitted to continuou8 priNry health Car. action. pl'0lra.-e8 (1.1)
- tha coaauaity cOQtribut.. in ca.h and in kind to h •• lth or health r.lated action (&2)
- The percentage of population served With •• fe ~ater in the home or within l5 .inure,' walkins distance i. 100 (C7.1.1)
- The percentage of population with adequ.te aanitary facilities in the ha.e or i ... diat. vicinity i. 100 (G7.1.2)
- The adult literacy rata for botb ~D and vo.en exceed, 701 (Cll) (Total/M/F'
- The Iro •• n.tiaoal product per head eaeeed. USSSOO at 1980 .. rket priee. (GI2)
- 'lbe daily 1)er caDita c:alorie availability exceed.. 2~OO (UI
- Tne daily per capita protein availability exceeds 70 gu ... (&4)
Year
1984
198.
1984
1984
1984
1984
1984
1983
1983
1983
1980
1980
1984
(98)
Data Act",,1
Dat.
- 1.56
• 21.9*
- No
... Yel
... Yel
• 100
• Yeo
70.97
7;.4
... Total - 12
+
Kale - U-88 &-76
Feule - U-74 a-;9
uss 1994 or J!$ 46B~
2000 calorie.
Source of Data
13/85
13/8~
13/8~
13/85
13/8~
13/8~
13/8~
13/8~
13/85
13/85
13/8~
13/85
13/85
13185
Motea: The nuaber in pareathe •• a _how the ovaber liven to the indicator in the global indicator liBt {Global StratelY for Healtb For All by tbe Year 2000. WHO, Geneva. 1981 (uRealth (l'or All" Series No.3). paZo, 75-76).
+ lea Source !Io No inforaation/noc available
MA Not available * Appropriation for "iniltry of Health only
13/8;:
OJ{79: 06/85:
Government's Report on Evaluating Progress in Iaple.entins 'he Stc4tegiea for HPA12000. 1985 PAO Production Yearbook 1979 Government l
• Reply to Cumulative totals of Claes and Deaths fro. 18 Sele~ted Di.ea.e8 for tbe Years 1983-84 and up to July 1985
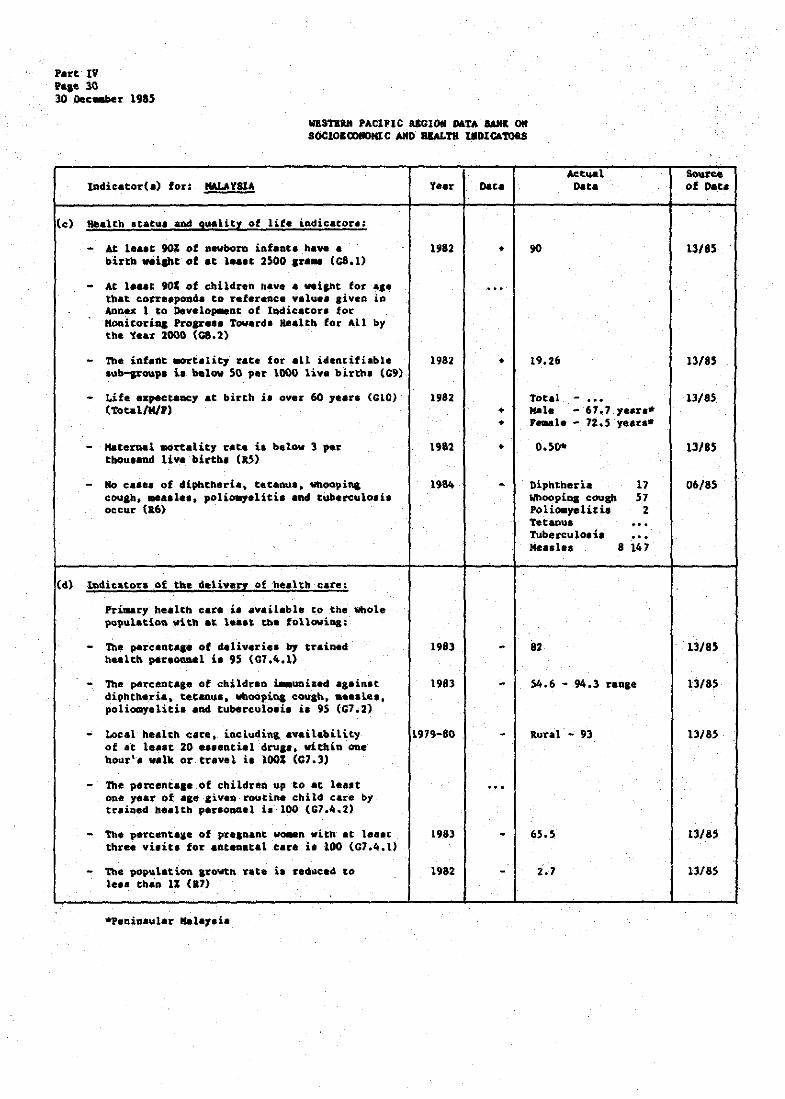
Plrt IV Pale 30 30 l)ec_r 1985
III!SnM I'AClFIC RSGIOti .... TA IANIt 011 SOCIOIODlIOIIlC AND IllALTII UDICOTOiS
ladie.tor(.) for: KALAYS1A
(e) sealen at. Cu. and Quality of life indicator.:
- At le •• t 901 of oevbom infantl bave • birtb weilbt of at 1 •••• 2500 Irl .. (G8.1)
- At l ••• c 901 of children have • veiaht for .,. t~.t eo~ •• p0a4. to reference valu •• liven in ADne~ 1 to Develo,..nt of Indicator. for Monicoriaa Proar ••• roverd_ a.altb for All by tbe Year 2000 (Ga.2)
- The infant .art.lie, rate for all identifiable sub-IF""P. 10 below 50 per 1000 live bi.rths le9)
- Life expectancy at birth i. over 60 ,earl (CIO) (Tota1/M1rl
- Matel'Dal mortal it,. rat. i, below 3 per thou.lnd Ii .. birth. (RS)
- No c •• e. of diphtheria. tet4DUa .. WboOpinc. couab ..... 1 ••• polio.yalici. and tuberculo.i. occur (a6)
(4) -lndicatora of tbe deliv.u of health care:
hillary health care ia .vai.lable too the', whole population _itb ., le.a, tba fol1ovinc:
- The paircanta,. of deUveri •• bJ trained health poc.on.o1 is 95 (C7.4.1)
- The percentase of children Laauaized .1,iR.t diphtheria. te.t&llUI, wboopiq c.ouah ••• ad .•• , poliomyelitis add tuberculo.i. i. 95 (G7.2)
- Loc.l health eire, iocludin& .v.ilability of .-t le.at 20 •••• nti.l clna,a. within OOe hour'. walk or travel i. 1001 (C7.3)
- The p.rcencl •• of children up to .t l ••• t one year of .'.'Iiven routine child care by trained health p.r.oaoel i. 100 (Gl.4.2)
- Th. paTcent.ae of pre,nant wo.en with .t l ••• t three vilit. fol' antenatal ear. ia ,100 (C1.4.U
- The population Irowtn r.te i. r.4~e.4 to Ie.. th.n 1% (&7)
Year
1982
1982
1982
1983
1983
1919-80
19.83
1982
D&t.
•
•
+ • +
90
19.26
""tUil D&t.
Tot.l - ••• Male - 61.7 year.* 'e.ale ~ 72.5 year.-
niphtheria WhoopiQl cough Po lioaye lit ia Tetanua Tuberculo.i. Measlel
82
17 57
2
8 147
54.6 - 94.3 riDge
aural - 93
65.5
2.-7
13/85
13/85
13/85
13/85
06/85
13/85
13/85
13/8'
13/85

Part IV Pap 31 30 Dec_er 198'
WtSTIaft PACIPIC lEGION DATA BAR< OK SOCIOECONOKlC AND IIJW.TH IRDICATOIS
lndicator(.) for: ~
.) Health policy indicators;
Health for all ha. received endor ... ent as policy at the high.at official level (Cl)
Meehani ••• for involving people in the i.pl~nt.tion of atratesiee have been foraed or acransth.Ded. and are actually functioning (C2)
At 1 ••• , " of the aroa. natiOnAL produce ia .pant on .... lcb (e3)
- ~ rea.oaabl. percenta.e of national nealth .xpaDditura i. devoted to primary he.lth care (G4)
Defiaed Itrate,iee for health for all are accoa,.nied by explicit re.ouree allocations (GO)
Defined atrate,i •• for health for all Deed external re.ouree. (G6)
The need. for .xternal resource. of veil-defined aCretesiea for healtb for all are receivin& .uatained .upport from more affluent countries lC6)
At le •• t 80% of local communities at all levels bave vell-eatabliahed voluntary and formal c~unity organic.tion., Which are c~itte~ to continuous primary h •• ltb care action pro&ra-.ea (11)
1he coamunity contribute. in ca.h and in kind to health or health rel.ted action (&2)
tb) SocioecoRoaie indicatora.
~he percentage of pOpulation aeTved vith aafe ~ateT in the home or within 15 .inut.a' wal~ing distance i. 100 (G7.1.1)
the percenta,e of population with adequate sanitary facilities in the bome or i.-ediat. vicinity i. 100 (G7.1.2)
the adult literacy rate for both men and women ~Kce.d. 10% (Gil) (Totall M/ Pl
The atoas national product per head exceed a US$500 at 1980 .. rket pricel (Gl2)
Tbe daily rer (apita calorie availability exceed. 2500 calorl~s (R3)
the daily per capite protein availebility exceeds 70 gr .... (R4)
Year Data Actual
Data Sooree of Data
Note.: The number in parenthese •• how tne n~ber given to the indicator in the global indicator list WHO, Genev •• 1981 ("Healtb For Allu Series
+ 'tea
"" Mo imformation/not available MA Not applicable
SOUTCe 10182: 12/82:
1982 ESCAf population Data Sheet Leaflet on Childhood CD t Report 3/82

tart IV Pale 32 30 DeC_r 1985
Wl8~'RN PACIFIC KEGION D6~A ~l ON IOC1010Dll0IIlC AMD IUW.t11 IlIDlCAtOu
l~ic.tor(.) forI !!y!!
,(e) Bealtn .tatul aDd quality of life iadicator ••
- At l •• ,t 901 of aevborn infantl hIve • birtb "'lbt of .t 1 •••• 2500 Sr ... (Ca.l)
- At 1 •• ,t 90% of children have I weicht for .,e thlt corr"ponda to referencI valu •• aivan in Anaa. 1 to Dey.lo,.eDt of Indicator. tor Hoaitorin& Proar ••• Toward. a.alth fQr All by the V •• r 2000 (GII.2)
- the infant .ore&lity rate for aLl identifi.ble .ub-,roupo i. below 50 per 1000 liv. birth. (G9)
~ Life .xpect.acy at birtb i, over 60 y •• rl (C10) (Tot.1/ HI r)
- Kat_raal ~rt.lit1 rate i. below ) per thou .... d 11..,. birth. (IS)
Year
.
- No e •••• of 4ipbcneria. tetanul, wbOOpiaa coyah. 19S2 •••• 1 ••• ,o1.1.,..U.til aad! tuberculo.i. occur'- (16
1 _
(d) Iadie.cor. of ~ deliverr of -.Iltb clre:
Priaary health care i, evailable to the Whole population with at l ... t tbe follow1oa:
- '!be perc.a.c ... _ of deli..,eri., by trained he.ltb per.oanel i. 95 (G7.4.1)
- The percentaae of children ~uni&.d a,einst diphtl'l.ria. t4c.aau •• woopi..., cou,h ..... le •• polio.,elitil aad tuberculolia i. 9S (C7.2)
• Local health care. includinc availability of at le.te 20 .eleDti.l druaa. within Oft, bour'. walk O~ travel i. 100' (07.3)
- The perceatale of children up to at le •• t one year of a" liven routine ebild care by traiaed bealth per.oanel i, 100 (G1.4.1)
- The pewceota,e of preanant wo.en witb at le •• t tbree vi,ita for antenatal care ia 100 (G7.4.1)
- !be population arowth rate i. reduced to 1 ••• tban 1% (a7)
.
1982
Data
+
Act .... Dat.
_aat •• lllberculolh
o
1 8
Sou,rcI of Dat.
12/82
10/82

WBSTIRM PACIFIC &&GlOM DATA BANl O. SOCIOICOIIOHIC AND Il&Al.m I.DICATORS
lndicator<.) fort. HEW ClJ.lOONlA Year Data
(.) Health policy indieatora:
- Health for all baa received endorsement .a policy at the bigbeat official level (GI)
- Meehani... for involvina people in the L.plementatioD of atrate.ie. have been formed or streagtneaed •• ad are actually functioning (C2)
- At 1 •• lt S' of the aro" natiooal product i •• pent Oil health (e3)
- A r ••• oaabla perceatage of national health expenditure i. devoted to pru..ry he.lth care (C4)
- lesource. are equitably distributed (C5)
- Defined atrat.aiea for health for all are accompanied by eaplicit resource allocationa <Co)
- Defined .trategie. for health for 411 need esternal resource. (G6)
- The needs fOT external fe'Durces of well-defined atrateaie. for health for all are receiving suetained support fro. .ore affluent count~ie. (C6)
- At leaat 80% of local communities at all levels have well-established voluntary and formal community organizationa. which are committed to continuous primary health care action programqea (Rl)
- The co.munity contributes in ca.h and in kind to h.alth or h.alth ralatad action (a2)
(b) Socioeconomic indicator.;
- The percentage of population served with safe W8~er in the hoae or within IS .iDutes l walking distance i. 100 (G7.1.11
- The percentage of population with adequate sanitary facilitiea in the home or ia.ediate vicinity i. 100 (G7.1.2)
- The adult literacy rate for both ~n and women exc.ed. 70% (Gil) (Total/H/F)
- Tbe gro •• domeatic product per head exceed. USS500 at 1980 market prices (G12)
The daily per capita calorie availability exceeda 2500 c.lori.. (131
The daily per capita protein availability exceeds 70 e .... (a41
1983 +
1983 •
1983 •
1983 +
1983 •
1983 •
1983
1983 +
198) +
...
...
Part IV l'qe JJ JO 0IIc ..... 'r 1i-85
Ye.
Y ••
20.6
Y ••
Ye.
Actual Dat.
100 (ellt.)
Total -92 Hale - 93 Female - 91
US$ 5 )79 or CFP 914 453
Source of Data
13/85
13/85
13/85
13/85
13/85
13/85
13/85
12/85
Notea: The nuaber in parentheaes show the nuaber liven to th~ indicator in the global indicator list (Global Str'au'3 for llealth Por All by the Year 2000. WHO. Geneva. 1981 (tiHealth Por AlllI Series No.3), pa... -76).
+ Yea No No info~tion/not available
NA Not applicable
Source 13/85: Government's Report 00 Evaluating Progress in Implementing the Strategies for HFA/2000, 1985
12/85: Country Health Inforaation Profile (CHIP) revised by Dr Petriosky (WHO Consultant). 1985

P.~t tV pqe 34 30 o.,,.be~ 1985
IIBIITIU PACIFIC UCIOll OAT ... _~ 011 SOClOIClI.oHlC AJlD 1IIW.'IIl IlIDICAJOas
Indic.tor(.) for, HIIII CALI_U
(c) He.l~h .tatv. aad quality of life iadic.to~.:
- At l ... t 90% of nevbom intl"t. ba.,. • birth .. isht of at le ... 2500 Ir- (CI.I)
- At l ••• t 901 of child~a. bAye • weiCht for I,e that corre.pond. to referente valu •• ,ivea in Annex 1 to Develo,..nt of Indicator. for Monito~iUl Pro,rel. Toward. H.alth for All by the t ••• 1000 (Ga.2)
- The infaat .ortllit1 rate for all identifiable IUb-.. OUp. 10 below SO per 1000 live birth. (G9)
- Life eKpectlney at birth i. over 60 y •• r. <CIO) (Total/ll/r)
- Katemal .ortality rate i. below 3 per thou.aad live birth. (Ij)
No c •••• of dipbtheria, tet.nul, whooping cou,h ..... 1 ••• pOlia.,alitia ADd t~.rculo.i. occur (1.6)
(ell, lAALe.tor. of tbe deliv.? of b •• lcb ure:
Pri .. ry health eIre i. Ivailabl. to the whole populatioQ vieh at 1 ... , tne followi .. ~
- The percent ... of 4Iliveri •• by trained health per.oDDo\ i. 95 (e7.4.1)
- The percenta,_ of cbildren ia.uni •• d .. ainee diphtheri., tetlAu., vboopina COUlb, .e •• le., polio.yeliti •• Dd tUbereuloai. i. 9S (C7e2)
- Local b.altb care, includina availability of at l ••• t 20 •••• atial dorvl', within one hour'. wolk or tr.vel i. 100% (e7.3)
- 'lb. p.rcelltase of chi ldreft up to at l •• u oa.. ''''£' 0-£ 'Ie ,iveD routiae cbild. car. by tr.ined health per.onnel i. lao (C7.4.2)
- The percent ••• of pr.an.ftt vo.ea with at l ••• t tbre. vi. it. for anten.t.l c.re i. 100 (C7.4.1)
- 'ftIe population poovtb r.te ia Ndtolc." to 1... than \1 (17)
• 6 year, old
V.ar o.ta
1984 +
1982 •
1976
1984 +
1984
1983 •
1983 +
1983 •
1983 +
1983
actual Data
92.8 ( .... )
21.9
- ..... Total Hale - 60.8 yr. , ... le - 66.8 yra
1.6
Tet.nu. lIboopina coush tuINrculo.t.a .... al ••
98*
100
100
100
1.3
3 9
111 79
Source of 0. ••
11/85
..
13/85
13/85
12/85
13185
13/85
UIBS
Il/U
U185
.
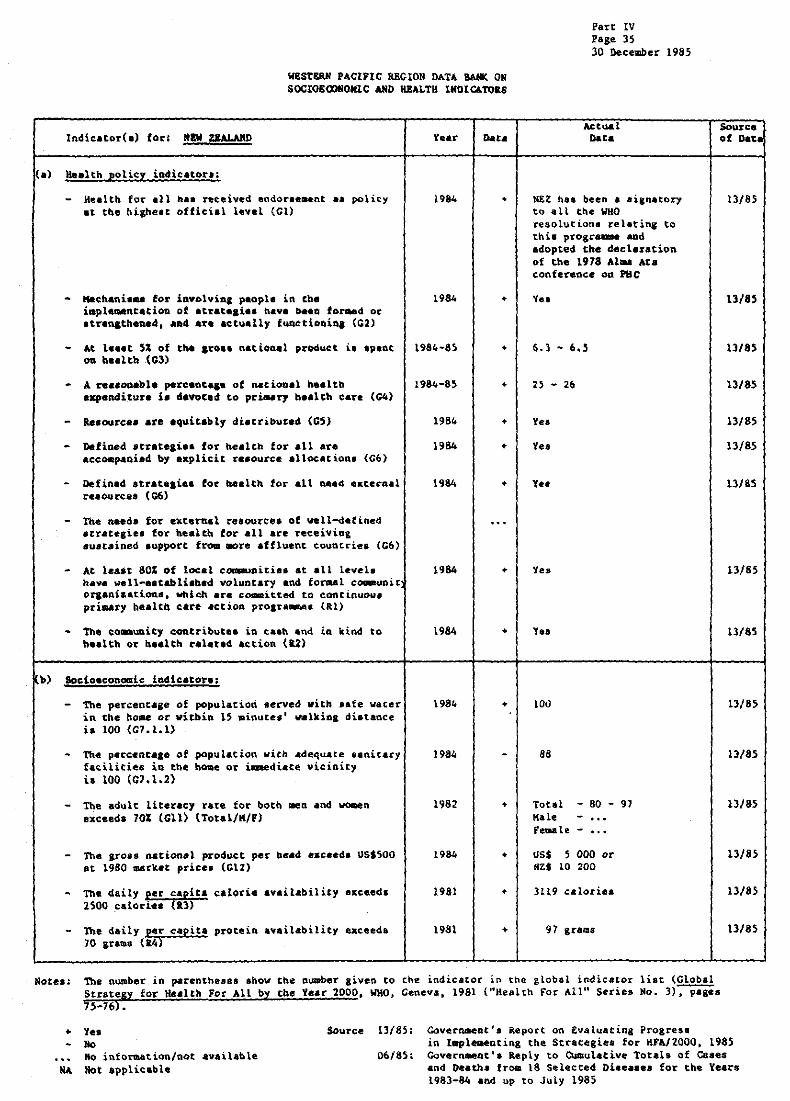
.
\l8ST£IlII PACIFtC III!CrON DATA IWIK ON SOCIOIOOllOIllC AJlI> lIl!ALTH lKOlCUOIlS
Part tV Page 3S 30 December 1985
Indic •• or(o) for, MIN ZIALAftD 'lear Dot. Actual o..t.
Source of Dat.
a> a.alth policy iadie.tora:
- Health fot' .11 ha. reteived endor .... nt •• policy at th~ highelt official t.vel (el)
- M*chani ... for involvin, people in tbe impleGencation of atrat •• ia. have ~Q fo~d or .tranctheae4. ADd are .~tu.lly funetioDiaa (el)
- At I ••• t S% of tht .~o •• national produ~t i •• peat "" hoalth (03)
- A rea,on.bt. perc.ata,. of RCtiooal health expenditure i. devoted to pr~ry health care (04)
- Ie.aurea. are equitably diatribute4 (GS)
- Defined steateaia. for health for .11 are aceo.panied by eKplicit r •• ouree allocations (G6)
- Defined atrat •• ie. for health for all a •• d external I:'eaou«el (C6)
- the need. for ext.mel relource. of ~ll-d.flfted ,trateaie. for health for all are reeeiviuc sustained aupport fro. ~re .ffluent eouatrie. (G6)
- At leA.t 80% of local comaupi~i •• at all level. have wel1-•• tabli.bed voluntary and fOr.4l com.unit oraania.tiona. which .~. co.mitted to continuov. primAry healtb c.r~ action pro,~a.me. (Rl)
- The co .. unity contribute. in ca.h and iQ kind to h •• lth or h •• lth tel.tld &¢tion (Il)
b) Socioeconomic ladle.tora:
- The percentase of population served with lafe water in the ho.e or witbin IS .inute. ' valkina dietanee i. 100 (G7.1.1)
- The perceDtA&e of population wiCh adequate 5anicary faciiities in the bome or tm.ediate vicinity i. 100 (C7.1.2)
- The adult literacy rate for both mea and wo.en exceeds 701 (Gil) (Total/K/F)
- The ,roas national prod~et per be.d exceeds US$SOO at 1980 .acket price. (e12)
~ The daily per capita ~alorie .vailability exceed I 2S00 calorie. tal)
- The daily per capita protein availability ~eee4. 70 gra ... (14)
1984
1984
1984-8S
1984-8~
1984
1984
1984
1984
1984
198~
1982
1984
1981
1981
•
•
•
•
• •
•
•
•
•
•
K&l ha. been a .ign.tory to .all the WHO resolution. relating to this programme and adopted the declaration of tbe 1978 Alma At. confer.nee 00 PHC
Y ..
6.3 - 6.5
25 - 26
Ye.
Yes
Ye.
Y ••
100
88
total Kale
- SO - 97
Fetaale: -
US$ 5 000 or HZ$ 10 200
1119 cclotiea
91 grams
Note.: !be number in parenthesel ahow tne aumber liven to the indicator in the global indicator list (Global Strategy £01' Health For All by the Year 2000, WHO, Geneva, 1981 ("HeaLth For All" Series Ho. 3)~s 75-76) •
.. 'iee Source L3/85. Government', Report on Evaluating Progress
13/85
13185
13/85
13/8~
13/85
13185
13/85
13/85
13/85
13/85
13/85
13/85
13/85
13/85
13/85
No No inforaation/not available
M4 Hot applicoble
in Ieple.eoting the Strategies for KFAl2000. 1985 06/85; Covern~Qt·. Reply to Owgulative Totel. of Caaes
and &eath~ fro. 18 selected Diee •• ea for the Years 1983-84 and up to July 1985

'art tV 'a,. 36 )0 Ga ...... 1985
WESYlaN PACI'IC RECION D6TA IAM& ON SOCIOBCOIIOIIlC AIID II£4LTII IIDlCAtoalI
(e) Health It_lu. and quality -of life ind~c.tor.:
- At lea.t 90% of ~ MWbOrn iohnc, n." • .a birth ... i&ht of ·.t 1 .... 2Soo Cr- (c:8.11
- At l •• ,t 901 of cbildten have • veiaht toe 8,_ that corr •• pooda to ref.rence value. civen in ADne. 1 to Devalopaent of Indicator. fo~ Konitoriac ~ar." Towarda Kaaltb for All by tho Y •• r 2000 (C8.2)
- The infant ~rtality cat. for ~11 ideatifiable aub-aroup, i. below SO p.r 1000 live birth. (C9)
- Life expectancy at bi~tb i. over 60 y.ar. (CIO) (Tota1!M!t)
- Materoel mortality rat. i. beloV l-per thous.nd live birtkl (IS)
- No c •••• of dipbtbecia. tet.nut. Vhoopinl couab ..... 1 •• 1' polioayelitia and tubelt'Cul,oaia oc.ur(lt6)
(d) Indicat,ctr. of the delivery- of b •• 1Cb eara,
Priaary health e&re i. available to the ~ole population with at t •• ,t-the fol1oviD&;
-
- The percent ace of deUverii,. by t-raiail<f heolth perlOQllel i. 95 (C7.4 .1)
- The percentlse of ~hildren i .. uni.ed I,ainat diphtheri., tet.nuI, wftoopin& couCh» .... le •• poliomyelitis &ad tubercu}o.i. i. 95 (Cl.2)
- Loc,l nealth care, incluGin& ,vailability of- .e 1 ... , 20 ••• ential druC., within CAe hour'. "elk 0< ... vel i. 1001 (G7 •. )
- The percentale of children up ~o at 1 ••• t one y.ar of _Ie liveu routine. child ear._01 trained h •• ltb perlonDel i. 100 (C7.4.2)
- The percent4ae of prelnant wo.eft with at le.at three via ita for ~t.D.t.l c.~. i. 100 (07.4.1)
- The 'POpulAtion arowtn race i. reduced to 1 ••• tkan l' (R7)
Year DUa
i
1982 •
1982 •
1983 •
1983 •
1983 •
1984
1984 •
1983
1984 •
1984 •
1983 -1984
94.8
90
lZ.S4
Actual Gat.
Total - _ •• Hate - 70.8 yr. Female - 76.9 yrs
Qiplttheti. Wnoopi"" ~ouab Polieayc1ici. Tet.ftUt: Tube rc.ulol il "e •• lei
99+
2 ... ... 7
404
71.33 - 73.68 ,a".
100
100
99-
1.1
.
Source ot oat.
U/85
U/8S
13/8S
13/85
13185
06/85
13/85
13/85
13/8S
13/85
13!85
U/S5
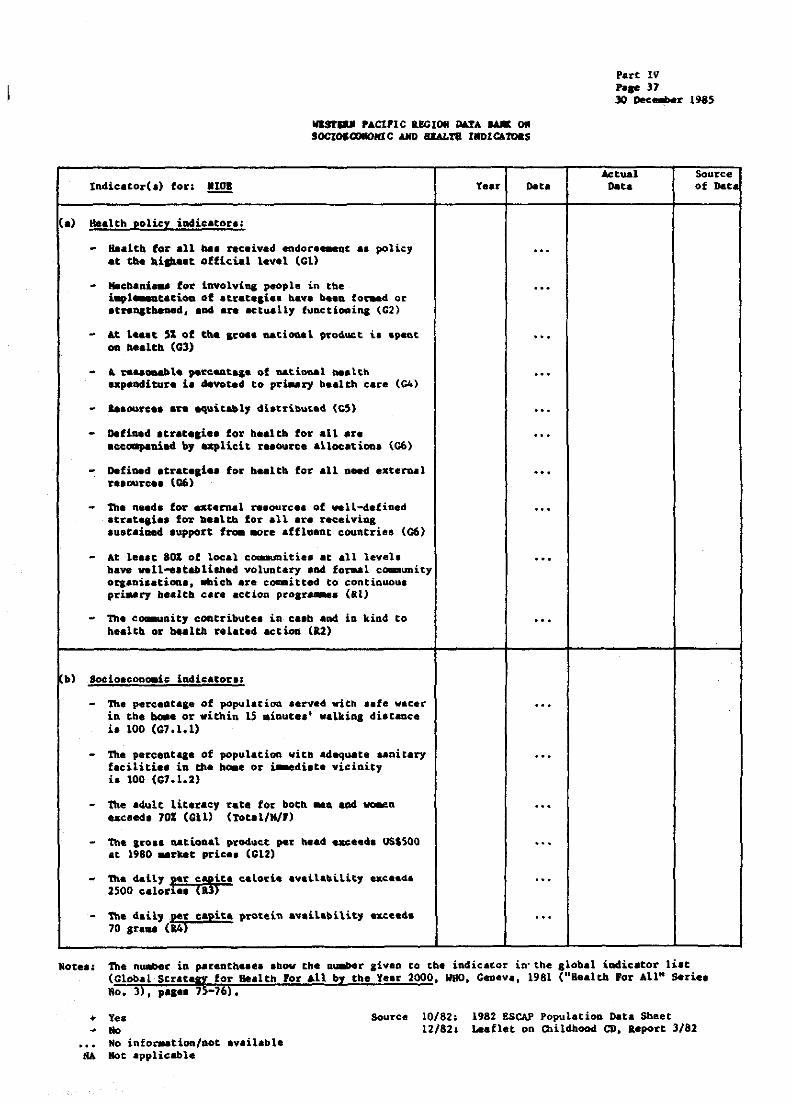
Part IV hac 31 JO Dec_ UIIS
(a) Health policy indicator.:
IIISfIlllll PACIFIC UGIOli DArA ... 011 SOCIOlQlllOI(IC AND 1IL\L'nI IllDlCATOIIS
- a.eltb for all bal received en4orl-.eac •• policy at tbo biSO ••• Dffi~ial lovol (Gl)
- "-cbloi ... for involvina people in tbe i.,l...atatioa of .t~.t.&i.. bay. b... fo~ or atHl\Itbe ... d. aDd Ire Ictull, t\lllcti~ina (C2)
- At 1 ... ~ 51 ot the .co.. Q&tioaa\ p~o4uct ia apeat OIl ho.ltb (03)
- A. Ho&aOD&b1.. pe~e.'Q.t. .... of 'U.tiiM\Al ..,..ltb up.Ddltur. i, devoted to p-riul")' h.alth care (G4)
- laaOQrc •• are ~itab17 di.tribu~.d (GS)
- Defined etrate.i •• tor h •• ltb for all .r. accoa,aDiad bJ explicit .o.~rco allocation. (G6)
- Defined I'tlte.i •• for bealth for all o .. d external ""'OU'r'C" (06)
- the n .. d, for esc.~l relourc •• of .. U-d.efined acraee,ie. for ••• 1Cb for all Ire receivio& .ust_ioed lupport fro. .ore .ffluent countries (C6)
- At le •• c 801 of local coamuniti •• at all level. bave vell-eltablhbed voluntary 1M fo-caal c.oaaunity or,&8ai&ation •• Whicb are committed to continuoul pri .. ry b •• ltb c.1C'e actioa prolr ___ (a1)
- The co..unity contribute. in ca.b aad in kind to b.alth Dr boalth .elo.ed ~.ioa (12)
- Th. perceota,e of population .er~.d with •• fe vlcer ia tbe boa. or _ithin 15 ainut.,' valkina diltaace ia 100 (07.1.ll
- The perceat .. e of population with adequate .. oitary faciliti •• in the ba.e or ~di.t. vicinity ia 100 (67.1.2)
- the adult literaey rate fot' both. MOo aQCl VQM.O
oxcoed. 70% (Clll (Total/K/fl
- The Iro.. aatLoA.t p~04~ct per bead cxc •• 4. USSSQO at 1980 .. rket price. (el2)
- 1h. dally yet' capita caLorie .vail&bilit, exce.de 2500 calof1.' tal)
- the 4ail, .per capita fretein av.ilability ~e.4. 70 gra .. (14)
Ac~ual
0. •• Source of Data
Mote.: the nwaber io par.ath •• e. .bow the Qu.ber liven to the indicator in' the alobal iadic.tor lilt (Gl~l'Str.t.H for Health For .11 by the Year 2000. WHO. Ceoev. , 1981 (Ua.alth .or AU" Se:rie. 80. 3), po.o. 7 -76).
+ Yel 110 No info~tiOft/Dot available
KA Hot applicable
Source 10/82, 12/82.
1982 ESCAP Population Data Sheet Loaflet on (hildhood CD, Report 3/82

'as't tV P ... 38 30 Dec.b.. 19U
OIIISTlIIIIf PACIFIC REGION DATA lANK ON SOCIOKOONO~C AND HBALTH INDICATORs
.
lndie.tor(s) for: ~
(c) Health status aad quality of life indic.to~.~
- At leaat 90% of newborn infant. have • birth veiabt of at l •• at 2500 ar ... (ca.l)
- At lea.t 90% of children have a weight for 4ie thet eorre.pond. to refer6nce value. aiven in Anne~ I to Development of Indicator. tor Konitorinl .roare •• Toward, Health for AIL by the Ye.r 2000 (CB.2)
- The infant .ortality rate tor all identifiable sub-group' i. below 50 per 1000 live birtn. (C9)
- Life expectancy at birth is over 60 year. (CIO) (Total/M/F)
- Haternal mortality rate it below J per thou.end live birth. (as)
Year
- "0 c •••• of diphtheria, tetanu., whoopinl Couah, 1982 mea. lea. poliomyeliti. and tuberculo.i. occu~ ('6
(d) lndicatora of the delivery of h.alth care: .
Primary health care i. available to tbe Whole population witb at leaat tbe followina:
- The percentag. of deLiveries by trained bealth peraonnel i. 95 (G7.4.l)
- the percentaae of children immuni&ed a,ain't diphtherial tetaau" whooping coulhl mea.l~ ••
. poliomJeliti. and tuberculo.i. is 9S <C1.2)
- Local health ~are. including availability of at least 20 easential dru,a. within one hour'. ~alk or travel ia 100% (Cl.)
- The percenta,e of children up to at le •• t one y~ar of .,~ given routine child care by trained health pertonnel ia LOO (Cl.4.2)
- the perc encase of pregnane vom~n with at 1 ••• t three vi.ita for antenatal care is 100 (C7.4.1)
- The population growth rate i. reduced to less th4n 1% (R7)
* Int:::OCIplete
1962
Dau
•
Actual Det.
Tubereu.lo. is
-J.I
2*
Source of De"
12{82
10/82
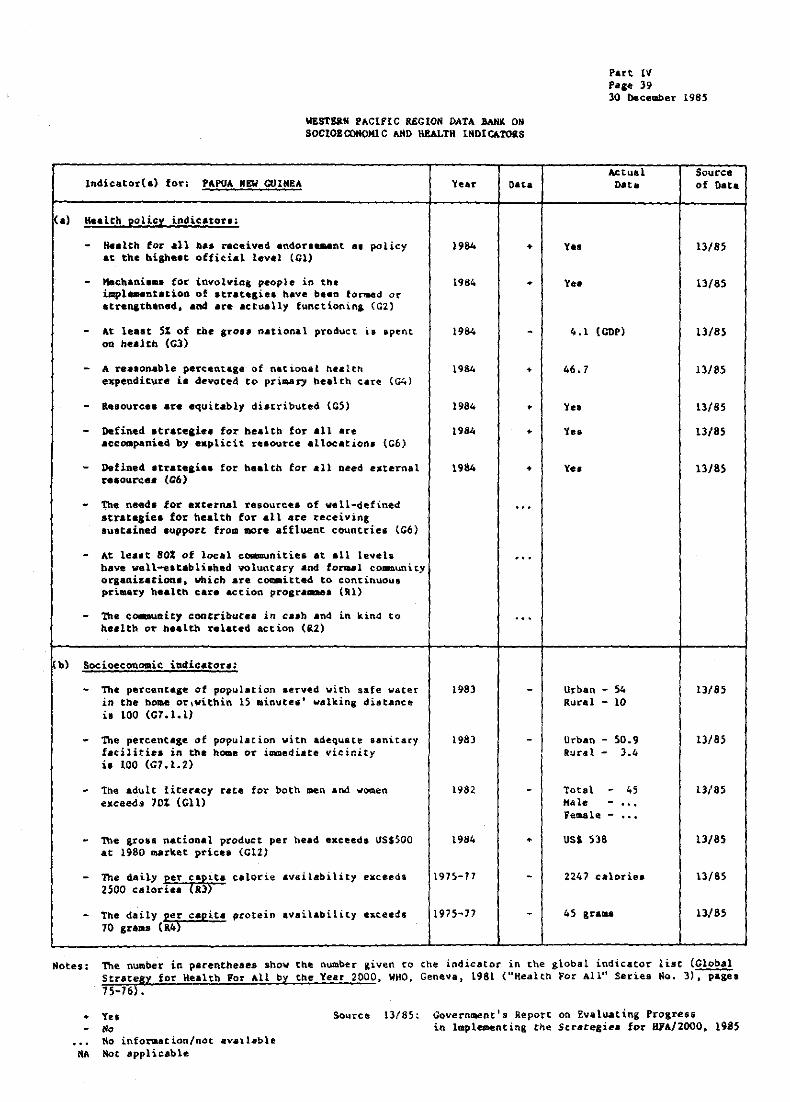
WESTBaN PACIfIC REGION DATA BANK ON SOCIOlOOll(lMl C AND lIULTH INOI CATOKS
lndicator(s) for. PAPUA NEW GUINEA Year Data
(.) Kealth policy indic:atora.
- Health for &11 h •• received endor.e.ent ., policy at the bighe.t offi~i.l level (01)
- Mechani ••• for involvia& people in the iapl ... Dtation of atrat.lie. have b •• n fo~d or ttrenathaned. and ara actually fURctionin, (GZ)
- At leaat 51 of the Iro,' national prod~ct i. apent on healtb (C3)
- A rea.anable p.rc~nt.le of national health expenditure i. deVoted to priaary health care (G4)
- Resource. are equitably distributed (CS)
- Defined ,treeelie, for health for all are accompanied by .a~lieit r.,ouree .llocation. (Cb)
- Defiaed atrateai •• for h •• ltn for all Deed e.ternal re.ourc:e. (C6)
- The need. for external resou~ce. of ~.ll-defined 8trateaie. for heatth for .11 are reeeivins austained lupport from more affluent eount~iea (G6)
- At leaat 80% of local communiti~a at all levell bave well-eatabli.hed voluntary and fo~l co.-unity organization., which are eom.itted to eontinuou. primary h •• lth care accion progr .... e. (Al)
- The eo.munity contribute. in ca.b an4 in kind to h •• lth or health related action (R2)
(b) Soeioeconoaic indicator.:
- The percenca,e of population aerved with aafe water in the boae or,vithin 15 minute.' walking distance i. 100 (G7.1.1)
- The pereenta,e of population vith adeq~ate aanitary facilities in the home or immediate vicinity i. 100 (G7.1.2)
- The adult literacy rate fOT both men and women exeeed. 101 (GIl)
- The &rosa national product per head exceeds USSSOO at 1980 market price. (ClI)
- The daily per capita calorie availability e~ceeds 2500 calorie. (2l>
- The daily per c.pita protein Availability e~ceeda 10 gra ... (&4)
1984 +
1984 •
1984
1984 •
1984 • 1984 •
1984 •
198)
1983
1982
1984 •
1975-77
1975-)]
Part IV Pal' H 30 beceqber 1985
Y ••
Yeo
Actual Inota
4.1 (COP)
46.7
Yes
Yes
Urban - 54 Rural - 10
Urban - SO.9 lura 1 - 3.4
Total - 45 Hale -'" Femah -
us. 538
224? calories
45 gralU
Source of Data
13/85
13185
13/8S
13/85
13185
13/85
lJ/8S
13/85
13/85
13/85
13/8S
U/8S
13/85
Notes: The number in parentheses sho~ t~e number given co che indicator in the global indicator list (Clobal Ser.tev for H.e.lth Fot All by the Year 2000. WHO. Genev., L981 ("Health For All"' Series Mo. 3)~. 7S-76) •
• Ye, No Ho inforaation/not availaple
NA Noe applicab1.e
SOuree 13/85: Government's Report on Evaluating Progres5 in ImpleDenting the Strareai~. for BlA/2000. 1985

'.1'1: IY Pa.o 40 30 o.&_~ 19&5
WZ81&RN PACIFIC RlGIOH GLTA &AMI OM SOCIOIOOHOKIC AHD IlULTH IIlDlCA'rOlS
Iadio.tor(.) for. PAPUA HEW.GUIHlA
c) Rt.lth .t.cu. and gu.lity of life indicatoT':
. - At 1 ••• t 90: of newborn. infant. 1'\.." •• birtn weiaht of at le •• t 2S00 Iram. (GB.l)
- A~ l ••• t 90: of cbi14~en have a ~ei.bt for .&~ th.t corr •• poada to reference value. aiven in Annex 1 to Developaent of Indicator. for Monitorin8 Procre •• Tov.rd. Health fo~ All by tho Y ••• ZODO (G8.Z)
; - The infant .o~t.Lity ~.te for all identifi,ble .ub-,rou,. i. ~.10¥ SO per 1000 li.o birth. (C9)
- Life expect.ncy .t birth i. over 60 yeer. (ClO) (rot'lfM/")
i - te.tern.l IIOft.lity rat. La belo.., 3 per thouaand live birth. (a5)
- No C'I •• of diphtblzia, tet.nul. whooping COUCh, .... 1.-•• p4liOlly.liti. and tlda.r~u.lo .. i. oceur (R6)
(4) In4icator. of tn. delivery of health care;
Pri.ary health care i. av.ilable to the whole popul.tion wit~ at ie.lt the following:
- the pe~c.nt.'. of delivetie. by trained ~ •• ltb per.onuel i. 95 (07.4.1)
- the parcanta,e of children iDluniced a,_inn diphthe~i •• t.taau •• whooping cOUah, .e •• le8, polio.yeliti. and tuberculo,is i. 9) (C7.2)
- Local bealtn care. including .v.ila~ilit1 of at l ••• t 20 ••• entiat druSI, vi thin one ·bou~·. ~lk or tr.~el i. 100% (G7.l)
- The pereentage of chi~dren up to at le •• c one year of ase liven toutine child care by t~aine4 kealth per.onnel i. 100% (07.4.2)
- The pe~ceQt.,e of pregnant women with at le •• t three vilie. for eDtenat.l eare i. 100 (G7.4.1)
~ The population growth rate i. reduced to Ie .. tban 11 (lI.7)
.Incidence rat. of cbildreD 1-5 year. **t-5 year.
Year Oat,
1979
1982
, 1981 -1981 -
-
... 1983 -
1983
1983
1984
1981
1983
1980
75.0
n
Urb.n:
aural;
Actual Dat.
H - 61
" - 6t
" - ~3 r - 54
,. •• rl , •• 1'.
y •• r. ,. •• ra
Wboopina c.ouSh 2656 Tetanua 39 PO'l iOUloye lit ie S He.slel to 023 Tube"u1.oli. 6208
33.5
4ft - 61 r.n.ge
93
$4.2
2.3
13/85
13/85
13/85
Utas
13/85
13/85
13t85
13/85
13185
U/85
13/85

WEST!RN PACIFIC REGION DATA ~ ON SOCIOICDIIOMIC AND ItIW.TH INDICATORS
Indicator(s) for: PRILIPPIHES
a) l\ealth policy indicatot".~
- Keelcn for all nal r.c~ived .ndor .... nt •• policy at Che hiene.t official level (ell
- "-chani ••• for involvina people in the implementation of Itrsteaiee have been fo~d or Itrengthened •• n~ .~e actually tunctioain& (C2)
At 1e •• t S% of the aro •• national product i. spent on neal th (G3)
A reasonable percentage of national nea1en expenditure i. devoted to pri .. ry health c~re (C4)
Resources are equitably distributed (CS)
Defined Itrategie. for health for all are accompanied by explicit resource allocations (Co)
Defined atrategiea for health for .11 need external resourc.es (G6)
- Tfte need. for external reaouree. of well-defined strategies for b.atth for all are receiving aUlteine4 support fro. more affluent countries (C6)
- At least 80% of local comaunitiea at all levels have well-established voluntary and formal community oraaai •• tiona, which are ca.mittad to continuous pri~ry n •• lth cara action prOltamme. (Rl)
- The co~unity contributea in ca.n .nd in kind to health or health related action (R2)
b) Socioeconomic indicators:
- The percentage of population served with .afe water in the hoae or within IS .inute.' walking distance i. 100 (G7.1.\)
~ The percentage of population with adequate sanitary faeilitie8 in the home or immediate vicinity i. 100 (G7.1.2)
- The adult literacy rate for both men and wo~n exceed. 70% (Gil) (Total/K/f)
The gro •• national product per head exceeds US$SOQ at 1980 market prices (G12)
The deity per capita calorie .vailabllity ekceed, 2jOO caloties (al)
Tne daily per capita protein availability exceeds 70 gra ... (R4)
Year
1964
1984
1985
198,
1981.
1984
1984
1984
1985
1985
1962
lIay 1965
1981
1981
Data
+
+
•
+
•
•
+
•
•
+
Part IV P.ce 41 30 Dec:ee.er 19a~
Actual Data
Ye.
Ye.
74
22
&4.5
56.5
Total lIale
- 90 - ... FellJale -
us£: 556 or 110 072
2&37 calories
67.7 grams
Source of Data
13/85
1)/85
13/85
13/8;
13/85
13/85
13/85
13165
13/ S;
13/85
13/85
13/65
13/65
13/85
Note$: The number in parentheaea 6how the nu~er siven to the indicator in the global indicator list (Ctobal Strategy for Health For AU by the Year 2000, WHO. Genev.a. liJ,al ("Health for AU tf Seriee No.3), pag •• 15-76).
+ Yes No ~o informacion/not available
HA Mor appl ie.bIe
Source 13/85: Government's Report on Evaluating Progress in Implementing the Strategits for R1A/2000. 1985
06/85: Government'. Reply to Cumulative Totals of Cases and Death' fro. 18 Selected Disease. for the Years 1983-84 and up co July 198>
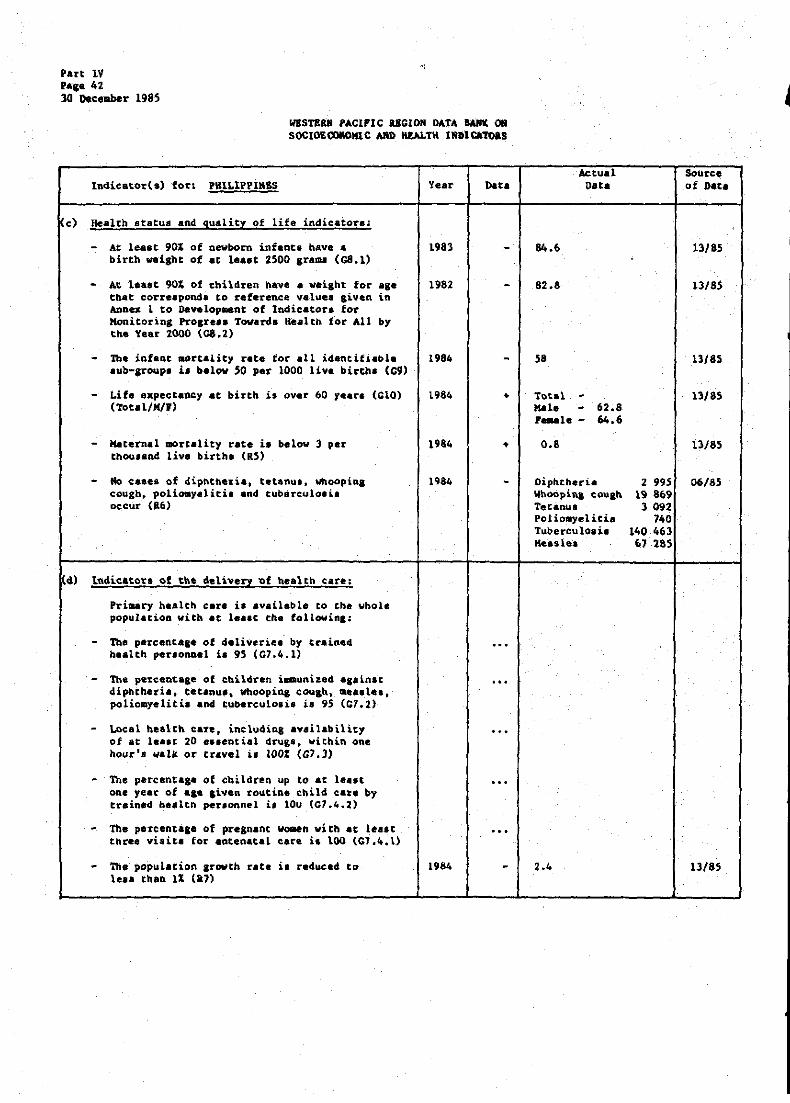
PAn tV 'a,e 42 30 oecember 1985
"
WBSTE&8 rACIFIC RlGIOM OATA BANK OR SOClOECIlIIOItlC AHD IIUl.TII 11l1l1CATOIS
Indieator(s) fort PlllLIPPIMIS
e) Health status .nd gualitl of life indicators.
- At least 90% of newborn infants have & birth wei.ght of .t le.ot 2500 grama (GB.I)
- At lealt 90% of children have a weight for age t~at corr.sponds to reference value. &iven in ADnex 1 to Develop .. nt of Indicator. for Monitoring Pr0lre,. Tovard. Health. f·ol' AU by the Year 2000 (ea.2)
- The infant .oreality rate for all idantifiabla aub-,roup. i. below SO pet 1000 live births (G9J
- Life expectancy at birth i. over 60 ye.~s (ClO) (Total/HIP)
- "-ternal mortality rate i. below 3 per thou, and live births (RS)
- No e •• e& of dipntneEia, tetanuI, whooplal coughJ polioayelitis and tuberculosis occur· (16)
el) Indicator a of the delivery "'Of h..ealtn Care;
Priaary h •• lth cere il available to the whol. popu14lt10a with at 1 ••• e the followinl.
- The percentaae of deliverie. by trained health por.o"".l 10 95 (G7.4.1l
- The percentaae of cbildren immunized •• ainlt diphtheria. tet.nul, Whoopina cau,h, Ge •• l •• , po!iomyeliti. and tubereulo.i. h 9S (C7.2)
- Local health care J in~lu4in8 av.ilability of at least 20 e.sential drugs, within one hour'. wal& or tfavel i. 100% (G1.l)
- The percentase of cbildren up to at le •• t ORe year of a.e liven routine child care by treined he.ltn per.onnel i, lOu (01.4.2)
- The p.rcentaae of pregnant woaen with at le •• t three vi. its for antenatal care i. 100 {Cl.4.1)
- The population arowth rate i. reduced to le •• thaft 11 (&7)
'tear n. ..
1983 -
1982 -
1984 -1984 •
1984 •
1984 -
1984
Actual Source Data of nata
84.6 13/85
82.8 13/8S
58 13/8:1
Total - 13/85 lI.do - 62.8 , ... le - 64.6
0.8 13/85
Diphtheri41 2 995 06/85 Wht>Opin& couah. 111 8bll Tetanul 3 092 Polio.yelitia 740 Tuberculo.is 140 463 Me.a$le. 67285
13(85

•• w-. b ..
WESTB&II PACIFIC !\!GION IlI.TA IWIIC O~ SOCIOSOOIlOHIC ANO ii£Al.TH I.OlCA~S
Y ... 11&<.
Part IV Page 43· 30 December 1985
atuel
(a) Health policy indicator.:
- Health for all naB received endor.~nC al policy at tne hilhest official l.evel (Cl)
- Hecbani ••• for involvins people in the iaplem.ntatioQ of .t~.t.li •• have b •• n formed or atraasch.ned, and ara ~tu.lly f~nctionina (e2)
At l ••• t 51 of the Iro., natioRAI product i. .pent on hoolth (G3)
- A reAsonable percenta •• of national he.Lth expenditure i. da~ot.d to priaary h •• lth care (C4)
- Reaourca. are equitably 4i.tributa4 (G5)
Defined Itrateaie. for health for .11 are acco.paaied by explicit resource allocations lG6)
Defined .t~.t.&i •• tor bealth for ,11 need external resource. (G6)
- The needs for .xter~.l reaources of veIl-defined atrate,iel for health for atl are receivina tbe sustained aupport froa .ore affluent countries (G~)
- At le.st 801 of Local co..unitiea at all level. have vell-eatabli.bed voluntary &n4 fo~l com-unity organizationa, which are coaaitted to continuoua primary health care action prosramaes (Rl)
- The comaunity contributes in ca.h and in kind to nealth or health related action (82)
(b) Socioecona.i~ indicatorl.
- The percentage of population aerved with •• te water in the ba.e or within is .inutea' walking distance i. 100 (G7.1.1)
- The percentage of population with adequate sanitary facilitiea in tbe home or immediate vicinity is lOa (G7.lo2l>
- The .4ult literacy rate tor botn Den and women • xee~d. 701 (Gil) (Total/K/Y)
The grOB& national product per bead exceedl USSSOO at 1980 market price. (G12)
The daily per capita calorie availability exceeds 2S00 calories (a3)
- ihe daily per cae ita protein availability eKCeeda 70 & ..... (R4)
198) +
198) •
1983
1984 •
1984
1984 +
1984 +
198. +
1984 •
1984 •
1983
1979 +
1983 •
1982 +
1982 +
Yes
Y ..
3
6.3
No
Y ..
Ye.
Ye.
Y ..
Ye.
83
Total - ... Mal. - 96 Female - SO
US, 1880
2588 calories
78. J ,,,atld
13/85
13/85
13/85
13185
13/85
13/85
13/85
13/85
13/85
1)185
13/85
1)/85
13/85
13/85
13/85
Notes: The number in parentheses ahow the number given to the indicator in the globat indicators list (Global Strategy for Keetch for All by the Year 200Q. WHO, Geneva, 1981 ("Health for All" Series Mo. 3), pea.s 75-76).
+ Yea No No information/not available
NA Not applicable
Source IlJ8~: Government's Report on Evaluating Progress in Implementin& the Strategies for KFA/2000, 1985
06/84. lnformation furniShed by the Hinistry of Affairs. Republic of Korea, 25 September 1984
06/8S; Governmenc's Reply co Cumulative Totals of Cases and Deaths frog 18 selected Di8ea.es for tbe Years 1983-84 and up to J~ly 198$
12/82.2! Covernment's Reply to EPt Kealth Info~tion Syatem Questionnaire, 1982
12/83: CHIP reviled by Covernment, 1983

P,rt IV P.,. 44 )0 Dec .. ber I ~a)
11&$,",&11 PI'Clrt¢ . .w~"r" ..... c 011 SOCIOIOOIIOIIlC AltO !llW.TII IIlDlCA'I01S
lndicotor(.) for: REPUBLIC Of lORIA
(c) Health at,tu, .nd quality of life indic.to~ ••
- At lea.t 90% of newborn fat.nu 1\," • birtb weiabt of ,t 1 •• 't 2500 Ir ... (C8.1)
- At le.lt 901 Ot enildren hllve • vei&h-t tor .,. tbat corre.pond. to reference v.\uel ai~en in Annex 1 to Develop .. nt of Indic.tor. for Honitoriaa Proar ••• Toward. Health for All by the Year 2000 (C8.2)
- The infant mort.lity rat. for all ide~titi.ble • u.b-gTOUp' i. below SO pel' 1000 live bi.rth. (C1)
- Lif. expect.ncy at birth il ove, 60 teart (GIG) (Toool/KI.)
- Kat.cnal .ort.lity ~.t. i. b.low 3 p.r thou •• nd live b •• th. (as)
- No c •••• of diphtberia, tet'Qu,. WftOOpinc .... le •• polio.r.1iti •• nd tubercdl~il occur (R6)
(d) Indieator. of the delivd'Y of h •• ltb care;
Primary nealth care i. ayailable to the Whole pop~latioa with at la.at tne follDWiDl~
- The percentase of deliverie. by train.d h •• lob per.oDD.1 i. 95 (G7.4.1)
- The pereenta,. of Children ~uniaed .,_inat dipbtne:d, •• tetanus. __ oopin8 caul'" .... 1 ••• poliomye1itia ao4 tub.~euLo.i. i. 95 (C1.2)
- toeal health care. includina availabili,y of at lealt 20 e •• ential drua •• vi thin ODe
hour'. walk or travel" it 1001 (C1 .. )
- the perc.ntaae of children up to at l.a.t OQe year of .,. aiven routine ehild care by trained health per.onnel ia 100 (C7.4.2)
- The percentage of pregnant wo..n with at le.tt three visita for antenat.l c.re i. 100 (C7.4.1)
... the. 9Opu.l.atioa. 8:l:ovt,n "ate i. reReed t.o I ... thaD II (171
Dn.
1981 +
198) •
1978-19
1985 +
1984
19113
1982
19$3
'"
1983
1984
90.8
34.2
Tot.l 1\&1. 'eul.
- &5.9 ye.n - 61.7 , .... -69.1 "' ...
0.34
Diptltne,.i • t.t'QUI Whoopina COU&1t Me., Ie. poliOlDyel iti. 'T..merculo8i.
65
16 5
I 854 2 246
o 136372
4.9 - 100 ra .....
80
78
1.57
13/85
13/85
13/85
.
13/85
06/85
13/85
12/82.2
13/85
13/85
13/85 .

(a)
WEST&RM PACIFIC REGION DATA 8AHl ON SOCIOBOOIlOI<IC AND IlBALTR INDICATORS
Indicator{.) for: ~
Realth policy indicator.:
- Keelcn for all ha. received ~ndoc.~nt a. policy at the high •• t official level (Cl)
- Mechanisms for in~olvinl people in the iaplementation of atretelie. have been fo~d or atrenlthened, eDd are actually functioning tGl)
- At lealt S% of the gro'l national prod~ct is spent on health (e3)
- A realonable percenta,e of national health expenditure i. devoted to primary health care (C')
- Resources are equitably distrib~ted (C~)
- Defined atrateai •• for health for all are accompanied by explicit resource allocation. (Gb)
- Defined atr.teaie. for health for all need external reaources (C6)
- The needs for extern.l resource. of w.lL-defined atreteai.s for health for .11 are ree.iviQS sustained support from more aftluent countrie. (C6)
- At la.at 801 of local coaaunitie. at all llveis hava well-.atablilna4 voluntary and form.1 community or&anizetiona, Wbicn are commicced to continuou. primary b.alth car. action prolramma' (_1)
- Tn. co.munity cOntributes in ca.h and in kind to he.lth or health related action (Rl)
1984
1984
1984
1984
1984
1984
o.u ; •
•
•
•
•
•
•
Yes
Ye'
30
No
No
Ye.
Ye.
10
Part 1\' , .•. , lO l>IIcatber 1985
N:tual Data
Source of Data
13/85
13/85
13/85
13{85
13/85
13{85
13/85
13/85
(b) Socioeconomic indicators:
- The percentage of popUlation served with sate water in the home or within 15 minute.' walkinl distance i. 100 (G7.1.1)
- the percentage of popUlation ~ith adequate sanitary facilities in the home or iQIIRecUate vicinity i. 100 (G7.1.2)
- The adult liter.cy ratio for both men aod women exceeds 10% (Cll) (Total/M/F)
- The groas national prOduce per head exceed. U5$)00 at 1980 market prices (G12)
The daily per capita calorie availability exceeds 2$00 calories (R.)
The daily per capita protein availability excee~s 10 grams (&4)
1982
1983
1984 •
1911:. •
1984
80
80
Total. Male
-> 9;
Female -
3 500 calories
13/85
13/85
13/85
13/85
13/85
Notes: The number in parentheses shoW the number given to the i.ndicator in ctoe global indicator lise (Global Strate,,, for Health For All by the Year 2000, WHO, Geneva. 1981 '''Health For Alll! Series No.3), p".' 1;-1&}.
+ Yes No No information/not available
HA Not applicable
SOurce 11/85: Gove~nmenc). Report on Evaluating PTDgress in lmplementinl the Strategies for HPA/2000. 1985
06/8~: Government's Reply to Cumul.ative Totals of eases and Deaths from 18 Selected Diseases for [he Years 1983-84 and up to July 1985
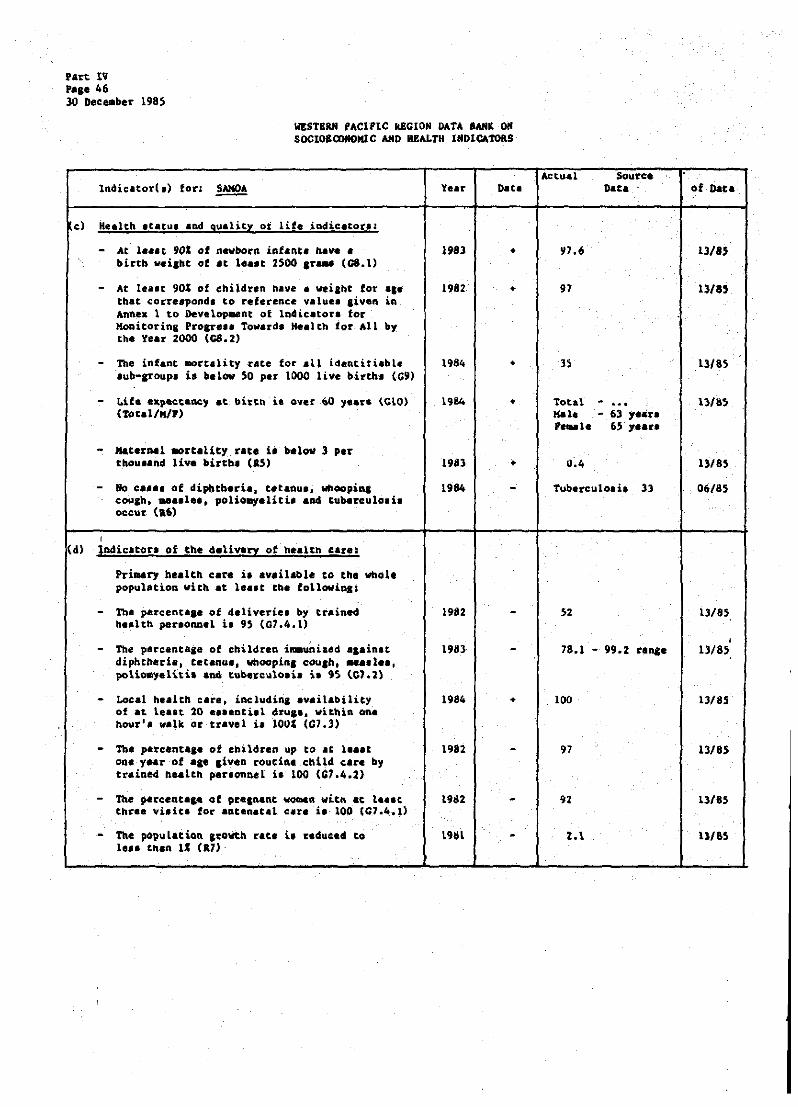
fa~t IV P". 46 30 D ..... ber 1985
WESTERN PACIFIC kEGION DATA lANK ~ SOCIOECOHOIIlC AND HEALTH I.DICATORS
Indicator(,) for: ~
c) Health .tleul and quality 01 life indic.tot.~
- At l.alt 90* of newborn infanta have. birth wei,bt of .t 1 ••• t 2500 ,r ... (G8.1)
- At lea It 90% of children have I vei&ht for a.e that cotre.ponda to reference valuel liven in Annex 1 to Development of lndicator. for Monitorinl Procre •• Toward. Kealth for All by the Y •• r 2000 (G8.2)
- The infant mortality ~ate fot .ll identitiable .ub-aroup, i. b.low SO per 1000 live birth. (Gg)
Lif. e~pectaQCy at birth i. over QO y •• rs (ClO) (Toul/II/,)
- Haternal .or-tallty rat. i. ~low 3 pet thOu.and live birch. (as)
I
10 ca.e. of diphtberia. t.tanu •• whoopia, eoulh, .... 1 •• , polio.yeliti, and tuberculo.i. oc.ur (a6)
~d) Indicator. of the 4.1ive~y of healtn carea
Primary healt~ care i, available to the whole population vitb at lea.t tn. followinsa
- Th. percenta,_ of d.liverie. by trained health perlonnel i. 95 (01.4.1)
- The parcentale of children im.unized a,.inat diphtheria. tetanuI, wnoopina couah, .... 1 •• , polioeyeliti. and tube¥culoli. i. 9S <&7.1)
- Local health care, iDcludina .vailability of at le •• t 20 e ••• oti.l drull. witbin on. nour', walk or travel i, 100' (e7.')
- The perc.nta,. of children up to at l ••• t one y .. r of ale ,iven routine child care by traiDed ne.lth per.ODDel i. 100 (01.4.2)
- the percenea,. of prelRant womea witn at l •• at thr •• ~i.it. for antenatal Car. i.· 100 (01.4 •• >
- The population crovth raC. i. r.du~.d to le," th.n II (a7)·
..
'tear
US3
1982
1984
1984
1983
1984
1982
1983
1984
1982
1982
19~1 ..
DaU
•
•
•
•
•
•
91
'tota\. Kel. ' ... le
U.4
Soure. DaC.
- 63 ,.en 6S 1-•• r.
Tuberculo.it 33
52
18.1 - 99.2 ~.n&'
100
91
92
2.1
.
of Data.
13/85
13/8S
13/85
1318S
06/85
13/85
, 13/85
13{85
13/8S
13/85
UI&S
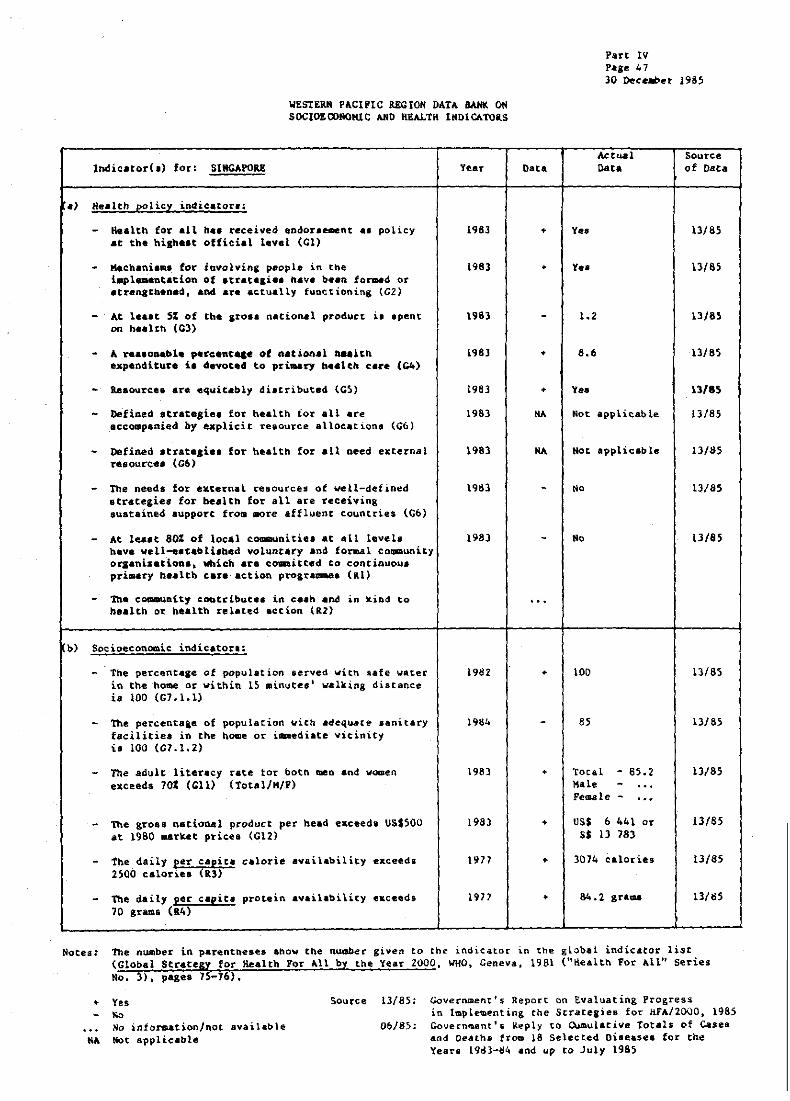
WEstERN PACIPIC REGION DATA BANK ON SOCtOEOO~OIUC AND K&Al.TK IHOICAToaS
Indi •• tor(,) for: SINGAPORE
Health for all b •• ~eceiyed endor.~nt •• policy .t the hiBb.,t offiti.l tevel (el)
Meeh.ni •• ~ for involving people in the impl ... ntation of .trat.ai •• bave O •• n fOnDed or _trengtn.ned, aDd are actually fuoetionini (G2)
At 1 ••• t S% of the Iro •• national product i •• pent on h •• lth. (el)
A rea.ooable p.rc.~t .. e of nation.l aaa1tn expenditure i. devoted to pri .. ry health ~.r. (C4)
Resoureea are ~quic.bly di.tributed (C~)
De'fined .trategiea for bealth tot' aU u'e accompanied by explicit resource alloeation. (G6)
Defined atrate,ie. fot' health for all need external resourees (G6)
The need. fot' external ~esources ot ~ll-d«fined strategies for health for all are receiving sustained support fro. more affluent countrie$ (Co)
At lea.c 80% of local communities at all levels bave well-.acabllahed voluntary and for.al community orsanis.tiona, Which are co.mitted to continuou. primary h •• lth c.r. action program.ea (Rl)
Tn. c~ftit1 ~OQtribute. in c •• h .nd in kiDd to health or b •• lth related action (R2)
b) Socioeconomic indicator.:
The percentage of population eerved with safe water in the home or within 15 minutes' walking distance i. 100 (G1.I.l)
- The percents&e of popUlation with adequate sanitary faeilitiea in the bome or i-.ediate vicinity ,. 100 (G7.1. 2)
- The adult literacy rate for botn men and w~en exceeds 10% (Gil) (Total/KIP)
The groas national product per head eaceed, usSSOO at 1980 market prices (G12)
The daily p4r capita calorie availability exceeds 2S00 calorie. tal)
The daily p~r capica protein availability e&ceed, 10 gr .... (&4)
Year
1983
1983
198]
198J
1983
1983
1983
1983
1983
19d2
1983
!983
1977
1977
Data
•
•
•
•
•
•
•
•
•
Part IV Page 47 30 Il<!ce.bn 1985
Ye.
Y ..
1.2
8.6
Ye.
Actual Oat.
Not appli~ab Le
Not applicab 1e
No
100
85
Total Male
- 85.2
Female -
US$ 6 441 or S$ 13 783
3074 calories
84.2 gra'CU
Source of Data
13/85
11/85
13/85
13185
13'8~
13/85
lJ/1l5
13/85
13/85
13/85
13/85
13/85
11/85
13/85
BidS
Notes: The number in parentheses thow the number given to th~ indicGtor in the global indicator list (Global Strategy for Health For All by th~ YeaI' 2000, WHO, Geneva, 1981 (lIk-\ealth For All" Series No. ), page. 15-16).
... Yes
"" No info~tion/not available NA Not applicable
Source 13/85: Government's Report on Evaluating Progress in Im~lementin& the Strategies for ~FA/2000. 1985
Ob185; Govern~ent'5 R~ply to Qumylacive Total, of Casel And Deaths frOG 18 Selected Oise.se8 for the ~ear. 1qd3-d~ and up to July 1985

'aTt. tV 1'.,e 48 30 Oeceaber 1985
WESTI .. PACIFIC R£CION DATA lANK ON SOCIOKOOtIOMlC ""D IiJ!:ALTH INDICILtoftS
c) Health atatus and quality of lif~ in4icator.:
- At I ••• t 90% of nevboru inf&~t. have • birth .. l&ht of at la •• t 2SDO It ... (08.1)
- At l ••• t 90' of children nave a w.i'~t for _a_ tnat eorr •• poodl to reference valu •• liven in Anne. 1 to Developaent of Indicator. tor Honieoriaa P~oare •• toward. He.lt~ for All by the Ye •• ZODO (08.2)
- The intant ~rtality rat. tor all identifiable .ub-,roup. i. belo~ 50 per 1000 live birth. (G9)
- Life .xpectancy at birth is over 60 1ears (CIO) (Total/K/F)
- Maternal mortality rate ia below 3 ,.r thOuland live oirtha (k5)
No ca.e. of diphtheri.) tetanus, WhOOpina cough, ••• lea, pOlio.,eHtie and' tubetculosis occur <a6)
(d) Iadieatora of the delivery of health eare:
PrimAry health care i, available to the wnole pop~l.tion with at le •• t the followiRl~
- The pe~centa&e of deliveries by trained health pe •• onnel i. 95 (G7.4.1)
- The percentace of child~en i"uRi&e4 alaina, diphtheria, tetanus, whoopin, cou&ht •••• 1 •• , polio.yelicia and tuberculo.i. i. ~5 (Cl.2)
- LOcal n.altb ear., inc~u4in& availability of at least 20 e •• enti.l druaa. withio one hour's walk -or travel i. lOU' (Cl.3)
- The percentage of children up to at le.st ome year of Ace ,iven ~outine child care by trained bealth personnel i. 100 l07.4.2)
- The percenta,e of pregnant wa.en with 81, leaat three vilits for .nt.~.tal care i. 100 le1.4.!)
- The pOpul.tion ,rowen rate i. red~e.d ~o 1e .. than 1% (&7)
Year
1982
1983/84
1980
1983
1984
1984
1983
1984
198~
198~
198)
DU.
• •
•
•
•
92.0
9.4
Total - .... Kelt - 69 y.are Pe.ale - 74 , •• rs
0.2
Diphtheria PoU.yeliti, Tub4!rculo.ia Mea.le.
99.8
76 - 86 ran,ge
10~
79
9S
1.1
Q
2 Z 143 Z 417
Ioutc.. of Data
13/8~
lJ/8~
13/8~
06/8S
13/85
13/8S
13/85
13185
11/85
13/8~
I
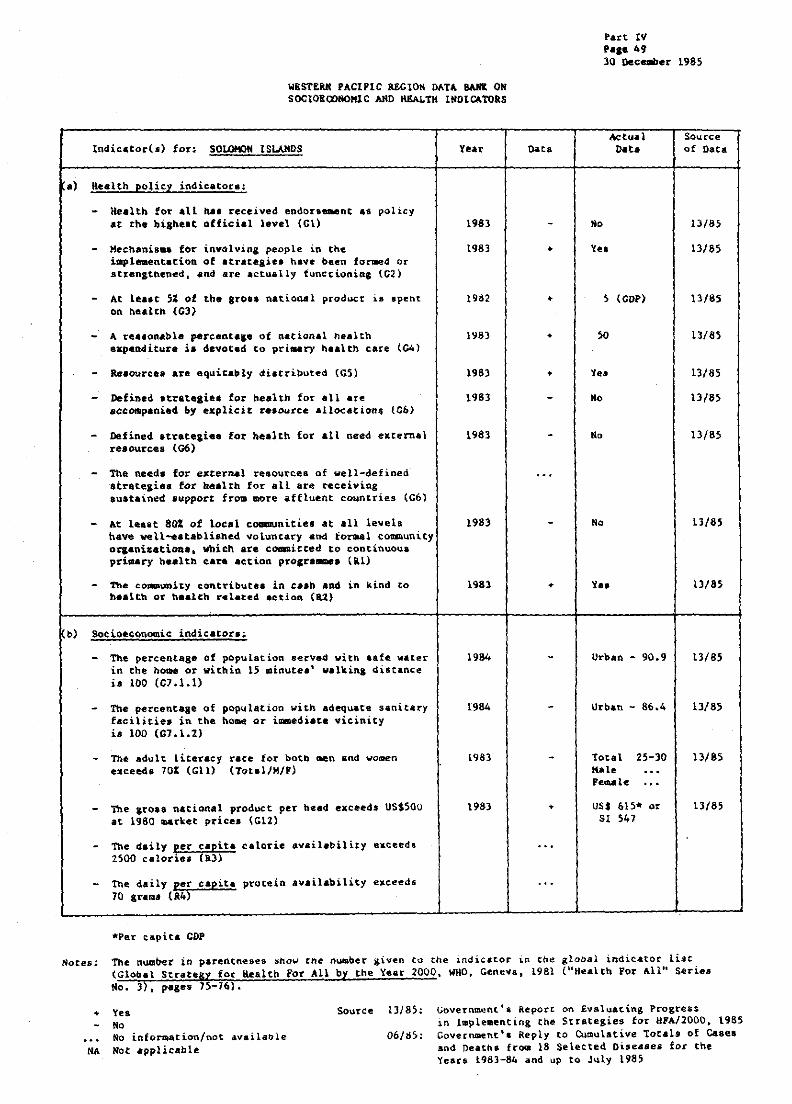
WEST£~ PACIFIC REGIO. DATA 8Afil ON 5OCIOBCOIIOIIlC AIID IIJ!AJ.T1I INDICATORS
Indic.to~(.) for: SOLOMON ISLANDS
a) H~.lth policl indicator.:
Healtb for all ~. received endorsement as policy at the biah.le official level eel)
Mecnanis .. for involving people in the i.,leaentation of atT.teaies have been formed or .stl'engttlened. and are .ctually tuncctonin& te2)
At le •• t 5% of the 8ro" national product i. spent on. health: (GJ)
A rea.onaole pereenta,e of national health expenditure i. devoted to pri .. ry h.alth care (C4)
aeaoureea are equitably distributeo (GS)
Defined strate.i •• for bealth for all ate accompanied by explicit re.ource .11oc.ti~a4 (Co)
Defined atrategi •• for healen for all need external resources (G6)
- Tne needs for external resources of well-defined strategiea for health for all are ~eceiving 8uatained support from more affluent countries (C6)
At leaat 80% of local communities at all levels have vell-eatabli.hed voLuntary and iormal c~unity oraanizatioaa. Which are c~icted to eODt~Duoua pri .. ry h •• lth ear. action pro,r.~. (&1)
Tb* to.mUDi~y contributea in cash and in kind to h •• lth or b •• lth r.l.ted action (82)
- The percentage of population served vitn aafe water in the home or within l5 minutes' valki~& 4istaRce is 100 (G7.!.I)
The percentage of population with adequ.te s.nita~y facilities in the home or i~di.te vicinity i. 100 (G7.1.2l
- The adult literacy rate for botb men and yomen •••• 048 70l (Gil) (Tot.I/H/F)
- The ,~OI8 national product per hee4 exceeds US$500 at 1980 market price. (Gl2)
The daily per capita calorie availability exceeds 2~OO calories (al)
the daily per capit. protein availability exceeds 70 Brom. (R4)
*Per capita CDP
Year
1983
1983
19S2
1983
1983
1983
1983
1983
198)
1984
1984
1983
1983
Data
•
+
•
+
+
+
Part IV Pa •• 49 30 Deee .... er 1985
.0 ~ ..
5 (GOP)
.0
No
No
UrbaQ - 90~9
Urban - 86.4
Total Kale Fe .... le
25-30
ust: 615* or 51 547
SOl.u"ce of Data
13/85
13185
13/85
Ll/85
13/85
13/85
13185
13185
1)/85
13/85
13/85
13/8,
[3/B5
Notes; ~he number in parentne8es ~ho~ ene nu.ber given to the indicacor in the global indicator lise (Global Strategy fot: klealtn For AU by the Year 2000. WHO, Gene"., 1981 (UHe.leh Vor All" Series Mo. 3). pages 1S-16).
+ Yes '0 No information/not available
NA Not applicable
Source lJ/8;: Governm~nt'a Report on Evaluating Progress in implementing the Strategies for HPA/2000. 1985
06/dS: Gover~nt'. Reply [0 Cumul.ti~e Tota19 of Gasel and Deatha from 18 Sele~te4 Diseases for the Years 198J-Sq and up to July 1985
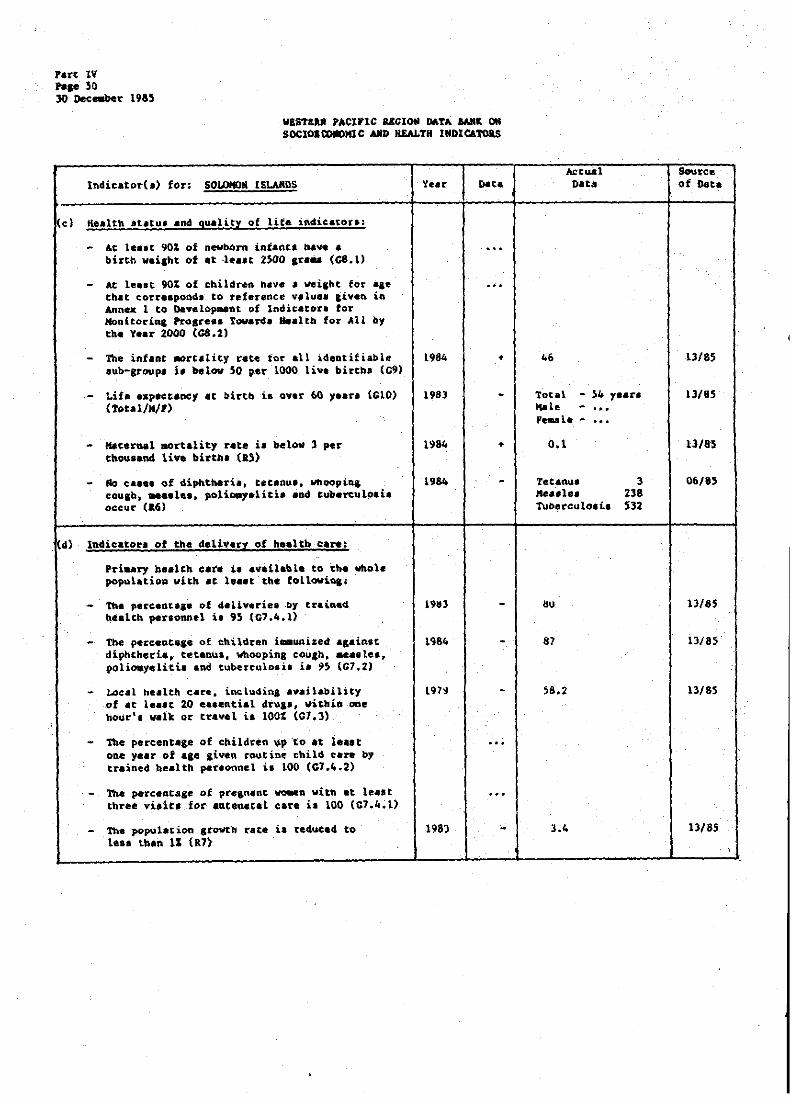
r ... tV Pap SO 30 Deceabn 1985
WIST&a. PACIFIC &lCtON ~TA BAR~ OM SOCIOIlOOllOKlC AlII) REALTH INDlc",1OU
Indicator(.) fo.: SO~N ISLANDS
- At le •• t 9OZ, of newborn intane. l\&w • birth vai&ht of at lea •• 2S00 ,.a .. (C8.I)
- At le •• t 90% of cbildr~n h.ve ~ weicht for a,e that corr •• pond. to reference v,lu •• liven in Annex 1 to Day.lo~Dt of Indicator. for Hoaitoriml Pr0le.a. Towa~. ".lta for All by tho Ye.r 2000 (C8.11
- The infant .ore.lity rate for all ideotifiable IuD-group. i. below SO per 1000 live birtha (G9)
- Lifa •• p.ceeney .t birt~ i& over 60 y.ar. (G10) (Total/H/P)
- Mat.raal .ortality r.te i. below 1 per tho~land li.o birtb. (as)
- No c. •••• of diphtne-ria, t-eunu., vtloopiq. couln ..... 1 ••• ,olioa,elitif aD4 tub.~ulo.i. occur (t6)
d) Indicator. of the de1tv.,y of healtb care:
P~iaary be.lth car. 1. &vaileble to ~h. whole popul.tio~ vith at le •• t the foLlowiDl'
- n.e p.C'c:..nt .... of 4eUverie. ,by trai.ned health perlonnel i. 95 (G7.4.1)
- The percenta,_ of children i .. uni&ed _sain.t diphtheria.- tet.nu., whooping coulb ..... le •• polioayeliti. and tuberculoaia ia ~~ (C7.2)
- Local health care. inclu4in& a.ailability of at l •• at 20 e •• ential 4rual, vithiD one hour', vait Q~ t~4vel i. lOO~ (C1.3)
- Ttle percentage of children \lop 'to a,t l ... t one year of a,e liven routine child care by trained bealth par.Gooel i, 100 (C7.4.2)
- The percentaae of prc.n.nt vo.en vitft at lea.t three vi.it. for auCeuctal care i, 100 (C7.4.1)
- The population srowth rate ia re4uced to Ie •• than 11 (R7)
Dot.
1984 •
1983
1984
1984
19¥J
1964
191~
1983
4&
Actual Data
Total - S4 y.ar. Male - ••• 'emale -
0.1
Tet.au. 3 ""4.1.. Z38 Tuberculo.i. 532
.
87
3.4
Source of Det.
13/85
13/8S
13/85
06/85
13/85
13/85
13/85
13/85 I

Part IV Pace 51 30 Dece.ber 198.5
WESTERN PACIFIC RIlGIOft DATA IW« Oft SOCIOEIDHOIIIC AIID lIIW.TB INDICATOIS
IndicatorC.) for. TOKELAU ISLANDS
.) Health policy indicator.:
Health for all ha. rec.ived .ndor .... nt •• policy .t tbe hiah •• t official level (Gl)
Meehaniams for involving people in the implementation of .trategies have been formed or strengthened, and are actually fUDctioniol (Gll
At le •• t 5% of the gro •• national product ia spent on health (G3)
A reasonable perceata,a ot national health expenditure i. devoted to prieary h •• ltb care (C4)
Re,ourc •• are equitably distributed (C5)
Dlfioed atratA,l., for h.altn for all ar. accoapanied by explicit r.aource all~c.tion (G6)
Defined atretesi •• for h.alth for all oeed eateraal resources (G6)
- The needs for external resources of ~ll-defined strategies for health for all are receiving austained support fro. more affluent countries (C6)
- At leaBC 80% of local commuaitie. at all levels have well-eatabliahed voluntary and fo~l community ora.nic.tion •• which are eo~itCed Co cODtinuQU, primary health cate action programme, (Rl)
- the ca.munity contribut., in cash and in kind to health or he.lth related action (&2)
b) Socioeconomic indicators;
The percentage of population served with sate water in the hoae or within 15 .inute.' walking distance i. 100 (G7.1.1)
The percentage of population with adequate sanitary facilitiea in the ha.e or i .. ediate vicinity i. 100 (G7.1.2)
The adult literacy rate tor bOCh men and women exc.ed. 70% (Gll) (Total/M/F)
The groll national product p~r head eKceeds US$500 at 1980 market price. (G12)
The daily per capita calorie availability exceeds 2500 calor i •• (Il)
The daily per capita protein availability exceeds 70 sr .... (R4)
Yeu
19114
19114
19.84
1984
1984
19114
1984
1984
1983
•
+
•
• •
•
...
•
+
...
., .
.,.
"0
Ye.
8
99
Y ••
Y ..
Yeo
Ye.
ActU41 D4ta
Total -Hale -Fecule -
99 ... ...
13/85
13/85
13/85
13/85
13/85
13/85
13/a5
13/85
13185
Mocea: The number in parenthe.et show the number given to the indicator in the global indicator list (Global Strategy for Health Por All by tne Year 2000, WHO, Geneva» 1981 (UHealth Por Allu Series No.3), pOS.' 75-76).
+ Yes IIa He infor.aation/not availeble
NA Not applicable
Source 13/85; Government1s Report on Evaluating Progresl in Implementing the Strategies for RFA/2000, 1985
06/85~ Government's Reply to Cumulative Totals of eate. and Death. from 18 selected Diae.ae. for the Year& 1983-84 and up to July 1984
12/83. CHIP revised by Governnlent, 1983
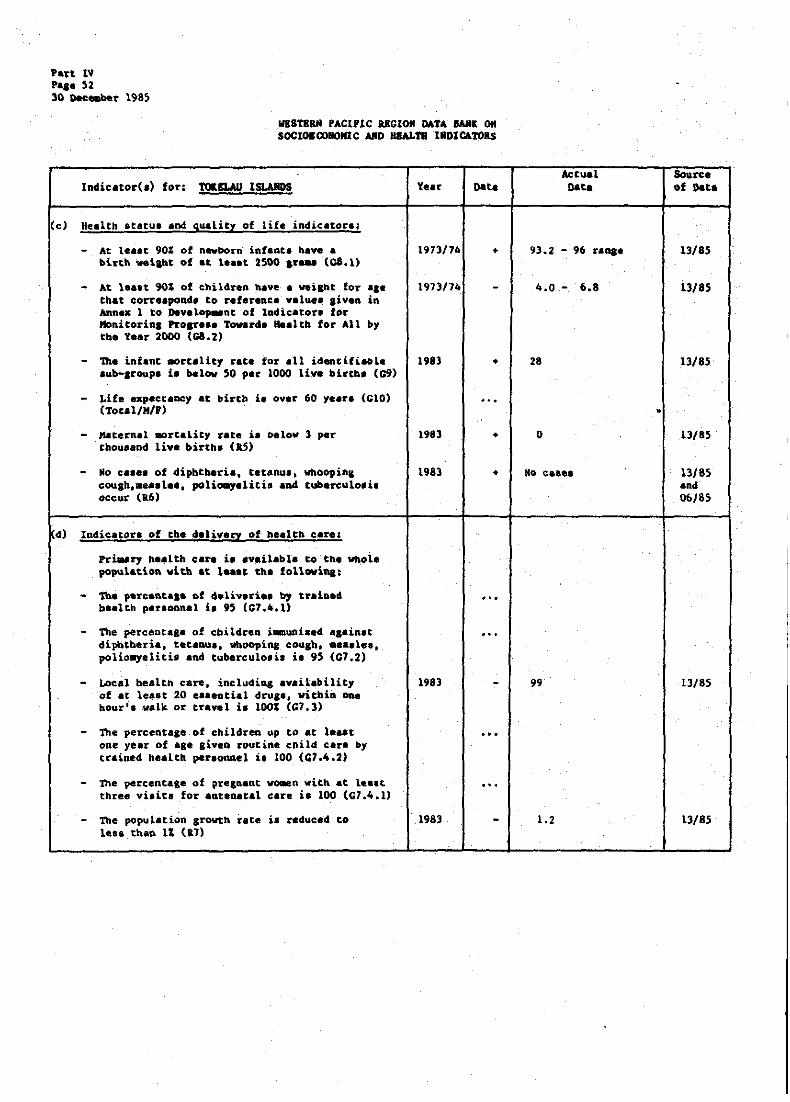
Pan IV Pa.e Sl 30 Ooce.ber 19a~
WESTERN PACIFIC alGIOH DATA BARe ON SOCIOBCOIlOIIIC AND IlllALTB IIIDICA'IORS
lndicator(.) for: tolILAU lSLARDS
(e) Health statue and quality of life indicator ••
- At 1e •• t 90: of newborn infant. have • bi~tb weilht of at t ••• t 2S00 ,r ... (ca.l)
- At le.8t gol of childreR have • wei&ht for .,_ tbat corr •• pond. to refereace valu •• liven in Annex 1 to Dev.l~nt of Indicator. fer IIonitorilll Pr0are •• Toward. He.ltb for All by tbe Year 2000 (Ga.l)
- The infant .ort.liey rate for .11 idencifi.Dle .ub-Iroup' i. below SO por 1000 live birtho (G9)
- Life expectancy at birth i. over 60 year. (CIO) (Tot.I/H/F)
- ~tern.l .orteLity rate i. oelov ) per thouland live birth. (IS)
- No c •••• of dipbtberi •• tetanul. wbOopin& cough, .... l ••• poli~.liti. and tubereulo.i, occur (&.6)
d) Indicator. of the delivery of health care:
Pri .. ry ~ •• lth care i. _vailable co ,the Whole populo.ion with •• 1 ... , tho folloviaa.
- the ,.~c.~t .•• of 4.liv.ri •• by traina' b •• lch per.oanel i. 95 (C7 ••• 1)
- The percenta,_ of children i.muni.ed a.ainet dipbtberi., ~et.DU" wbooping cGUSb, •••• le., polio~eliti. and tuberculo.i, i. 9~ (C1.2)
- Local heAlth care, incl~din, availability of at lea.t 20 e •• eaeiel dru,.. witbin ODe bour" "elk or tr.~l i. 1001 CG1.)
- The percenta,e of children ~p to at 1 ... t one year of aae liven routine cnild care by trained health per.onnel i. 100 (C1.4.2)
- The percentale of preenanC vo.en vit~ at 1 ••• e three vi.it. for antenaeal care i. 100 (G7.4.1)
- The population growth ute i. H'duced to I ••• tbon 11 (17)
Year oata
1973/74 •
1973/74
1983 •
... 1983 •
1983 •
...
1983
...
1983
Actual oat.
93.2 - 96 raDiO
4.0 - 6.8
28
o
Mo c ••••
99
1.2
•
Source of D&ta
13/85
13/85
lJ/8S
lJ/BS
13/8~ ond 06/8~
13/85
13/85
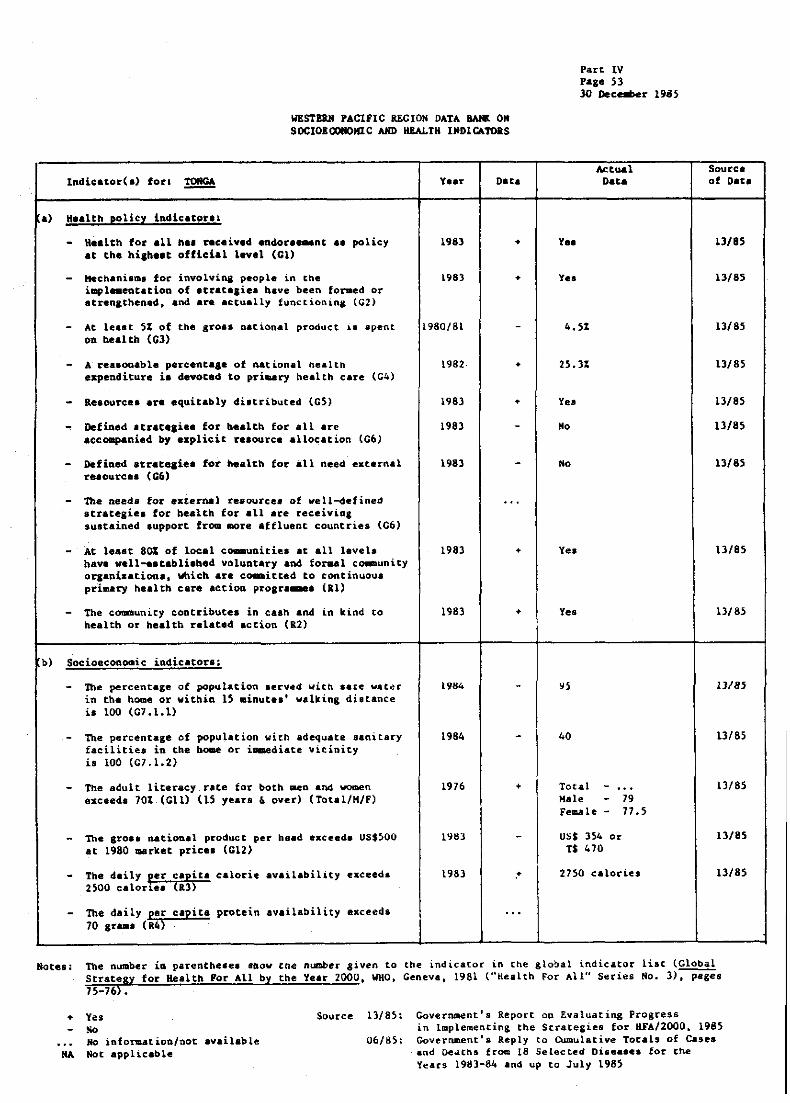
WESTBIIII PACIFIC ilECION DATA &AlIt OM SOCIOBOOIIOIIIC AlIIl IlBAl.TH INDlCATOItS
lndicator(.) fori ~ V.ar Data
.) Ha.lth poliey indicator.,
- a •• lth for all ha. ~c.iv.d eudor .... nt •• policy at tho hi,h.lt official Ilvol (Gl)
- MechaRilme fo~ invo1vina people in the impl .. eatatioa of Ittatl,iea hIve been fo~d or etrenathenad. and .r. actually functionina (G2)
- At 1e •• t 5% of the ,ro., national product 1. spent on health (Gl)
- A rea.onable percenta._ of Rational nealth expenditure i. devoted to pri .. ry health care (C4)
- Reaourc •• are equitably diltributed (GS)
- Defined Itrata.iea for health for .11 are accompanied by esplicit r •• ource allocation (C6)
- Defined Itt.teai •• for health for .11 need external relource. (G6)
- The needa for extetn.1 relouree. of ~ell-4efined strategiea for bealth fOT all are receiving sustained lupport from .ore affluent countries (C6)
- At le.st 80% of local communities at all levels bave well-.,tabli,be4 voluntary and foraal community orlani.ations. which are co..itted to continuoul prImary heal th care actiol! prolu .... (a1)
- The community contribute. in cash and in kind to health or health ralated action (&2)
b) Socioeconomic indicators;
- The percenta,e of population served witn •• ,e w.t~r in the home or within IS .inute.' walking diatance is 100 (G7.1.l)
- The percentage of population with adequate a.nitary facilities in the home or iuaediate vicinity is 100 (G7.1.2)
The adult literacy rate for both men and women exceeds 70t (Gll) US yeus & over) (TotaI/H/F)
The sro •• national product per head e~ceed. US$~OO at 1980 ~rket prica. (G12)
The daily fer capita calori~ availability exceed. 2500 calor~e. <a3)
- The daily per capita protein availability exceeda 70 gru. (R4)
1983 •
1983 •
1960/61
•
1963 • 1963
1983
1983 •
1963 •
1984
1964
1976 •
1983
1983 "
Part IV Page 53 JO Dec_r 19B5
Y ••
Ye.
4.51
25.31
Yea
No
No
Yeo
Yes
40
Total -Hale -Fema Ie -
usC 354 or T$ 410
79 77.5
27~0 calories
Source of Data
11/85
13/85
13/85
13/85
13/65
13/85
13/65
13/85
13/85
lJ18}
13/85
13/65
13/85
13/85
Notes. the number in parenthe.e. Show the numbe~ liven to the indicator in tne glooal indicato~ list (Global Strategy for Healtb 'or AU by the Year 2000, WHO, Geneva, 1981 ("Health For All" Series No. 3):--page, 75-76) •
+ Yes !iO No information/not available
HA Not applicable
Source 13/8~: Government's Report 00 Evaluating Progress in ImpleMentin& the Strategies for HFA/2000. 1985
06/85: Government's Reply to CUmulative Totals of Case. .nd OeaChs from 18 Selected Di.e •• ~. for the Years 19d1-84 and up to July 1985

Part IV PalO 54 30 __ ber 1985
IlUUU PACIFIC UGIO" DATA _ OM SOClOICOlOlllC AlII) IIJW.TH IIIPlCATOItS
Indicator(a) for: ~
c) Ma.ltb status aDd Quality of life indicatora:
- At lea.£ 90% of aevborA infanta ~ve • birtb weicht of at l ... t 2500 ar ... (08.1)
- At le •• t 90% of children o.ve • veiaht lor _ae that corresponda to reference valu •• livID in Ann.~ 1 to DeYelo,..nt"of ladie.tora for Moa.itorin.. Pr0lr ••• TORN' Health for All by tbo Y •• r 2000 (08.2)
- lbe infant .ore.lit, rate for all ideotifiabla lub-croupi il b.low 50 plr 1000 livo birtbl (09)
- Lif. expectaDeY at birch i. over 60 , •• 1" (CIO) (rotal/NI,)
- Materoal aortal it)' r:at.. i. below 3 plr tbouaand live birtlll (IS)
- No c •• ea of diphtheria, tee_aul. vnoopiol COUCh, .... 1 ••• polio.,elitia .ad tub.rculo.i. oecur (&6)
d) ladle.tor. of the delivery of health c.r.~
Primary health care i. av.ilable to the whole population with at 1 ••• t the fOllowiaa:
- The percenta,e of deliv.ri.1 by trained healtb perloanel il 95 (07.4.1)
- The percent ... of cbildren (infant. under one y.ar of a.e) iamuni&ad _.ainat diphtberia J
tetaDu. 1 whoopina couan • .ea.le., polia.yeliti. ao4 tuberculoli. i. 95 (C7.2)
- Local healtb care. includina availability of -at 1e.lt 20 e".D~i.l d~l. within ODe hour'. walk or travel il 100% (C7.3)
- The percent.,e of children up to at leaat one year of a,. ,iYen routine child care by trained health perloaael i. 100 (G1.4.2)
- The perceDC". of pre,nant vo.en with at l.a.t three vilit. for anteDatal care i, 100 (C7.4.1)
- The population IrOwth rate i. reduce. to Ie .. thaD 11 (.7)
Year Data
1984 •
1983 •
1984
1984
1984
1984
1984
1984
1984
1984 •
Actual Data
:> 98
80
11.1
Toul -Male -, ... 1. -
60
'" '"
Whoopin& COUlh TetaDIII Tuberculoli, *.Ilel
60
80
80
60 - 80
80
0.9
4 1
46 5
SOurce of Data
13/85
13/85
13185
13/85
06/85
13/85
13/85
13/85
13/H
13185

WESTIItII PACIFIC REGIOII DATA BAlIK 011 SOCIOlCOllOHlC AliD Il&ALTH INDICATORS
Indi.ator(o) for: T T of the PACIFIC ISLAMDS
.> Health policy indicator.:
Health for all ha. received endor.e.eot 8. policy at the biab •• t official level (Gl)
Hach&Ai... for involvina people in the ~leaent.tion of Bereteai •• have been formed or .trenSthened •• nd are actually functioniQg (C2)
At le •• t 51 of the aro •• national product i. apent on health (03)
A rea.onable percentage of national health expenditure i. devoted to primary health care (C4)
a •• ourcee are equitably di.tributed (GS)
- Defined .trateli.a for healtn for all are accompanied by explicit resource allocation. (C6)
- Defined Btrateai •• for b •• lth for all need external r •• ource. (C6)
- The needs for external re.ource. of veil-defined .trace,i •• for h •• lth for .11 are receiving IUlcained lupport from .ore affluent countries (G6)
- At le •• t 801 of l~.l communi tie. at all leyel. bave well-e.tabli.hed voluntary and foraal community organization •• which are committe4 to continuous primary h •• lth care action programme. (Rl)
- The community cont~ibute. in ca.n and in kind co healtb or health related action (R2)
b) Socioeconoaic indicators:
- The percentage of population served witn sate ~ater in the ha.e or witbin 1S .inutea' walkin, distance i. 100 (G7.1.1)
- the percentage of population witn adequate sanitary facilities in the hoaa or La.ediate vicinity i. 100 (G7.1.2)
- The adult literacy rate for Doth .en and women exceed. 701 (Gil) (Total/H/F)
- The grO.S national product per head exceeda USS500 at 1980 market price. (GI2)
- The daily per capita calorie av.ilabili~y ex~eeds 2500 calories (I.)
- The daily per capita protein availability exceed~ 10 ,raIDs (11.4)
1983
1983
1983
19~J
1983
1983
1983
1983
1983
1983
1983 1982
Oata
+
+
+
+
+
+
Part IV Page S5 30 Dee_er 1985
No
No
Actual Data
6 - 12
15 - 20
No
Yeo
No
Ye.
&0
30
US$ -1300* US$ 9300-
Sourc:e of Data
13/85
13/85
13/85
13/85
13/85
13/85
13/85
13/85
13/85
13/SS
13/85 13/85
Notes; the number in pareotheles ahow tne number given to the indicator in the global indicator list (Clobal Strategy for Kealth For All by the '{ear 2000. WHO, Geneva. 1981 (nHealth For All n Series No.3), page. 75-76).
+ 'les !Io No info~tionJnot available
NA Not applicable
*federated States of Mieronesia
Souree 13/85; Government's Report on Evaluating Progress in Implementing the Strategies for HFA/2000. 1985
**Gross Island Product per head - Northern Karianas

Port IV •••• )6 30 Dec_r 1985
IIISTIU PAClIIC II£GIOII lIATA _ 011 SOCIOllODllOllIC ANI> IlllALTII lJIOICAtOas
.r-----------------------------------_,,---~--_,r_--~~~------~~~~ k t",al Source Indic.tor(.) for, T T 0' TRB PACIFIC lSLABDS
c) Health atatuS and quality of life indicatora;
- At lealt go, of newborn iBfaatl a.v. & birtb weiCkt of ot I ••• t 2500 ,rial (ce.l)
- At le.at 90% of cbildrea nave • weicbt for ',e that corr •• poDdl to reference y.lue. liven in Annex 1 to Devel~nt of Indicators for Konitoriq Proar ••• Toward. Health for All by thoY ••• 2000 (ce.l)
- the iuf.at .o~t.lit, ,ate for all identifiabla 'ub-croup. l. below 50 po. 1000 livo bi.th. (G9)
- Lif ••• plce.DC, at bittn ia oYer 60 ,.are (GlO) (Tot.lfII/f)
- Macern.l .ore.lic1 rat. i. below 3 plr thou •• nd live birtb. (a5)
- No c •••• of diphtheria, tet.nua, whoop inc eouln. meaal •• , pOli~liti. an4 tubeTeulosi. occur (R6)
d) Indicator. of the delivery of health Clre:
Priwary h •• ltb care hi available to tbe wole population vitb at 1 ... t tbe fol1owiaa~
- Tne percenta,_ of 4eliverie. by traine4 h.olth pe.oODrioI i. 9S (G7.4.1)
- The percent ... of children i .. unized .,.in.c di,atberia. tet.nu., Mboopina cou&h, •••• 1 ••• poli~.iitil ond tuborculo.i. i. 95 (C7.2)
- Local health eare. ia;cludina .",.ilahiUt, of .t le •• t 20 .I.entiat dru,I, within one hour' .... Ik or tr ... ol it 1001 (C7.)
- The percenca,_ of children up to at l ••• t one yelr of •• e liven routine child ~.re by trained nealtb po.a .... 1 i. ~OO (&1.4.2)
The. peft.D.te,e of pn,pan;t ..... " vi ttt. at le.lt ebre. vi.it. for aat_aatal .a~ i. 100 (C1.4.1)
- The popule,rioa. crowtb rete iI reduc.d to h •• than U (87)
*Micron •• i. **Within O6e hour'. tr.~.l
***Have acel" to 20 •••• nti.1 druse
Year
1919-111
19&3
1983
1982
19114
1981
1981/84
1983
1982
Oot.
•
•
•
+
...
...
Deca of Dat.
92 .6 - 94 •• "'.
17.6
... . ..
lIhoopin& COUIh 4S1 Tuberculosis 18
89
:10 - 99 T ....
95**; 10 ....
13/85
13{85
13/85
13/85
13185
13/85
13185

Part n· Pa&e 57 30 Dece.ber INS
WESTBAN PACIPIC REGION DATA BANK OM SOCIOBCOIlOMlC AND Il&ALTli INDICATORS
lndicator(a) for: ~
.) Health poliey indicators:
Healtb fOT .11 aa. received endoraeeent •• policy at the hi,h •• t official level (Gl)
Kechaniaal for involvinl people in th. iapl ... ucetion of .t~.t.&i •• h&VI ~.n tor..d or a trengthened , and are actually fuactioaina (C2)
At le •• t 51 of tne ,ro •• national product i •• pent on health (C3)
A reaaonable percentage of Qation.l health expenditure i. devoted to pr~ry he.ltb care lG4)
Resources are equitably distributed (C~)
Defined stratecie. for bealth for .11 are acca.panied by explicit resource allocationl (Co)
Defined atrategi.a for bealth Ior all need external resources (06)
The need. for external resources of well-defined stratelie. for health for all a~e receiving suetained .uppor~ from more affluent countriea (CO)
At leaat 80% of local e~unitie8 at all leyels have well-establiahed voluntary and foreal ~ommunity organization., wnien are comaitted to contiaunU8 pri .. ry health caee action proaram.el (al)
The community contribute. in calh and in ~ind to health o~ health r.lated action (12)
b) Socioeconomic indicator.:
- The percentage of population served wieh safe vater in tne home or within 1S minutes' walking di.tance is 100 (G7.1.1)
- The percentage of population vith adequate sanitary facilities in tbe hoae or imeediate vicinity ia 100 (G7.1.Z)
- The adult literacy rate for botn aen .nd women exceed. 70% (GIl) (TotAl/HIP)
- The groa. national product per head exceeds USS500 at 1980 marker pric •• (GI2)
- The d4ily per capita calorie availability exceeds 2500 calories (ll)
- The daily per capita protein availability exceeda 70 grlUll. (R4)
Year
1983 •
1983 •
19s.:. •
19s.:. •
1983 • 1983 •
1983 •
1983 •
1983 •
1983 •
1 9s.:. •
19114
1983 •
1983
Actual Dara
Constitution contain. a .tatement OQ the riaht of citizens to live a healthy 1 if.
Yea
7.7
Approxiaate 1y 30
Yea
Yea
Financial a.sistance received fr~ affluent countries and organizationa for the development of the national health 8ervices
100
Community provide. free labour
100
00
Total - 95 Kole - ... Fema le - ...
USS 360 or AuatS 430
Nate.; The dumber in parentheses sbow the number given to the indicator in the global indicator lise {Global Stu,ten for Health 'or All by th.e "tear 2000, WHO, Geneva. 1981 (lfH.ealth For All" Series No. 3)~ .. 75-76).
+ Yes No No information/not available
NA Not applicable
Source 13/8S: Government'S Report on Evaluating Progress in lmple~nting the Strategies tor HPA/2000, 1985
06/85: Government's Reply to Ou~ulative Totals of Cases and Deaths from 16 Selected Diseas~8 for the Years 1983-~ and up to July 1985
Source of o.t.
13/85
13/85
13{85
13/85
13/85
13/85
13185
13{85
13/85
13/85
13/85
13/85
13/85

Part. IV ,... S8 lO 0.,, __ 1985
WISTEaM PACIPIC RSGIOM DATA aAMt OM SOCIOr.OOIIOKlC AIIJ) IIEIol.t\I 1I1DItAtolS
Indicacor(,) for~ ~ .
c) Heal'h It.~. Ind quality of life indicator.:
- At le,lt 90' of newborn infant. bey. a birth veiaht of .t 1 ••• t 2'00 ,ra •• (Ga.l)
- At l.ast 90% of children ~.v .. w~i,ht tor ase that corre.pond. to reference value. given in Artnex 1 to Deyelo~nt ot Indicators for Monitoring Pr0lr ••• Towara. Healtb for All by the Yeor 2000 (G8.2)
~ The infant aoTtali~, rat. tor all id.ntitiaol. .u.b-Iroup' ia below SO peT 1000 liv1I biTt". (C9)
- Lit. expectaacy &c birth i, o~er 60 7 •• ~' (Cl0) (TOtal/K/')
- Haternal mortality rate i. below l per thou.and live birth. (15)
- No c •••• of diphtberia. t.e.QUI, Whoopin& couah, mea. Ie •• polioayeliti, and tuberculo.i. occur (R6)
d) Indicator. of the delivery of health care:
Pr~ry he.lth c.re i. available to the Whole population with at lea.t the follovina:
- the percenta,. of deliverie. by treined bulth paroo"".l i. 9) (G'.~.l)
- The perc.n~ ••• of children i.-uni.ad .,ainet 4ipbth.~i., tet.au_, wboo~iua coulh ••••• 1 •• , polio.yelie! •• ad tuberc~lo.i. i. 9S <C7.Z)
- Locel nealth care. including avaiLabiLity of at lea.t 20 e.lential dr~c., vit~in one houri. walk or trayal i. 100% (Gl.3)
- The percental. of children up to at least one ye.r of a .. liveD routine thild eIre by tr.iaed he.lth pe~loanel i. 100 (C7.4.2)
- The percenta,e of pregnlDt woaen with at le.l[ thrt. visit. for aat.Dat.1 eare i. 100 (C7.4.1)
- The population growth rate i. re4uced to 1 ••• than 1% (&,)
Yeat:' not •
198) •
1984 •
198)
198) •
1984
1984 •
198)
1984 +
1984 •
1984 +
193)
97
4S.6
Act",,1 oata
'Total - ..... Kal. - ~1 y •• re female - 60 years
9
100
6S ~ 100 rona.
100
100
100
1.5
Source of Data
1318S
Ill"
13/8S
n/8S
06/85
13/85
III 85
13/85
13185
13/85
13/8S

IlESTUIi PACIFIC REGIOII DATA _ ON SOCIO.OONOllIC AIID HEALTH UDlCATORS
PArt IV P .... ~9 30 Decellber 1985
Indieator(.) for: VANUATU Year /)<It. SOurce of Data
(.) Health policy indicator ••
- Health for all ha. received endorsement .s policy at the high •• t official level (el)
- Mecheni... for involving people in the implementatioD of atraCeliee have been formed or .crenscbened. and are actually tunccloain; (GZ)
- At leaat S% ot tbe aTO.' a.tional product 1. 'peat Oft heolcb (G3)
- A re •• onabla parcentaa. of na,iooal health expenditure i. devoted Co prt.ary health care (G4)
- ".ourc ••• ~ .qui~.bly di.tributed (G)
- Defined ,trate,i •• for h.alth. for aU are accompanied by .apli~it re.ourci allocations lG6)
- Defined Itt'ata,i., for h.alth for all ne.6 ext.r~l 'C'e,ource8 (G6)
- The needs for external resources of well-defined strategies for h.alth for all are receiving sustained support from more affluent countries (G6)
At least 80% of local c~unitie. at ell te~e16 h.ve well-e,tabli,hed voluntary and f~rmal community organizationl, which are committed to continuous primary h.alth care action programmes (Rl)
Tne community contributes in ca.h and ia kind to health or health related action (Rl)
(b) Soeioecodomic indi~.tor ••
- The percentage of population served ~ith eafe ~ate~ in the ho.e or within 15 .inutes' walk in, distance i. 100 (G7.1.1)
- The percentage of population with adequate ,anLtary facilities in the ho.e or i .. ediate vicinity i. 100 (G7.1.2)
- The adult literacy rate tor both qen and women ekceed. 701 (Gll) (TotalIH/F)
The gross national product per bead exceeds US$SOO at 1980 mark4t ~ice. (Gl2)
The daily per capita calorie availability exceed. 2500 caloriea (ll)
The daily per capita protein availability exceeds 70 gram. (8.4)
1~&4 •
1984 +
1981. •
1984 •
1984
1984 +
1984 •
1984
1984 •
1981-85
1981-85
1982 +
1979 •
1979
Ye.
Ye.
13.&
so
No
Yes
Ye.
45
30
US$ 529 or VA1'\) ~l 320
2546 calories
68.4 ,ramI
13/85
13/85
13/&5
13/8S
13/8S
13/85
13185
13/8S
13/85
13/85
13/8S
13185
13/85
Notes: The number in parentheses shOW ~he numbe~ given ~o the Lndicator in the global indicator list (Global
Strategy for lIealtt' For All by the Year 2000, WHO, Geneva, 1981 ("Health For All" Serie. No.3). pale. H-(0).
+ Yes No No inform&tion/not .~ailable
NA Not applicable
Source 13/8;: Government's ~eport on Evaluating progress in I,plemeotin, the Strategies for HFA/2000. 1985
ob/a~: Government"s Reply to Cumulative Total. of Gases and Deachs fr~ 18 Selected elsea_e. for the
Years 1983-84 and up to July 1985
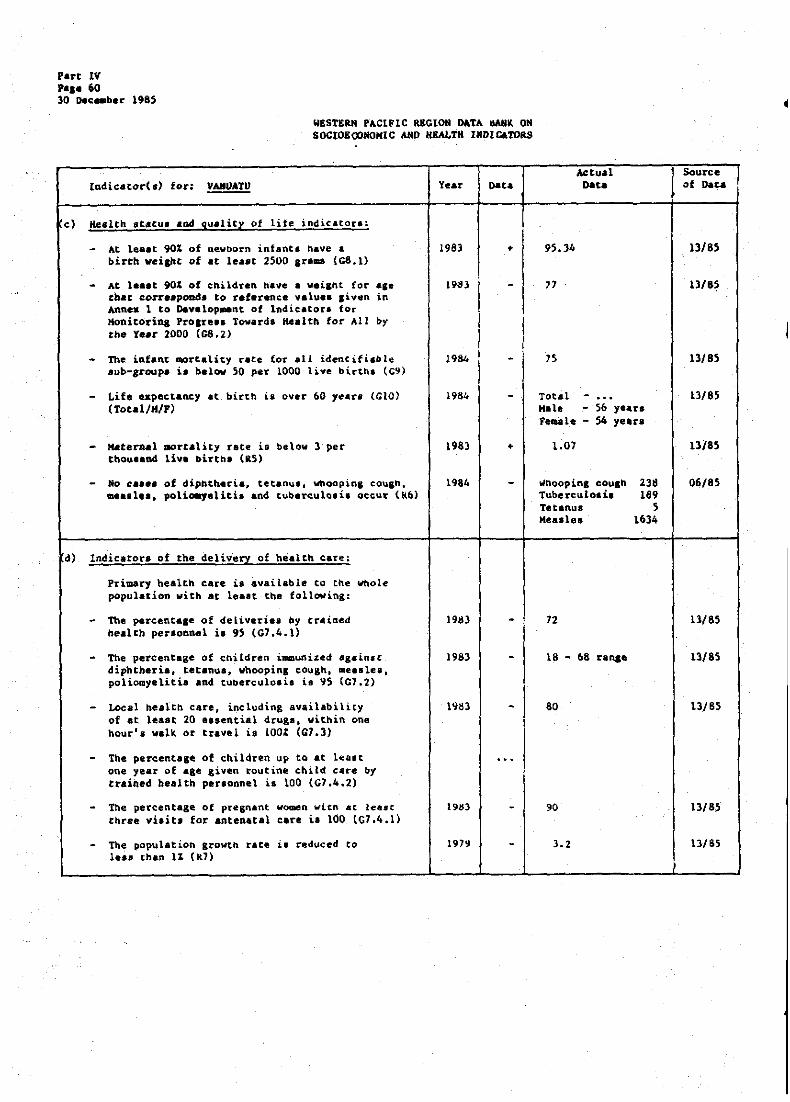
Part IV P ••• 60 30 Dec_ber 1985
WESTERN PACIFIC REGION nlTA OARK ON SOCIOECONOMIC AND H£Al.TH INDICATOlIS
ludicator(.) for: VANUATU
- At le.at 90% of newborn infant. have a birth weicht of at leaat 2500 ara .. (Ca.l)
- At le •• t 90' of cnildren nave I vetlht for ••• that corr •• poad. to reference valu •• ,iv.n in Annex 1 to DevIlop .. nt of lndicator. fOr Monitorinl Pro,re •• Toward. Health tor All by the Year 2000 (CS.2)
- The inflnt .ortalicy rIte for all idencifiable .ub-,roup. i. below SO per 1000 live birth. (C9)
- Life expectancy at birth is over 60 y~ar. (CIO> (Total/H/F)
- ~tern.l aortality rate is below J per tbou.and live birth' (&5)
- No c •••• of dipntberia, tetanu., wnoopinl eouah. mea. I ••• poliaa,eliti. and tubercula.i. occu~ (k6)
cJ) Indicator. of the deliv"ery of health. Care ~
Primary healtn eIre i. available to the Whole population with at le •• t tne following:
- The percentage of deliveries by cr.ined bealth personnel i. 9S (C7.4~1)
- The percentage of cnildren immunized against diphtheria, tetanuI, Whoopinl coYah •• e •• le •• poliomyeliti. and tuberculo.i. ia ~S (01.2)
- Local health care, inCluding availability of at least 20 elsential drugs, within one hour's w.lk or travel i8 100% (G1.1)
- The percent. Ie of cbildren up to at 1~a8t one year of aae liven routine child c4re by trained health perlonnel il 100 (G7.4.2)
The per~entage of pregnant women vitD at lea.e three vi,ita for antenatal cere ia 100 (C1.4.1)
The population I~owth ~ate i, reduced to 1 ••• than 11 (R7)
Year oato
1983 +
198)
1984 I
198:.
198) +
1984
1983 - ,
1983
\98)
19)9
95.34
)S
Actual oat.
Total - ••• Kale - 56 ye.rs Fe .. le - 54 years
1.0)
whoopin.1 COUlh Tuberculo.i. Tetanus Keades
72
18 ... 68 ranae
80
90
).2
23~ 189
S 1634
SOurce of Dau.
13/85
13185
13/8S
13/85
13185
06/85
11/8S
13/85
13/85
13/85
III 85

WESTEllM PACIFIC B.EGION DATA B.ANK ON SOCIOEOONOIIIC MD H!Al.TH IHI>ICATORS
Indicator(s) for: SOCIALIST REPUBLIC OF VIEt HAM
a) Health policy inaicatDrs:
Health for all has received endorsement a. policy at the biaheat official level (GI)
Mechani ... for involvina people in the implementation of .trat~&ie. have been formed or strengthened, and are actually functioning (e2)
At leaat 5% of the &ros, national product i. apent in heaUn (G)
A reasonable percentase of national nealth expenditure ia devoted to pri-ary health c.re (G4)
ae_ouree. are equitably distributed (CS)
Defined atratelies for health for all are accompanied by explicit resource alloe_cions (Gb)
Defined strateaiea for healtn for all need external resources (06)
The needs for external resources of ~ll-detined strategies for nealth for all 4re receiving sustained support from more affluent countries (Gb)
- At least SO%. of local communities at all levels have well-established voluntary and formal coamuniry organizationa, which are co~itted to continuous primary health care ac~ion pTogrammea (Rl)
- The comaunity contributes in ca.h and in kind to be.leb Or h •• lth rel_ted action Ca2)
b) Socioeconomic indicators:
- The percentage of population served witb safe water in the home or within 1S minutes' walking distance i. 100 (C7.1.1)
- Tht percentage of population with adequate sanitary facilities in the home or i.medi.te vicinity i. 100 (G7.I.I)
The adult literacy rate tor botn men and women .xc.ed. 70% (Cll) (Totll/K/F)
- The gross national product per head exceed. U5SS00 at 1980 .. rket pricea (GIZ)
- The d.ily per capita calorie ayailability exceeds 2500 calories (ll)
- The daily per cap it. protein availability e~ceedt 70 gru. (&4)
Year Data
196) +
198) •
•
1982 +
1983 +
1983 +
198)
196)
(98) +
(98) +
198)
.Part IV page 61 30 Deceabe:r 1985
Ye.
Y ••
~~
Y ••
Y ••
Y ..
Actual Data
Urban - 90 !tural - 30
)0
Total ""le Female -
US$ 500
96
2000 calories
Source of Data
13/8~
\3/8~
\3/8~
\3/8~
13/8~
1)/8S
13/85
13/85
1l/85
1)/85
13/8~
Notes: The number in parentbeses Show the number given to the indicator in the global indicator list (Glob".l Strategy for Health For All by the Year 20VO, WHO, Geneva, 1981 ("Healtb For All" Serie6 No. ), page. 75-76).
+ Yes No No information/not available
NA Net applicable
Source 13/85: Govern~ent's Report on Evaluating Progress in Implementing the Strategies for KFA/2000. 1985

Pn't 1'* ,&._ 62 30 Doc •• ber I98S
WEST"N PACIFIC REGION DATA HAlIK ON SOCI0&OONOMlC >.liD l\UI.TR INDlCATOIlS
Indicator(.) for: SOClALlST REPUBLIC OF VIET NAlI
c) Health statuI and quality of lite indicatorl:
- At leaat 90% of newborn infant. have a birth veilbt of at t ••• t 2S00 sr ... (ca.l)
- At le •• t go& of children have a weilhc ror age that corre.poo4s to reference value. liven in Annea I to Develo,..nt of Indicator. for MOnitorio& Pro&re •• Tow.rd. Health for All by the Y •• r 2000 (G8.2)
- The infant mortality rate ror all identifiable sub-sroups ia below SO per 1000 live birth. (C9)
- Life expect.acy at birth is over 60 year. (GIO) (Totai/H/P)
- Maternal mortality rate i. below 3 per thou.and live birthS lIS)
No c •••• of diphtberia, tetaau. , Wboopina cou,h. mea.le' l poli~eliti. and tubereulo.i. occ"r (&6)
d) Indicators of the d.elivery of health care:
.
Primary health care i. available to the Whole population with at l.a.t the following:
- The percentaae of ~eliverie. by trained health penonnel h 95 (G7.4.U
- Tne percentage of cnildren UDaunized against diphtheria, tetanus, whooping couah, measlea, polia-yelitia an6 ~uberculo.i. i. 9S lGl.1)
- Local health care. including availabilicy of .t le.at 20 e •• ential drug') within one hour's walk or travel i. 100& (G7.1)
- The percentage of children up to at lea.t One year of age liven routine child care by trained health personnel i. 100 lG7.4.2)
- The perc.ntaa8 of pre&nant vomen with at least three viaits tor antenatal care i. 100 lG7.4.1)
- The population grovth rate i. red"ced to Ie •• th.n 1& (a7)
Year Data
19".
1982
1983 •
1982 • +
1983 •
1983
19&1 •
1983
1982
1982
1983
75
86
Actual Data
33.5
Total ""I. - 62 yeare , ... le - 66 year.
1.1
Diphtheria Whoopia.a couah Tetanua PoliOilyeliti. Hea.le, Tuberc.ulo. is
100
50 - 70 range
75
90
2.34
1480 92 18 23
SSI 631
Source of Data
13/85
13185 . .
13/8S
13/85
13/85
13185
11/83
1l/8s
.
13185
11/85
13/85

~'"
WESTERN PACIFIC REGION DATA BANK ON SOCIOECOHOHlC AND HEALTH INDICATORS
Indicator(a) for: WlLLIS ANO FUTUNA
a) Sealth policr indicator"
- Health for all ha. received endor .... nt •• policy at the hiBheat official level (GI)
- Meehani, •• far involvina people in the implementation of .crate,i.s have b.en formed or etrenetbened, and ara actually functionina (G2)
- At lealt 5% of tbe gr08S national product is spent on health (C3)
- A rea.onable percentage of national health expenditure i. devoted to primary health care (G4)
- Resources are equitably distributed (05)
- Defined strateaiel for health for all are accompanied by explicit resource allocations (C6)
- Defined atrategiee for healt~ for all need external resources (G6)
- The needs fo~ external resources of well-detined stTategiea for health for all are receiving sustained support frOtlll more affluent countries (G6)
- At least 80X of local communities at all levels have well-established voluntary and formal community organization •• Which are com.itted to continuous primary h~.lth care action prolra.me. (al)
- The community contribute. in calh and in kind to h~or he.lth related action (R2)
- The percentage of population served with safe wa[~T in the home or within 15 minutes' walking distance i. 100 (C7.1.1)
- The percentage of population with adequate sanitary facilitie. in the home or imeediate vicinity i, 100 (G7.1.2)
- The adult literacy rate tor both men and women exceeds 70% (Gil) (TotaI/K/F)
- The gross national product per head e~ceed. USS5uO st 1980 market prices (GI2)
- The daily per capita calorie avail.billey exceeds 2500 calories (al)
- The daily per capit. procein availability cxc~ed~ 70 gr .... (R4)
Year Data
...
...
. -.
...
...
'"
..
...
Part IV P.,e 63 30 December 1985
Actual Oat.
I
SOUl'ce of Data
Notes; The number in peTentneaes 6~QW tbe numbe~ ~iven to tne indicator La the global indicator list (Global Strategy for Healen Por All by the Year 2000, IIIHO, Geneva, 19tH ("Health For All" SeTies Ho. ), pages 1.$-76).
.. Yes No
No information/not availabl~ NA Not applicable
Source 06/85; CoVern'Dent I s Reply to Cumulative Totals of Cases and Deaths from 18 Selected Oi,ease$ for the Years 1983-84 and up to July 1985
-- ~
, 1
I

.
P.rt tV Pa.e 64 30 Dece.ber 1985
WESTUN PAClFlC kEGlON DATA 1Wi~ ON SOCIOECONOHlC AND K£ALTH INDICATORS
Indicator(.) for, WALLIS AND FUTUNA
~) Health status and quality of life indicator.:
At lea.t 90% of newborn infant. have a birth weiaht of at least lSOO arame (Gael)
At least 90% of children have a wei8ht for that corresponds to reference value. ,iven Annex 1 to Develov--nt of Indicator. for Monitorin, Prolre •• Toward. Health for All the Year 2000 (G8e2)
age in
by
- The infant mortality race for all identifiable .ub-&roup' i. below SO per 1000 live birth' (09)
- Life expectancy at birth i. over 60 y •• r~ (CIO) (Total/K/F)
- Maternal mortality rate i. below 3 per thou.and live birth. (R$)
- No casea of diphtneria, tetanu" whoopin& couan, .... le., polio.,eliti. and tuberculo.ia occur (16
cO Indicators of the delivery of I'lealth car_:
Primary health care i. available to the whole population with at lea.t the followina.
- The percenta,_ of 4.1iveriea by tr.ined healtn per.oanel i. 95 (G7.4el)
- The perceaca,e of children immuaiaad a.ainst diphtheria, tetaaue, whooping couah, •••• le., polio.yelitil and tuberculolis i. 9S (C1.2)
- Local health care, includin, availability of .t 1 •• lt 20 ••• ential drus., within one hour', walk or travel ia 100% (G7.1)
- The percentage of children up to at lea.t one year of a&e given routine child care by trained health perlannel is 100 (C7.4.2)
- The percentage of pregnant woaen with at lea.t three vilit. for antenatal care i. 100 (C7.4.1)
- The population growth rate i. reduced to Ie •• 'han 1% (Rl)
Year Data
I 000
00 0
1984
Actual Oata
Tuberculolil 14 "ealle. 4
Source of nata
06/85
I

WORLD HEALTH ORGANIZATION Regional Office for the Western Pacific
WESTERN PACIFIC REGION DATA SANK
ON SOCIOECONOMIC AND HEALTH INDICATORS
PART V GRAPHIC PRESENTATIONS OF
GLOBAL AND REGIONAL INDICATORS FOR WPR COUNTRIES/AREAS
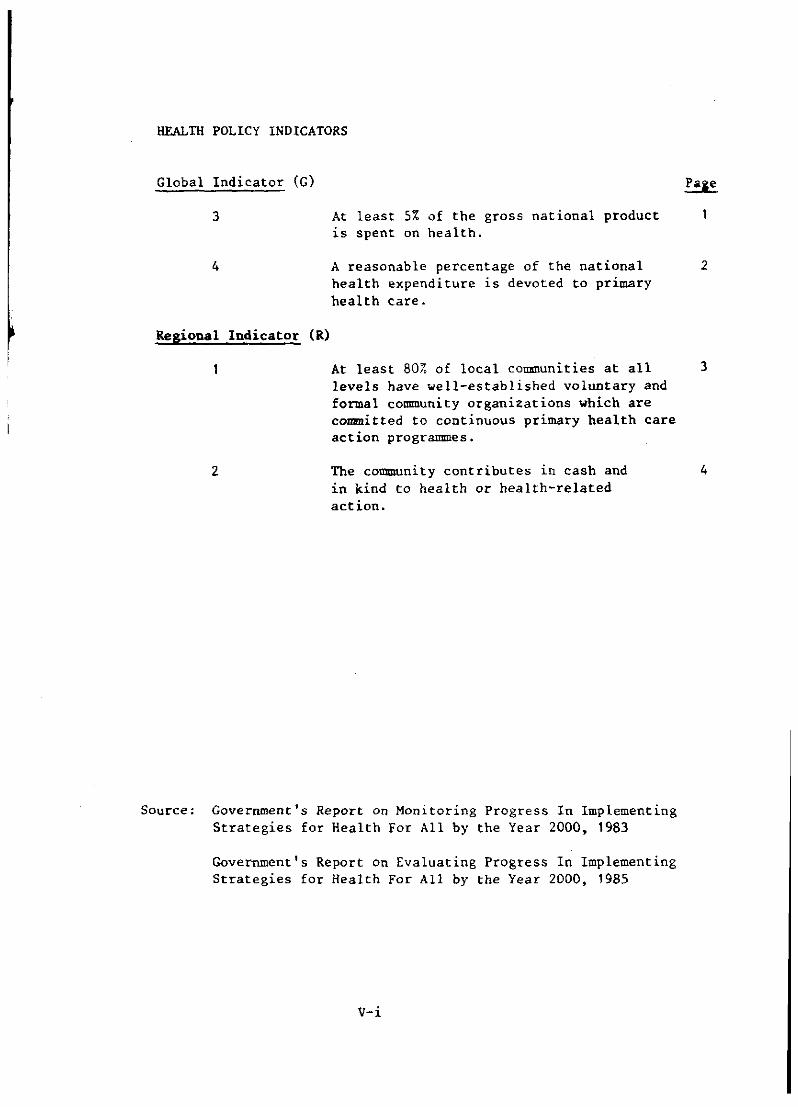
HEALTH POLICY INDlCATORS
Global Indicator (G) Paie
3 At least 5% of the gross national product is spent on health.
4
Regional Indicator (R)
A reasonable percentage of the national health expenditure is devoted to primary health care.
2
At least 807. of local communities at all 3
2
levels have well-established voluntary and formal community organizations which are committed to continuous primary health care action programmes.
The community contributes 1n cash and in kind to health or health-related action.
Source: Government's Report on Monitoring Progress In Implementing Strategies for Health For All by the Year 2000, 1983
Government's Report on Evaluating Progress In Implementing Strategies for Health For All by the Year 2000, 1985
v-i
4

SOCIOECONOMIC INDICATORS
Global Indicator (G)
7.1.1
7.1.2
11
12
Regional Indicator (R)
3
4
The percentage of population served with safe water in the home or within 15 minutes' walking distance is 100.
The percentage of population with adequate sanitary facilities in the home or immediate vicinity is 100.
The adult literacy rate for both men and women exceeds 70%.
The gross national product per head exceeds US$500 at current market prices.
The daily per capita calorie availability exceeds 2500 calories.
The daily per capita protein availability exceeds 70 grams.
v-ii
5
6
7
8
9
10
HEAL11l STATUS AND QUALITY OF LIFE I!;'1)ICATORS
Global Indicator (G)
8.1
8.2
9
10
Regional Indicator (R)
5
6
At least 90% of newborn infants have a birthweight of at least 2500 grams.
At least 90% of children have a weight for age that corresponds to reference values given in Annex 1 of the Development of Indicators for Monitoring Progress towards HFA/2000.
The infant mortality rate for all identifiable subgroups is below 50% per 1000 live births.
Life expectancy at birth is over 60 years.
Maternal mortality is below 3% per thousand live births.
No cases of diphtheria, tetanus, pertussis (whooping cough), measles, poliomyelitis, and tuberculosis occur.
v-iii
11
12
13
14
15
16-::1

INDICATORS OF THE DELIVERY OF HEALTH CARE
Global Indicator (G)
7.4.1
7.4.1
7.2
7.3
7.4.2
Regional Indicator (R)
7
The percentage of deliveries by trained health personnel is 95.
The percentage of pregnant women with at least three visits for antenatal care is 100.
22
23
The percentage of children immunized 24 against diphtheria, tetanus, Whooping cough, measles, poliomyelitis, and tuberculosis is 95.
Local health care including availability 25 of at least 20 essential drugs, within one hour's walk or travel is 100%.
The percentage of children up to at least 26 one year of age given routine child care by trained health personnel is 100.
The population growth rate is reduced to less than 1%.
V-iv
27

WESTERN PACIFIC REGION DATA BANK
ON SOCIOECONOMIC AND HEALTH INDICATORS
PART V GRAPHIC PRESENTATIONS OF GLOBAL AND
REGIONAL INDICATORS FOR WPR COUNTRIES/AREAS
COUNTRY / AREA
American Samoa Australia
.................................................... .... " .............................................. ..
Brunei China
.................................................................... ......................................................................
Cook Islands .... ,. ................................................ .. Democratic KampUChea .................... . Fi j i ................................... . French Polynesia .•..•••.•.•.•.•..•..•••• Guam ...................................................................... .. Hong Kong .............................................................. J a pan .................................................................... .. Kiribati .......... ,. .................................................. .. Lao People's Democratic Republic •••••••• Macao .................................................................... .. Malaysia .............................................................. .. Nauru ................................................................. .. New Ca ledonia .................................................. .. New Zea land ••••••••••••••.••••••••••••.. Ni Ue ...................................................................... ..
Papua New Guinea .............................................. .. Philippines ........................................................ .. Republic of Korea .............................................. Samoa .................................................................... .. Singapore ............................................................ .. So lomon Is lands ................................................ .. Tokelau .................................................................. Tonga .................................................................. .. Trust Territory of the Pacific Islands Tuva lu .................................................................. .. Yanuatu Viet Nam
.................................................................. ................................................................
Wallis and Futuna ..............................................
V-v
ACRONYM
AKS AUS BRU CHN COK DEM FlJ FRP GUM HOK JPN KIR LAO MAC MAA NAU NEC NEZ NIU PNG PHL KOR SMA SIN SOL TOK TON PTT TUV YAN VTN WAF

f.
WESTERN PACIFIC REGIO~ DATA BA.~~ ON SOCIOECONOMIC AND HEALTH INDICATORS
Part V Page I 30 December 1985
GNP SPENT ON HEALTH
AMS AUS BRU CHN COK DEM FIJ FRP GUM HOK JPN KIR LAO MAC MAA NAU
1983 (Y.) 1985 (7.) • 1983 (I.) 1985 (I.) • '3.2 : NEe
8: NEZ 7.3: 6.4: 5: 8: NIIJ
PNG "=' --:. I ..... "_, 1 4.1:
6.1: 11: PHL • , KOR 3.4~ ..... ". SMA 5: • ,
11.55 : SIN 2.7: 1.2: SOL 5!
4.4: 3.73: TOK 8: a: • TON 4.5: 4.5: ,
9: 10: , PH 9: , "" , TUV 9,,:3: 7 .. 7! -" •
10: 10: VAN 13.8: 3.59: 1.56: VTN
WAF
* IIIP O. HULTII
GLOBAL Ih~ICATOR 3 (G3): At least 5% of the gross national product LS spent on health.
Inl
1"5

7-
Part V Page 2 30 December 1985
WESTERN PACIFIC REGION DATA BANK ON SOCIOECONOMIC AND HEALTH INDICATORS
EXPENDITURE DEVOTED TO PHC
AMS AUS BRU CHN COK OEM FIJ FRP GUM HOK JPN KIR LAO MAC MM NAU
1983 (;;) ,
1985 (I.) , 1983 (I.)
, 1985 (I.) , , , , ,
10.3: , NEC , 20.6: , •• 45: NEZ It 34.4: 25.5: I 40: NIU , PNG 50: 46.7: , 45: 501 PHL 4.2:
KOR , 6.3: • SMA • 30: • , 41.41 SIN , • 8.6: • , ,
28: 16.9: SOL t I 50: • • 7.161 TOK 8S: 99:
• TON 25.3: 25.3: • 30: 10: PTT • 11.5: •
50: TUV • • 30: , • • VAN • 45: 50: • , 22.2: 21.9: VTN 55: 55:
WAF
GLOBAL INDICATOR 4 (G4): A reasonable percentage of national health expenditure is devoted to primary health care.
1M3 I,.

I,ESTERN PACIFlC Rr:c W:\ DATA 8.\);;: ,)); SOCIOECONomc AND lii:ALTIl lX!)lCATO!~S
Part V Page) 30 December 1985
I. COMMVN!TY I NVOL VEMENT
, , , ,
AMS AUS BRU CHN COK DEM FlJ FRP GUM HOK JPN KIR LAO MAC MAA NAV
1 '')83 (I.)
..... I c..
j :
: :
1';;85 (~~i 1'383 !'i.1 1985 ('f.)
~37 "
• • 95: 60:
100:
NEe NEZ NLU PNG PHL KOR SMA SIN SOL TOK TON PTT TUV VAN VTN WAF
Clft"URIT' liVelY.
77' . , 74:
100:
, !
: ' , :! i !: f! j : :' -::::'1" 11.·,i ... -:.:', .... 'i"'-:;l,-:-:'i~:-:' ;···-:ld,. ;··_·;..···;.1···-1
···+-!!tf·····t-···.;. , I; ,;' j "-:' i ' :;!
, i! : i
II
REGIOXAL INDICATOR 1 [R1J: At least 60% of local communities at all levels have well-established voluntary and formal community organizations, which are committed to continuous primary health care action programmes.
1903
"85

Part V Page 4 30 December 1985
WESTE~~ PACIFIC REGION DATA BANK ON SOCIOECONm!IC AND HEALTH INDICATORS
I. CONTRIBUTION IN CASH AND KIND
AMS AUS BRU CHN COK DEM FIJ FRP GUM HOK JPN KIR LAO MAC MAA NAU
1'383 (I.) 1985 (%) 1983 (i.) 19:::5 (I.) NEe NEZ ,
• NIU • , PNG • , PHL ''')-':1- I .... ' r,OR SMA 10: , SIN ,
• SOL , TOK TON
3: , PTT , 20: TUV
VAN VTN WAF
REGIONAL INDICATOR 2 {R2l: The community contributes in cash and in kind to health or health-related action.
1983 I,.S

PER CENT SA~E WATER
AMS AUS 8RU CHN COK DEM FIJ FRP GUM HOK JPN KIR LAO MAC MAA NAU
1'383 60!
'3:3.6 : 85:
10.7:
lOO! 99:
10:
100:
WESTERN PACIFIC REGION DATA B~~K ON SOClOECONOlUC AND HEALTH INDICATORS
83.:3: :30 :
100' 'j':;':
100; 70. '37:
NEe "'EZ NI)') i'~G PHL K(IR SMA SIN SOL TOil rON p~T I .
TU\' ',jAN VTN WAF
safE WAHR
1983
'39 .. 3:
75: 64.5:
:30: 100:
• • '31.3:
100: "-,1: J c..,_' I
?art V Page 5 30 December 1985
l'j:::5 100: 100:
64: 64.5:
C.,·-.l 1..' ....... 1
80: 100:
90. ':;' ~
'35: 60:
100: 45!
GLOBAL INDICATOR 7.1.1 (G7.1.1): The percentage of the population served with safe water in the home or within 15 minutes' walking distance is 100.
1913
1ge5
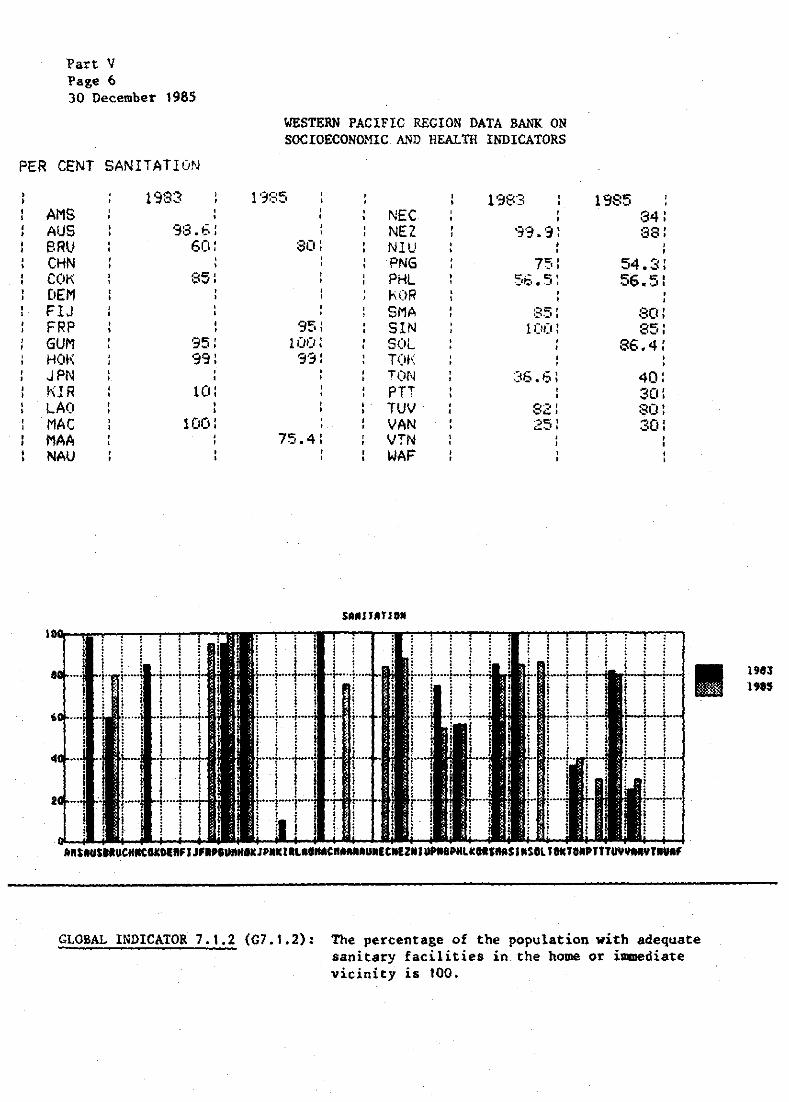
Part V Page (, 30 December 1985
PER CENT SANITATI(IN
1983 AMS AUS 98.6: BRV 60: CHN
, •
COK 85: (lEM FLJ FRP GUM '35: HOI, 99: JPN K1R 10: LAO MAC 100: MAA NAU
WESTERN PACIFIC REGION DATA BANK ON SOCIOECONOmC AND HEALTH INDICATORS
1'185 1983 NEC , , NEZ ·~'3. '3:
80: NIU PNG 75: PHl 56.5: kOR SMA 85:
95: SIN 100: 100: SOL
'3'3: T(lh TON 36.6: PH , , TUV 82: VAN 25:
75 .. 4: VTN WAF
1985 84: 88: , ,
54.3: 56.5:
80: 85:
86.4 :
40: 30: 80! 30: , , ,
•
GLOBAL INDICATOR 7.1.2 (G7.1.2): The percentage of the population with adequate sanitary facilities in. the home or immediate vicinity is 100.
1903 198'

;
Part V Page 7 30 December 1985
ADULT LITERACY RATE
79.5:
WESTE~~ PACIFIC REGION DATA B&~K O~ SOC IOECONOHIC &'1D IlEAL Til IND ICATORS
1 '3:::5 1 '3~:·.3 'JEe ,',E Z 3:3 :
:30 •. :: : ell 'j PNG 45:
100: PHL '30 : "OR ,-,C:: (
.,;. -' , 7'j : :3MA 'j::: : 8:j: SIN ~34
, , %.4 , SOL ,
1 '3~::5 32
~:::S. :
4S : 91) ;:;j
'j':, :=:5. ;2
, , 27.5
AMS AUS 8RU CHN C')K OEM FIJ FRP GUM HOfi J PrJ f\lR LAO MAC MAA NAV
86.9: T(lh, '3'3 :
100: 41 : '3(1: 72:
3~d ':OC'" , '-',-' , 'jO: 7'''' , ~,
TON 7:3.5: 7:::' • 2 PTT TUV '30: '35 \IAN \lTN '36 : 9E. WAF
ADUll L1lU.tv
GLOBAL INDICATOR 11 (GIl): The adult literacy rate for both men and women exceeds 70;;;,
, ,
,
,
II 1983
1985

Part \' Page 8 30 December 1985
WESTERN PACIflC REGION DATA HA:;K ON SOCIOECONOHlC AND HEALTH I~DICATORS
PER CAPITA GNP
1 '3:0:3 (US$) 1 '3:;5 (US$) AMS AUS 8240: BRU 'jD?: * 7t,I";, : CHN 2':'0 : 2':'(1 : (OK 100:,: : 'j:;cCt : OEM FlJ 18~50 : 1850: FRP 6780: 4700: GUM 4760: 4000: HOK 4350: 5';'40: #I.
JPN '018'30 : , , ~:IR 300: 47.45: LAO 83: 20.2'1 MAC 1500: 1 ~IOO ~ ~1AA 186::::: 1 '394: NAU
*Per capita GDP
NE': NEZ NLU PNG PHL k,)R SMA SIN SOL TOt<: TON PTT TUV \jAN VTN WAF
1'38:3 (1,)5$)
'3:,4 : 720:
1607: .302:
4200: 601 :
49'3:
446: 620: 500:
1 '3:35 1_: US$:i 537'3: 5000:
':I.~:::: : 5:1';':
1 :=::30:
6441 : 615 :*
:354: '3300 i**
3E·O: 52'3 : 500~
**"Cross Island Product" pt!r head in :.lortbl'rn Hariannsj [IS$1 100 - Fpderatecl St;tt~s of MicronesiiJ
IOOO,~----------------------.-------------------------------------------------, '50 900 850 800 750 700 650 600 550 500 450 400 150 300 250 200 150 lOG 50
..................... _........... . ............................................................................ .
............................... +. . ........................................................................... ..
................................ ,.. . ............... _............. .................... .. .................... ..
........................... -.........
A.$AU$BRUCKNtD.D[.FIJF.P8U."'~JPN.IRLA'.ACRA.'.U.[CN£2.IUP.'PNL~'.S •• SI.S'LTD.tO.PtTTU ••••• t.U.F
GLOBAL INDICATOR 12 (CI2): The gross national product per head exceeds U5$500 at current market prices.

~~STE~~ PACIFIC REGIO~ DATA Bfu~K ON SOCIOECONOmC AND HEALTH INDICATORS
PER CAPITA CALORIE AVAILA8ILITY
1 '383 (c a l. , . 1 ':':35 .: {a l. " : 1'383 (cal.) • • ;
AMS NEe AUS 2500: NEZ -344:3 : BRU 29!159; 295'3: NlU CHN 243':- : 2517: P"1G 2247: COl<: PHL 2211: DEM 1767: KOR 24E:5: FIJ 2'577: 2'577: SMA 3500: FRP 2738: 374:' SIN :';:074: GUM 1 9(1~, ~ 1905: SOL 212:3 : HOf<: 2211 : :3402: TOt<: JPN 2847: TON 2750: KIR PTT LAO 1842; 1842! TUV MAC 21:31: 21:',1 , VAN 2546: • MAA 2562: 2000: VTN 1850: NAU WAF
CALORIES
Part V Page 9 30 December 1985
1'385 (cal.):
3119r
2747: 2637: 2588: 3500: 3074:
2750: • • , ,
2546: 2000:
REGIONAL INDICATOR 3 [R3]: The daily per capita calorie availability exceeds 2500 calories.

Part V Page 10 30 December 1985
WESTERN PACIFIC RET ION DATA B&~K ON SOCIOECONOMIC AND HEAI.TH I~DICATORS
PER CAPITA PROTEIN SUPPLY
AMS AUS BRU CHN COK DEM FIJ FRP GUM HOK JPN KIR LAO MAC MAA NAU
98: 73.7: 73.7: 63.4: 65:
40: 56.8: 56.8: 69.5: 118.96: • •
80: 80: • • 78.'3: 99: 86.5:
47.7: 47.7: 57.9: 57.9: 46.5:
NEe NEZ NIU PNG PHL KOR SMA SIN SOL TOK TON PTT TUV VAN VTN WAF
1983 (9ms.): 1985 (9n,s.):
109.'31
45.:::: 41 :
7--' .-, , ';'. t, I
41.5: 84,,2: 41.9:
61.2:
€·8.4 : 4'3:
97
45 67.7 78.3 41.5 84.21
68.4:
REGIONAL INDICATOR 4 [R4J: The daily per capita protein availability exceeds 70 grams.
1983
".5

WESTERN PACIFIC REGION :WJ:A ;,ASK 0:; SOCIOECONOMIC AND HEALTH r;,DICATORS
Part \' Page " 30 December 1985
I. B1RTHWEIGHT (IF NEWBORN INFANTS
, , , ,
1 '3:::::3 ( ~1. ) 1 3:::5 C/,. 1'3:33 (%) 1'385 (I.) , , AMS 97. 1 : '='17 .4: NEC 9':. .:. 1
~ • '",,' I
AVS '34.2 : NEZ ':14.2: '34.::< ~ BRU 'j:? ! 'jCl: N1V CHN '34: PNG 7f;:"1 -' , 75: COK '36.8: 98: PHL 80 .. 5: 84.6: [lEM KOR 'jO.:3 : '30.::: : FlJ 86.1 : :36.1
, SMA '3:::.5: ';;7.6: , FRP 92.7: SIN :=::3. ::: : '32: GUM '31.3: '32.4.: SOL HOK '31.9: 95. i::: TOK '34. 6 ~
JPN '34.'3: TON '36 : 98! KIR , E:2: PH 93.3: , LAO 82: 60.7: TVV 36: 97: MAC 93.4: VAN ';'5. :3 : 95.3: MAA 91: 'jO: VTN 9,")1 <- , 75: NAU WAF
• IIRTHVEI&MT
GLOBAL INDICATOR 8.1 (G8.1): At least 907. of newborn infants have a birthwei&ht of 2500 crams.
1983 1985

l'art V Page 12 30 December 1985
WESTERN PACIFIC REGION DATA BANK ON SOCIOECONOMIC AND HEALTI! INDICATORS
X WEIGHT FOR AGE
AMS AUS BRU CHN COl<: OEM FlJ FRP GUM HOK JPN KIR LAO MAC MAA NAU
1 '383 (!.) 1985 (Xl
so: , , , ,
, , , , , , , , , ,
NEe NEZ NlU PNG PHL KOR SMA SIN SOL TO/{ TON PH TUV VAN VTN WAF
, , , ,
1983 (X) , , 90:
:::2.:3 :
96.7:
1985 (X)
90: , , 80ft
82.8:
97: , ,
5.4: 80:
77: 86:
*Incidence rate of children 1-5 years; 72% for children under 1 year
GLOBAL INDICATOR 8.2 (GB.2): At least 90% of children have a weight for age that corresponds to reference values given in Annex 1 of the Development of Indicators for Monitoring Progress Towards Health for All by the Year 2000.
1913 aes

WESTERN PACIFIC REGION DATA BANK OX SOCIOECONOMIC AND HEALTH VIDICATOES
Part V Page 13 )0 December 1985
INFANT MORTALITY RATE
, , , ,
1983 (I.) , 1985 (I.)
, 13S:~ (~~ :; , 1985 (I.)
, , , , ,
AMS 16.7: 5.8; NEe 21. '3: AUS 10.6: , NEZ 1 E.: 12.5! , BRU 15.8: 1~' ." , NIIJ .;.., • , I , CHN 4"" 34.7: , PNG 7.3: 7-:.0 1
,:;., , '- , COK 38.5: 16.4: PHL 51: 58~ DEM 160: KOR :32 : 34.2: FIJ 35: 22 .. 5: SMA :35: :35: FRP 47: 22 .. '3: SIN 10.E: : 9.4 : GUM 10.6: ":I. 1 : SOL 46: 46: HOK 9.'3: '3. 1 : TOK 44.4: 28~ JPN 8: TON 21.7: 11.1 : KIR 87: PH 29; 17.6: LAO 124: 104: TUV 37.5: 45.6: MAC IS: 14. 1 : VAN 45: 75: MAA 24.9: 19.3: VTN 34.7: :33.5 : NAU WAF
I ., ......................................................................................... _ .. _._ .... .. 15 ....... · .... ·· .... · .. · .. · ..................... · .... · .......... ··· .... ·· .... · .... ·· .. · ........................................................................................ · .. · ...... · .... · .. · .. · .... 1 Iq~·· .. · .. ·· .... · ...... · ..................... ·· ...... · .... · ...... ·· ...... ·· .. · .......... _ ..................................................... _ ................... _ ...... _ ..... _ .. --; IJ ....... · ...... · .... ·· .... ·· .. -~···---.. · .... • ...... - .... · .. · .... • .. · .. · .. ·· .. - ....... --.............................................................. --.................. --~ .,
• III 5 ..... ...................... ·· .. · .. t .... · .... ," .... · .... · .... · ...... · f·.. .... ........ " ~..il........... iii •• · ...... · .. · .... · .... · .. w ..... · .... ·, ..... ·· .... ·· .. · .. ······ f·.. ,................................. f.· .. : .. ::::· .. ·....~.. f41'· .......... -I
q· .. · .... · .... I ........... ·IO·· .. ·-.a .... :· ~ ~,~ I ~= ~==:':.~~=~=;;;.~.JiI.~~:"~ .. 'IUP • .,.III.KIIII$ .. SJ.S.lT.KTOIIPTTTU'Y •• VT.~
Ual
."$
GLOBAL INDICATOR 9 (G9): The infant mortality rate for all identifiable sub-groups is below 50 per 1000 live births.

Part V Page 14 30 December 1985
LIFE EXPECTANCY AT BIRTH
1 '3:3:3 (YRS.): 1 '3:35 AMS 70.1 : AUS 74.5: 8RV 70.1: CHN 66 .. 5: COK E.4 .. 3: [lEN 43.5: FlJ T'" '-, FRP 61: GUM 74.5: HOI<: 75; JPN 76.5: KIR 52: LAO 49.5: MAC 65: MAA 69.5: NAU
*Peninsular Malaysia only **Micronesia
WESTERN PACIFIC REGION DATA BA.';K ON SOCIOECONOMIC AKD HEALTH INDICArORS
(YRS.): 1983 (YRS.) : 70.1 : NEC , ,
NEZ 60: 70: NIU
67.'3: PNG 57: 67: PHl t.4.5 :
hOR fiE. : 6 ... · ... " ,:,:"".>. SMA 62 .. 5: 66 .. 6: SIN 71 .. 5 : 72.1 : SOL 54: 75.4: TOK 54!
TON 58~ , PTT 58t , 4 - , ,=" TUV 5:3.5: 65: VAN "''''' ... ',_1 t
70.1: .. VTN 63.5: WAF
Llf' (.P£C".'Y 'IS
1385
GLOBAL INDICATOR 10 (GIO): Life elCpectancy at birth is over 60 years.
(YRS.) : 6:3.8; 73.:3! , ,
58: 63.7: 65.'3:
64: 71.5:
54: 54: 60: 64 :,,;.
58.5: 55:
63.5:
I'll 1945

Part V Page 15 30 December 1985
WESTERN PACI!'le RECION DATA BANK O~1
SOCIOECONOHlC A.'iD IIEALTIl I~DICATORS
MATERNAL MORTALlTY RATE
19:33 CO , 1 '38-:1 (!. .l 1983 (I.) l'j85 (I.)
, , , AMS 0.91: NEC 1 .. 6 : AUS 0.01 : NEZ 0.115: 1 .. 6 : BRU 0.17 : 0.46: NlU CHN PNG 1 .. 3: , , COK 0: 1 : PHl 1.42 : 0.8: DEM KOR 0 .. 42: 0.34: FlJ 0.82: 0.032: SMA 0.2: 0.41 FRP SIN 0.1: 0.2: GUM 0.3: 0.314: SOL 0 .. 1 : HOI"( 0.01 : 0.06: TOK 0: JPN 0.204: TON KIR 0 .. 1 : , PTT 1.57 : , LAO 0.02: • TUV 0; 2.5: • MAC 0.4: 0.4: , VAN 1 .. 1 : 1.07 : , MAA 0.63: O.5~· VTN 1 : 1.1 : NAU WAF
*l'eninsular Halaysia only
InitiAL .o.alItY • l ! ;
, , , ; ; ; ;
, , , , ,
, , II ; : , 2.!~···!"··i .. ····i· .. ·i .. · .. i .... +·· .. ! .... ·i· .... i· .... ! .... !· .... !·· .. ·! .. · .. ! .... ·,· .... ~· .. ·i ..... ; .... ; ...... ; ..... " .... + ..... ; ..... ; .... ! .... + .... ; ... -;
;
, ! , , , , , ,
: i
, i
0 . ~ . .. , .... I .... ,
')1'''' I UJ: lJIi i. !a
Ij
:'j ;'! I:' ...... , ..... i .... i· .. + .... : .. · .. I··· ... · .. -l .. ·· .. i .... ·; .... ·HIHl! .... ····· .;;; , fl· .. ·
L. ~; '.' 'i ... ,.... .j .
i j~; .. i ' . ~ i';;;t::::~~~:.:~;t.~~~;:=.KlU"O$I"'elT .. ' .. 'fllUYY ••• TI»A'
REGIONAL INDICATOR 5 [RS]: }~ternal mortality rate ~s below 3 per one thousand live births.
1'83 1915

Part V Page 1 b 30 Decelllber 1985
NO. OF OlPHTHERIA CASES
No. (1'3:33) , No. , AMS 0: AUS 1 : BRU 0: CHN COK DEM FIJ 0: FRP 0: GUM 0: HOK 1 : JPN 29: "OR
--:, , <-.
LAO , •
MAC 0: MAA 7: NAV
, ! : : :
.hh. • : • ... , j
:~ •. :
••• ••• . . .. ., .....
j
1 'MI,
WESTERN PACIFIC REGION DATA BANK ON SOCIOECONomc A.'1D HEALTH INDICATORS
( 19:35) , No. <1'383) , No. , , CI! NEC 1 : NEZ 1 : 0: NIU
3418: PNG 0: 0: PHL 1275:
KOR 0: SMA 4:
SIN 6: 0: SOL 0: TOK
20: TON 0: 0: PTT 0:
30: TVV 0: 0: VAN (I:
17 : • VTN 2065: • , WAF •
,."s PI~"I"I.I. .l. : .. \ . ' .. L '.L : I , ; I .. +.; ..... ; .....
i
,
:
• . ... i .. ··· • .: :
fl. ...... w~ ... ,
REGIONAL INDICATOR 6 (R6]: No cases of diphtheria occur.
(985) 0: -,,:. I <- , , , 0:
29'35: 16:
0: 0: 0: 0: O~ 0: 0:
1480;
, . ... ! ••.• ,
~ ... ,.. ..
; ..... ~ .... '-
,w.wr
II _G. <l98l
.... (I'"

NO. OF TETANUS CASES
No. 0'383.1 No. AMS AUS 11: BRU 'J ~ CHN COK OEM FIJ 1: FRP GUM 0: HOK 22: JPN :36: KIR 3: LAO MAC 3: MAA NAU 0:
WESTERN PACIFIC REGION DATA BANK ON SOCIOECONOMIC AND HEALTH INDICATORS
( 1985) No. (j 9$31 O~ NEe
11: NEZ '" -' , 0: NIU , ,
PNG 28: 0: PHL 1427:
KOR I : SMA 0:
SIN SOL
46: TOK 0: 56: TON .:' ,
~,
PTT 0: :31 : TVV 0:
6: VAN Ot VTN 'j72 ( WAF
Part V Page 17 30 December 1985
No. t. 1985") .) I ,_, I
7' , ,
39: '30'32:
C" , "_, 1
, , :3: 0: 1 : 0: 0: '" "-' , 1 .-. , .;.,
,.: :' !
2·:~t::::::::J:::j::::::::::t:::t::::j=:::j:::::;::::j::::::::::r:::t::::t::::r:::t:::::::::::::::::::::::!:itF::::!::·::·:::.:::;':::;::) .... :j ...... ; , ..... j ..... ;, ...... ;'; .. .. 26 , ... , ...... , ..... " ..... ; ... + ... , .... · ..... ·1
,
l::::.::::~:::::!:::::1::::·:;.::::::::::~:::::t.:::~:=:,t::::t:=:t=::~::=:t::::1::j:::::t::±:::j::::t:::
tt:::tt:::~::::::,:::::l:::::t:::~~::~::::' t::;:::: ".w.,
~EGJONAL INDICATOR (, [R6j: No cas .. s of tetanus occur.
MO. (lUl)
••• <I~85)

Part V Page 18 30 December 1985
WESTERN PACIFIC REGION DATA Bfu~K ON SOCIOECONOmC Mm HEALTH INDICATORS
NO. PERTUSSIS CASES
No. ( 1 '3(3) , No. (1985) , No. ( 1983> No. (l98~, ) , ,
AMS 1 : 0: NEC '3: AUS 196: 196: NEZ 0: BRU 0: 0: NIU CHN 215965: PNG 743: 2656: COK 0: PHL 32'36: 19869: DEM KOR 1854: FIJ 11: 5: SMA 10: FRP 8: • SIN , GUM 0: 0: SOL 0: HOK 1 : is: TOK ,
0: , JPN 2815: 2459: TON 258: 4: KIR 17: 0: PTT 0: 451 : LAO , 1813: TVV 0: 0: , MAC 4: Cil VAN -':0 t
~, 238: MAA s:·n 57: VTN 48624: '~2: NAU II' - , WAF
220001~-:-;'--""'--'!-'-I-,r, -:,-;,r-T!-;;--,,-;,--.!-;,-;r-T!,--,r-T,-;!r-',-;,--"-;'--'!-;,--!r-Tl--';-T,--,~ 20000 .... I ..... L····I.. i .... ·i .. ···i· .... '· .. ··!··· .. ! .... ·:··· .. i.· ... ! .. · . .i .... ~ .. ·.·!.... .. .. ; ..... ; ..... 1·· .. ·i.. .. ·l .. · .. 1 ..... 1 .. · ... ·· .. ·,.· ... ; ..... I· .... ! .... ~ ..... ! ..... ! ....
! j , i I I I I i 'j ! i I ! i !!! i ! i ; ! ! ! ! ! i ! ! 180001 .... I, • .... 1 .. ''';,,'' i· .... · .... 1· .... '· .... 1 .... ·, .... · ..... , ..... 1 .... ·1 .. ·+ .... , .... · "'1' ..... j ..... j .... + .... , ... · .. i·····! .. ··.,. .. ··j· .... j·· .. ·j .. · .. j· .... j .... ·j· .... j· .. ·
. . • t. ......'..".. 160001 .... 1 ..... 1 ..... ; .. I .... ·! .... ·I·· .. ·I· .... ! .... ·I .. ··+· .. ·I··· .. I .. · .. ! .... ·! .. · .. I· .. · , .. ·I ... ·+· .. + .... !· .. ··! ..... !·· .. ·I .... +.· .. , .. ·+ ... -!-- ... ! ..... ! .... -1 ..... i .....
iiI I I I I I I I I 1 I I .:,. I , , , : ' • • : , :
140001 .... ( ... ! ..... [.. i .... ·'· .... /· .... j· .... / .... ·, .... ·j····T .... /· .. T·· · .. ·l·.. ·+· .. 1 .. ·+ .. + .... , .... ·; .. ·+ .. ·+· .. ·; .... ·;· .. ..;.··..;. .. +·+·..;. .. .. 120001 .... [ ..... [ ..... [. !· .. ·t .. + .. ·!· .... ! .. ·-+· .. ·r .... ~· .. i .. · .. t···t .... l.... .. .. l .. · .. l· .... l· .. ·'!' .. ·l· .. t·· .. ;· .. ··;··· .. ; .. ···;· .... ; .. ···\· .... t·· .. ·t .... ·; .... · 100001 .... ! ........... ,.. ..···t .... ·!· .... ' .... 1 .... ·!· .. ··t-·· .. r··T··r·' .. ·-! .. · .... 1 .... ••·• ...... · .. ,-.. ·' .... 1-· .. ' .... · ... · ..... · ..... · ... ·_· ..... ·, ........ · ....... . auooe .... L .... L ... L.'; ··.·.f· .. ·.L ... L.~ .. L._ •.. u.L ... ~_ ... i ..... ~_ .. .i.-..i ......... j ..... L ... L .. ,L .... ' ..... i ..... L .. .L .... : ..... L ... L ... ~ ... ..l ..... L ... ~., .. .
iii " j i ~ : I j I j i j ,: : 1 iii i i ! iii iii i 60001 .. ·T .... ' .... ')" t .. r··' .... t .. + .. 1 .... r .... I· .. --r .... r .. ·r-.. · ...... · .. ·! .. · .. l· .. ··!" .... I .... T .... ! .... ·!·····'··· .. I· .... ~ .. ·r-.. ·t· .. ! .... 1 ..... j .... . 40001 .... I .... ·! .... ·!.. !· .. ·++· .. t .... ! .. · .. ~····!· .. -+ .. I ..... t~ .... i!· .. ·-t-r .... tl ..... ! ..... ·· .. l .. ···i·· .. ·i .... ·i· .. ·-:- .. ·-r·· .. !· .. ·r··i .... ·t .. ··i· .... ! .. · .. : .. · .. j .. ; .... . 2000~ ····,··· .. t·····t· .. --i~ .. ··T·· ... )n ......... ........ ···t···· ··"t .. ···!·····t·_··t· ····"!*"···t·····!"····!·····t·_·r-··!"'··-r--- .! ... ..
. ! ! . . t ! l ! , • :! ! : ~ • ~ : : : : ! ! ! • :
REGIONAL INDICATOR 6 [R6J: No cases of pertussis occur.
10. 11983 Ie. 0,.5

NO. OF MEASLES CASES
AMS AUS BRU CHN COK DEM FIJ FRP GUM HOK JPN KIR LAO MAC MAA NAU
No. (198:3) • •
. ? • .... 775:
705: 1187:
9: 1863: 6715:
11: , , 0:
7073: 1:
No .
WESTERN PACInc REGION DAri\ BA.'1K ON SOCIOECONOMIC AND HEALTH iNDICi\TORS
( 1985) 0:
556: 619709:
4: • •
827: 113: 104: 678:
7281 : 0:
924: 110:
8147: 1:
•
NEe NEZ NlU PNG PHL KOR SMA SIN SOL TOK TON PH TUV VAN VTN WAF
'.SES "E.SlU
No. ( 1983)
0: 0:
10583: 23676:
7: 1965:
0: 13:
1 : 0: 0:
59300:
Part V Page 19 30 December 1985
No . ( 19:'::5) 7'j:
10023: 672:35;
2246:
2417: 23~3 :
0: 5: 0: O~
16:34: 551 :
4:
"ooo~-;-:--,-:--:-:-;--.-.--;-; __ ,-;--:-;-, __ ,-;--,-:--,-:--:-;-; __ ~-:-;-:--,-:-,
== ti:f- ftf.lt$1?~~1'tri.':··:. :::f:::I=:::r.:::1::::1:::::I:::::l:::::;::::··:::::i:::]:::fTl::}:::111 :::::: · .. T· .. '!' .. ··!' I ..... j ..... ! ..... , ..... , ... --!-.... , ... --;--. ..;. .. + .......... ,.... ::I::~;::·::;:::::;:::::c::;::::::·:::r:::;::::~:::::::::::;::::~:::::;:::::;::.:: '. :~:t~~:l~:::::: 1 "'"
~:::: · .. ·i· .. ··1 .. "'!' 1:::::1:::::1: ::: :1:::::1:: :::1:::::1:::::1':::1::=:1:::::1:::':['·::· :: ::1:::::;:: . ::1: ::: :1:::::/:::::;:: :::1:·: ::i:::::;-::+:: :r:' ;:: :::/:::::r: ::'~:': .. ::::: ... , ....... :"-r- . I. '::1::::,'. :::::11, : ::::'1' :::::'1' :::::1,:::::',:::: ::',' :::::1" :::::,1. :::::1", ::::. :T::: ',;::: ::,1.' :::::'" ::: ::',' :::::r", . ::::',.::: :::::: ::.C::f,:::::'!<::::~,'. ::::::.:: ::::.~.' ::: ::. : :::: '. ~~::t::t:::t. .. I r
:::::: I 1 ; !::::t::I::::l::::I::::1::::II:::':\::::I:::::I:::41:::::\::::: .:::!::::t::::I::::t::::ft::::t:::::::::(r:::f:::-t: .. :f:::'t:J:::j:: .. 5000' ::::~,:::::i.i.:::J,:: I ; : • I; ,1 ..!. I .... ! 1 ! . : , ! , ! .! •. ;
','L-~~~Lijr_"_"~!"_"+'r_"~"'~"_"'~!'_"'~'!~"'_"~r_"'~'I_' .. _ .. ~! .. _ .. +·r_ .. ~ .. I~ ... _ .. ·~r_ .. j·L·_··'~:_ .. ·~·!_ .. _· .. ~r ... ·~·j.Jg~fl"_"+·j_·"_"!~"~"+T_"~"!~"_"+'i'~"~"T~"~·"~!'_·"4·1_ .. ·_ .. ~JLj~·4·i~· .. ~ ..
• ftS.US.RUCHIC .. OI""JFaPlUftH •• 'P •• '.L •• I.' ••••• U.'C.EZ.'UP ... KLk .. S".SI.SllTOKTI.PTTTUVV •• VT.UAF
REGIONAL INDICATOR 6 [R6j: No cases of measles occur.
Ik>. 11983
Ik>. ",.5

Part V Page 20 30 December 198$
WESTERN PACIFIC REGION DATA BANK ON SOCIOECONOMIC ~\~ HEALTH INDICATORS
NO. (IF POLIOMYELITIS CASES
No. 0'383) • No. <198'5) • No. ( 1983) , , • , AMS 0: 0: NEC AUS 0: • NEZ O~ •
• BRU 0: NIU • • CHN 1626: PNG 16: •
COK 0: PHL 256: DEM • I KOR • • • FlJ 01 01 SMA 0: FRP 11 • SIN 1 : • GUM 01 01 SOL • • HOK 01 0: TOK 0: JPN 11 0: TON 0: KIR 0: 0: • PTT 0: • LAO 13: • TUV 0: • MAC 01 VAN 0: MAA 5: 2: VTN 8'32: NAU I WAF
'aSIS ptlll"'£lITIS
; , !
. ,
.-......... It
REGIONAL INDICATOR 6 [R6): No cases of poli~elitiB occur.
No.
...
(1985) 0:
:;:1 ~.
740: 0:
':' I ... 0: 0: 0: 0: 0: (II
23:
;
, ... , ...... , .... i--'
i-
II ... (1983 ... (I'"

NO. OF TUBERCULOSIS CASES
No. (1983) , No. , AMS 4: AUS 1169: 8RU Z,..t$5 : CHN COK OEM FlJ 115: FRP 67: GUM 44: HOK 7527: JPN 66600: KIR 62: LAO MAC 233: MAA NAV 8:
1 ~~~ } : "T ,
• T
I \'
, I
.~~ ::::
~~~~
:: : ,
~J
WESTERN PACIFIC REGION DATA BANK ON SOCIOECONmliC AND HEALTIl INDICATORS
( 1985) • No. <19:::3 ) • 10: NEe
1169: NEZ 434 : 249! NIU 2: , PNG ,
291 PHL 6182'3: , KOR • • , 1651 SMA 'j',=>'
'-""' 68: SIN 2080; 54: SOL • ,
7843: TOK , , 63789: TON 45:
PH 1"')":1 ' '-"'. 65281 TUV 1 -J I
~.
671: ~AN 35: VTN
81 WAF
'AS'S TUlrICUleSJ$ , T •
! , , I , ;
i i
I i
l····
iI ....
Part V Page 21 30 December 1985
No. ( 1985) 112 : 404:
·-,1 ':':'1
6208: 14046:3: 136372:
:33: 2143~
5:32: 0:
46: 88:
'3: 1 t;':t : 631 :
14:
! , -, , : , , i
; ;
: i
:
:
lTDKtD.Ptttuv¥aIVY.VAF
REGIONAL INDICATOR 6 [R6J: No cases of tuberculosis occur.
10. <1903 ... (1985

Pan V Page 22 10 December 1985
WESTERN PACIFIC REGION DATA SANK ON SOCIOECONOmC AND HEALTH INDICATORS
:~ DELIVERIES BY TRAINED PERSONNEL
1983 (%} • 1985 (X) 1983 (%) 1985 • AMS 96.5: • NEC • AUS 98.6: • NEZ • 8RU 85.3: 32: NIU CHN PNG COK 100: PHL OEM KOR FlJ ':i7.2 : , SMA C'.~ I • -.'':':' I
FRP 100 : , SIN • GUM 99.9: ,,9.9: , SOL • HOK 99.5: 99.5: • TOK , JPN TON 85.5~ KIR PTT LAO • TUV tOO: , MAC VAN 8.0 : MAA 82: VTN 100: NAU WAF
II HlIY.IIU
00
99:
33.5~
65; 5'" ~.
99.8t 8Ct~
60: €IS:
100: 7"" ....
100:
GLOBAL INDICATOR 7.4.1 (G7.4.1): The percentage of deliveries by trained health personnel is 95.
1983 1"5
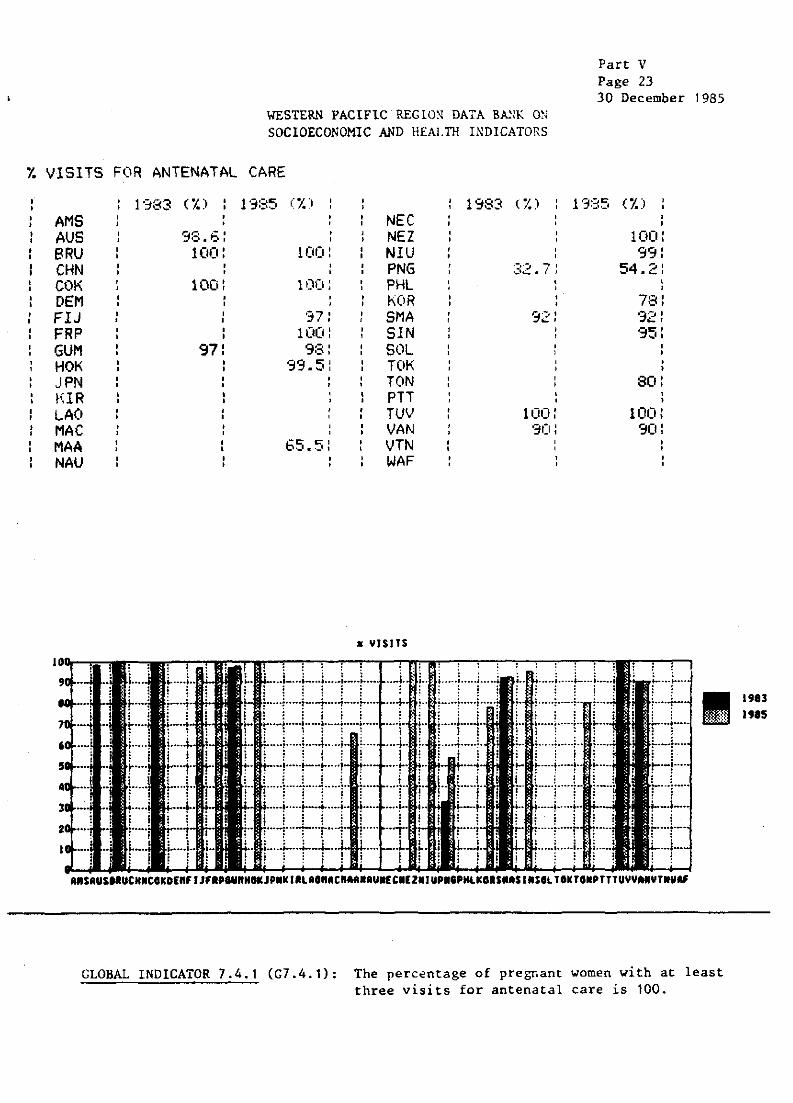
WESTERN PACIFIC REGiO)! DATA BA!iK O~i
SOCIOECONOMIC AND HEALTH I~DICATORS
Part V Page 23 30 December 1985
i. VISITS FOR ANTENATAL CARE
• • , , • ,
AMS AUS 8RU CHN COK DEM FIJ FRP GUM HOK JPN fUR LAO MAC MAA NAU
1'''183 (I.)
98.6: 100:
100:
• • 97:
• , , I
l':i8!'5 (I. :1
100: , , 100:
'37 : 100:
9:3: '3'3.5:
65.5:
1983 (I.) 1 '3:35 (I.) NEC
I NEZ 100: • • NIU 99: •
PNG .-,",) -. I .,:.~ • I I 54.2:
PHL KOR 78: SMA 92: '32: SIN , 95: , SOL TOK TON 80: PTT TUV 100: 100: VAN '30: 90: VTN WAF
• YISITS
GLOBAL INDICATOR 7.4.1 (G7.4.1): The percentage of pregnant women with at least three visits for antenatal care is 100.
1983 19.5

'l.
, , , ,
Part V Page 24 30 December 1985
~~STE~~ PACIFIC REGION DATA BANK OK SOCIOECONOMIC AND HEALTH INDICATORS
IMMUNIZATION ( DPT. Po l i 0 • T8. Mea$les)
AMS AUS BRU CHN COK DEM FIJ FRP GUM HOK JPN KIR LAO MAC MAA NAU
1'383 (I.) , 1985 (%) ,
56: 100 NEe NEZ
95: % NIU PNG , 85 PHl , , KOR ,
71.2, SMA '35: SIN 84:* SOL , 85: 90.7: TOK , , TON ,
PH TUV VAN
69: VTN WAF
*Diphtheria-tetanus-whooping cough-measles **6 years old
I< III.,UlIllATlOII
1983 OP 1385
77.5:
64:
64:
00 , , 98 :*,(
72.3:
52.3; , , 57.1: 86.4:
84: 87:
80: 64.5: 80.8:
36: 60:
GLOBAL INDICATOR 7.2 (G7.2): The percentage of children immunized against diphtheria, tetanus, whooping cough, measles, poliomyelitis and tuberculosis is 95.
1983 1985

I.
• • , •
Part V Page 25
WESTERN PACIFIC REGlON DATA BANK ON 30 December 1985
SOCIOECONOMIC AND HEALTH INDICATORS
AVAILABILITY OF LOCAL HEALTH CARE
1'~83 ( ".) 1'385 (I.) 1983 (I. ) 1385 (I.) AMS '35: 100: NEe 100: AUS • 98.6: NEZ 100: • BRU • 98: 96: NIU • CHN • PNG 7C-' 93: • -' . COK 100: 100: PHL OEM f\oR 80: FlJ 100: SMA 88: 100: FRP 80: SIN 100: GUM 98: 100: SOL 58.2: HOK 99: 39: TOK 99: JPN TON 86.:3: 80: KIR 10: 95: PH 95:** LAO 66.7: TUV 100: 100: MAC VAN 80: 80: MAA '33 jt VTN 75: NAU WAF
*Rural **Within one hour's travel; 70% have access to 20 essential drugs
• LICit NIALlH CARE
GLOBAL INDICATOR 7.3 (G7,3): Local health care, including availability of at least 20 essential drugs, within one hour's walk or travel is 100%.
1983 1915

j(
1 1 I 1
Part V Page 2& 30 December 1985
WESTERN PACIFIC REGION DATA BANK ON SOCIOECONOMIC AND HEALTH INDICATORS
CHILD CARE UP TO 1 YEAR
1'383 (j() 1985 (I.) 1983 (7.) 1985 (7.) AMS , NEC 100: , AUS 98.6: NEZ 100: BRU 100: 100: NlU CHN PNG 97.3: 17.6: COl< 100: 1001 PHL DEM KOR FIJ SMA 7"" ... , 97: FRP 100: SIN , 79 • GUM SOL • • HOK • '33.5: • TOK • • • • JPN • • • TON • 40: 70 • • • • KIR • PTT • LAO TUV 100 MAC VAN MAA VTN 90: 90 NAU WAF
GLOBAL INDICATOR 7.4.2 (G7.4.2): The percentage of children up to at least one year of age given routine child care by trained health personnel is 100.
1"3 .,.5

WESTE~~ PACIFIC REGION DATA SANK ON SOCIOECONOMIC Al'iD HEALTH INDICATORS
ANNUAL POPULATION GROWTH RATE
1983 (I.) ,
1385 (I.) 1983 (I.) , , ,
AMS 1 • '3 : NEC AUS 1.6: NEZ 1 • 1 : BRV 3.4: 2.5: NIU CHN 1.4 : 1.3: PNG 2. 1 : COK 1.6: 1.6: PHL 2.4: OEM 2.9: KOR 1 • Eo : FlJ 1. s: 1.8: SMA 0.8: FRP 3.03: SIN J .2: GUM 2.6: 2.2' SOL :3.4: HOK 1.5: 1 TOK JPN 0.7: TON 1.6: KIR 2.2: 1.7 PTT 1. ':1: LAO 2.5: 2.'3 TUV oj .j 1
0:......'-1
MAC 2.8: 2.8 VAN 2. '3: MAA 2.5: 2.7 VTN 2.3: NAU
, WAF , • ,
,., '.'¥T" Ian
Part \' Page 27 30 December 1985
1985 (I.)
1 • :3 : 1 • 1 :
':0 '';, I '- • 0_' 1
2.4: 1.57 : 2.1 : 1.1 : 3.4: 1 '0' . '- ;
0.9: 1. '3; 1.5: 3.2:
2.34:
REGlONAL INDICATOR 7 [R7J: The annual population growth rate is reduced to less than IX.