what did we learn from the add my pet data base?
TRANSCRIPT
What did we learn from the Add_my_Pet data base?
Brest, 2019/04/10-12 https://deb2019.sciencesconf.org Chaetonotus zelinkai shares with DEB applications that
it is very common, but few biologists heard about it

Contents
• What is AmP? • Why AmP? • Reasons to let AmP grow rapidly • AmP 2017 vs 2019 • What did we learn in 10 yr AmP? • AmP use • Future developments
2019
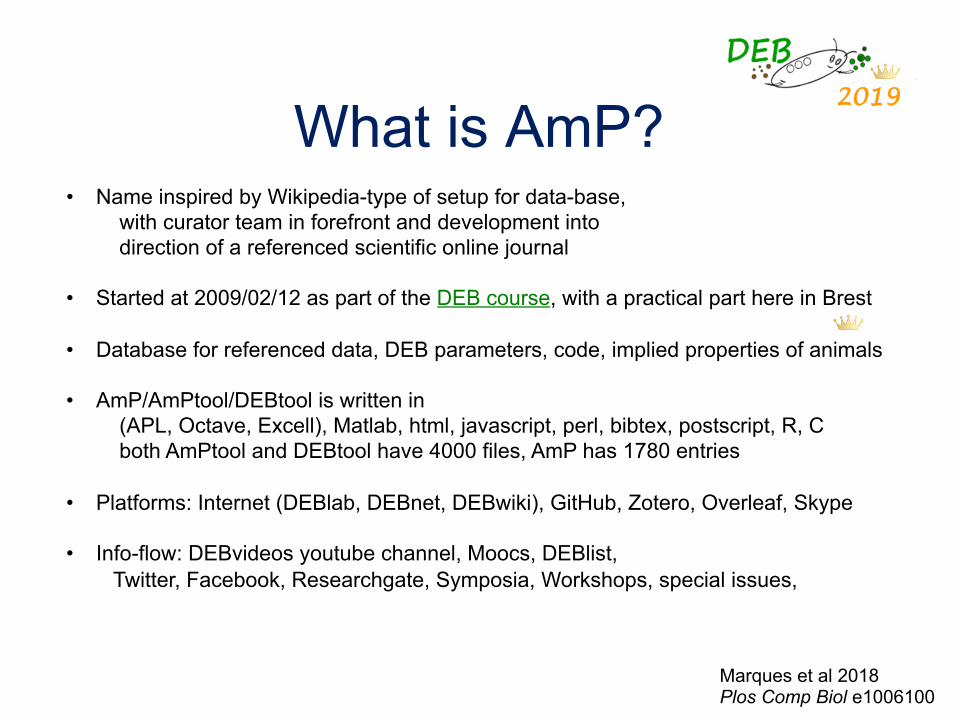
What is AmP? • Name inspired by Wikipedia-type of setup for data-base, with curator team in forefront and development into direction of a referenced scientific online journal • Started at 2009/02/12 as part of the DEB course, with a practical part here in Brest • Database for referenced data, DEB parameters, code, implied properties of animals
• AmP/AmPtool/DEBtool is written in (APL, Octave, Excell), Matlab, html, javascript, perl, bibtex, postscript, R, C both AmPtool and DEBtool have 4000 files, AmP has 1780 entries • Platforms: Internet (DEBlab, DEBnet, DEBwiki), GitHub, Zotero, Overleaf, Skype • Info-flow: DEBvideos youtube channel, Moocs, DEBlist, Twitter, Facebook, Researchgate, Symposia, Workshops, special issues,
2019
Marques et al 2018 Plos Comp Biol e1006100

Why AmP? • the world is at risk: we urgently need to get better control on sustainability (apply DEB theory via AmP) • Why would you want to know the name of a species? To google for properties! (ticket to existing knowledge) Why would you want to know DEB parameters of a species? To predict properties (that were not measured before)! • get pars by fitting multiple data sets simultaneously (κ: growth & reproduction) • comparison of species on the basis of parameter values • develop tools to avoid good fit for wrong reasons (learning in practice, pseudo-data, context) • DEB course exercise to stimulate post-course applications (targeting PhD students)
2019
Fundamental difference between description and analysis

AmP entries & fit 695 @ 2017/06/01
1812 @ 2019/03/30
2017/06/01
2019/03/30
2019

Reason to let AmP grow rapidly • understand variation in parameter values ([p_M] = 1400 J/d.cm^3 for daphnids, but 20 J/d.cm^3 for fish at 20C)
• test generality of DEB theory (new model-varieties in family structure, such as ssj model) • stimulate contributions from others (more appealing to add to a large collection: coherence as means of long-term survival) • enhance applications (fisheries, culturing, bioconservation, climate change, ecotox) • eco-evolutionary patterns in parameter values (body size-variation, acceleration, waste-to-hurry, supply-demand, altricial-precocial)
• ease parameter estimation by comparison (multiple species) • transition of website from VU to .. (Naturalis?) • links with other large websites to enhance longterm survival (EoL, ADW) • do something useful with old data • test claims by evolution-theorists on optimality • last but not least: I learn a lot about properties of species
2019
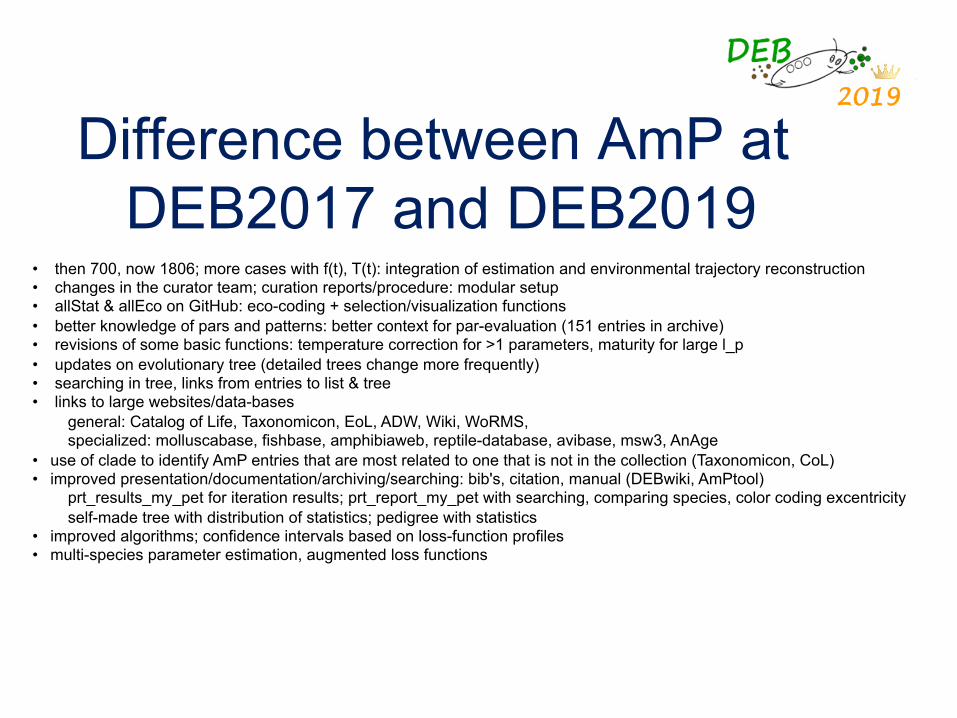
• then 700, now 1806; more cases with f(t), T(t): integration of estimation and environmental trajectory reconstruction • changes in the curator team; curation reports/procedure: modular setup • allStat & allEco on GitHub: eco-coding + selection/visualization functions • better knowledge of pars and patterns: better context for par-evaluation (151 entries in archive) • revisions of some basic functions: temperature correction for >1 parameters, maturity for large l_p • updates on evolutionary tree (detailed trees change more frequently) • searching in tree, links from entries to list & tree • links to large websites/data-bases general: Catalog of Life, Taxonomicon, EoL, ADW, Wiki, WoRMS, specialized: molluscabase, fishbase, amphibiaweb, reptile-database, avibase, msw3, AnAge • use of clade to identify AmP entries that are most related to one that is not in the collection (Taxonomicon, CoL) • improved presentation/documentation/archiving/searching: bib's, citation, manual (DEBwiki, AmPtool) prt_results_my_pet for iteration results; prt_report_my_pet with searching, comparing species, color coding excentricity self-made tree with distribution of statistics; pedigree with statistics • improved algorithms; confidence intervals based on loss-function profiles • multi-species parameter estimation, augmented loss functions
2019
Difference between AmP at DEB2017 and DEB2019

• DEB parameters can only be estimated from several data sets simultaneously (growth/reproduction/feeding)
• Parameter values must make evo-eco sense: comparison with other species
• Can be estimated for a set of species simultaneously: parameter values can be shared, different or something in between (reduced variance), augmented loss functions
• Links between parameter values and eco-labels
2019
Par estimation in context

• Metabolism of all animals follows the same DEB rules apart from covariation rules: waste-to-hurry, acceleration, supply-demand & altricial-precocial spectra κ is beta-distributed because pA and pM are Weibull distributed and has mean 0.9 EHb easily deviates from covariation rules, especially for aquatic species with larvae • Parameter identification is complex and requires context • Completeness of available data is low • Data in the literature is frequently inconsistent • Wide acceptance grows slowly, but will be inevitable • Development of applications is not easy, requires
multidisciplinary appraoches, but no alternatives exist • Progress is fast
2019
What did we learn in 10 yr AmP?
sM
Ctenophora Cnidaria
Tunicata
Leptocardii
Echinodermata
Mixini
Cephalaspidorphi
Chondrichthyes Actinopterygii
Amphibia
Reptilia Aves
Mammalia
Chaetognatha
Rotifera
Gastrotricha
Platyhelminthes
Annelida Mollusca
Tardigrada
Nematoda Crustacea
Arachnida
Entognatha
Insecta
1 2 5 10
Sarcopterygii
Ecdysozoa Acanthocephala
Bryozoa
Porifera
Xenacoelomorpha
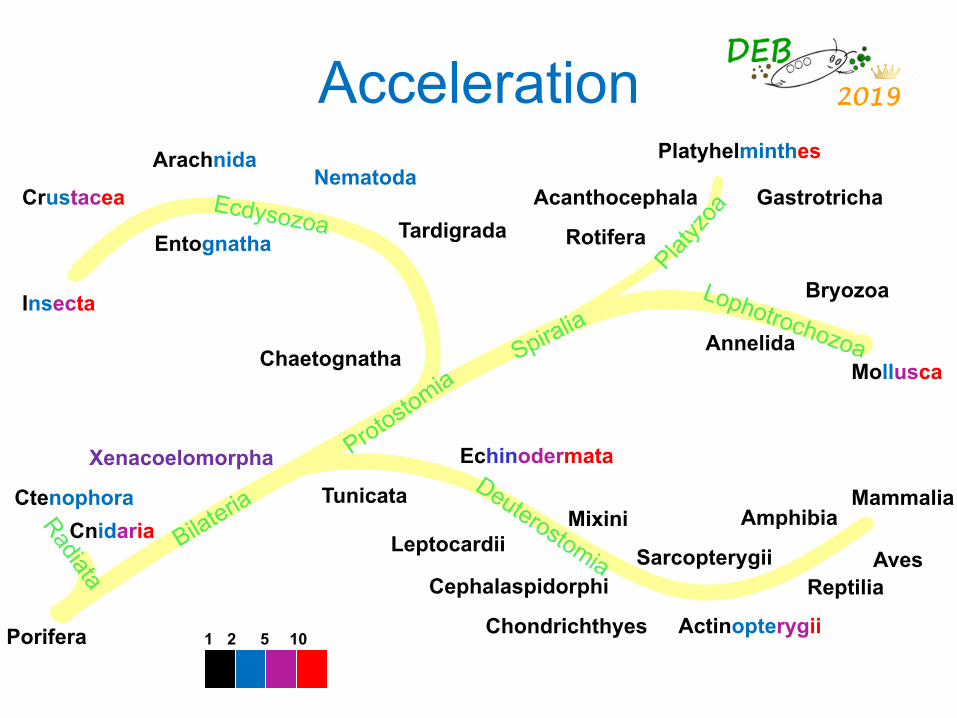
Acceleration 2019
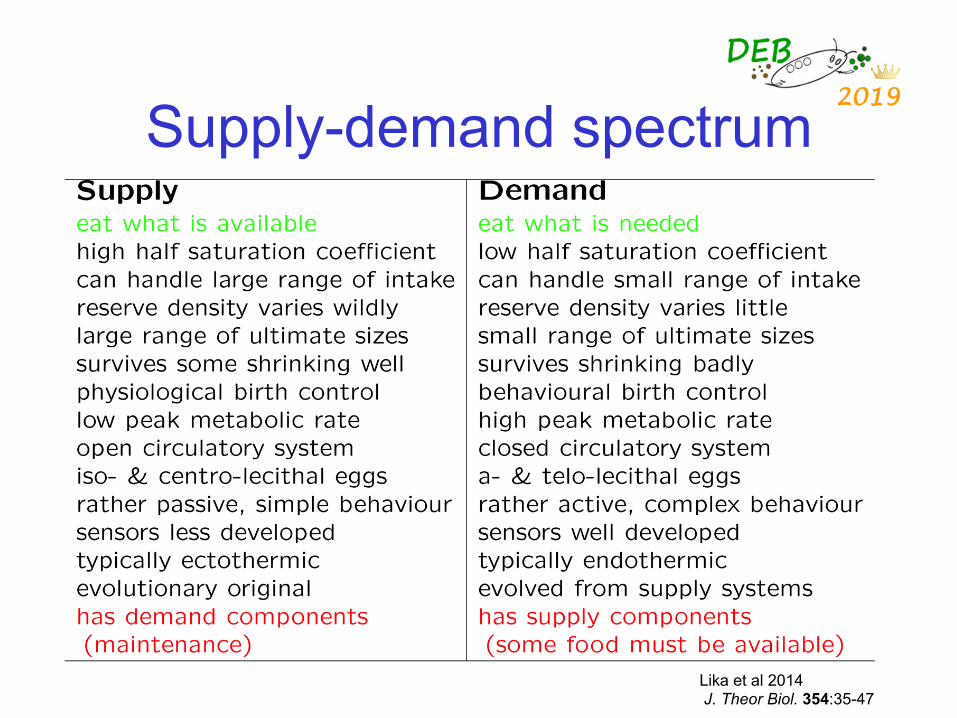
Supply-demand spectrum 2019
Lika et al 2014 J. Theor Biol. 354:35-47

Supply-demand spectrum
The small deviations from the surface ss (κ,epmin) = ep
3 κ2 (1−κ) are caused by acceleration sM dependeng on food level
2019
epmin: scaled func resp such that growth ceases at puberty ss: supply stress kap: allocation fraction to soma
n = 1785
AmPtool/mydata_shstat example 4
puberty is controlled by EHp
but ss and kap don´t directly relate to EH
p

Weibull distribution
Κ and ss are β-distributed 2019
Weibull distribution
Lika et al 2019 J Sea Res 143: 8–17
Weibull distribution Weibull distribution
n = 875
Body size as
emergent property
of metabolism
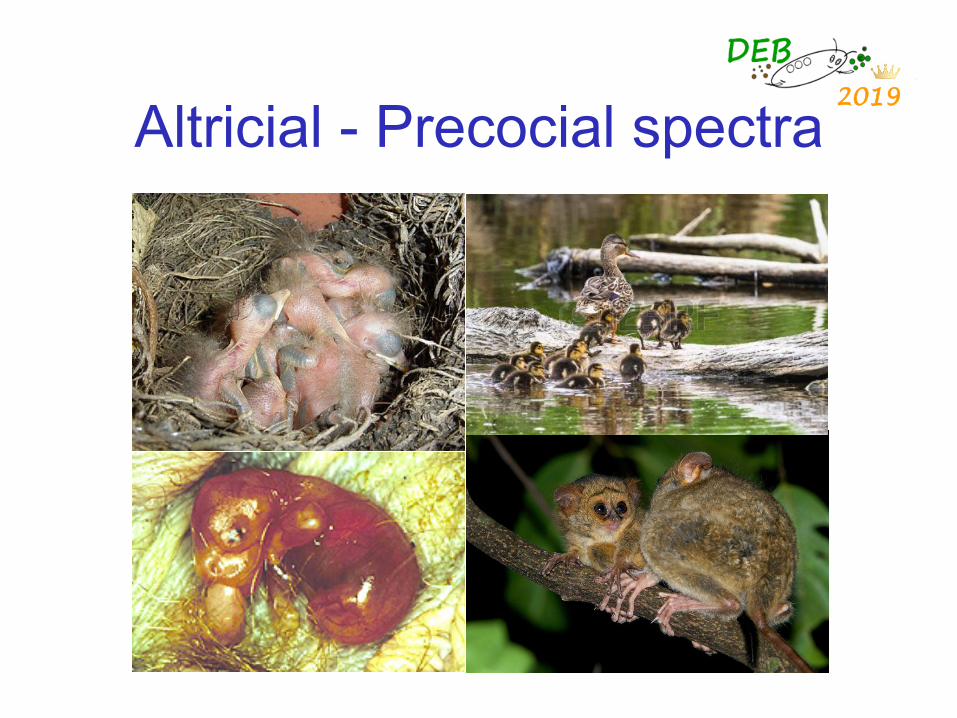
Altricial - Precocial spectra 2019

Altricial vs precocial evolution
Both birds and mammals evolved 250 Ma ago Birds: precocial → altricial big terrestrial eggs: expensive insoluble (non-toxic) nitrogen waste nesting from ground → trees: small eggs, parental care
Mammals: altricial → precocial small terrestrial eggs: inexpensive but rather toxic nitrogen waste from egg → foetal development 30 Ma ago: larger neonates
2019
Augustine et al 2019 J Sea Res 143: 27-34

Budget diversity 2019
Situation at puberty: maintenance, growth, reproduction

active AmP users
per month
per week
per day
2019/03/21
1247 users 2018/03-2019/03
2019 AmP use
DEB publications on Zotero
DEB special issues 2006 J Sea Res 56 (2) 2009 J Sea Res 62 (2,3) 2010 Phil Trans R Soc 2011 J Sea Res 65 (1) 2014 J Sea Res 94 2019 J Sea Res 143 2020 Ecol Mod
DEB symposia 2009 Brest 2011 Lisbon 2013 Texel 2015 Marseille 2017 Tromsø 2019 Brest
from
Goo
gle

• doi’s for accepted entries • upgrading of existing entries • development of methods to deal with many parameters in context • popDyn • NicheMapR • Ecotox applications • transfer of website to a museum-type institute
2019
Future developments of AmP

Thank you 2019
Organizors: thank you for the invitation Audience: thank you for your attention Download slides https://www.bio.vu.nl/thb/users/bas/lectures/ Add-my-Pet https://www.bio.vu.nl/thb/deb/deblab/add_my_pet/ Questions are welcome