what have raised beds, sub- surface water management, and ......what have raised beds, sub-surface...
TRANSCRIPT

What have raised beds, sub-
surface water management,
and N x S fertilization in
common?Hans Kandel,
NDSU Extension Agronomist

Soybean Productivity on Raised Seedbeds

Soybean Productivity on Raised Seedbeds
Soybean Productivity on Raised Seedbeds
•Evaluate soybean yield and response when
grown on raised seedbeds compared with
conventional tillage in flat land areas prone
to soil water logging.
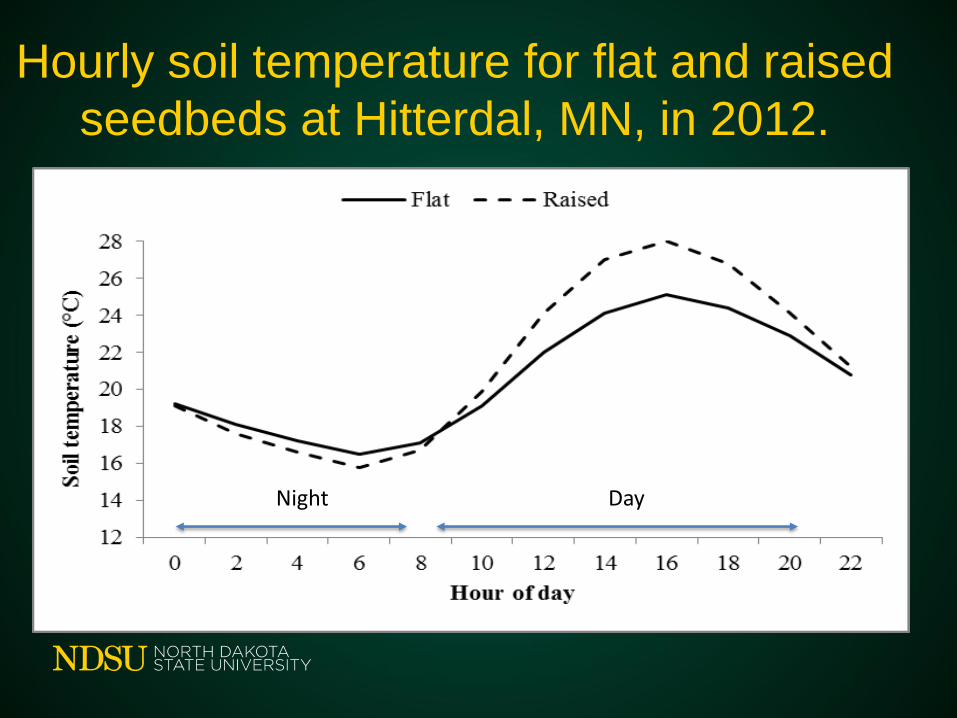
Hourly soil temperature for flat and raised
seedbeds at Hitterdal, MN, in 2012.
Night Day
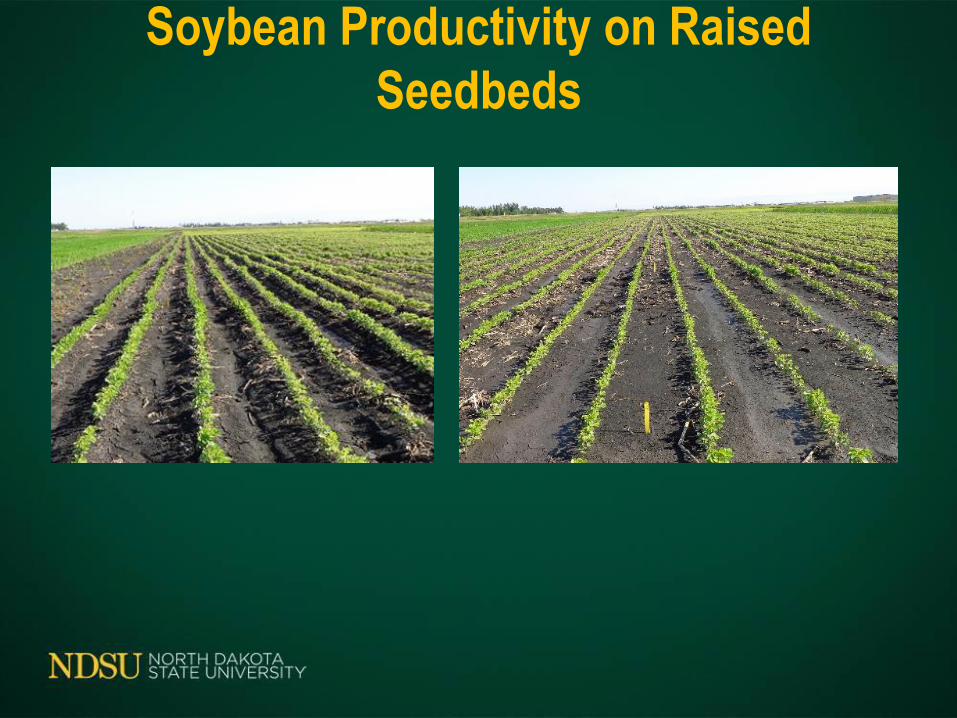
Soybean Productivity on Raised
Seedbeds

Soybean Seed Yield
1 Averaged across 5 locations.2 Averaged across 3 locations: tile and
no tile in Fargo, and Casselton.
Tillage Yield
20121
Yield
20132
Yield
20142
Bu/acre Bu/acre Bu/acre
Flat 44.6 30.3 49.7
Raised bed 44.4 33.4 51.7
LSD NS 2.0 1.8

Soybean Productivity on Raised
Seedbeds

Soybean Stand, Vigor and Yield 2013-2014
1 Averaged across 6 environments: tile
and no tile in Fargo, and Casselton
2013-2014.
Tillage Stand Vigor Yield 13-
14
Plant/acre (1-9)[ 9= best]
Bu/acre
Flat 105,650b 4.4b 40.4b
Raised bed 134,050a 5.9a 43.0a
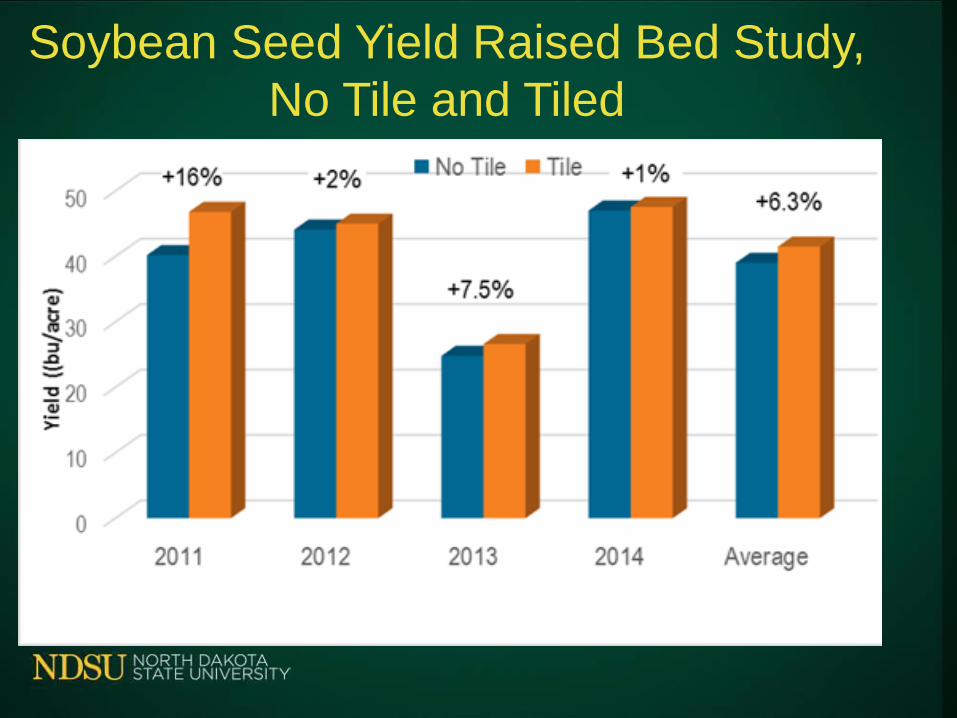
Soybean Seed Yield Raised Bed Study,
No Tile and Tiled

Summary Study
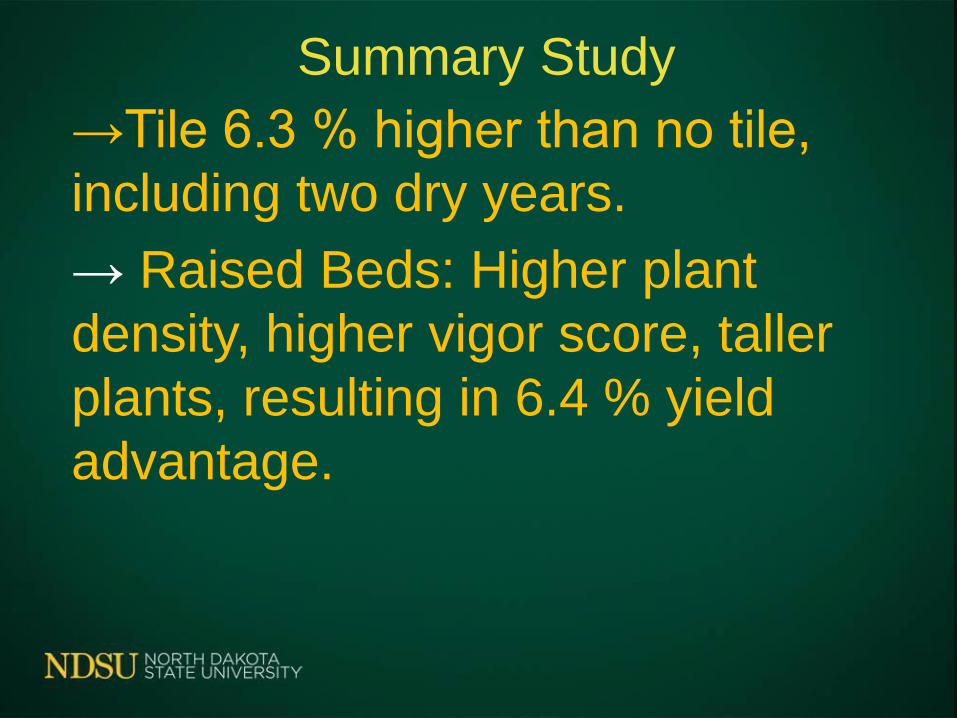
→Tile 6.3 % higher than no tile,
including two dry years.
Summary Study
→Tile 6.3 % higher than no tile,
including two dry years.
→ Raised Beds: Higher plant
density, higher vigor score, taller
plants, resulting in 6.4 % yield
advantage.


Penetrometer Readings

Resistance values for depths 8-46 cm on drained
and undrained ground seeded into soybean.
Drained soil higher soil resistance
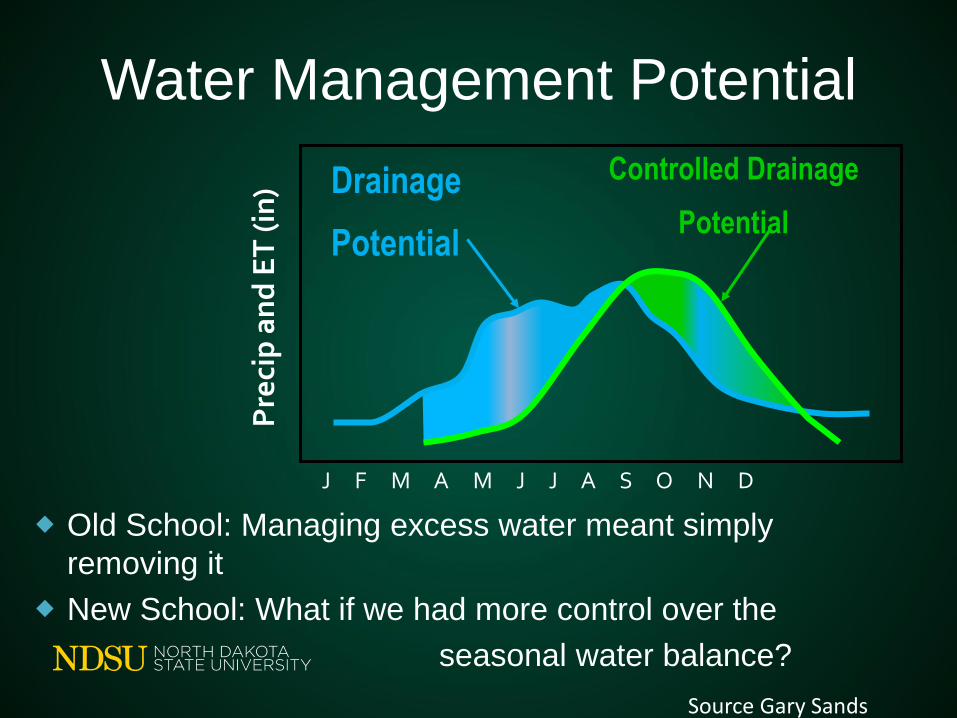
Water Management Potential
Old School: Managing excess water meant simply
removing it
New School: What if we had more control over the
seasonal water balance?
Controlled Drainage
Potential
Drainage
Potential
J F M A M J J A S O N D
Pre
cip
an
d E
T (
in)
Source Gary Sands
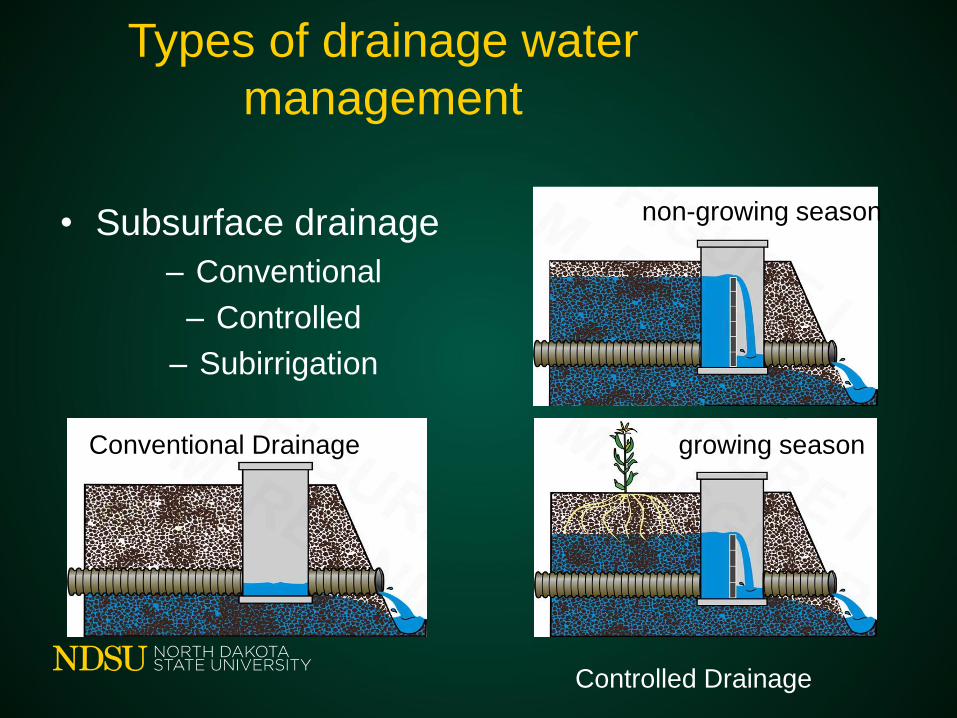
Types of drainage water
management
Conventional Drainage
Controlled Drainage
• Subsurface drainage
– Conventional
– Controlled
– Subirrigation
non-growing season
growing season
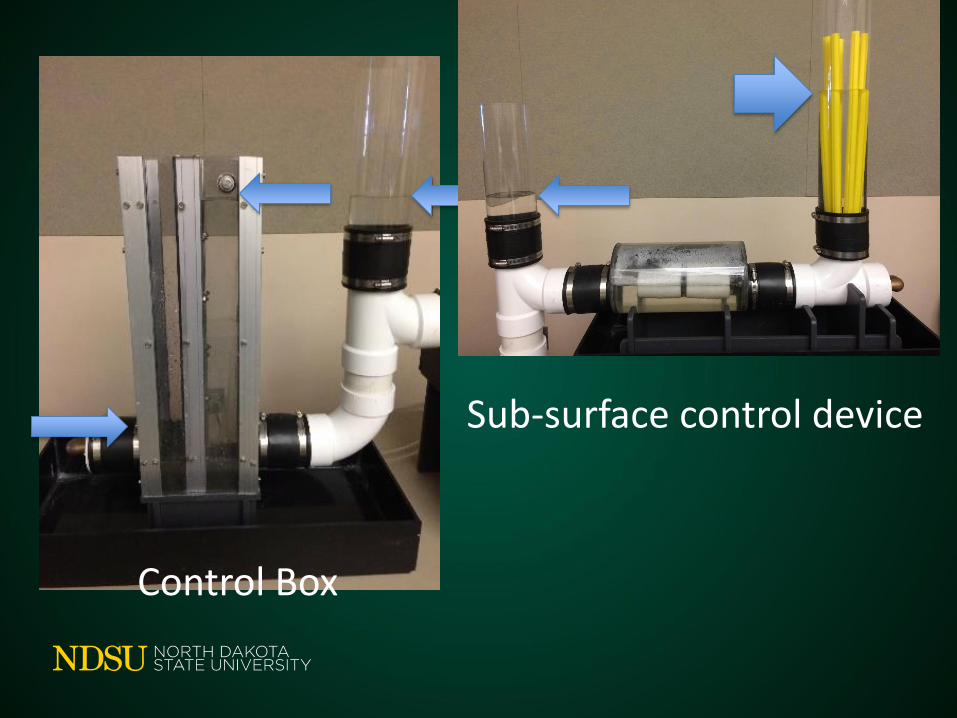
Control Box
Sub-surface control device

Water table
0
10
20
30
40
50
60
70
80
-120
-100
-80
-60
-40
-20
0
Ra
infa
ll (mm
)
Dep
th B
elo
w G
rou
nd
(cm
)
NW22 Water Table Depth 2015
Rainfall (mm)
NAD
CTD
Naturally drained
Controlled drained

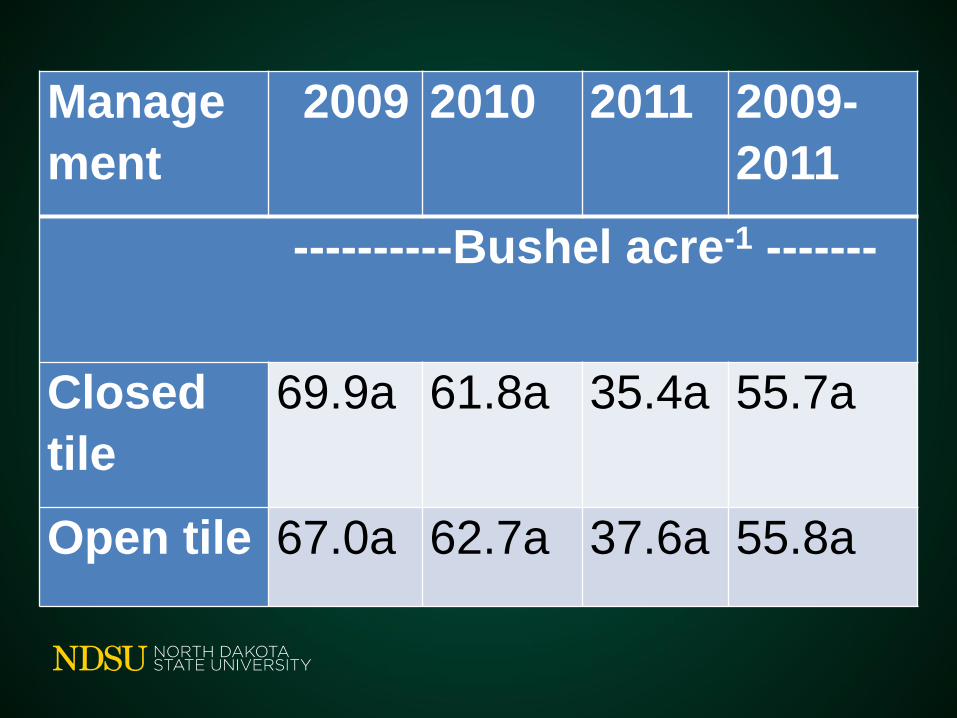
Wheat Study 2009-2011


Manage
ment
2009 2010 2011 2009-
2011
----------Bushel acre-1 -------
Closed
tile
69.9a
Open tile 67.0a
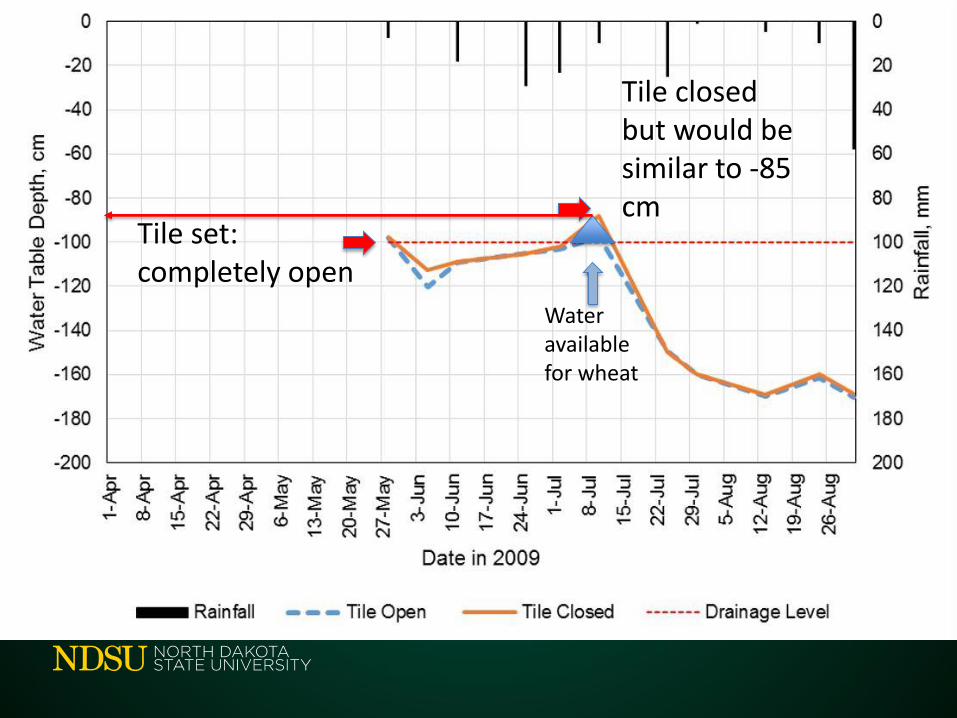
Tile set:completely open
Tile closed but would be similar to -85 cm
Water available for wheat

Excess water

Manage
ment
2009 2010 2011 2009-
2011
----------Bushel acre-1 -------
Closed
tile
69.9a 61.8a
Open tile 67.0a 62.7a

Excess water Excess water
Manage
ment
2009 2010 2011 2009-
2011
----------Bushel acre-1 -------
Closed
tile
69.9a 61.8a 35.4a 55.7a
Open tile 67.0a 62.7a 37.6a 55.8a


Mgt
Level 1
2009-
2011
Mgt Level
2
2009-
2011
Bu/A Bu/A
Closed
tile
55.7a Limited
Mgt
54.8b
Open
tile
55.8a Best Mgt 56.7a
Level 2 is best management approach, i.e. tile closed in 2009 in response to dry conditions and tile open in 2010 and 2011 in response to wetter conditions. Numbers with the same column with the same letter are not significantly different at p≤0.10.

Mgt
Level 1
2009-
2011
Mgt Level
2
2009-
2011
Bu/A Bu/A
Closed
tile
55.7a Limited
Mgt
54.8b
Open
tile
55.8a Best Mgt 56.7a
Level 2 is best management approach, i.e. tile closed in 2009 in response to dry conditions and tile open in 2010 and 2011 in response to wetter conditions. Numbers with the same column with the same letter are not significantly different at p≤0.10.

Effect of tile drainage and additive at
the 112 N rate on yield of corn, NW22,
2011.

Iron Deficiency Chlorosis (IDC)
• Fe is a micronutrient
• Fe is essential in the formation of
chlorophyll
• IDC often associated with high pH,
stressed plant, lack of soil aeration
• Normally not a lack of Fe in the soil
• Caused by the inability of the plant to take
up Fe or utilize it

Symptoms occur usually in the newest leaves formed. The leaf looks yellow and the veins in the leaf stay green.

SOYBEAN IRON CHLOROSIS
1. High pH ( 7.8 - 8.5).
2. High amounts of bi carbonates.
3. High levels of soluble salts (>0.7 ppm).
4. Very dry or wet soils (higher moisture more
IDC).
5. Low Soil Temperature.
6. High Soil Nitrate Concentration.

Numerical Score Description
1-5 scale 1-9 scale Rating
1 to 2 1 to 2.5 Tolerant
2.1 to 3 2.6 to 5 Moderately
Tolerant
3.1-4 5.1 to 7.5 Moderately
Susceptible
4.1 to 5 7.5 to 9 Susceptible
Iron Deficiency Chlorosis Score

Iron Chlorosis score 4
Iron Chlorosis score 5
Source: Dr. Jay Goos

Source: J. Goos

http://www.ag.ndsu.edu/varietytrials

http://www.ag.ndsu.edu/varietytrials


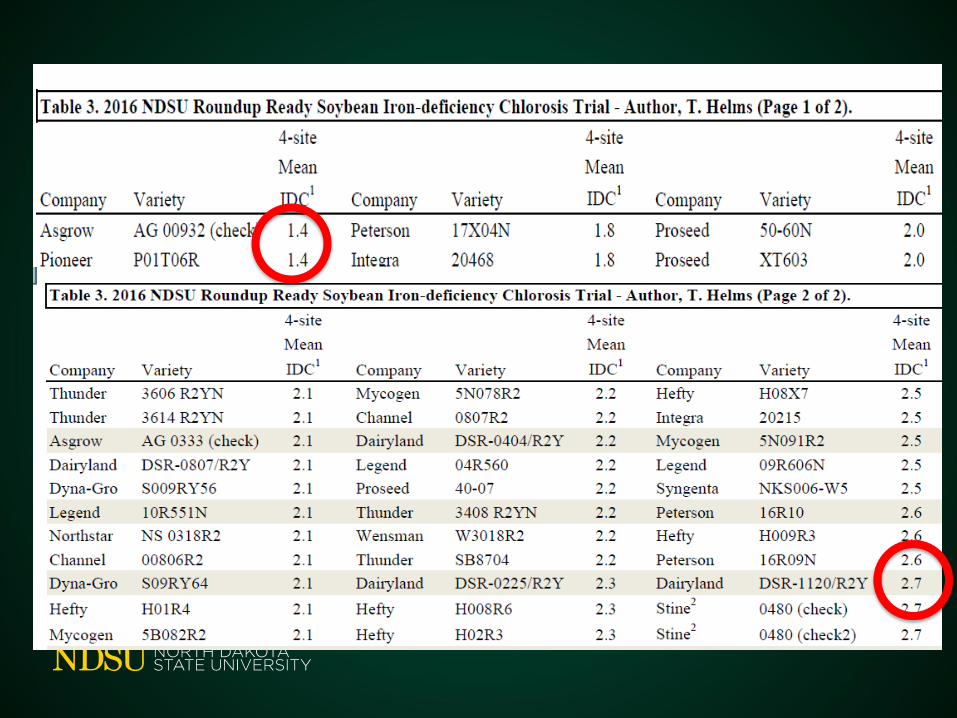

223 RR Varieties IDC Score 2016ID
C S
core
1
1IDC score was 1-5 scale with 1-green, 5-dead.


60 non RR Varieties IDC Score
2016
IDC
Sco
re1
Variety1IDC score was 1-5 scale with 1-green, 5-dead.

2016 NDSU Conv. IDC Trial
1IDC score was 1-5 scale with 1-green, 5-dead.
Company Cultivar IDC visual*score
Dyna-Gro S04LL37 1.3Peterson L07-16N 1.7NDSU Sheyenne 2.0NDSU ND Bison 2.0NDSU Ashtabula 2.1Thunder 5615LLN 2.3Susceptible check Sargent 2.7LSD (0.05) 0.22

2016 IDC Yield

NDSU Previous year RR Soybean yield
and IDC
1IDC score was 1-5 scale with 1-green, 5-dead.
IDC SCORE 1-5
BU
SHEL
PER
AC
RE

IDC and Yield NDSU Trial 2015B
ush
el p
er a
cre
IDC: 1 green, 5 dead tissue

IDC and Yield NDSU Trial 2015B
ush
el p
er a
cre
IDC: 1 green, 5 dead tissue
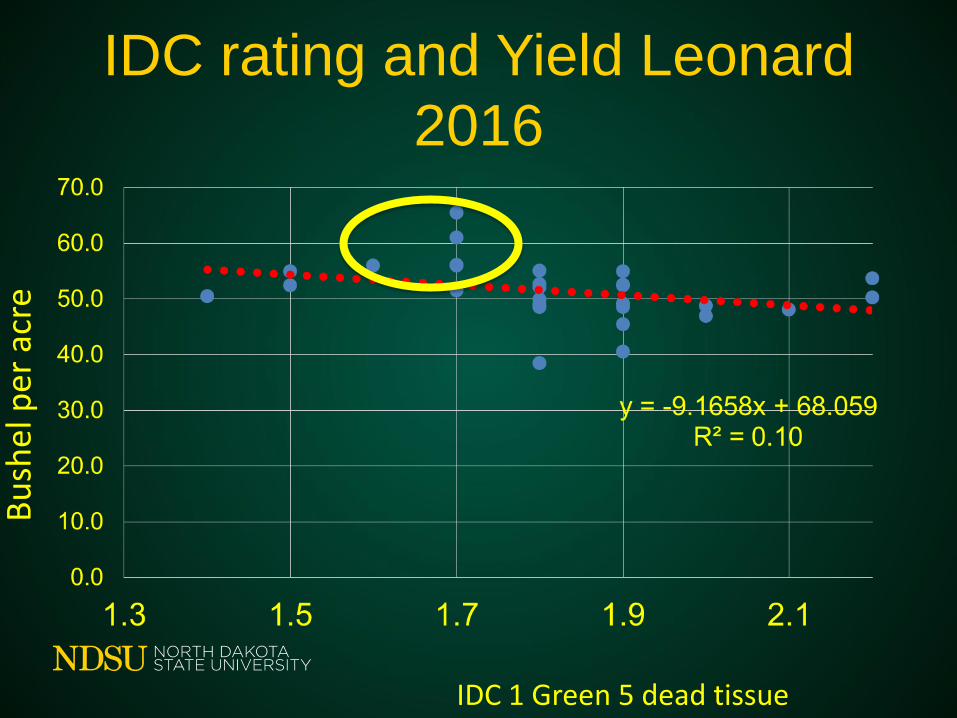
IDC rating and Yield Leonard
2016
IDC 1 Green 5 dead tissue
Bu
shel
per
acr
e

Guidelines for Iron Chlorosis
• Select Varieties with high tolerance
when:
– pH above 8
– Salts above 1 mmhos
– Carbonates above 6-8%
• Still a lot to learn about carbonates
– Need to handle saturated soils
– Disease resistance package
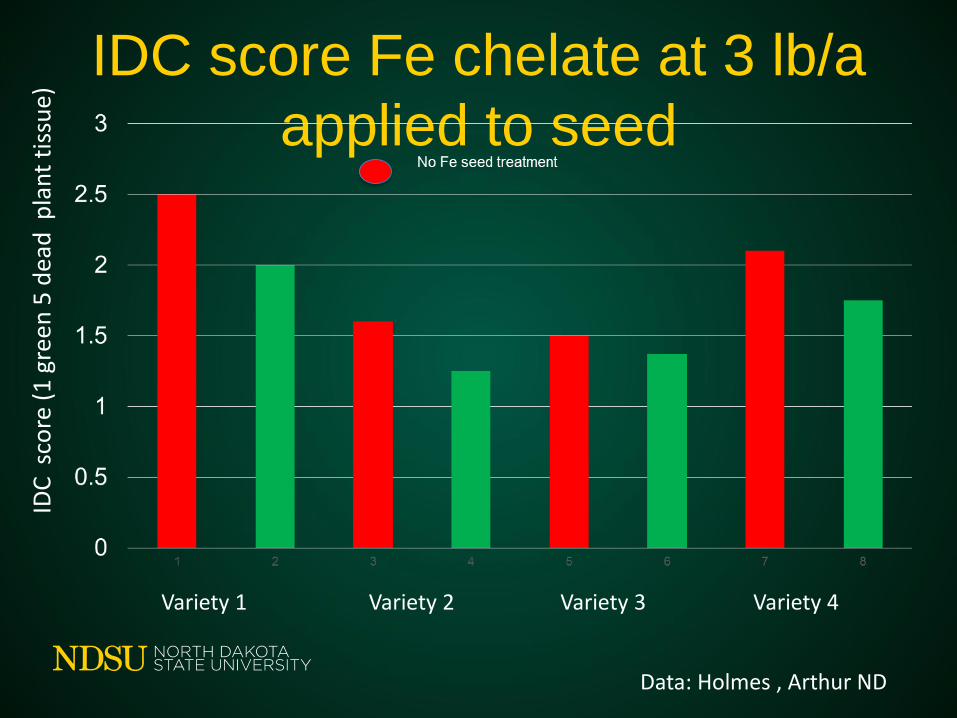
IDC score Fe chelate at 3 lb/a
applied to seed
Variety 1 Variety 2 Variety 3 Variety 4
IDC
sco
re (
1 g
reen
5 d
ead
pla
nt
tiss
ue)
Data: Holmes , Arthur ND

Soybean and Nitrogen
• Nitrate may aggravate iron chlorosis
• Soybeans can fix their own Nitrogen
• If carryover of NO 3 -N from previous
crops is high, the soybean uses the
NO 3 -N from the soil. The partnership
with the Rhizobia bacteria becomes
less efficient.

Soybean Response to Nitrogen Inputs under Tile Drained Conditions

Soybean Yield With and Without N,
2009-2011
Bu
pe
r a
cre
* 4%
increase

Sources of N for a Soybean Crop
Figure 1. A generalized N budget for soybean. Adapted from Salvagiotti et al., 2008.
N Need

Measurements taken
• Stand count
• Early and late vigor score
• IDC score
• Visual greenness score
• Plant height
• Yield

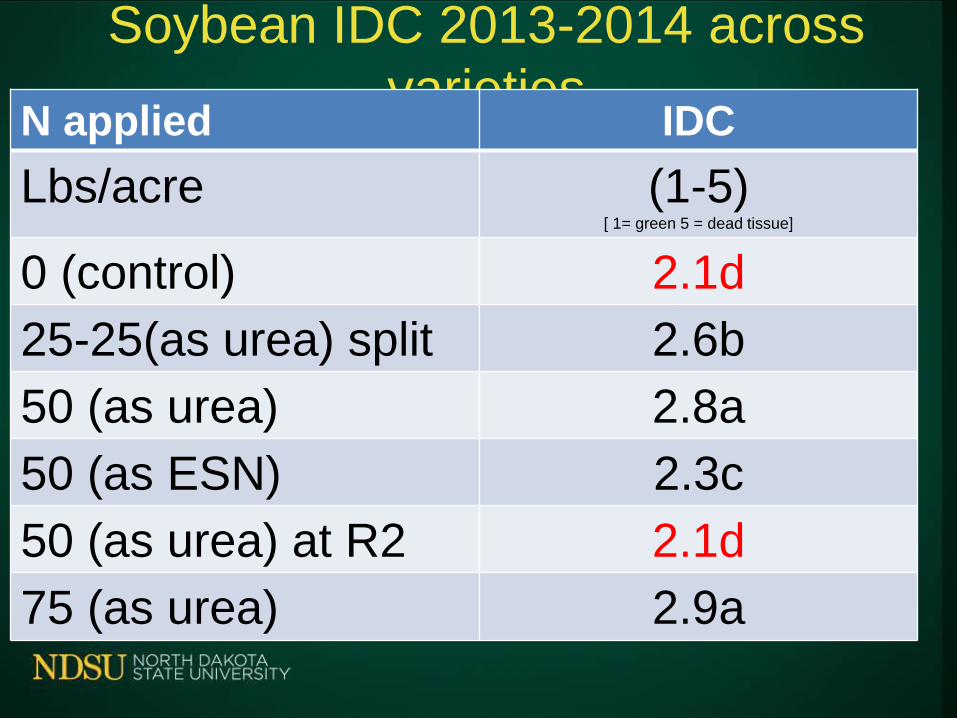
Soybean IDC 2013-2014 across
varietiesN applied IDC
Lbs/acre (1-5)[ 1= green 5 = dead tissue]
0 (control) 2.1d
25-25(as urea) split 2.6b
50 (as urea) 2.8a
50 (as ESN) 2.3c
50 (as urea) at R2 2.1d
75 (as urea) 2.9a
Soybean IDC 2013-2014 across
varietiesN applied IDC
Lbs/acre (1-5)[ 1= green 5 = dead tissue]
0 (control) 2.1d
25-25(as urea) split 2.6b
50 (as urea) 2.8a
50 (as ESN) 2.3c
50 (as urea) at R2 2.1d
75 (as urea) 2.9a

Soybean IDC 2013-2014 across
varietiesN applied IDC
Lbs/acre (1-5)[ 1= green 5 = dead tissue]
0 (control) 2.1d
25-25(as urea) split 2.6b
50 (as urea) 2.8a
50 (as ESN) 2.3c
50 (as urea) at R2 2.1d
75 (as urea) 2.9a

2014 NW22 soybean
49
50
51
52
53
54
55
56
0 lb/ac 50 lb/ac @Emergence
75 lb/ac @Emergence
50 lb/ac @ R2-3
25 lb/ac - 25lb/ac @R2-3
50 lb/ac ESN@ Emergence
N treatment yield (bu/ac)
LSD=.05
c ab ab abb a
OptRx active optical sensor• This sensor operates similar to the
greenseeker sensor but has three channels.
• The sensor emits light at three wavelengths:
670 and 730 nm in the visible band, and 780
nm in the near infra-red (NIR) band.
• Sensor has the ability to provide NDRE
(Normalized Difference Vegetation Index Red
Edge) values calculated as (NIR – Red
edge)/ (NIR + Red edge).

Soybean greenness and yield
across N treatments and varieties
y = 9614.1x - 656.01R² = 0.84
0
500
1000
1500
2000
2500
3000
3500
0.30 0.32 0.34 0.36 0.38 0.40
Yiel
d(k
g h
a-1)
NDRE

Variety-4
y = 11499x - 920.08R² = 0.63
0
500
1000
1500
2000
2500
3000
3500
4000
4500
0.00 0.05 0.10 0.15 0.20 0.25 0.30 0.35 0.40 0.45
Yie
ld(k
g h
a-1
)
NDRE
No-Tile
y = 11007x - 740.11R² = 0.63
0
500
1000
1500
2000
2500
3000
3500
4000
4500
0.00 0.10 0.20 0.30 0.40 0.50
Yie
ld(k
g h
a-1
)
NDRE
Tile

Variety-4 all data points

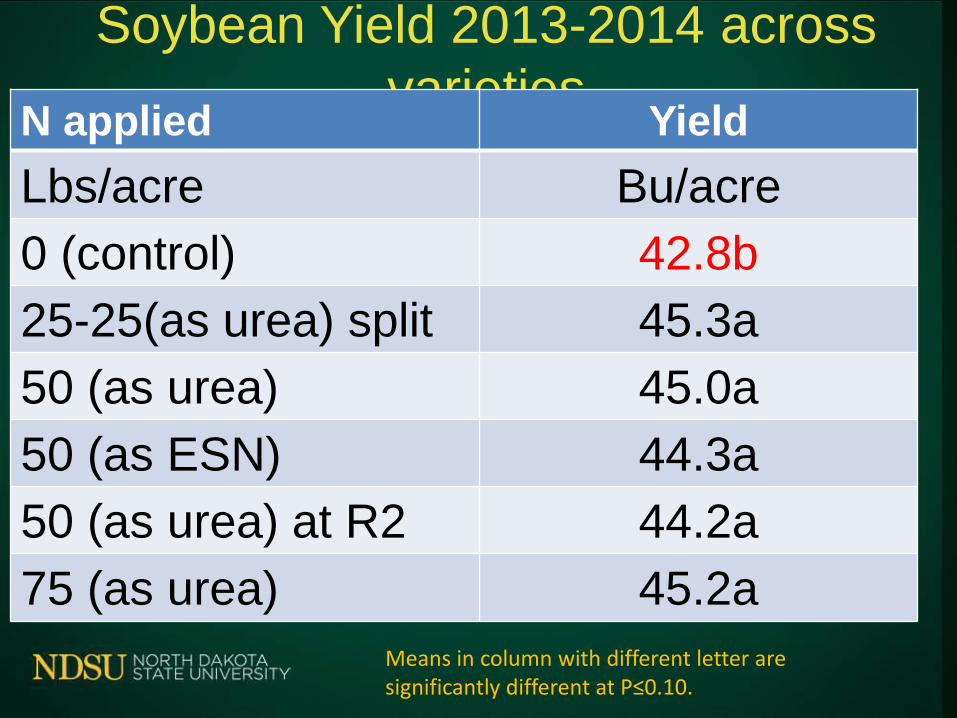
Soybean Yield 2013-2014 across
varietiesN applied Yield
Lbs/acre Bu/acre
0 (control) 42.8b
25-25(as urea) split 45.3a
50 (as urea) 45.0a
50 (as ESN) 44.3a
50 (as urea) at R2 44.2a
75 (as urea) 45.2a
Means in column with different letter are significantly different at P≤0.10.
Soybean Yield 2013-2014 across
varietiesN applied Yield
Lbs/acre Bu/acre
0 (control) 42.8b
25-25(as urea) split 45.3a
50 (as urea) 45.0a
50 (as ESN) 44.3a
50 (as urea) at R2 44.2a
75 (as urea) 45.2a
Means in column with different letter are significantly different at P≤0.10.

Soybean Yield over 5 N Rates, 2015
45.5
46
46.5
47
47.5
48
48.5
49
49.5
0 25 50 75 100
Yie
ld (
bu
/A)
N Rate (lbs/A)
Increased yield did not pay for additional fertilizer cost

N application and Nodulation, 2015
N (as Urea)
In lb/acre
Nodules Percent large
nodules
0 41 45

N application and Nodulation, 2015N (as Urea)
In lb/acre
Nodules per
root
Percent large
nodules
0 41 45
25 30 15

N application and Nodulation, 2015N (as Urea)
In lb/acre
Nodules per
root
Percent large
nodules
0 41 45
25 30 15
50 26 8

N application and Nodulation, 2015N (as Urea)
In lb/acre
Nodules per
root
Percent large
nodules
0 41a 45a
25 30b 15b
50 26b 8b
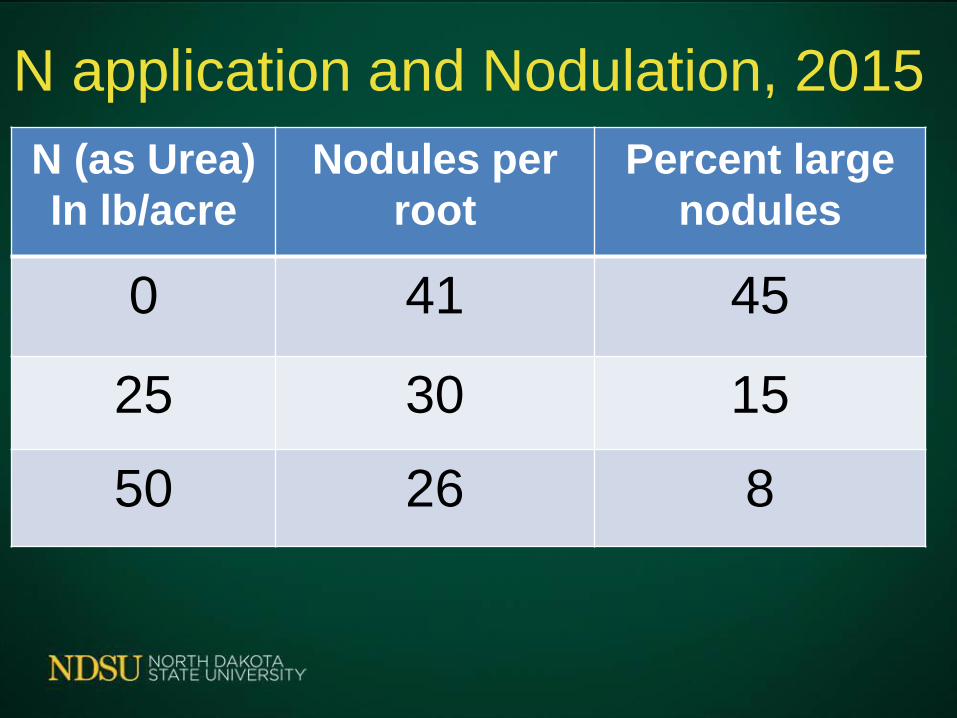
N application and Nodulation, 2015
N (as Urea)
In lb/acre
Nodules per
root
Percent large
nodules
0 41 45
25 30 15
50 26 8
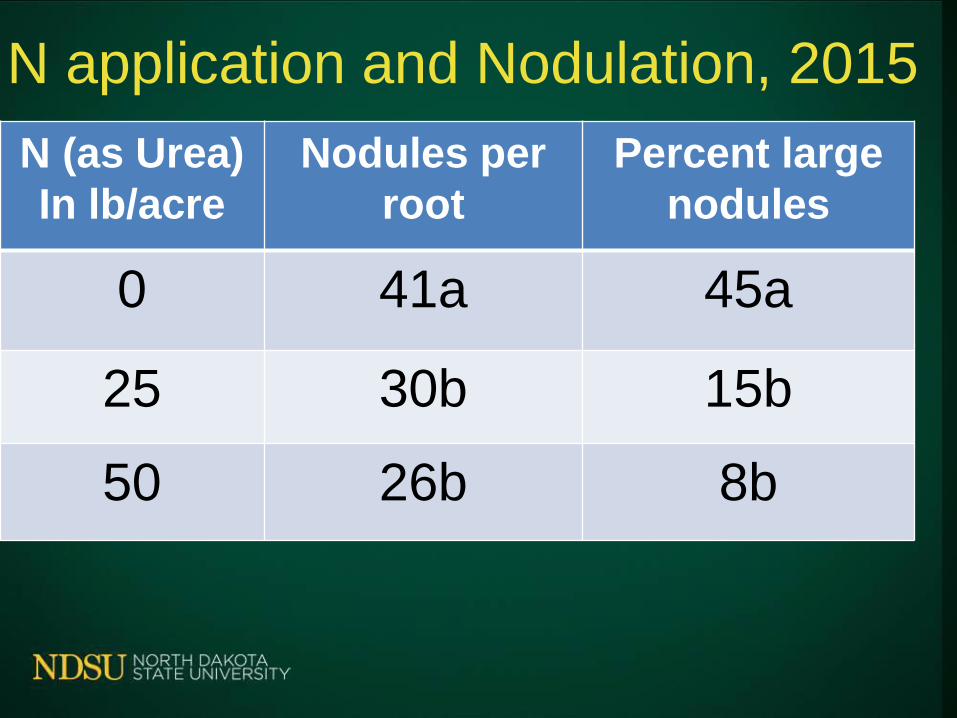
N application and Nodulation, 2015
N (as Urea)
In lb/acre
Nodules per
root
Percent large
nodules
0 41a 45a
25 30b 15b
50 26b 8b

Conclusions N application
• Fertilizer N application
increased IDC.
• N application decreased
nodulation
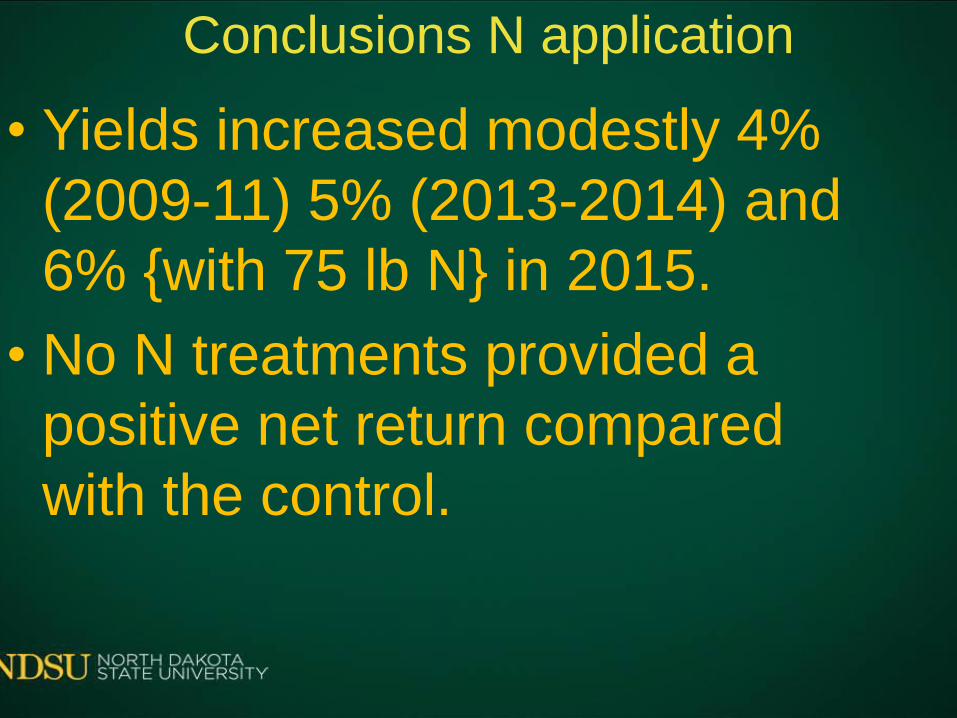
Conclusions N application
• Yields increased modestly 4%
(2009-11) 5% (2013-2014) and
6% {with 75 lb N} in 2015.
• No N treatments provided a
positive net return compared
with the control.

Soybean Response to
Nitrogen and Sulfur
Fertilization

Main N and S treatments

Visual greenness score
• 1-5 scale
– 1 = green

Vigor score between VTs
a
b
†Vigor was scored visually on a scale of 1-9 (9 = most vigorous)

N effect on plant density
aa
b
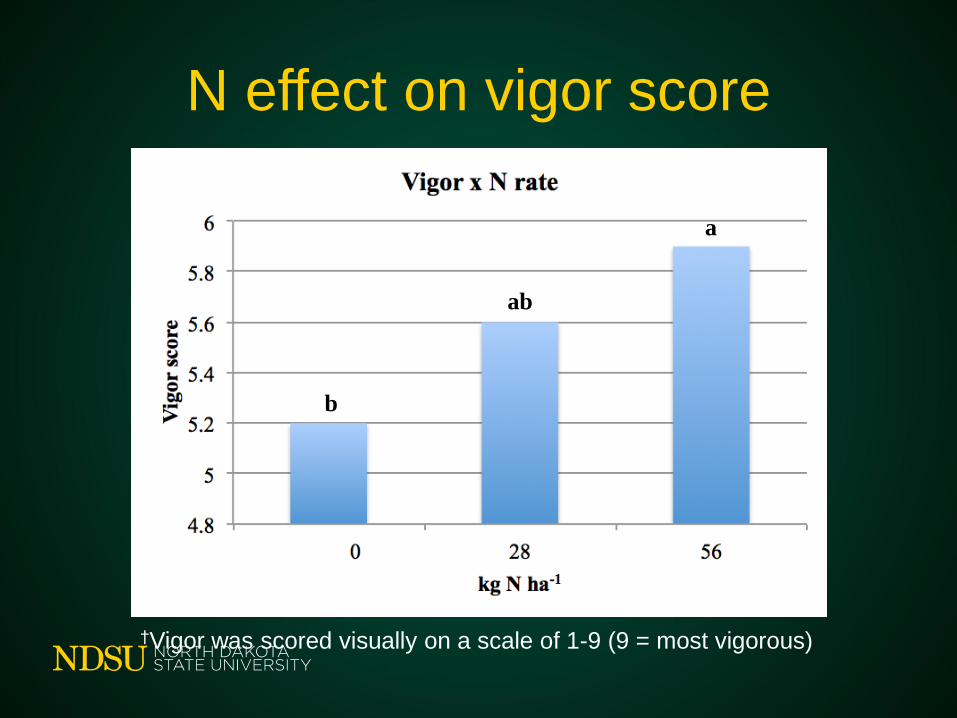
N effect on vigor score
b
a
ab
†Vigor was scored visually on a scale of 1-9 (9 = most vigorous)

N effect on NDVI score
†NDVI obtained from the handheld GreenSeeker on
scale of 0 – 0.99 (0.99 = most vigorous)
a
a
b

First root dig
0 kg N ha-1280 kg N ha-1

N effect on V4 average nodules

Summary
• Varieties
– Differ in vigor
• Nitrogen
– Decreased density
– Increased vigor, G, NDVI, height, & yield
• N x S
– Influenced visual greenness but not yield at (p≤0.05)

NDVI vs Yield Steele County
Variety Trial

DGCI vs Yield Steele County
Variety trial

NDVI August and yield N x S
across varieties