what it takes to make history torbjorn bjering ho-jung hsiao eric griffin chun-hung lin gulsah...
TRANSCRIPT

What it Takes to Make History
What it Takes to Make History
Torbjorn BjeringHo-Jung Hsiao
Eric GriffinChun-Hung LinGulsah GunencGaoyuan Tian
Laura Braeutigam
Torbjorn BjeringHo-Jung Hsiao
Eric GriffinChun-Hung LinGulsah GunencGaoyuan Tian
Laura Braeutigam

Table of ContentsTable of Contents
IntroductionBrief SummaryDescriptive StatisticsExploratory Data AnalysisStatistical AnalysisConclusions
IntroductionBrief SummaryDescriptive StatisticsExploratory Data AnalysisStatistical AnalysisConclusions

IntroductionIntroductionA lot goes into winning an
election.There are many factors that can
lead a candidate to victory.A campaign is based on what is
important to the population.A candidate’s image will help
him appeal to many different aspects of society.
A lot goes into winning an election.
There are many factors that can lead a candidate to victory.
A campaign is based on what is important to the population.
A candidate’s image will help him appeal to many different aspects of society.

What are we studying?What are we studying?The 2008 Presidential
electionObama vs. McCain
How do different aspects of society influence the result of the election?
Why do they affect the outcome?
The 2008 Presidential electionObama vs. McCain
How do different aspects of society influence the result of the election?
Why do they affect the outcome?

Why are we studying the election?Why are we studying the election?Monumental event in our
nation’s historySomething that affects all
AmericansAbundant accurate dataRecently occurred
Monumental event in our nation’s history
Something that affects all Americans
Abundant accurate dataRecently occurred

How are we studying the election?How are we studying the election?Extracting data from U.S. Census
Bureau50 states plus District of ColumbiaDC is an outlier!
Evaluating exploratory dataLSM Regression
GenderAgeFinancial StatusEducationReligionRace
Extracting data from U.S. Census Bureau50 states plus District of ColumbiaDC is an outlier!
Evaluating exploratory dataLSM Regression
GenderAgeFinancial StatusEducationReligionRace

Brief SummaryBrief SummaryObama won the election.Who support Obama?
WomenYounger votersVoters with higher
income Highly educated
votersJewish votersMinority groups
Obama won the election.Who support Obama?
WomenYounger votersVoters with higher
income Highly educated
votersJewish votersMinority groups

Exploratory Data AnalysisExploratory Data AnalysisAn approach to analyze data
for the purpose of formulating hypotheses worth testing, complementing the tools of conventional statistics for testing hypotheses.
Analyzing scatter diagrams to see if we can use linear regression
An approach to analyze data for the purpose of formulating hypotheses worth testing, complementing the tools of conventional statistics for testing hypotheses.
Analyzing scatter diagrams to see if we can use linear regression
Descriptive StatisticsDescriptive StatisticsDependent Variable
Obama election percentageIndependent Variable
Minority PopulationBlackNative AmericanHispanicAsian
Dependent VariableObama election percentage
Independent VariableMinority Population
BlackNative AmericanHispanicAsian

Independent Variable Gender Age Religion
ChristianJewish
EducationPersons with Bachelor's Degree or More
Financial StatusUnemployment RatePersonal Income Per Capita in Current
DollarsEnergy Consumption Per CapitaHomeownership Rate
Independent Variable Gender Age Religion
ChristianJewish
EducationPersons with Bachelor's Degree or More
Financial StatusUnemployment RatePersonal Income Per Capita in Current
DollarsEnergy Consumption Per CapitaHomeownership Rate
Descriptive Statistics cont.Descriptive Statistics cont.

Statistical AnalysisStatistical AnalysisAnalyzing collected data for the
purposes of summarizing information to make it more usable and/or making generalizations about a population.
Analyzing collected data for the purposes of summarizing information to make it more usable and/or making generalizations about a population.

Obama vs. MinorityObama vs. Minority
Effect of minority groups are positive. Asian is more supportive to Obama than
other groups. All coefficients except Hispanic and
Native are significant.
Effect of minority groups are positive. Asian is more supportive to Obama than
other groups. All coefficients except Hispanic and
Native are significant.
Minority = 100-white

Obama vs. MinorityObama vs. Minority
Blacks
DC
Minority (%)
Blacks (%)
Minority
DC

Obama vs. GenderObama vs. Gender
Women are more supportive to Obama than men.
Women are more supportive to Obama than men.

Obama vs. GenderObama vs. Gender
0.2
0.4
0.6
0.8
1.0
46 47 48 49 50 51 52
MALE
OB
AM
A
0.2
0.4
0.6
0.8
1.0
48 49 50 51 52 53 54
FEMALE
OB
AM
A
DC DC
(Male %)
(Female %)
Male Female

Obama vs. AgeObama vs. Age
All groups of ages have positive effect on Obama vote. The positive effect is decreasing with increase of age.
All groups of ages have positive effect on Obama vote. The positive effect is decreasing with increase of age.

Obama vs. ReligionObama vs. Religion
Christian voters tend not to vote Obama, but not significant.
Jewish voters are supportive to Obama.
Christian voters tend not to vote Obama, but not significant.
Jewish voters are supportive to Obama.
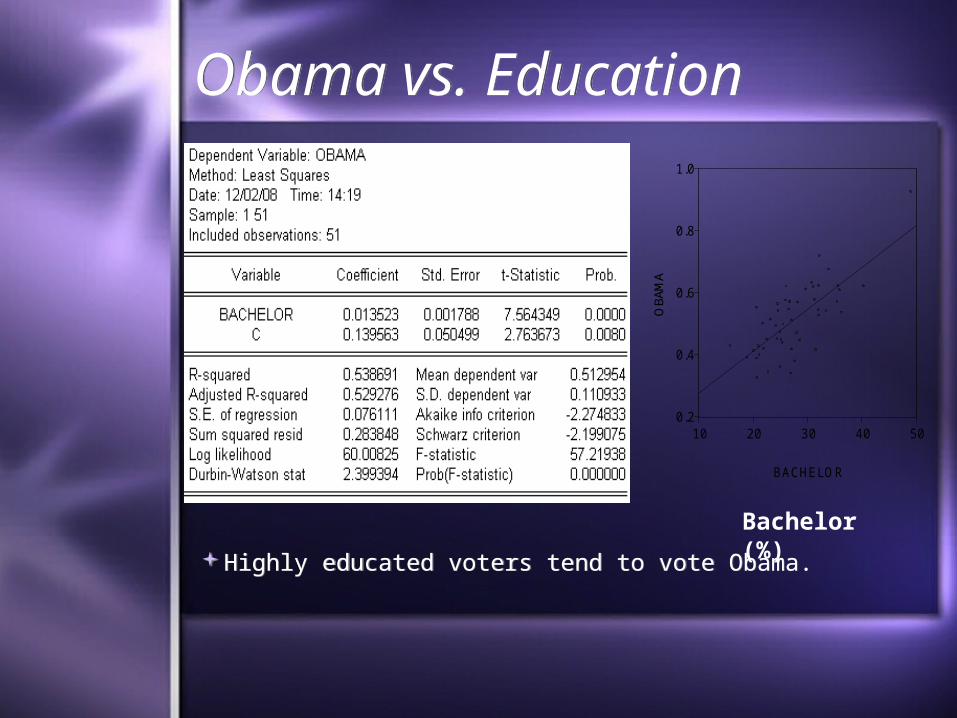
Highly educated voters tend to vote Obama.Highly educated voters tend to vote Obama.
Obama vs. EducationObama vs. Education
0.2
0.4
0.6
0.8
1.0
10 20 30 40 50
BACHELOR
OBA
MA
Bachelor (%)

Obama vs. UnemploymentObama vs. Unemployment
Jobless voters seem to be supportive to Obama, but the coefficient is not significant.
Jobless voters seem to be supportive to Obama, but the coefficient is not significant.
0.2
0.4
0.6
0.8
1.0
2 3 4 5 6 7 8
UNEMPLOYMENT
OB
AM
A
OBAMA vs. UNEMPLOYMENT
Unemployment (%)

Obama vs. IncomeObama vs. Income
0.2
0.4
0.6
0.8
1.0
20000 30000 40000 50000 60000 70000
INCOME
OB
AM
A
OBAMA vs. INCOME
Income $Voters with higher income are
supportive to Obama.Voters with higher income are
supportive to Obama.
Obama vs. Financial StatusObama vs. Financial Status
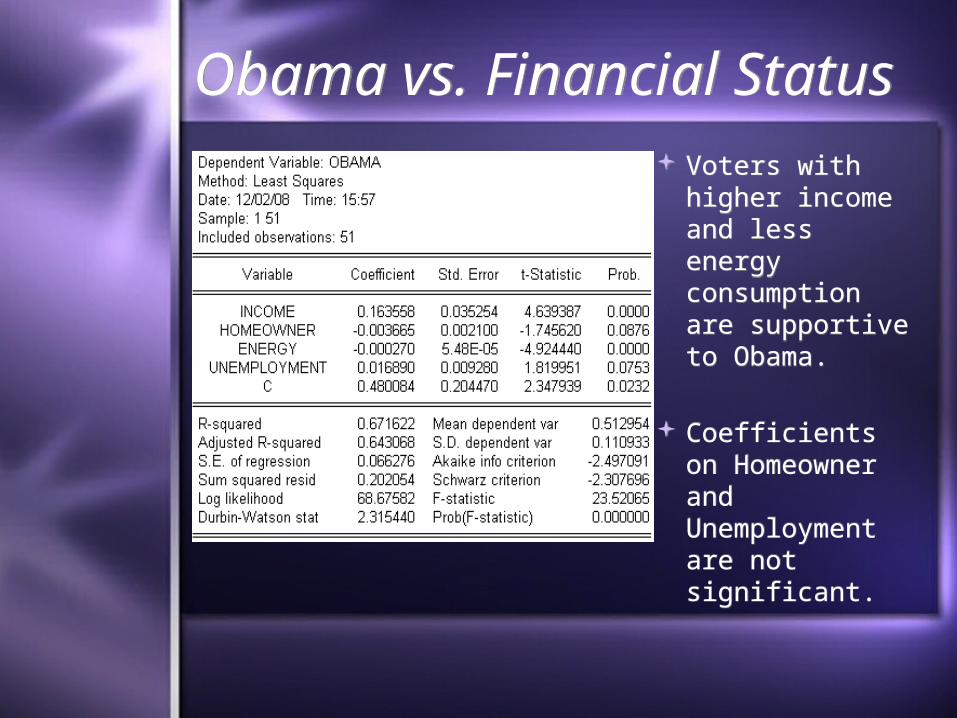
Voters with higher income and less energy consumption are supportive to Obama.
Coefficients on Homeowner and Unemployment are not significant.
Voters with higher income and less energy consumption are supportive to Obama.
Coefficients on Homeowner and Unemployment are not significant.

ConclusionsConclusionsSurprising
resultsVoters with
higher income are supportive to Obama.
Coefficient for African American voters is lower than expected
High energy users and home owners were not supportive
Surprising resultsVoters with
higher income are supportive to Obama.
Coefficient for African American voters is lower than expected
High energy users and home owners were not supportive

More ConclusionsMore Conclusions
Expected resultsWomen Younger people
Educated people
Minorities
Expected resultsWomen Younger people
Educated people
Minorities