what your p2p vital signs are telling you - pasa home · what your p2p vital signs are telling you...
TRANSCRIPT

What Your P2P Vital
Signs Are Telling You Amy Fong | P2P Program Leader, The Hackett
Group
18th November, 2015

iSave
iPerform
iSupplier iContract Repository
iContract Authoring
iSource
AutoClass
iAnalyze
iCost
eInvoicing
Procure-to- Pay
Supplier Management Contract
Management
eSourcing
Spend Analysis Financial Savings
Management
One View
Zycus Source-to-Pay Suite
© 2015 The Hackett Group, Inc. All rights reserved. Reproduction of this document or any portion thereof without prior written consent is prohibited.

3 © 2015 The Hackett Group, Inc. All rights reserved. Reproduction of this document or any portion thereof without prior written consent is prohibited.
Presenter
Amy Fong
Senior Procurement Advisor and P2P Program Leader
Ms. Fong is a Senior Advisor for The Hackett Group’s Procurement
Executive Advisory program and Program Leader for the Purchase to Pay
Advisory Program. She has 20 years of experience in both industry and
consulting with a focus on procurement, supply chain and organizational
effectiveness. She has considerable experience in P2P Process
improvement, managing complex global supply chain partnerships,
sourcing, supplier performance & relationship management, outsourcing
evaluation and implementation and cost improvement for the North
American, Asian, and South Pacific markets. Ms. Fong holds an MBA
from Vanderbilt University and a BS from Syracuse University.

4 © 2015 The Hackett Group, Inc. All rights reserved. Reproduction of this document or any portion thereof without prior written consent is prohibited.
Enabling World-Class: Hackett’s Solution Portfolio Benchmarking, Advisory, Business Transformation
▪ Unlimited inquiry access for members to Hackett experts for transformation steering
▪ Library of 2,500+ Best Practice Research Perspectives, Books of Numbers, and Hackett
Certified Best Practices through the Best Practice Intelligence Center
▪ Peer-to-Leader 1-2-1 Best Practices sharing, and Best Practices networking events
▪ Enterprise, functional and process-based performance studies & value accelerators
▪ “Gold Standard” Benchmark – over 8,500 conducted, the empirical backbone for your
transformation at the SG&A Enterprise, Functional, and Process level.
▪ World-Class, Peer, and Custom Peer comparative metrics and best practices
▪ Ability to provide multiyear World-Class Program view of performance over time
▪ Hackett Performance Exchange (automatic accumulation of performance data from Oracle or SAP
Finance
Human Resources
Information Technology
Procurement
Supply Chain and Operations
Membership
Advisory &
Research (Provides insights into World
Class Performance)
Benchmarking (Defines World Class
Performance) Hackett Perspective on World-Class Finance – Accelerating GBS | 9
Peer Group World Class
The World-Class Advantage – FinanceWorld-Class organizations always find a way to get there
IT Cost (per end user Equivalent)
Procurement Cost (% of spend)
Peer Group World Class
23%
$1.7K$2.2K
HR Cost (per employee)
Peer Group World Class
19%
0.59%0.73%$6.0K
22%
2014 Cost of Finance by Process Category (as a % of revenue)
Finance Cost (% of revenue)
Peer Group World Class
1.12% 46%
-59%-46%
-23%
0.60%$7.7K
0.39%
0.21% 0.23%
0.16%0.11%
0.17%
Transacting Control & Risk Planning & Strategy
Practice or
Outcome
Process
Taxonomy
Vision
Dimension
SDM
Component
Capability /
Enabler 1 - Lagging 2 - Achieving 3 - Exceeding 4 - Leading
Current
State
Assessment
PriorityFuture State
TargetAverage Gap
Practice
Sourcing and
Supply Base
Strategy
Supply
Assurance
Process
Design
Degree to which a
sourcing strategy
exists
Sourcing strategy is ad hoc or
nonexistent.
Sourcing strategies reflect and are
aligned with overall business
strategy and objectives, including
high level risk requirements.
Historical spend analyses are
regularly and routinely conducted
by market and across markets -
i.e. by specific commodity, service,
location and business.
Commodity management and
sourcing strategies define
appropriate purchasing and
payment processes and tools.
Contract terms, lengths, and
conditions are defined to drive
optimal benefits to the enterprise;
in terms of total life-cycle cost,
service, and quality.
Sourcing strategy is reviewed and
updated annually (or more
frequently) to reflect direct linkage
to the company's strategic growth
plans, market changes and
product innovations, production
plans and business
M&A/ventures.
2 - Achieving 2 - Medium 3 - Exceeding 1.00
Practice
Sourcing and
Supply Base
Strategy
Supply
Assurance
Process
Design
Breadth of supplier
universe
Supplier selection is based on
historical or personal
relationships; suppliers often
selected prior to Procurement’s
involvement in a project.
Projects are initiated to limit the
total number of suppliers and
bundle the spend volume.
Procurement is involved in the
supplier selection process.
Suppliers are often considered on
a regional or compartmentalized
basis.
Supplier universe is considered
by major commodity or service
area rather than in aggregate.
Suppliers are considered for
bundled and/or extended services
that may extend to multiple areas
of competency.
Supply universe is global and not
limited to traditional commodity
suppliers.
1 - Lagging 2 - Medium 2 - Achieving 1.00
Practice
Sourcing and
Supply Base
Strategy
Supply
Assurance
Process
Design
Degree to which
supplier risk is
measured and
managed within the
sourcing process
Risk not considered as part of
sourcing decisions or supplier
management.
Supply risk is considered as part
of category-specific sourcing
efforts and supplier performance
management processes.
Supply base risk is explicitly
factored into broader business
continuity objectives. Supplier
risk is considered beyond the
specific good or service being
sourced.
Procurement works with other risk
management staff, ensuring
alignment between internal
risk/return preferences, business
objectives, and both general and
specific supply market risks.
3 - Exceeding 3 - High 4 - Leading 0.90
Practice
Sourcing and
Supply Base
Strategy
Supply
Assurance
Process
Design
Degree of
contingency
planning performed
to assure supply
No supply contingency planning
exists.
Contingency plan exists in case of
supply shortage; alternate
suppliers and alternate locations
identified.
Alternative supply sources are
developed in conjunction with
current suppliers for key
purchases.
Back-up suppliers are required for
critical or strategic categories and
items, including formalized
contingency plans to ensure
seamless supplier transition and
application of penalties and
liabilities with supplier(s) at fault.
3 - Exceeding 2 - Medium 3 - Exceeding -0.55
Practice
Sourcing and
Supply Base
Strategy
Supply
Assurance
Process
Design
Degree of supplier
qualification in
place
No formal supplier qualification
process.
Simple processes in place to
register suppliers and inspect
supplier qualifications at time of
registration or category review.
Established supplier training
program on enablement
strategies and buyer’s
technologies. Formal program
exists to identify key qualification
metrics with stratification based
on category criticality and supply
alternatives.
Annual review of at risk suppliers
and suppliers of key categories.2 - Achieving 2 - Medium 2 - Achieving 0.37
Practice
Sourcing and
Supply Base
Strategy
Supply
Assurance
Process
Design
Degree of
effectiveness and
efficiency of price
refresh process
Quoting and price refresh process
is undefined and performed
manually and on an ad hoc basis.
Quoting and price refresh process
is defined and audited manually.
Quoting and price refresh
processes are structured to
minimize enterprise financial
impact to all parties.
Quoting and price refresh
processes are automated, nearly
error-proof,, with appropriate
controls in place..
2 - Achieving 2 - Medium 2 - Achieving 0.46
Practice
Sourcing and
Supply Base
Strategy
Purchased
Cost
Reduction
Process
Design
Level of
rationalization of
supply base size
Large number of suppliers due to
short-term, “one-off” relationships.
Organization has identified the
need to rationalize the number of
suppliers in order to create
leverage.
Supply base rationalization is
complete. Few new suppliers are
needed and an added supplier
typically results in a removed
supplier (equilibrium). Strong
relationships developed with
current suppliers focusing on JPI
in critical or large dollar spend
areas.
Structured process is in place that
benchmarks the marketplace and
ensures continual supply base
assessment.
2 - Achieving 2 - Medium 2 - Achieving 0.50
Practice
Sourcing and
Supply Base
Strategy
Purchased
Cost
Reduction
Process
Design
Maturity of use of
supply market
intelligence
Supply market knowledge is ad
hoc and incomplete.
Process, tools, and sources
established to gather and
organize data on most categories.
Supply market intelligence /
knowledge captured to identify
when a supply strategy needs to
be re-visited.
Supply market intelligence /
knowledge captured, modeled,
and utilized for pro-forma
simulations done during strategic
planning, design, sales, etc.
2 - Achieving 2 - Medium 2 - Achieving 0.66
Business
Transformation (Transforms Performance into
World Class)
Service
Delivery
Components
Information
Service
Placement /
Scope
Process
Sourcing /
Location
Strategy
Process
Design
Enabling
Technology
Skills &
Talent
Governance
&Organization
Enterprise Performance Management
Shared Services, Global Business Services & Outsourcing
Merger Integration
Working Capital Management
Oracle EPM (Platinum Partner)
SAP ERP (Gold Partner)
Hyperion
Kronos
Workforce Management
Application Managed Services
Source to Pay Solutions
Assessment
Selection
Implementation
Change Management
Best Practice
Technology
Enablement (Implements Technology to
enable World Class)
In
-h
ou
se
Co
mp
le
te
O
utso
urc
in
g
Colo
catio
n
CustomerResponsibility
ProviderResponsibility
Sa
aS
A
pp
lic
atio
ns

5 © 2015 The Hackett Group, Inc. All rights reserved. Reproduction of this document or any portion thereof without prior written consent is prohibited.
How far are you from World Class?
Measure your end to end process performance with our
2015 Purchase-to-Pay Study
The Hackett Group’s industry leading Purchase-to-Pay study is still open to Zycus
contacts at no charge. This longstanding study measures key efficiency and
effectiveness performance as well as best practice adoption across Purchasing
Operations and Accounts Payable.
Participate in this study to
Learn how top-performing organizations are leveraging best practices to reduce costs, better
manage working capital, and increase process efficiency through the end to end purchase-to-pay
process
Gain insights into the characteristics of top-performing purchasing operations and accounts payable
organizations
Pinpoint the cost drivers in purchasing operations and accounts payable and identify potential
savings
Know how - and how well - your organization leverages proven best practices
Build the business case for improving purchasing operations and accounts payable performance
Receive a customized report showing how your organization’s performance compares to Purchase-
to-Pay Top Performers
Contact Zycus for a participation link

6 © 2015 The Hackett Group, Inc. All rights reserved. Reproduction of this document or any portion thereof without prior written consent is prohibited.
The Hackett Value Grid™ defines P2P Top Performers based on overall efficiency and effectiveness
Hackett Purchase to Pay Value Grid™
Example Effectiveness Drivers
First Pass Match Rate
On Time Payment Rate
Level of Spend Visibility
Streamlined Transaction
Strategy
Level of Centralization
Training Investment
Compliance to Preferred
Suppliers
Guided Buying Effectiveness
Supply Base Consolidation
Example Efficiency Drivers
Cost per Transaction
Transactions per FTE
Span of Control
Order Cycle Time
Invoice Processing Cycle
Time
Percent of Electronic
Transactions
Level of Automation

7 © 2015 The Hackett Group, Inc. All rights reserved. Reproduction of this document or any portion thereof without prior written consent is prohibited.
How does a World Class P2P Process support enterprise goals? Four Enterprise Themes in 2015
Enterprise Theme P2P Top Performance
Characteristics
Customer centricity Internal Stakeholder Centricity
Business Agility Process Automation
Big Data for Performance
Management
Digitalization of Information
Protecting the Business from
Risk
Balancing Risk and Control with
Efficiency

8 © 2015 The Hackett Group, Inc. All rights reserved. Reproduction of this document or any portion thereof without prior written consent is prohibited.
Purchase-to-Pay is an end-to-end process and an enabler to effective sourcing and supplier management
Supplier
Master Mgmt
Verification
and Approval
Invoice
Pre-Processing
Invoice
Processing
Discrepancy
Resolution
Supplier
Payment
Customer
Inquiry and
Response
File, Store, &
Retrieve
Reconciliation,
Accrual and
Compliance
Purchasing Operations
Accounts Payable
End-to-End Purchase to Pay Process
Requisition &
PO Processing
Supplier
Scheduling
Receipt
Processing
Item Master/
Content Mgmt Catalog Mgmt
Contract Master
Mgmt
Pcard
Management
Strong alignment is key: Designated "purchase-to-pay" owner is accountable for "end-
to-end" process (e.g. single accountability for the end-to-end process) or “high-level” of
coordination between Purchasing and AP
Peer
Top Performer 60% 44%

9 © 2015 The Hackett Group, Inc. All rights reserved. Reproduction of this document or any portion thereof without prior written consent is prohibited.
Top Performers are faster at placing orders and at processing invoices
Order Cycle Time
Peer
Top
Performer
Source: 2015 Hackett P2P Performance Study
Invoice Cycle Time
5 hours 6 days
15 hours 11 days
72%
60%
PO-Based
Invoices

10 © 2015 The Hackett Group, Inc. All rights reserved. Reproduction of this document or any portion thereof without prior written consent is prohibited.
While purchasing costs continue to go down, AP costs for Top Performers have flattened as the focus has moved to effectiveness and value delivery
Source: 2015 Hackett P2P Performance Study &
Procurement Benchmark
$0.00
$1.00
$2.00
$3.00
$4.00
$5.00
$6.00
$7.00
2011 2013 2015
Process Cost per Order
Process Cost per Invoice
Process Costs for Top Performers
(Labor + Outsourcing)

11 © 2015 The Hackett Group, Inc. All rights reserved. Reproduction of this document or any portion thereof without prior written consent is prohibited.
Internal Stakeholder Centricity
Guiding and supporting
requisitioners
Streamlining policies
Enabling self service
P2P Best Practice Tactics Customer Experience Management
Identify
Customers
Improving the
Customer
Experience
Measure
Success
Analyze
Results
Take
Action

12 © 2015 The Hackett Group, Inc. All rights reserved. Reproduction of this document or any portion thereof without prior written consent is prohibited.
Top Performers guide requestors to preferred sources of supply using e-Procurement tools Then they monitor channel compliance to drive improvement
Indirect Line Items Ordered
through an E-catalog
20%
43%
Peer Top Performer
Indirect Requisitions
Supported by Catalog
Content vs Free Text
Source: 2015 Hackett P2P Performance Study
54% 38%
Purchasing teams that
are effective at driving
requisitioners to
preferred buy/pay
channels with the right
supplier/right price/right
buy method
Top
Performer 85%
61%
Organizations
managing P2P
compliance by
monitoring the use of
proper buying
channels
Peer
Top
Performer 83%
44%
Peer

13 © 2015 The Hackett Group, Inc. All rights reserved. Reproduction of this document or any portion thereof without prior written consent is prohibited.
Tracking invoice inquiry response times drives the right behaviors by creating a strong stakeholder focus
29%
47%
10%
17%
21%
13%
29%
13%
12%
11%
TopPerformer
Peer
Source: 2015 Hackett P2P Performance Study
Inquiry Response Time Not Tracked
(no case management system in place)

14 © 2015 The Hackett Group, Inc. All rights reserved. Reproduction of this document or any portion thereof without prior written consent is prohibited.
Process Automation
Enhancing process
efficiency
Optimizing processes
Defining payment
strategy
P2P Best Practice Tactics Enterprise-Level Business Agility Enablers

15 © 2015 The Hackett Group, Inc. All rights reserved. Reproduction of this document or any portion thereof without prior written consent is prohibited.
Top Performers leverage electronic transactions far more than Peers, with the greatest gap in e-invoice receipt
Electronic Invoices Electronic Payments
19%
70% 69%
80%
Peer Top Performer
42%
68%
No Touch Orders
Source: 2015 Hackett P2P Performance Study
Invoice Receipt Supplier Payment PO Processing
16 © 2015 The Hackett Group, Inc. All rights reserved. Reproduction of this document or any portion thereof without prior written consent is prohibited.
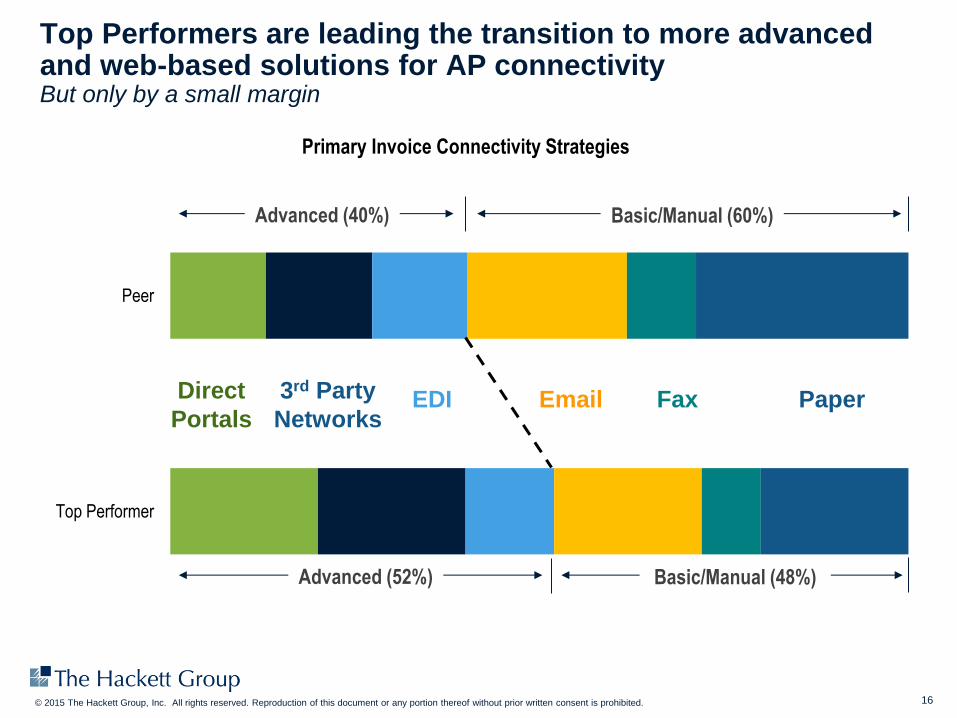
Top Performers are leading the transition to more advanced and web-based solutions for AP connectivity But only by a small margin
Primary Invoice Connectivity Strategies
Peer
Top Performer
Advanced (40%) Basic/Manual (60%)
Advanced (52%) Basic/Manual (48%)
Direct
Portals
3rd Party
Networks EDI Email Fax Paper
17 © 2015 The Hackett Group, Inc. All rights reserved. Reproduction of this document or any portion thereof without prior written consent is prohibited.
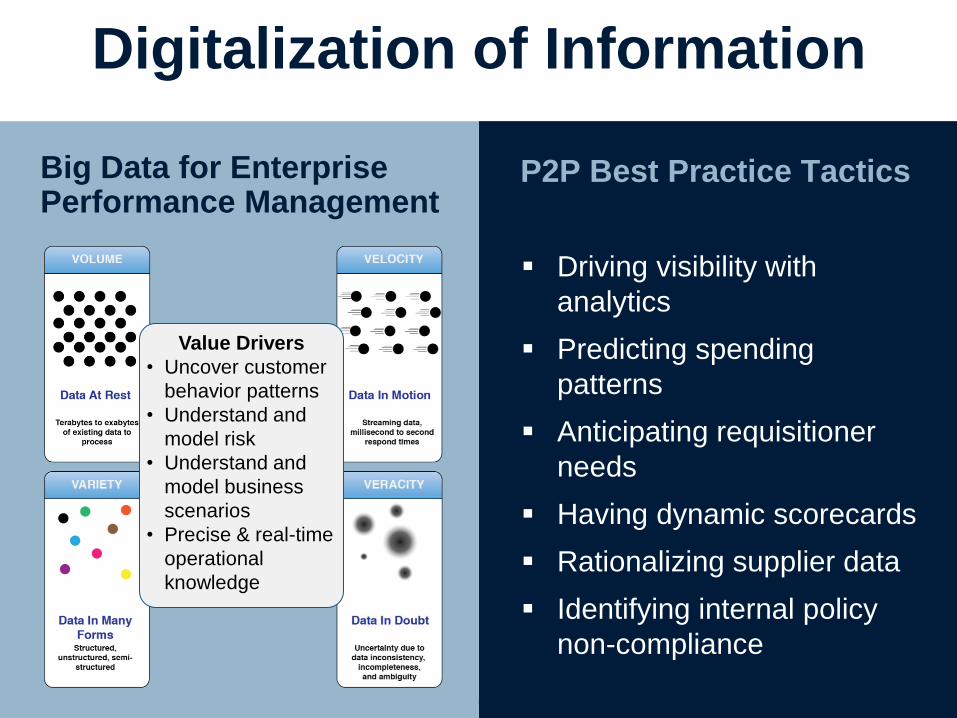
Digitalization of Information
Driving visibility with
analytics
Predicting spending
patterns
Anticipating requisitioner
needs
Having dynamic scorecards
Rationalizing supplier data
Identifying internal policy
non-compliance
P2P Best Practice Tactics Big Data for Enterprise Performance Management
Value Drivers
• Uncover customer
behavior patterns
• Understand and
model risk
• Understand and
model business
scenarios
• Precise & real-time
operational
knowledge

18 © 2015 The Hackett Group, Inc. All rights reserved. Reproduction of this document or any portion thereof without prior written consent is prohibited.
Top Performers have higher levels of visibility to spend at the line item level, a key contributing factor to spend management effectiveness
Spend Visibility at the Supplier, Category and
Line Item Level
38%
73%
Source: 2015 Hackett P2P Performance Study
Peer
Top
Performer

19 © 2015 The Hackett Group, Inc. All rights reserved. Reproduction of this document or any portion thereof without prior written consent is prohibited.
Top Performers have the benefit of a more concentrated supply base and a cleaner supplier master file
Total Active Suppliers/$Billion of Spend
Percent of Suppliers
That Make Up 80% of
Invoice Volume
10,838
2,403
Peer
Top Performer
Source: 2015 Hackett P2P Performance Study
4.5%
8%
20 © 2015 The Hackett Group, Inc. All rights reserved. Reproduction of this document or any portion thereof without prior written consent is prohibited.
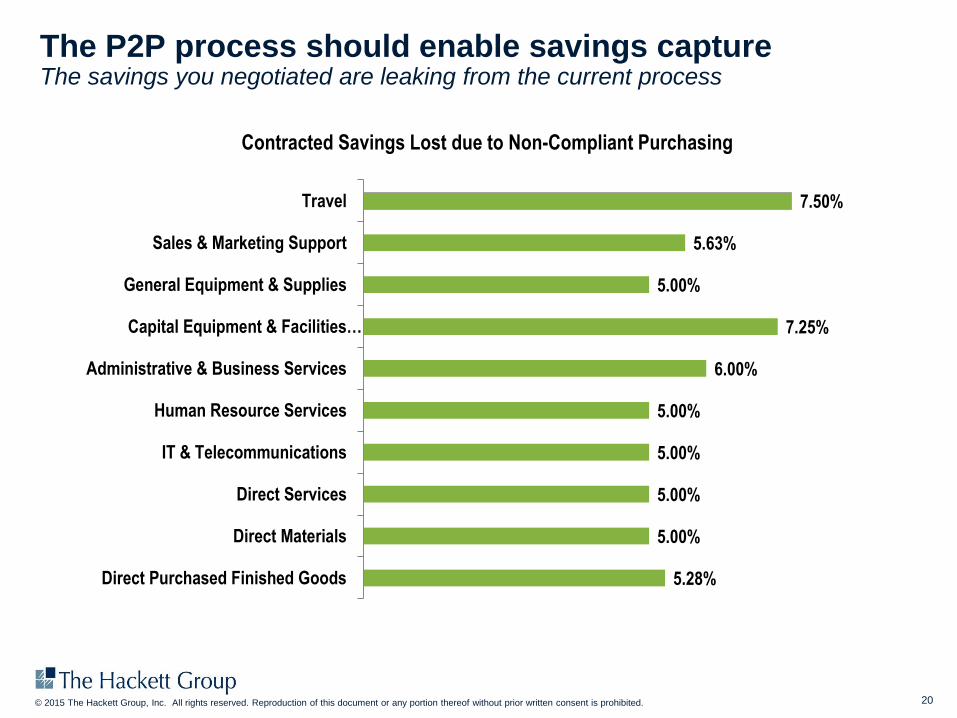
The P2P process should enable savings capture The savings you negotiated are leaking from the current process
5.28%
5.00%
5.00%
5.00%
5.00%
6.00%
7.25%
5.00%
5.63%
7.50%
Direct Purchased Finished Goods
Direct Materials
Direct Services
IT & Telecommunications
Human Resource Services
Administrative & Business Services
Capital Equipment & Facilities…
General Equipment & Supplies
Sales & Marketing Support
Travel
Contracted Savings Lost due to Non-Compliant Purchasing

21 © 2015 The Hackett Group, Inc. All rights reserved. Reproduction of this document or any portion thereof without prior written consent is prohibited.
Balancing Risk and Control with Efficiency
Establishing S2P channel
strategies
Monitoring supplier
contract compliance
Customizing supplier
onboarding
Streamlining information
gathering
Identifying fraud
P2P Best Practice Tactics Top-10 Supply Risks Cited by Procurement
# Risk Event (ranked by highest exposure)
1 Fiscal crises in key economies
2 Unexpected regulatory changes
3 Large-scale cyber-attacks
4 Environmental disasters
5 Supplier competitive events
6 Purchase price escalation effects
7 Price and supply volatility
8 Unfavorable currency movements
9 Loss/theft of sensitive/private data
10 Data loss/theft
Source: 2014 Hackett Supply Risk Management Study

22 © 2015 The Hackett Group, Inc. All rights reserved. Reproduction of this document or any portion thereof without prior written consent is prohibited.
Top Performers use a blended channel strategy based on commodity risk, balancing spend control with efficiency
Top Performers process 35% of transactions through Optimal Channels
Source: 2015 Hackett P2P Performance Study
Optimal Efficiency
Optimal Efficiency
Optimal Efficiency
Optimal Control
Optimal Control
Optimal Efficiency
Optimal Control
Optimal Control
Minimize
Travel, Pcard, Debit/Pay Cards
Evaluated Receipt Settlement
(ERS) 2-Way Match
Recurring Payment
2-Way Match
Invoice Only
Assumed Receipt
2-Way Match
3-Way Match
Contract/
PO
Contract/
PO
Contract/
PO
Contract/
PO Invoice
Invoice
Invoice
Receipt
Receipt
Invoice
Credit
Card
Top Performers control 74% of spend on a Purchase Order / Contract

23 © 2015 The Hackett Group, Inc. All rights reserved. Reproduction of this document or any portion thereof without prior written consent is prohibited.
The supplier onboarding process should leverage a custom checklist of controls and validation points
Source: 2015 Hackett P2P Performance Study
Traditional
Vendor Master File
Focused primarily on ERP fields
needed to place POs, pay
invoices, and analyze spend
Supplier Lifecycle Management
Customized data gathering based on
category and supplier profiling
Organizing and managing all key supplier
information more efficiently and effectively
Tying information into knowledge,
intelligence, and analytics
Supplier Lifecycle Management (SIM) solutions are helping to integrate onboarding
validation with broader risk and supplier management goals

24 © 2015 The Hackett Group, Inc. All rights reserved. Reproduction of this document or any portion thereof without prior written consent is prohibited.
Additional Purchase to Pay performance drivers and trends
Focus on end to end process standardization, especially globally
Technology enablement and consolidation is important
E-Invoicing implementation is a still top technology priority; self service is
next
Know your organizations broader business goals – is Working Capital a
focus? Should you be pushing for early payment discounts?
While most companies have opportunity to improve efficiency it shouldn’t
be the only goal – effectiveness drives more value for the business

25 © 2015 The Hackett Group, Inc. All rights reserved. Reproduction of this document or any portion thereof without prior written consent is prohibited.
How does a World Class P2P Process support enterprise goals?
Enterprise Theme P2P Top Performance
Characteristics
Best Practice Tactics
Customer centricity Internal Stakeholder Centricity • Guiding and supporting requisitioners
• Enabling self service
• Streamlining policies
Business Agility
Process Automation • Enhancing process efficiency
• Optimizing processes
• Defining payment strategy
Big Data for
Performance
Management
Digitalization of Information • Driving visibility with analytics
• Predicting spending patterns
• Anticipating requisitioner needs
• Creating dynamic scorecards
• Rationalizing supplier data
Protecting the
Business from Risk
Balancing Risk and Control
with Efficiency
• Establishing S2P channel strategies
• Monitoring supplier contract compliance
• Customizing supplier onboarding
• Streamlining information gathering
• Identifying fraud
• Addressing internal policy non-compliance

26 © 2015 The Hackett Group, Inc. All rights reserved. Reproduction of this document or any portion thereof without prior written consent is prohibited.
Amsterdam | Atlanta | Chicago | Frankfurt | Hyderabad | London | Miami
Montevideo | New York | Paris | Philadelphia | San Francisco | Sydney | Vancouver
Contact information
Amy M. Fong
P2P Advisory Program Leader
+408 887 7335| m

27 © 2015 The Hackett Group, Inc. All rights reserved. Reproduction of this document or any portion thereof without prior written consent is prohibited.
Statement of Confidentiality and Usage Restrictions
This document contains trade secrets and other information that is company sensitive, proprietary, and confidential, the disclosure of which would provide a competitive advantage to others. As a result, the
reproduction, copying, or redistribution of this document or the contents contained herein, in whole or in part, for any purpose is strictly prohibited without the prior written consent of The Hackett Group.
www.thehackettgroup.com
Thank You