whatever happened to canada's automotive trade … · introduction 1 introduction between 1982...
TRANSCRIPT
1
Average hourly wag-es in automotive assembly and parts manufacturing in Canada have declined since
Res
truc
turi
ng in
the
Aut
omot
ive
Ind
ustr
y
aprc.mcmaster.ca
1. This report was made possible by the support of funds from the Automotive Policy Research Centre (APRC) at McMaster University, which is an APC-SSHRC funded project.
Whatever Happened to Canada’s Automotive Trade Surplus? A Preliminary Note
John Holmes, Queen’s University
March 2015
Automotive PolicyResearch Centre
Intr
oduc
tion
1
Introduction
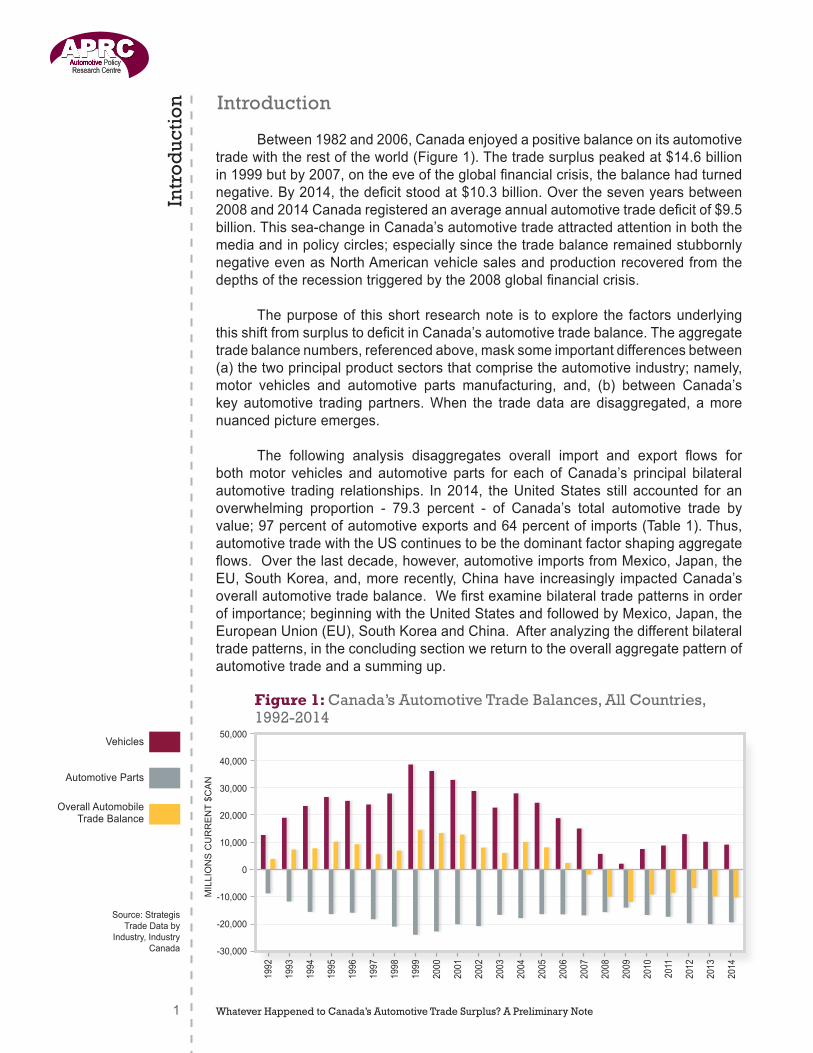
Between 1982 and 2006, Canada enjoyed a positive balance on its automotive trade with the rest of the world (Figure 1). The trade surplus peaked at $14.6 billion in 1999 but by 2007, on the eve of the global financial crisis, the balance had turned negative. By 2014, the deficit stood at $10.3 billion. Over the seven years between 2008 and 2014 Canada registered an average annual automotive trade deficit of $9.5 billion. This sea-change in Canada’s automotive trade attracted attention in both the media and in policy circles; especially since the trade balance remained stubbornly negative even as North American vehicle sales and production recovered from the depths of the recession triggered by the 2008 global financial crisis.
The purpose of this short research note is to explore the factors underlying this shift from surplus to deficit in Canada’s automotive trade balance. The aggregate trade balance numbers, referenced above, mask some important differences between (a) the two principal product sectors that comprise the automotive industry; namely, motor vehicles and automotive parts manufacturing, and, (b) between Canada’s key automotive trading partners. When the trade data are disaggregated, a more nuanced picture emerges.
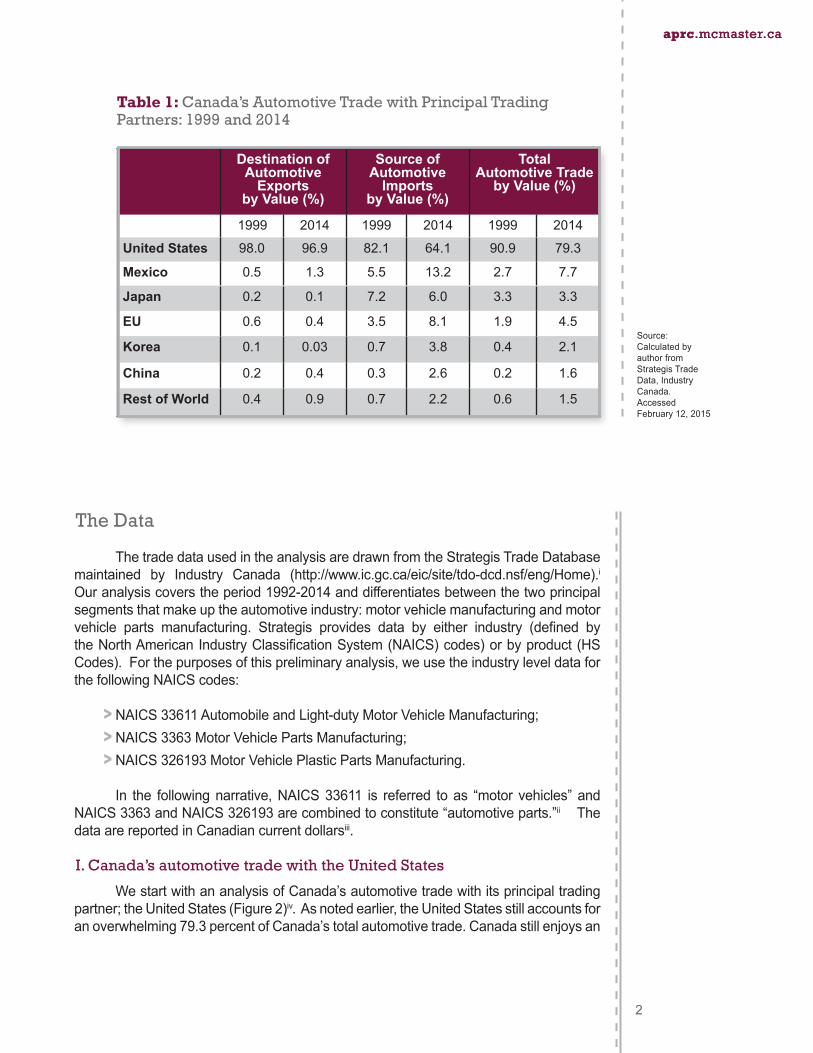
The following analysis disaggregates overall import and export flows for both motor vehicles and automotive parts for each of Canada’s principal bilateral automotive trading relationships. In 2014, the United States still accounted for an overwhelming proportion - 79.3 percent - of Canada’s total automotive trade by value; 97 percent of automotive exports and 64 percent of imports (Table 1). Thus, automotive trade with the US continues to be the dominant factor shaping aggregate flows. Over the last decade, however, automotive imports from Mexico, Japan, the EU, South Korea, and, more recently, China have increasingly impacted Canada’s overall automotive trade balance. We first examine bilateral trade patterns in order of importance; beginning with the United States and followed by Mexico, Japan, the European Union (EU), South Korea and China. After analyzing the different bilateral trade patterns, in the concluding section we return to the overall aggregate pattern of automotive trade and a summing up.
Whatever Happened to Canada’s Automotive Trade Surplus? A Preliminary Note
Figure 1: Canada’s Automotive Trade Balances, All Countries, 1992-2014
1992
1993
1994
1995
1996
1997
1998
1999
2000
2001
2002
2003
2004
2005
2006
2007
2008
2009
2010
2011
2012
2013
2014
50,000
40,000
30,000
20,000
10,000
0
-10,000
-20,000
-30,000
MIL
LIO
NS
CU
RR
EN
T $C
AN
Vehicles
Automotive Parts
Overall Automobile Trade Balance
Source: Strategis Trade Data by
Industry, Industry Canada
The Data
The trade data used in the analysis are drawn from the Strategis Trade Database maintained by Industry Canada (http://www.ic.gc.ca/eic/site/tdo-dcd.nsf/eng/Home).i Our analysis covers the period 1992-2014 and differentiates between the two principal segments that make up the automotive industry: motor vehicle manufacturing and motor vehicle parts manufacturing. Strategis provides data by either industry (defined by the North American Industry Classification System (NAICS) codes) or by product (HS Codes). For the purposes of this preliminary analysis, we use the industry level data for the following NAICS codes:
> NAICS 33611 Automobile and Light-duty Motor Vehicle Manufacturing; > NAICS 3363 Motor Vehicle Parts Manufacturing; > NAICS 326193 Motor Vehicle Plastic Parts Manufacturing.
In the following narrative, NAICS 33611 is referred to as “motor vehicles” and NAICS 3363 and NAICS 326193 are combined to constitute “automotive parts.”ii The data are reported in Canadian current dollarsiii.
I. Canada’s automotive trade with the United States
We start with an analysis of Canada’s automotive trade with its principal trading partner; the United States (Figure 2)iv. As noted earlier, the United States still accounts for an overwhelming 79.3 percent of Canada’s total automotive trade. Canada still enjoys an
2
aprc.mcmaster.caaprc.mcmaster.ca
Source: Calculated by author from Strategis Trade Data, Industry Canada. Accessed February 12, 2015
Table 1: Canada’s Automotive Trade with Principal Trading Partners: 1999 and 2014
Destination of Automotive
Exports by Value (%)
Source of Automotive
Imports by Value (%)
Total Automotive Trade
by Value (%)
1999 2014 1999 2014 1999 2014
United States 98.0 96.9 82.1 64.1 90.9 79.3
Mexico 0.5 1.3 5.5 13.2 2.7 7.7
Japan 0.2 0.1 7.2 6.0 3.3 3.3
EU 0.6 0.4 3.5 8.1 1.9 4.5
Korea 0.1 0.03 0.7 3.8 0.4 2.1
China 0.2 0.4 0.3 2.6 0.2 1.6
Rest of World 0.4 0.9 0.7 2.2 0.6 1.5
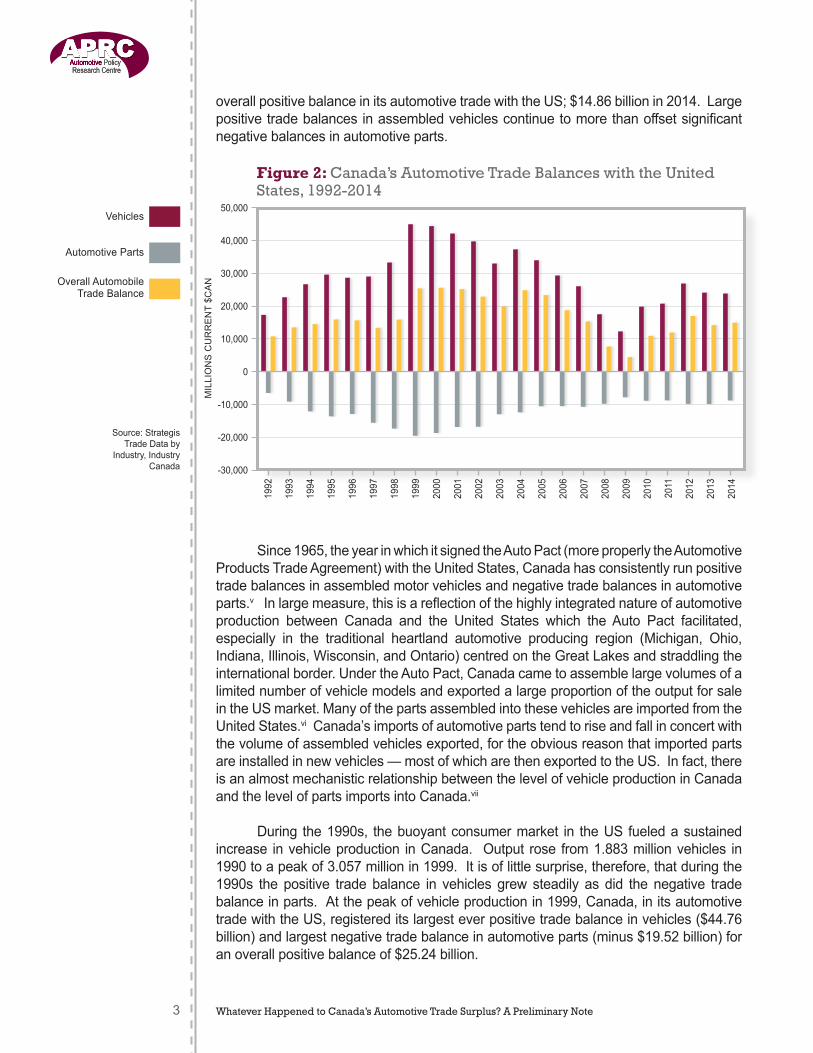
overall positive balance in its automotive trade with the US; $14.86 billion in 2014. Large positive trade balances in assembled vehicles continue to more than offset significant negative balances in automotive parts.
Since 1965, the year in which it signed the Auto Pact (more properly the Automotive Products Trade Agreement) with the United States, Canada has consistently run positive trade balances in assembled motor vehicles and negative trade balances in automotive parts.v In large measure, this is a reflection of the highly integrated nature of automotive production between Canada and the United States which the Auto Pact facilitated, especially in the traditional heartland automotive producing region (Michigan, Ohio, Indiana, Illinois, Wisconsin, and Ontario) centred on the Great Lakes and straddling the international border. Under the Auto Pact, Canada came to assemble large volumes of a limited number of vehicle models and exported a large proportion of the output for sale in the US market. Many of the parts assembled into these vehicles are imported from the United States.vi Canada’s imports of automotive parts tend to rise and fall in concert with the volume of assembled vehicles exported, for the obvious reason that imported parts are installed in new vehicles — most of which are then exported to the US. In fact, there is an almost mechanistic relationship between the level of vehicle production in Canada and the level of parts imports into Canada.vii
During the 1990s, the buoyant consumer market in the US fueled a sustained increase in vehicle production in Canada. Output rose from 1.883 million vehicles in 1990 to a peak of 3.057 million in 1999. It is of little surprise, therefore, that during the 1990s the positive trade balance in vehicles grew steadily as did the negative trade balance in parts. At the peak of vehicle production in 1999, Canada, in its automotive trade with the US, registered its largest ever positive trade balance in vehicles ($44.76 billion) and largest negative trade balance in automotive parts (minus $19.52 billion) for an overall positive balance of $25.24 billion.
3 Whatever Happened to Canada’s Automotive Trade Surplus? A Preliminary Note
50,000
40,000
30,000
20,000
10,000
0
-10,000
-20,000
-30,000
1992
1993
1994
1995
1996
1997
1998
1999
2000
2001
2002
2003
2004
2005
2006
2007
2008
2009
2010
2011
2012
2013
2014
Figure 2: Canada’s Automotive Trade Balances with the United States, 1992-2014
Source: Strategis Trade Data by
Industry, Industry Canada
MIL
LIO
NS
CU
RR
EN
T $C
AN
Vehicles
Automotive Parts
Overall Automobile Trade Balance
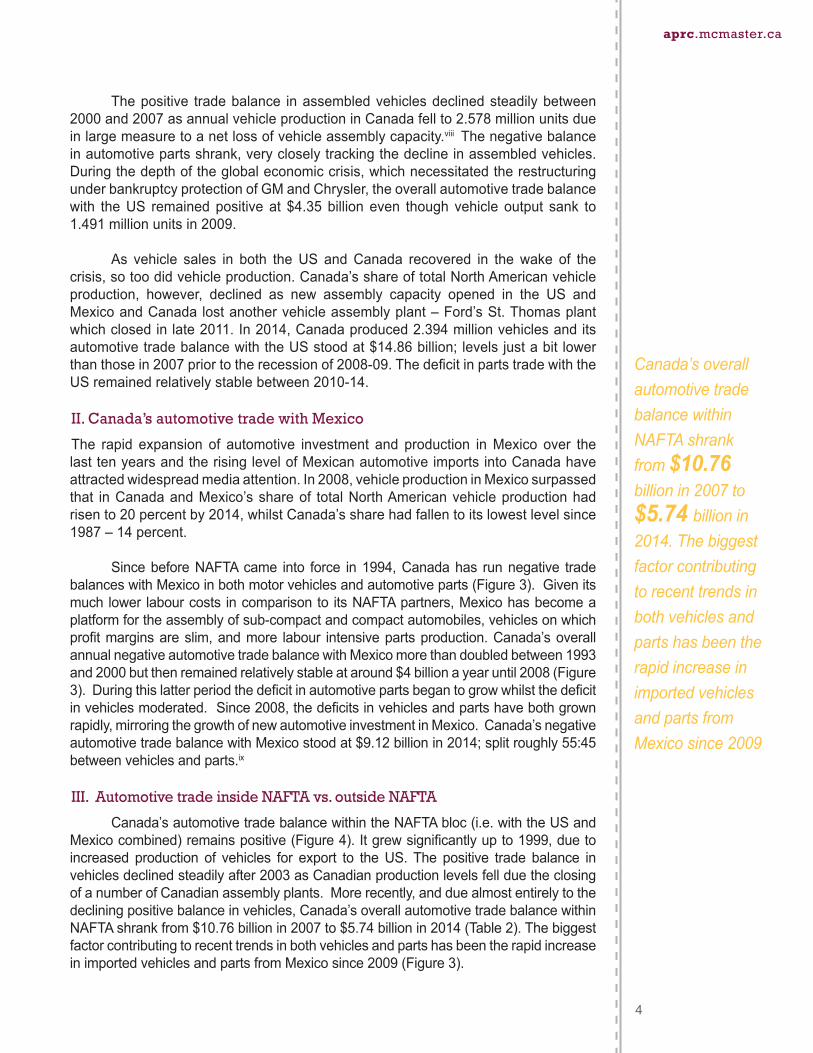
The positive trade balance in assembled vehicles declined steadily between 2000 and 2007 as annual vehicle production in Canada fell to 2.578 million units due in large measure to a net loss of vehicle assembly capacity.viii The negative balance in automotive parts shrank, very closely tracking the decline in assembled vehicles. During the depth of the global economic crisis, which necessitated the restructuring under bankruptcy protection of GM and Chrysler, the overall automotive trade balance with the US remained positive at $4.35 billion even though vehicle output sank to 1.491 million units in 2009.
As vehicle sales in both the US and Canada recovered in the wake of the crisis, so too did vehicle production. Canada’s share of total North American vehicle production, however, declined as new assembly capacity opened in the US and Mexico and Canada lost another vehicle assembly plant – Ford’s St. Thomas plant which closed in late 2011. In 2014, Canada produced 2.394 million vehicles and its automotive trade balance with the US stood at $14.86 billion; levels just a bit lower than those in 2007 prior to the recession of 2008-09. The deficit in parts trade with the US remained relatively stable between 2010-14.
II. Canada’s automotive trade with Mexico
The rapid expansion of automotive investment and production in Mexico over the last ten years and the rising level of Mexican automotive imports into Canada have attracted widespread media attention. In 2008, vehicle production in Mexico surpassed that in Canada and Mexico’s share of total North American vehicle production had risen to 20 percent by 2014, whilst Canada’s share had fallen to its lowest level since 1987 – 14 percent.
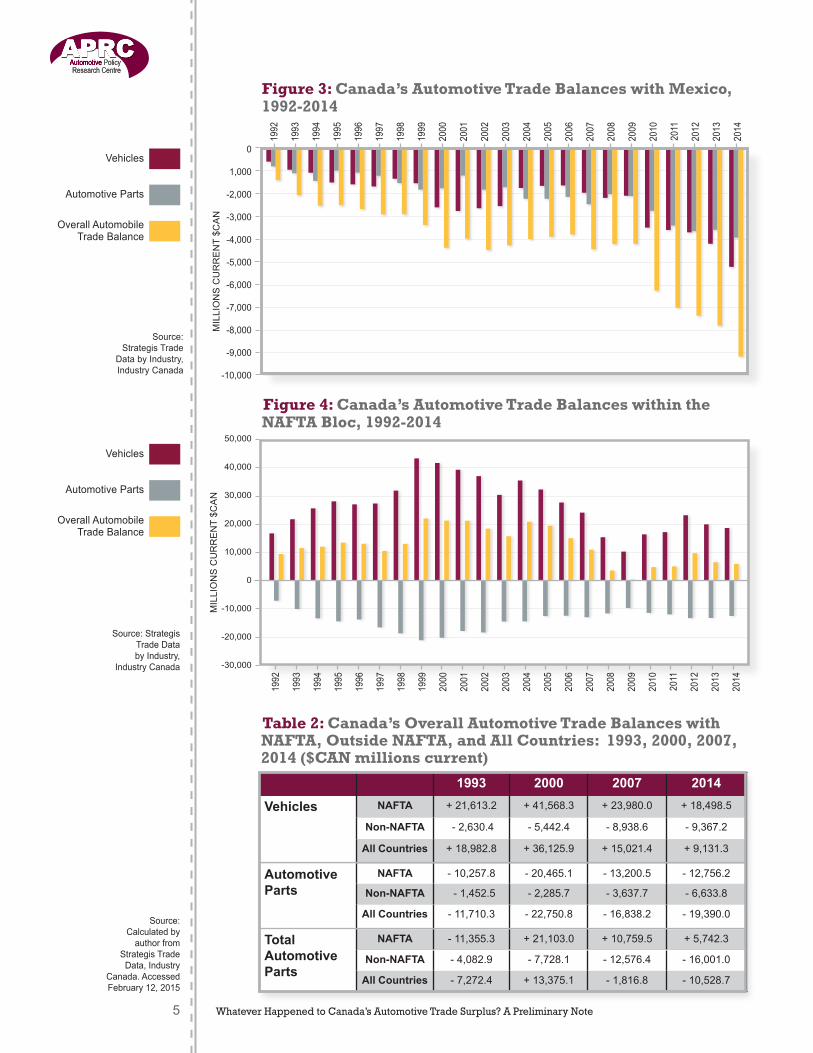
Since before NAFTA came into force in 1994, Canada has run negative trade balances with Mexico in both motor vehicles and automotive parts (Figure 3). Given its much lower labour costs in comparison to its NAFTA partners, Mexico has become a platform for the assembly of sub-compact and compact automobiles, vehicles on which profit margins are slim, and more labour intensive parts production. Canada’s overall annual negative automotive trade balance with Mexico more than doubled between 1993 and 2000 but then remained relatively stable at around $4 billion a year until 2008 (Figure 3). During this latter period the deficit in automotive parts began to grow whilst the deficit in vehicles moderated. Since 2008, the deficits in vehicles and parts have both grown rapidly, mirroring the growth of new automotive investment in Mexico. Canada’s negative automotive trade balance with Mexico stood at $9.12 billion in 2014; split roughly 55:45 between vehicles and parts.ix
III. Automotive trade inside NAFTA vs. outside NAFTA
Canada’s automotive trade balance within the NAFTA bloc (i.e. with the US and Mexico combined) remains positive (Figure 4). It grew significantly up to 1999, due to increased production of vehicles for export to the US. The positive trade balance in vehicles declined steadily after 2003 as Canadian production levels fell due the closing of a number of Canadian assembly plants. More recently, and due almost entirely to the declining positive balance in vehicles, Canada’s overall automotive trade balance within NAFTA shrank from $10.76 billion in 2007 to $5.74 billion in 2014 (Table 2). The biggest factor contributing to recent trends in both vehicles and parts has been the rapid increase in imported vehicles and parts from Mexico since 2009 (Figure 3).
4
aprc.mcmaster.ca
Canada’s overall automotive trade balance within NAFTA shrank from $10.76 billion in 2007 to $5.74 billion in 2014. The biggest factor contributing to recent trends in both vehicles and parts has been the rapid increase in imported vehicles and parts from Mexico since 2009
Whatever Happened to Canada’s Automotive Trade Surplus? A Preliminary Note5
1992
1993
1994
1995
1996
1997
1998
1999
2000
2001
2002
2003
2004
2005
2006
2007
2008
2009
2010
2011
2012
2013
2014
50,000
40,000
30,000
20,000
10,000
0
-10,000
-20,000
-30,000
Mill
ions
Cur
rent
$CA
N
Table 2: Canada’s Overall Automotive Trade Balances with NAFTA, Outside NAFTA, and All Countries: 1993, 2000, 2007, 2014 ($CAN millions current)
Figure 4: Canada’s Automotive Trade Balances within the NAFTA Bloc, 1992-2014
MIL
LIO
NS
CU
RR
EN
T $C
AN
Vehicles
Automotive Parts
Overall AutomobileTrade Balance
Vehicles
Automotive Parts
Overall AutomobileTrade Balance
Source: Strategis Trade Data by Industry,
Industry Canada
Source:Calculated by
author from Strategis Trade
Data, Industry Canada. Accessed February 12, 2015
0
1,000
-2,000
-3,000
-4,000
-5,000
-6,000
-7,000
-8,000
-9,000
-10,000
1992
1993
1994
1995
1996
1997
1998
1999
2000
2001
2002
2003
2004
2005
2006
2007
2008
2009
2010
2011
2012
2013
2014
Mill
ions
Cur
rent
$CA
N
Figure 3: Canada’s Automotive Trade Balances with Mexico, 1992-2014
Source: Strategis Trade
Data by Industry, Industry Canada
MIL
LIO
NS
CU
RR
EN
T $C
AN
1993 2000 2007 2014
Vehicles
NAFTA + 21,613.2 + 41,568.3 + 23,980.0 + 18,498.5
Non-NAFTA - 2,630.4 - 5,442.4 - 8,938.6 - 9,367.2
All Countries + 18,982.8 + 36,125.9 + 15,021.4 + 9,131.3
Automotive Parts
NAFTA - 10,257.8 - 20,465.1 - 13,200.5 - 12,756.2
Non-NAFTA - 1,452.5 - 2,285.7 - 3,637.7 - 6,633.8
All Countries - 11,710.3 - 22,750.8 - 16,838.2 - 19,390.0
TotalAutomotiveParts
NAFTA - 11,355.3 + 21,103.0 + 10,759.5 + 5,742.3
Non-NAFTA - 4,082.9 - 7,728.1 - 12,576.4 - 16,001.0
All Countries - 7,272.4 + 13,375.1 - 1,816.8 - 10,528.7
6
aprc.mcmaster.ca
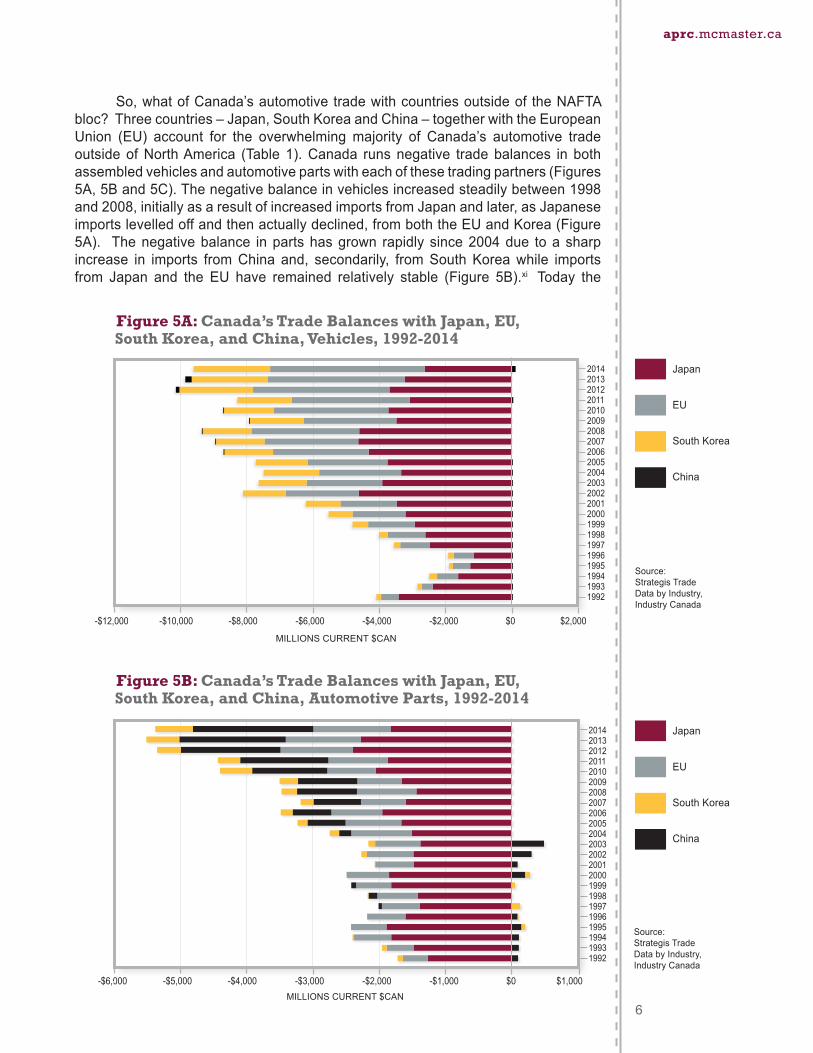
So, what of Canada’s automotive trade with countries outside of the NAFTA bloc? Three countries – Japan, South Korea and China – together with the European Union (EU) account for the overwhelming majority of Canada’s automotive trade outside of North America (Table 1). Canada runs negative trade balances in both assembled vehicles and automotive parts with each of these trading partners (Figures 5A, 5B and 5C). The negative balance in vehicles increased steadily between 1998 and 2008, initially as a result of increased imports from Japan and later, as Japanese imports levelled off and then actually declined, from both the EU and Korea (Figure 5A). The negative balance in parts has grown rapidly since 2004 due to a sharp increase in imports from China and, secondarily, from South Korea while imports from Japan and the EU have remained relatively stable (Figure 5B).xi Today the
Source: Strategis Trade Data by Industry, Industry Canada
Source: Strategis Trade Data by Industry, Industry Canada
Figure 5B: Canada’s Trade Balances with Japan, EU, South Korea, and China, Automotive Parts, 1992-2014
Japan
EU
South Korea
China
Japan
EU
South Korea
China
20142013201220112010200920082007200620052004200320022001200019991998199719961995199419931992
-$12,000 -$10,000 -$8,000 -$6,000 -$4,000 -$2,000 $0 $2,000
Figure 5A: Canada’s Trade Balances with Japan, EU, South Korea, and China, Vehicles, 1992-2014
MILLIONS CURRENT $CAN
20142013201220112010200920082007200620052004200320022001200019991998199719961995199419931992
MILLIONS CURRENT $CAN
-$6,000 -$5,000 -$4,000 -$3,000 -$2,000 -$1,000 $0 $1,000
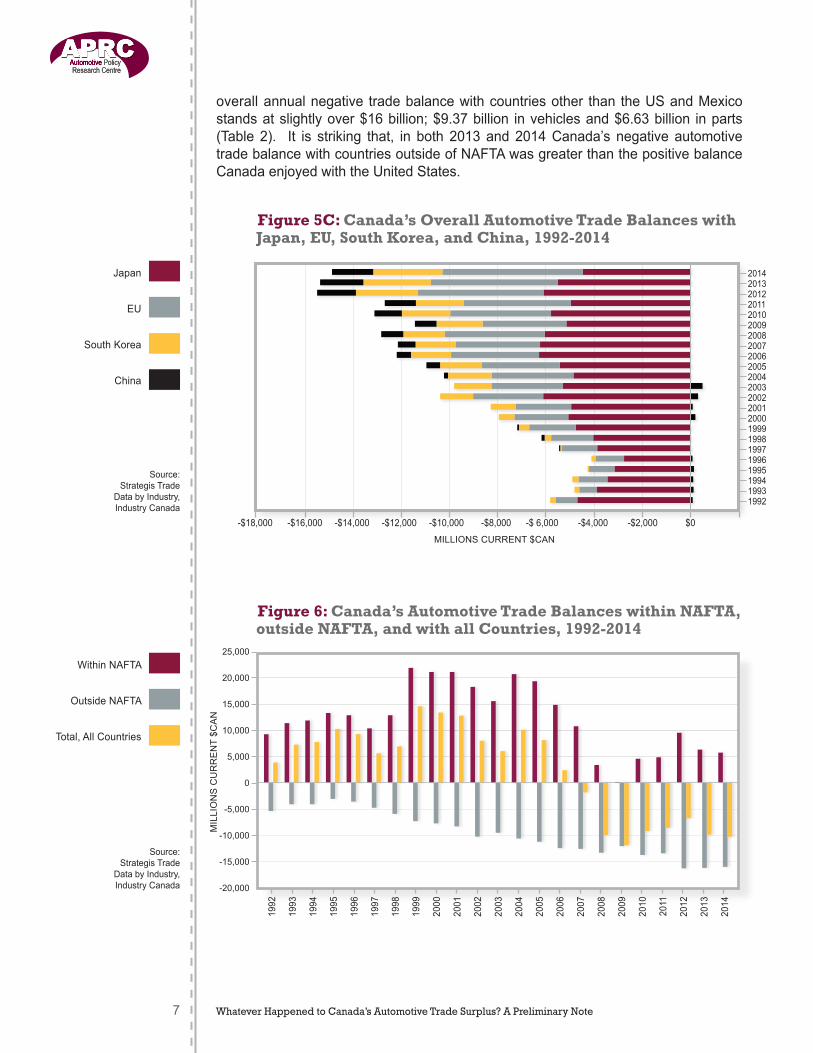
overall annual negative trade balance with countries other than the US and Mexico stands at slightly over $16 billion; $9.37 billion in vehicles and $6.63 billion in parts (Table 2). It is striking that, in both 2013 and 2014 Canada’s negative automotive trade balance with countries outside of NAFTA was greater than the positive balance Canada enjoyed with the United States.
Whatever Happened to Canada’s Automotive Trade Surplus? A Preliminary Note7
20142013201220112010200920082007200620052004200320022001200019991998199719961995199419931992
-$18,000 -$16,000 -$14,000 -$12,000 -$10,000 -$8,000 -$ 6,000 -$4,000 -$2,000 $0
1992
1993
1994
1995
1996
1997
1998
1999
2000
2001
2002
2003
2004
2005
2006
2007
2008
2009
2010
2011
2012
2013
2014
25,000
20,000
15,000
10,000
5,000
0
-5,000
-10,000
-15,000
-20,000
Figure 5C: Canada’s Overall Automotive Trade Balances with Japan, EU, South Korea, and China, 1992-2014
Figure 6: Canada’s Automotive Trade Balances within NAFTA, outside NAFTA, and with all Countries, 1992-2014
Source: Strategis Trade
Data by Industry, Industry Canada
Source: Strategis Trade
Data by Industry, Industry Canada
Japan
EU
South Korea
China
Within NAFTA
Outside NAFTA
Total, All Countries
MILLIONS CURRENT $CAN
MIL
LIO
NS
CU
RR
EN
T $C
AN
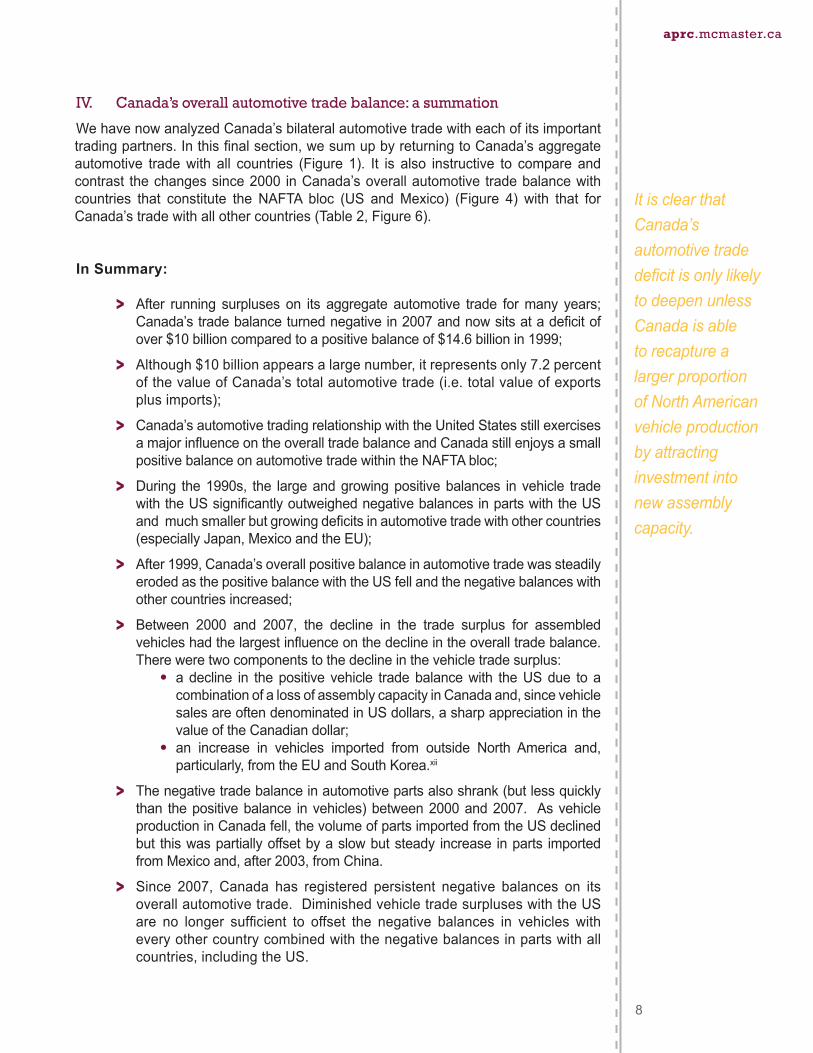
IV. Canada’s overall automotive trade balance: a summation We have now analyzed Canada’s bilateral automotive trade with each of its important trading partners. In this final section, we sum up by returning to Canada’s aggregate automotive trade with all countries (Figure 1). It is also instructive to compare and contrast the changes since 2000 in Canada’s overall automotive trade balance with countries that constitute the NAFTA bloc (US and Mexico) (Figure 4) with that for Canada’s trade with all other countries (Table 2, Figure 6).
In Summary:
> After running surpluses on its aggregate automotive trade for many years; Canada’s trade balance turned negative in 2007 and now sits at a deficit of over $10 billion compared to a positive balance of $14.6 billion in 1999;
> Although $10 billion appears a large number, it represents only 7.2 percent of the value of Canada’s total automotive trade (i.e. total value of exports plus imports);
> Canada’s automotive trading relationship with the United States still exercises a major influence on the overall trade balance and Canada still enjoys a small positive balance on automotive trade within the NAFTA bloc;
> During the 1990s, the large and growing positive balances in vehicle trade with the US significantly outweighed negative balances in parts with the US and much smaller but growing deficits in automotive trade with other countries (especially Japan, Mexico and the EU);
> After 1999, Canada’s overall positive balance in automotive trade was steadily eroded as the positive balance with the US fell and the negative balances with other countries increased;
> Between 2000 and 2007, the decline in the trade surplus for assembled vehicles had the largest influence on the decline in the overall trade balance. There were two components to the decline in the vehicle trade surplus:
• a decline in the positive vehicle trade balance with the US due to a combination of a loss of assembly capacity in Canada and, since vehicle sales are often denominated in US dollars, a sharp appreciation in the value of the Canadian dollar;
• an increase in vehicles imported from outside North America and, particularly, from the EU and South Korea.xii
> The negative trade balance in automotive parts also shrank (but less quickly than the positive balance in vehicles) between 2000 and 2007. As vehicle production in Canada fell, the volume of parts imported from the US declined but this was partially offset by a slow but steady increase in parts imported from Mexico and, after 2003, from China.
> Since 2007, Canada has registered persistent negative balances on its overall automotive trade. Diminished vehicle trade surpluses with the US are no longer sufficient to offset the negative balances in vehicles with every other country combined with the negative balances in parts with all countries, including the US.
8
aprc.mcmaster.ca
It is clear that Canada’s automotive trade deficit is only likely to deepen unless Canada is able to recapture a larger proportion of North American vehicle production by attracting investment into new assembly capacity.
Whatever Happened to Canada’s Automotive Trade Surplus? A Preliminary Note9
• Since 2009, imports of both vehicles and parts from Mexico and parts from Japan, China and Korea have all risen sharply.
• In 2014, the value of Canadian automotive parts exports was approximately 25 percent lower than in 2004. This decline resulted from a combination of the rising value of the Canadian dollar, the closing of Canadian parts plants during the recession of 2008-09, and the logistical challenges faced by Canadian plants in supplying the southward shift in North American assembly capacity.xiii
It is clear from the above analysis that Canada’s automotive trade deficit is only likely to deepen unless Canada is able to recapture a larger proportion of North American vehicle production by attracting investment into new assembly capacity.
Recent developments do not augur well. The threat of a further reduction in Canadian assembly capacity is very real given the continuing uncertainty regarding GM’s footprint in Oshawa after 2016. The closing of one or both of the GM Oshawa plants would significantly erode Canada’s remaining positive vehicle trade balance with the US. At the same time, recently announced trade deals with South Korea and the EU could well result in a worsening of automotive trade balances for Canada.
In a subsequent extended version of this analysis, we will look in detail at variations in the patterns of trade by the various sub-industries that constitute NAICS 3363 (i.e. engines and engine parts; electrical and electronic equipment; steering and suspension components; brake systems; transmission and power train parts; seating and interior trim; metal stampings; and “other” parts) as well as NAICS 326193 (plastic parts). We will also illustrate how dependent for its automotive parts trade (for both exports and imports) Canada is on the Great Lakes Region of the US.
10
aprc.mcmaster.ca
Footnotes i. Notwithstanding certain limitations, the Strategis Trade Data Base is widely used as a consistent and
user friendly source of trade data that allows a relatively high degree of both industry and geographical disaggregation. An alternative source of trade data can be found in CANSIM 228-0059.
ii. NAICS 326193 (Plastic Parts for Motor Vehicles) is a very important component of the automotive parts industry in Canada. Hence, it is important to combine NAICS 326193 with NAICS 3363 in order to provide a more accurate picture of the Canadian automotive parts industry. We do not include heavy duty trucks (NAICS 33612) or vehicle bodies and trailers (NAICS 3362) in the analysis. There are other industries that supply parts to the automotive industry (e.g. batteries, tires, glass) that are not included under NAICS 3363 and, hence, are also omitted from this analysis. Unlike plastic parts, the industry-level trade data for these industries do not allow differentiation between output destined for the automotive industry and that supplied for non-automotive uses. NAICS 3363 may be disaggregated into 8 sub-industries at the NAICS 5-digit level and future research will include an analysis of automotive parts trade at that disaggregated level.
iii. A subsequent and more comprehensive analysis will also examine differences that may arise when the data are converted to constant dollars and US dollar values are used. The latter potentially could be significant given the size of the trade flows between Canada and the US and the fact that the exchange rate between the Canadian and US dollar changed significantly over the period under study.
iv. Canada’s trade in automotive parts is not only dominated by the US but by one region within the United States; the Great Lakes region. In 2013, that region (Michigan, Ohio, Indiana, Illinois and Wisconsin) was the destination for 67 percent of Canada’s automotive parts exports and the source of 47 percent of automotive parts imports.
v. For data on Canada’s automotive trade with the United States prior to 1992 see J. Holmes (2004) The Auto Pact from 1965 to the Canada United States Free Trade Agreement, in M. Irish (ed.) The Auto Pact: Investment, Labour and the WTO. The Hague: Kluwer Law International pp. 3-21.
vi. In 1992, for example, parts imported from the US represented 67 percent of Canada’s apparent domestic market (ADM) for automotive parts, where ADM= value of manufactured shipments – exports + imports. By 2012 this had declined to 52 percent although imported parts from all countries accounted for 76 percent of the ADM.
vii. P. Kumar and J. Holmes (1998) The Impact of NAFTA on the Auto Industry in Canada, in S. Weintraub and C. Sands (eds.) The North American Auto Industry Under NAFTA. Washington D.C.: The CSIS Press. pp. 92-183.
viii. The following assembly plants closed between 2000-08: GM Ste. Therese (2002); Chrysler Pillette Road Van Plant (2003); Ford Ontario Truck Plant (Oakville) (2004); and, GM Truck Plant (Oshawa) (2008). Only one new assembly plant – Toyota Woodstock (2008) – was opened in the same period.
ix. To put the increased deficits in Canada’s automotive trade with Mexico into perspective, however, remember that automotive imports from Mexico in 2014 still only accounted for about one-fifth of the level of imports from the US and that Mexico accounts for less that 8 percent of Canada’s total automotive trade (Table 1).
x. The levelling off of imported vehicles from Japan after 2002 probably reflects Japanese automakers opening more North American assembly capacity to serve the NAFTA market including Canada. Note the dip of roughly $650 million in the trade deficit with Japan in between 2010 and 2011 likely due to the impact of the early 2011 earthquake/tsunami that depressed Japanese vehicle production and exports for close to a year.
xi. In 2014 Canada imported almost equal quantities of parts by value from both China and Japan. It is probable that the composition of these two import flows is quite different; with higher value-added componentry from Japan and low value-added parts from China.
xii. Note that vehicle imports from Japan fluctuated but remained relatively stable between 2000 and 2007. Increased imports of vehicles from Mexico really don’t happen until after 2009.
xiii Increasingly, Canadian owned companies are shifting production to their newly opened or expanded parts plants in the southern US and Mexico to overcome these logistically challenges.
Foo
tno
tes