what's new in ram commander version 7 · web viewthe document covers only the features which...
TRANSCRIPT

What’s New in RAM Commander version 7.6
This document describes new features of RAM Commander 7.6. The document covers only the features which were added to the RAM Commander 7.6 since 7.52 version. Please, see RAMC_7_52_ReleaseNotes and other previous documents for earlier versions new features.
Major Improvements and New Features
Markov Chains Module – Beta version Customizable fields in Product tree view Telcordia Issue 2 reliability prediction method 217PlusTM reliability prediction method
General
Ref.Des. field width increased to 50 characters Manufacturer field width increased to 50 characters Global Change support of ILS data New improved Graph Generator control
Reliability
Improved component library support for FIDES
Maintainability
New Report - MAC (Maintenance Allocation Chart) Improvements in Standard Tasks Library
FMECA and TAM Module
Failure Modes Library can be filtered for Failure Modes or Next Higher Effects or both
New format for FMECA import added
Design/Process FMEA
New customizable fields Several fields width increased
A.L.D. Headquarters52 Menachem Begin Road, Tel-Aviv, 67137 ISRAEL
Phone: (972-3) 791-3200 Fax: (972-3) 791-3210 E-mail: [email protected] Web : www.aldservice.com

Fixed features
Report Generator: option to view items inside assembly if there are Functional Blocks
Sockets calculation in MIL-HDBK-217F Notice 2 Part Stress GPRD: ability to save data in European decimal comma delimited format; many additional corrections and improvements
Installation of RAMC 7.6For the local stand-alone installation, run the RAMCW76.EXE downloaded from the A.L.D. web site (www.aldservice.com) , or run RAMC\setup.exe from the installation CD. For additional instructions and for client-server configuration, see User Manual: Installation guide.
2

RAM Commander version 7.6 Release NotesMarkov Chains Module
The Markov chain technique and its mathematical model have been demonstrated over years to be a powerful tool to analyze the evolution, performance and reliability of physical systems.
RAM Commander Markov is a powerful tool with the following features:
Up-to-date, intuitive and powerful Markov Chain diagram interface with possibilities of full control over the diagram: elements location, colors, styles, zooms etc.
Convenient ways of diagram printing and simple Copy & Paste transfer to other applications
Calculation of Steady-State Mode Calculation of Time-Dependency Mode Calculation of Availability, Unavailability, Failure and Repair rate and frequency, MTBF,
MTTF, MTTR, Reliability/Unreliability and other system parameters. Results output:
o System parameters for selected times as table or grapho State probabilities for selected times as table or grapho Steady-State results reporto Transition Matrix reporto States and Transitions data report
Results export to Excel, Word, HTML formats.
Note on Beta versionCurrent version is Beta version. Some features are unavailable, the version may contain bugs.The features which are not available in beta version but will be available in release:
o Copy & Pasteo Diagram Save as, Rename, Delete.o Libraries for States, Transitions and Parameters
Entering Markov module
1. Run RAM Commander2. Open project3. Go to Modules menu, choose “Markov Chains”.4. Each project may contain multiple Markov Diagrams. The list of all diagrams in the
current project will appear. Choose existing diagram or enter name of a new diagram and press “Open” button:
3

5. Selected or new Markov Diagram will appear.
Drawing the diagram
Each Markov diagram contains number of states and transitions between states. Diagram may contain any number of states and transition between them. Below you will find procedures for creating or editing states and transitions. Once the diagram is created, you can freely move and resize state nodes, change elements shapes, colors and other properties.
Draw a state To draw a state, bring the mouse cursor into the diagram, press the left button, move
the mouse and release the left button. You have created a state node. This node is selected: that's why 9 handles (little squares) are displayed.
4

The handle at the center of the node is used to draw a link. The 8 others allow resizing the node. If you want to move the node you bring the mouse cursor into the node, press the left button, move the mouse and release the left button. State data screen will appear immediately for the new state.To edit existing state data, double-click on it, or select from menu Item –> Edit…. On edit dialog, you can choose state node background color, shape and assign bitmap picture.
Draw a Transition Bring the mouse cursor into the handle at the center of the selected node, press the left button, move the mouse towards the other node. When the mouse cursor is into the other node, release the left button. The transition has been created. And it is selected since a handle is displayed at the center of this transition link. Transition data screen will appear immediately for the new transition.To edit existing transition data, double-click on it, or select from menu Item –> Edit.
Specifying State, Transition and Diagram data
State DataWhen you create a new state or double-click an existing state, the following state data screen appears:
Below is the explanation of state data fields:Field DescriptionCode Unique state codeName State nameDescription State description (appears as a tooltip when mouse pointer is
over state node on diagram)State type State type: define if the state is Failure state or Operational
state.Performance Value describing whole system performance or capacity, when
the system is in the current state. Performance measurment units are user-defined – you may define percent of maximal performance or absolute measurement, like power station
5

Field Descriptionpower produced while it is in current state. Performance unit is defined on Diagram Properties screen.
Initial state prob.
Probability that the system is in the current state when it starts working. Total initial probability for all states should be 1.
Visual representation
Possibility to select shape, color, border, background picture and text alignment for diagram element
Transition Data
When you create a new transition or double-click an existing transition, the following data screen appears:
Below is the explanation of transition data fields:Field DescriptionCode Unique transition codeName Transition nameDescription Transition description (appears as a tool tip when mouse pointer
is over transition on diagram)Transition type Transition type: define if the transition is Failure (usually from
good to bad state), Repair (usually from bad back to good state) or custom transition.
Transition rate Number of transitions per hour between states connected by current transition link
Visual representation
Possibility to select line style, direction, color and width
Connection with Product Tree / FMECA
Under development
Diagram data
6
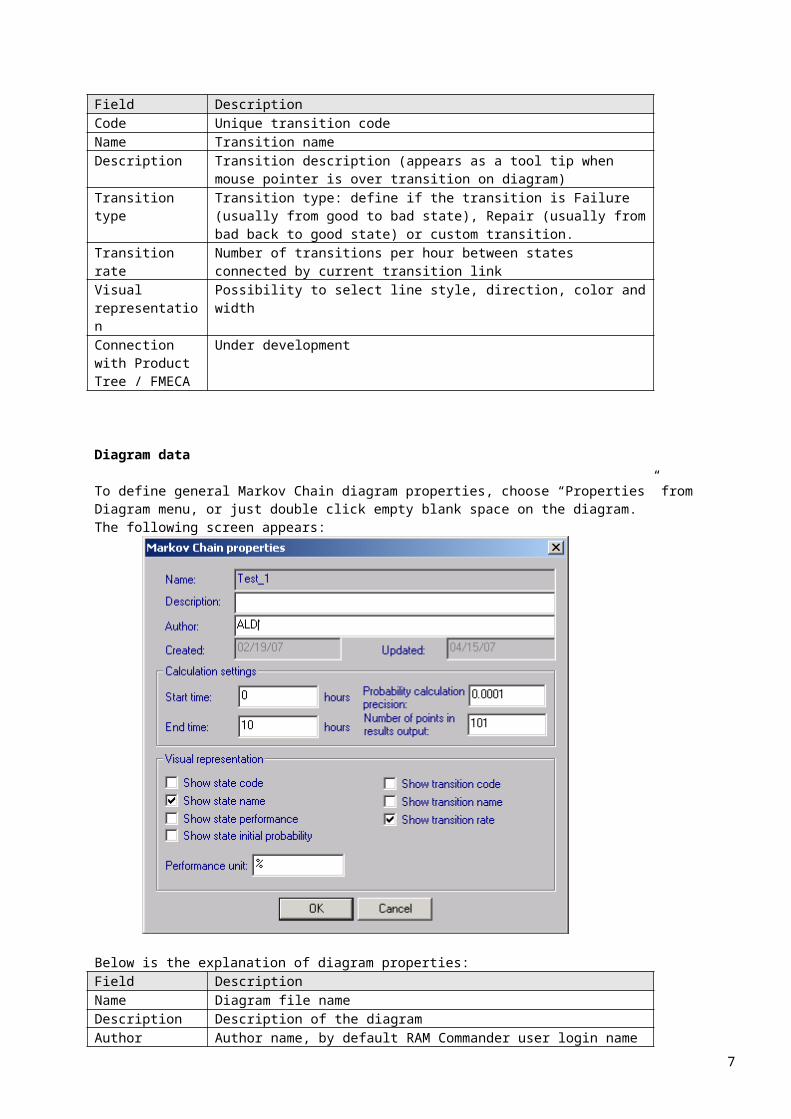
To define general Markov Chain diagram properties, choose “Properties” from Diagram menu, or just double click empty blank space on the diagram.The following screen appears:
Below is the explanation of diagram properties:Field DescriptionName Diagram file nameDescription Description of the diagramAuthor Author name, by default RAM Commander user login nameCreated, Updated
Date when the diagram was updated or created
Start time Starting time for results outputEnd time Finish time for diagram results outputPrecision Calculation precision. Used in time-dependent analysis
calculationNumber of points
Number of points in time-dependent analysis results output. For example, if start time is 0 hours and end time is 10 hours and number of points = 11, then resulting report will contain points for 0,1,2,…10 hours.
Visual representation
Allows defining appearance of states and transitions – what is printed and what is hidden.
Performance unit
User-customizable performance unit (may be % of maximal performance or absolute value)
7

Working with diagram
PrintChoose “Print” option from the “Diagram” menu to print the diagram.
ZoomChoose different zooming options from “Diagram” menu, “Zoom” submenu.
ExportYou can insert the diagram as a picture to another application (Word, Excel, PowerPoint etc.). Choose menu item Diagram – Export to Clipboard. The diagram will be placed to Clipboard. Enter another application, choose where to paste the diagram and press Ctrl+V (or choose menu item Edit – Paste). The diagram picture will be copied.
CalculationTwo calculation modes are available: Steady-state and Time-dependency.
Steady-State calculation modeThis mode calculates and displays system parameters (state probabilities, system availability, reliability etc.) for a Steady State. Steady State is state where time t is approaching infinity and state probabilities are approaching final probabilities. It is assumed that final probabilities exist and that they do not depend on initial state probabilities.Calculation is based on linear equations solving.To run this calculation mode, choose “Steady-State Calculation” from Calculation menu.
Time Dependency Calculation modeThis mode calculates and displays system parameters (state probabilities, system availability, reliability etc.) for time points from Start time to End time (see Diagram properties).Calculation is based on fourth-order Runge-Kutta method for differential equations.To run this calculation mode, choose “Time Dependency Calculation” from Calculation menu.
8

ReportsThere are a number of different reports and graphs available to output diagram data and calculation results. Open “Reports” menu to see the list of available reports:
Diagram data report:
Transition Matrix Report:
Steady-State Calculation Results:9

Time-Dependency Calculation Results:
Time-Dependency Calculation Results for time interval – table and graph:
10

Markov Calculation Results
Availability
Unavailability
Time(hours)
0.0
0.2
0.4
0.6
0.8
1.0
0 20000 40000 60000 80000 10000010000 30000 50000 70000 90000
Time-Dependency State Probabilities for time interval – table and graph:11

Markov State Probabilities
State 1
State 2
State 3
State 4
Time(hours)
0.0
0.1
0.2
0.3
0.4
0.5
0.6
0 0.5 1 1.5 2 2.5 3 3.5 4 4.5 5 5.5 6 6.5 7 7.5 8 8.5 9 9.5 10
12

2PARTS + RPR
1PART + RPR
2lambda, Rate=0.002778
2PARTS - RPR
Mu, Rate=1
1PART - RPR
2Lambda, Rate=0.002778
0Parts - RPR
Lambda, Rate=0.001389
0Parts + RPR
Lambda, Rate=0.001389
Mu, Rate=1
Example of two parallel parts with one spare part
13

Customizable Fields in Product Tree View
Now you can change an existing Product tree view by adding new columns. User can create unlimited number of predefined views.
Open project, from the “View” menu choose “Custom Tree fields”.
In the Product tree view new columns will be displayed.
14

Telcordia Issue 2 Reliability Prediction Method
New version based on Reliability Prediction Procedure for Electronic Equipment, SR-332, Issue 2, September 2006
“The generic device failure rates have been revised based on new data. For several devices, the range of complexity covered by the procedures has been extended. In addition, many new devices have been added.”
217Plus reliability prediction method
Based on Handbook of 217PlusTM Reliability Prediction Models, 26 May 2006
15

Global Change Supports of ILS data
Today any ILS field can be used in Global Change utility. ILS fields can be used as condition and/or the value of these fields can be set by using the Global Change feature.
16

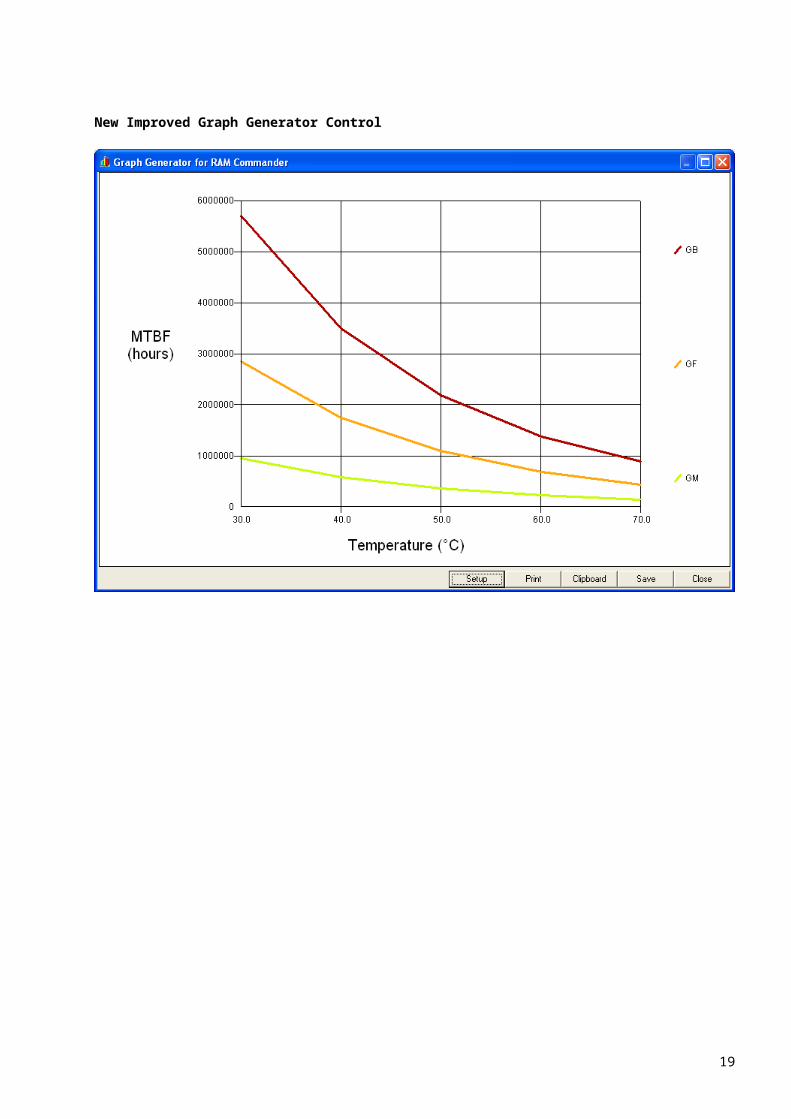
New Improved Graph Generator Control
17

Improved Component Library Support for FIDES
Support for following Item Codes and fields was added:
# Item Code Fields1. IC Memory Packages2. IC Analog Packages3. IC Digital Packages4. Capacitor CV Product; Tantalum Package5. Relay Contact Type; Cutoff power; Vrat6. Connectors Mount Type7. LF Diodes Packages8. LF Transistors Packages9. HF Diodes Packages10. HF Transistors Packages; New Type11. Optoelectronic New Types; Packages; # of Pins; LCD technology; LCD types;
Screen size; Monitor weight; Max horiz. Refresh rate; Configuration; Cooling
12. Inductive New Types13. PWB New Technologies; Routing Class; PCB identification14. Crystal New Types; Technology; Temp. Manufacturer; Current rated15. Miscellaneous New Types; Configurations; Type of use; Protection; # of heads;
Hard disk format; Average access time
18
New Report - MAC (Maintenance Allocation Chart)
Maintenance Allocation Chart Report Project name: TUTORIAL
Assembly Ref.Des.: Communic, ID: 1.1, Description: Rx/Tx system.
ID RFL Name
Level of
Replace
Level of Repair
Maintenance Task Type
Maintenance Task Description
Time [hours]
Labour Power
Support Engineer Time [hours]
Qty
Technician Time [hours]
Qty
Welder Time [hours]
Qty
1.1.1
'01-01-01
Main Switch
Intermed
Depot Preparation UNIT DISCONNECTION
0.000 1.0 0.000 1.
Fault Isolation
Diagnostic Procedure
0.067 1.0 0.067 1. 0.067 1.
Disassembly
Remove panel 1.4E-002
1.0 1.4E-002 1. 1.4E-002
1.
Interchange Replace switch 0.083 1.0 0.083 1.
Reassembly
Replace panel 3.3E-002
1.0 3.3E-002 1. 3.3E-002
1.
Start-Up Power On 0.083 1.0 0.083 1. 0.083 1.
1.1.2
'01-01-02
Receiver Intermed
Depot Preparation UNIT DISCONNECTION
3.3E-002
1.0 3.3E-002
1. 3.3E-002
1.
Fault Isolation
Diagnostic Procedure
0.067 1.0 0.067 1.
Disassembly
Remove front panel
4.4E-002
1.0 4.4E-002 1.
Interchange Replace receiver 1.7E-002
1.0 1.7E-002
1.
Reassembly
Replace front panel
3.3E-002
1.0 3.3E-002 1. 3.3E-002
1.
Checkout Visual 1.0E-002
1.0 1.0E-002 1.
Start-Up Power On 0.083 1.0 0.083 1. 0.083 1.
1.1.3
'01-01-03
Transmitter
Intermed
Depot Preparation Disconnection 3.3E-002
1.0 3.3E-002 1.
Disassembly
Open Screws 4.4E-002
1.0 4.4E-002 1.
Reassembly
Insert new Channel Box
3.3E-002
1.0 3.3E-002 1.
Checkout Visual 8.3E-003
1.0 8.3E-003 1.
Start-Up Power On 8.3E-003
1.0 8.3E-003
1. 8.3E-003 1.
1.1.4
'01-01-04
PS Intermed
Discard
Fault Isolation
Check 8.3E-003
1.0 8.3E-003
1.
Disassembly
Open 1.2E-002
1.0 1.2E-002 1.
Reassembly
Insert new PS 3.3E-002
2.0 3.3E-002
1. 3.3E-002 1.
Start-Up Power ON 8.3E-003
1.0 8.3E-003
1. 8.3E-003 1.
19

ID RFL Name
Level of
Replace
Level of Repair
Maintenance Task Type
Maintenance Task Description
Time [hours]
Labour Power
Support Engineer Time [hours]
Qty
Technician Time [hours]
Qty
Welder Time [hours]
Qty
Interchange Standard connect.
0.056 1.0 0.056 1.
0.81 0.408 0.688 0.114
Improvements in Standard Tasks Library
20

Failure Modes Library can be filtered for Failure Modes or Next Higher Effects or both
New format for FMECA Import Added
RAM Commander 7.6 supports additional import format for FMECA. This format supports the following fields:
ID Ref.Des. Item function FM - failure mode Cause Detection FR - failure rate Phase Component effect (imported into user defined field) NHE – next higher effect EE – end effect Crew action (imported into user defined field) Severity Compensating provisions
21