where is the money and what are we doing with it? - world...
TRANSCRIPT

THE WORLD BANK
DRAFT
October 2011
WHERE IS THE MONEY AND WHAT ARE WE DOING WITH IT?Creating an Evidence Base for Better Health Financing
and Greater Accountability A Strategic Guide for the Institutionalization of National Health Accounts


DRAFT
October 2011
WHERE IS THE MONEY AND WHAT ARE WE DOING WITH IT?Creating an Evidence Base for Better Health Financing
and Greater Accountability A Strategic Guide for the Institutionalization of National Health Accounts


iii
Contents
Acknowledgement v
Acronyms vii
Executive Summary xi
Introduction xix
Chapter 1: The Case for Institutionalizing National Health Accounts 1
Chapter 2: Governance Structures for NHA 17
Chapter 3: Building Capacity to Sustain NHA Activities 33
Chapter 4: Financing Strategy for NHA 45
Chapter 5: Translation and Dissemination of NHA 54
Chapter 6: The Value of Global and Regional Partners 67
Conclusion 81
References 83
Individuals and Organizations Consulted and Providing Inputs into the Strategic Guide 87
iv | Where Is the Money and What Are We Doing with It?
Appendix Contents 101
Appendix A. NHA in Brief 103A1 An Overview of National Health Accounts 103
A2 An Overview of A System of Health Accounts 2011 104
Appendix B. NHA Toolkits 109
B1 Country Planning Tool Examples 109
B2 Country Assessment Tool 112
B3 Sample Indicators to Measure NHA Institutionalization 112
B4 National Health Account Production Tool 112
B5 Health Resource Tracker 114
B6 Sample List of Basic Indicators in NHA 116
B7 Suggested additional questions to DHS 118
B8 ADePT 120
B9 Health System Financing Profile 122
Appendix C. Other Documents 123
C 1 Literature Review on NHA Institutionalization 123
C2 Survey Questionnaire for the World Bank Survey on Costs of Health Accounting, 2010 123
C3 Survey Questionnaire for the World Bank Survey on Financing of Health Accounting, 2011 127

v
Acknowledgement
Policy makers and technical experts from more than 50 countries have contributed to the shaping of this report through an extensive consultative process involving low-, middle- and high-income countries, large and small, from all corners of the world (listed on page
108–113) We are grateful for these contributions which have helped shape a document that rep-resents a synthesis of lessons learned from country experiences This report is intended to serve as a Strategic Guide, helping countries build greater ownership of the process of designing, implementing, and integrating NHA into their planning, budgeting, and monitoring processes
The Bill and Melinda Gates Foundation (BMGF) provided generous financial support for activ-ities undertaken in this global initiative, including the development of this report; provision of technical assistance to institutionalize NHA in selected countries; consultative meetings with experts and practitioners for methodological development; and in-depth analysis of the con-straints to institutionalizing NHA, based on collaborations and interactions with developing country partners
The report was developed in consultation with Technical Advisory Group members that included colleagues from the following development partner organizations BMGF, USAID, WHO, and OECD (listed on page 114–116) We are also grateful for the support and guidance by several other development partners, such as the African and Inter American Development Banks and Regional observatories and NHA networks (listed on page 113, 116–121) Further, numerous World Bank and development partner field staff have informed the creation of this report and contributed to the design and implementation of technical work in countries (listed on page 110–113)
We are grateful to World Bank internal peer reviewers, John Langenbrunner, Sarbani Chakraborty, Moulay Driss El-Idrissi, Tania Dmytraczenko, and external peer reviewer Professor A K Nandakumar from Brandeis University (representing the TAG) as well as the many others who have contributed with constructive feedback and guidance
Overall guidance for this Strategic Guide has been provided by Cristian Baeza, Sector Director for Health, Nutrition and Population at the World Bank and Akiko Maeda, Lead Health
vi | Where Is the Money and What Are We Doing with It?
Specialist at the World Bank The project team leader, Margareta Norris Harrit and the core team including Shunsuke Mabuchi, Banafsheh Siadat, and Somil Nagpal syn-thesized this report building on earlier work by Mukesh Chawla, Charu Garg, Rubama Ahmed, Vaihab Gupta and Mahesh Shukla
Outstanding project management support was provided by Daniela Hoshino, Emiliana Gunawan, and Mario I Mendez
The report was edited by Colin Douglas Design and typesetting were done by The Word Express, Inc

vii
Acronyms
ADB Asian Development BankAIS AIDS Indicator SurveyAPNHAN Asia Pacific National Health Accounts NetworkAusAID Australian Agency for International DevelopmentBIA Benefit Incidence AnalysisCHIPSR Policy and Systems ResearchCIS Euro-Asia (regional network)CID Integrated Expenditure SystemSRS Creditor Reporting SystemDAC OECD Development Assistance CommitteeDANIDA Danish International Development AgencyDEC Research Department (of the World Bank)DECRG Research Department (of the World Bank)DHS Demographic and Health SurveyDMT data management toolDFID Department for International DevelopmentDOH Department of Health (Philippines)DRGs Diagnosis Related GroupsECSA East, Central, and Southern AfricaEquitap Equity in Asia-Pacific Health SystemsEO European Observatory (on health systems and policies)FA Francophone AfricaFIES Family Income and Expenditure SurveysFNU Fiji National UniversityGAC Governance and Anti-CorruptionGDP Gross Domestic ProductGFATM Global Fund to Fight AIDS, Tuberculosis and MalariaGHE Government Health ExpendituresGHI Global Health InitiativeGTZ Deutsche Gesellschaft für Technische ZusammenarbeitHHC High Health Council (Jordan)

viii | Where Is the Money and What Are We Doing with It?
HIS Health Information System(s)HMIS Health Management Information SystemHMN Health Metrics NetworkHMOs Health Maintenance OrganizationsHR Human ResourcesHSS Health Systems StrengtheningHUES Health Utilization and Expenditure Survey (Georgia)IAC-HNS The Inter-Agency Committee on Health and Nutrition StatisticsIADB Inter-American Development BankICD International Classification for DiseasesICHA International Classification for Health AccountingIDB Inter-American Development BankIHEA International Health Economics AssociationIHPP International Health Policy Program (Thailand)IMF International Monetary FundIOPHOS Planning Department of the Republican Institute of Public Health (Serbia)JHAQ OECD-Eurostat-WHO Joint Health Accounts QuestionnaireKHIDI Korea Health Industry Development InstituteKIHASA Korea Institute of Health and Social AffairsKIHSM Korea Institute of Health Services ManagementLAC Latin America and Caribbean (now REDACS, q v )LSMS Living Standards Measurement StudyMBB Marginal Budgeting for BottlenecksMDGs Millennium Development GoalsMENA Middle East and North AfricaMICS Multiple Indicator Cluster SurveysMIS Malaria Indicator SurveyHMIS Health Management Information System (Georgia)MDGs Millennium Development GoalsHMOs Health Maintenance OrganizationsMOF Ministry of FinanceMOH Ministry of HealthMoHFW Ministry of Health and Family Welfare (India)MoHSW Ministry of Health and Social WelfareMOPH Ministry of Public HealthMTEF Mid-Term Expenditure FrameworkNASA National AIDS Spending AssessmentNCMH National Commission on Macroeconomics and Healthn d undatedNESDB National Economic and Social Development Board (Thailand)NGO Nongovernmental organizationNHA National Health AccountsNORAD Norwegian Agency for Development CooperationNRHM National Rural Health Mission (India)NSCB National Statistical Coordination Board (Philippines)NSO National Statistical OfficeOECD Organisation for Economic Co-operation and Development

Acronyms | ix
PAHO Pan American Health OrganizationPER Public Expenditure ReviewPETS Public Expenditure Tracking SurveysPG Producer’s GuidePHFI Public Health Foundation of IndiaPPP Purchasing Power ParityPREM Poverty Reduction and Economic Management Network (World Bank)REDACS Network of the Americas on Health AccountsRH Reproductive HealthSDS State Department of StatisticsSES Socio-Economic SurveySHA System of Health AccountsSIDA Swedish International Development Cooperation AgencyTHE Total Expenditure on HealthUHI Universal Health InsuranceUN United NationsUNGASS United Nations General Assembly Special SessionUSAID United States Agency for International DevelopmentUSP University of the South PacificWG Working GroupWHO World Health OrganizationWHS World Health Survey


xi
Executive Summary
Policies to improve the equity and efficiency of health financing can play a critical role in strengthening health outcomes in the developing world However, such policies must be built on a foundation of sound evidence and analysis
There has been a global effort to promote the institutionalization1 of National Health Accounts (NHA) as a tool to provide a robust evidence base on the sources and allocation of public, donor and private health expenditures at the country level Since 2008, the World Bank has been coor-dinating this effort, which draws on lessons learned from countries at different stages of the journey towards institutionalization This work has culminated in a strategic guide for the insti-tutionalization of NHA, developed through an extensive consultative process involving more than fifty low-, middle- and high-income countries, large and small, in all corners of the world
This guide represents a synthesis of lessons learned from country experiences and is intended to help countries build greater ownership of the process of designing, implementing, and inte-grating NHA into their planning, budgeting, and monitoring processes This summary sets out the key elements of the guide
The value proposition for institutionalizing NHA
NHA provide national decision makers with essential financial information on a coun-try’s health system, and facilitate more sustainable, equitable and efficient allocation of resources. NHA thus represent a cost-effective, “smart” investment for countries.
It is vital for effective policy making that decision makers have access to essential informa-tion on health expenditure—such as the share of health expenditure within an economy, the
1 Defined as: ‘Routine government-led and country-owned production and utilization of an essen-tial set of policy relevant health expenditure data using an internationally accepted health accounting framework ’

xii | Where Is the Money and What Are We Doing with It?
financial burden of health spending on house-holds, the magnitude of external financing in health expenditure, and the share of spending on primary care It is also important for pol-icy makers to be able to understand how these metrics are shifting over time in their coun-tries, and to make accurate comparisons with health expenditure in other countries
NHA provide a globally recognized frame-work to systematically measure the total expenditure and the flow of funds in a coun-try’s health system. NHA provide a rigor-ous methodology that reveals actual sources of funds, resource gaps, and potential areas for capturing greater resource efficiencies They disaggregate total health expenditure by end user, type of provider, and the popu-lation sub-group that benefited from health services With such information, countries can monitor spending and design policies to achieve more sustainable, equitable, and effi-cient health financing
NHA can provide considerable value-add to countries Many countries that have insti-tutionalized NHA have benefitted from the ability to visualize resource gaps and inef-ficiencies As a result, country leaders have been able to focus attention on priority issues, such as reducing out-of-pocket payments by households, mobilizing additional resources for healthcare, and identifying opportuni-ties to improve cost-efficiency in government spending
Constraints to institutionalization
The number of countries that have institu-tionalized NHA is still very limited. In 2010, only forty-one countries were routinely pro-ducing NHA, many of them OECD members. Institutionalization of NHA has not pro-gressed as fast as expected—despite the value-add of NHA and evidence that in-country
institutionalization can result in significant savings in cost and time
Country experiences reveal that one of the major constraints to institutionalization has been the failure to consider NHA as part of a complete cycle of activities that include demand for data by country leaders; pro-duction of NHA; dissemination and trans-lation of NHA data; and finally, the use and application of NHA for policy decisions
Institutionalization requires a full cycle of NHA activities to be embedded within a country’s planning and budgeting pro-cesses. This cycle extends beyond produc-tion, and involves translating the essential information that NHA can help provide into insightful, evidence-based policy recom-mendations for decision makers (Figure 1) The steps in the cycle and their effective linkages to one another are influenced and guided by a country’s governance struc-ture, as well as its institutional capacity and financial resources to support NHA-related activities
Historically, a major challenge in using NHA for decision making has been the weak link between data production and its appli-cation by key stakeholders who could make use of the NHA to inform policy Much of NHA capacity building has focused on data collection and production, whereas there has been a relative dearth of resources to invest in the “translation” of large volumes of data into policy-relevant information The trans-lation of data into policy-relevant analyses is essential for enabling policy makers to cap-ture, interpret, and use the critical informa-tion contained in NHA for their policy deci-sions Likewise, a clear strategy is required to disseminate NHA data and analyses to target audiences through a variety of channels
A second major constraint in NHA institu-tionalization has been the absence of atten-

Executive Summary | xiii
viewed as an externally-driven (rather than country-owned) process
For the NHA cycle to be fully optimized and leveraged, the process needs to be “owned” by country champions who can coordinate and ensure effective linkages between the steps in the NHA cycle. This “ownership” needs to be defined and adjusted based on a country’s governance structure and avail-ability of human and financial resources
In countries where external assistance is needed there has to be a “shared responsi-bility” in which countries have an explicit stake in managing the NHA institutional-ization cycle. Institutionalization will only occur when country leaders recognize the added value of the evidence base that NHA help produce For example, low-income countries might focus on ensuring that the use of NHA data will serve as an input to policy decisions and annual planning and
tion to developing a long-term strategy for ownership and capacity building that takes realistic account of the country’s unique resource environment. Countries need to “learn by doing” and should tailor NHA to meet their domestic policy needs. In this, the international development partners who support NHA will need to take a longer view on institutionalizing NHA, and allow sufficient time and pacing of activities to ensure country ownership.
Where NHA production has been conducted by consultants with insufficient focus on the transfer of capacity to local staff, there has been little ownership by countries and little use has been made of the data at the coun-try level. Several countries have undertaken multiple rounds of NHA production, yet do not possess the institutional skills to own the process in a way that serves annual budget and planning processes at the country level Such practices have led NHA activities to be
Figure 1. Framework for institutionalization of national health accounts
1. Demand and use
4. Translation of data anddissemination of specific analysis
• As country leaders make tough trade-offs to ensure an equitable and efficient allocation of scarce health resources, there is a critical need for an evidence base
• Regular use of NHA in policy making contributes to more sophisticated policy analysis
• Sustainable production of data remains a major challenge in many countries, but capacities to produce health accounts have grown significantly in the developing world over the past decade
• Making the collected data available for analysis enhances transparency and—with experience—analysis and insights that inform policy
• In countries that have institutional-ized NHA, data are widely disseminated.
• Dissemination takes place at two occasions, (1) when the NHA tables have been produced and (2) after the data has been translated into policy relevant briefs
• The value of NHA data is limited unless used as an evidence base for more informed health financing decisions.
• Country ownership of the translation process allows countries to champion key policy insights, increasing the likelihood that the answers NHA data provide will be used to affect policy
2. Production, data management, and quality assurance
3. Dissemination
Demand and Use
Production
Dissemination
Translationof data
GovernanceCapacityFinance
Source: The World Bank.

xiv | Where Is the Money and What Are We Doing with It?
budgeting activities, while continuing to rely on development partners for part of the fi-nancing and production of NHA In middle-income countries, country ownership might extend to the entire cycle, including financ-ing and production of NHA, with minimal external support
The Way Forward
Effective NHA institutionalization requires the development of long-term strategies that address three key elements of the cycle—gov-ernance, capacity and financing—adjusted to a country’s socio-economic status (Figure 2) Experiences drawn from the countries that have contributed to this global initiative have provided valuable insights on the importance of these elements in building the foundation for sustaining the NHA cycle These are sum-marized below
The governance structure of NHA is a core component in linking NHA production to use of the data and its translation through further analysis into insights to support policy making Country experiences show that different governance models exist for NHA, each with its own strengths and chal-lenges Countries can choose a model that best fits their own political context as well as capacities
Countries typically employ one of four gover-nance models for NHA: (1) led by the Ministry of Health (MOH) with little external collabo-ration; (2) MOH-led with multisectoral col-laboration; (3) government-mandated coordi-nation by a multisectoral team; and (4) led by an entity outside of government Each model has its strengths and limitations The optimal institutional “home” for NHA will depend on a country’s institutional capacity, financial resources, and political context
Figure 2. a three-dimensional model of country ownership of nha institutionalization (illustrative)
Translationof data
Demandand use
Dissemination
Production
Area of potential use of domestic resources Potential reliance on international support
Illustrative
Finance
Low-income-country model
Middle-income country model
Low-middle-income country model
Governance Capacity • How governance, capacity, and finance are owned and managed throughout the NHA cycle should differ by countries’ socioeconomic status
• Reliance on international support is expected to decrease as countries’ socioeconomic status improves
• Regardless of the availability of domestic resources, it is critical that countries ‘own’ key dimensions of NHA institutionalization to ensure uptake in planning and budgeting processes at the country level
Use of domestic resources increases as country’s socio-economic status improves
Low income countries may need to rely on international support to finance activities, but would benefit from owning the process for creating demand and effective use of NHA
Source: The World Bank.

Executive Summary | xv
In all cases, an important element of suc-cess involves clearly delineating the respon-sibilities within the core teams, and build-ing strong and explicit linkages with other agencies to facilitate access and validation of data. Many countries define a Coordinating Body to plan, budget, and coordinate the cycle of NHA activities; a Policy Advisory Group that liaises with key decision makers to pro-vide them with essential financing informa-tion; and a Technical Consultative Group that provides data collection support, validation, and quality assurance of data
Capacity building should target existing gaps within the NHA cycle, and focus on building institutional knowledge. Creating a mechanism to embed NHA cycle within the policy making process can increase the sustainability of NHA, and bridge the gap between production and use.
Production, dissemination, and effective use of NHA depend on access to a skilled work-force equipped to produce work of high tech-nical quality and empowered to coordinate the links between each step of the NHA cycle. Capacity constraints are common, especially in health systems where statisticians, health accountants, and health economists are scarce
Although capacity building in many coun-tries has been focused on production, a comprehensive assessment of and targeted approach to critical gaps across the entire NHA cycle will be crucial to build sustainable capacity for the complete cycle of data pro-duction, dissemination, translation, and use
Experience also shows that addressing insti-tutional and environmental factors can greatly increase the capacity to sustain NHA activities and link NHA to policy decisions:
• Countries can build institutional knowl-edge by ensuring that the NHA process
is standardized and well-documented, and by creating tools to facilitate the pro-cess This reduces reliance on the knowl-edge of a few staff members or of external consultants
• Countries can consider strengthening their institutional production capacity by outsourcing production of NHA or by partnering with entities outside the MOH or outside government, such as universi-ties and independent policy and research institutions
• Countries can build an institutional mech-anism that links NHA to policy units in the MOH as well as to formal budgeting and planning processes (such as public expenditure reviews, and medium-term expenditure frameworks) This will give decision makers access to insights from NHA, so bridging the gap between pro-duction and use
• Broader contextual factors such as the political, financial and institutional envi-ronment affect the efficiency and effec-tiveness of the NHA cycle
Learning-by-doing is an effective approach to building long-term capacity. Capacity build-ing for NHA, at both the individual and insti-tutional levels, is a highly iterative process For example, an NHA team gradually learns the NHA classification and methodology; it part-ners with multiple organizations to stream-line the data collection process; it aligns exist-ing surveys to the NHA format; it adjusts methodologies to estimate consumption; it includes high-level policy makers in a Policy Advisory Group; and it improves communica-tion among members of that Advisory Group
A long-term financing strategy can help countries sustain NHA activities and cap-ture cost efficiencies early.
A long-term financing strategy can gener-ate cost savings. Overall, country experiences show that the cost of NHA tends to decrease

xvi | Where Is the Money and What Are We Doing with It?
significantly with each subsequent round of NHA It is thus crucial that a long-term financing strategy is put in place extending beyond the initial rounds of NHA produc-tion, and which makes provisions for cost-sharing between development partners and countries
Embedding NHA activities in a country’s planning and budgeting processes can ensure sustained financing of NHA
Opportunities for capturing cost efficien-cies reside in early rounds of the NHA cycle More than 70 percent of the total average NHA cost is made up of survey, consultant, and staff costs, which form an even larger proportion of costs in early rounds There are several opportunities to capture cost efficien-cies early:
• Survey costs can be saved by integrat-ing the NHA data collection process with routine data management systems and by simplifying and standardizing pro-cesses and tools. Several countries avoid survey costs by using their existing data system, sometimes by using estimation methodologies, revising questionnaires and classifications of existing surveys and budget items Low-income countries also can limit the survey questionnaire to essential information, and use automated NHA production tools
• Localizing and standardizing produc-tion and analysis can save costs on inter-national consultants. Consulting costs can be reduced by: leveraging cheaper regional and local expertise and avoiding international consultants; standardiz-ing and minimizing the NHA process to reduce the workload of consultants; and building staff capacity to reduce the need for consultant support These steps can also improve development of in-coun-try knowledge and skills to manage the NHA cycle
International and regional organizations can add value through their global networks and cost-efficient, peer-learning approach-es, but they also have specific challenges to overcome if they are to serve countries effec-tively over the long term.
Coordination at the global level can sup-port institutionalization across the full cycle of NHA activities at the country level, by helping to improve accountability and trans-parency and facilitating the use of interna-tionally comparable data Moreover, inter-national development partners can add value by: (1) serving as a repository of knowledge to build institutional capacity and facili-tate the exchange of information; (2) facil-itating the link from data to issues relevant to policy; and (3) improving transparency in their financing of health resource tracking activities
Regional agencies can add value to countries by facilitating peer-based learning, serving as a repository of knowledge and best prac-tices, and providing cost-efficient technical expertise However, regional agencies often lack adequate financing and strong gover-nance structures to support their work To leverage regional agencies effectively, it is critical that these challenges are overcome through further dialogue between coun-tries and international development part-ners Countries need to define the modal-ity that best serves their needs and be willing to contribute to the costs of establishing and managing the agencies This would create a market equipped to shape the purpose and value-add of regional networks from a coun-try perspective
* * *
Through the process of synthesizing coun-try experiences, it has become clear that we are moving into a new era where NHA activ-ities can no longer be addressed in isolation.

Executive Summary | xvii
NHA activities need to be conducted strategi-cally to serve as an input into broader resource tracking, ultimately to inform policy This shift requires a more strategic partnership between countries and their development partners, and calls for genuine commitments to mutual transparency and accountability
on resources It is hoped that countries and their development partners can fully utilize NHA in making headway towards national and international targets and in improving the efficiency and effectiveness of country-led efforts to build more equitable and efficient health systems for populations

xix
Introduction
One of the key constraints to improving health outcomes in the developing world relates to equitable and efficient health financing In most developing countries, a large portion of health expenditure is private and out-of-pocket (Gottret and Schieber, 2006) This
deters the poor from seeking health care, and puts many of the non-poor at risk of impover-ishment as a result of a health shock when they do seek care The public sector’s share of health expenditure is relatively small in low-income countries Further, there is empirical evidence indicating that, in several low- and middle-income countries, the rich proportionately bene-fit far more from public health spending than do the poor (Wagstaff, 2010) Moreover, public spending is often not allocated in a cost-effective manner
Any analysis of health financing issues has to begin with sound estimates of the level and flow of resources in a health system, including total levels of spending, the sources of health expen-ditures, the uses of funds in terms of services purchased, and in terms of who purchases them The analysis should also aim at understanding how these resource flows are correlated with health system outcomes, including those of improving health, reducing health inequalities, and reducing the incidence of catastrophic health expenditure National Health Accounts (NHA) provide a framework to collect, compile, and analyze such data on all types of health spending in a country—and so create a robust evidence base for policy making
Although NHA data delineate the key financial metrics of a health system, the collection of these data have not been institutionalized in most developing countries Whilst most OECD countries follow standardized guidelines and systems to report NHA annually, many devel-oping countries do not have systems in place for the routine reporting of NHA-related infor-mation The root problems are often the same: insufficient resources to collect, collate, analyze and produce information on spending; poor development of health and other information sys-tems; low levels of local capacity to interpret information to meet policy needs; and inadequate demand for data within countries
In many low- and middle-income countries, previous NHA activities have been con-ducted as ad hoc, donor-driven initiatives Some countries have never developed NHA; as a result, information on health resource flows in these countries is often limited, incomplete,

xx | Where Is the Money and What Are We Doing with It?
poorly communicated and understood, or inconsistent
There has been a global effort to promote the institutionalization of National Health Accounts (NHA) as a tool to provide a robust evidence base on the sources and allocation of public, donor and private health expen-ditures at the country level Since 2008, the World Bank has been coordinating a global initiative to identify bottlenecks to the insti-tutionalization of NHA, and to learn lessons in countries at different stages on the journey towards this institutionalization The activi-ties in this initiative have included: the devel-opment of this report; provision of technical assistance to institutionalize NHA in selected countries; consultative meetings with experts and practitioners for methodological devel-opment; and in-depth analysis of the con-straints to institutionalizing NHA, based on collaborations and interactions with develop-ing country partners
This report has been developed through a consultative process 2 Five international and four regional consultations have taken place,
involving a wide mix of countries at different stages on the NHA institutionalization jour-ney In addition, country leaders in more than fifty countries have contributed to the devel-opment of this report, through workshops, technical assistance, and in-person or virtual conversations Development partners have provided important contributions through-out the project, reflecting their past experi-ences with both NHA production and institu-tionalization Further, numerous World Bank staff have informed the creation of this report and contributed to the design and implemen-tation of technical work in countries
This report represents a synthesis of les-sons learned from country experiences and is intended to serve as a strategic guide to countries as they design and implement their strategy to develop nationally relevant and internationally comparable data, col-lected in a routine and cost-effective man-ner These data will enable policy makers to develop and implement evidence-based decisions, and better measure the impact of health reforms, especially those related to health financing
2 See the Section in this document entitled, “Individuals and Organizations Consulted and Providing Inputs into the Strategic Guide”

1
Chapter 1
The Case for Institutionalizing National Health Accounts
This chapter sets out the business case for institutionalizing National Health Accounts (NHA) at the country level First, it shows how NHA can play a critical role in strengthen-ing national decision making and allocating health resources more effectively and equita-
bly The chapter then presents a framework for the institutionalization of NHA, from the pro-duction of accounts right through to their use in policy decisions Each of the elements of this framework is then elaborated in subsequent chapters
Key points are:
• NHA provide a globally recognized framework to systematically measure the source of public and private health expenditures and the flow of funds in a country’s health system
• Input from NHA to provide an evidence base on resource gaps and inefficiencies can help the making of policy decisions to reduce out-of-pocket payments borne by households, increase total health expenditure, and identify cost-saving opportunities on government spending
• Linking NHA data with nonfinancial information (such as output and outcome indica-tors) can provide a powerful means of linking financial investments with attainments in health status and driving improvements in the effectiveness, efficiency, and quality of health services
• A major constraint to institutionalization has been the failure to consider NHA as a com-plete cycle of activities that include demand for data by country leaders, production, dis-semination, translation of large volumes of data into relevant policy briefs, and use of data for policy decisions
• While a country can ‘borrow’ the capacity and finance needed to develop NHA, it is essen-tial that overall leadership and ownership of the NHA cycle is provided by the country itself
• It is crucial to align a long-term strategy between countries and development partners that facilitates country ownership of the NHA cycle, and is based on a country’s unique resource environment

2 | Where Is the Money and What Are We Doing with It?
1.1 The value proposition for the institutionalization of National Health Accounts
Essential data to inform policyAccurate information on the key dimensions of national health expenditure is essential for effective decision making by national policy makers, both in the health sector and beyond, and for the equitable and efficient allocation of scarce health resources Such information might include:
• Health expenditure as a share of GDP• The county’s health expenditure and its
composition over time• The country’s health expenditure as com-
pared to that in countries with similar income levels
• The country’s health outcomes as com-pared to those in other countries with sim-ilar income or health expenditure levels
• The financial burden imposed by health episodes on households—linked to their level of financial protection and their risk of impoverishment due to catastrophic health expenditure
• The share of health sector investments devoted to primary care
• The share of health expenditure reaching the population groups with the greatest health care needs
• The role of external financing in the coun-try’s health expenditure
NHA provide a globally recognized frame-work to systematically define, track, classify, and measure the total volume of expenditure and the flow of funds in a country’s health system NHA allow countries to produce con-sistent and internationally comparable infor-mation on the generation, allocation, and utilization of health system resources This information can be used in conjunction with other datasets, such as those on health out-puts and health outcomes, to further enrich the analytical base for health policy
If appropriately used, NHA can be a power-ful lever to help countries document resource gaps, highlight resource efficiencies, effec-tively advocate for additional funds where needed, and channel money to priority areas
NHA are also a means of ensuring account-ability and transparency in a country’s use of financial resources They offer a rigorous methodology to account for the flow of health funds from financing sources such as MOFs, development partners, and households, to the entities that determine how these funds are spent, such as MOH, insurance agencies, and households Moreover, NHA allow for the disaggregation of total health expenditure by end use, such as by curative or preventive care, or by the type of provider that has deliv-ered the service With further analysis, NHA can help identify the population subgroups that have benefited from health services
A key value-add offered by NHA is the abil-ity to provide national decision makers with essential information about the financial sta-tus of a country’s health system This infor-mation can monitor and guide current and future expenditure, and assist in the design of policies to improve health financing via a more sustainable, equitable, and efficient allo-cation of resources In an era of constrained fiscal resources, NHA data can help coun-tries prioritize funds and design more effec-tive interventions to protect pro-poor health services Information on how money is spent at all levels is critical for ensuring success-ful outcomes for major health sector reforms, including implementing universal coverage (in Thailand, for instance) or decentralization (such as current efforts in the Philippines)
Baseline data for national and international equity analysisNHA can provide information on the finan-cial burden that health expenses impose on households and provide an evidence base for reforms aimed at improving financial

The Case for Institutionalizing National Health Accounts | 3
protection and reducing out-of-pocket pay-ments For example, in Mexico NHA data raised concerns about exorbitant out-of-pocket expenses and led to the establish-ment of Seguro Popular, a program geared toward achieving universal health care cov-erage Since 2004, those states participating in Seguro Popular have witnessed a 23 per-cent reduction in the proportion of families experiencing catastrophic health expendi-ture The evidence also helped the govern-ment redistribute resources among the states (Frenk 2006; King et al 2009) Georgia has also used the information from NHA to improve financial protection for the poor and improve equity in access to health care (Box 1 1)
Further, international comparability of NHA data allows countries with similar financing and health system structures to compare per-formance from an equity perspective Box 1 2 summarizes several examples of compara-tive equity analyses using NHA The need for comparative data and standard methods (such as SHA 2011) to conduct such analysis will be discussed in section 6 1 and Appendix A
Analysis and projections to improve efficiencyFurther, in Turkey, NHA have been used to estimate the cost of the universal health insurance (UHI) system, its impact on out-of-pocket payments, and to identify measures to capture cost efficiencies in the UHI NHA
Inequities in financial access to care in Georgia have been highlighted by routine NHA analysis. Data revealed that Georgia primarily relies on private sources of financing, accounting for 71 percent of total health expen-ditures annually between 2001 and 2007. In per capita terms, private health spending more than doubled over this period. This demonstrated the need for greater financial risk protection, particularly for the poorest populations.
NHA estimations were subsequently used to inform the Medium-Term Expenditure Framework (MTEF), which provided additional insurance coverage for the poor as protection from financial risks related to catastrophic health spending. As a result, 700,000 poor people (16 percent of the population) received insurance coverage for additional health care services and drugs. The benefit package was also expanded to include public health, primary health care, and select hospital care services so as to better provide financial access to care. (World Bank, 2008)
Box 1.1. Use of nha to promote equity in Financial access to care in Georgia
table 1. private health expenditures as a percentage of total health expenditures, by type of medical Service (2001–2007)
Medical Service Type 2001 2002 2003 2004 2005 2006 2007
Curative services 34% 29% 29% 30% 30% 29% 28%
Inpatient curative services 19% 16% 17% 17% 16% 16% 15%
Outpatient curative care 15% 13% 13% 13% 13% 13% 13%
Additional medical services 7% 8% 8% 8% 8% 9% 9%
Medical supplies and medical equipment
31% 34% 40% 40% 39% 34% 34%
Total Private expenditure 72% 71% 77% 78% 77% 72% 71%
Total Health expenditure 100% 100% 30% 30% 29% 28% 28%
Total Health expenditure (in 100 Gel 521.6 650.7 724.8 835.9 998.3 1,159.6 1,386.6
Source: Georgia National Health Accounts; WHO, 2009.
4 | Where Is the Money and What Are We Doing with It?
National Health Accounts (NHA) data have been used in a comparative study to assess equity in the distribu-tion of financing and health system resources in Bangladesh, Nepal, and Sri Lanka (Data International et al., 2001). All three countries have health systems in which the predominant sources of financing are taxes and out-of-pocket payments by households. Despite the similarity in financing and delivery systems, the authors found significant differences in terms of equity between Bangladesh and Sri Lanka. In Sri Lanka, both tax and out-of-pocket payments were found to be progressive means of financing, with government health care expenditures being pro-poor. In Bangladesh, health financing was modestly regressive, and the distribution of government health expenditures was not pro-poor.
More recently, this comparative analysis of expenditure distributions linked to NHA data has been extended by the Equity in Asia-Pacific Health Systems (Equitap) network. It analyzed the distribution of government health spending in a range of countries and territories in the Asia-Pacific region, and used NHA data to anchor compar-ative analyses of the progressivity of financing, and the household impacts of out-of-pocket healthcare spend-ing. Its analysis of the equity dimensions of public health spending across 11 Asian countries and provinces revealed that the distribution of public health care is pro-rich in most developing countries (O’Donnell et al., 2007), but results from Malaysia, Sri Lanka and Thailand showed that limiting user fees (particularly for the poor), and building a large network of health facilities is necessary in order to increase the pro-poor spending.
Equitap’s study on the progressivity of health financing illustrated the structure and distribution of health financing in 13 Asian territories, combining health accounts and household survey data on household payments to estimate the distribution of health financing (O’Donnell et al, 2005a). An important finding from this study was that more affluent groups generally contribute more as a proportion of ability-to-pay in low and lower-mid-dle income territories. Moreover, Equitap’s study of the catastrophic impact of health financing revealed that, despite the concentration of catastrophic payments on the better-off in the majority of low-income countries, out-of-pocket payments still push many families into poverty (van Doorslaer et al, 2005). Overall, these studies illustrate both the use of NHA to conduct equity analyses with implications for developing pro-poor policies, as well as the benefits of comparative cross-country analyses linked to standardized NHA estimates.
Box 1.2. Using nha for comparative equity analyses
analyses identified the potential for a 38% reduction of the government cost of the UHI through the cost-efficiency measures such as family medicine practice, spending caps for MOH and hospitals, and modest copayments, which have been adopted by the government to improve the financial sustainability of the UHI (Box 1 23, 4)
A robust evidence base to inform policy decisionsTable 1 1 illustrates how several countries have used the evidence provided by the NHA data to inform their policy decisions and to foster accountability and transparency in the health system
As illustrated in Table 1 1, information from NHA is also useful in allocating finan-cial resources based on the country’s health
policies and priorities, which in turn are related to the long-term financial sustainabil-ity of a country’s health system For exam-ple, choosing the quantum of resources for treatment of non-communicable diseases and provision of long-term care has been a major policy issue for countries battling with the demographic transition and an aging pop-ulation Large disparities in public cover-age of long-term care costs among nineteen OECD countries reflect variations in choice among countries in the way that long-term
3 World Bank 2004 Preparing for Universal Health Insurance in Turkey: Estimation of Costs Under Different Scenarios. Washington, D C : The World Bank4 Chawla, Mukesh, Menon, Rehka 2011 Personal Interview Head of Knowledge and Senior Economist, The World Bank August 22

The Case for Institutionalizing National Health Accounts | 5
table 1.1. policy applications of nha: country illustrations
Thematic AreaCountry examples Policy impact in the highlighted country example
Evidence for designing health policy
Jordan
Philippines
Serbia
Korea
Mali
Problem: Cost inflation in the pharmaceutical sector resulted in pharmaceuticals accounting for 34% of total health expenditures, or 3% of GDP.
Impact: NHA results prompted Jordan to revise its rational drug use policy. For example, it developed a National Essential Drug List; a National Formulary for Essential Drug List; a Joint Procurement Department to oversee the procurement of pharmaceuticals across the public sector.
Health sector reform and financial risk protection
Thailand
Philippines
Kenya
India
Jordan
Problem: Weak financial risk protection left a large number of uninsured among the Thai population.
Impact: Using NHA data, Thailand developed a policy on universal coverage in 2002, incorporating its Low Income Scheme with the Health Card Scheme and extending coverage to those previously uninsured. The composition of health financing has changed over time, with public financing increasing and households accounting for only 18% of Total Health Expenditure (THE) in 2008 (down from 44% in 1994).
Financial planning, budgeting, and financial sustainability
Tanzania
Georgia
Mali
Problem: In Tanzania, NHA brought to light the high degree of donor aid provided off-budget which inhibited budgeting and planning for key health care programs.
Impact: NHA data were used to encourage donors to channel funds in a “basket” managed by government. Since then, the proportion of donor funds provided for health through on-budget arrangements has increased significantly.
Accountability and transparency
Serbia
Burkina Faso
Tanzania
Thailand
Problem: Weak transparency in public and private financial flows to health, par-ticularly “informal” payments to providers.
Impact: NHA revealed that households incur high out-of-pocket payments, including under-the-table payments to providers. This resulted in the develop-ment of the Fiscal Bill Policy requiring providers to share fiscal invoices with patients. This promotes transparency as it generates a more accurate picture of overall financial flows within the health sector to facilitate planning and rational allocation of funds.
Equity (across population groups, regions, program areas)
Turkey
Kenya
Thailand
Burkina Faso
Problem: Inequities in health spending left many population groups without financial access to care.
Impact: NHA revealed a need to harmonize the benefit package across insurance schemes and mitigate out-of-pocket spending for the poor (through the Green Card holders program). As a result, Green Card holders were given access to out-patient care and pharmaceuticals, and today all insurance schemes have access to the same basic benefits package. Formal health insurance coverage has also increased, reaching 87% of the population compared to 67% of the population in 2002. Out-of-pocket payments have decreased from 27.6% in 2000 to 17.4% of total health spending in 2008.
Allocative and technical efficiency in health spending
Mali
Philippines
Kenya
Burkina Faso
Problem: Weak allocative efficiency in Mali resulted in low financing for health at the periphery level.
Impact: Mali has used insights from NHA to shift health financing from central to periphery (regional) levels, in order to implement the government’s decentraliza-tion policy. The aim is to increase the budget ceiling at the periphery level and address needed capital and other investments.
(continued on next page)
6 | Where Is the Money and What Are We Doing with It?
care is financed and provided (OECD 2005a) Burkina Faso, on the other hand, reviewed the end-use data from NHA to reallocate resources to poorer geographical areas and to institute free health promotion and preven-tive services (Box 1 3) Decisions to improve resource allocation to reach those popula-tions who need it the most give NHA a clear purpose in driving improvements in alloca-tive efficiency, in contributing to raising the equity of health spending, and in support-ing country leaders in being accountable to the populations they serve NHA can thus be used to increase the fiscal space available for public health expenditure, both through effi-ciency gains as well as through making an evidence-backed case for higher investments in health
Review of effectiveness when combined with other dataNHA are an integral component of effec-tive Health Information Systems (HIS), and Health Systems Strengthening (HSS) (WHO 2010a) Linking this information with other nonfinancial information (such as output and outcome indicators) provides the basis for powerful tools to monitor performance, link financial investments with attainments in health status, and drive improvements in effectiveness, efficiency, and quality of health services Lebanon, for example, used the find-ings from its NHA exercise to put in place a
comprehensive pharmaceutical policy and to renew its focus on primary and preventive health care, which helped it to reduce health spending and the burden of out-of-pocket spending
International comparisonsNHA have also been used for benchmark-ing health system performance against estab-lished targets and goals at the national or inter-national level, and in identifying existing gaps and challenges Figures 1 1a and 1 1b illustrate the use of NHA in benchmarking the level of public expenditure on health (as a share of the country’s GDP) In Figure 1 1a, the eight coun-tries of the South Asia region (highlighted in black) are benchmarked in relation to their global peers (represented by hollow circles), as well as countries with similar levels of income (in terms of GDP per capita) The analysis was used to demonstrate that most countries in South Asia have a lower level of public spend-ing on health than other countries with similar levels of income (LaForgia and Nagpal, 2011), making a case for increased public spending on health in these countries As depicted in Figure 1 1b, a similar analysis was undertaken for Ghana (World Bank, 2011) using the same dataset, where Ghana was compared to other African, East European, and Asian countries Such analysis can provide a useful bench-marking tool for in-country as well as inter-national use
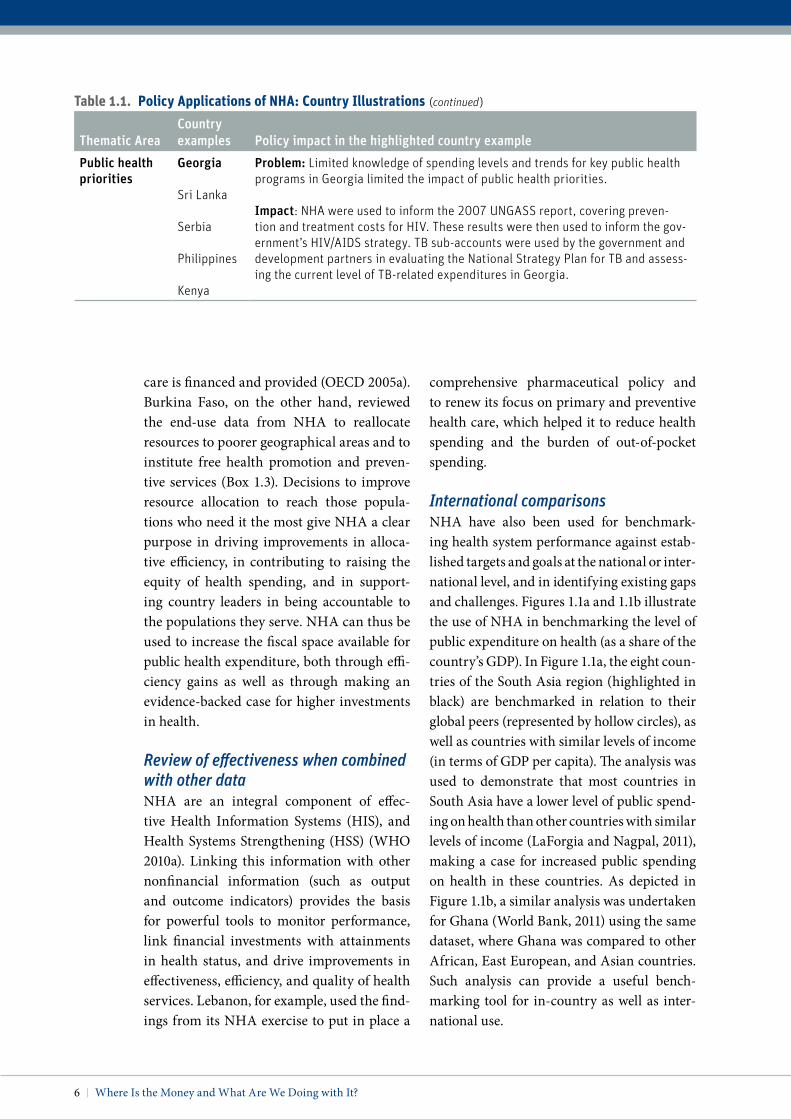
table 1.1. policy applications of nha: country illustrations
Thematic AreaCountry examples Policy impact in the highlighted country example
Public health priorities
Georgia
Sri Lanka
Serbia
Philippines
Kenya
Problem: Limited knowledge of spending levels and trends for key public health programs in Georgia limited the impact of public health priorities.
Impact: NHA were used to inform the 2007 UNGASS report, covering preven-tion and treatment costs for HIV. These results were then used to inform the gov-ernment’s HIV/AIDS strategy. TB sub-accounts were used by the government and development partners in evaluating the National Strategy Plan for TB and assess-ing the current level of TB-related expenditures in Georgia.
(continued)

The Case for Institutionalizing National Health Accounts | 7
In 2003, Turkey ranked behind most other middle-income countries in terms of its health indicators—life expec-tancy was nearly 10 years below the OECD average, and infant and maternal mortality rates were among the highest among middle-income countries. The public health sector was underperforming due to inefficiencies in resource allocation, under-trained staff, and poor incentives. To address these poor outcomes, the Health Transformation Program (HTP) was launched which included among other the establishment of universal health insurance (UHI) and a integrated primary health care system based on the family medicine model.
During the design of the HTP, NHA studies were conducted to estimate the additional health care costs of achieving UHI and cost saving opportunities that could help the Government of Turkey maintain health care costs at sustainable level while increasing insurance coverage. Different scenarios were used to model the var-ious cost paths (see Table below). The analysis showed that increased utilization as a result of increased insur-ance coverage in the absence of additional efficiency measures could potentially threaten the sustainability of the UHI (Model 2 below). On the other hand, if increased insurance coverage was combined the introduction of family medicine, referral rates and non-referral outpatient visits to MOH hospitals could be reduced by 10% and 50% respectively resulting in cost savings. Further, introduction of expenditure caps for MOH, private hospi-tals, university hospitals, and pharmaceutical spending with modest patient copayments could reduce the pub-lic health spending on UHI by 38% while maintaining the level of reduction of out-of-pocket expenses (Model 4 below). These results were presented to policy makers.
Adoption by the Government of these measures in the design of the HTP, has lead to the significant efficiency gains and improved financial sustainability of the UHI system. In addition, significant improvements in health outcomes in terms of increased life expectancy and reduced infant and maternal mortality rates have also been realized. In Turkey, as the reform progressed, NHA studies have helped continued monitoring the financial sus-tainability of the UHI system (OECD/WB, 2008; World Bank/MOH, 2011).
Box 1.3. Universal health insurance (Uhi) in turkey – Using nha analysis to realize efficiency Gains
Government health expenditure with and without Uhi in model 4 (after cost efficiency Gains) % GDP
0.0%2005 2007 2009 2011 2013 2015 2017 2019 2021 2023 2025
0.5%1.0%1.5%2.0%2.5%3.0%3.5%4.0%4.5%5.0%
Govt Exp no UHI Govt Exp with UHI
additional costs of Uhi (trillion tL, 2002 prices)
Model
Total Program
Costs
Additional Government
Costs
Additional Social Costs
Additional Out-of-Pocket
Expenses
Model 1: Complete coverage, no changes in utilization patterns 14 113 3 826 2 091 (–) 1 734
Model 2: Complete coverage, with expected changes in utilization levels and patterns following introduction of insurance
17 005 6 462 4 728 (–) 1 734
Model 3: Complete coverage, with expected changes in utilization levels and patterns following introduction of insurance, and intro-duction of family medicine
16 755 6 213 4 214 (–) 1 998
Model 4: Complete coverage, with expected changes in utilization levels and patterns following introduction of insurance, introduc-tion of family medicine, and with measures adopted to reduce pharmaceutical, inpatient care and hospital-based outpatient care expenditures
14 532 3 989 2 299 (–) 1 690

8 | Where Is the Money and What Are We Doing with It?
Transparency at the global levelFor international development agencies, NHA can inform the debate on the value of additional funds from development partners Thus, it can provide critical information to international partners for additional resource needs to meet global priorities such as the Millennium Development Goals (MDGs) NHA data have provided evidence to fore-cast the availability of resources and, based on this assessment of needs, US$ 40 billion was pledged for women’s and children’ health at the September 2010 UN summit 5 In May 2011, the United Nations Commission on Information and Accountability for Women’s and Children’s Health proposed a framework for global reporting, oversight, and account-ability on women’s and children’s health This accountability framework will track results and resource flows at global and country
levels, as detailed in Chapter 6, making a clear case for resource tracking using the NHA framework
NHA can also provide data for studies exam-ining how the availability of international aid influences the allocation of domestic resources for the health sector (Farag et al 2009; Lu et al 2010) By integrating NHA data into other policy instruments, such as public expenditure tracking systems, public expen-diture reviews (PERs), and medium-term expenditure frameworks (MTEFs), countries can link expenditures to budgets, making it possible to view the allocations in the context of complete public expenditure management,
Burkina Faso has used NHA to improve resource allocation across regions and key program areas. The 2005 NHA revealed major geographic inequities in health spending with poorer regions receiving less of total health spending than more affluent areas. For example, Boucle du Mouhoun and Nord, two of the poorest regions within the country with poverty incidences of 60 percent and 69 percent respectively, received a combined total 11 percent of all health care spending, but were home to 20 percent of the country’s total population. In contrast, the wealthier Centre region, home to just 9 percent of the population, received 29 percent of national health care spending, despite having only a 22 percent poverty incidence.
The discrepancy in health spending was due to the differential ability of regions to invest in infrastructure and capital investments. Poorer regions simply lacked the resources to devote additional resources to health. This finding prompted the construction and development of new health facilities by the central government, which increased by 62 percent between 2000 and 2009. The results also prompted the central government and devel-opment agencies to reallocate resources to poorer regions.
Effective resource tracking data have also been used to improve equity in resource allocation across health pro-grams in Burkina Faso. For example, the 2005 NHA found that 46 percent of the total health budget was spent on medication and other medical goods for outpatients, whereas 10 percent was spent on preventive services and health promotion. This prompted the government to offer free health promotion and preventive services to ensure that individuals continue to utilize primary health care services. Following this, the 2006 NHA results showed that spending on medical goods for outpatients declined to 31 percent, while spending on preventive health increased to 26 percent.
In addition, the NHA results showed insufficient district health spending, indicating little involvement of the health sector at the district-level. This prompted the central government to further decentralize responsibilities in health, for example, by transferring money and staff from central to district governments.
(Zida et al, 2010)
Box 1.4. Use of nha to improve resource allocation across Geographies and program areas in Burkina Faso
5 See http://www.who.int/pmnch/activities/jointac-tionplan/jap_financialgapswg/en/index.html and http://www.who.int/pmnch/en

The Case for Institutionalizing National Health Accounts | 9
as well as to forecast future needs Thailand provides an example of such an approach (Box 1 3) Using internationally accepted tools to define and measure health expendi-ture for these policy instruments also ensures that the numbers used are internationally comparable
Analysis of the fiscal spaceFor a variety of reasons—e g , for assessing the availability of public resources for meet-ing health-related MDGs or for implementing much-needed reforms such as attaining uni-versal health insurance coverage—there has been a growing demand for a framework for analyzing the fiscal space for the health sector in particular
The primary questions motivating any fiscal space assessment for health generally include:
• Given well-defined needs, what are the prospects (if any) for increasing public spending on health in the short- to-medi-um term without jeopardizing the gov-ernment’s long-term solvency or crowd-ing out necessary expenditures in other sectors?
• What is the impact of broader macroeco-nomic factors on public expenditures for
health; and conversely, to what extent does public and private spending on health influence the macro-economy?
• What can governments realistically afford, given macroeconomic and other constraints on public expenditures for health?
• Are there examples of innovative strate-gies that have been successful in increas-ing fiscal space for health in some coun-tries that could be adopted in others?
It is virtually impossible to conduct a robust fiscal space assessment without access to baseline NHA First, analysis of NHA data provides a baseline assessment of the current allocation of fiscal space to health Second, and of obvious importance for reform pos-sibilities, NHA can help identify the need for additional public (and total) spending on health and the potential fiscal space areas that could help meet such an identified need For example, Turkey’s Health Transformation Program aims to ensure the future fiscal sus-tainability of the health system Actuarial projections using NHA data were first con-ducted in 2007 under two different cost sce-narios to illustrate the need for building cost containment “brakes” into the system, such as hard caps on public health spending,
Figure 1.1. public expenditures on health as a Share of Gdp and in relation to income per capita, 2008
1.1a: South Asia 1.1b: Ghana in relation to peers

10 | Where Is the Money and What Are We Doing with It?
cost-sharing mechanisms, as well as micro-efficiency measures to ensure financial viabil-ity and fiscal sustainability of the health sys-tem (OECD/World Bank, 2008) Many such measures were introduced between 2007 and 2010, thus keeping public health spending at 6% of GDP
By parsing health resource flows by sources and use of funds, NHA data can also help assess the role of external sources in creating (or distorting) fiscal space for health in low- and lower-middle-income countries An anal-ysis by Shiffman (2008) for instance, high-lights the fact that in many African countries with relatively low-prevalence, donor com-mitments for HIV exceed the national bud-get devoted to all other diseases and public health activities collectively, suggesting a pos-sible skewing of priorities towards donor pref-erences Analysis of NHA data can also help assess whether or not donor funds tend to cre-ate additional fiscal space, or simply displace domestically-sourced public expenditures on health Prudent use of external resources is demonstrable in Indonesia where analy-sis of NHA data shows that donor funding on health as a share of total health spending rose dramatically in an attempt to cushion
the impact of the 1997–1998 financial crisis (Figure 1 2)
NHA data and its micro components can be analyzed in order to assess whether pub-lic resources for health might need to be reallocated to improve technical and alloca-tive efficiency (another critical source of fis-cal space for health) to shed light on equity—Are resources going to areas where they are needed the most? Are the poor benefit-ting from public resource outlays?—and effi-ciency—Is the country utilizing resources so as to maximize health outputs obtained? Are countries spending too much for pharmaceu-ticals? NHA data can be analyzed to provide answers to these and other efficiency-related questions that can help feed into fiscal space assessments
This section has reviewed various aspects of the value add that NHA data can contrib-ute in making health financing more efficient and equitable Weighed against these bene-fits, the costs of NHA activities is fairly small, especially if long-term capacity building and cost saving efforts are taken into account (see Chapter 4 for details) For example, the costs for the latest round of production and dissemination of NHA in Burkina Faso and Thailand represent 0 02% and 0 0006% of the respective governments’ spending on health 6 This rough calculation of cost, alongside the potential benefits and cost efficiencies NHA can help capture, suggests that investing in NHA activities is a cost-effective and “smart” investment for developing countries seeking to make better use of limited resources
Figure 1.2. Gdp Growth and external resources Share of health Spending in indonesia
GDPgrowth
rate
External share oftotal health spending
2
4
6
8
10
12
–15
–12
–9
–6
–3
0
3
6
9
1995 1997 1999 2001 2003 2005 2007
Exte
rnal
res
ourc
es s
hare
of h
ealt
h sp
endi
ng (
%)
Year
Source: IMF; WHO.Note: Shaded bars are years when GDP growth declined by more than 1% point.
6 Boureima Ouedraogo and Some Tegwouli, 2011 Personal Interview Director-General, Information and Health Statistics, Director of Studies and Planning, MOH, Burkina Faso Walaiporn Patcharanarumol 2011 Personal Interview Senior Researcher, IHPP, MOPH, Thailand June 22

The Case for Institutionalizing National Health Accounts | 11
1.2 The Case for institutionalizing National Health Accounts
Increasing awareness of the information and insights that NHA can offer policy makers and development partners has led to an ever-increasing number of countries producing and utilizing health expenditure data The practice of accounting for national health expenditures originated in the 1960s amongst OECD member countries By 1980, only fif-teen countries were producing health expen-diture information, still mainly OECD mem-bers; this number rose to twenty-five by 1990 In 2000, eighty-seven countries had produced such information at least once and thirty-seven of these were producing it on a regular basis By 2010, one hundred and thirty coun-tries had produced NHA at least once, with forty-one countries producing it routinely through internationally accepted health accounting techniques
The increased production of NHA is in many cases thanks to the hard work of individ-ual country champions who have designed and implemented the methodologies in the context of their respective countries Wider NHA production and use has also been facil-itated by regional agencies and academia through knowledge sharing,7 and by interna-tional development partners through finan-cial and technical support for these efforts Use of NHA has become more widespread, from being a resource-tracking tool used pri-marily in the richer countries to a tool used to inform policy in some of the poorest coun-tries of the world
While there is consensus on the need to improve the availability, quality, and policy relevance of financial data on health, NHA have not been widely institutionalized in most developing countries Even after the rapid gains made in recent years, NHA often remain
a supply-driven exercise sponsored princi-pally by donors and development partners rather than governments Even where there is interest, governments have often been unable to sustain NHA production, due to scarcity of financial and human resources or paucity of the data needed to produce health accounts regularly In some instances, accounts have been produced but have not been widely used as the link to policy makers has been weak, so limiting their potential impact
Institutionalization, by its nature, is suggestive of an ongoing process in which a set of activ-ities becomes an integral and sustainable part of a formal system Institutionalization can also be seen as a sequence of events leading to “new practices becoming standard practice” (Yin 1978) Merino Juárez and Raciborska (2008) developed a framework for assessing the institutionalization of NHA using the dimensions of an HIS as defined by the Health Metrics Network (HMN) 8 Supported by this prior work and based on feedback from about 40 countries which have been consulted, a working definition for institutionalization of NHA was arrived at, as follows:
Definition of Institutionalization of NHA
‘Routine government-led and coun-try-owned production and utiliza-tion of an essential set of policy rele-
7 “Regional agencies” is a term used in this doc-ument to define a partnership that helps coordi-nate the activities of countries in a specific region to promote a particular interest In this case, this partnership would support activities related to NHA or health financing (or both) It would comprise the regional agencies of international organizations, such as the regional offices of WHO, the regional networks (in this case mostly regional NHA networks), regional development banks, or regional institutions like the European Observatory on Health Systems and Policies (www.euro.who.int/en/home/projects/observatory) 8 See www.who.int/healthmetrics/about/en/

12 | Where Is the Money and What Are We Doing with It?
vant health expenditure data using an internationally accepted health ac-counting framework ’9
NHA represent a global public good and their use is certainly not limited to those who have produced them, nor does their use by one entity diminish their use by others Thus, the cost of producing NHA is to be compared to the full value that national and international stakeholders can potentially derive from the information There are many positive exter-nalities around this information that are yet to be completely realized, and in many cases these are not yet fully understood Economic theory suggests that in the absence of formal mechanisms to ensure sustained production, NHA data will be under produced by health information services, which may not be a desirable situation for countries or interna-tional development agencies
Institutionalizing NHA fosters their greater use and demand and improves transpar-ency and accountability in health systems Institutionalization reduces the cost and time required for the NHA process, and is criti-cal for ensuring local ownership and improv-ing demand If countries manage the process themselves, they usually design and imple-ment cost-effective programs that they see as being in their best interests Institutionalizing NHA also fosters greater use and demand for NHA as a tool for budgeting and tracking resources The more that NHA findings are used by policy makers and policy advocates, the more likely it is that this will strengthen demand for greater policy use of NHA
1.3 Holistic Framework for institutionalizing National Health Accounts
The definition set out above is supported by a framework for the institutionalization of
NHA, as depicted in Figure 1 3 This frame-work is predicated on the belief that institu-tionalization goes beyond the recent progress made by several countries in the production of NHA Instead, the framework proposes a complete process cycle, undertaken on a rou-tine basis, with the clear purpose of ensuring that NHA inform the decisions of national policy makers
Institutionalization, then, requires a cycle of activities to be embedded alongside the health systems planning and budgeting cycles Further, it requires a strategy to be developed to translate data into insights that are relevant for policy making
1.3.1 Stages in the NHA Process CycleThe stages in the NHA process cycle are as follows:
Demand from country leaders. In addi-tion to the global phenomenon of growing demand for information and accountability, NHA provide country leaders with the evi-dence required to make difficult decisions on the equitable and efficient allocation of scarce health resources Demand from country lead-ers is thus an essential stage in the NHA pro-cess This demand can be further accentu-ated, strengthened, and sharpened when put in the context of broader health financ-ing issues, through triangulation with other instruments and, as more information is made available, through appropriate ‘trans-lation’ of the information contained in the NHA, constituting a virtuous circle The ele-ment of ‘utilization’ in the above definition of institutionalization responds to this stage in the process cycle
Production of NHA, process management, and quality assessment. Major progress has
9 Global consultation in Washington DC (Oct 20–21, 2011)

The Case for Institutionalizing National Health Accounts | 13
been achieved in this part of the NHA cycle in recent years, and capacity to produce NHA has grown significantly over the past decade, especially in the developing world Neverthe-less, sustained production of NHA remains a major challenge Depending on their con-text, countries may face issues around the ownership of the production, the appropri-ate level of sophistication to match the coun-try’s capacity and financial resources, and linkages between production and utilization These issues are elaborated in further sections of this document
Dissemination of NHA findings. Dissemi-nation of information provided by NHA can be done both before and after data transla-tion While dissemination of the NHA will itself enhance transparency (and, with time, greater analysis and insights), it is very impor-tant to also disseminate the ‘translated’ data arising out of the NHA Dissemination pro-vides the vital link between production and
utilization, and requires effective targeting and messaging
Translation of NHA findings and dissemina-tion of specific analysis. NHA can be complex and often require further analysis (sometimes using additional datasets and other tools and instruments) to provide essential informa-tion on socioeconomic and health financ-ing issues that assist country leaders in tak-ing decisions and tracking progress towards health system goals The process of ‘transla-tion’ achieves this by extracting the informa-tion from NHA and creating new documents useful for the specific needs of different stake-holders and policy makers
Institutionalization of NHA will acceler-ate when the cycle of NHA activities starts with demand from policy makers who clearly articulate the key policy questions NHA can help inform Demand from policy mak-ers helps create an enabling environment
Figure 1.3. Framework for institutionalization of national health accounts
1. Demand and use
4. Translation of data anddissemination of specific analysis
• As country leaders make tough trade-offs to ensure an equitable and efficient allocation of scarce health resources, there is a critical need for an evidence base
• Regular use of NHA in policy making contributes to more sophisticated policy analysis
• Sustainable production of data remains a major challenge in many countries, but capacities to produce health accounts have grown significantly in the developing world over the past decade
• Making the collected data available for analysis enhances transparency and—with experience—analysis and insights that inform policy
• In countries that have institutional-ized NHA, data are widely disseminated.
• Dissemination takes place at two occasions, (1) when the NHA tables have been produced and (2) after the data has been translated into policy relevant briefs
• The value of NHA data is limited unless used as an evidence base for more informed health financing decisions.
• Country ownership of the translation process allows countries to champion key policy insights, increasing the likelihood that the answers NHA data provide will be used to affect policy
2. Production, data management, and quality assurance
3. Dissemination
Demand and Use
Production
Dissemination
Translationof data
GovernanceCapacityFinance
Source: The World Bank.
14 | Where Is the Money and What Are We Doing with It?
for accessing quality data and translating it into policy-relevant briefs However, in many countries, the cycle starts with the production of essential data, which goes through incre-mental improvements that can be leveraged when there is political demand to achieve cost efficiencies and more equitable spending
For example, in the USA, NHA produc-tion began in the 1960s and has been pro-duced routinely In 1980, projections for a five-year period began, for which continuous improvements have been made, to allow for the 75-year projections made today During the 1990s, NHA projections were increas-ingly integrated into Medicare trust funds, to inform key policy issues of federal rele-vance Recently, NHA data in triangulation with demographic data has provided evi-dence for analyzing the current financial cri-ses and US debt issues The demand for and sophistication of NHA data has grown over time Sustained production over time allowed economists and statisticians to make incre-mental improvements to generate and cap-ture a “policy window” for improving effi-ciency and equity in health spending 10
1.3.2 Core Elements of NHA Institutionalization
Three core elements—governance, capacity, and finance—form the heart of the frame-work presented above, and underpin the insti-tutionalization of all the stages in the process cycle The interplay between these core ele-ments and the process stages is illustrated in Figure 1 4 and briefly addressed in the remainder of this chapter Each of these core elements is then discussed in greater detail in the subsequent chapters of this document
Governance. A well-defined governance structure offers a framework for engaging key stakeholders to run and link each step of the NHA cycle and to improve data col-lection, validation, and eventual uptake in decision making Such a structure provides
the platform to connect the various politi-cal, administrative, and technical stakehold-ers involved in the process and thus influ-ences how each step in the cycle takes effect and is linked to the other steps The institu-tional structure of NHA governance can take multiple forms:
• It can be established entirely within the MOH
• It can be established within the MOH but with a formal structure that provides for multisectoral collaboration
• Ownership can be provided jointly by multiple sectors of government
• Ownership can reside outside of govern-ment
Further, within these models of ownership, the actual production itself can be ‘housed’ inside a government entity or outsourced to an external agency such as an independent research institution, a public school of health, or the national statistics office There is no right or wrong model in all these choices—there are strengths and weaknesses in each model and countries need to choose the one that best fits their institutional capacity, finan-cial resources, and political context Failure to consider governance in the NHA institution-alization plan, however, may mean that key opportunities in the health sector are missed These aspects are elaborated in Chapter 2 on governance
Capacity. The NHA process requires appro-priate individual, institutional and envi-ronmental capacity to drive and sustain the cycle The level of sophistication of NHA needs to match the country’s production and analytical capacity, as well as its capacity to apply the information for policy purposes
10 Waldo, Daniel 2011 Written Communication Senior Economist, Actuarial Research Corpora-tion 17 September 2011

The Case for Institutionalizing National Health Accounts | 15
Each stage in the NHA process also requires specific skill sets in the NHA teams, which need to be matched with the skill sets avail-able in-country or internationally, and made available for effective completion of the task These aspects are detailed in Chapter 3 of this document
Finance. The availability of adequate finan-cial resources to regularly undertake the NHA process is key to sustaining NHA activities It is important to put in place a long-term financing strategy as a part of country’s plan to build capacity and achieve cost efficiencies, based on a country’s specific socioeconomic contexts It is also appropri-ate to institute mechanisms for higher cost efficiency, such as by reducing the reliance on specific surveys for the purpose of NHA alone, and by integrating NHA data require-ments with the country’s regular report-ing systems or with other planned surveys These issues are elaborated in Chapter 4 of this document
In considering these three core elements of the NHA institutionalization framework, it is important to emphasize that while a coun-try can ‘borrow’ capacity and finance, coun-try leadership and ownership of the entire NHA process is crucial In other words, NHA can be institutionalized effectively in a coun-try even in the absence of adequate domestic sources of finance and capacity—but not in the absence of true ownership by that country
1.3.3 Country Context and its Implications for Institutionalization
The four-stage process cycle and the three core elements discussed above represent two different dimensions of the institutionaliza-tion framework for NHA The third dimen-sion of the framework is represented by the country context, which has a multitude of implications for how NHA are institutional-ized Issues surrounding ownership, finan-cial sustainability, and cost efficiency of the NHA process can differ significantly at the
Figure 1.4. critical components in managing the nha cycle and their influence on performance
• Organizational structure that runs and links each step of the cycle
• Individual, institutional, and environmental capacity to drive and sustain the cycle
• Finances to support the cycle of activities and the ability to generate cost efficiencies
• Mode of production influences the technical capacity, connection with data sources, link to policy makers, and sustainability
• Knowledge and skills are necessary to produce NHA
• Level of NHA sophistication needs to match countries’ capacity
• Robust structure for producers and users to interact is crucial to improve analysis and use
• Need capacity to draw useful insights from NHA to inform policies, and make the case for NHA to policymakers
• Formal structure that links NHA with planning and budgeting processes can ensure that data informs policy
• Capacity of policy makers and other users to understand and reflect key findings on policy decisions is critical for the effective use of data
• Production accounts for majority of total NHA cost
• Upfront cost savings are possible, and can increase sustainability
• Resources need to be allocated for dissemination, translation and use
• Long-term financing strategy across the cycle that defines cost sharing between countries and donors over time ensures sustainability
• Dissemination strategy and channels impact effective targeting and messaging
• Skills to target communications are critical to influence users
Governance Capacity Finance
Translationof data
Demandand use
Dissemination
Production
Definitions
Source: The World Bank.

16 | Where Is the Money and What Are We Doing with It?
country level So can the capacity aspects of knowledge transfer, tools and skills, and link-ages of NHA to a country’s specific finan-cial resources and its planning/budget prior-ities One of the major influences for all these aspects of the country context is the resource environment We have therefore used the dif-ferences a country’s income levels (using the World Bank income classification of coun-tries) to represent this third dimension, as illustrated in Figure 1 5
This three-dimensional model takes cogni-zance of the fact that ‘one size does not fit all’ and that the country context is an important determinant for making appropriate choices for the institutionalization of NHA In par-ticular: As a country’s economy matures and its skill-sets grow, its capacity to afford recur-ring costs as well as undertake in-country production of NHA also increases However, this ability to finance NHA domestically, and also the availability of domestic capacity
to produce and translate NHA, is to be dis-tinguished from country ownership of NHA which needs to exist even when the process is externally funded and/or externally produced
With increasing complexity of health financ-ing systems, as countries move from low-middle income to middle income, there may be need for more sophisticated NHA infor-mation and to invest in more detailed NHA exercises As a corollary, in a low-income set-ting it is important to match the complex-ity of the NHA exercise with the level of re-sources, prioritizing essential information for policy makers
In the chapters that follow, this document synthesizes, organizes and builds upon actual country experiences to provide a sys-tematic framework and methodology that country policy makers can deploy for insti-tutionalizing NHA in their own specific context
Figure 1.5. a three-dimensional model of country ownership of nha institutionalization
Translationof data
Demandand use
Dissemination
Production
Area of potential use of domestic resources Potential reliance on international support
Illustrative
Finance
Low-income-country model
Middle-income country model
Low-middle-income country model
Governance Capacity • How governance, capacity, and finance are owned and managed throughout the NHA cycle should differ by countries’ socioeconomic status
• Reliance on international support is expected to decrease as countries’ socioeconomic status improves
• Regardless of the availability of domestic resources, it is critical that countries ‘own’ key dimensions of NHA institutionalization to ensure uptake in planning and budgeting processes at the country level
Use of domestic resources increases as country’s socio-economic status improves
Low income countries may need to rely on international support to finance activities, but would benefit from owning the process for creating demand and effective use of NHA
Source: The World Bank.

17
Governance Structures for NHA
This chapter assesses the range of possible governance models for NHA, including the institutional location of NHA activities It shows how the choice of governance structure is influenced by a country’s income level, its available institutional capacity, and the loca-
tion of the resources necessary to undertake the work This chapter also considers the specific styles and modes of NHA production, which are related to its governance structure and influ-enced by similar considerations Broadly speaking, NHA production can either be handled in-house by the government entity acting as the “institutional home” for NHA activities, or out-sourced to an independent research organization or a school of public health, as examples This chapter also discusses the importance of supporting the governance structure by legal and bud-getary frameworks
Key points are:
• The governance structure of NHA lies at the heart of the NHA institutionalization cycle It is a vital element linking NHA production to the effective use of the data to inform pol-icy decisions
• Four governance models have been identified:1 Government mandated: MOH-led production and use with limited input from outside
the health sector2 Government mandated: MOH-led production with multisectoral Technical and Policy
Advisory Groups3 Government mandated multisectoral Production, Technical and Policy Advisory teams4 Externally mandated with limited or no government collaboration
• Countries can choose their model in view of their financial and human resources and polit-ical context, taking into account the unique strengths of the model chosen, while being able to preempt potential challenges associated with the chosen model Country experiences also suggest several lessons for selecting a governance model:• Countries can improve the sustainability of NHA production by locating the produc-
tion of NHA where technical expertise resides, including statistical, accounting and health economics expertise
Chapter 2

18 | Where Is the Money and What Are We Doing with It?
• Regardless of the model and produc-tion mode selected, ownership of the “institutional home”, especially in connecting analysis of data with pol-icy use, is crucial
• A governance structure with multi-sectoral involvement is likely to facil-itate access, transparency and qual-ity of date, which is likely to lead to broader uptake of the insights this data help produce by policy makers
• It is important that the governance struc-ture is supported by appropriate legal and budgetary frameworks that help countries ensure routine NHA production, dissem-ination, and translation, and improve sus-tainability of the activities
2.1 identifying the Right institutional “Home” for NHA
The governance structure of NHA—its institu-tional “home”—lies at the heart of the full insti-tutionalization cycle It is a core component in linking NHA production to the use of the data and their “translation” to inform policy (i e the further analysis that translates large volumes of data into insightful evidence that supports pol-icy makers in their decision making) Failure to consider governance in the NHA institutional-ization plan may mean that key opportunities in the health sector are missed
This NHA “home” differs from country to country and depends on the country context and its institutional, political, and fiscal capac-ity There are different governance models that countries may consider in this regard; we have identified four models based on an extensive literature review and interviews with pro-ducers and policy makers in more than forty countries, as well as with staff of development agencies and donors, including World Bank staff globally These interviews have suggested potential strengths and challenges that apply broadly to each model It is important to high-light the possible advantages and disadvan-tages of each so that countries can plan how to deal with these challenges in advance
It is important to note that the institutional “home” of the NHA may shift over time, and that the availability of technical expertise will indicate the most logical place for NHA to be located Korea provides an example as the institutional “home” for its NHA has changed over the years, based on where expertise for its production has been located (Box 2 111)
We begin by proposing a generic frame-work that highlights the various roles and
Over time, Korea has experienced a series of changes to the institutional “home” for NHA—from the Korea Institute of Health Services Management (KIHSM), predecessor of the Korea Health Industry Development Institute (KHIDI) in the early 1990s, to the Korea Institute of Health and Social Affairs (KIHASA) Management (1998–2005) after joining the OECD, and finally (as of 2003) to Yonsei University, commissioned by the Ministry of Health and Welfare. The shift in the “home” of NHA was due to the level of technical expertise at Yonsei. Whereas previously NHA tables were produced by the KIHSM and the KIHSA in a two-dimensional man-ner (i.e. by financing and function), the NHA team at Yonsei has succeeded in constructing three-dimensional tables required by the System of Health Accounts (SHA). Currently, the official organization responsible for the production of NHA is the Ministry of Health and Welfare. The Ministry contracts the production of NHA out to Yonsei University, which is responsible for producing the full set of NHA tables and matrices.
(Jeong, 2004)
Box 2.1. changes in Governance Structure in Korea
11 Jeong, Hyoung-Sun 2011 Personal com-munication Professor, Department of Health Administration, College of Health Science, Yonsei University August 11

Governance Structures for NHA | 19
responsibilities that make up the cycle of NHA activities This is not a one-size-fits-all model but is rather meant to serve as an illustration for countries to think through when delineat-ing the various tasks and responsibilities in institutionalizing NHA Irrespective of the governance model chosen, it is important that responsibilities be clearly delineated and del-egated Here is an example of how roles and responsibilities could be structured into three main teams (Figure 2 1):
• A Coordinating Body can be employed to plan, budget and coordinate the full cycle of NHA activities Activities of the Coordinating Body may include: develop-ing and managing the NHA budget; coor-dinating a data repository; developing an effective communication strategy; and managing the work of health accountants
• A Policy Advisory Group facilitated by the Coordinating Body could then potentially provide the critical link between NHA results and the uptake and use of data to inform policy The Policy Advisory Group would therefore be responsible for provid-ing guidance on policy priorities and serve as “ambassadors” of NHA and of NHA insights to the respective organizations
they represent, to ensure that these are applied to policy Its members would liaise with key decision makers to ensure buy-in and ownership of the data, and most importantly provide them with access to essential information that can guide their decision making
• A Technical Consultative Group, also facili-tated by the Coordinating Body, could pro-vide guidance on the technical side—e g , reaching out to entities that provide data inputs for NHA production, validating and ensuring quality of the data, and so on Within the Technical Consultative Group, various sub-committees could interact directly with public, private, and household sub-committees to ensure the regular feed-in of the data needed for NHA production
Countries often establish a Steering Committee to oversee and support NHA activities, which in some settings serves as a Policy Advisory Group and in others serves as a Technical Consultative Group It is important for coun-tries to clearly define the function of each entity, and ensure a body is in place to provide guidance on policy priorities and serve as a link between NHA insights and policy (i e the function of Policy Advisory Group)
Figure 2.1. illustrative Framework for defining roles and responsibilities
Policy Advisory Group
Coordinating body
Technical ConsultativeGroup
Key role:
Sub committee 1(public sector focus)
Sub committee 2(private sector focus)
Sub committee 3(household focus)
Illustrative structure
• Plan, budget, and coordinate implementation for the full institutionalization process
• Coordinate production of data (in-house or outsourced)
• Act as a repository of data
Key role:
• Facilitate outreach to different stakeholders on access to data
• Conduct and facilitate quality assurance and data validation
Key role:
• Provide guidance on policy priorities
• Act as champions for uptake and policy use
Source: The World Bank.
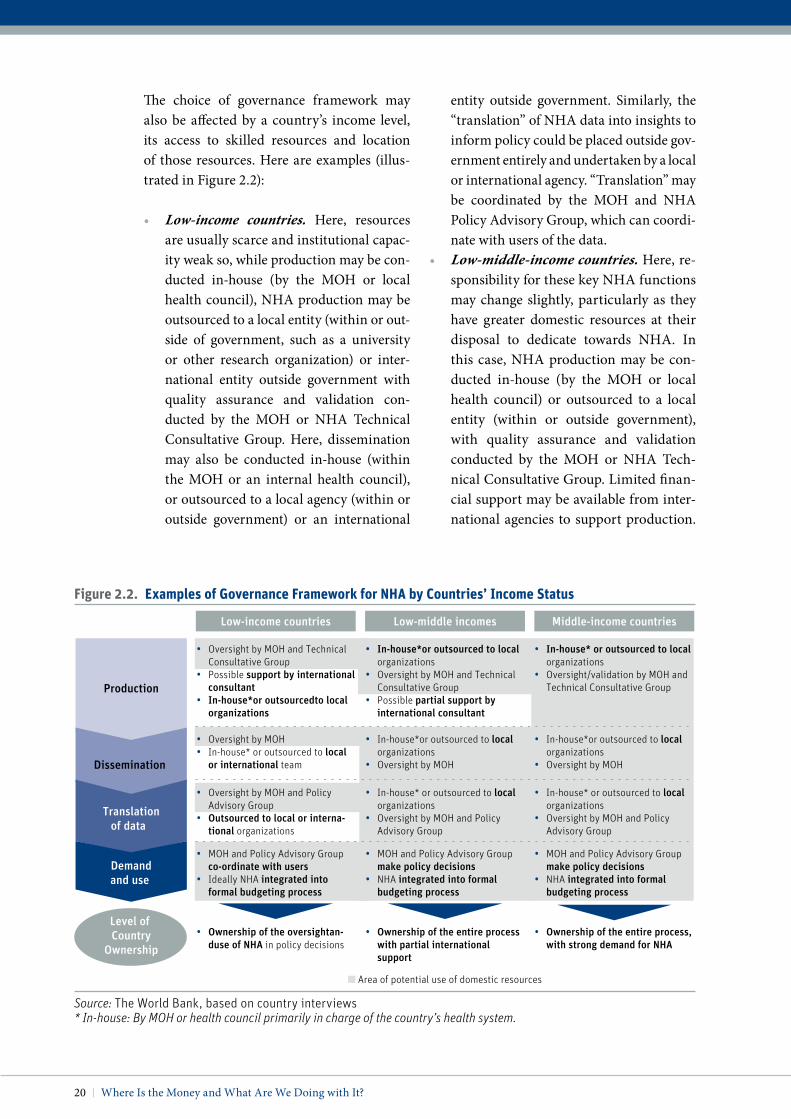
20 | Where Is the Money and What Are We Doing with It?
The choice of governance framework may also be affected by a country’s income level, its access to skilled resources and location of those resources Here are examples (illus-trated in Figure 2 2):
• Low-income countries. Here, resources are usually scarce and institutional capac-ity weak so, while production may be con-ducted in-house (by the MOH or local health council), NHA production may be outsourced to a local entity (within or out-side of government, such as a university or other research organization) or inter-national entity outside government with quality assurance and validation con-ducted by the MOH or NHA Technical Consultative Group Here, dissemination may also be conducted in-house (within the MOH or an internal health council), or outsourced to a local agency (within or outside government) or an international
entity outside government Similarly, the “translation” of NHA data into insights to inform policy could be placed outside gov-ernment entirely and undertaken by a local or international agency “Translation” may be coordinated by the MOH and NHA Policy Advisory Group, which can coordi-nate with users of the data
• Low-middle-income countries. Here, re-sponsibility for these key NHA functions may change slightly, particularly as they have greater domestic resources at their disposal to dedicate towards NHA In this case, NHA production may be con-ducted in-house (by the MOH or local health council) or outsourced to a local entity (within or outside government), with quality assurance and validation conducted by the MOH or NHA Tech-nical Consultative Group Limited finan-cial support may be available from inter-national agencies to support production
Figure 2.2. examples of Governance Framework for nha by countries’ income Status
Area of potential use of domestic resources
• Oversight by MOH and Technical Consultative Group
• Possible support by international consultant
• In-house*or outsourcedto local organizations
• In-house*or outsourced to local organizations
• Oversight by MOH and Technical Consultative Group
• Possible partial support by international consultant
• In-house* or outsourced to local organizations
• Oversight/validation by MOH and Technical Consultative Group
• Oversight by MOH• In-house* or outsourced to local
or international team
• In-house*or outsourced to local organizations
• Oversight by MOH
• In-house*or outsourced to local organizations
• Oversight by MOH
Low-income countries Low-middle incomes Middle-income countries
Translationof data
Demandand use
Dissemination
Production
• Oversight by MOH and Policy Advisory Group
• Outsourced to local or interna-tional organizations
• In-house* or outsourced to local organizations
• Oversight by MOH and Policy Advisory Group
• In-house* or outsourced to local organizations
• Oversight by MOH and Policy Advisory Group
• MOH and Policy Advisory Group co-ordinate with users
• Ideally NHA integrated into formal budgeting process
• MOH and Policy Advisory Group make policy decisions
• NHA integrated into formal budgeting process
• MOH and Policy Advisory Group make policy decisions
• NHA integrated into formal budgeting process
• Ownership of the oversightan-duse of NHA in policy decisions
• Ownership of the entire process with partial international support
• Ownership of the entire process, with strong demand for NHA
Level of Country
Ownership
Source: The World Bank, based on country interviews* In-house: By MOH or health council primarily in charge of the country’s health system.

Governance Structures for NHA | 21
Dissemination may also be conducted in-house (within the MOH or an inter-nal health council) or outsourced to a lo-cal entity within or outside government Similarly, “translation” of NHA data into insights to inform policy could be out-sourced to a local agency (within or out-side government), coordinated by the MOH and NHA Policy Advisory Group, which can integrate NHA into formal budgeting and planning processes and use the data to make policy decisions
• Middle-income countries. Here gover-nance may take a different approach given the greater resources available to lead and own various activities in the full cycle of NHA activities As a result, middle-income countries may handle NHA pro-duction in-house (within the MOH or local health council) or delegate this work to a local agency within or outside government (e g , Central Statistical Agency) Again, validation and quality assurance could be assumed by the MOH and NHA Technical Consultative Group Similarly, dissemina-tion could be conducted in-house (within the MOH or by a local health council) or delegated to a local agency within or out-side government These same entities could play a role in the “translation” of insights from NHA data to inform policy, with the MOH and Policy Advisory Group ultimately applying these insights to directly affect policy, while fully integrat-ing NHA into formal budgeting and plan-ning processes These processes can ulti-mately culminate in strong ownership of and demand for NHA at the country-level
2.2 Governance Models Compared
The four governance models identified above are considered here, along with their poten-tial strengths and challenges (also summa-rized in Figure 2 3 and Figure 2 4)
1 Government mandated: MOH-led production and use with limited input from outside the health sector. Some countries host NHA strictly within the statistics, economics, or planning units of the MOH This typically indi-cates that data collection and produc-tion are conducted or, if outsourced to an external organization, overseen by the MOH Management and quality assurance may be tasked to the same production team or a wider NHA Technical Consultative Group within the MOH responsible for overseeing the team’s work Similarly, “transla-tion” of data may be conducted by a Policy Advisory Group before dissem-ination to and use by technocrats who can link the evidence to relevant health policies This model typically entails that demand for the data is driven by the government agency that acts as the institutional home for NHA, often the MOH In this model there is little to no collaboration across agencies and min-istries within government, with owner-ship of the full cycle of NHA activities largely remaining within the MOH
Potential strengths of this model are:
• Data analysis is likely to reflect poli-cies and priorities within the MOH, increasing the likelihood that insights from the data will be generated to inform health policy
• Further, the team responsible for pro-duction will tend to have strong public health expertise
Potential challenges of this model are:
• The production team may lack the sta-tistical or accounting expertise needed for NHA production
• Use of data to inform policy may be limited to the MOH, limiting the

22 | Where Is the Money and What Are We Doing with It?
Figure 2.3. Governance Structures by Key Function
1. MOH with little collaboration
2. MOH with multisectoral collaboration 3. Multisectoral team
4. Independent research agency
Production
Translation of data
Demand and use
MOH External to governmentMultisectoral team Government-led model
• Statistics/economic/ finance unit of MOH
• Statistics/economic/ finance unit of MOH
• Planning department of MOH
• Statistics/economic/ finance unit of MOH
• Multisectoral Policy Advisory Group
• Statistics/economic/ finance unit of MOH
• Multisectoral production and technical expert team (MOH, university, MF, statistical office, etc.)
• Production team (above)
• Multisectoral Policy Advisory Group
• Planning department of MOH in charge of national health strategies
• Multisectoral Policy Advisory Group (MOH, MOF, statistical office, etc.)
• Multisectoral Policy Advisory Group (MOH, MOF, statistical office, etc.)
• Independent research agency or think tank
• Independent research agency or think tank
• Independent research agency or think tank
Source: The World Bank
Figure 2.4. Governance Structures: possible Strengths and challenges
1. MOH with little collaboration
2. MOH with multisectoral collaboration 3. Multisectoral team
4. Independent research agency
• Can expect analyses to reflect policies and priorities within MOH, increasing the likelihood that data will inform policy
• Strong public health expertise among producers
• Can leverage broad/ multisectoral expertise of team to facilitate production
• Can leverage team members’ connections to facilitate access to data inputs for NHA production
• May have greater objectivity in use of data to inform policy
• Can “showcase” results and prompt govern-ment to take action, particularly where there is lack of interest by government
• May have strong technical or health expertise
• May have greater objectivity in analyses to inform policy
• Analyses typically reflect policies and priorities within MOH, as well as broader government policies (e.g., MTEF), and other planning and budgetary processes
• Strong public health expertise among producers
• Can leverage team members’ connections to facilitate access to data inputs
• May have greater objectivity in use of data to inform policy
• Ease of coordination with MOH as “anchor” or owner of the NHA process
• May lack statistical or accounting expertise needed for production
• Use of data to inform policy may be limited to MOH
• May lack objectivity in selecting analyses and using results to inform policy
• May focus on tracking resource flows within health sector alone, which may limit understanding of the total resource flows to health
• Results may not be validated by MOH or other agencies providing data inputs
• Lack of ownership by MOH or other government entity may limit ability to impact policy
• Lack of sustainability
• May lack statistical or accounting expertise needed for production
• Requires multisectoral coordina-tion
• Multisectoral coordination requires strong champion to effectively bring stakeholders together
Potential Strengths
Potential Challenges
Source: The World Bank

Governance Structures for NHA | 23
ability of other government agencies (e g , Ministry of Finance) to use data to shape policy A potential limitation of this model is that it tends to offer limited access to and validation of data outside the MOH, given the lack of collaboration and input from other agencies
• The analyses conducted for policy use are likely to be driven by the MOH, rather than by the needs of other agen-cies within government
2 Government mandated: MOH-led production with multisectoral Tech-nical and Policy Advisory Groups. Another type of governance structure is one where the institutional “home” of the NHA lies within the MOH, yet where there is multisectoral involve-ment through an NHA Technical Consultative Group and/or a Policy Advisory Group that is both techni-cally and politically savvy (Box 2 212) In this example, data collection and production are conducted or, if out-sourced, overseen by the team housed within the MOH Access to and vali-dation of data that exist outside the scope of the health sector can be
facilitated by Technical Consultative Group members Management and quality assurance may also be provided by a multisectoral Technical Consulta-tive Group responsible for providing methodological guidance and super-vision This group may include rep-resentatives from the public and pri-vate sectors, universities, development partners, or research organizations “Translation” and dissemination may occur through a multisectoral Policy Advisory Group Given the multisec-toral involvement in this model, de-mand for NHA data may come from the MOH, Ministry of Finance (MOF), development partners, or the various stakeholders involved in the Advisory Group Nevertheless, the MOH con-tinues to serve to “anchor” the NHA institutional cycle from production to use In other words, the MOH coordi-nates the process and serves as the pri-mary custodian of NHA activities For example, in Japan, the MOH mandates
Tanzania “houses” its NHA within the Ministry of Health and Social Welfare (MoHSW) and uses a multi-stake-holder Working Group (WG) to provide oversight. Data collection and production are conducted by a multisec-toral technical team, comprised of a representative from the University of Dar es Salaam, Ministry of Finance, and National Bureau of Statistics. Management and quality reviews of data are the responsibility of a Health Financing Working Group which includes development partners, the Ministry of Finance, and the private sector and civil society to provide methodological guidance.
The WG is also responsible for commissioning specific studies deemed relevant to the health sector and there-fore “translating” the data to inform policy. Dissemination occurs through: the Joint Annual Health Sector Review where all development partners and public and private entities are present; the MoHSW website; pol-icy briefs; and international forums such as the International Health Economics Association (iHEA). Local media will be used to further disseminate future results. Multisectoral involvement in Tanzania means that there is a broader use of data from a wide range of audiences including government, civil society, research institutions, and development partners.
Box 2.2. Governance through the moh with a multisectoral Steering committee in tanzania
12 Ally, Mariam 2011 Personal Interview Head of Health Financing Unit, Ministry of Health and Social Welfare, Tanzania July 7
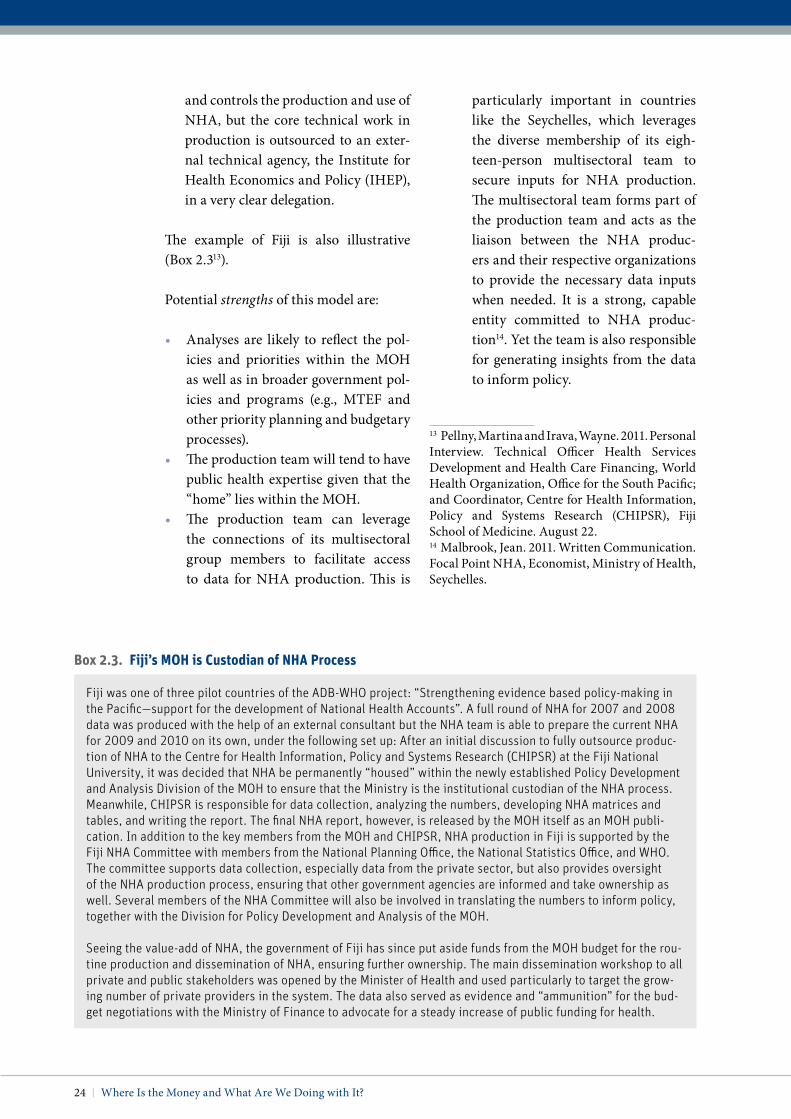
24 | Where Is the Money and What Are We Doing with It?
and controls the production and use of NHA, but the core technical work in production is outsourced to an exter-nal technical agency, the Institute for Health Economics and Policy (IHEP), in a very clear delegation
The example of Fiji is also illustrative (Box 2 313)
Potential strengths of this model are:
• Analyses are likely to reflect the pol-icies and priorities within the MOH as well as in broader government pol-icies and programs (e g , MTEF and other priority planning and budgetary processes)
• The production team will tend to have public health expertise given that the “home” lies within the MOH
• The production team can leverage the connections of its multisectoral group members to facilitate access to data for NHA production This is
particularly important in countries like the Seychelles, which leverages the diverse membership of its eigh-teen-person multisectoral team to secure inputs for NHA production The multisectoral team forms part of the production team and acts as the liaison between the NHA produc-ers and their respective organizations to provide the necessary data inputs when needed It is a strong, capable entity committed to NHA produc-tion14 Yet the team is also responsible for generating insights from the data to inform policy
Fiji was one of three pilot countries of the ADB-WHO project: “Strengthening evidence based policy-making in the Pacific—support for the development of National Health Accounts”. A full round of NHA for 2007 and 2008 data was produced with the help of an external consultant but the NHA team is able to prepare the current NHA for 2009 and 2010 on its own, under the following set up: After an initial discussion to fully outsource produc-tion of NHA to the Centre for Health Information, Policy and Systems Research (CHIPSR) at the Fiji National University, it was decided that NHA be permanently “housed” within the newly established Policy Development and Analysis Division of the MOH to ensure that the Ministry is the institutional custodian of the NHA process. Meanwhile, CHIPSR is responsible for data collection, analyzing the numbers, developing NHA matrices and tables, and writing the report. The final NHA report, however, is released by the MOH itself as an MOH publi-cation. In addition to the key members from the MOH and CHIPSR, NHA production in Fiji is supported by the Fiji NHA Committee with members from the National Planning Office, the National Statistics Office, and WHO. The committee supports data collection, especially data from the private sector, but also provides oversight of the NHA production process, ensuring that other government agencies are informed and take ownership as well. Several members of the NHA Committee will also be involved in translating the numbers to inform policy, together with the Division for Policy Development and Analysis of the MOH.
Seeing the value-add of NHA, the government of Fiji has since put aside funds from the MOH budget for the rou-tine production and dissemination of NHA, ensuring further ownership. The main dissemination workshop to all private and public stakeholders was opened by the Minister of Health and used particularly to target the grow-ing number of private providers in the system. The data also served as evidence and “ammunition” for the bud-get negotiations with the Ministry of Finance to advocate for a steady increase of public funding for health.
Box 2.3. Fiji’s moh is custodian of nha process
13 Pellny, Martina and Irava, Wayne 2011 Personal Interview Technical Officer Health Services Development and Health Care Financing, World Health Organization, Office for the South Pacific; and Coordinator, Centre for Health Information, Policy and Systems Research (CHIPSR), Fiji School of Medicine August 22 14 Malbrook, Jean 2011 Written Communication Focal Point NHA, Economist, Ministry of Health, Seychelles
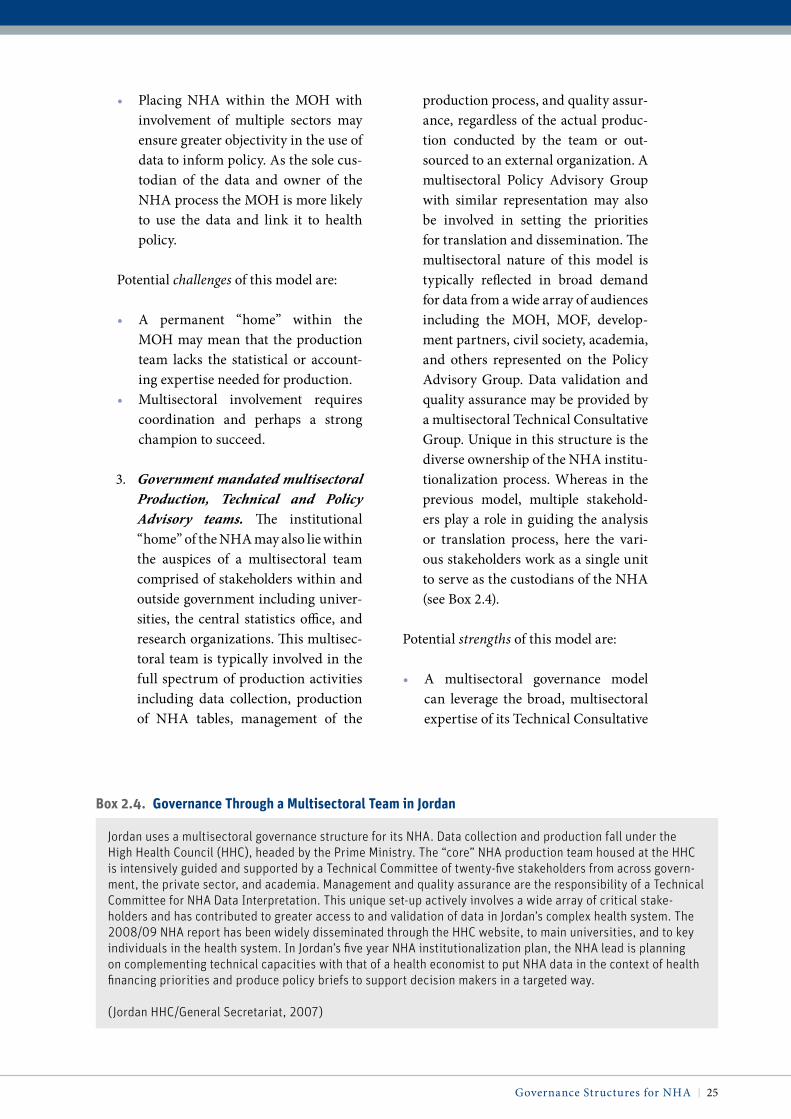
Governance Structures for NHA | 25
• Placing NHA within the MOH with involvement of multiple sectors may ensure greater objectivity in the use of data to inform policy As the sole cus-todian of the data and owner of the NHA process the MOH is more likely to use the data and link it to health policy
Potential challenges of this model are:
• A permanent “home” within the MOH may mean that the production team lacks the statistical or account-ing expertise needed for production
• Multisectoral involvement requires coordination and perhaps a strong champion to succeed
3 Government mandated multisectoral Production, Technical and Policy Advisory teams. The institutional “home” of the NHA may also lie within the auspices of a multisectoral team comprised of stakeholders within and outside government including univer-sities, the central statistics office, and research organizations This multisec-toral team is typically involved in the full spectrum of production activities including data collection, production of NHA tables, management of the
production process, and quality assur-ance, regardless of the actual produc-tion conducted by the team or out-sourced to an external organization A multisectoral Policy Advisory Group with similar representation may also be involved in setting the priorities for translation and dissemination The multisectoral nature of this model is typically reflected in broad demand for data from a wide array of audiences including the MOH, MOF, develop-ment partners, civil society, academia, and others represented on the Policy Advisory Group Data validation and quality assurance may be provided by a multisectoral Technical Consultative Group Unique in this structure is the diverse ownership of the NHA institu-tionalization process Whereas in the previous model, multiple stakehold-ers play a role in guiding the analysis or translation process, here the vari-ous stakeholders work as a single unit to serve as the custodians of the NHA (see Box 2 4)
Potential strengths of this model are:
• A multisectoral governance model can leverage the broad, multisectoral expertise of its Technical Consultative
Jordan uses a multisectoral governance structure for its NHA. Data collection and production fall under the High Health Council (HHC), headed by the Prime Ministry. The “core” NHA production team housed at the HHC is intensively guided and supported by a Technical Committee of twenty-five stakeholders from across govern-ment, the private sector, and academia. Management and quality assurance are the responsibility of a Technical Committee for NHA Data Interpretation. This unique set-up actively involves a wide array of critical stake-holders and has contributed to greater access to and validation of data in Jordan’s complex health system. The 2008/09 NHA report has been widely disseminated through the HHC website, to main universities, and to key individuals in the health system. In Jordan’s five year NHA institutionalization plan, the NHA lead is planning on complementing technical capacities with that of a health economist to put NHA data in the context of health financing priorities and produce policy briefs to support decision makers in a targeted way.
(Jordan HHC/General Secretariat, 2007)
Box 2.4. Governance through a multisectoral team in Jordan

26 | Where Is the Money and What Are We Doing with It?
Group to guide and provide oversight of the production process
• It can leverage team members’ con-nections to facilitate access to data input for production
• A multisectoral model may contrib-ute to greater objectivity in the use of data to inform policy, as there are var-ious stakeholders who “own” the insti-tutionalization process
Potential challenges of this model are:
• Responsibilities for production may be unclear unless there is good coor-dination and delegation of tasks
• It may be difficult to coordinate and oversee the NHA process without strong leadership and good commu-nication across agencies to oversee the work
• Multisectoral coordination requires a strong champion to succeed, as is the case in Jordan where NHA insti-tutionalization has been facilitated and led by a strong policy advocate who has realized the added value of having broad stakeholder support, continuous training, and making a “home” for health resource tracking data at the cornerstone of policy mak-ing Without a strong custodian in an entity like the MOH, it may be difficult to “translate” insights from NHA data to impact health policy, given that the MOH is not the custodian or owner of the NHA process
4 Externally mandated with limited or no government collaboration. Finally, some governance structures place the “home” of the NHA entirely outside of government The external entity may or may not have linkages to govern-ment In this model, data collection and production is conducted entirely by the external team along with over-
sight, management, and quality assur-ance In this model, translation, dis-semination, and NHA data use to inform policy may in each case be the responsibility of the external team or government
Potential strengths of this model are:
• An external governance structure may imply greater objectivity in conducting and using analyses to inform policy
• Through wide dissemination of re-sults, externally mandated NHA ac-tivities can assist in holding country leaders accountable for their targets or in showcasing results to bring aware-ness of key findings to the govern-ment—particularly in areas where it has previously lacked interest
• The external agency may also have strong technical or health expertise, depending on the personnel on the team
• Minimal bureaucracy in the out-side agency may increase the speed of production
Potential challenges of this model are:
• An externally “housed” NHA raise issues of sustainability—particularly if the external entity loses the interest or ownership of the NHA
• This model may result in limited own-ership of the process by the MOH or other government entity, thereby lim-iting the potential for data to inform policy
• Results may fail to be validated by the MOH or other agencies providing data input
• This model requires strong link-ages and communication between the external agency and policy users and translators within government to inform policy

Governance Structures for NHA | 27
Regardless of the governance structure cho-sen, country experiences indicate that it is beneficial to think through the following issues:
• Creating administrative agreements or mandates to institutionalize NHA pro-duction
• Delineating clear roles and responsibili-ties to avoid duplication of effort and opti-mize productivity as well as clear link-ages to other agencies which both provide input and are able to translate data to inform policy
• Building institutional capacity within the institutional “home” to ensure there is a sufficient knowledge base to support operations at times of staff loss
• Establishing well-functioning Technical Consultative Groups to ensure quality and credibility of the data and of Policy Advisory Groups that can set priorities and act as champions for the use of data in policy
Country experience also shows that having stakeholders involved to provide access to and to validate the data is likely to increase data quality, transparency, and reliability Further, linkages to policy makers help to ensure that use of the data is optimized and that insights from the data can be readily taken up by pol-icy makers; this requires an economist or other health expert (possibly one who also sits on the production team) with linkages to key decision makers, who can put NHA in the context of other broad health reform issues and analyses
2.3 Selecting Modes of production for NHA Data
The NHA production stage will now be con-sidered in more detail Production gener-ally includes a set of activities involving
data collection, management, quality assess-ment, and validation It should be noted that the location of production may change over time and that while the mode of production may vary dependent upon a country’s income level and access to and the location of skilled resources, the choice of style and mode of the process is important as there are strengths and challenges associated with each As has been said, the production side of NHA may be undertaken in-house or external to the “institutional home” regardless of the model selected (Figure 2 5) Details of the produc-tion process including data collection, data management, and data quality are discussed elsewhere in the Guide to Producing National Health Accounts (World Bank, WHO and USAID, 2003)
As has already been seen, some countries may decide to outsource production to agencies external to the “institutional home”—such as a national statistics bureau, universities, research entities, or national or international consultants, depending on where the required skills reside Meanwhile, several countries may decide to keep NHA production within the government agency responsible for NHA institutionalization, to ensure stronger own-ership of the process and to facilitate the uptake of insights produced by the data to inform policy In both of these instances, it would be important that the body that repre-sents the “institutional home” for NHA has a stake in the validation and quality assurance of the data
Internal and external modes of produc-tion with their potential strengths and chal-lenges will now be considered (summarized in Figure 2 5)
1. Internal productionInternal production simply means that pro-duction is done in-house (e g , within the MOH) rather than outsourced to another entity (e g , statistical department, school of

28 | Where Is the Money and What Are We Doing with It?
public health, research organization, national or international consultants, or think-tank)
In terms of strengths, internal production may allow for greater control over the production process, with greater ability to validate and review data There is likely to be easier access to the data input needed for production, as both the inputs and production processes are conducted in-house Analyses are more likely to reflect policies and priorities within the institutional “home” of the NHA Internal production (either within the MOH or via a multisectoral team which includes the MOH) allows for NHA to leverage linkages to other agencies or ministries within the same insti-tutional “home” This facilitates data produc-tion but also strengthens the NHA connec-tion to other data sources and instruments (e g , MTEF) Burkina Faso serves as an exam-ple where NHA data are used regularly in conjunction with household expenditure sur-veys and the Integrated Expenditure System (CID), which are also used for the MTEF and Marginal Budgeting for Bottlenecks (MBB) tools This ensures that the utility of tools like the NHA can be translated in ways that
“reach” policy makers, and creates greater buy-in and ownership by the MOF and other, finance-related entities, given the NHA links to broader budgeting and planning issues highlighted by the MTEF In this way, coun-tries may be able to realize cost efficiencies through synergies between NHA produc-tion and other data instruments and sources, and build on existing surveys Production in-house helps to ensure that results can be made available to institutions and individu-als who inform health policy Finally, internal production allows representatives from dif-ferent agencies within the MOH to contribute to the NHA and collaborate without major difficulties
In terms of potential challenges, an internal mode of production may result in less objectiv-ity in how data are produced and the assump-tions made in their analysis; this underscores the need for a standardized NHA method-ology Furthermore, in-house production—particularly where solely reliant on domestic budgets—also requires that the NHA com-pete with other items on the agenda for fund-ing Internal production may be more prone
Figure 2.5. two modes of production within the Four Governance model
1. MOH with little collaboration
2. MOH with multisectoral collaboration 3. Multisectoral team
4. Independent research agency
• NHA produced within the MOH
• NHA produced within Multisector team (MOH, university, MF, statistical office, etc.)
• NHA produced by Independent research agency produces • University• Research institute
• NHA produced within the MOH
• Production outsourced to an external agency (overseen by MOH)• Statistical
department• University• Research institute
• Production outsourced to an external agency (overseen by MOH)• Statistical
department• University• Research institute
• Production outsourced to an external agency (overseen by MOH)• Statistical department• University• Research institute
Internalmode ofproduction
External mode ofproduction
• “Institutional home” of the Model 1–3 can choose to either produce NHA by themselves or outsource the production to an external agency and oversee the production
• Countries that manage production well appear to produce where statistical and accounting expertise exist• Both modes of production require ownership by the “institutional home” to validate the NHA and ensure the link of the
NHA to their policy use

Governance Structures for NHA | 29
to bureaucratic bottlenecks, shifts in the insti-tutional and political climate, and so on This may result in high staff turnover, which is fre-quently found on the production team
Jordan is an example of a country that has dealt with this issue by forming a multisec-toral team within the “institutional home” The NHA data is produced by the core NHA Team within the High Health Council (HHC) comprised of about 25 stakeholders (includ-ing three individuals responsible for produc-tion) from government, the private sector, and academia To facilitate the exchange of infor-mation and provide a single, central location for quality assurance of the data, Jordan has also established a Centralized Data Collection Unit for NHA within the HHC Further, the country has mandated the routine production of the data and roles of relevant NHA stake-holders through a royal decree These arrange-ments have allowed Jordan to maintain the objectivity of data and high level of organiza-tional commitment to the NHA production
2. External productionExternal production (i e production outside the “institutional home”) conducted at a sta-tistical department, university or research entity is also possible Again, there are poten-tial strengths and challenges to this approach Countries such as Georgia, Japan, Korea, Mali, the Philippines, Rwanda, and Serbia are all examples of this outsourced model, albeit through different arrangements
As to the potential strengths, there may be greater objectivity in production if “out-sourced” to an independent agency—say, a school of public health or research entity This also ensures greater control over production processes by the external entity (i e with-out interference from government or a mul-tisectoral team) and clear responsibility for production Furthermore, there is a greater likelihood that political and institutional interference is minimized, so that work can
continue without significant upheaval (e g , staff turnover) resulting from political and institutional changes; an external agency may have a greater pool of human resources and production expertise that avoids interruption of routine production
It is also important to take note of potential challenges in outsourcing production First, without proper coordination, the outsourced production entity may have limited access to the data input that is needed for production
Further, in the absence of strong linkages between producers and users in an out-sourced production model, data may be less readily available to or accepted by institutions and individuals who design health policy Korea overcomes this challenge by leverag-ing strong networks between the NHA Focal Point and influencers of policy Production is outsourced to the team at Yonsei University (see Box 2 1), yet there is regular uptake of the data to inform policy debates given that the Focal Point who leads the production team has strong linkages to the Ministry of Health and Welfare and other high-level policy com-missions due to his previous work experi-ence at the Ministry and current advisory role The current Focal Point is a member of the Committee for Health Insurance Policy, the highest committee which determines the contribution rate and fee schedule in National Health Insurance—meaning that there is an opportunity for NHA results to be publicized and shared broadly by a well-informed audi-ence, and actively fed into the health policy making process 15 Along those lines, most countries would benefit from strong commu-nication and linkages between the production entities and government or other multisec-toral entities chosen to coordinate and make use of the data
15 Jeong Personal communication already re-ferred to

30 | Where Is the Money and What Are We Doing with It?
These general strengths and potential weak-nesses are context specific and will often vary depending on a country’s political, economic and social climate
2.4. Building an Enabling Environment to Support the Governance Structure
Country experiences suggest that building a legal and budgetary structure as an enabling environment that gives a clear mandate of the chosen governance model and facilitate the activities by the NHA team Without it, NHA teams often rely on personal relations and ad hoc requests to obtain information from other government departments, such as the comptroller general of accounts that man-ages data on audit government expenditures This makes timely production and translation of NHA data difficult
Two dimensions of the enabling environ-ment have been highlighted in country case studies:
• Stipulation of a budget line-item for NHA. This offers a clear mandate to ensure capacity for overseeing NHA activities by the entity that has been allo-cated responsibility as the “institutional home” A budget line should improve sustainability of these activities Several countries, such as Ghana, have developed a formal budget line but are still strug-gling to ensure that the allocated bud-get is disbursed In an era where country ownership of key dimensions of the NHA institutionalization process is core for long term sustainability of activities, it is important that governments honor their commitments to fund or partially fund recurring NHA activities Generally, by taking a stake in the financing of activi-ties they also generate higher demand for
Figure 2.6. modes of production compared (illustrative)
• Greater control over production processes• Easier access to data inputs needed for production• Can expect analyses to reflect policies and priorities within
the institutional “home” of NHA• If produced within government, can leverage linkages with
other formal processes (e.g. MTEF)• May be able to realize cost efficiencies through synergies
between NHA production and other data instruments/sources; build on existing surveys
• Results can be easily made available to institutions and people who make health policy
• Representatives from different agencies within the organization can contribute to NHA and collaborate without major difficulties
• Greater objectivity in production• Greater control over production processes• Clear responsibility over production• Greater likelihood that political and institutional
interference is minimized, so that work can continue without significant upheaval resulting from political and institutional changes (e.g. staff turnover due to promotions or transfers)
• May have existing and more in-depth skill sets in statistics and accounting
• May have limited access to data inputs needed for production
• Cannot leverage linkages with other agencies within the same institutional “home”
• May not be able to realize cost efficiencies through synergies between NHA production and other data instruments/sources; build on existing surveys
• Results may be less readily available to institutions and people who make health policy
• May have limited ability to collaborate with other agencies with different expertise or insights
• Less objectivity in production• More prone to bureaucratic bottlenecks• Greater likelihood that political and institutional
interference may impede production, resulting in high staff turnover
• May compete for funding with other internal agencies
1. Internal mode of production 2. External mode of production
Potential Strengths
Potential Challenges
Source: The World BankNote: “Internal” refers to within MOH. “External” refers to an entity within government but outside the MOH, or an entity outside government entirely.

Governance Structures for NHA | 31
the outputs, which in turn should facili-tate the linkages between data and policy-relevant insights
• Legislation of NHA activities. Several countries, such as Georgia and Jordan, mandate the routine production of NHA—including the collection of data inputs from public and private sources needed for NHA’s routine production, and the delineation of workplans and roles of relevant stakeholders This both clarifies the roles and responsibilities of stakehold-ers but also provides the selected “institu-tional home” with legitimacy in negotiat-ing for the data collection, translation and advocacy for policy use
Other factors that play part in shaping an enabling environment for NHA institution-alization include, for example, the human resources and data systems environments The need to strengthen these environmental factors over the long term is discussed in sec-tion 3 4
The governance model and its legitimacy will determine a country’s ability to bene-fit from the range of advantages that access to routinely produced NHA data can provide Careful attention should be given to the selec-tion of governance model and the enabling environment around it, taking into account a country’s particular context and socioeco-nomic reality In countries where NHA activ-ities are supported by development partners, the design of the governance model and the enabling environment should be a critical part of a long term plan to sustain and opti-mize use of the answers NHA can provide Country experiences provide several insights that can guide the selection of an appropri-ate governance model and production mode Here we discuss these insights in some depth
1 Countries can improve sustainabil-ity of NHA production by locating production where statistical and ac-
counting expertise resides. NHA re-quire a production team with the req-uisite skills in national statistics and accounting practices, knowledgeable about the nation’s health system and health policies, and with experience in working with data input and in-formation generated by different en-tities in the health system Ultimately, this requires a team that is quantita-tively oriented, with a willingness to question numbers and look for and consider alternatives to existing data sources This also entails having a Co-ordinating Body to act as a repository for the data In resource-constrained environments, many countries have strengthened their production capac-ity by locating technical production where the statistical and accounting skills exist For example, in the Phil-ippines NHA is currently produced by the National Statistical Coordina-tion Board (NSCB) that was created by a Presidential Executive Order in 1986 to serve as the highest statistical coordinating and policymaking body in the country 16 The expertise of the NSCB staff ensures that they can read-ily understand, analyze and release the data once it is received The NSCB also produces the National Income Ac-counts, placing NHA at the hub of the country’s statistical system and exper-tise (Racelis, 2008)
2 Regardless of the governance model and the mode of production of data, it is critical to ensure that the
16 NHA was initially produced in the early 1990s solely by academics at the University of the Philippines School of Economics (UPSE) The NSCB has been directly involved in the produc-tion process since 1995 and served as the institu-tional “home” of NHA since 1999; the NSCB has since undertaken a thorough review of the initial NHA methodology and parameters (Encarnacion, 2011)

32 | Where Is the Money and What Are We Doing with It?
“institutional home” feels sufficiently comfortable with the data to ensure an effective link to policy. Countries with strong ownership over the NHA process have greater capacity to link NHA data to insights that informs pol-icy For example, Turkey uses a shared governance model for NHA where one entity is responsible for data collection (the Turkish Statistical Institute), and another entity which provides tech-nical support and reviews the data (Turkish Ministry of Health-affiliated School of Public Health) Technical experts in both organizations subse-quently review, validate and analyze the NHA results Strong dissemination of results and information-sharing has facilitated the “translation” of insights from the data to inform policy On the other hand, several countries with external modes of production struggle to link NHA with policy priorities In Serbia, for example, NHA fall under the purview of the Republican Institute of Public Health (IOPHOS), com-missioned by the Ministry of Health (MOH) to produce NHA However, there is still limited awareness of NHA and their importance within govern-ment, particularly outside the MOH
3 Multisectoral involvement can im-prove access to and quality and trans-parency of data, and facilitate the up-take of data by policy makers. NHA production requires access to large volumes of data input from public, pri-vate, and external sources, analyzed through a standardized methodol-ogy Multisectoral involvement can fa-cilitate the collection of this input In Ghana, for example, the planning for NHA institutionalization takes place
within the realm of the MOH, with the support and guidance of a Techni-cal Consultative Group, which plays a critical role in accessing and validat-ing data Further, multisectoral in-volvement can enhance the transla-tion of NHA in a way that answers the policy questions of multiple users, draws attention to NHA from multi-ple stakeholders, improves data objec-tivity, and ultimately strengthens the linkage with policy making In Jor-dan, NHA is conducted by a 25-per-son team comprised of individuals from the public sector, private sector and academia This team receives an-nual “refresher” trainings on NHA; and weekly discussions among NHA team members are held to highlight the current state of NHA, new ap-proaches, next steps and key decisions Jordan’s two most recent NHA rounds were part of a broad effort to integrate activities to serve decision making, in-cluding through strengthening capac-ity building and dissemination
4 A supportive legal environment can facilitate NHA production and con-tribute to institutionalization. A strong legal foundation can ensure that data is routinely produced, and that there are regular funds to sup-port both production and dissemina-tion As mentioned, several countries, including Georgia and Jordan, have issued decrees mandating the routine production of NHA, along with a clear specification of the roles and respon-sibilities of the relevant NHA play-ers This, in turn, creates an environ-ment where there is strong political commitment to institutionalize health resource tracking efforts

33
Chapter 3
Building Capacity to Sustain NHA Activities
This Chapter considers approaches for building capacity to accelerate and sustain the NHA cycle It shows how the capacity building of individuals can target gaps in the NHA cycle It discusses efforts to build institutional capacity so as to protect countries from losing
production knowledge and skills, and to ensure countries are able to link NHA to their plan-ning processes Further, the chapter considers how an enabling environment for NHA can be nurtured in a country, including through strengthening the policy, data, and HR environ-ments Finally, the chapter emphasizes “learning-by-doing” as an effective approach for build-ing capacity
Key points are:
• The production, dissemination, and effective use of NHA depend on a skilled workforce equipped to produce work of high technical quality and empowered to coordinate the full NHA cycle
• Although capacity building in many countries has been focused on a few, key production staff, a comprehensive approach is critical to build capacity for the complete cycle of data production, dissemination, translation, and use
• The target of capacity building—that is, those capacities that need to be built and in which people—should be defined based on each country’s socioeconomic status, existing capacity, and ability to develop, attract, and retain the required workforce
• Countries can build their institutional knowledge and skills base by ensuring that the NHA process is standardized and well-documented, and by building tools to facilitate the process
• Building an institutional mechanism whereby decision makers regularly gain access to the insights that NHA data can provide would help bridge the gap between production and use
• Countries that have moved towards full ownership of the NHA cycle have often done so through an open book, “learning-by-doing” approach, either without external consultants or with a clear phasing out of external technical assistance—external consultants can be valuable to serve as a source of knowledge and to facilitate rather than implement the NHA process

34 | Where Is the Money and What Are We Doing with It?
3.1 Focused Capacity Building to Accelerate and Sustain the NHA Cycle
Production, dissemination, and effective use of NHA depend on access to a skilled work-force equipped to produce work of high tech-nical quality and who are empowered to effec-tively coordinate the links between the steps of the NHA cycle Capacity constraints are common, however, especially in health sys-tems where statisticians, health accountants, and health economists are scarce In addition, skilled workers are often fragmented between a range of competing priorities
Building of skills to lead NHA activities is not directly correlated to the number of NHA rounds which a country has undertaken In countries where NHA production has been funded by donors and conducted by exter-nal consultants with insufficient focus on the transfer of knowledge and skills to local staff, little ownership and thus little use has been made of the data at the country level There are several countries that have gone through multiple rounds of production yet still do not possess the institutional skills to produce a next round of NHA Rwanda, for example, struggled to build and retain the capacity to produce NHA and translate them into policy implications even after five NHA rounds; its production and translation were all driven externally by consultants and knowledge was lost with frequent turnover To deal with this, the country decided on a governance model where NHA are overseen by the MOH, with production outsourced to the National University of Rwanda School of Public Health The school pools statisti-cian and public health experts, yet with some support from external consultants The new staff members from the university are form-ing a group of experts working on the pro-duction of NHA which is set up in such a way that it will be able to help new staff to catch up
rapidly (Rajkotia et al, 2011) Georgia, on the other hand, is an example that shows that the building of skills during the early rounds of NHA is possible Its local NHA team learned the skills as they produced the country’s first NHA The team was able to produce its sec-ond NHA round with minimal support from external consultants, thanks to an explicit strategy to phase out external support after the first round of production
Building capacity beyond the individual stat-istician or health accountant requires an approach that addresses three factors: indi-vidual, institutional, and environmental (Figure 3 1):
• First, countries need skilled and respon-sible individuals to produce, disseminate, translate, and optimize the use of NHA
• Second, the knowledge and skills needed to run each step in the NHA cycle need to be held in the responsible institutions, which must retain knowledge and prepare for normal staff losses Having a robust system, with standardized processes and tools to collect data and use NHA for pol-icy, can improve and sustain the efficiency and effectiveness of the NHA cycle
• Third, broader contextual factors such as the policy, data, and human resources (HR) environment affect the efficiency and effectiveness of the NHA cycle Many aspects, such as an awareness of the accountability at the policy level and the robustness of health management infor-mation systems are not directly control-lable within the ambit of NHA activities, but understanding the country context will be important to ground a long-term capacity building strategy for the coun-try-specific NHA situation
The target of capacity building (i e whose and what capacity needs to be built) should be defined based on each country’s socio-economic status and existing capacity For
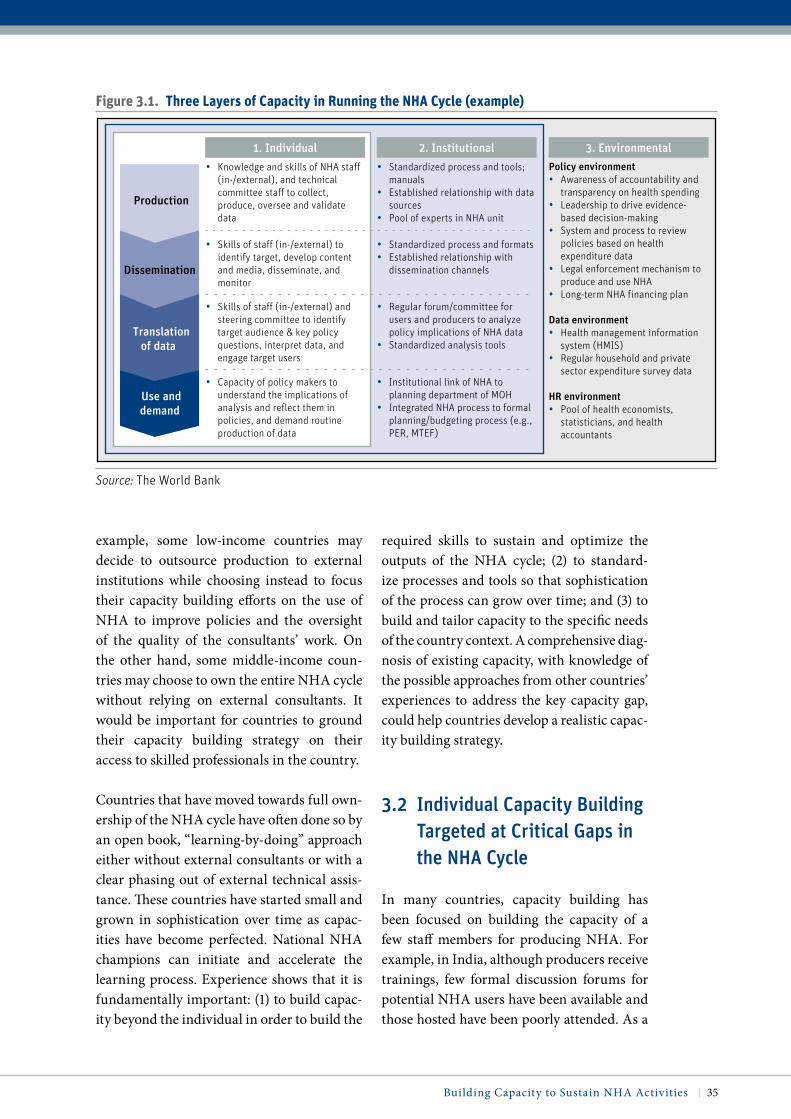
Building Capacity to Sustain NHA Activities | 35
example, some low-income countries may decide to outsource production to external institutions while choosing instead to focus their capacity building efforts on the use of NHA to improve policies and the oversight of the quality of the consultants’ work On the other hand, some middle-income coun-tries may choose to own the entire NHA cycle without relying on external consultants It would be important for countries to ground their capacity building strategy on their access to skilled professionals in the country
Countries that have moved towards full own-ership of the NHA cycle have often done so by an open book, “learning-by-doing” approach either without external consultants or with a clear phasing out of external technical assis-tance These countries have started small and grown in sophistication over time as capac-ities have become perfected National NHA champions can initiate and accelerate the learning process Experience shows that it is fundamentally important: (1) to build capac-ity beyond the individual in order to build the
required skills to sustain and optimize the outputs of the NHA cycle; (2) to standard-ize processes and tools so that sophistication of the process can grow over time; and (3) to build and tailor capacity to the specific needs of the country context A comprehensive diag-nosis of existing capacity, with knowledge of the possible approaches from other countries’ experiences to address the key capacity gap, could help countries develop a realistic capac-ity building strategy
3.2 individual Capacity Building Targeted at Critical Gaps in the NHA Cycle
In many countries, capacity building has been focused on building the capacity of a few staff members for producing NHA For example, in India, although producers receive trainings, few formal discussion forums for potential NHA users have been available and those hosted have been poorly attended As a
Figure 3.1. three Layers of capacity in running the nha cycle (example)
• Knowledge and skills of NHA staff (in-/external), and technical committee staff to collect, produce, oversee and validate data
• Standardized process and tools; manuals
• Established relationship with data sources
• Pool of experts in NHA unit
Policy environment• Awareness of accountability and
transparency on health spending• Leadership to drive evidence-
based decision-making• System and process to review
policies based on health expenditure data
• Legal enforcement mechanism to produce and use NHA
• Long-term NHA financing plan
Data environment• Health management information
system (HMIS)• Regular household and private
sector expenditure survey data
HR environment• Pool of health economists,
statisticians, and health accountants
• Skills of staff (in-/external) and steering committee to identify target audience & key policy questions, interpret data, and engage target users
• Regular forum/committee for users and producers to analyze policy implications of NHA data
• Standardized analysis tools
• Capacity of policy makers to understand the implications of analysis and reflect them in policies, and demand routine production of data
• Institutional link of NHA to planning department of MOH
• Integrated NHA process to formal planning/budgeting process (e.g., PER, MTEF)
• Skills of staff (in-/external) to identify target, develop content and media, disseminate, and monitor
• Standardized process and formats• Established relationship with
dissemination channels
1. Individual 2. Institutional 3. Environmental
Translationof data
Use anddemand
Dissemination
Production
Source: The World Bank

36 | Where Is the Money and What Are We Doing with It?
result, the link between NHA production and its potential input to broader health financing issues has not always been made NHA are, however, a complete cycle of data production, dissemination, translation, and use, and the capacity of key stakeholders at each step of NHA activities needs to be built comprehen-sively, especially since, as the Indian case sug-gests, a major capacity gap has been identified in many countries on the use side of NHA
Table 3 1 exemplifies the capacities needed to manage each step of the NHA cycle The pro-cess by which a country may prepare a tar-geted capacity building strategy includes defining: (1) those steps in the NHA cycle that need to be prioritized; (2) what capacity in the selected step needs to be addressed; (3) whose capacity needs to be built or leveraged; and (4) how it can be built
What capacity should be addressed and whose capacity should be built or leveraged
depend on the country’s ability to develop, attract, and retain the required workforce For instance, low-income countries may decide to rely on external consultants to pro-duce and disseminate NHA whilst focus-ing their resource on managing the links between the production of the accounts and their role as a tool to inform policy decisions at the country level The approach to capac-ity building is likely to change as countries’ economies grow Figure 3 2 suggests the var-ious capacities needed in the NHA cycle according to the socioeconomic status of dif-ferent countries More local resources can be leveraged as a country’s socioeconomic sta-tus improves
3.3 Building institutional Capacity
There are several critical steps that can be taken to strengthen a country’s institutional
Figure 3.2. examples of capacity Building Framework for nha by countries’ income Status (illustrative)
Area of potential use of domestic resources
• Oversee, facilitate connection to data sources, validate data
• Identify the most essential data for policy needs
• Collect data, produce NHA, oversee and validate data
• Identify essential data for policy needs
• Oversight provided by interna-tional consultant
• Collect data, produce NHA, oversee and validate data
• Higher complexity product to answer context-specific financing questions
• Set the target and oversee progress
• Identify target audience, develop content and media, disseminate and monitor the impact
• Identify target audience, develop content and media, disseminate and monitor the impact
Low-income countries Low-middle incomes Middle-income countries
Translationof data
Demandand use
Dissemination
Production
• Identify target and key policy questions, interpret analysis with the help from consultant
• Understand simple analysis to influence essential policies
• Identify target audience & key policy questions, interpret and analyze data
• Develop simple analysis with potential international support
• Identify target audience & key policy questions, interpret and analyze data
• Build sophisticated analysis to answer complex questions
• Understand implications of the analysis and reflect them in policies
• Understand implications of the analysis and reflect them in policies
• Understand the implications of analysis and reflect them in policies
• Capacity to provide oversight and guidance
• Capacity to use NHA for policy
• Capacity to manage the entire cycle with simple analysis and with limited international support
• Capacity to manage the entire cycle with sophisticated analysis without international support
Level of Country
Ownership
Source: The World Bank, based on country interviews
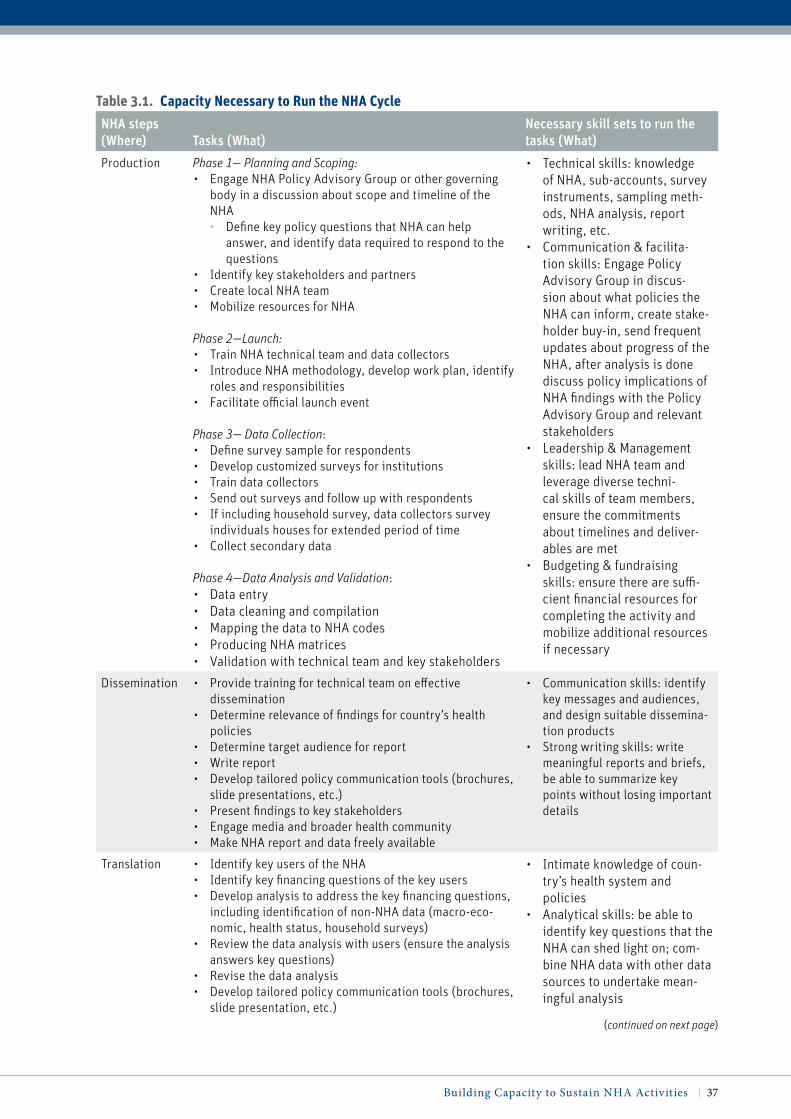
Building Capacity to Sustain NHA Activities | 37
table 3.1. capacity necessary to run the nha cycle
NHA steps (Where) Tasks (What)
Necessary skill sets to run the tasks (What)
Production Phase 1— Planning and Scoping:• Engage NHA Policy Advisory Group or other governing
body in a discussion about scope and timeline of the NHA• Define key policy questions that NHA can help
answer, and identify data required to respond to the questions
• Identify key stakeholders and partners• Create local NHA team• Mobilize resources for NHA
Phase 2—Launch:• Train NHA technical team and data collectors• Introduce NHA methodology, develop work plan, identify
roles and responsibilities• Facilitate official launch event
Phase 3— Data Collection:• Define survey sample for respondents• Develop customized surveys for institutions• Train data collectors• Send out surveys and follow up with respondents• If including household survey, data collectors survey
individuals houses for extended period of time• Collect secondary data
Phase 4—Data Analysis and Validation:• Data entry• Data cleaning and compilation• Mapping the data to NHA codes• Producing NHA matrices• Validation with technical team and key stakeholders
• Technical skills: knowledge of NHA, sub-accounts, survey instruments, sampling meth-ods, NHA analysis, report writing, etc.
• Communication & facilita-tion skills: Engage Policy Advisory Group in discus-sion about what policies the NHA can inform, create stake-holder buy-in, send frequent updates about progress of the NHA, after analysis is done discuss policy implications of NHA findings with the Policy Advisory Group and relevant stakeholders
• Leadership & Management skills: lead NHA team and leverage diverse techni-cal skills of team members, ensure the commitments about timelines and deliver-ables are met
• Budgeting & fundraising skills: ensure there are suffi-cient financial resources for completing the activity and mobilize additional resources if necessary
Dissemination • Provide training for technical team on effective dissemination
• Determine relevance of findings for country’s health policies
• Determine target audience for report• Write report• Develop tailored policy communication tools (brochures,
slide presentations, etc.)• Present findings to key stakeholders• Engage media and broader health community• Make NHA report and data freely available
• Communication skills: identify key messages and audiences, and design suitable dissemina-tion products
• Strong writing skills: write meaningful reports and briefs, be able to summarize key points without losing important details
Translation • Identify key users of the NHA• Identify key financing questions of the key users• Develop analysis to address the key financing questions,
including identification of non-NHA data (macro-eco-nomic, health status, household surveys)
• Review the data analysis with users (ensure the analysis answers key questions)
• Revise the data analysis• Develop tailored policy communication tools (brochures,
slide presentation, etc.)
• Intimate knowledge of coun-try’s health system and policies
• Analytical skills: be able to identify key questions that the NHA can shed light on; com-bine NHA data with other data sources to undertake mean-ingful analysis
(continued on next page)

38 | Where Is the Money and What Are We Doing with It?
(continued)
capacity, both to produce NHA data and to translate these into policy briefs
3.3.1 Strengthening Institutional Capacity for NHA Production
Skills, if only retained by a few individual pro-ducers of NHA, will deteriorate significantly with natural loss of individual staff For exam-ple, the number of staff in the NHA unit of the MOH in Malaysia decreased from eight to four due to promotions and transfers; as a result, most staff responsible for data management are temporary workers There is growing con-cern about maintaining knowledge and insti-tutional capacity within the unit, and detailed documentation is thus kept wherever possible
Different approaches, which countries can com-bine in their capacity building strategies, have been identified to protect countries from losing production knowledge and skills by strength-ening institutional capacity (Figure 3 3):
1 Countries can build their institutional knowledge and skill base by ensuring
that the NHA process is standardized and well-documented, and by build-ing tools to facilitate the process; this enables new staff to learn quickly and reduces the reliance on the knowl-edge of a few production staff In the Philippines, for example, a sim-ple NHA design has been developed, based mostly on routine data collec-tion, which makes NHA easy to pro-duce Data sources and procedures for estimation are documented in a man-ual and built into an estimation tool This allows the country to train new staff even at times when production staff members leave (Racelis, 2008) In Georgia, on the other hand, a spe-cial data management tool (DMT) software application was developed in 2005 to facilitate the production of NHA The DMT includes modules that contain classification codes for various categories of health expendi-ture to encode the input data, embed-ded formulas for calculating output
table 3.1. capacity necessary to run the nha cycle
NHA steps (Where) Tasks (What)
Necessary skill sets to run the tasks (What)
• Writing and communication skills: be able to disseminate findings from the analysis in impactful ways
• PR skills: Have strong rela-tionship with government and other stakeholders; seek audi-ence for relaying findings
Demand/Use • Government, partners and civil society organizations use NHA findings and NHA-based analysis to guide pol-icy-making, planning, and performance assessments
• The users of NHA in turn demand that NHA exercises be conducted on a routine basis
• Knowledge about NHA: Widespread awareness about NHA and the quantities that they measure
• Advocacy Skills: Stakeholders should be able to effectively demand that Ministries of Health produce NHAs as a mat-ter of routine
Sources: National Health Accounts Trainer Manual. PHRplus Project. June 2004; Personal Interviews: Lara Lorenzetti, Nirmala Ravishankar, Catherine Connor, Douglas Glandon, 2011

Building Capacity to Sustain NHA Activities | 39
estimates, and functions to gener-ate NHA tables These modules are linked together so that the NHA tables can be computed automatically, based on the data entered An output file is generated which is linked to other NHA files for data analysis The DMT enables the NHA team to easily pro-duce NHA, balance respective tables, and find errors in the output tables without deep accounting knowledge (Goginashvili and Turdzlandze, 2009)
The NHA Production Tool being developed by the Health Systems 20/20 Project also aims to strengthen a country’s institutional capacity to pro-duce NHA and translate the results into policy analyses by providing step-by-step guidance through many of the more technical aspects of the NHA estimation process, as well as a series of automated production and analysis tools For example, custom-ized coding and a pre-designed sur-vey built into the tool enable consis-tent and automated data production over multiple years Data can be auto-matically imported if they are entered
electronically, and easy-to-follow steps and information are also provided to assign codes to data for their auto-mated analyses The tool was pilot tested in Tanzania during the local team’s data analysis workshop and the final version is expected to be available in the autumn of 2011 17
2 Countries can often tap into their existing skills base and strengthen production by either outsourcing or partnering the production process As discussed in the previous chapter (Box 2 4) for example, the Ministry of Public Health (MOPH) in Thailand designated the International Health Policy Program (IHPP), a research arm of the Bureau of Health Policy and Strategy in the MOPH with auton-omous status, to host the NHA long-term and to be a national focal point based on its expertise, continuity, and full commitment The IHPP has a pool of approximately eighty statisticians,
17 See Chapter 4 and Appendix B4 for details of the Production Tool
Figure 3.3. approaches for Strengthening institutional capacity for nha productionExamples
• Philippines simplified and standardized the production process, and the data sources and estimation process are carefully documented in a manual
• Georgia uses the Data Management Tool (DMT) that contains classification codes and automatically computes NHA tables based on the input data
• Thailand’s MOPH designated its semi-independent research arm to be a focal point of NHA based on its NHA experiences and strong pool of experts in statistics/economics/public health
• Jordan formally brings in 25 stake-holders from different organization such as MOF, statistical department, and university to leverage their statistical and accounting skill base
Develop tools
Outsourcing
Partnering
Build standardized process/manuals
Buildknowledgeand skill base
Strengthen institutional capacity to produce NHA
Tap intoexisting skill base
Source: The World Bank, based on country interviews

40 | Where Is the Money and What Are We Doing with It?
economists, and public health experts, and it would be able to assign new staff members with expertise and provide coaching for them to catch up rela-tively quickly even when staff turnover occurs Thailand’s strategy to invest in the development of highly skilled technical experts with overseas expe-rience makes a unique contribution to building sustainable capacity to col-lect, produce, analyze and dissemi-nate data Whilst Thailand’s ability to invest in people may be far from the reality of many other countries, the approach it has taken to locate NHA production where statistical exper-tise exists offers a valuable lesson By contrast, Jordan sourced the neces-sary expertise internally from statis-tics, finance, accounting, and public health, by partnering with the vari-ous in-country organizations such as the statistical department, universi-ties, and the MOF The country built a formal multisectoral team of twenty-five staff members from different orga-nizations within the Health Council to facilitate access and validate the NHA tables This group, with its vast exper-tise, would be able to fill any resource gap relatively easily through coaching other staff members
3.3.2. Building Institutional Mechanisms to Link NHA to Planning Process
The capacity to understand and reflect on the implications of NHA analyses in policies is an essential capacity that countries have expressed the clear desire to own, regard-less of their socioeconomic status The link between production, translation, and use has, however, often been weak due to the lack of coordination and a limited awareness of the value that NHA can add to broader health financing issues Building an institutional mechanism whereby decision makers gain access to the insights that NHA data can pro-vide—sometimes in triangulation with other data instruments and tools—would help bridge the gap between production and use Countries can build institutional linkages between NHA and policy units by designat-ing ownership of the NHA in the MOH or in other organizations with strong connections to policy units Countries can also integrate NHA into the regular planning and budget-ing process such as PERs18 and the MTEF19
18 The World Bank’s core diagnostic tool prepared to help countries establish effective and transpar-ent mechanisms to allocate and use available pub-lic resources 19 A tool to encourage cooperation across minis-tries and planning over a longer horizon than the immediately upcoming fiscal year
Figure 3.4. approaches to Build institutional capacity for effective translation and Use of nhaExamples
• Philippines created health policy unit within the Department of Health to use NHA as an input to their policy research, planning/ targeting, and monitoring functions
• Rwanda harmonized the existing categories of the Joint Annual Work Plan (JAWP) and MTEF with NHA classifications, which makes NHA a fundamental tool to build and review the JAWP and MTEF
• Tanzania uses the Steering Committee for NHA which reviews all health expenditure-related analysis, and ensures the use of NHA along with other expenditure data
Build institutional linkage for NHA to policy units
Institutionalize the use of NHA
Integrate NHA into existing planning and budgeting process
Source: The World Bank, based on country interviews

Building Capacity to Sustain NHA Activities | 41
(Figure 3 4) Countries can combine these approaches in their institutional capacity building strategies to strengthen the transla-tion and use of NHA
To ensure perpetuation of information and evidence-based decision making for their Department of Health (DOH), the Philippines created the health policy unit of the Health Policy Development and Planning Bureau within the DOH It is mandated to use NHA for input to policy research, planning and tar-geting, and monitoring Formally locating NHA use within the policy unit of the DOH will facilitate regular application of the NHA to policy
Rwanda has also been making efforts to generate an institutional linkage between NHA and policy making In order to inte-grate their NHA into existing formal plan-ning and budgeting processes such as PERs and the MTEF, the country harmonized the existing categories of the Joint Annual Work Plan (JAWP) and MTEF with NHA classifi-cations This can make the NHA an essen-tial tool for annual and multi-year planning reviews (Rajkotia, 2011)
Tanzania,20 meanwhile, integrated their NHA analysis with other data and analy-ses on health expenditure The country man-dated the quality assurance of the NHA to the Steering Committee that oversees all infor-mation and analysis related to health spend-ing This will ensure NHA use as one of the key sources of information in the policy review on health spending
3.4 Creating an Enabling Environment for Effective Resource Tracking
As shown in Figure 3 1, the effective and effi-cient production, dissemination, translation,
and use of NHA hinge greatly on the pol-icy, data, and HR environment of a country Although many factors are beyond the scope of NHA work, the capacity building strategy for NHA and collaboration between coun-tries and development partners should be grounded in the differences in these environ-mental factors and their implications for the capacity of countries
Countries can benefit from addressing their NHA environmental factors For example, Georgia used legal measures and is improv-ing the data environment to make the NHA process robust and efficient The govern-ment issued a decree in 2006 that defines the information flow needed for producing NHA, the organizations that are responsible for providing data, and the terms and condi-tions for submitting the data This provides for successful institutionalization of multi-stakeholder data collection processes, and all the necessary data are covered by infor-mation from other agencies With support from USAID, Georgia is also strengthening its HMIS to improve data reliability As the data environment of the country improves, it is expected that the frequency of the HUES for NHA can be reduced from three to every five years, leading to a significant reduction of annual survey costs Legal measures to for-malize access to data from key stakeholders in the health system have also been deployed in Jordan The country issued a royal decree that mandates the routine production of the data, delineation of workloads and roles of relevant NHA stakeholders, and use of data to inform budgeting and planning for policy purposes
Building the HR environment for NHA could improve the quality of production, translation and NHA use in the long-term For example,
20 Ally, Mariam 2011 Personal Interview Head of Health Financing Unit, Ministry of Health and Social Welfare, Tanzania July 7

42 | Where Is the Money and What Are We Doing with It?
Ghana is considering designing an NHA mod-ule in the Masters Program of the School of Public Health at the University of Ghana; this is expected to broaden the HR base for NHA and strengthen the university’s research func-tions using NHA output Further, the capacity to produce and translate NHA into effective policy briefs should be discussed in a wider context of establishing countries’ capacity to conduct Health Policy and Systems Research The Biennial Review by Alliance emphasized that generating appropriate, trustworthy evidence depends on the existence of good research organizations (Alliance, 2007) The Review also concluded that capacity building strategies need to focus on the comprehen-sive needs of institutions, including overall skills and career development, development of leadership, governance and administrative systems, and strengthening networks among
the research community Addressing compre-hensive research capacities in the long-term, as done in Thailand, needs to be considered as an important component of a broader initia-tive for resource tracking and evidence-based policy making (Alliance, 2007)
There appears to be a growing consensus among countries that actively engage in NHA on the need for institutional approaches to improve uptake of NHA, by making advo-cacy less about the tool itself and more about the answers which NHA can help to provide Politically savvy personnel with strong com-munication skills provide useful skill sets to become NHA “champions” that can help “graduate” NHA beyond production, and can promote institutional approaches in a multi-stakeholder environment around pol-icy issues
Thai NHA were initiated by the MOPH, Health Planning Division, in 1994 and fully institutionalized by 2000. It was started by 12 researchers at the National Statistical Office (NSO), National Economic and Social Development Board (NESDB), MOPH, MOF, and academic institutes, which without any external expert advice used WHO publications in an “open-book-do-it-yourself” approach (Tangcharoensathien et al., 2008).
There was a discrepancy of 1.5 percent of GDP between the consumption data and the UN estimate in the first NHA round, which led to further investigation of data and estimation methodologies that helped the researchers build deeper knowledge of these techniques. This process also served to strengthen partnership with the NSO, which led to the amendment of the questionnaire for the Socio-Economic Survey so as to include a detailed breakdown of expenditure for ambulatory services and inpatient care in the NHA.
During Phase 2, with a strategic objective to closely engage the NESDB because it produced the health expen-diture data for NHA, the team involved the secretary general of the NESDB as chair of the Steering Committee. Also, in pursuit of the national focal point for NHA during Phase 3, the Deputy Permanent Secretary of the MOPH decided to designate the IHPP as host of the NHA on the ground of its expertise, continuity, and full commitment.
This case shows the step-by-step iterative evolution of NHA in terms of staff knowledge, data collection pro-cesses, and the involvement of key stakeholders. The country also carefully determined its institutional home based on expertise and past performance, which ensured there would be good institutional capacity to sustain the process.
The entire evolution of NHA has been driven by researchers from multiple organizations, motivated by the need for reliable expenditure estimates for health care functions, providers, and sources of financing. This case dem-onstrates how motivated champions can drive the evolution of NHA from within.
(Tangcharoensathien et al., 2008)
Box 3.1. “Learning-by-doing” approach in thailand

Building Capacity to Sustain NHA Activities | 43
3.5 “Learning-by-Doing” Approaches for Effective Long-Term Capacity Building
Country experiences indicate that capacity building for NHA is a highly iterative pro-cess that evolves at each step of the cycle: an NHA team discovers the data, learns the classification and calculations, gradu-ally partners with multiple organizations to streamline the data collection process, aligns existing surveys to the NHA format, adjusts methodologies to estimate consumption by examining data discrepancies, and includes high-level policy makers in a Policy Advisory Group The three layers of capacity—individ-ual, institutional, and environmental—are addressed at the same time during the itera-tive process The case of Thailand in Box 3 1 exemplifies this iterative process of “learn-ing-by-doing” as driven by local staff mem-bers A similar iterative process was observed in other countries such as Georgia, Kenya, Jordan, and Serbia
Some country cases suggest the potential role that external support can play to promote “learning-by-doing” For example, in Serbia two international consultants were an excel-lent source of support in guiding production by a team of two part-time economists and a head of the NHA unit at the initial round of the NHA cycle One consultant made a work plan for data collection together with the NHA team and Steering Committee He also provided considerable on-the-job training, showing his work and explaining how NHA
data could be collected and used for NHA production Instead of collecting and validat-ing the data himself, he then let the team col-lect and validate the data, while he served as a source of knowledge The other consultant made a work plan to revise the data acquired from the pilot activities and prepared a plan to fully implement NHA production This shows how external consultants can be valu-able to serve as a source of knowledge and to facilitate rather than implement the NHA process
A “learning-by-doing” approach appears to be initiated and promoted either through the efforts of individual “champions” from within the country (e g , Thailand), through effec-tive external facilitation, or a combination of both (e g , Serbia) It would thus be valuable to identify a potential champion of NHA as well as to plan and review external support from the point of view of capacity building
In conclusion, capacity building for NHA is a long-term, iterative process for individuals, institutions, and the country environment across the full cycle of NHA activities The target of capacity building and approaches to bridge capacity gaps are likely to differ, depending on the socioeconomic status of the country Developing a long-term strategy grounded on the specific country situation is critical to sustain NHA activities through the built capacity of skilled and empowered staff Finally, the role played by technical assistants should be carefully defined in the strategy to enhance rather than obstruct the “learning-by-doing” process


45
Financing Strategy for NHA
This chapter shows how a financing strategy can be crafted to ensure the long-term sus-tainability of NHA, taking cognizance of a country’s socioeconomic status and develop-ment path It then discusses the importance of rooting NHA in a country’s planning and
budgeting process, both to allocate sufficient resources for NHA and to help ensure they are used effectively The chapter also highlights ways to achieve cost savings—including integrat-ing the NHA data collection process with routine data management systems, simplifying and standardizing NHA processes and tools, and localizing production Finally, the chapter sets out the possible variations in a country’s NHA financing strategy, as determined by its eco-nomic status
Key points are:
• Past experience shows that, without a long-term financing strategy, countries face chal-lenges in sustaining NHA
• NHA in low- and middle-income countries have often been a donor driven, highly tech-nical, and expensive exercise To turn NHA into a user-friendly, practical, and sustainable tool, they need to be cost-efficient and integrated into existing data collection and national budgeting processes
• The cost of NHA tends to decrease with each subsequent round of NHA It is thus crucial to have a financing strategy in place that extends beyond the initial rounds of NHA produc-tion and aligns the shift in cost sharing between countries and development partners over the long-term
• Rooting NHA activities in countries’ planning and budgeting processes can ensure sus-tained financing of NHA
• On average more than 70 percent of the total average NHA cost is made up of survey, con-sultant, and staff costs, and these costs form a larger proportion of overall costs in early rounds This serves as an opportunity to capture cost efficiencies early • Approaches to reduce consulting costs include reducing the unit cost of consultants by
leveraging local and regional expertise, reducing workloads by minimizing and stan-dardizing the process, and building the capacity of local staff
Chapter 4

46 | Where Is the Money and What Are We Doing with It?
• By investing upfront in integrating the data collection process into the exist-ing data collection system, countries can benefit from cost savings every year after the initial rounds This is particularly true of surveys to esti-mate private (household) spending on health
4.1 A Sustainable Financing Strategy in Tune with a Country’s Socioeconomic Status
Among the main challenges in sustaining NHA activities are both short- and long-term financing of the household surveys, staff, and the costs of keeping an office run-ning Past experiences show that without a long-term financing strategy, countries face challenges in sustaining NHA cycles In sev-eral countries, donors have funded techni-cal assistance for a few rounds of NHA pro-duction without a clear collective financing strategy to sustain activities, and the cycle did not continue after the one to two fully-financed rounds In contrast, countries such as the Philippines, Thailand, and Jordan have moved toward self-funding by standardiz-ing the NHA process, building capacity, and integrating the NHA cycle into existing data collection and budgeting processes through years of “learning-by-doing”
NHA in low- and middle-income countries have often been a donor-driven, highly tech-nical, and expensive exercise In order to turn them into a user-friendly, practical, and sus-tainable tool that feeds into countries’ needs, they need to be cost-efficient and integrated into existing data collection and national budgeting processes Whilst it is important for a country to co-finance the activity for the sake of owning the output, the level of (co)-financing needs to be based on its specific resource situation
4.2 Benefits of a Long-Term Financing Strategy
4.2.1 A long-term Financing Strategy Can Facilitate Transition to Lower Costs
The total cost of financing NHA decreases as countries experience more rounds and build capacity The World Bank conducted a sur-vey on the costs on NHA in 2010 (The World Bank, 2010) Of fifty-nine countries respond-ing to the survey, thirty-two countries pro-vided their cost breakdown Of those, seven are OECD countries, seventeen are middle-income countries,21 and eight are low-income countries These respondents reported their total costs of production and dissemination for their latest rounds of NHA; their figures often exclude the costs of international consul-tants as recipient countries often have limited transparency on the total cost of the technical assistance that they may be receiving Based on the responses reported by the twenty-five low- and middle-income countries, the aver-age total cost for NHA production and dis-semination for countries that experienced NHA more than five times is 53 percent lower than the cost for the countries that have expe-rienced one to two rounds These data indicate that costs can be reduced over time with more NHA experience notwithstanding the limited size of the sample and the fact that countries do not fully capture international consulting costs Cost saving opportunities may be even more dramatic if the high spend on interna-tional consultants is reduced already in the initial rounds of the NHA cycle
According to the same survey results, the average operating22 and investment23 cost
21 Including upper- and lower-middle-income countries22 For staff, office, travel, dissemination, and other costs23 For consultants, training, and IT

Financing Strategy for NHA | 47
for countries with more than five rounds of NHA experience tends to decrease to about one third of the costs of those with only one to two rounds of experience, as countries build skills and standardize the process and tools Savings on household and other sur-vey costs appear to be achieved more slowly, however: the average total survey cost for countries with more than five NHA rounds is only 23 percent smaller than the average survey cost for countries with one to two rounds of experience In contrast, none of the seven OECD countries who responded to the World Bank’s survey reported any survey cost because all NHA data come from routinely collected financial data and no marginal cost is required Non-OECD countries that use existing routine data collection systems to produce NHA such as Vietnam, Thailand, and China also reported very low survey cost
Overall, the cost of NHA tends to decrease significantly with experience It would be crucial for countries and development part-ners to have a financing strategy that extends beyond the initial rounds and aligns cost-sharing between development partners and countries long-term to support this cost tran-sition process effectively
The World Bank conducted another sur-vey in April 2011 which looked at the opti-mal duration of donor support for success-ful institutionalization of NHA A majority of the twenty-one countries that responded to this survey thought that a five-year timeline for donor support would be required for this purpose (Figure 4 1) (The World Bank, 2011) The importance of having a long-term financ-ing strategy is backed up by several country examples In Madagascar and Mongolia, for instance, donor financing supported the pro-duction of the first round of the NHA but with no financing strategy in place for the future; as a result, these countries struggled to maintain the NHA cycle
The pace of the cost transition and the need for financing support will vary depending on the country’s socioeconomic status and access to resources Low-income countries tend to need external consulting support across the NHA cycle, due to the shortage of human resources, and might need to conduct expen-sive household surveys to complete the NHA tables given the lack of reliable data systems The variations in financing strategies between countries of different resource levels will be further discussed in the following sections
Figure 4.1. optimum duration of Support from development partners (n = 21)
Num
ber
of r
espo
nses
(U
nit)
0
2
4
6
8
10
12
14
3 years 5 years 9–10 years 6–8 years more than10 years
• The majority of respondents believe that it takes 5 years to make recurrent costs and activities for NHA sustainable without donor support
• This suggests that an NHA institutionalization plan should cover and budget 5 years ahead
Q: For your country to put in place effective and sustainable capacity for the production, dissemination, analysis, and use of health accounts, what time commitment and support would you expect from donors and development partners?
4
12
2 2
0
Source: The World Bank’s survey on financing of health accounting, 2011

48 | Where Is the Money and What Are We Doing with It?
4.2.2 Rooting NHA Activities in the Country’s Planning and Budgeting Process could Ensure Effective Use and Unlock National Funds for NHA
An effective approach to secure funding is to integrate the NHA process as a part of a coun-try’s regular budgeting process For example, Rwanda is moving towards the integration of NHA into the formal national resource plan-ning exercise in which the government and SWAP partners jointly plan sector expendi-tures (Rajkotia et al, 2011) Thailand uses NHA data in conjunction with hospital adminis-trative data to estimate health expenditures for curative and preventive care It also used NHA to inform MTEF for the health sector in the 10th National Economic and Social Development Plan 24 In the Philippines also, the Health Policy Development and Planning Bureau within the Department of Health uses NHA along with a wide range of other health-related data as input to their policy research, planning, and monitoring functions, and a law requires the production of NHA every year (Racelis, 2008) These approaches ensure the routine use of NHA as a formal tool for analysis, and unlock national funds for the NHA exercise
4.3 Capturing Cost Efficiencies for NHA
4.3.1 Opportunities for Capturing Cost Efficiencies Reside in the Early Rounds of the NHA Cycle
Capturing cost efficiencies is critical to increase financial sustainability of NHA Figure 4 2, based on the 2010 World Bank survey on costs of health accounting, shows that on average more than 70 percent of the total, average NHA cost is made up of survey, consultant, and staff costs (The World Bank, 2010) This percentage will even be higher if the costs of international consultants that are not fully captured in the survey are included Since it is vital for a country to build and sus-tain human capacity, cost-saving opportuni-ties should be sought primarily on survey and consulting costs and not on staff costs The survey data suggest that the survey and con-sulting costs form a larger proportion of costs at the early rounds of the NHA cycle, and that
Figure 4.2. average cost composition (%) for nhaAverage cost composition for NHA
• The top 3 cost items, survey cost, consulting cost, and staff cost account for 71% of the total NHA costs
• Survey cost (35%) is the largest cost driver
• Consulting and survey cost would be even higher if full costs for international consultants would be captured
Staff cost 18%
Consultant cost 18%
Office cost 3%
IT cost 4%
Travel cost 4%Training cost 6%
Survey cost 35%
Dissemination cost 7%
Other cost 5%
Source: The World Bank Survey on costs of health accounting, 2010Note: Costing is based on reports from responding countries, who often have little overview of the full costs of international technical assistance
24 Tangcharoensathien, Viroj, and Walaiporn Patcharanarumol 2011 Personal Interview Senior Advisor and Senior Researcher, IHPP, MOPH, Thailand June 22

Financing Strategy for NHA | 49
there is also a significantly larger variation in cost at the early rounds of NHA among coun-tries with the same rounds of experiences Assuming the adequate quality of NHA data produced in these countries, this would imply that the opportunity to capture cost efficien-cies in survey and consulting costs reside in the early rounds of NHA, and that bench-marking best cost-efficient practices can reduce the NHA cost up front
4.3.2 Costs Can be Saved by Integrating NHA Data Collection Process to Routine Data Management Systems
Many countries need a household survey to complete NHA, due to the lack of access to household health expenditure data or their poor quality This makes the survey cost the largest cost item across different rounds of NHA For example, Georgia conducts HUES to supplement the existing household survey by the State Department of Statistics (SDS) This survey costs account for 77 percent of the total NHA cost of the country 25
As summarized in Figure 4 3, country experi-ences indicate that survey costs for NHA can be saved through: (1) reducing the number of
surveys by integrating data collection process into existing data management systems; and (2) reducing the cost of a survey by simplify-ing it and standardizing its process and tools
Integrate the NHA data collection process into existing data systemFirst, countries can reduce or avoid the sur-vey cost for NHA by integrating data col-lection into existing survey or data systems, where these exist, and use alternative esti-mation methodologies that leverage existing data Estimation of household out-of-pocket expenditures (OOP) is frequently the most complex activity to estimate health expendi-tures Furthermore, they often pose a large cost burden on overall NHA activities The problems of reporting bias in large-scale sur-veys such as household surveys and for-profit private providers’ surveys are well docu-mented and studied To avoid this, countries can use alternative methods for estimating household OOP that integrate and triangu-late multiple data sources Countries such as
Figure 4.3. cost Saving approaches in nha Survey costExamples
• Georgia is improving its HMIS, and trying to conduct the household expenditure survey every 3 instead of 5 years
• Thailand, Rwanda, and India changed the questionnaire and classifications of house-hold surveys to integrate data collection for NHA into existing surveys
• Minimizing the survey questions to essential data to build key analyses/ tables reduces the cost of interview and compilation per household
• NHA Production Tool by Health Systems 20/20 can reduce the data collection and compilation cost for a household survey through automation
Simplify the survey
Optimize the frequency of NHA survey
Integrate NHA into existing surveys and data system
Automate a part of the survey process
Reduce the number of surveys for NHA
Reduce survey cost for NHA
Reduce the cost per survey for NHA
1
2
Source: The World Bank, based on country interviews.
25 Goginashvili, Ketevan 2011 Personal Interview Chief Specialist, Health Policy Division of Health Care Department, Ministry of Labor, Health, and Social Affairs of Georgia July 20

50 | Where Is the Money and What Are We Doing with It?
the USA, Australia, Malaysia, Sri Lanka and Bangladesh have been able to generate reli-able estimates of the level, trend and composi-tion of household OOP without using house-hold survey data (Box 2 1) Also, as discussed in the previous chapter, the government of Georgia issued a decree that defines the infor-mation flow and responsible organizations for producing NHA, institutionalizing the multi-stakeholder data-collection process With support from USAID, the country is strengthening the HMIS to improve data reli-ability, which is expected to reduce the fre-quency of health expenditure surveys thereby reducing the survey cost by 40 percent 26
Further, several countries have revised their questionnaire and classification of exist-ing household surveys, adding a module to the survey to satisfy the data needs of NHA, thereby saving the entire survey cost for NHA (Figure 4 3) Research for Health Systems 20/20 estimated that a free-standing house-hold health expenditure survey for an NHA estimation can cost up to US$ 1,000,000
(Carlson and Glandon, 2009) It is also esti-mated that the cost for a free-standing, dis-ease-specific survey to review expenditures in health areas like HIV/AIDS and malaria for NHA sub-accounts can reach US$ 200,000–500,000 (Carlson and Glandon, 2009) On the other hand, adding a few questions to an existing survey to collect the same informa-tion for an NHA estimation adds less than a minute to the interviewing time for many of household members, which adds only about a few thousand dollars (Carlson and Glandon, 2009) These data show that the integration of NHA data collection into existing surveys can significantly improve the financial sus-tainability of NHA
However, adding expenditure related ques-tions to existing surveys, such as the Demographic and Health Survey (DHS), needs to be designed and tested carefully
Current best practice methods for estimating household out-of-pocket spending involve integrating and trian-gulating multiple data sources to estimate household spending, many of which are related to the production or provider side resort (Examples of the latter include industry data on pharmacy sales, surveys and admin-istrative reports from private hospitals. In countries such as the USA, Australia, Malaysia, Sri Lanka and Bangladesh, these are sufficient to generate reliable estimates of the level, trend and composition (by func-tions) of household out-of-pocket spending. However, in areas where expenditures occur at non-institutional or informal providers, household survey data may represent the last resort (Rannan-Eliya et al, 2010).
Countries that have used this estimation approach and leveraged existing and routine data sources have made significant savings on the overall costs of NHA activities (ADB, 2008). For example, in recent updates of NHA in several of the Pacific Island countries that share the challenge of limited data sources, new household surveys were not commissioned for NHA estimations. Instead, existing household budget and new provider surveys were employed. In the wider Asia-Pacific region, none of the developed or developing countries with annually updated NHA estimates depend on household surveys commissioned for NHA purposes, although all have used existing national household survey data to some extent.
However, the continuing reliance on household surveys to estimate household spending may reflect the diffi-culty that many NHA agencies have in recruiting and retaining personnel with research skills. The triangulation and adjustment of survey data with other data sources is less costly than conducting a new household survey, but requires the capacity to assess and manipulate statistics. Countries can benefit from capacity building sup-ports on the alternative methods through experts and regional networks.
Box 4.1. estimating out-of-pocket payments without household Surveys
26 Goginashvili Personal interview already re-ferred to

Financing Strategy for NHA | 51
First, even if the additional questions for NHA will not be a significant burden for many respondents, it is necessary to carefully avoid interviewee and interviewer fatigue due to adding further complexity to existing large-volume surveys, and to ensure that the quality of overall survey responses is main-tained Further, integrating an NHA module into existing surveys can require more train-ing and monitoring It would be crucial to examine these potential negative impacts of the integration and minimize them through, for example, limiting the additional module for NHA to essential questions that directly help policy decisions, and through optimiz-ing the sample size for the additional module for NHA to the minimum level required to inform national-level NHA estimates 27
In Thailand, the NHA team built a strong partnership with National Statistical Office (NSO), and the NSO amended their Socio-Economic Survey (SES) questionnaire to break down the household expenditure into ambulatory services, that are provided by public and private providers, and inpatient services in public and private hospitals As a result of these modifications, household expenditure in the NHA rely solely on the routine SES By integrating NHA data sources into existing data sources, the NHA team has been able to reduce the entire survey cost for the last round of NHA to just US$ 1,538 per year28 (Tangcharoensathien et al, 2008)
Rwanda is also exploring ways to streamline data collection processes to achieve cost-effi-ciency For example, the country has inte-grated NHA and National AIDS Spending Assessment (NASA) analyses by identifying the primary sources of data needed going for-ward In this way, analyses can be done annu-ally rather than every five years To streamline the collection of household data and mini-mize costs, household surveys which used to be the largest cost drivers of NHA for Rwanda have been integrated as part of major surveys
including the DHS and the Household Living Conditions Survey (EICV) by aligning the questionnaires with NHA Also, interme-diate surveys on non-household expendi-tures will be conducted routinely every two to three years As a result, more than 80 percent of data for NHA can be sourced from routine data collection processes This will signifi-cantly reduce their NHA survey costs, which typically range from US$200,000–$500,000 (Rajkotia et al, 2011)
Carlson and Glandon in Health Systems 20/20 proposed sets of questions that coun-tries can add to their regular, nationally-rep-resentative household surveys such as the DHS, the Living Standards Measurement Study (LSMS), and the World Health Survey (WHS) These questions are selected based on four criteria: 1) tested; 2) pertinent to health policy; 3) will inform NHA; and 4) mini-mize the additional financial and labor costs associated with data collection (Carlson and Glandon, 2009) The proposed questions that can be added to regular household surveys are presented in Appendix B7 An evalua-tion of the feasibility and impact of integrat-ing these questions into the DHS has been tested through a stand-alone pilot DHS sur-vey in Egypt and is being analyzed as a result of integration into the Rwanda 2010 DHS 29
Modifying the government accounting sys-tem can also reduce the need for additional surveys In India during 2004/05, based on insights from the ongoing NHA pro-cess, the government introduced a line item
27 Adetunji, Jacob and Maniscalco, Lisa, 2011 Personal interview Contracting Officer’s Technical Representative (COTR), Technical Advisor USAID, September 7 28 Patcharanarumol, Walaiporn, 2011 Personal interview Senior Researcher, IHPP, MOPH, Thailand and Technical Officer, Department of Health System Financing, WHO August 15 29 Adetunji, Jacob and Maniscalco, Lisa, 2011 Personal interview already referred to

52 | Where Is the Money and What Are We Doing with It?
classification for “Medical Treatment” in its accounting system to capture the expen-diture incurred by the government on the health of its employees Before this was intro-duced, the expenditure on employees’ health had been captured under “salaries”, and it required an additional survey on the payment and accounting offices to estimate the gov-ernment spending on its employees’ health This survey cost was thus saved by the intro-duction of a sub-category in the expenditure classification 30
Simplify survey and standardize process and toolsSecond, countries can reduce the cost of a sur-vey by simplifying the survey and standardiz-ing and automating the survey process One approach is to limit the survey questions to obtain information that offer essential infor-mation for policy makers Complicated ques-tionnaires will incur additional cost in inter-viewing households and compiling results as well as for modifying an increase in errors Especially in low-income countries with resource constraints where additional surveys would be needed, simplifying the survey to create essential NHA tables based on policy needs could maximize the cost effectiveness
Another approach is to use standardized and automated tools that facilitate data col-lection and compilation and reduce the re-work to deal with errors In Tanzania, the National Health Accounts Production Tool developed by USAID-funded Health System 20/20 is being tested (see Appendix B 4) The Production Tool uses electronic ques-tionnaires that are automatically generated for data providers It also imports responses directly to the database electronically Built-in validation and easy-to-follow steps to assign codes to data with automated dou-ble-counting check functions are expected to facilitate the compilation and validation of data and make it possible for a trained local team leader to administer the process It also
automatically produces the NHA tables and visualizes the flow of funds, which can save time for costly international consultants to double-check data It is expected that the Production Tool can save the cost for survey and consulting at the initial stages of NHA by US$ 58,000–79,000 (rough estimation to be tested) (Figure 4 4) 31
It should be noted that the long-term reduc-tion of survey costs through integration into regular data collection processes may require considerable upfront consulting and staff costs that entail identifying existing data sources, validating data reliability, proposing changes in the regular data collection pro-cess, and negotiating with stakeholders Once the integration is complete, however, signif-icant cost savings can be made, as repeated household surveys in each subsequent round of NHA are expensive It should be noted that whilst upfront investments may be high, experience shows that similar capital invest-ments have been made just in NHA produc-tion without considering long-term efficien-cies The sooner countries can integrate their data, the more years of cost saving will follow
4.3.3 Localizing and Standardizing Production and Analysis can Save International Consultant Costs
There are two kinds of consulting cost: the direct cost of consultants as a large cost item; and, if inappropriately designed to support long-term sustainability, the indirect cost of insufficient transfer of knowledge and skills to manage the NHA cycle, which is discussed in the previous chapter
Experiences suggest that countries and their development partners can consider combin-
30 Nagpal Personal interview already referred to 31 Douglas Glandon and Lara Lorenzetti 2011 Personal Interview Senior Analyst and Associate Analyst of Abt Associates July 20

Financing Strategy for NHA | 53
ing three approaches to reduce the direct consulting cost (Figure 4 5): (1) reduce unit cost of consultants by leveraging local and regional expertise; (2) reduce workloads by minimizing and standardizing the process; and (3) utilize and build the capacity of local staff
Leverage regional and local expertiseCountries can capture cost efficiency by leveraging regional and local experts where possible while avoiding the use of interna-tional consultants The current unit cost for a regional consultant in the Euro-Asia net-work is about US$ 300 per day In the former Soviet Union countries, for example, trained regional consultants can often also help the country more efficiently; they are familiar with statistics and data systems specific to
the former Soviet Union countries, and can quickly identify where to collect specific data to fill the gaps They also speak the local lan-guage, which enables them to work effectively with NHA staff, other local stakeholders, and local consultants For example, in Uzbekistan a regional consultant worked closely with the leader of a local working group effectively helping her to identify options for efficient data collection, and they were able to com-municate in the local language 33
Figure 4.4. expected cost Saving through nha production tool by health Systems 20/20 (rough estimate)
• Local team adds customized codes in different format
• Can cause inconsistency in multi-year spending analysis
• Survey designed by local team
• Data technicians manually build data entry screen/collect/enter the data into Excel
• Requires follow-up for data entry errors
• Assign codes, split expenditures, and weigh response manually (highly technical work without instruction)
• Complicated manual weighting• Manual search for double-
counting and errors• No consistent way to validate data
• No template to present data
Total US $~58,400 – $78,900 estimated cost savings* every year
Customize NHA codes and develop surveys
Collect, enter and clean
data
Map and analyze
data
Adjust and auditdata
Validate and present
data
• Customized coding built into the tool, enabling its consistent and automated use over years
• Pre-designed survey with electronic survey response
• Automatic data entry from electronic responses
• Built-in validation function prevents extreme numbers
• Easy-to-follow steps and information are provided to assign codes
• Mapping for subaccounts integrated to streamline analysis
• Simple weighting process with automated formula
• Automated double-counting check feature highlights overlaps
• Automated production of NHA tables
• Interactive flow diagram allows easy review of data
• Workshop cost for training and to build survey ($~1,500)
• Cost savings in building codes and surveys ($~2,750)
• Mailing, collection, entry and validation saving ($~13,900)
• Savings from workshop costs ($~4,000)
• Significant reduction of data analysis training ($16,000–31,000)
• Savings from workshop costs ($4,000-6,000)
• Reduced work with automated functions ($8,250–11,250)
• Savings from workshop costs($500-1,000)
• Reduced work in generating charts and reports ($~5,000)
• Savings from report writing workshops ($~2,500)
Preliminary
From: Traditional approach Potential cost savingTo: NHA production tool
Sources: Lara Lorenzetti, Nirmala Ravishankar, Catherine Connor, Douglas Glandon, 2011.32
32 Lara Lorenzetti, Nirmala Ravishankar, Cath-erine Connor, Douglas Glandon, 2011 Personal Interviews Senior Analyst and Associate Analyst of Abt Associates July 2033 Markova, Nora 2011 Personal Interview Health Expenditure and Financing Analyst, WHO Bar-celona Office for Health Systems Strengthening August 2

54 | Where Is the Money and What Are We Doing with It?
Standardize and minimize processStandardizing the process of data collection and analysis reduces the transaction cost thus decreasing the workload of consultants The example of the Philippines in Chapter 3, where the country standardized and doc-umented its estimation procedure and data sources in a manual and in an estimation tool, not only reduced the consulting work-load but also made it possible for new staff to learn the process without the help of exter-nal consultant (Racelis, 2008) Also, the NHA Production Tool developed by the Health System 20/20 in the previous section is a good example of reducing the consulting workload by simplifying and minimizing the process through an IT tool
Build staff capacityBuilding of local staff capacity can also reduce the consultant cost by increasing their ability to do more without support As discussed in Chapter 3, several countries have leveraged existing statistical capacity within different government entities, and built their capacity to produce and ana-
lyze NHA through a “learning-by-doing” approach
In the Philippines, staff at the NSCB with sta-tistical expertise and trained health econ-omists saved consulting hours NSCB staff members readily understand the NHA approaches, especially when viewed as a com-ponent of existing National Income Accounts They are also already familiar with many of the data sources for the NHA, facilitating data collection and compilation As a result, the Philippines did not need to rely heavily on international consultants across the NHA cycle (Racelis, 2008)
In Georgia, while building the standardized process, tools, and manuals for data collection and analysis, consultants effectively helped a member of NHA staff and a local consultant to produce the first NHA themselves through “learning-by-doing” This limited the role of international consultants to light, remote support rather than on-site production and analysis of the NHA; this saved consulting and travel cost from the second round As a
Figure 4.5. approaches to save direct consulting cost for nhaExamples
• Belarus uses local consultants combined with regional experts for cost-efficiency
• Euro-Asia Network has two experienced experts who know local statistical system and speak local language
• Automated data compilation and analysis tool being tested in Tanzania
• Georgia defined information flow from stakeholders by decree
• Philippines leveraged skilled statistical office staff for NHA production
• In Georgia consultants adopted learning-by-doing approach and build staff skills
Leverage local consultants
Leverage regional consultants
Minimize process through tools
Standardize process to speed up
Reduce unit cost of consultants (Price)
Reduce consulting cost
Reduce workloads (Quantity)
1
2
Use skilled staff
Build capacity of existing staff
Replace consultants by staff (Ratio)
3
Source: The World Bank, based on country interviews.

Financing Strategy for NHA | 55
consequence, Georgia maintains a relatively low consulting cost of about US$ 12,000 just to hire a local consultant34 (The World Bank Survey on costs of health accounting, 2010)
As illustrated in Figure 4 6, then, by investing upfront in developing the data collection pro-cess in such a way that it is integrated into the existing data collection system and building the capacity to produce NHA with minimum support from external consultants, countries can benefit from cost savings every year after the initial rounds The strategy to capture cost efficiency should be based on the spe-cific resource context of respective countries, which will be elaborated in the next section
4.4 Aligning Countries’ Financial Ownership
The socioeconomic status of a country should affect its financing of NHA and cost saving approaches Figure 4 7 summariz-es different approaches for low-income,
lower-middle-income, and middle-income countries Low-income countries, for in-stance, may need external financing across the NHA cycle, and they might need to con-duct household surveys to supplement insuf-ficient data infrastructure A realistic financ-ing approach for them may be to seek partial cost-sharing of recurrent and dissemination costs, and to limit survey complexity to essen-tial data for policy makers Even in this sit-uation, it should be possible to reduce con-sulting costs over time by standardizing the process and ensuring the necessary financing for effective use of NHA by integrating them as tools for formal budgeting processes
As the human and financial resources of a country improve, however, it can reduce reli-ance on external finance and save survey and consulting costs by fully integrating the NHA data collection process into the existing data system and by building local capacity It is
Figure 4.6. conceptual illustration of Upfront cost-Saving model (sample)
• Initially consultant-driven production of NHA•Continuous support by external consultants
• Dedicated household survey for NHA continues
• Gradual cost saving in investment and operating cost
• Upfront investment in data integration and capacity building
• Upfront saving of survey cost• Gradually reduced support by
external consultants and increased use of local consultants
• Upfront and continuous cost saving of all cost items
From: Traditional model
To: Upfront cost-saving model
A cost saving model should be designed based on country’s context such as existing staff capacity, data infrastructure, and regular availability of household expenditure data
Rounds
Operating costInvestment cost Survey cost
1 2 3 4 5 6 7
Focus on producing NHA
Survey cost remains the largestContinuous support by external consultants required
Early and continuous cost saving in survey and consulting cost
Focus on data integration and capacity building
Source: The World Bank.
34 Goginashvili Personal interview already referred to

56 | Where Is the Money and What Are We Doing with It?
important for countries and development partners to align financial ownership of the NHA process with shifts in income status over time, from the perspective of long-term, collective planning
Driving the NHA cycle requires upfront investment and long-term financing of recur-rent cost However, as discussed in Chapter 1, NHA can provide considerable value-add to countries, and potentially improve their bot-tom-line Turkey, as shown in Box 1 2 as an example, increased its total health expendi-ture using NHA as a monitoring tool, and through NHA analyses identified a signifi-cant cost-saving (38%) opportunity in respect of government’s health spending Despite these benefits, the cost of NHA is fairly small, especially with cost saving efforts introduced
in this chapter For example, as introduced in Chapter 1, the cost for the latest round of production and dissemination of NHA in Burkina Faso and Thailand represent 0 02% and 0 0006% of the respective governments’ spend on health 35 This suggests that investing in NHA activities is a cost-effective “smart” investment for developing countries seek-ing to make better use of how every dollar is spent
Figure 4.7. examples of Financing Framework for nha by countries’ income Status (illustrative)
Area of potential country ownership
• Partial cost sharing of recurrent costs by country
• Consultants/survey financed by donors for medium term
• Often full survey cost needed
• Partial cost sharing of recurrent costs by country
• Investment/survey financed by donors for medium term
• Surveycost reduced through integration to existing source
• Recurrent cost covered by country
• Survey cost minimized by leveraging existing sources
• Consulting cost minimized
• Could be financed by donors with some costs borne by country
• Financed by country • Financed by country
Low-income countries Low-middle incomes Middle-income countries
Translationof data
Demandand use
Dissemination
Production
• Consultant cost financed by donors
• Financed by country• International consultants financed
by donors
• Financed by country
• Formal budgeting process (e.g., MTEF) often financed by donors
• Formal budgeting process (e.g., MTEF) often financed by donors
• Formal budgeting process financed by country
• Partial cost sharing of recurrent cost
• Low cost with appropriate data complexity
• Partial cost sharing of recurrent cost
• Low cost with appropriate data complexity and reduced survey
• Full coverage of recurrent cost by country
• Minimized cost for survey and consultants
Level of Country
Ownership
Source: The World Bank, based on country interviews.
35 Boureima Ouedraogo and Some Tegwouli, 2011 Personal Interview Director-General, Information and Health Statistics, Director of Studies and Planning, MOH, Burkina Faso Walaiporn Patcharanarumol 2011 Personal Interview Senior Researcher, IHPP, MOPH, Thailand June 22

57
Translation and Dissemination of NHA
This Chapter surveys how insights from NHA can be “translated” to inform policy and thus illustrates the variety of dissemination mechanisms and products used to target key stakeholders in health
While the production of NHA alone provides a good fact base to illustrate current health financing flows within a country, the data are not particularly meaningful unless key insights from the data are not taken up by policymakers In order for insights from NHA to “translate” into policy, results should be disseminated broadly to reach a wide variety of audiences This translation and dissemination play a critical role in the full cycle of NHA activities: without them, data are little used, and key opportunities in health systems reform may be missed As a result, this Chapter illustrates several lessons that have been learned from country experiences in their process of translation and dissemination While it is recognized that production plays an important role in NHA, details of the production process, including data collection, data management, and data quality, are discussed elsewhere—in the Guide to Producing National Health Accounts (World Bank, WHO and USAID, 2003)
Key points are:
• Without the translation of large volumes of data into policy-relevant analyses and insights, as well as their dissemination to a broad audience, stakeholders in health may fail to cap-ture important information about the performance of the health system They may also fail to appreciate the utility of NHA as an evidence base that can provide input to help the shap-ing of policy
• Countries require a clear NHA dissemination strategy, with each dissemination “product” targeting one of a range of different stakeholders or audiences
Chapter 5

58 | Where Is the Money and What Are We Doing with It?
5.1 Translating Data into insight for policy Makers
A general challenge in using data such as NHA for decision making has been the weak link between data production, on the one hand, and the demand and use of NHA to inform policy, on the other In previous years, there has been an emphasis on production that has failed to address this critical link Without the translation of data into key anal-yses and insights, and their dissemination to a broad audience, stakeholders in health may fail to see the utility of NHA and there-fore miss an important tool to help shape policy Ultimately, translation to the policy phase involves overall country ownership of the NHA process, regardless of the mode of production or governance structure followed: this allows countries to champion key pol-icy insights, increasing the likelihood that insights will be used in a meaningful way
Country interviews with leaders on the pro-duction and use side reveal possible solutions to strengthen the linkages between NHA pro-duction, translation, dissemination, and use This section first looks at ways in which trans-lation may inform policy, and then at ways for such translation to be supported by policy makers and development partners
Possible ways for countries to translate data to inform policy include:
• Focus less on the tool and more on the answers that NHA can provide. Providing answers to essential policy questions is the strongest selling point of NHA, as all policy makers increasingly need data to inform their decisions By moving away from a discussion on NHA as a tool in itself, towards a discussion on the data which policy makers cannot live without, the case for NHA is easily made Korea is an example where, due to strong linkages
between production and use, the NHA as well as OECD Health Data are regularly used to inform key policy debates For example, the data are frequently cited in discussions on the public proportion of total health finance compared to that in other OECD countries With the impend-ing presidential elections, political parties have cited the NHA and OECD Health Data figures to highlight Korea’s low pub-lic health spending as a proportion of total health expenditures Specifically, while the public share of total pharmaceutical spending remains at about the same pro-portion as the OECD average, its share of inpatient expenditure falls far below the OECD average 36 Figures such as these make the case for shifting public health spending from pharmaceuticals towards inpatient care
• Make the product digestible and the pol-icy relevant By translating large volumes of data (NHA tables) into sharp and con-cise policy briefs, insights from NHA data are more likely to be absorbed and used as evidence to support decision making India provides an example where NHA results revealed low public health spend-ing compared with the high out-of-pocket payments incurred by households This prompted the National Commission on Macroeconomics and Health (NCMH) to encourage the government to establish the National Rural Health Mission (NRHM) in India, which promoted greater public financing and lower household payments in consequence It also led to a new gener-ation of government-funded health insur-ance schemes that target the poor (e g , Rashtriya Swasthya Bima Yojna or RSBY) (India MoHFW, n d ) The impact of the NHA was due to their linkage to a broad health reform agenda, commissioned by
36 Jeong Personal communication already referred to

Translation and Dissemination of NHA | 59
the NCMH to study the nexus between economic growth and the health sector
• Tailor your product to your audience The importance of dissemination cannot be over-stated Dissemination can come in the form of policy briefs just referred to, or as seminars and workshops to inform policy makers These add relevance to the NHA and highlight their importance In the case of analyses which are transmit-ted to the media and broader public, it is important that key messages be crisp, free from technical terms, and with clear mes-sages on what the data suggest
• Continue to invest in improving produc-tion and translation capacity to develop and respond to “policy windows” that can spur demand and use For example, in the United States, NHA production began in the 1960s and has been produced rou-tinely ever since In 1980, projections for a five-year period began Continuous improvements have since been made to these projections which have allowed for the 75-year projections that are made today During the 1990s, NHA projec-tions were increasingly integrated into Medicare trust funds, to inform key pol-icy issues of federal relevance Recently, NHA data, in triangulation with demo-graphic data, have provided evidence for analyzing the current financial crises and U S debt issues Demand for NHA data has grown over time; as have their lev-els of sophistication Sustained produc-tion has allowed economists and statisti-cians to make incremental improvements to generate and capture a “policy win-dow” for improving efficiency and equity in health spending 37
• Triangulate NHA data with other data instruments and sources. As has been seen, creating strong linkages between NHA and other data instruments and sources can generate cost savings It can also facil-itate translation of data into analyses and relevant insights for policy The case of
the Philippines is illustrative here, where NHA were triangulated with the Family Income and Expenditure Surveys (FIES) and National DHS to illustrate discrep-ancies between insurance coverage and health financing sources—indicating a lack of “effective coverage” While the private insurance scheme, PhilHealth, claimed a national insurance coverage rate of 85 percent, public social health insur-ance accounted for only 8 5 percent of all health financing sources This indicates that 57 percent of health financing came from households’ out-of-pocket expen-diture (Lavado et al, 2011b); the burden on households was also increasing over time These results served as the impetus to move policy discussions from “cover-age” to “effective coverage” 38 Essentially, the linkage between NHA and other data sources revealed a disparity between the national health insurance policy and the government’s ability to implement it through the provision of financial access to care
In Thailand also, NHA have been used with other data instruments and sources to inform health policy (Box 5 1) In par-ticular, this has led to the projection of various scenarios in the MTEF for the health sector, highlighting how the gov-ernment can invest more in public and preventive health programs
Possible ways for policy makers and develop-ment partners to support translation include:
• Engage political leaders through the NHA Policy Advisory Group. Policy Advisory Groups with a solid skill-set in translation
37 Waldo, Daniel 2011 Written Communication Senior Economist, Actuarial Research Corpora-tion September 17 2011 38 Chakraborty, Sarbani 2011 Personal Interview Senior Health Specialist, World Bank June 9
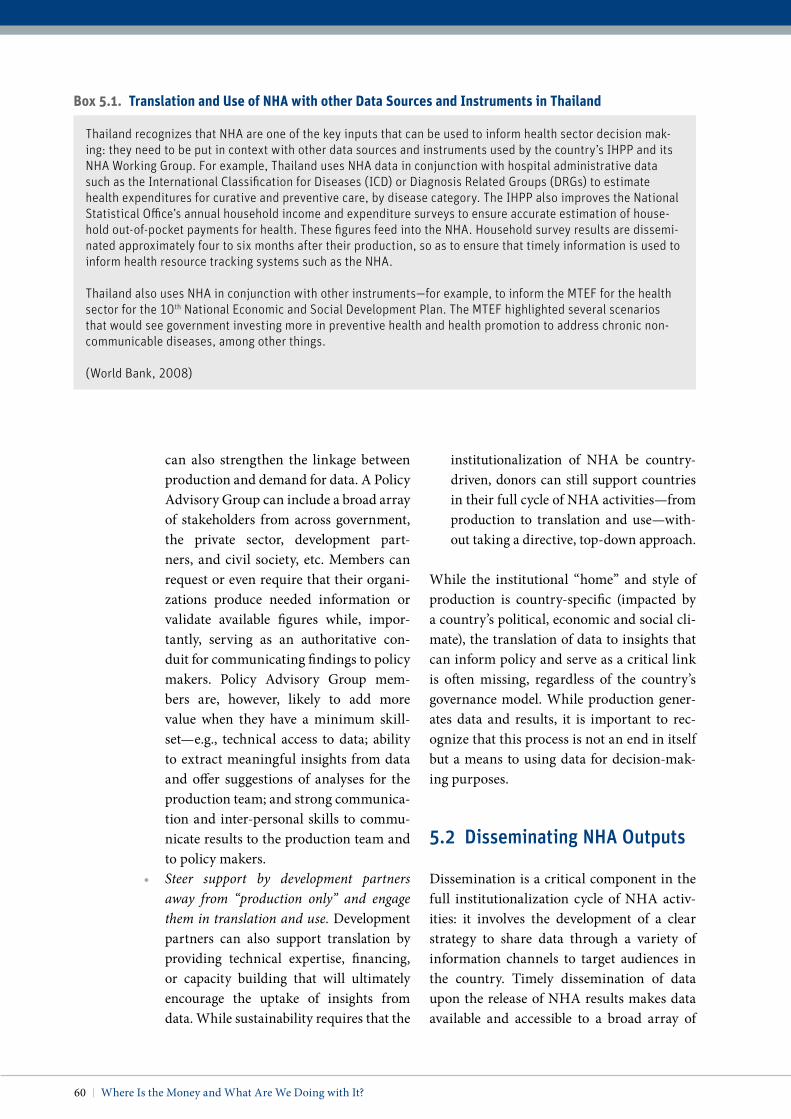
60 | Where Is the Money and What Are We Doing with It?
can also strengthen the linkage between production and demand for data A Policy Advisory Group can include a broad array of stakeholders from across government, the private sector, development part-ners, and civil society, etc Members can request or even require that their organi-zations produce needed information or validate available figures while, impor-tantly, serving as an authoritative con-duit for communicating findings to policy makers Policy Advisory Group mem-bers are, however, likely to add more value when they have a minimum skill-set—e g , technical access to data; ability to extract meaningful insights from data and offer suggestions of analyses for the production team; and strong communica-tion and inter-personal skills to commu-nicate results to the production team and to policy makers
• Steer support by development partners away from “production only” and engage them in translation and use. Development partners can also support translation by providing technical expertise, financing, or capacity building that will ultimately encourage the uptake of insights from data While sustainability requires that the
institutionalization of NHA be country-driven, donors can still support countries in their full cycle of NHA activities—from production to translation and use—with-out taking a directive, top-down approach
While the institutional “home” and style of production is country-specific (impacted by a country’s political, economic and social cli-mate), the translation of data to insights that can inform policy and serve as a critical link is often missing, regardless of the country’s governance model While production gener-ates data and results, it is important to rec-ognize that this process is not an end in itself but a means to using data for decision-mak-ing purposes
5.2 Disseminating NHA Outputs
Dissemination is a critical component in the full institutionalization cycle of NHA activ-ities: it involves the development of a clear strategy to share data through a variety of information channels to target audiences in the country Timely dissemination of data upon the release of NHA results makes data available and accessible to a broad array of
Thailand recognizes that NHA are one of the key inputs that can be used to inform health sector decision mak-ing: they need to be put in context with other data sources and instruments used by the country’s IHPP and its NHA Working Group. For example, Thailand uses NHA data in conjunction with hospital administrative data such as the International Classification for Diseases (ICD) or Diagnosis Related Groups (DRGs) to estimate health expenditures for curative and preventive care, by disease category. The IHPP also improves the National Statistical Office’s annual household income and expenditure surveys to ensure accurate estimation of house-hold out-of-pocket payments for health. These figures feed into the NHA. Household survey results are dissemi-nated approximately four to six months after their production, so as to ensure that timely information is used to inform health resource tracking systems such as the NHA.
Thailand also uses NHA in conjunction with other instruments—for example, to inform the MTEF for the health sector for the 10th National Economic and Social Development Plan. The MTEF highlighted several scenarios that would see government investing more in preventive health and health promotion to address chronic non-communicable diseases, among other things.
(World Bank, 2008)
Box 5.1. translation and Use of nha with other data Sources and instruments in thailand

Translation and Dissemination of NHA | 61
stakeholders in the public interest It can highlight to policy makers specific policy issues that are revealed by the raw data and is likely to optimize the uptake of insights from data to inform policy
In Thailand, the dissemination of health resource tracking data has been effective in informing debates around the effective use of medicines For example, when representatives from industry suggested that Thailand was spending too little on pharmaceutical spend-ing, a network of statisticians triangulated the data, allowing IHPP Thailand to produce evi-dence to the contrary—emphasizing the coun-try’s sustainable use of generics as a cost-con-taining measure The results were broadly disseminated to the media and throughout society, and the debate was discussed pub-licly through television and newspapers 39 Use of NHA thus brought transparency to public debate and enhanced accountability as a result
In developed countries such as Korea, NHA data are shared broadly, and insights from the data have contributed to key policy debates In the first instance, the NHA data are posted on Korea’s health accounts website 40 Press releases are also issued after the annual pub-lication of the NHA report Korea’s NHA Forum, under the Korean Association of Health Economics and Policy, has held work-shops and planned other activities to expand its user audience The NHA Focal Point has strong linkages to the Ministry of Health and Welfare as a result of his previous work expe-rience at the Ministry and current advisory role—this facilitates the uptake of insights from the data 41
Broad sharing of NHA results thus helps to promote transparency, adds credibility to the numbers that the NHA provide, and as a result helps to inform key policy debates
In a variety of countries, however, data pro-duction rather than dissemination have been
prioritized Examples of countries where this has occurred include India, Burkina Faso, Serbia, and Mali The emphasis on production has been reinforced by international work-shops and conferences which tend to focus on the bottlenecks in production rather than those encountered in dissemination and use In addition, there remains a dearth of finan-cial resources to invest in dissemination While a routine budget line-item may sup-port production, there is often little in the way of supporting dissemination This has been observed in a variety of countries
In Serbia, for example, the termination of donor funding for NHA has left only limited financial resources to support dissemination Whereas previously, eight workshops were held to launch and disseminate NHA results, current dissemination is limited to post-ing of data on the MOH website, production of annual reports, and sharing of data with WHO The NHA team is trying to circum-vent this issue by presenting findings at inter-nal and external workshops for Continuing Medical Education 42
Mali serves as a unique example of a country that has sought to overcome this challenge In previous NHA rounds, data were avail-able directly from the MOH, development partners, or the Institute of Public Health Research, but were not broadly disseminated Its draft three to five year NHA institution-alization plan seeks to prioritize dissemina-tion through a broad strategy geared towards Parliament, NGOs, the Ministry of Health, and the Bureau of Statistics Results will be
39 Tangcharoensathien, Viroj, and Walaiporn Patcharanarumol 2011 Personal interview already referred to 40 www.healthaccount.kr41 Jeong Personal communication already referred to 42 Gajic-Stevanovic, Milena 2011 Personal inter-view already referred to
62 | Where Is the Money and What Are We Doing with It?
disseminated through the internet, work-shops, policy briefs, and flyers 43
In Ghana, there are plans underway to estab-lish a clear dissemination strategy For exam-ple, specific policy papers will be commis-sioned and disseminated as full reports or policy briefs This will ensure that data can feed into policy discussions, for example on how to prioritize and allocate resources to the health sector There are also plans to host a competition for the best paper on the use of NHA data to impact policy Overall, Ghana aims to: print and disseminate total results and specific policy analyses; present analy-ses at various forums; and promote contin-uous advocacy with senior policy makers to increase demand for NHA data 44
Dissemination should occur at two points in the cycle of NHA activities First, basic tables and raw data should be made avail-able for initial discussion with the providers of the data and to draw broad conclusions Second, additional dissemination of results should take place following the translation of the initial data into policy-specific analyses and reports While the first dissemination plan can target policy makers, the media,
and perhaps academic or research entities, the second dissemination stage could focus on senior policy makers and those who are able to have a direct impact on planning and budgeting Box 5 245 exemplifies the two stages of dissemination in the example of the Philippines
Unfortunately, countries often lack a clear dis-semination strategy with clearly specified prod-ucts and channels that are tailored to target audiences, including stakeholders within and outside of government Frequently, data are not shared outside of government, making it dif-ficult for universities, academics, think-tanks, and other independent institutions to access the information For example, dissemination of NHA results in India currently includes a launching ceremony or workshop organized by the MoHFW, to highlight key findings Results are also posted on the websites of the MoHFW
The institutional “home” for NHA in the Philippines, the National Statistical Coordination Board (NSCB), con-venes multilateral forums to discuss the needs and concerns of data producing agencies (Encarnacion, 2011). First, raw data are put into the public domain, allowing independent researchers and others to use the data for research; this generates evidence and independent commentaries on the health sector (Chakraborty, 2011). The annual National Health Research Forum of the DOH then allows for dialogue between the NSCB and users; this allows the NSCB to present its findings, highlight the data input needed, and share its plans on how to use the data.
The Inter-Agency Committee on Health and Nutrition Statistics (IAC-HNS) serves as another forum to promote dialogue between producers and users. The IAC-HNS, chaired jointly by the MOH and NSCB, contains 20 regular members from both the producer and user side of health statistics; they meet quarterly to discuss the problems faced by NSCB statisticians in production, areas where help is needed, and mechanisms to facilitate the trans-fer of data from data producing agencies to the NSCB. The association of Health Maintenance Organizations (HMOs) is also a regular participant in the IAC-HNS.
(Racelis, 2008)
Box 5.2. dissemination via workshops and Forums in the philippines
43 Zine-Eddine El-Idrissi, Driss M 2011 Personal Interview Senior Health Specialist, The World Bank June 21 44 Draft NHA institutionalization strategy for Ghana 45 Encarnacion Personal communication already referred to

Translation and Dissemination of NHA | 63
and WHO 46 Despite these steps, dissemination remains limited; this is attributable to weak ownership of and demand for the data
Thailand, however, provides an example of a country that has sought to strengthen dissem-ination The country places a strong empha-sis on dissemination and information sharing NHA results are disseminated every two years, with NHA matrices posted on the IHPP web-site in Microsoft Excel, as well as in the form of policy briefs (World Bank, 2008) Briefings are held to debate specific policy issues Results are also publicized in the media to highlight particular policy issues Meanwhile, feed-back from interested parties (e g , comments and queries from the private hospital sector) is received via email This fosters transpar-ency in the policy making process Tanzania, another good example, has strengthened its commitment to improving dissemination and information sharing While with the first NHA little was done in the way of dissemi-nation, there has been a much greater effort to improve dissemination in the second and third rounds For example, the second round of NHA results were disseminated broadly at the Joint Annual Health Sector Review where all development partners were present, includ-ing members of the public sector (e g , the MOH and the MOF) and the private sector NHA results were posted online at the website of the Ministry of Health and Social Welfare In addition, policy briefs on sub-accounts (e g , reproductive health) were published online in conjunction with USAID’s Health Systems 20/20 project Findings were also pre-sented at the International Health Economics Association (iHEA) meeting in Beijing in July, 2009 For the third round (in process), efforts will be made also to use local media and news-papers 47 Together, these various avenues of dissemination have helped to foster transpar-ency in the policy making process
Even low-income countries, where a dissemi-nation strategy is not yet in place, can broadly
disseminate data and analyses For exam-ple, in Afghanistan NHA findings were high-lighted with much fanfare through a “launch-ing” ceremony in April 2011 Senior officials from other Ministries (including the MOF), representatives from the Central Statistics Organization, hospital directors, NGOs, and the donor community were among those invited The event received significant cover-age on local television and radio and has moti-vated significant discussion on how to use data to inform health policy Once the NHA report is completed, it will be printed and published on the government’s NHA website and trans-lated into local languages However, the data is already being communicated by email to vari-ous ministries (Afghanistan MoPH, 2011)
Similarly in the Seychelles, where the first round of NHA results is just now being final-ized, there are plans to disseminate results Once confirmed, the results will then be for-warded to a Cabinet of Ministers The final report will be posted on the MOH website and hard copies distributed to stakeholders The Seychelles also intends for its NHA data to be used by a wide variety of stakeholders, includ-ing the MOH, the MOF, WHO, private health care practitioners, and private pharmacies 48
Even in resource-constrained settings, then, there are various ways that countries can maintain a broad dissemination strategy Malaysia provides a good illustration of this point (Box 5 349,50)
46 Nagpal Personal interview already referred to 47 Ally Personal interview already referred to 48 Malbrook Written communication already referred to 49 Dr Zainuddin, Jameela 2011 GSAP Financing-Malaysian Perspective. Head of Unit, Malaysia National Health Accounts Unit, Planning & Development Division, Ministry of Health Malaysia 50 Dr Zainuddin, Jameela and Dr Husein, Rozita 2011 Written communication. Head of Unit, Malaysia National Health Accounts Unit, Planning & Development Division, Ministry

64 | Where Is the Money and What Are We Doing with It?
system The linking of NHA data with other, important health databases and systems facil-itates translation of data to inform policy
Countries can also leverage regional, health-accounting networks to highlight and dissem-inate NHA results This has been particularly important for the Asia Pacific National Health Accounts Network (APNHAN) and Euro-Asia networks, where members can present their NHA findings, discuss methodological concerns, as well as possible applications to policy among their peers (see Chapter 6)
Regardless of the mode of dissemination cho-sen, it is important to have a clear commu-nication strategy in place that is tailored to an array of specifically-identified audiences
It is important for countries to define target audiences and prioritize dissemination prod-ucts according to their available resources Table 5 1 shows some variations in the dis-semination output for different targets
Other, innovative solutions for the dissemi-nation of NHA results are also available One approach relies on integrating the NHA with other data instruments and sources Statistical reporting systems in many countries fail to use indicators produced from NHA data NHA are frequently considered a tool in par-allel to existing health information systems This can be remedied through the integra-tion of NHA indicators in health informa-tion systems with other statistical documents Investments in IT solutions (e g , a common platform or health information system) can also help to harmonize data sources and instruments (e g , MTEF) so that the NHA are not perceived as a stand-alone, separate
Malaysia disseminates NHA data through policy dialogue sessions, held every two years, that involve public and private stakeholders in health. Group work during these sessions highlights important issues in the NHA along with areas that need to be addressed broadly, as well as the issues that require the attention of individual agen-cies. The output of these sessions is compiled and disseminated to stakeholders and key policy makers (World Bank, 2008). Final NHA products are disseminated to all stakeholders in health, either in hard copies of the reports or else in CD format. Summaries of the data are also documented in the Health Facts booklet, a pocket-size health statistics reference that is produced annually by the MOH. This booklet is disseminated widely in hard copy and online. A major obstacle, however, lies in generating additional funds for producing hard copies and postage—yet Malaysia has overcome this challenges by disseminating the data in CD format, and web-based data uploads are currently being considered.
Box 5.3. Financial resources for dissemination in malaysia
of Health Malaysia and Head of the National Health Financing Unit under the Planning & Development Division of the MOH, Malaysia
table 5.1. examples of dissemination products for different targets (not exhaustive)
Type of Dissemination
Internet (email, website)
Hard or soft copies of reports, or CDs
Workshops, forums, training sessions
Policy briefs Press releases, media sound bites
Main target audience (Examples)
Civil society, researchers, universities, policy makers
Producers, researchers, universities, civil society
Policy makers, researchers
Policy makers, civil society, researchers
Civil society, researchers

Translation and Dissemination of NHA | 65
in-country, along with the financial support that is needed for routine dissemination In this way, information can be shared broadly,
encouraging the uptake of insights from data production for use by policy makers in deci-sion making


67
The Value of Global and Regional Partners
Previous chapters have explored approaches that countries can take to strengthen each of the steps out of the full cycle of NHA activities—including governance, capacity building, and financing—based on their income levels and skills profile Moreover, international
and regional organizations can also play a critical role in facilitating the institutionalization of the NHA process at the country level This chapter explores the potential value that global part-ners and regional agencies can add to NHA institutionalization
Key points are:
• Some coordination at the global level may help improve the accountability and transpar-ency of the NHA process at the country level, facilitating the use of internationally compa-rable data
• International development partners can add value to countries by: refining and updating international statistical frameworks and guidelines; serving as repositories of knowledge to build institutional capacity; promoting and facilitating the translation of data into policy-relevant data; and improving transparency in their own financial flows
• Regional agencies such as WHO regional offices, regional NHA networks, and regional observatories can further support country-level NHA activities
• Regional agencies can add value to countries by facilitating peer-based learning among member countries, serving as a repository of knowledge and best practices, and provid-ing cost-efficient technical expertise However, regional collaboration requires overcoming financing and governance challenges in the long-term
6.1 Global partners
Coordination at the global level can help support institutionalization across the full cycle of NHA activities at the country level by: (1) promoting accountability and transparency through global initiatives and governance structures; and (2) establishing international standards for health accounts and facilitating global access to internationally comparable data Moreover,
Chapter 6

68 | Where Is the Money and What Are We Doing with It?
international development partners can add value by: (1) serving as a repository of knowl-edge to build institutional capacity and facil-itate the exchange of information; (2) facili-tating the link between data to issues relevant to policy; and (3) improving transparency in their financing of health resource tracking activities
Global initiative to improve accountability and transparencyIn the face of global financial and fiscal con-straints, governments around the world are demanding greater accountability on the use of funds, whether they are domestic or exter-nal In such an environment, there is increas-ing global momentum to improve account-ability in health resource tracking as a critical activity for benchmarking progress towards the achievement of global health initiatives, such as MDGs
A high-level commission was convened by WHO to improve global reporting, oversight and accountability for women’s and children’s health—the Commission on Information and Accountability for Women’s and Children’s Health was established in January 2011 fol-lowing the launch of the Global Strategy for Women’s and Children’s Health at the UN, with increased pledges worldwide to achieve Millennium Development Goals (MDGs) 4 and 5 to reduce child mortality and improve maternal health The Commission proposes a framework for global reporting, oversight, and accountability that includes tracking results and resource flows at global and country levels, creating a system to monitor whether external assistance for women’s and children’s health are made on time, whether resources are spent wisely and transparently, and whether the desired results are achieved (Commission on Information and Accountability for Women’s and Children’s Health, 2011)
Specifically, the Commission calls for new targets in health resource tracking—i e by
2015, among all seventy-four countries where 98 percent of maternal and child deaths occur, to track and report at minimum two aggregate resource indicators: (1) total health expenditure by financing source, per capita; and (2) total reproductive, maternal, new-born, and child health expenditure by financ-ing source, per capita It is based on the prem-ise that tracking financial resources provides critical information that helps increase the accountability of governments to their cit-izens; shows whether countries have spent funds according to the priority areas bud-geted for in their national health plans; sup-ports more informed policy making; and enables money spent to be associated with results achieved (Commission on informa-tion and accountability for Women’s and Children’s Health, 2011) This initiative, led by countries and development partners, to coor-dinate global accountability sheds lights on the importance for countries to institution-alize NHA as a key tool for health resource tracking
Global coordination for international comparabilityInternational comparison helps countries to measure their health financing perfor-mance compared to peers (Box 6 151) The Organisation for Economic Co-operation and Development (OECD) is mandated by its member countries to work towards inter-national comparability of health spending
51 Sources for Box 6.1:Somanathan, A , Rannan-Eliya, R P , Fernando,
T , Hossain, N , Mahal, A , Pande, B R , and L Reichenbach 2004 Review of Costs and Financing of Reproductive Health Services. Unpublished report prepared for World Bank’s Analytical and Advisory Activity on Better Reproductive Health for Poor Women in South Asia Colombo, Sri Lanka: The World Bank
OECD 2010 Health at a Glance: Asia/Pacific 2010 OECD Publishing Available at: http://dx.doi.org/10.1787/9789264096202-en
The Value of Global and Regional Partners | 69
A System of Health Accounts (SHA) was released by OECD in 2000 with the aim of establishing an international statistical framework for the reporting of health expen-diture and financing data In 2003, the World Bank, WHO and USAID developed a meth-odological guide on how to collect data and produce national health accounts that built
on the principles and concepts established by SHA The result was the NHA Producer’s Guide (PG), published in 2003, whose pri-mary goal was to assist developing countries prepare their own national health accounts While countries can develop and use their own financial reporting system that reflect the unique aspects of their health system,
The Asia-Pacific region represents provide several examples where health accounts have been used to facili-tate inter-country comparisons at the national level, and allowed for the decomposition of national estimates to yield program-specific comparisons.
Inter-country comparisons have been undertaken for a variety of analyses using health accounts data in the Asia-Pacific region. One notable example is a study of regional comparisons of national health spending that have been analyzed for the Asia-Pacific Joint Regional NHA Collections, led by APNHAN together with OECD Korea, using the OECD SHA framework. This analysis combines health accounts and non-financial data. It exam-ines health expenditure levels and trends from an international perspective, decomposing health financing by function, provider, and source (OECD, 2010). To illustrate: the report highlights a great deal of variation in total health spending across Asia-Pacific countries—from USD 3,448 PPP in Australia to USD 24 PPP in Myanmar—illustrating health spending that is highly correlated with GDP. The report also points to variations in the growth rate of real, per capita, public health spending over time—from 4.9 percent in Asia-Pacific compared to 4.1 per-cent annual growth for OECD countries over the period 1998–2008. Yet other countries experienced a decline in health spending—e.g. Brunei Darussalam, Papua New Guinea and Nepal. In some cases, this was due to broader government pressures to reduce public spending. Finally, private sector health spending was found to exhibit large variations by country, and constituted the major source of private financing for health—again with strong inter-country variations.
NHA have also facilitated analytical work on the distribution of health financing in the Asia-Pacific region. The Equity in Asia-Pacific Health Systems (Equitap) network, a collaborative effort of more than 20 research teams in the Asia-Pacific region, has engaged in examining equity in national health systems in the Asia-Pacific region, with linkages to NHA data. These include several inter-country analyses on benefit incidence, progressivity of health financing, and the catastrophic impact of health financing.
NHA has also been used to facilitate inter-country comparisons for specific health services. As one exam-ple, NHA were used in a World Bank, multi-country study (2004) on the costs and financing of reproductive health (RH) services in South Asia. NHA and other government estimates allowed for a full analysis of the costs of reproductive health services incurred by governments, donors, and households in Bangladesh, Sri Lanka, Nepal, Pakistan, and the states of Rajasthan and Andhra Pradesh in India. Amongst other things, this study found the public-private health financing mix to vary by country in South Asia, with public spending on RH rang-ing from 15–16 percent (Rajasthan, Sri Lanka) to 42 percent (Andhra Pradesh). In Bangladesh and Rajasthan, private financing for reproductive health was two—or threefold that of public financing. In contrast, private financing in Sri Lanka was only half that of public financing. Moreover, financing for specific RH services was also found to vary by country. Importantly, even countries with similar income per capita exhibited strong vari-ations in access to care. For example, Sri Lanka, Bangladesh, and Nepal have similar RH expenditure in relation to GDP, but Sri Lanka provides universal access to RH services, while Bangladesh and Nepal have less than one half or one third the levels of access, respectively. The authors of the present document attribute this variation to differences in technical efficiency of public sector services across countries.
These examples further highlight the value of adopting international standards, harmonizing data (under the SHA), web-accessible databases, and comparable reports on health financing to facilitate international comparisons.
Box 6.1. Using nha for international comparisons

70 | Where Is the Money and What Are We Doing with It?
the use of the SHA and the International Classification for Health Accounting (ICHA) enables international comparisons of the data produced, helping policy makers under-stand their country’s health spending in rela-tion to their peers Through the use of the OECD-Eurostat-WHO Joint Health Accounts Questionnaire (JHAQ), comparable and detailed health expenditure data (based on the SHA/PG) are currently collected for around 35 OECD/EU countries The same questionnaire is also used in the Asia-Pacific regional health accounts collection
The release of a revised SHA manual in 2011 by OECD, WHO and the European Commission provides an updated global standard in health accounting that reflects new and emerg-ing demands on health accounts, including greater responsiveness to the needs of non-OECD countries In particular, SHA 2011 manual offers an updated international sta-tistical framework for tracking financial flows from sources (external and domestic) to uses of funds The addition of the SHA tables on sources of funds reflects a specific response to the particular needs of many non-OECD countries In addition, SHA 2011 includes sig-nificant revisions on classifications for disease tracking that could better support the prep-aration of subaccounts by disease categories
Global resource tracking effortsAt present, a large number of resource track-ing efforts are being led by a diverse group of stakeholders A number of international development partners have invested resources to build capacity at country level and pro-vided financial and technical assistance to assist developing countries produce NHA This section highlights a number of ways in which international development partners are contributing to this process:
Methodological developmentSeveral entities play a role in methodological development and statistical standard setting
For example, OECD, WHO and the European Commission recently released SHA 2011, which provides a global standard in health accounting This brings together the original SHA and PG produced by the World Bank, WHO, and USAID in 2003 (See Appendix A2 for details) Other entities, such as UNAIDS, use tools including the NASA to monitor the flow of HIV/AIDS funding
FinanciersThere are several financing entities that sup-port NHA activities in countries as well as at a regional level These include: the World Bank, USAID, the European Commission which provides financial support for African coun-tries, the Asian Development Bank (ADB), and WHO country offices which provide limited funding Several other donor agen-cies also have invested in NHA activities over the past years, including: BMGF, GTZ, DFID, the Inter-American Development Bank (IDB), Swedish Development International Cooperation Agency (SIDA), etc In addition, some organizations fund household surveys, which include health expenditure compo-nents (e g MEASURE DHS)
Technical assistance (including capacity building)Several organizations play a key role in pro-viding technical assistance, including capac-ity building, at country and regional level For example, WHO provides technical assistance to countries and supports regional capacity building efforts through its regional offices USAID supports a wide range of technical assistance and capacity building support to various countries through its HS 20/20 pro-gram Other organizations such as PAHO and Harvard University’s International Health Systems Group are also providing techni-cal assistance to support country-level NHA activities (Hjortsberg, 2001)
The World Bank provides financial and tech-nical support for NHA, often in conjunction

The Value of Global and Regional Partners | 71
with Public Expenditure Review, which is one of the World Bank’s core diagnostic tools pre-pared to help countries establish effective and transparent mechanisms to allocate and use available public resources in a way that pro-motes economic growth and helps in reduc-ing poverty NHA is an essential input for preparing the health sector component of PERs (see Box 6 2) The World Bank has devel-oped instruments such as Public Expenditure Tracking Surveys (PETS) to collect informa-tion on the characteristics, financial flows, outputs, and accountability arrangements of service facilities and, in some cases, firms Data collected from PETS would provide valuable inputs for refining NHA Finally, the Bank conducts Living Standard Measurement
Surveys (LSMS) through which it supports government statistical offices in developing countries strengthen the type and quality of household data to inform development poli-cies, including data collection for NHA
Various organizations also play a role in pro-viding technical assistance to support devel-opment of disease-specific sub-accounts For example, WHO has issued guidelines on creating Reproductive Health, HIV/AIDS, and Malaria sub-accounts that are based on the NHA methodology Other agencies such as USAID and UNAIDS assist coun-tries in their production of disease-specific, sub-accounts for HIV/AIDS, malaria, TB, and RH
PERs are useful analytical tools that can be used to evaluate health-system performance, help ensure that resources are being allocated in ways that reflect national priorities and are likely to improve efficiency and equity of the health sector. NHA data* are critical for effective PERs. A review of 44 recently-published PERs provides several examples demonstrating how NHA data can be used effectively; they also remind us that well-targeted public policy cannot be made without such data. We highlight just a few examples:
• Level of health spending. Recommendations on the level of health spending cited in PERs are often based on NHA data. Health spending indicators—such as public spending on health as a percentage of GDP or pub-lic spending on health as a percentage of total government spending—can be easily compared to regional averages and/or averages of countries of the same income level. In one example, the PER for Sierra Leone (2010) pointed to low levels of public health expenditure data relative to international standards, and a reduction in public expenditures in the share devoted to health. These observations were aligned with the dismal ranking of Sierra Leone in terms of health outcomes.
• Financial sustainability. PERs typically raise issues of the financial sustainability of the health sector, and these are based on NHA-type data. For low- and low-middle income countries, issues of financial sustainabil-ity raised in PERs most frequently relate to the size of donor funding relative to domestic funding for health. Donor funding is consistently reported as being unpredictable and unreliable for long-term strategic pol-icy formulation. Another financial sustainability issue, raised in PERs using NHA data, concerns spending on specialized treatment abroad. For example, in the West Bank and Gaza PER (2007), the size of specialized treatment received outside the MOH was found to have reached unsustainable levels. In addition, the grow-ing number of exempt beneficiaries and the decreasing revenues from payroll taxes has raised issues about the sustainability of the Government Health Insurance system. The PER therefore recommended diversifying the revenue base of the government’s health insurance scheme.
• equity/targeting of specific populations. PERs typically raise issues of inequality or poor targeting for specific population groups, again using NHA-type data. For example, the Ukraine PER (2008) analyzed the impoverishment and redistributive effects of high out-of-pocket payments borne by households. In the 2008 PER for Indonesia, in another example, benefit incidence analysis revealed that reforms were needed to address the regressivity of health-care spending. Geographically disagregated NHA data also revealed dis-parities in funding across districts of the same region.
Box 6.2. the role of nha in Formulating policy: examples from pers
* The term “NHA data” is used loosely to include any type of data quantifying health expenditures by source or use.

72 | Where Is the Money and What Are We Doing with It?
Other support for health resource trackingThe Global Fund to Fight AIDS, Tuberculosis, and Malaria (GFATM), whose work is based on the principle of performance-based financ-ing, also supports resource tracking efforts, although it does not directly produce health accounts Its activities and grants are con-tinuously being evaluated and monitored in order to make sure that performance bench-marks are reached The GAVI Alliance also views monitoring and evaluation as integral to health-system strengthening, in its work to improve access to immunization in poor countries
Further, the Global Health Initiative (GHI) represents a comprehensive, U S govern-ment-wide strategy for global health, focusing on the health challenges and needs of those in low- and middle-income countries The GHI invests in 80 countries globally for a variety of global health programs, with an increas-ing focus on country ownership Monitoring and evaluation is a critical component of this effort
Value added by international development partnersLeveraging their global outreach, interna-tional development partners can also add value in supporting country-level NHA activities, through: (1) information shar-ing and serving as a repository of knowl-edge and (2) improving transparency in their own financial flows, at the global level; and (3) facilitating the link between data and issues relevant to policy, at the country level
Data collection, estimation, and global and regional reportingWHO collects health-spending information from member countries and reports annu-ally on a set of health-spending indicators Countries, as well as donors, increasingly use this information for both internal pur-poses as well as for cross-country compari-sons WHO also offers several tools to sup-port these efforts: it has recently launched an online Global Health Expenditure Database that permits easy access to the totality of NHA information The tool allows for quick cross-national comparisons (Figure 6 152), country-specific summary statistics, a variety of easy-to-produce reports (see Appendix B 9), and figures on health expenditures OECD/DAC (OECD Development Assistance Committee) also produces annual estimates of donor dis-bursements and financial commitments to health DAC collects its information using its Creditor Reporting System (SRS) Other enti-ties such as UNAIDS collect and report on spending on HIV/AIDS It uses the NASA methodology as its country-resource track-ing system
Figure 6.1. illustrative Bubble chart from Global health expenditure database
Source: WHO Global Health Expenditure Database.
52 Source for Box 6 2: Gaudin, Sylvestre 2011 “National Health Accounts in Decision Making: Insights from World Bank’s Public Expenditure Reviews and Poverty Assessments ” Draft Prepared for the World Bank September 8, 2011

The Value of Global and Regional Partners | 73
At the global level:1 International development partners
can facilitate information-sharing and serve as a repository of knowledge for building country-level institutional capacity for NHA For example, expe-rienced consultants can share their technical knowledge (including stan-dardized methodologies and tools) to collect, compile, validate, and translate data to inform policy They can also share experiences from other coun-tries in incorporating NHA indicators into routine living-standard surveys and other data instruments This may include integrating health expenditure questions directly into DHS, Multiple Indicator Cluster Surveys (MICS), the World Bank‘s LSMS, or other local surveys In doing so, international sup-port should ensure that countries own and lead the institutionalization pro-cess, regardless of whether the produc-tion is conducted in-house or by local, regional, or international consultants and they should support NHA from a long-term perspective rather than as a one-off exercise
2 International development part-ners can also work toward improving accountability and transparency in the release of funds for the health sector in such a way that these are tracked and managed by countries themselves The OECD DAC has forged major inter-national development commitments, including the Paris Declaration on Aid Effectiveness, which establishes a monitoring system to assess progress and ensure that donors and recipients hold one another accountable for their commitments Specifically, the Paris Declaration requires that international development partners harmonize efforts and use local systems in trans-ferring funds to recipient countries, as
well as simplify and share information to improve transparency in the flow of funds (OECD DAC, 2008)
At country level3 International development partners
can facilitate the linkage between data and their translation into insights that inform policy This may involve help-ing countries to think through various governance structures and develop a long-term capacity building and financing plan for NHA, with empha-sis on their use for policy making In doing so, development partners can leverage their access to policy mak-ers so as to encourage the uptake of insights from the data to inform pol-icy This would help to foster a culture of using data for decision making
Donors can also leverage their active involvement in countries’ planning and budgeting processes to support the integration of NHA with other existing planning and budgeting instruments (e g , linking NHA to the PER and the MTEF) Essentially, link-ing NHA to broader country planning initiatives will also support the sus-tained production of NHA, as well as their use to inform policy In doing so, donors can support the use of stan-dardized tools and the creation of a centralized health information reposi-tory at country-level, where a variety of data inputs can be accessed easily (e g , to inform NHA, PER, and MTEF)
Global harmonization requires the buy-in of all key players (countries and regional and international stakeholders) and chang-ing the incentives for development partners (Nandakumar and Ravishankar, 2011) to align their behaviors with the guidelines and targets set forth by the Paris Declaration
74 | Where Is the Money and What Are We Doing with It?
and the Commission on Information and Accountability for Women’s and Children’s Health
6.2 Regional Agencies to Support Country-Level NHA institutionalization
In addition to global partners, regional agen-cies can further support country-level NHA institutionalization Various regional agen-cies such as WHO regional offices, regional NHA networks, and regional observatories can support country-level NHA activities by adding value from the perspective of individ-ual countries, including: offering the poten-tial to facilitate peer-based learning among member countries; serving as a repository for knowledge and best practices to build insti-tutional capacity; and providing cost-efficient technical expertise
• WHO regional offices. WHO regional offices can support countries by provid-ing technical assistance in NHA produc-tion This is largely due to WHO’s own strengths and interest as a producer of internationally comparable health expen-diture information
• Regional NHA networks. Regional NHA networks aim to promote regional collab-oration and cooperation in order to es-tablish and maintain NHA within the regions As presented in Box 6 3, with support from regional agencies, bilater-al partners, and regional development banks, six regional networks were estab-lished by various bodies from 1997 to 2003: Eastern, Central, and Southern Af-rica (ECSA), Network of the Americas on Health Accounts (REDACS), Asia Pa-cific National Health Accounts Network (APNHAN), Middle East and North-ern Africa (MENA), Francophone Africa (FA), and Euro-Asia (CIS) Further, new
sister networks are developing such as one for the Pacific Islands, the sister network of APNHAN Generally, the networks provide a platform for member coun-tries to discuss experiences and share best practices on the production-side While they have primarily focused on the pro-duction of NHA, their activities in pro-moting dissemination and use of the data have been limited
• Regional observatories. Regional obser-vatories have the potential to play a role in supporting country-level institution-alization activities by linking the out-puts from the regional NHA networks to policy The aim is to build on the suc-cess of the European Observatory (EO) on Health Systems and Policies in developing similar but unique partnerships in other regions The observatories aim to bring together highly respected academic insti-tutions to undertake analyses, promote dialogue with key policy makers, and leverage additional funding from other agencies (World Bank, 2011) Although still at an early stage of development, it is envisaged that regional observatories may play a role in guiding dissemination and the translation of data to affect policy, thereby filling a critical gap in NHA insti-tutionalization activities
Potential value added by regional activitiesRegional activities have the potential to add value to countries in their NHA institutional-ization activities in the following ways:
• Promote peer-level knowledge sharing and learning Regional activities can serve as forums where producers of the data can share results and discuss concerns on the production-side (Box 6 453) It allows
53 Pellny, Martina and Irava, Wayne 2011 Personal interview already referred to

The Value of Global and Regional Partners | 75
Asia pacific national health accounts network (apnhan). The largest of the six networks, APNHAN was established in 1998 with support from the Rockefeller Foundation grant channeled through WHO headquar-ters. The Asia-Pacific Health Economics Network (APHEN) established APNHAN as a non-funded project as well. Subsequently, the WHO Regional Offices for the Western Pacific (WHO-WPRO) and South East Asia (SEARO) have both provided funding on an ad-hoc basis either directly from their regional budgets or from country budgets to finance APNHAN members to attend annual meetings. WHO-SEARO facilitated the holding of the initial dis-cussion meeting to establish the network on the fringes of a SEARO organized meeting. At the time, both WHO-SEARO and WHO-WPRO equally supported grant applications made by APNHAN to secure its initial seed funding by endorsing applications made by APNHAN to other entities. Membership within APNHAN consists of either min-istries of health (or other agencies responsible for commissioning health accounts systems) or specialized techni-cal agencies or experts responsible for compiling and maintaining health accounts systems. One of the network‘s major accomplishments was the establishment of Equitap in 2000, an initiative targeted at analyzing the various equity dimensions of health care financing and delivery. Over the years, APNHAN has cemented its relationship with the OECD, co-hosting its last five annual meetings with the OECD Korea Policy Centre in Seoul. Discussions mainly focus on technical issues related to production of health accounts under the SHA framework.
Eastern, Central, and Southern Africa (ECSA). Established in 1997, ECSA has a membership of 10 countries. Until 2001, its activities—largely consisting of periodic meetings to discuss technical matters—were financed by the WHO Regional Office for Africa. Since 2001, the Commonwealth Regional Health Community for East, Central and Southern Africa (CRHCS) has led the ECSA network. Regional training workshops have been the norm, with activities increasingly geared toward boosting national demand for NHA—particularly through sensi-tizing policy makers during the annual ministerial health conference—and building local capacity to sustain long-term production of NHA.
Euro-Asia Network. In 2008, after five years of operating as the Commonwealth of Independent States (CIS) network, it changed its name to Euro-Asia in an attempt to broaden its membership. The establishment of the network has been extensively supported by the USAID and WHO Regional Office for Europe. There has been a clear shift in leadership from development partners to network member countries with workshops and meet-ings regularly alternating among member countries. Peer support and technical assistance provided by regional experts (beyond the scope of the network‘s regional training sessions) have played a large role in improving data systems and the quality of estimates in member countries.
Middle East and Northern Africa (MENA). When the MENA network was established in 1999, membership was limited to countries of similar socioeconomic status suffering from common health issues. It has since expanded almost threefold as countries of all income levels have begun facing challenges related to the long-term financial sustainability of their health systems. MENA activities have largely been financed by the Eastern Mediterranean Regional Office of WHO, though member contributions are increasing. To meet the rising demand for support, the network is redirecting its attention away from technocrats to policy makers. While technical workshops are still being offered on a regular basis to promote routine production, the network has recently achieved greater success in motivating countries ministries to devote staff towards NHA production.
Network of the Americas on Health Accounts (REDACS). Also launched in 1997, REDACS has undergone sub-stantial change over the years. It was initially known as the Latin America and Caribbean (LAC) network with membership limited to those countries undergoing significant health sector reform with an interest in the devel-opment of health accounts. Training sessions were heavily focused on refining health accounts methodology, with the Pan-American Health Organization assisting countries in the production of satellite health accounts. Nevertheless, minimal funding left LAC mainly inactive between 2000 and 2008. In 2008, the LAC network was reactivated as an initiative of Fundacion Plenitud and the Ministry of Health of the Dominican Republic. Today, it operates as branch of the LAC Health Observatory.
Pacific NHA Network. The Pacific NHA network is currently in the process of being launched. It is envisaged that the network will be governed by a Coordinating Body or Secretariat (chaired temporarily by the WHO); a Steering Committee (Policy Advisory Group) to provide strategic guidance to which members will be elected and for which representation can include member states as well as other research entities (e.g., FNU); and a Technical Resource Center to foster capacity building. The network plans to focus on data collection and pro-duction currently, but also dissemination and use of data to inform policy going forward. Member states have requested workshops to assist them in writing policy briefs using NHA data.
(Based on regional network studies conducted by Sakthivel Selvaraj (APNHAN), Jeff Tshabalala (ECSA), Jens Wilkens (Euro-Asia), Osmat Azzam (MENA), and Magdalena Rathe (REDACS), and based on interview with Martina Pellny and Wayne Irava (Pacific NHA))
Box 6.3. overview of regional nha networks

76 | Where Is the Money and What Are We Doing with It?
producers to communicate with their peers, present key findings, and receive training on NHA concepts and method-ology For example, in order to facilitate peer-to-peer learning and the sharing of information, the Euro-Asia network has leveraged a common language and cul-tural understanding among members, common health information systems and statistics, and similar health system structures
Countries within the region have also benefited from regional workshops and forums In Serbia for example, the Euro-Emro regional workshop has been seen as an invaluable tool in supporting Serbia to recognize NHA as official health statis-tics through the development of a Health Evidence Law which would mandate the submission of data inputs required for NHA production, delineate production responsibilities, etc (as done in Georgia)
The Pacific Island Countries (PICs) have been making efforts to establish and develop health accounts sys-tems for more than a decade. Recently, efforts have been made to develop a Network for NHA and evidence-based policy making in the Pacific. It is envisaged that the network will be governed by a Coordinating Body or Secretariat (chaired temporarily by WHO) and that a Policy Advisory Group will provide strategic guidance: members will be elected to the Policy Advisory Group with representation that can include member states as well as other research entities or interested members; there are a number of Australian institutes affiliated with the network, as well as IHP from Sri Lanka. The network’s core institution however will be a Technical Resource Center, and CHIPSR at the Fiji National University (FNU) has been designated to take over this role. The aim of the Technical Resource Center is to build local capacity (rather than use international consultants), by creating a cadre of persons from across the Pacific Islands that are educated in health financing and health accounting at FNU or the University of the South Pacific (USP). These individuals can then support NHA activities within the ministries of their home countries. It is expected that the Technical Resource Center will be able to spark con-versations about what is happening in NHA throughout the region; inform countries of new methods; serve as a guide on securing data inputs; and serve as a sounding board for methodological questions as needed. For some of the smaller PICs, it is also envisaged that the Center take over the routine production of NHA fully or partly—in close cooperation with their respective Ministries of Health.
The network plans to focus on data collection and production at first, but on the dissemination and use of data to inform policy in the future. At its inception, member states requested workshops to assist them in writing policy briefs using NHA data. The network also aims to have a designated focal point for NHA within the MOH of each member country, where production may or may not reside. The idea is to ensure that the MOH “owns” the NHA institutionalization process and that NHA have a permanent home, regardless of where production occurs. While funding remains limited, the Pacific NHA Network is currently leveraging the support of FNU, WHO, and development partners such as the affiliated institutes to support trainings and workshops. APNHAN provides financial support directly to CHIPSR and therefore the PIC NHA Network. This is conducted on an ad-hoc basis, and includes funding for a single regional training workshop held recently (costs shared with WHO), and funding to assist CHISPR in coordinating the NHA/SHA data collection from Pacific Island countries. Despite this, there is a need for additional financial support for the network.
Still, the network has been successful in creating awareness of NHA and serving as a platform to affect pol-icy change. For example, the network has helped to raise awareness about the use of NHA given that fund-ing by external donors and development partners in health is relatively high in the Pacific. There is therefore a great need to apply a recognized and comparable methodology to track sources of funding accurately—for the sake of better aid effectiveness. NHA also provide a fairly complete picture of all health expendi-tures and sources—not only on those provided by external partners—and it is also important for PICs to be informed of these. There was evidence of interest in NHA on a higher political level at the June 2011 Health Ministers meeting; all 22 Pacific Island countries identified their top ten priorities in health and one of these was to improve health financing, including for the production and use of NHA data as a tool to guide policy decisions.
Box 6.4. capacity Building and Use of data for decision making in the pacific nha network

The Value of Global and Regional Partners | 77
The Head of Serbia’s NHA office has been part of the Working Group involved in the law’s formulation, guided by consultants from Slovenia; to date such a law has not been introduced, however, and its status remains ambiguous This regional work-shop has also benefited countries by facil-itating the sharing of experiences (both positive and negative) encountered in pro-duction cross-nationally and developing local solutions to these challenges In this way, regional collaboration has created a sense of camaraderie and support among peers (Gajic-Stevanovic, 2011)
Peer-level discussions can also occur through online networks to facilitate the exchange of information after regional meetings In addition, regional agen-cies can help to partner non-institution-alized with institutionalized countries to facilitate an exchange of information For example, the new Pacific NHA network is linked and affiliated to APNHAN in order to leverage the expertise and knowledge available in the Asia and Australian region (APNHAN, 2010; Asian Development Bank and the World Health Organization, 2010) While still in its infancy, REDACS (established in 2008 to replace the previ-ous Latin America and Caribbean NHA network) has plans to include the United States and Canada in its networks so that countries in Latin America and the Caribbean can learn from the experiences of countries that have more experience in institutionalizing NHA (Rathe, 2010)
• Serve as hub or repository for data and best practices Regional agencies also have the potential to gather evidence on regional and global best practices on NHA insti-tutionalization and share these with member countries They can further assist members in conducting country assessments and developing implemen-tation plans for institutionalization In
particular, APNHAN has organized tech-nical sessions to facilitate the sharing of country experiences in NHA estimation, and to share best practices in estimating households’ out-of-pocket expenditures (Box 6 5) Under the APNHAN network, experts reviewed current methods and best practices for estimating these expen-ditures and made recommendations for improving and harmonizing estimation in future This has helped to improve data quality among countries within the region
• Provide cost-efficient technical assistance with regional expertise Regional agencies can also be used to generate cost savings for countries by creating a pool of regional consultants to provide technical assis-tance and expertise This pool of experts can facilitate recruitment of staff needed for production In particular, regional consultants can support countries just embarking on NHA at costs lower than that of international consultants They can also be effective in identifying data sources, coaching local staff, and man-aging local consultants with their knowl-edge about local data system in a com-mon, local language For example, within the Euro-Asia network, regional consul-tants were sent to Belarus to guide NHA production, identify data sources, exam-ine national health statistics systems and highlight ways to improve the existing system The consultants helped Belarus to create a NHA database and worked to improve data quality In Uzbekistan, a regional consultant worked closely with the leader of a local working group and effectively helped her to identify options for efficient data collection and commu-nicate with local consultants in the local language The REDACS network (for-merly LAC) has also been able to improve the cost effectiveness of NHA production for member countries in building a data repository for countries to access at the

78 | Where Is the Money and What Are We Doing with It?
regional-level in the event that they need technical assistance (Rathe, 2010)
Challenges to materializing the value-add of regional agenciesWhile regional agencies can add value, they require substantive financial commitments and a sound governance structure and coor-dinating body to support activities at coun-try-level These are discussed in turn below:
• Financial commitments. Regional agen-cies often lack adequate financing to sup-port their work In particular, financial sustainability remains a concern for the regional NHA networks Networks have typically been supported by donors, as countries have been unable to contrib-ute to the financial costs the networks require For example, with respect to the
Euro-Asia network, member countries themselves (with the exception of Russia and possibly others) have few resources to support the network given limited domes-tic budgets This calls in question the sus-tainability of the network in the absence of sustained donor funding
An alternative is to pursue innovative financing solutions to support regional NHA activities For example, networks can incorporate NHA activities into dis-ease-specific studies, or loans and grants related to health system strengthening This approach would further align NHA with policy making and broader reform issues Another approach is piggy-backing on NHA-related discussions with other forums where similar people are likely to be present (e g , the International Health
NHA have facilitated analytical work on health financing, particularly in the Asia-Pacific region. One example is the Equity in Asia-Pacific Health Systems (Equitap) network a collaborative effort of more than 21 research teams in the Asia-Pacific region engaged in examining equity in national health systems in the Asia-Pacific region. Equitap was originally established as an initiative of the Asia-Pacific National Health Accounts Network (APNHAN), in collaboration with Erasmus University (The Netherlands) and The London School of Economics (United Kingdom), (Equitap, 2005). Equitap’s original founder members were NHA teams who wanted to extend their NHA work to examine how health financing flows were distributed across their populations.
The Equitap network undertakes regular inter-country analyses of benefit incidence, progressivity of health financing, and the catastrophic impact of health financing. Specifically, Equitap has assessed the benefit inci-dence of public health care subsidies, exploiting detailed health accounts data to allow for variation in unit expenditures across health services, facilities and regions. Equitap research has shown that Hong Kong SAR achieves one of the most pro-poor distributions of all public health expenditures in the world, whereas pub-lic health care spending is moderately pro-poor in Malaysia and Thailand, and evenly distributed in Sri Lanka (O’Donnell et al, 2005b).
In addition, Equitap’s study on the progressivity of health financing illustrated the structure and the distribution of health care financing in 13 Asian territories, combining health accounts and household survey data on house-hold payments to estimate the distribution of health financing. An important finding from this study was that more affluent groups generally contribute more as a proportion of ability-to-pay in low and lower-middle income territories, and that unlike in Europe indirect taxes are universally progressive in developing Asia (O’Donnell et al, 2005a). Moreover, Equitap’s study of the catastrophic impact of health financing on households revealed that, despite the concentration of catastrophic payments on the better-off in the majority of low-income coun-tries, out-of-pocket payments still push many families poverty. In this study, 2.7 percent of the total population was pushed below the poverty threshold of USD $1 per day due to health care payments (van Doorslaer et al, 2005).
Box 6.5. the equity in asia-pacific health Systems (equitap) project
Note: Erasmus University and LSE are no longer members of Equitap. Equitap has built sufficient capacity such that it no longer needs technical assistance.

The Value of Global and Regional Partners | 79
Economics Association meeting typi-cally follows the national health accounts meeting every two years)
For example, a large part of the APNHAN’s funding comes from projects and research grants, as well as some government support APNHAN also receives funds through the Australian Agency for International Development (AusAID), of which a com-ponent is explicitly for APNHAN support; this is currently the largest form of sup-port to APNHAN by an external spon-sor In addition, APNHAN has secured funding from the Rockefeller Foundation and European Union (2001), (PHFI, 2010) Other networks like REDACS are sup-ported by the LAC Health Observatory, launched by Funsalud and the Carlos Slim Institute for Health, which has an agree-ment with the Health Metrics Institute, financed by the Gates Foundation, to launch a series of “research networks” (including REDACS), along with the Harvard School of Public Health Additional funding for REDACS will be obtained through spe-cific projects currently under development In this way, funding for REDACS is tied to broader sources of funding that go beyond NHA so that the network is not solely reli-ant on WHO or member country support (Rathe, 2010)
• Governance and coordination of regional agencies. Regional agencies also require a strong governance structure and coordi-nating body to manage and govern their
activities Governance may require trans-ferring coordination activities to agency members directly, but this may prove dif-ficult given members’ own responsibilities in their respective countries For example, in an effort to hand over leadership from donors to countries in the Euro-Asia net-work, WHO’s Euro office initiated and sponsored a series of smaller working group meetings with the most engaged countries The group has met and dis-cussed specific technical issues and func-tioned as an organizing committee for the network meetings Donors have had dif-ficulty transferring responsibilities, how-ever, as countries have limited time and funds to support the networks Country ownership will become more important as a network strives to move beyond its tra-ditional focus on production to increased demand and use of NHA among member countries; this will require broadening the network’s participants to include pol-icy makers beyond the technical experts who typically attend the network meet-ings (Wilkens, 2010)
Regional activities have proven their value in promoting peer learning and in serving as a repository for knowledge and exper-tise to generate cost efficiencies for member countries However, they also require coun-try ownership and practical plans to support their own financing and governance Further exploration is needed for countries and inter-national development partners alike to make the best use of regional cooperation

81
Conclusion
Country experiences presented in this report demonstrate how National Health Accounts, if translated into relevant policy analyses, can add value to health system design, financ-ing prioritization, and performance monitoring Countries that have institutionalized
NHA have used evidence to reduce the financial burdens borne by households, increase their total health expenditure for wider health care coverage, and identify opportunities to improve cost efficiency in government spending
On the other hand, country experiences also show that a supply-driven model—where the con-nections between production and use have been weak—has limited the potential for NHA to detect resource gaps, inequities and inefficiencies in the health system, and thereby inform pol-icy in a sustained manner
The connection between production and use of NHA can be strengthened through a long-term strategy, developed and owned by the countries and supported by the international commu-nity, which addresses bottlenecks and ensures sustainable investments in the entire cycle of the NHA process For such a strategy to be effective, it will need to include a detailed plan on gov-ernance, capacity building and financing based on a country’s unique resource environment and institutional capacity
It is hoped that the country experiences synthesized in this report will encourage countries and international development partners to plan strategically and advance the journey towards NHA institutionalization in the spirit of genuine partnership and mutual responsibility Routine use of NHA will generate valuable information and evidence base that responds to increasing national and international demands for transparency and accountability in the use of resources
Significant international efforts are being launched to improve transparency and accountabil-ity in the health sector through a more coherent and effective resource tracking approaches Following the 2004 High-Level Forum on the Health MDGs which identified the improvement of information on resource flows as a priority for action, the Global Health Resource Tracking Working Group conducted a series of background analyses and called for a more coherent

82 | Where Is the Money and What Are We Doing with It?
long-term support to improve government budgetary and financial systems in the devel-oping world, including the integration of NHA into policy making (High-Level Forum on the Health MDGs, 2004; Global Health Indicators Working Group, 2007) More recently, the Commission on Information and Accountability for Women’s and Children’s Health developed a framework for improved global reporting, oversight, and accountabil-ity on women’s and children’s health
A synthesis of the country experiences reveals that NHA are moving into a new era—one in which NHA activities can no longer be addressed in isolation, but will need to be undertaken strategically and sustainably as a critical component in a broader resource tracking effort that will inform policy NHA can help countries plan and track the prog-ress of health reforms when they are linked to national policy priorities, such as the expan-sion of health coverage through health insur-ance schemes NHA can serve as an input to key national budgeting and planning tools and processes such as Medium Term Eco-nomic Frameworks and Public Expenditure Reviews Moreover, NHA will continue to be an essential tool to track progress towards
international policy targets and priorities, including the Health MDGs, as highlighted in the recommendations of the Commission on Information and Accountability on track-ing resources and results for maternal and child health indicators
To be effective, the cycle of NHA activities will need to be firmly embedded within the national process for evidence based policy, and owned by all the stakeholders in the sys-tem This will require a fundamental shift in the nature of the partnership among all the stakeholders This partnership starts with national and international leaders commit-ting to mutual accountability in the use of national and international resources towards the goal of improving the performance of health systems and the health outcomes of the populations they serve The journey towards that goal will involve many stake-holders National governments, citizens and civil societies, development partners, and technical agencies all have a stake in ensuring a responsible use of resources Collectively, these actors can ensure an effective use of NHA to improve the performance of a coun-try’s health system, and ultimately, to a better health and well-being of its people

83
References
Alailima, Patricia J , and Faiz Mohideen 1983 Health Sector Commodity Requirements and Expenditure Flows Unpublished report Colombo, Sri Lanka
Alliance 2007 Sound choices: enhancing capacity for evidence-informed health policy Edited by Andrew Green, and Sara Bennett Geneva: WHO
Asian Development Bank (ADB) 2008 “Strengthening Evidence-Based Policy-Making in the Pacific: Support for Development of National Health Accounts ” Technical Assistance Con-sultant’s Report Online, [Available]: http://www.adb.org/Documents/Reports/Consultant/REG/41186/41186–01-reg-tacr-01.pdf [accessed 15 September 2011]
Bredenkamp, Caryn, Wagstaff, Adam, Bilger, Marcel, Buisman, Leander, Prencipe, Leah, and Darwin Young 2011 “Health Equity and Financial Protection in Zambia ” Washington, D C : The World Bank
Carlson, Ken, and Douglas Glandon 2009 Tracking Household Health Expenditures in Devel-oping Countries through Major Population-based Surveys Bethesda, MD: Health Systems 20/20 project, Abt Associates Inc June
Data International, Nepal Health Economics Association, and Institute of Policy Studies 2001 Equity in Financing and Delivery of Health Services in Bangladesh, Nepal and Sri Lanka Colombo, Sri Lanka: Institute for Policy Studies Institute of Policy Studies (2003) “Equi-ty in Financing and Delivery of Health Services in Bangladesh, Nepal, and Sri Lanka ” In A S Yazbeck and D H Peters (eds ), Health Policy Research in Asia: Guiding Reforms and Building Capacity. Washington, D C : The World Bank
Global Health Resource Tracking Working Group 2007 Following the Money: Toward Better Tracking of Global Health Resources, Report of the Global Health Resource Tracking Work-ing Group Center for Global Development May
Gaudin, Sylvestre 2011 “National Health Accounts in Decision Making: Insights from World Bank’s Public Expenditure Reviews and Poverty Assessments ”Draft Prepared for the World Bank September 8, 2011
Goginashvili, Ketevan, and Alexander Turdzlandze 2009 “Institutionalization of National Health Accounts: Experiences from Georgia” Health, Nutrition, and Population. Wash-ington, DC: World Bank
Gottret, Pablo and George Schieber 2006 Health Financing Revisited: A Practitioner’s Guide. Washington, D C : The World Bank
84 | Where Is the Money and What Are We Doing with It?
Government of the Islamic Republic of Af-ghanistan Ministry of Public Health April 2011 National Health Accounts Af-ghanistan 2008–2009: Preliminary Find-ings Kabul, Afghanistan
Health Systems 20/20 2011a National Health Account Production Tool Brochure
Health Systems 20/20 2011b Health Resource Tracker Brochure
High Level Forum on the Health MDGs 2004 Tracking Resources for Global Health: Progress toward a Policy-Responsive Sys-tem Abuja December
Hjortsberg, Catharina 2001 “National Health Accounts – Where are We To-day?” Health Division Document 2001:6 Swedish Development International Co-operation Agency
India MoHFW 2009 National Health Ac-counts India 2004–05 New Delhi, India: Government of India, Ministry of Health and Family Welfare
India MoHFW n d National Rural Health Mission: Meeting People’s health Needs in Rural Areas. Framework for Implementa-tion 2005–2012. New Delhi, India: Minis-try of Health and Family Welfare
Jeong, Hyoung-Sun 2004 “SHA-Based Health Accounts in 13 OECD Countries: Country Studies—Korea, National Health Accounts, 2001 ” OECD Health Technical Papers, No 7, OECD Publishing http://dx.doi.org/10.1787/383072205636
Jordan HHC/General Secretariat 2007 Jor-dan National Health Accounts 2007 Jor-dan High Health Council/General Secre-tariat
Kruise, Ioana L 2009 “Institutionalization of National Health Accounts: The Experi-ence of Madagascar” March11
Lavado, R F , Ulep, V G T and L P Lagrada 2011b “Burden of Health Payments in the Philippines PowerPoint
Musange, Sabine F 2009 Rwandan Nation-al Health Account—Rwanda Case Study June
O’Donnell et al 2005a Who Pays for Health Care in Asia?, Equitap Project Working Paper No 1
O’Donnell et al 2005b Who benefits from public spending on health care in Asia? Equitap Project Working Paper No 3
O’Donnell,et al 2007 “The Incidence of Pub-lic Spending on Healthcare: Comparative Evidence from Asia ” The World Bank Economic Review, 21(1): 93–123
OECD DAC 2008 The Paris Declaration on Aid Effectiveness and the Accra Agenda for Action. Paris: OECD DAC
OECD and World Bank (2008), OECD Re-views of Health Systems Turkey, Paris, OECD
OECD 2010 Health at a Glance: Asia/Pacif-ic 2010 OECD Publishing http://dx doi org/10 1787/9789264096202-en
Nandakumar, Allyala, and Nirmala Ravishan-kar 2011 “The Case for Situation Nation-al Health Accounts within a Broader Re-source Tracking Agenda ” Draft July 14
PHFI (Public Health Foundation of India) 2010 “Institutionalization of Nation-al Health Accounts – Role of Asia-Pacif-ic Regional Network (APNHAN) in Sup-porting Institutionalization Activities ” Unpublished case study commissioned by the World Bank September 2010
Racelis, Rachel H 2008 “National Health Accounts (NHA) Development and In-stitutionalization: Philippines Coun-try Experience ” Unpublished case study commissioned by the World Bank Sep-tember 2008 Available at: http://sitere-sources.worldbank.org/INTHSD/Resour ces/376278–1261143298590/6660179–1276866538484/PhilippinesFULL.pdf [ac-cessed June 1, 2011]
Rajkotia, Yogesh, Mukunizi, Jean-Louis, Ravishankar, Nirmala, and Binagwa-ho, Agnes 2011 “Moving beyond NHA: Resource planning and tracking for im-proved resource management ” In prepa-ration
References | 85
Rannan-Eliya, Ravi P , Claudia Blanco-Vidal, and A K Nandakumar 2000 The Distri-bution of Health Care Resources in Egypt: Implications for Equity. DDM Working Paper Number 81 46 pages Boston, MA: Harvard School of Public Health
Rannan-Eliya, Ravindra P 2009 “Case Study: Mongolia—Institutionalization of Na-tional Health Accounts” Health, Nutri-tion, and Population ADB and WHO Western Pacific Region Office
Rannan-Eliya, Ravindra P 2010 “Develop-ment of A Collaborative Network to Sup-port Institutionalization of Health Ac-counts in Pacific Island Countries: Critical Issues and Options ” 2010 Issues paper ADB and WHO
Rannan-Eliya, R P and L Lorenzoni (2010), “Guidelines for Improving the Com-parability and Availability of Private Health Expenditures Under the System of Health Accounts Framework”, OECD Health Working Papers, No 52, OECD Publishing Available: http://dx.doi.org/ 10.1787/5kmbrcg0clvc-en
Rathe, Magdalena 2010 “Institutionaliza-tion of National Health Accounts (NHA): Role of LAC Regional Network in Sup-porting Institutionalization Activities ” Unpublished
Shiffman, J 2008 “Has Donor Prioritization of HIV/AIDS Displaced Aid for Other Health Issues?” Health Policy and Plan-ning, 23: 95–100
Somanathan, A , Rannan-Eliya, R P , Fernan-do, T , Hossain, N , Mahal, A , Pande, B R , and L Reichenbach 2004 Review of Costs and Financing of Reproductive Health Services. Unpublished report pre-pared for World Bank’s Analytical and Advisory Activity on Better Reproductive Health for Poor Women in South Asia Colombo, Sri Lanka: The World Bank
Tangcharoensathien, Viroj, Chitpranee Vasav-id, Walaiporn Patcharanarumol, Kanja-na Tisayathikom, and Jittraporn Mekkra-
jang December 2008 “Institutionalizing National Health Account: Experiences from Thailand: International Health Poli-cy Program” Health, Nutrition and Popu-lation Washington, DC: World Bank
UN 2011 Keeping Promises, Measuring Re-sults. Geneva: Commission on informa-tion and accountability for Women’s and Children’s Health
Van Doorslaer et al, 2005 “Paying Out-of-pocket for Health Care in Asia: Cata-strophic and Poverty Impact Equitap Project Working Paper No 2
Wagstaff, Adam Bales, Sarah, and Breden-kamp, Caryn 2011 “Module 2a: Benefit Incidence Analysis” PowerPoint presen-tation, presented at World Bank Health Equity and Financial Protection train-ing course Available at: www worldbank org/povertyandhealth
Wagstaff, Adam 2010 “Benefit Incidence Analysis Are Government Health Expen-ditures More Pro-rich Than We Think?” Policy Research Working Paper 5234 De-velopment Research Group, The World Bank;
Wilkens, Jens 2010 “Institutionalization of National Health Accounts (NHA)—Role of Regional Networks in Supporting In-stitutionalization Activities: The Case of the Euro-Asia network, (former CIS net-work)” Unpublished
World Bank 2004 Preparing for Universal Health Insurance in Turkey: Estimation of Costs under Different Scenarios. Wash-ington, D C : The World Bank
World Bank 2008 How Countries Use their Health Expenditure Information: Evi-dence from 80 Countries Washington, D C : The World Bank
World Bank 2010 “The World Bank Survey on Costs of Health Accounting, 2010 ” 2010 Washington, DC: World Bank
World Bank 2011 “Partnership Review Note: Regional Partnership Program on Health System and Policies, P125655 ”
86 | Where Is the Money and What Are We Doing with It?
World Bank 2011 “The World Bank Survey on Financing of Health Accounting, 2011 ” Washington, DC: World Bank
World Bank, WHO and USAID 2003 Guide to Producing National Health Accounts with Special Applications for Low-Income and Middle-Income Countries. Geneva: WHO.
Zainuddin, Jameela 2011 GSAP Financing-Malaysian Perspective. Head of Unit, Ma-laysia National Health Accounts Unit, Planning & Development Division, Min-istry of Health Malaysia

87
Individuals and Organizations Consulted and Providing Inputs
into the Strategic Guide
This Strategic Guide has been developed through a process of consultation with many countries and international development partners; interviews with country producers and policy makers in more than twenty countries; written contributions from country
NHA champions and consultants; online surveys to countries on financing and costing; and through participation at several international conferences and regional consultations Monthly, meetings were held by the NHA Technical Advisory Group, and an extensive consultation pro-cess was held in October 2010 Countries, development partners, and regional country net-works have provided important contributions that reflect their experiences throughout the NHA institutionalization process
international Conferences
International Health Economics Association (iHEA), Beijing, China, July 2009Prince Mahidol Award Conference (PMAC), Bangkok, Thailand, January 2010Global Consultation on the Strategic Guide, Washington DC, USA, October 2010“Where is the Money” Resource Tracking for Better Health Outcomes and Greater Health Sys-
tems Accountability, Geneva, Switzerland, May 2011International Health Economics Association (iHEA), Toronto, Canada, July 2011
Regional Consultations
South and East Asia Region, Delhi, India (December 2008), with Afghanistan, Bangladesh, In-dia, Malaysia, Maldives, Nepal, Pakistan, and Sri Lanka (primarily government officials) participating Development partners that contributed were GTZ (regional office), WHO
88 | Where Is the Money and What Are We Doing with It?
(regional office), The World Bank (head-quarters and regional office)
Latin America Mexico City, Mexico (Janu-ary 2009), with Argentina, Bolivia, Brazil, Costa Rica, Colombia, Dominican Re-public, Ecuador, Mexico, and Peru (LAC Network Countries) participating The development partners participating were Eurostat, OECD, and WHO
Africa, Nairobi, Kenya (April 2009), with Be-nin, Burkina Faso, Côte d’Ivoire, Ethio-pia, Gambia, Kenya, Mauritius, Namibia, Niger, Senegal, Sierra Leone, Tanzania, Zambia, Zimbabwe (government offi-cials and technical experts) participating Development partners that participated were Eurostat, OECD and WHO (coun-try offices)
Europe and Central Asia, Yerevan, Armenia (November 2009), with Armenia, Belar-us, Georgia, Kazakhstan, Kyrgyz Repub-lic, Moldova, Russia, Turkmenistan, and Tajikistan, Ukraine, Uzbekistan (ECSA Network countries) participating Devel-opment partners that participated were USAID, WHO (country and regional of-fices) and The World Bank (Headquarters and country offices)
Country Consultations with Development partners
Bamako, Mali (April 2009), with Mali (rep-resentatives from National Public Health Department, National Statistics and Infor-mation Department, Ministry of Finance, Department of General Budget) and with Afristat, CIDA (Canadian Cooperation Office—Mali), Co-operation Dutch, and WHO (Burkina Faso) participating The World Bank representative was: Ousmane Diadie Haidara
Bogota, Colombia (April 2009, September 2009), with Colombia (Ministry of Social Protection, Department of Planning, De-partment of Statistics Javeriana Univer-
sity), and Mexico (consultant) and with The World Bank (headquarters and coun-try office) participating The World Bank representatives were: Andre Medici, Ma-ria Ariano (consultant), and (Juan Carlos Junca consultant)
Ouagadougou, Burkina Faso (June 2009), with Burkina Faso (Ministry of Health, Ministry of Statistics), Mali (MOH), and Niger (MOH) and with WHO (West Af-rica regional office) participating The World Bank representatives were: Ous-mane Diadie Haidara and Tshiya A Sub-ayi (involved in initial stages)
Ulaanbaatar, Mongolia (July 2009), with Mongolia (Department of Health, De-partment of External Relations and sev-eral other stakeholders) and with WHO (Western Pacific region) participating The World Bank representatives were: Tungalag Chuluun, John C Langenbrun-ner, and Aparnaa Somanathan
Rabat, Morocco (February 2010), with Mo-rocco (Ministry of Health, Ministry of Economy and Finance, Ministry of Plan-ning—Division of Statistics, National Se-curity Fund) and with The World Bank and WHO participating The World Bank representative was: Heba Elgazzar
Accra, Ghana (July 2011), with Ghana (Min-istry of Health, Institute of Statistical, Social and Economic Research) and with WHO (West Africa regional office) and The World Bank (headquarters and country office) participating The World Bank representatives were: Karima Saleh, Akiko Maeda (headquarters) and Marga-reta Harrit (headquarters)
Amman, Jordan (August 2011), with Jordan (High Health Council, Ministry of Fi-nance, Ministry of Health, Ministry of Higher Education, Ministry of Planning and International Collaboration, Min-istry of Social Development, the Royal Medical Services (army), Jordan Univer-sity, Hospital (JUH), King Abdullah Uni-versity Hospital (KAUH), the Food and

Individuals and Organizations Consulted and Providing Inputs into the Strategic Guide | 89
Drug Administration, the Joint Procure-ment Department, Department of Statis-tics, the Private Hospitals Association) and with The World Bank (headquar-ters and country office) participating The World Bank representatives were: Bjorn Ekman (headquarters), Margareta Harrit (headquarters), and Allyala Nandakumar (consultant)
Cairo, Egypt (September 2011), with Egypt and with The World Bank (headquarters and country office) participating Repre-sentatives of The World Bank were: Alaa Mahmoud Hamed, Akiko Maeda (head-quarters), and Margareta Harrit (head-quarters)
Regional Network Study Contributors
Sakthivel Selvaraj (Public Health Foundation of India) from APNHAN
Jeff Tshabalala (Technical Support Director, Health and Development Africa (Pty) from ECSA
Jens Wilkens (Director, Swedish Committee for International Health) from Euro-Asia
Osmat Azzam (Health Economist, Azzam Health International Consulting) from MENA
Magdalena Rathe (Executive Director, Fun-dacion Plenitud) from REDACS
NHA Contributors participating at Consultation (October 2010)
ABAYAWICKRAMA, Muhandiramge Ruk-mal Renuka: Director, Department of Fiscal Policy, Ministry of Finance and Planning, Sri Lanka
ABDIKARIMOVA, Dinara: Deputy Director of Economics and Finance Department, Ministry of Health, Kazakhstan
ABU-ELSAMEN, Taher: Director/Secretary-General, High Health Council, Jordan
ABU-SHAER, Muien Fuad: Technical Offi-cer, High Health Council, Jordan
ALA, Maria Virginia Guzman: Director for Health Policy Development and Plan-ning, Department of Health, Philippines
ALITI, Tom: Principal Finance Officer, Min-istry of Health, Uganda
AUGUSTO, Tomás: Director, Health Eco-nomics, Ministry of Health, Argentina
BARUA, Prasanta Bhushan: Joint Secretary, Health Economics Unit, Ministry of Health and Welfare, Bangladesh
BATA, Pascal Kora: Director of Planning and Programming, Ministry of Health, Benin
BEN MAHMOUD, Mohamed Adel: Minis-try of Public Health, Tunisia
BOUGRINE, Abderrahmane: Division Ad-ministrator, Ministry of Health, Morocco
BRKIC, Miroslav: Economist, Ministry of Fi-nance, Bosnia-Herzegovina
CHANSA, Collins: Chief Planner, Director-ate of Planning & Development, Ministry of Health, Zambia
CHEELO, Caesar: Principal Investigator for the HIV/AIDS Monitor Project, Univer-sity of Zambia, Zambia
CHIMEDDAGVA, Dashzeveg: Economic Pol-icy Advisor, Ministry of Health, Mongolia
CUSTOVIC, Adnan: FBH Health Insurance Fund, Bosnia-Herzegovina
DIOP, Mamadou: Head of Statistics Unit, Ministry of Health, Mali
EGAMOV, Farrukh: Consultant, Health Poli-cy Unit Ministry of Health, Tajikistan
EKOYE, Malam: Secretary General, Ministry of Public Health, Niger
ENCARNACION, Jessamyn: Chief of Pov-erty, Human Development, Labor, and Gender Statistics, National Statistical Co-ordinating Board, Philippines
FARIJI, Khadija: Principal State Engineer, Ministry of Health, Morocco
HAFIZOV, Saydali: Head of Finance and Budget Planning, Ministry of Health, Ta-jikistan
HARRIS, Benedict C : Director, Policy, Plan-ning, and Health Financing Division,
90 | Where Is the Money and What Are We Doing with It?
Ministry of Health and Social Welfare, Liberia
HASHIMI, Mir Najmuddin: NHA Team Member, Ministry of Health, Afghanistan
IQBAL, Mohiburahman: NHA Team Lead, Ministry of Health, Afghanistan
JAMILYA, Avliyakulova: Deputy Head of the National Accounts Department, Minis-try of Health, Uzbekistan
JUMA, Mariam Ally: Head of Health Care Financing, Ministry of Health and Social Welfare, Tanzania
KARADZIC, Irena: Advisor, NHA, Statisti-cal Office of Montenegro (MONSTAT), Montenegro
KHONELIDZE, Irma: Program Manager, Georgia Health and Social Projects im-plementation Center, Georgia
KLIVLEYEV, Rafael: Head of the Division of Economics, Financing and Planning, Ministry of Health, Uzbekistan
KOMARYANI, Kalsum: Head of Health Fi-nancing Division, Center for Health Fi-nancing, Indonesia
KONTOR, Emmanuel Kwakye: Senior Plan-ning Officer, Ministry of Health, Ghana
LANGSAM, Martin Gustavo: Ministry of Economy and Public Finance, Argentina
MABANDI, Leonard: Director of Finance and Administration, Ministry of Health & Child Welfare, Zimbabwe
MAINA, Thomas: Principal of Health Eco-nomics, Ministry of Medical Services, Kenya
MALIKONGWA, Christine: Chief Finance Officer, Ministry of Health, Botswana
MATANGELO, Gérard Eloko Eya: Program Director, NHA, Ministry of Health, DRC
MATHALA, Onkemetsi: Team Leader, NHA, Ministry of Health, Botswana
MBENGUE, Arona: CNS Focal Point, Minis-try of Health, Senegal
MENDIS, Upul Ajith: Director-General, Health Services, Ministry of Health, Sri Lanka
MILUTINOVIC, Ruzica: Department Head, Monitoring the Collection of Compulso-
ry Health Insurance Contributions and NHA, Montenegro National Health In-surance Fund, Montenegro
MWESIGYE, Francis Runumi: Commission-er of Health Services Planning, Ministry of Health, Uganda
NAZAROVA, Zarina: Chief, Department of Finance, Ministry of Health, Kyrgyzstan
NSWILLA, Anna: National Coordinator for District Health Services, Ministry of Health and Social Welfare, Tanzania
NTARE, Charles: Head of Integrated Health Management Information Systems, Min-istry of Health, Rwanda
NURMAMBETOV, Ulan: Deputy General Director, Mandatory Health Insurance Fund, Kyrgyzstan
NZOYA, Dhimn Munguti: Economist, Minis-try of Public Health and Sanitation, Kenya
OPETHA, Pierre Lokadi Otete: Secretary-General, Ministry of Health, DRC
ORSHIKH-ULZII, Kh Ulzii: Officer in Charge of Health Financing, Department of Strategic Planning, Mongolia
OSEI, Dan: Deputy Director for Planning and Budget, Ghana Health Service, Ghana
OUÉDRAOGO, Boureima: Director-Gen-eral, Information and Health Statistics, Ministry of Health, Burkina Faso
ROMARIC, Some Tegwouli: Director of Studies and Planning, Ministry of Health, Burkina Faso
SACHDEVA, Arvinder Singh: Economic Ad-viser: Ministry of Health and Family Welfare, India
SARI, Nelly Mustika: Secretariat-General, Center for Health Financing, Indonesia
SHIFANA, Aishath: Senior Accounts Officer, Ministry of Health, Maldives
SOUIDENE, Mohamed Adel: Ministry of Development and International Cooper-ation, Tunisia
SOUMANA, Sidikou: Director of Planning, Ministry of Public Health, Niger
TAHA, Merivat: Director-General, Depart-ment of Planning, Ministry of Health, Egypt

Individuals and Organizations Consulted and Providing Inputs into the Strategic Guide | 91
TEMIROV, Adyljan: Deputy Director, Health Policy Analysis Centre, Kyrgyzstan
TOKEZHANOV, Bolat: Director of Strategic Development, Ministry of Health, Ka-zakhstan
TURDZILADZE, Alexander: Economist, Georgia
WAGUE, Filyfing Tounkara: Lead, Support Unit of Health Financing and Partner-ship, Ministry of Health, Senegal
YEVIDE, Dorothée: Director of Cabinet, Ministry of Health, Benin
ZAINUDDIN, Jameela: Head of NHA Unit, Ministry of Health, Malaysia
ZOLIA, Yah M : Director, Monitoring & Eval-uation, Ministry of Health and Social Welfare, Liberia
Country Case Study Contributors (2008, 2011)
Ten case studies were commissioned by The World Bank in 2008 (for Ethiopia, Georgia, Guatemala, Indonesia, Madagascar, Mon-golia, Nicaragua, Philippines, Rwanda, and Thailand) These were authored by staff of The World Bank, and by staff of the Health Systems 20/20 project in Ethiopia The studies were summarized with the help of Rubama Ahmed, Vaibhav Gupta, Geir Sølve Sande Lie, and Shubhra Saxena of Columbia Uni-versity under the guidance of Charu Garg In 2011, fifteen case studies were commissioned by The World Bank—several of these built on the 2008 case studies
AHMED, Rubama: USAID Health Systems 20/20 Country Lead, Afghanistan, Global Health & Social Protection, Deloitte Con-sulting LLP, Afghanistan
ALA, Maria Virginia Guzman: Director for Health Policy Development and Plan-ning, Philippines Department of Health, Philippines
ALLY, Mariam: Head of Health Financing Unit, Tanzania Ministry of Health and Social Welfare, Tanzania
ARI, Hakan Oguz: Expert, The Ministry of Health RefiK Saydam Hygiene Center Presidency (RSHCP), School of Public Health, Ankara, Turkey
ASCOBAT Gani: Health Consultant, Profes-sor and Former Dean, School of Public Health, University of Indonesia, Indone-sia
BARIS, Enis: Sector Manager, MNSHD, The World Bank, Jordan
BELAY, Tekabe: Senior Economist, The World Bank, Afghanistan
CHAKRABORTY, Sarbani: Senior Health Specialist, The World Bank, Philippines
CHAWLA, Mukesh: Head of Knowledge, The World Bank , Turkey
HAIDARA, Ousmane Diadie: Health Spe-cialist, The World Bank, Burkina Faso
DIACK, Aissatou: Senior Health Specialist, The World Bank, Mali
DMYTRACZENKO, Tania: Senior Econo-mist, Health, Nutrition & Population, South Asia Region, The World Bank, Sri Lanka
EKAN, Bjorn: Senior Economist, The World Bank, Jordan
ENCARNACION, Jessamyn: OIC Director, Social Statistics Office, National Statisti-cal Coordination Body, Government of the Philippines, Philippines
FRANCISCO, MARIA: Senior Health Advi-sor, Health Systems Team Lead, Office of Population and Health, USAID/Kenya, Kenya
GAJIC-STEVANOVIC, Milena: Head of NHA Office, Serbia Republican Institute of Public Health, Serbia
GOGINASHVILI, Ketevan: Chief Special-ist, Health Policy Division of Health Care Department, Georgia Ministry of Labor, Health, and Social Affairs, Georgia
HAAZEN, Dominic: Sector Manager, The World Bank, Tanzania
HOLT, Ana: Health Specialist, The World Bank, Serbia
HUSEIN, Rozita: Head of the National Health Financing Unit under the Planning &

92 | Where Is the Money and What Are We Doing with It?
Development Division of the Malaysia MOH, Malaysia
IQBAL, Mohiburrahman: NHA Team Lead, Health Economics & Financing Direc-torate, Afghanistan Ministry of Public Health, Afghanistan
JEONG, Hyoung-Sun: Professor, Department of Health Administration, College of Health Science, Yonsei University, Korea
JOHNSTON, Timothy: Senior Health Spe-cialist, The World Bank, Thailand
JUÁREZ, María Fernanda Merino: Senior Health Specialist, Inter-American Devel-opment Bank, Nicaragua
KARANGWA, Michael: Health Systems Strengthening Specialist, USAID/Rwan-da, Rwanda
KONTOR, Emmanuel Kwakye: Senior Plan-ning Officer, Ghana Ministry of Health, Ghana
KRUISE, Ioana L : Former Consultant, The World Bank
LINDELOW, Magnus: Senior Economist, The World Bank, Thailand
MALBROOK, Jean: NHA Focal Point, Econ-omist, Seychelles Ministry of Health, Sey-chelles
MARQUEZ, Patricio: Lead Health Specialist, The World Bank, Turkey
MEKKRAJANG, Jittraporn: National Eco-nomic and Social Development Board, Thailand
MENON, Rehka: Senior Economist, The World Bank, Turkey
MOROSHKINA, Nino: Consultant, The World Bank, Turkey
MUCHIRI, Stephen: Kenya Team Leader for the USAID-funded Health Systems 20/20 project (Kenya)
MUSANGE, Sabine F : Assistant Lecturer, National University of Rwanda School of Public Health, Rwanda
NAGPAL, Somil: Health Specialist, Health Nutrition and Population, South Asia Re-gion, The World Bank, India
NANDAKUMAR, Allyala: Director, Insti-tute for Global Health and Development, Brandeis University, Jordan
NAVARATNE, Kumari Vinodhani: Public Health Specialist, The World Bank, Sri Lanka
OSEI, Dan: Deputy Director for Planning and Budget, Ghana Health Service, Ghana
OSORNPRASOP, Sutayut: Human Develop-ment Specialist, The World Bank, Thai-land
OUEDRAOGO, Boureima: Director-Gen-eral, Information and Health Statistics, Burkina Faso Ministry of Health, Burki-na Faso
PALU, Toomas: Lead Health Specialist, The World Bank, Thailand
PATCHARANARUMOL, Walaiporn: Senior Researcher, IHPP, MOPH, Thailand; and Technical Officer, Department of Health System Financing, WHO, Geneva, Thai-land
PERERA, Susie: Director Policy Analysis & Development, Sri Lanka Ministry of Health, Sri Lanka
POSTOLOVSKA, Iryna: Former Consultant, The World Bank, Turkey
RACELIS, Rachel: Professor, University of the Philippines, Philippines
RACIBORSKA, Dorota: Project Manager, In-ter-American Development Bank, Nica-ragua
RAJKOTIA, Yogesh: Team Leader for Health Systems Strengthening, USAID/Rwanda, Rwanda
RANNAN-ELIYA, Ravindra P : Executive Director & Fellow of the Institute for Health Policy (IHP), Sri Lanka, Indone-sia, and Mongolia
SACHDEVA, Arvinder: Economic Advis-er, India Ministry of Health and Family Welfare, India
SAIF, Jamal Abu: Director of Technical Af-fairs, Studies and Research, High Health Council, Jordan, NHA Focal Point, Jordan

Individuals and Organizations Consulted and Providing Inputs into the Strategic Guide | 93
SALEH, Karima: Senior Economist, The World Bank, Ghana
SHAER, Muien Abu: Chief of Administra-tion Division, Jordan High Health Coun-cil, Jordan
SOMANATHAN, Aparnaa: Senior Econo-mist, The World Bank, Sri Lanka
TAHER, Abu El Samen: Secretary General of High Health Council of Jordan, Jordan
TANGCHAROENSATHIEN, Viroj: Senior Advisor, IHPP, MOPH, Thailand
TEGWOULI, Some: Director of Studies and Planning, Burkina Faso Ministry of Health, Burkina Faso
TISAYATHIKOM, Kanjana: International Health Policy Program, Thailand
TURDZILADZE, Alexander: Economist, Georgia
VALLADARES, Riccardo: Inter-American Development Bank, Guatemala
VASAVID, Chitpranee: Researcher, Interna-tional Health Policy Program, Ministry of Health, Thailand
WORKIE, Netsanet W: Senior Health Econo-mist, The World Bank, Seychelles
ZAINUDDIN, Jameela: Head of Unit, Malay-sia NHA Unit, Planning & Development Division, Malaysia Ministry of Health, Malaysia
ZINE-EDDINE EL-IDRISSI, Driss Mou-lay: Senior Health Specialist, The World Bank, Mali and the Seychelles
Regional-Level Contributors (2011)
HUSAIN, Ishrat: Senior Health Adviser, US Agency for International Development, Africa Bureau, Africa
IRAVA, Wayne: Coordinator, Centre for Health Information, Policy and Systems Research (CHIPSR), Fiji School of Medi-cine, Pacific Islands Network
MARKOVA, Nora: Health Expenditure and Financing Analyst, WHO Barcelona Of-
fice for Health Systems Strengthening, Euro-Asia NHA Network
PELLNY, Martina: Technical Officer Health Services Development and Health Care Financing, World Health Organization, Office for the South Pacific, Pacific Is-lands Network
RANNAN-ELIYA, Ravindra P : Executive Di-rector & Fellow of the Institute for Health Policy (IHP), Sri Lanka, APNHAN NHA Network
Technical Advisory Group Members
AHUJA, Rajeev: Economist, The World Bank
ARIANO, Maria: Consultant, Social Protec-tion (Africa), The World Bank
BELAY, Tekabe: Senior Economist, Health (South Asia), The World Bank
BERMAN, Peter: Lead Economist, Health, The World Bank
BITTMAN, Sarah: Nepal Family Health Program Intern at John Snow, Inc (JSI)
BOROWITZ, Michael: Health Division, OECD
BOS, Eduard: Lead Population Specialist, Health, The World Bank
CHAN, Domin: Research Analyst, Bill & Melinda Gates Foundation
CHARLES, Jodi: Health Systems Advisor, USAID/GH/HIDN/HS
CHAWLA, Mukesh: Sector Manager, Health (Human Development Network), The World Bank
CHULUUN, Tungalag: Operations Officer, Health (East Asia and the Pacific), The World Bank
CONNOR, Catherine: Deputy Director of Operations for Health Systems 20/20 project, Abt Associates
CORNELIUS, Margaret: Program Officer, Global Health Policy and Advocacy, Bill & Melinda Gates Foundation

94 | Where Is the Money and What Are We Doing with It?
COUFFINHAL, Agnes: Senior Health Econ-omist, (Europe and Central Asia), The World Bank
HAIDARA, Ousmane Diadie: Health Spe-cialist (Africa), The World Bank
DMYTRACZENKO, Tania: Senior Econ-omist, Health (South Asia), The World Bank
DUPRIEZ, Olivier: Senior Statistician (DEC), The World Bank
ELGAZZAR, Heba: Economist, Health (Mid-dle East and North Africa),The World Bank
EMREY, Bob: Chief, Health Systems Divi-sion, USAID
EVANS, David: Director, Health Systems Fi-nancing, WHO
FISZBEIN, Ariel: Chief Economist, The World Bank
FORTIN, Henri: Senior Financial Man-agement Specialist (PREM),The World Bank
GLANDON, Douglas: Senior Analyst, Abt Associates
GLASSMAN, Amanda: Senior Social Devel-opment Specialist, IADB
GORDILLO-TOBAR, Amparo: Senior Econ-omist, Health (Latin America and the Caribbean), The World Bank
HANSEN, Keith: Sector Manager, Health (Latin America and the Caribbean), The World Bank
HAY, Phil: Communications Advisor, Health (Network Operations), The World Bank
HERNANDEZ, Patricia: Health Economist, WHO
HUSAIN, Ishrat: Senior Technical Advisor, AFR/SD/HT, USAID
JARAWAN, Eva: Sector Manager, Health (Af-rica), The World Bank
JUAREZ, Maria Fernanda Merino: Senior Protection Specialist, IADB
KAWABATA, Kei: Manager, Social Sector, IADB
KOSTERMANS, Kees: Lead Public Health Specialist (South Asia), The World Bank
KRESS, Daniel: Deputy Director, Global Health Delivery, Bill & Melinda Gates Foundation
LANGENBRUNNER, John C : Lead Econo-mist, Health (East Asia and the Pacific), The World Bank
LEVINE, Ruth: Director of Evaluation, Policy Analysis & Learning, USAID
MAEDA, Akiko: Sector Manager, Health (Middle East and North Africa), The World Bank
SHUKLA, Mahesh: Consultant, The World Bank
MARTIN, Gayle: Senior Economist, Health (Africa), The World Bank
MCCLAUGHLIN, Julie: Sector Manager, Health (South Asia), The World Bank
MEDICI, Andre: Economist, Health (Latin America and the Caribbean), The World Bank
MORGAN, David: Health Accounts, Health Division, OECD
MOUYELO-KATOULA, Michel: Senior Stat-istician (DEC), The World Bank
MUSAU, Stephen: Health Financing Advisor, Abt Associates
NAGPAL, Somil: Health Specialist (South Asia), The World Bank
NANDAKUMAR, Allyala Krishna: Direc-tor, Institute for Global Health & Devel-opment, Brandeis University
PEARSON, Mark: Head of Health Division, OECD
RAVISHANKAR, Nirmala: Senior Associate, Abt Associates
REGALIA, Ferdinando: Social Protection and Health Division Chief, IADB
SCHLEIMANN, Finn: Senior Health Special-ist, The World Bank
SMITH, Owen: Economist, (Europe and Cen-tral Asia), The World Bank
SOMANATHAN, Aparnaa: Economist, Health (East Asia and the Pacific), The World Bank
SOUCAT, Agnes: Former Adviser, Health (Africa), The World Bank

Individuals and Organizations Consulted and Providing Inputs into the Strategic Guide | 95
STEWART, Scott: Senior Technical Adviser, Office of HIV/AIDS, USAID
SWATDISUK, Ploi: Program Manager, US-AID
TANABE, Kimie: Economist (Middle East and North Africa), The World Bank
TANDON, Ajay: Senior Economist, Health (East Asia and the Pacific),The World Bank
TAN-TORRES EDEJER, Tessa: Coordinator, (CEP) (HSF) (HSS), WHO
URIBE, Juan Pablo: Sector Manager, Health (East Asia), The World Bank
VANDEMAELE, Kat: Medical Officer, WHOVERHOEVEN, Marinus: Lead Economist
(PREM),The World BankWAGSTAFF, Adam: Research Manager
(DEC), The World BankWORKIE, Netsanet Waleligh: Senior Econo-
mist, Health (Africa), The World BankYAZBECK, Abdo: Sector Manager, Health
(Europe and Central Asia), The World Bank
ZHAO, Feng: Senior Health Specialist (Afri-ca), The World Bank
ZINE-EDDINE EL-IDRISSI, Driss Moulay: Senior Economist, Health (Africa), The World Bank
ZURITA, Rebeca: Team Leader, Inter-Ameri-can Development Bank
Development partners
ABDIKARIMOVA, Dinara: Deputy Director of Economics and Finance Department, Ministry of Health, Kazakhstan
ABU-ELSAMEN, Taher: Director/Secretary-General, High Health Council, Jordan
ABU-SHAER, Muien Fuad: Technical Offi-cer, High Health Council, Jordan
AHMED, Rubama: Country Lead, Glob-al Health & Social Protection, USAID Health Systems 20/20, Deloitte Consult-ing LLP
AHUJA, Rajeev: Economist, (South Asia) The World Bank
ALA, Maria Virginia Guzman: Director for Health Policy Development and Plan-ning, Department of Health, Philippines
ALITI, Tom: Principal Finance Officer: Min-istry of Health: Uganda
APPELT, Bernd: Principal Advisor, GTZARIANO, Maria: Consultant, Social Protec-
tion, The World Bank, AfricaASHBOURNE, Elizabeth J : Senior Opera-
tions Officer, The World BankAUGUSTO, Tomás: Director, Health Eco-
nomics, Ministry of Health, ArgentinaAVDEEVA, Olga: M&E Unit, The Global
FundBARUA, Prasanta Bhushan: Joint Secretary,
Health Economics Unit, Ministry of Health and Welfare, Bangladesh
BATA, Pascal Kora: Director of Planning and Programming, Ministry of Health, Benin
BAYARSAIKHAN, Dorjsuren: Regional Ad-viser in Health Care Financing at the WHO, Regional Office for Western Pacif-ic Region based in Manila, Philippines
BELAY, Tekabe: Senior Economist, Health, The World Bank, South Asia
BEN MAHMOUD, Mohamed Adel: Ministry of Public Health, Tunisia
BERMAN, Peter: Adjunct Professor, Health, Harvard School of Public Health
BHAWALKAR, Manjiri: Senior Technical Officer, The Global Fund
BITTMAN, Sarah: Family Health Program Intern at John Snow, Inc (JSI), USAID, Nepal
BOS, Eduard: Lead Population Specialist, Health, The World Bank
BOUGRINE, Abderrahmane: Division Ad-ministrator, Ministry of Health, Morocco
BRKIC, Miroslav: Economist, Ministry of Fi-nance, Bosnia-Herzegovina
CAVE, William: System Administrator of Health Accounts, Statistics Directorate, OECD
CHANSA, Collins: Chief Planner, Director-ate of Planning & Development, Ministry of Health, Zambia

96 | Where Is the Money and What Are We Doing with It?
CHARLES, Jodi: Health Systems Advisor, the Office of Health, Infectious Diseases and Nutrition, USAID
CHAWLA, Mukesh: Head of Knowledge, The World Bank, Turkey
CHEELO, Caesar: Principal Investigator for the HIV/AIDS Monitor Project, Univer-sity of Zambia, Zambia
CHIMEDDAGVA, Dashzeveg: Economic Pol-icy Advisor, Ministry of Health, Mongolia
CHULUUN, Tungalag: Operations Officer (East Asia and the Pacific), Health, The World Bank,
CLEMENTS, Ben: Fiscal Affairs, IMFCORNELIUS, Margaret: Program Officer,
Global Health Policy and Advocacy, Bill & Melinda Gates Foundation
COUFFINHAL, Agnes: Senior Economist, The World Bank, South Asia
CUSTOVIC, Adnan: FBH Health Insurance Fund, Bosnia-Herzegovina
HAIDARA, Ousmane Diadie: Health Special-ist, The World Bank, Burkina Faso
DIOP, Mamadou: Head of Statistics Unit, Ministry of Health, Mali
DIPPELSMAN, Robert: Statistics Depart-ment, IMF
DMYTRACZENKO, Tania: Senior Econo-mist, Health, The World Bank, South Asia
DUPRIEZ, Olivier: Senior Statistician (DEC), The World Bank
DZIOBEK, Claudia: Division Chief, Data Dis-semination Standards Division, Statistics Department, IMF
EGAMOV, Farrukh: Consultant, Health Poli-cy Unit, Ministry of Health, Tajikistan
EKOYE, Malam: Secretary General, Ministry of Public Health, Niger
ZINE-EDDINE EL-DRISSI, Driss Moulay: Senior Economist, Health, The World Bank, Africa
ELGAZZAR, Heba: Economist, Health, The World Bank, Middle East and North Af-rica
EMERY, Bob: Health Systems Division Chief, USAID
ENCARNACION, Jessamyn: Chief of Poverty, Human Development, Labor, and Gender Statistics, National Statistical Coordinat-ing Board, Philippines
EVANS, David: Director, Health Systems Fi-nancing, WHO
FARIJI, Khadija: Principal State Engineer, Ministry of Health, Morocco
FIFE, Paul: Director, Department of Global Health, Education and Research, NORAD
FISZBEIN, Ariel: Chief Economist, The World Bank
FORTIN, Henri: Senior Financial Manage-ment Specialist (PREM), The World Bank
GALEMA, Anno: Senior Health Advisor, De-partment Head, Division of Health and AIDS, Department for Social Develop-ment, Netherlands Ministry of Foreign Affairs
GARDEN, Bjarne: Assistant Director, Depart-ment of Global Health, Education and Re-search NORAD
GARG, Charu: Senior Health Economist, WHO
GLASSMAN, Amanda: Senior Social Devel-opment Specialist, IADB
GORDILLO-TOBAR, Amparo: Senior Econ-omist, Health, The World Bank, Latin America and the Caribbean
GREENFIELD, Joanne: Maternal and Child Health Adviser, AusAID
GUPTA, Sanjeev: Deputy Director, Fiscal Af-fairs Department, IMF
GUPTA, Vaibhav: Officer on Special Duty at Ministry of IT and Communications, Government of India
HAFIZOV, Saydali: Head of Finance and Bud-get Planning, Ministry of Health, Tajikistan
HARRIS, Benedict C : Director, Policy, Plan-ning, and Health Financing Division, Ministry of Health and Social Welfare, Liberia
HASHIMI, Mir Najmuddin: NHA Team Member, Ministry of Health, Afghanistan
HERNANDEZ, Patricia: Health Economist, WHO

Individuals and Organizations Consulted and Providing Inputs into the Strategic Guide | 97
HUSAIN, Ishrat: Senior Health Adviser, Afri-ca Bureau, USAID
IMASHEVA, Aizhan: Managing Director, Kazakhstan Development Bank,
INGVAR, Theo: Senior Adviser, Department for Global Health Education and Re-search, Global Health Section, NORAD
IQBAL, Mohiburahman: NHA Team Lead, Ministry of Health, Afghanistan
JAMILYA, Avliyakulova: Deputy Head of the National Accounts Department, Minis-try of Health, Uzbekistan
JONES, Gary: Senior Economist, Govern-ment Finance Division, Statistics Depart-ment, IMF
JUÁREZ, María Fernanda Merino: Senior Health Specialist, IADB
JUMA, Mariam Ally: Head of Health Care Financing, Ministry of Health and Social Welfare, Tanzania
KAMPHUIS, Monique: Senior Health Advi-sor, Ministry of Foreign Affairs, Nether-lands
KARADZIC, Irena: Advisor, NHA, Statisti-cal Office of Montenegro (MONSTAT), Montenegro
KAWABATA, Kei: Manager, Social Sector IADB
KHETRAPAL, Sonalini: Junior Professional Associate, The World Bank
KHONELIDZE, Irma: Program Manager, Georgia Health and Social Projects Im-plementation Center, Georgia
KLIVLEYEV, Rafael: Head of the Economics, Financing and Planning Division, Minis-try of Health, Uzbekistan
KOMARYANI, Kalsum: Head of Health Fi-nancing Division, Center for Health Fi-nancing, Indonesia
KONTOR, Emmanuel Kwakye: Senior Plan-ning Officer, Ministry of Health, Ghana
KOSTERMANS, Kees: Lead Public Health Specialist (South Asia), The World Bank
KRESS, Daniel: Deputy Director, Global Health Policy and Advocacy, Bill & Me-linda Gates Foundation
KUTZIN, Joseph: Head, WHO Barcelona Of-fice for Health Systems Strengthening
LANGENBRUNNER, John C : Lead Econo-mist, Health, The World Bank, East Asia and the Pacific
LANGSAM, Martin Gustavo: Ministry of Economy and Public Finance, Argentina
LEVINE, Ruth: Director of Evaluation, Policy Analysis & Learning, USAID
LIE, Geir Sølve Sande: Junior Professional Associate, The World Bank
LORENZETTI, Lara: Associate Analyst, Abt Associates
MABANDI, Leonard: Director of Finance and Administration, Ministry of Health & Child Welfare, Zimbabwe
MAEDA, Akiko: Sector Manager, Health, The World Bank, Middle East and North Af-rica
MAINA, Thomas: Principal Health Econom-ics, Ministry of Medical Services, Kenya
MALIKONGWA, Christine: Chief Finance Officer, Ministry of Health, Botswana
MARTIN, Gayle: Senior Economist, The World Bank
MATANGELO, Gérard Eloko Eya: Program Director, NHA, Ministry of Health, DRC
MATHALA, Onkemetsi: Team Leader, NHA, Ministry of Health, Botswana
MBENGUE, Arona: NHA Focal Point, Min-istry of Health, Senegal
MCLAUGHLIN, Julie: Sector Manager, Health, The World Bank, Middle East and North Africa
MEDICI, Andre: Economist, Health, The World Bank, Latin America and the Ca-ribbean
MENDIS, Upul Ajith: Director-General, Health Services, Ministry of Health, Sri Lanka
MILUTINOVIC, Ruzica: Department Head, Monitoring the Collection of Compulso-ry Health Insurance Contributions and NHA, Montenegro National Health In-surance Fund, Montenegro
MOLIN, Anders: Lead Health Expert, SIDA
98 | Where Is the Money and What Are We Doing with It?
MWESIGYE, Francis Runumi: Commission-er of Health Services Planning, Ministry of Health, Uganda
NAGPAL, Somil: Health Specialist, Health Nutrition and Population, The World Bank, South Asia Region
NAZAROVA, Zarina: Chief, Department of Finance, Ministry of Health, Kyrgyzstan
NORA, Markova: Health Expenditure and Financing Analyst, WHO Barcelona Of-fice for Health Systems Strengthening, WHO Euro-Asia NHA Network
NSWILLA, Anna: National Coordinator for District Health Services, Ministry of Health and Social Welfare, Tanzania
NTARE, Charles: Head of Integrated Health Management Information Systems, Min-istry of Health, Rwanda
NURMAMBETOV, Ulan: Deputy General Director, Mandatory Health Insurance Fund, Kyrgyzstan
NZOYA, Dhimn Munguti: Economist, Min-istry of Public Health and Sanitation, Ke-nya
OPETHA, Pierre Lokadi Otete: Secretary-General, Ministry of Health, DRC
ORSHIKH-ULZII, Kh Ulzii: Officer in Charge of Health Financing, Department of Strategic Planning, Mongolia
OSEI, Dan: Deputy Director for Planning and Budget, Ghana Health Service, Ghana
OUÉDRAOGO, Boureima: Director-Gen-eral, Information and Health Statistics, Ministry of Health, Burkina Faso
POLETTI, Timothy: Health Advisor, AusAIDRENUKA, Muhandiramge Rukmal Abayaw-
ickrama: Director, Department of Fiscal Policy, Ministry of Finance and Planning, Sri Lanka
ROMARIC, Some Tegwouli: Director of Studies and Planning, Ministry of Health, Burkina Faso
SACHDEVA, Arvinder Singh: Economic Adviser, Ministry of Health and Family Welfare, India
SALEHI, Hossein: Regional Advisor, WHO, Egypt
SARI, Nelly Mustika: Secretariat-General, Center for Health Financing, Indonesia
SCHLEIMANN, Finn: Senior Health Special-ist, The World Bank
SHAKARISHVILI, George: Senior Advisor, Health Systems, The Global Fund
SHIFANA, Aishath: Senior Accounts Officer, Ministry of Health, Maldives
SHUKLA, Mahesh: Consultant, The World Bank
SINGH, Alaka: Health Care Financing Unit, WHO SEARO, New Delhi
SLATYER, Beth: Health Adviser, AusAIDSMITH, Owen: Economist, The World Bank,
Europe and Central AsiaSOMANATHAN, Aparnaa: Senior Econo-
mist, The World Bank, Sri LankaSØNDERSTRUP, Esben: Chief Health Advis-
er, DANIDASOUCAT, Agnes: Former Adviser, Health,
The World Bank, AfricaSOUIDENE, Mohamed Adel: Ministry of
Development and International Cooper-ation, Tunisia
SOUMANA, Sidikou: Director of Planning Ministry of Public Health, Niger
SOUMARE, Alice: Regional Office for Afri-ca, WHO
STRUCK, Bernd: Advisor, National Health Accounts, Pakistan Office, GTZ
SUAREZ, Ruben: Regional Advisor, Health Economics and Financing, PAHO/WHO
TAHA, Merivat: Director-General, Depart-ment of Planning, Ministry of Health, Egypt
TANABE, Kimie: Economist, The World Bank, Middle East and North Africa
TANDON, Ajay: Senior Economist, Health, The World Bank, East Asia and the Pacif-ic
TAN-TORRES EDEJER, Tessa: Coordinator, (CEP) (HSF) (HSS), WHO
TEMIROV, Adyljan: Deputy Director, Health Policy Analysis Centre, Kyrgyzstan
TOKEZHANOV, Bolat: Director of Strategic Development, Ministry of Health, Ka-zakhstan
Individuals and Organizations Consulted and Providing Inputs into the Strategic Guide | 99
TURDZILADZE, Alexander: Economist, Georgia
URIBE, Juan Pablo: Sector Manager, Health, The World Bank, East Asia
VAN DE MAELE, Nathalie: HSS/CEP/NHA, WHO
VERHOEVEN, Marinus: Lead Economist (PREM), The World Bank
WAGSTAFF, Adam: Research Manager (DEC), The World Bank
WAGUE, Filyfing Tounkara: Lead, Support Unit of Health Financing and Partner-ship, Ministry of Health, Senegal
WORKIE, Netsanet Waleligh: Senior Econo-mist, Health, The World Bank, Africa
YAZBECK, Abdo: Sector Manager, Health, The World Bank, Europe and Central Asia
YEVIDE, Dorothée: Director of Cabinet, Ministry of Health, Benin
ZAINUDDIN, Jameela: Head of NHA Unit, Ministry of Health, Malaysia
ZOLIA, Yah M : Director, Monitoring & Eval-uation, Ministry of Health and Social Welfare, Liberia


101
Appendix Contents
A. NHA in Brief
A1 Overview of National Health AccountA2 Overview of A System of Health Account 2011
B. NHA Toolkits
PlanningB1 Country Planning Tool ExamplesB2 Country Assessment ToolB3 Sample Indicators to Measure NHA Institutionalization
Production/TranslationB4 National Health Account Production ToolB5 Health Resource TrackerB6 Suggested List of Basic Indicators in NHAB7 Suggested additional questions to DHSB8 ADePTB9 Health System Financing Profile
C. Other Documents
C1 Literature review on NHA InstitutionalizationC2 Survey Questionnaire for the World Bank Survey on Costs of Health Accounting, 2010C3 Survey Questionnaire for the World Bank Survey on Financing of Health Accounting, 2011


103
Appendix A. NHA in Brief
A1. An Overview of National Health Accounts
NHA are a tool designed to assist policy makers in their efforts to understand their health sys-tems and to improve health system performance (WHO, 201154)
NHA constitute a systematic, comprehensive, and consistent monitoring of resource flows in a country’s health system for a given period and reflect the main functions of health care financ-ing: resource mobilization and allocation; pooling and insurance; purchasing of care; and the distribution of benefits (WHO, 201155)
NHA can help identify expenditure gaps and assess the performance of a health system in terms of inputs related to health outputs and outcomes NHA go beyond the provision of esti-mates for the resource input envelope, and also enables an assessment of the extent to which resources may be misallocated
What Questions Can NHA Answer?
NHA can answer key policy questions, including:
• Where do the resources come from?• Where do the resources go?• What kinds of services and goods do they purchase?• Who provides what services?• What inputs are used for providing services?• Whom do they benefit?
54 Available at: http://www.who.int/nha/what/en/index.html55 Available at: http://www.who.int/nha/what/en/index.html

104 | Where Is the Money and What Are We Doing with It?
What Boundaries Does NHA include?
National health expenditure encompasses all expenditures for activities whose primary purpose is to restore, improve and maintain health during a defined period of time This definition applies regardless of the type of the institution or entity providing or paying for the health activity In addition to the above, NHA are comparable across time and space, allowing evaluation of changes in health expenditure over the years and of differences in experience among different geopolitical entities 56
What are the Six Key Dimensions of NHA?
NHA comprise data tables that enable sys-tematic tracking of the flow of resources in a country’s health system (Figure A 1) NHA takes into account both public and private sector activities in health, and are a key input in the design, implementation, and evaluation of health policies
Financing sources – defined as resources that enter initially into the health system for health goods and services, whether from tax-based, social security, other private entities such as firms, NGOs, households, or other entities (principally funding from external resources)
Financing agents – defined as institutions receiving and managing funds from financ-ing sources to pay for or purchase health goods and services, including social security schemes, ministries of health, medical pri-vate insurance, NGOs and firms Households, who bear a large share of the total health bill, are added to round-up to total expenditure although they do not exert an intermediary function
Providers – defined as entities who receive financial resources and use those resources to produce health goods and services, include public and private hospitals, clinics, nursing homes, community health centers, private practices, etc
Functions – defined as the categories of goods and services consumed, include inpatient services, ambulatory services, public health interventions, etc Health-related functions, part of the total, refer to investment, training and R&D
Cost of Factors of Production (often referred to as “line items”) – defined as the type of resources allocated to health care It includes variables such as labor, drugs and pharma-ceuticals, medical equipment, etc
Beneficiaries – defined through distributional tables in which the value of goods and services produced are classified according to: geo-graphic boundaries, demographic character-istics, economic strata and disease categories/interventions
A2. An Overview of A System of Health Accounts 2011
As demands from analysts and policy-mak-ers for more comparable, more detailed and more policy relevant health expenditure and financing information increase, more coun-tries implement and institutionalize health accounts Health accounts provide a system-atic description of the financial flows related to the consumption of health care goods and services
56 Available at: http://www.who.int/nha/what/en/index.html
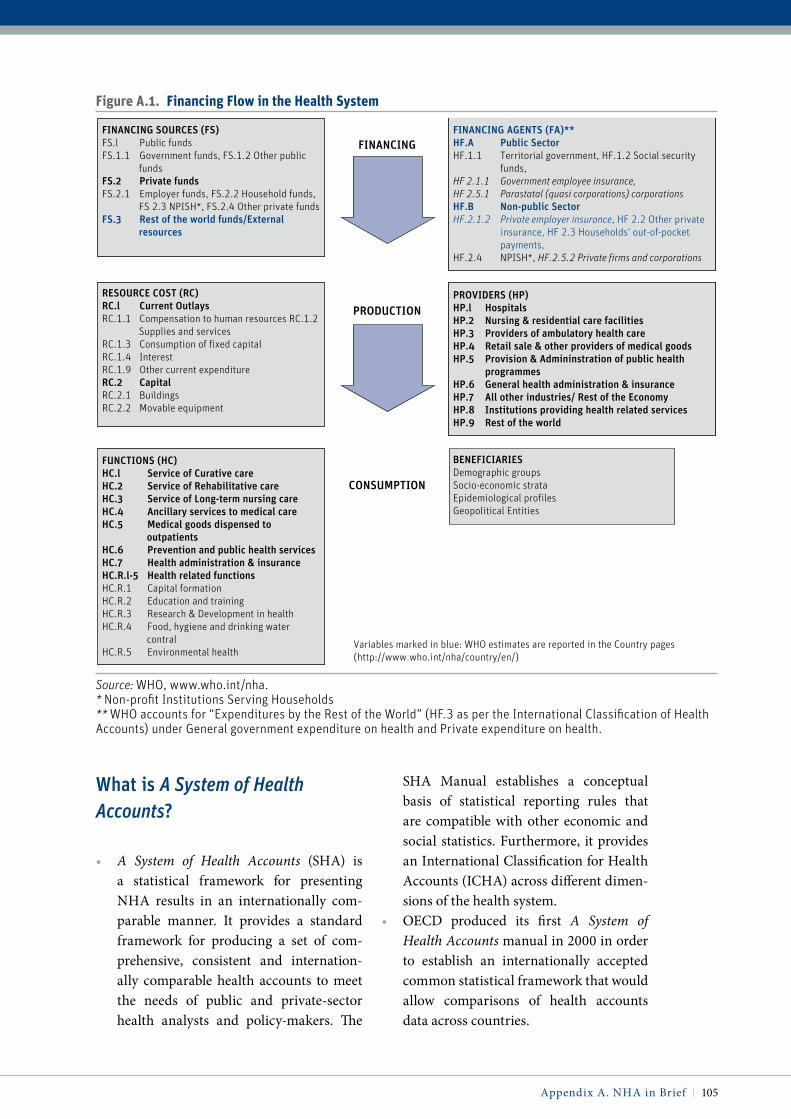
Appendix A NHA in Brief | 105
What is A System of Health Accounts?
• A System of Health Accounts (SHA) is a statistical framework for presenting NHA results in an internationally com-parable manner It provides a standard framework for producing a set of com-prehensive, consistent and internation-ally comparable health accounts to meet the needs of public and private-sector health analysts and policy-makers The
SHA Manual establishes a conceptual basis of statistical reporting rules that are compatible with other economic and social statistics Furthermore, it provides an International Classification for Health Accounts (ICHA) across different dimen-sions of the health system
• OECD produced its first A System of Health Accounts manual in 2000 in order to establish an internationally accepted common statistical framework that would allow comparisons of health accounts data across countries
Figure a.1. Financing Flow in the health System
FINANCING
PRODUCTION
CONSUMPTION
FINANCING SOURCES (FS)FS.l Public fundsFS.1.1 Government funds, FS.1.2 Other public
fundsFS.2 Private fundsFS.2.1 Employer funds, FS.2.2 Household funds,
FS 2.3 NPISH*, FS.2.4 Other private funds FS.3 Rest of the world funds/External
resources
Variables marked in blue: WHO estimates are reported in the Country pages (http://www.who.int/nha/country/en/)
FINANCING AGENTS (FA)**HF.A Public SectorHF.1.1 Territorial government, HF.1.2 Social security
funds, HF 2.1.1 Government employee insurance, HF 2.5.1 Parastatal (quasi corporations) corporationsHF.B Non-public SectorHF.2.1.2 Private employer insurance, HF 2.2 Other private
insurance, HF 2.3 Households' out-of-pocket payments,
HF.2.4 NPISH*, HF.2.5.2 Private firms and corporations
PROVIDERS (HP)HP.l HospitalsHP.2 Nursing & residential care facilitiesHP.3 Providers of ambulatory health careHP.4 Retail sale & other providers of medical goodsHP.5 Provision & Admininstration of public health
programmesHP.6 General health administration & insuranceHP.7 All other industries/ Rest of the EconomyHP.8 Institutions providing health related servicesHP.9 Rest of the world
BENEFICIARIESDemographic groupsSocio-economic strataEpidemiological profilesGeopolitical Entities
RESOURCE COST (RC)RC.l Current OutlaysRC.1.1 Compensation to human resources RC.1.2
Supplies and servicesRC.1.3 Consumption of fixed capitalRC.1.4 InterestRC.1.9 Other current expenditureRC.2 CapitalRC.2.1 BuildingsRC.2.2 Movable equipment
FUNCTIONS (HC)HC.l Service of Curative careHC.2 Service of Rehabilitative careHC.3 Service of Long-term nursing careHC.4 Ancillary services to medical careHC.5 Medical goods dispensed to
outpatients HC.6 Prevention and public health services HC.7 Health administration & insuranceHC.R.l-5 Health related functionsHC.R.1 Capital formationHC.R.2 Education and trainingHC.R.3 Research & Development in healthHC.R.4 Food, hygiene and drinking water
contralHC.R.5 Environmental health
Source: WHO, www.who.int/nha.* Non-profit Institutions Serving Households** WHO accounts for “Expenditures by the Rest of the World” (HF.3 as per the International Classification of Health Accounts) under General government expenditure on health and Private expenditure on health.

106 | Where Is the Money and What Are We Doing with It?
How do National Health Accounts and A System of Health Accounts Differ?
• NHA is a generic methodology for health expenditure analysis, and does not imply any particular statistical framework Historically, NHA estimates were pro-duced using accounting categories and boundaries that reflected the particu-lar structure of the national health sys-tems, and were not necessarily comparable across countries Since the introduction of A System of Health Accounts by OECD, almost all OECD member countries now report their NHA numbers using the SHA statistical framework While many non-OECD countries continue to produce NHA using their own classifications, an increasing number are beginning to apply the same statistical framework for inter-national comparability (some countries conduct dual reporting—presenting one according to local classifications, and the other according to SHA for international purposes)
• As a statistical framework, SHA does not provide guidance on how to collect data or calculate the numbers To fill this meth-odological gap, the World Bank, WHO and USAID led the work on the Guide to Producing National Health Accounts, 2003. This NHA Producer’s Guide was developed primarily to provide produc-ers of health accounts with a step-by-step approach to collecting and calculat-ing the numbers It should be emphasized that the NHA Producer Guide does not offer an alternative statistical framework to SHA; in fact, the Guide endorses SHA as the statistical format for international comparison, and follows the same guid-ing principles as the SHA
Why Was a Revised A System of Health Accounts Necessary?
• Across the globe, health systems have been constantly changing and evolving with the introduction of new technologies, organizational reforms, and demographic changes, and the demands on the SHA have also been changing over the years
• A System of Health Accounts 2011 is the result of a four-year collaborative effort between OECD, WHO and the European Commission, and attempts to update the SHA to better meet the evolving needs and demands from a wide range of coun-tries The SHA 2011 Manual takes into account the range of health care systems around the globe with very different orga-nizational and financing arrangements
• It has been prepared after an extensive consultation process, with hearings held in all regions of the world
• Importantly, it brings together the orig-inal SHA manual with methodological work of the NHA Producer Guide into a single framework to be able to track resource flows through the health system from sources to uses
How Will SHA 2011 Be used?
• Essentially, SHA 2011 is a statistical ref-erence manual, setting out in detail the boundaries, the definitions and the con-cepts, and responding to all health sys-tems around the globe—from the simplest to the more complicated
• It is not a set of guidelines for produc-ing health accounts and, critically, it does not prescribe the level of detail of data that should be collected Rather, the man-ual should be used as a reference and as a source of definitions to help statisticians facing particularly complex issues

Appendix A NHA in Brief | 107
• Like any statistical manual, countries will find different aspects of it more useful than others It is up to each country to apply parts that are most relevant to their own circumstances and adapt its application to their individual needs and capacities
is SHA 2011 Complicated?
• Efforts have been made to ensure that the SHA 2011 Manual is considerably clearer than the 2000 version Many concepts have been clarified and many examples have been included
• SHA 2011 follows exactly the same ap-proach as the previous version, in that it is built around the three dimensions of health functions; health providers and health financing
• It is much longer than the previous Man-ual because more materials have been added to cover the needs of health systems around the world with very different or-ganizational and financing arrangements, including countries with complex health systems requiring finer and more detailed definitions and classifications These ad-ditional features will not affect the vast majority of countries which do not re-quire this level of detail
• Pilot exercises by a number of countries have concluded that the new system does not pose any significant new mapping or implementation issues
Does SHA 2011 imply a “One-Size-Fits-All” Approach to Data Collection?
• No Different countries (and different data collections) will want to focus on what matters for the purposes they have in mind
• For instance, many analysts, and not exclusively in lower and middle income countries, may view the tracking of sources of financing as an inherent part of the development of their health accounts, while some higher income countries may place a higher importance on estimations of trade in health care or developing price and volume measures SHA 2011 will help accountants in both cases, but does not require them to invest time and resources in doing something which is of, at best, marginal relevance
• In summary, SHA is intended as a refer-ence guide and a flexible toolkit for the health accountants
Are New Guidelines for producing SHA 2011 also Needed?
• Yes New guidelines for compiling consis-tent overall health expenditures, includ-ing lighter and more rapid methodolo-gies for capacity constrained countries, are necessary The health care financing framework allows for a systematic assess-ment of how finances are mobilized, man-aged and used Accounting tools would allow for improved resource tracking with both domestic financing and external aid and importantly mapping to already established statistical collections on aid flows (OECD CRS)
• Similarly, further guidance for producing disease specific accounts within the over-all health expenditure framework with resources dedicated to piloting in more low income, high aid countries is seen as a priority


109
Appendix B. NHA Toolkits
To help countries to improve and institutionalize the NHA cycle, a number of tools are being developed in consultation with other development partners and agencies The tools introduced below can facilitate countries’ assessment, planning of NHA institutionaliza-
tion activities, improvement in data collection and translation, and their policy use
Planning
B1. Country planning Tool Examples
Several countries have developed long-term institutionalization plans for NHA, based on the framework of NHA cycle This section introduces a sample structure and work plan format for countries to see how they can structure the institutionalization plan
B1.1 Sample structure of a country’s institutionalization strategy (illustrative)
IntroductionGlobal context• Introduce the context of resource tracking initiatives, i e national and international
demands for greater accountability, transparency or specific targets (e g , health insurance reforms, MDGs, tracking results for maternal and child health)
• Adjust the NHA cycle of activities to align with a given country context and priorities including: demand for data by country leaders; production of NHA; dissemination and translation of NHA data; and the use of NHA for policy decisions, and governance struc-ture, capacity, and finance as core elements that influence the performance of the cycle
Country context• Describe brief history, challenges and progress of NHA institutionalization in the country • Analyze the current situation along the framework from governance structure, capacity,
and financing perspectives to identify key issues

110 | Where Is the Money and What Are We Doing with It?
• Production (data collection, data man-agement, validation)
• Translation of data• Dissemination of data• Use and demand for policy making
Institutionalization PlanGoals of institutionalization• Define broad goals of the institutionaliza-
tion with a target time frame
Objectives and actions towards institutionalization• Objectives and an explicit action plan can
be developed for each elements/process of the cycle of the NHA activities; for example (example of a country starting up NHA):• Establish the national NHA gover-
nance structure• Develop core technical capacities in-
country for production and use of NHA• Undertake at least one full round of
the NHA cycle, and prepare a plan for more regular update
• Integrate key aspects of NHA data collection into routine information systems, including national surveys
• Demonstrate the value of NHA to pol-icy makers through specific policy-related analyses
• Effectively disseminate and commu-nicate NHA findings to enhance their use
Arrangement of governance structure• Choose governance model
• Analyze strengths and challenges of each model in country specific context
• Explore approaches to preempt the challenges of the selected model
• Define members, roles, and responsibili-ties of:• Policy Advisory Group• Coordinating Body• Technical Consultative Group
Detailed activities to achieve each objective• Develop key activities to achieve the
defined objectives
Financing plan for the next five years• Cost each activity, and define the cost
sharing between a country and devel-opment partners (who pays what, how much)
1. Demand and use
4. Translation of data anddissemination of specific analysis
• As country leaders make tough trade-offs to ensure an equitable and efficient allocation of scarce health resources, there is a critical need for an evidence base
• Regular use of NHA in policy making contributes to more sophisticated policy analysis
• Sustainable production of data remains a major challenge in many countries, but capacities to produce health accounts have grown significantly in the developing world over the past decade
• Making the collected data available for analysis enhances transparency and—with experience—analysis and insights that inform policy
• In countries that have institutionalized NHA, data are widely disseminated.
• Dissemination takes place at two occasions, (1) when the NHA tables have been produced and (2) after the data has been translated into policy relevant briefs
• The value of NHA data is limited unless used as an evidence base for more informed health financing decisions.
• Country ownership of the translation process allows countries to champion key policy insights, increasing the likelihood that the answers NHA data provide will be used to affect policy
2. Production, data management, and quality assurance
3. Dissemination
Demand and Use
Production
Dissemination
Translationof data
GovernanceCapacityFinance

Appendix B NHA Toolkits | 111
B1.2 Institutionalization Work Plan Sample
Sample for Translation of NHA dataSub ojective 1. Build capacity at nha team to analyze data
Year 1 Year 2 Year 3 Year 4 Year 5Activity Q1 Q2 Q3 Q4 Q1 Q2 Q3 Q4 Q1 Q2 Q3 Q4 Q1 Q2 Q3 Q4 Q1 Q2 Q3 Q41. Train NHA team on data analysis2. Train NHA team on health financing3. Study trip to countries that uses
NHA for planning and budgeting
Sub ojective 2. conduct nha analyses
Year 1 Year 2 Year 3 Year 4 Year 5Activity Q1 Q2 Q3 Q4 Q1 Q2 Q3 Q4 Q1 Q2 Q3 Q4 Q1 Q2 Q3 Q4 Q1 Q2 Q3 Q41. Establish technical committee2. Develop method to conduct study3. Conduct analyses4. Prepare draft report5. Discuss with steering committee
and finalize report6. Prepare policy brief
Sample for Dissemination of NHA dataSub ojective 1. develop nha website
Year 1 Year 2 Year 3 Year 4 Year 5Activity Q1 Q2 Q3 Q4 Q1 Q2 Q3 Q4 Q1 Q2 Q3 Q4 Q1 Q2 Q3 Q4 Q1 Q2 Q3 Q41. Form a committee on website design2. Prepare web design specifications3. Create a website4. Maintain and update the website
Sub ojective 2. organize dissemination events
Year 1 Year 2 Year 3 Year 4 Year 5Activity Q1 Q2 Q3 Q4 Q1 Q2 Q3 Q4 Q1 Q2 Q3 Q4 Q1 Q2 Q3 Q4 Q1 Q2 Q3 Q41. Annual NHA Workshop2. Arrange periodic TV interview about health spending (once a quarter)3. Annual press release on NHA Findings4. Meetings with users to discuss NHA Findings, in regular planing/budgeting meetings
Sub ojective 3. distribute nha report and Findings
Year 1 Year 2 Year 3 Year 4 Year 5Activity Q1 Q2 Q3 Q4 Q1 Q2 Q3 Q4 Q1 Q2 Q3 Q4 Q1 Q2 Q3 Q4 Q1 Q2 Q3 Q41. Distribute NHA report to broad range of stakeholders2. Distribute and present Policy Briefs to policy makers3. Distribute Technical Reports to research institutes and ministries

112 | Where Is the Money and What Are We Doing with It?
B2. Country Assessment Tool
The Country Assessment Tool57 has been developed to test constraints and assess coun-try readiness for NHA institutionalization The tool is structured based on specific com-ponents of NHA institutionalization: gover-nance structure, resources (financial, human resource), data sources and collection, data management, quality and validity, prod-ucts/indicators, and dissemination and use Assessments using the tool will help build a strategic plan for NHA institutionalization with the goal of increasing the availability, quality, value, and use of timely and accurate health information
Objectives
• Support countries in identifying major constraints to NHA institutionalization
• Provide information for baseline and fol-low-up evaluation
• Inform stakeholders about aspects of the NHA—HIS with which they may not be familiar
• Build a consensus to strengthen compo-nents important for institutionalization
• Mobilize joint technical and financial support for implementation of a strategic plan that identifies priority investments during the short (1–2 years), medium (3–5 years), and long term (10 years)
Methodology. Each element is analyzed with the help of questions that have been iden-tified based on the findings of case stud-ies, interviews with stakeholders, and pilot workshops (Figure B 2) This tool can be best filled in a workshop organized with various stakeholders
Results. The tool has yielded critical inputs re-garding areas of weakness for the pilot coun-tries, and subsequently informed the work
plans for institutionalization Summary re-sults from Mali are presented in Figure B 2 2
B3. Sample indicators to Measure NHA institutionalization
A set of 12 qualitative and quantitative indi-cators are set out in Table B 3 1, which have been developed to assess the NHA institu-tionalization status of a country The indica-tors are structured according to four criteria of NHA institutionalization, based on lit-erature reviews and interviews The indica-tors can be used by countries as a checklist to assess the stage they have reached in the pro-cess of institutionalization and the area they could further strengthen
Production/Translation
B4. National Health Account production Tool
The NHA Production Tool is a software tool being developed by the USAID-funded Health Systems 20/20 project with input and support from key NHA stakeholders includ-ing WHO and the World Bank The tool aims to lessen the complexity of the NHA exer-cise by providing step-by-step guidance to in-country NHA teams, thereby reducing the need for technical assistance, increasing local capacity for NHA production, and capturing cost-efficiency 58
57 World Bank 2011 “Country Readiness Tool” available at: http://intranet.worldbank.org/WB-SITE/INTRANET/SECTORS/HEALTHNUTRI-TIONANDPOPULATION/INTHSD/0,,contentMDK:22668361~menuPK:376286~pagePK:210082~piPK:210098~theSitePK:376279~isCURL:Y,00.html58 Health Systems 20/20 2011a “National Health Account Production Tool” Brochure
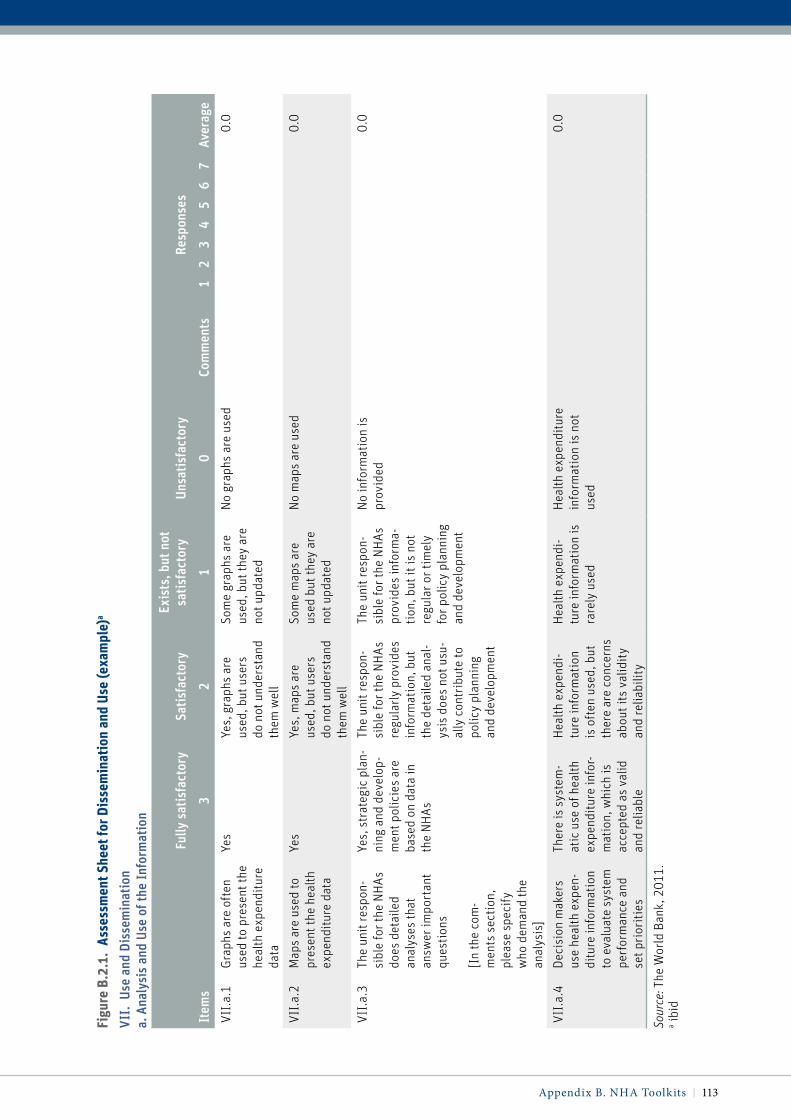
Appendix B NHA Toolkits | 113
Figu
re B
.2.1
. as
sess
men
t She
et fo
r dis
sem
inat
ion
and
Use
(exa
mpl
e)a
vii.
use
and
Dis
sem
inat
ion
a. A
naly
sis
and
use
of th
e in
form
atio
n
Item
s
Fully
sat
isfa
ctor
ySa
tisf
acto
ryEx
ists
, but
not
sa
tisf
acto
ryUn
sati
sfac
tory
Com
men
ts
Resp
onse
s
Aver
age
32
10
12
34
56
7
VII.
a.1
Grap
hs a
re o
ften
us
ed to
pre
sent
the
heal
th e
xpen
ditu
re
data
Yes
Yes,
gra
phs
are
used
, but
use
rs
do n
ot u
nder
stan
d th
em w
ell
Som
e gr
aphs
are
us
ed, b
ut th
ey a
re
not u
pdat
ed
No
grap
hs a
re u
sed
0.0
VII.
a.2
Map
s ar
e us
ed to
pr
esen
t the
hea
lth
expe
nditu
re d
ata
Yes
Yes,
map
s ar
e us
ed, b
ut u
sers
do
not
und
erst
and
them
wel
l
Som
e m
aps
are
used
but
they
are
no
t upd
ated
No
map
s ar
e us
ed0.
0
VII.
a.3
The
unit
resp
on-
sibl
e fo
r the
NH
As
does
det
aile
d an
alys
es th
at
answ
er im
port
ant
ques
tions
[In
the
com
-m
ents
sec
tion,
pl
ease
spe
cify
w
ho d
eman
d th
e an
alys
is]
Yes,
str
ateg
ic p
lan-
ning
and
dev
elop
-m
ent p
olic
ies
are
base
d on
dat
a in
th
e N
HAs
The
unit
resp
on-
sibl
e fo
r the
NH
As
regu
larly
pro
vide
s in
form
atio
n, b
ut
the
deta
iled
anal
-ys
is d
oes
not u
su-
ally
con
trib
ute
to
polic
y pl
anni
ng
and
deve
lopm
ent
The
unit
resp
on-
sibl
e fo
r the
NH
As
prov
ides
info
rma-
tion,
but
it is
not
re
gula
r or t
imel
y fo
r pol
icy
plan
ning
an
d de
velo
pmen
t
No
info
rmat
ion
is
prov
ided
0.0
VII.
a.4
Deci
sion
mak
ers
use
heal
th e
xpen
-di
ture
info
rmat
ion
to e
valu
ate
syst
em
perf
orm
ance
and
se
t pri
oriti
es
Ther
e is
sys
tem
-at
ic u
se o
f hea
lth
expe
nditu
re in
for-
mat
ion,
whi
ch is
ac
cept
ed a
s va
lid
and
relia
ble
Hea
lth e
xpen
di-
ture
info
rmat
ion
is o
ften
use
d, b
ut
ther
e ar
e co
ncer
ns
abou
t its
val
idit
y an
d re
liabi
lity
Hea
lth e
xpen
di-
ture
info
rmat
ion
is
rare
ly u
sed
Hea
lth e
xpen
ditu
re
info
rmat
ion
is n
ot
used
0.0
Sour
ce: T
he W
orld
Ban
k, 2
011.
a ibid

114 | Where Is the Money and What Are We Doing with It?
Key functions of the tool include:
• Step-by-step directions to help guide coun-try teams through the NHA methodology
• Platform to manage complex datasets and reduce the burden of data management
• Survey creator and an import function to streamline the data-collection and data-analysis process
• Built-in auditing function to facilitate re-view, and correction for possible double-counting
• Report generator for simplified NHA ta-ble creation
Figure B.2.2. results of assessment tool for mali (example)a, b
0% 25% 50% 75% 100%
Environment
Resources
Data sources
Data management
Quality, reliability,
Indicators / products
Dissemination & use
Source: The World Bank, 2011a Percentage figures demonstrate the assessment of the achievement in each component. High scores means higher achievement in the component, and the component with the lowest score can be regarded as the bottleneck.b ibid
• Interactive diagram feature to help NHA teams visualize and critically analyze the flow of funding through the health sector
The tool was pilot-tested in Tanzania in August 2011 and is expected to be released in late fall 2011 59
B5. Health Resource Tracker
The Health Resource Tracker is a web-based tool that the Government of Rwanda and the USAID-funded Health Systems 20/20 project are building in collaboration with other stake-holders in Rwanda The tool aims to stream-line the collection of detailed health spend-ing information from government agencies, donors, and NGOs active in the health sector,60 and inform NHA efficiently The tool reduces the burden of reporting and analyzing sur-veys, builds analytical linkages between differ-ent resource tracking exercises (e g , NHA and NASA) to improve policy impact and use, and create a permanent home for resource tracking data 61 The tool was developed in Rwanda and is now been transferred to Kenya
59 ibid60 Rwanda Health Resource Tracker, Available at https://resourcetracking.heroku.com/; Health Systems 20/20 2011b “Health Resource Tracker” Brochure; Rajkotia et al, 2011 61 ibid

Appendix B NHA Toolkits | 115
table B.3.1. indicators to measure nha institutionalization
Criteria for Institutionalization Key Elements Indicators
Type of Indicator
(i) Consistent use of NHA data
Data is effectively dissemi-nated, analyzed, and used
Collected data is available publicly on website
NHA data is analyzed and policy relevant infor-mation is produced
Binary
Binary
NHA data is used for reporting health expendi-tures in government documents every year
Binary
NHA information is used to inform at least one of the following government priorities every year: health policy, budgetary planning, finan-cial sustainability, resource tracking, transpar-ent funding, and efficiency and equity of health spending.
Binary
(ii) Adequate financial, human, and institutional capacity to routinely produce, disseminate, analyze, and use health accounts
NHA is government-man-dated and local capacity exists
Law/regulation/decree mandating production and use
Binary
“Institutional home”* identified for NHA Binary
Government budget earmarked for NHA activities
Skills to produce, analyze, and use health accounts information adequately available in the country
Binary
(iii) Consistent production of NHA data
NHA production is a reg-ular/routine activity, i.e. NHA is produced regularly and data reported annually
Public expenditure data collected and compiled annually
Binary
Private** expenditure data collected at least once every five years and estimated annually
Binary
Minimum set of interna-tionally accepted data is produced
Key health expenditure indicators are produced and reported annually
Binary
(iv) Use of health accounts methodology
An internationally accepted methodology is applied consistently
Data is consistent with NHA boundary definition
Binary
Local classifications are mapped to NHA classifications
Binary
Source: Authors’ analysis.* government agency primarily responsible for production of health accounts** data such as household health expenditure

116 | Where Is the Money and What Are We Doing with It?
Key features of the tool include:
• A dynamic and flexible user interface that donors, NGOs, and government agencies can use to report budgeted and realized expenditures as well as activity descrip-tions for their health programs
• Low maintenance and user-friendly site administration that allows the govern-ment to collect and store annual budget and spending data more efficiently than with paper surveys
• Impactful reporting features that are tied to country priorities and facilitate broad access to data for relevant stakeholders
• Customized data reporting that can inform resource tracking estimations, such as NHA
• Open-source code that can be refined fur-ther in the future and adapted to suit the needs of other countries
B6 Sample List of Basic indicators in NHA
A sample list of basic indicators for NHA is presented in Table B 6 1 Countries can start from this list in building the data format for NHA, collecting the essential data, and then build a more detailed list depending on their available resources

Appendix B NHA Toolkits | 117
table B.6.1. Basic nha indicatorsExpenditure Ratios 1. Total expenditure on health (THE) as % of GDP
Financing Sources Measurement 1. General government expenditure on health (excluding social security funds) as % of THE
2. Private expenditure on health as % of THE
3. External expenditure on health as % of THE
Financing Agents Measurement 1. General government expenditure on health as % of THE
2. Private expenditure on health as % of THE
3. External expenditure on health as % of THE
a. External expenditure on health as % of THE (Direct)b. External expenditure on health as % of THE (channeled to
government)c. External expenditure on health as % of THE (channeled to NGOs)
4. Government expenditures on health (including social security funds) as % of general government expenditure
5. Social security funds as % of general government expenditure on health
6. Private insurance as % of private expenditure on health
7. Out of pocket expenditure as % of private expenditure on health
Selected Per Capita Indicators for Expenditures on Health
1. Total expenditure on health/capita at exchange rate
2. Total expenditure on health/capita at purchasing power parity
3. General government expenditure on health/cap exchange rate
4. General government expenditure on health/cap purchasing power par-ity (NCU per US$)
Expenditures on Health by Providers 1. Hospital expenditures as % of THE
Expenditures on Health by Function 1. Capital expenditures as % of THE
2. Outpatient care expenditures as % of THE
3. Inpatient care expenditures as % of THE
4. Preventive care expenditures as % of THE
Expenditures on Health by Inputs 1. Drug and commodity expenditures as % of THE
2. Health worker expenditures as % of THE
Expenditures on Health by Disease Type Specific to Meeting Health-related MDGs
1. HIV/AIDS expenditures as % of THE
2. Tuberculosis expenditures as % of THE
3. Malaria expenditures as % of THE
4. Newborn and maternal health expenditures as % of THE
5. Reproductive health expenditures as % of THE
Note: Some of these indicators may not be easy to trace for the private sector as they need specific surveys, which many countries do not conduct regularly. Hence for these indicators, public and external expenditures indicators suffice.

118 | Where Is the Money and What Are We Doing with It?
Questions to add
Type and number of Questions Questions
Estimated % of respondents*
1 General question
Was <name> ill or injured in the last four weeks? (Y/N) 100%
1 Outpatient screening question
Did <name> visit/consult a health provider (including Pharmacy/chemist &Traditional Healers) in the last four weeks without staying overnight in the facility? (Y/N)
100%
4 Outpatient questions
Did <name> have more than one visit in the last four weeks? (Interviewer: If <name> had more than one visit in the last four weeks, ask the following questions about each visit. Repeat for all other members of the household)
What was the type of the health provider that <name> visited? (See Provider Codes table below)
How much money did <name> spend on treatment/ services received?
14%
What were the MAIN health reasons for <name> seeking care? (See Symptom Codes table below)
16%
1 Inpatient screening question
Was any member of the household admitted to stay overnight at a medical facility during the last 6 months? If yes, ask the ques-tions below for each admission.
100%
4 Inpatient questions
Did <name> have more than one visit in the last 6 months? (Y/N)
(Interviewer: If <name> had more than one visit in the last 6 months, ask the following questions about each visit. Repeat for all other members of the household)
What was the type of health provider that <name> visited? (See Provider Codes table below)
How much money did <name> spend on treatment/ services received?
What were the MAIN health reasons for <name> seeking care? (See Symptom Codes table below)
< 3%
1 Prevention/health mainte-nance question
Apart from the health expenses from the medical visits you told me about, how much did all members of your household spend on health and healthrelated commodities in the last four weeks (e.g. routine medication, family planning commodities and ser-vices (condoms, pills, etc.), ORS, vitamin supplements (e.g. cod liver, oil, etc.)?
* This is the estimated percentage of people surveyed who would be asked these questions. Estimates are based on household surveys in Kenya in 2003 and 2007.
B7. Suggested Additional Questions to DHS
Carlson and Glandon in Health Systems 20/20 proposed that by adding the following
questions to a section of the household ques-tionnaire, DHS could provide a complete sub-stitute for the household survey usually con-ducted as part of the NHA (Carlson and Glandon, 2009)

Appendix B NHA Toolkits | 119
PROVIDER CODES
Public Sector:
1) Govt. Hospital
2) Govt. health center/clinic/post
3) Gov. dispensary
4) Public pharmacy/chemist
5) Govt. Nursing/maternity home
6) Govt. Community-based health worker (incl. TBA, CHW)
7) Other
Private not-for profit (NGO incl. faithbased) sector:
8) NGO hospital
9) NGO health center/clinic/post
10) Govt. Nursing/maternity home
11) NGO Community-based health worker
12) Community pharmacies (Bamako)
13) Other
Private for-profit sectors:
14) Private hospital
15) Private clinics
16) Private doctors/nurses/midwife
17) Company/parastatal clinic
18) Private pharmacy/shop/mobile vendor
19) Private laboratory
20) Traditional Healer
21) Other
Source: Carlson and Glandon, 2009.
Change Add item 546A “[In addition to the illness you just described] has <NAME> had any other illness or injury at any time during the last two weeks?”
Respondents All children under the age of 5
Rationale National Health Accounts are based on total spending. In addition, analysis of access to care is more powerful.
Change [If yes to item 546A, add] “What sort of sickness/injury did <NAME> suffer?”
Pain in back, limbs or joints Skin problems Ear, nose or throat Eye Dental Accident Other
Respondents Children under 5 with additional illness. In the most recent Kenya household sur-vey, this is 1.7% of children.
Rationale This item converts a partial description of illness to a total description with minimal impact on respondent burden.
Change Add item “What was the type of the health provider that <NAME> visited? (Including Chemists & Traditional Healers) [modify list as nationally appropriate]
Respondents Children under 5 with health care visits. Typically, this is about 5% to 10% of chil-dren who had an additional illness (or only up to about 0.2% of all children).
Rationale NHA tables are indexed by economic sector
Change Add item “How much money did <name> spend on treatment/ services received?”
Respondents Children under 5 with health care visits.
Rationale Dependent variable for NHA
Source: Carlson and Glandon, 2009.
Further, Carlson and Glandon also proposed the following modification of the questions on children less than five years of age to capture
sufficient health expenditure information to inform child health sub-accounts of NHA (Carlson and Glandon, 2009)

120 | Where Is the Money and What Are We Doing with It?
B8. ADepT
ADePT, the Software Platform for Automated Economic Analysis, is a free program designed to simplify and speed-up the production of analytical reports Created by the Research Department (DECRG) of the World Bank, it can be used to generate summary tables and charts from micro-level surveys and present them in a print-ready form ADePT can gen-erate sets of about 50 print-ready tables and graphs in different areas of economic analy-sis, including the Health sector 62
ADePT helps minimize human errors and facilitate effective translation of NHA and survey data into policy analysis The func-tionalities of the BIA component of the health module include (Wagstaff et al, 2011):
• Production of tables showing the distribu-tion across living-standards groups (e g ,
quintiles of per capita consumption) of utilization (by subsector) and subsidies (by subsector and in total)
• Computation of the concentration indices for subsidies for each subsector, and for total subsidies
• Generation of charts showing the concen-tration curves for subsidies for each sub-sector, and for total subsidies
Box B 1 shows the example of the use of ADePT in Vietnam and in Zambia
62 World Bank 2009 “ADePT: A Great Software for Data & Analytical Reports” Blog submitted by Ihssane Loudiyi ” [Online], Available at: http://blogs.worldbank.org/growth/adept-great-soft-ware-data-analytical-reports [accessed 4 Novem-ber 2009]

Appendix B NHA Toolkits | 121
While it is generally accepted that government health expenditures should disproportionately benefit the poor, in practice in most developing countries the opposite is the case, although there are exceptions such as Malaysia, Sri Lanka, and Thailand. Using NHA data and other sources, Benefit Incidence Analysis (BIA) has been conducted using the World Bank’s ADePT tool in the contexts of Vietnam and Zambia,. BIA tries to allocate gov-ernment health expenditures (GHE) across households to see whether it is the poor or better off who benefit dis-proportionately. NHA are one of two data sources used to conduct BIA, the results of which have been used to translate data into insightful analysis that informs policy.
For example, a recent study by Wagstaff (2010) uses household survey and NHA data to analyze the benefit inci-dence of health sector subsidies in Vietnam, exploring the sensitivity of the results to different assumptions about the link between the unit cost of government-provided services and the out-of-pocket payments paid by the patient. In Vietnam, subsidies emerge as pro-rich under most assumptions, but are more pro-rich if higher out-of-pocket payments are assumed to reflect more costly care. His study uses government health expenditure from NHA in conjunction with household survey data to conduct the BIA (Figure B.4).
In Zambia as well, ADePT has been used to determine the extent to which government expenditures for health disproportionately benefit the poor. Table B.3 shows the incidence of government spending on health across service area using three sets of estimates of the distribution of subsidies across consumption quintiles (i.e. con-stant unit-cost assumption; constant unit subsidy assumption; and proportional cost assumption). In Zambia, 63.4% of government subsidies are spent on inpatient care in public hospitals, 30% on outpatient care in these hospitals, and 7.1% on health centers and health posts. Taken together, these BHAs show that government spending on health seems to favor the poor, especially at the lowest level of outpatient care, but the results do depend on the assumptions invoked.
In Zambia, the progressivity of health financing was analyzed using ADePT. Health care payments are consid-ered progressive if the poorest quintile’s share in total household consumption exceeds its share in total pay-ments, while the opposite is true of the richest quintile. In 2006, health care financing in Zambia was fairly pro-gressive. The financing sources that contribute to the overall progressivity of health care finance are general taxation, which finances 42% of domestic spending on health, and contributions made by private employers, which finance 9% of spending. An additional contribution to overall progressivity is made through pre-payment mechanisms, but this remains fairly limited given that they only represent 1% of total health finance. Out-of-pocket health payments are proportional to income, with only slight and not statistically significant evidence of progressivity. Given the considerable share of this financing source (47%), it off-sets part of the progressivity of taxation and employer contributions, roughly halving their overall progressivity.
Box B.1. nha to inform Benefit incidence analysis and assess the progressivity of health care payments through adept
Source: Wagstaff, Adam. 2010. “Benefit Incidence Analysis Are Government Health Expenditures More Pro-rich Than We Think?” Policy Research Working Paper 5234. Development Research Group, The World Bank; and Bredenkamp, Caryn, Wagstaff, Adam, Bilger, Marcel, Buisman, Leander, Prencipe, Leah, and Darwin Young. 2011. “Health Equity and Financial Protection in Zambia.” Washington, D.C.: The World Bank.
Figure B.4. Bia Shows the rich do Better than the poor from Government Subsidies
0
5
10
15
20
OP***visit CHC*
OP*** visit Poly-clinic
OP*** visit General Hospital
Inpatientadmissions
Totalsubsidy
25
30
35
40
051015202530354045505560
Qui
ntile
s sh
are
(%)
Subsector’s Share in GHE* (%
)
Poorest 20%s share Richest 20%s share Share of government health expenditures
• NHA is one of the key inputs to BIA• BIA can reveal how disproportionately
GHE benefits the poor• BIA can also be used to track the
progress of improving the allocation of government resources
1. The poor do relatively well in CHC* outpatient visits
2.The rich do relatively well in the other subsectors
4. As a result, total subsidies accrue disproportionately to the rich
3.However, the bulk of GHE** spent on hospitals outpatients and inpatients

122 | Where Is the Money and What Are We Doing with It?
B9. Health System Financing profile
WHO has recently launched an online Global Health Expenditure Database that permits easy access to the totality of NHA
information The tool allows for quick cross-national comparisons, country-specific summary statistics, and a variety of easy-to-produce figures and reports on health expenditures, including the Health System Financing Profile
Source: WHO website: http://apps.who.int/nha/database/ChoiceDataExplorerRegime.aspx

123
Appendix C: Other Documents
C.1 Literature Review on NHA institutionalization
Table C 1 below presents a compilation of studies, which have examined progress on NHA institutionalization in various regions, and the list of elements considered in each case to assess the level of institutionalization
C2. Survey Questionnaire for the World Bank Survey on Costs of Health Accounting, 2010
Thank you for taking the time to complete this survey designed by the Health Accounts Institutionalization Support Team of the World Bank Your feedback is important to us to bet-ter support the countries in routinely producing and using health accounts information This survey consists of 10 questions and should take 10 minutes of your time Your answers will be completely anonymous You may state approximate figures if you are not sure of precise costs If you have any questions, please contact us (Charu Garg or Mahesh Shukla) at cgarg@world-bank org or mahesh@gwmail gwu edu
The term “National Health Accounts (NHA)”’ is used for health accounting at national level and also includes System of Health Accounts (SHA) and Health Satellite Accounts (HSA) for the purpose of this survey
• Please answer these initial questions with regard to health accounting in your country.
1 Please name your country 2 What is the health accounting methodology used? (NHA/NHEA/SHA/HSA/any other)3 What was the approach used in building the last health accounts, top-down or
bottom-up?4 When was the last NHA exercise done?

124 | Where Is the Money and What Are We Doing with It?
table c.1. analysis of Literature on nha institutionalization
SourceSponsoring Organization(s) Elements
Explicit Definition of Institutionalization
Bura M. (2003). “Institutionalization of National Health Accounts in ECSA: Progress Report”. Paper presented at the 3rd International NHA Symposium
San Francisco, California, June 13–14.
Commonwealth Regional Health Community for East, Central and Southern Africa
Training and mobilizing resources for NHA
Policy makers sensitized
Government decision made to conduct NHA
NHA committee exists
NHA a budget line item
Number of NHA committee meetings
NHA lead person in place
Resources for NHA available
Number of national workshop attendees
Number of regional workshop attendees
1st NHA conducted and disseminated
2nd NHA undertaken
NHA impact on policy demonstrated
Tools for NHA data analysis adopted
Household surveys undertaken
YES
Center for Global Development (2005).
“Following the Money in Global Health”. Global Health Policy Research Network.
Gates Foundation/Center for Global Development
Adoption of standard methodology
Production of NHA on regular basis
Availability of capacity to produce NHA
Availability of resources
Political will to produce NHA
Coordination among development partners
Comprehensiveness of NHA
Coverage of public and private sectors
Accuracy of NHA data
Timeliness for reporting and dissemina-tion of NHA
NO
Glenngård A H, Hjalte F and Hjortsberg C. (2006). “National Health Accounts – Developments, Institutionalization and Policy Implications”. Selected Papers from IHE Studies.
The Institute for Health Economics
Participation in NHA regional networks
Information campaigns about NHA
Capacity-building needs
Sources of financing for NHA activities
Composition of country teams
Analysis and international comparisons
Formation of NHA “communities”
Use of NHA
Constraints in financial and human resources
Role of development partners
Integration with national statistical sys-tems and SNA
YES
(continued on next page)
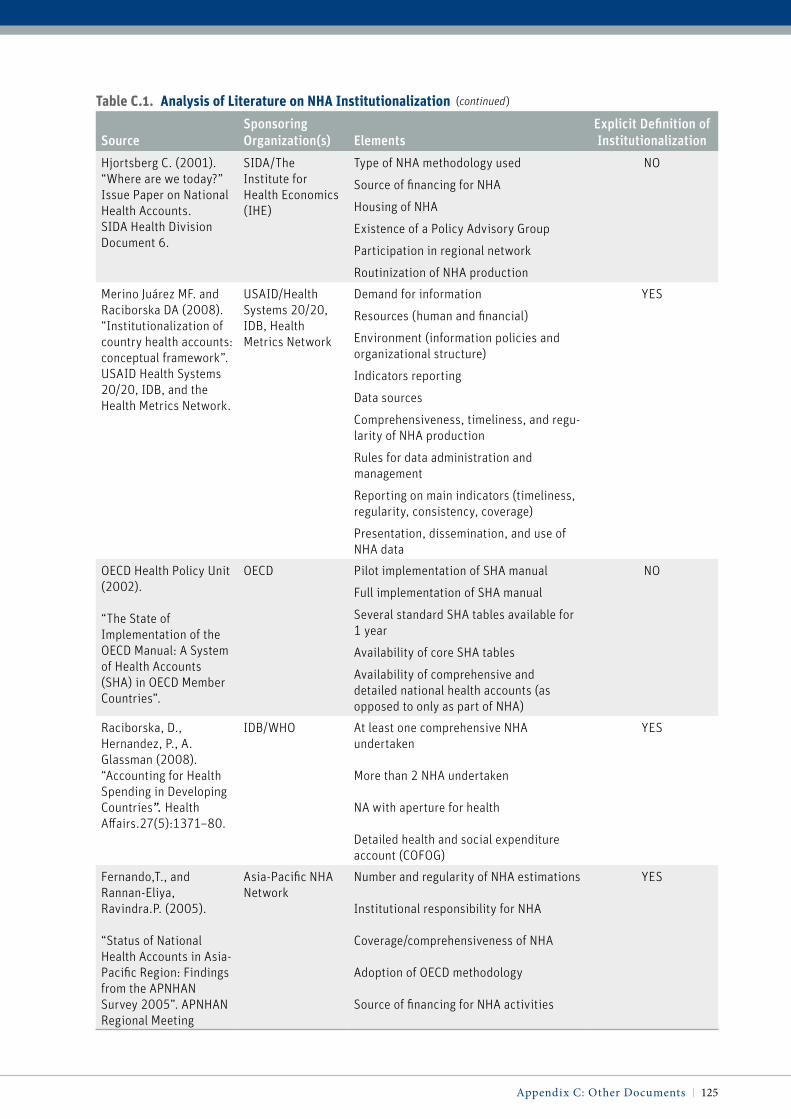
Appendix C: Other Documents | 125
table c.1. analysis of Literature on nha institutionalization
SourceSponsoring Organization(s) Elements
Explicit Definition of Institutionalization
Hjortsberg C. (2001). “Where are we today?” Issue Paper on National Health Accounts. SIDA Health Division Document 6.
SIDA/The Institute for Health Economics (IHE)
Type of NHA methodology used
Source of financing for NHA
Housing of NHA
Existence of a Policy Advisory Group
Participation in regional network
Routinization of NHA production
NO
Merino Juárez MF. and Raciborska DA (2008). “Institutionalization of country health accounts: conceptual framework”. USAID Health Systems 20/20, IDB, and the Health Metrics Network.
USAID/Health Systems 20/20, IDB, Health Metrics Network
Demand for information
Resources (human and financial)
Environment (information policies and organizational structure)
Indicators reporting
Data sources
Comprehensiveness, timeliness, and regu-larity of NHA production
Rules for data administration and management
Reporting on main indicators (timeliness, regularity, consistency, coverage)
Presentation, dissemination, and use of NHA data
YES
OECD Health Policy Unit (2002).
“The State of Implementation of the OECD Manual: A System of Health Accounts (SHA) in OECD Member Countries”.
OECD Pilot implementation of SHA manual
Full implementation of SHA manual
Several standard SHA tables available for 1 year
Availability of core SHA tables
Availability of comprehensive and detailed national health accounts (as opposed to only as part of NHA)
NO
Raciborska, D., Hernandez, P., A. Glassman (2008). “Accounting for Health Spending in Developing Countries”. Health Affairs.27(5):1371–80.
IDB/WHO At least one comprehensive NHA undertaken
More than 2 NHA undertaken
NA with aperture for health
Detailed health and social expenditure account (COFOG)
YES
Fernando,T., and Rannan-Eliya, Ravindra.P. (2005).
“Status of National Health Accounts in Asia-Pacific Region: Findings from the APNHAN Survey 2005”. APNHAN Regional Meeting
Asia-Pacific NHA Network
Number and regularity of NHA estimations
Institutional responsibility for NHA
Coverage/comprehensiveness of NHA
Adoption of OECD methodology
Source of financing for NHA activities
YES
(continued)

126 | Where Is the Money and What Are We Doing with It?
5 How many NHA exercises have been done so far?
6 How many years of NHA data are available?
i) Who conducted the last health accounting exercise?
Government, National Agency or Institute other than Government, International Entity
ii) Please name the ministry or office of the government or the non-government agency or entity that conducted the last NHA.
• What was the total cost of the last NHA exercise? You may give approximate fig-ure if you are not sure of precise figure.
1 Cost and the name of local currency2 Cost in US dollars
i) Who paid the cost of the last NHA?
Government, development partner or donor, part-government part-donor
ii) If the government met the cost fully or in part, was it provided through bud-get of the Government? How much and what proportion of total cost?
• What are the major cost drivers of national health accounting exercise?
1 Staff salaries and benefits2 Consultant costs3 Office costs4 Information technology costs5 Training costs6 Survey costs7 Dissemination costs8 Number of the core NHA matrices
completed (FA × P, P × F, FA × F, FS × FA, FS × F, P × RC, FA × RC, others)
9 Whether the country has a centralized or a decentralized form of governance structure
10 Whether the data are collected for cen-tral and regional level analyses, or only for central level analysis
11 Any other cost drivers? Does your country carry out surveys such as household survey or provider survey especially for health accounting pur-pose or use ‘piggy-backing on existing surveys’ approach? Or both? You may offer additional comments on how to minimize NHA costs in general and survey cost in particular while main-taining quality
• Please give break-up of total cost of the last health accounting exercise in US dollars or local currency (please state the name of the local currency). If you are not sure of precise figures, please feel free to give approximate estimates.
1 Staff salaries and benefits2 Consultant fees and other costs3 Office space, equipment, materials and
furniture4 Information technology equipment
and maintenance5 Travel costs6 Training costs7 Survey costs8 NHA Dissemination costs9 Other costs
• What is the total number of staff that worked on the last NHA?
1 Number of full-time staff2 Number of full-year part-time staff3 Number of part-year part-time staff4 Number of full-time consultants5 Number of part-time consultants

Appendix C: Other Documents | 127
• Please give particulars of staff and con-sultants enumerated in earlier question.
i) How many of them were statisticians, health economists, public health or health policy specialists, medical spe-cialists, information technology special-ists, data analysts, etc.?
ii) You may also state if and how many were generalist civil servants.
iii) Please, mention if and how many international consultants worked on the last NHA? For how long? What was the additional cost (in US dollars or in local currency: please state the currency) of any subaccount your country ever did? You may give year of subaccount and approximate cost figure or percentage if you are not sure of precise figure.
1 HIV/AIDS2 Malaria3 Tuberculosis4 Reproductive health5 Child health6 Subnational health accounts7 Any other disease-specific account
(please name the account and state the cost
If ever in your country health account-ing exercise was supported by a donor/development partner, how much did it cost? Please compare this cost with the cost in the year when it was solely funded by your government. Please state the years, and costs in US dollars or local currency.
C3. Survey Questionnaire for the World Bank Survey on Financing of Health Accounting, 2011
Dear Sir, Madam,
We thank you for making the time to com-plete this survey Your feedback during the global consultation in October 2010 enriched the draft Strategic Guide for the Institutionalization of National Health Accounts The Strategic Guide provides an opportunity to take ownership of a jour-ney towards sustainable and country-driven resource tracking by international standards We hope our joint efforts will result in you implementing the necessary tools and capa-bilities successfully A small group of coun-tries will soon start drafting a financing strat-egy to provide guidance on the costing of implementation of NHA Your response to this survey will provide crucial insights to your priorities and costing assessments
The term “health accounts” includes National Health Accounts (NHA), System of Health Accounts (SHA), National Health Expendi-ture Accounts (NHEA) and Health Satellite Accounts (HSA) for the purpose of this sur-vey Should you have a question, comment or a concern; please feel free to contact us (Mar-gareta Harrit at mharrit@worldbank org or Mahesh Shukla at [email protected])
1. Countries conduct national health accounts to track resource allocation to their health sector and to achieve transpar-ency, equity and efficiency in their health spending. From the perspective of your country, what is the business case for insti-tutionalizing health accounts?

128 | Where Is the Money and What Are We Doing with It?
• Ensures adequate funds for protecting public health
• Useful in tracking health funds• Helps meet demand for expenditure
information from external and internal stakeholders
• Useful in making evidence-based health policy
• Helps achieve equity and efficiency in health spending
• Ensures financial sustainability of health funding
• Improves timeliness and consistency of health expenditure information thus making it more useful over time
2. Overall, health expenditure information is useful to the countries for making health policy, tracking health resources and achiev-ing financial sustainability, equity and effi-ciency in their health spending. Different countries may have used it differently e.g., to inform their resource allocation deci-sions especially during recent financial cri-sis, to inform their equity analysis, or to provide an evidence base for their particu-lar health reform decisions. Please identify at serial number 1. key stakeholders who have an interest in using health expendi-ture information in your country and state at serial numbers 2–6 specific examples of how your country has used health expendi-ture information in different ways.
1 Stakeholders2 How used
3. During the Global Consultation that you attended in Washington, DC on 20–21 October 2010, 25 countries committed to preparing their national institutionaliza-tion plans by early 2011. In this context, please respond to the following questions.
• Please name your country • Please name your ministry and bureau/
department
• Has the institutionalization plan been developed?
• If yes, is it approved by the government?• What is the duration of this plan?• Is it costed?• If costed, what is the cost in local currency
and in US dollars?• Are you willing to share this plan with us
at this time?• If the plan is not developed at this time,
by when do you expect the plan will be ready?
• Do you need any technical assistance in developing this plan?
• If yes, please tell us in brief what kind of technical assistance you need
• Does your country have a functioning Policy Advisory Group?
• Is health accounting a budget item with its own budget code?
• Does your government have a mandate (legislative/executive) for production/institutionalization of health accounting?
4. For your country to put in place effective and sustainable capacity for the production, dissemination, analysis and use of health accounts, what time commitment and sup-port would you expect from donors and development partners?
• 3 years• 5 years• 6–8 years• 9–10 years• More than 10 years
A comment, observation or suggestion
5. As you build country capacity, which of the following costs is your government likely to fund from its own budget?
• Staff salaries and benefits• International consultant fees• Regional consultant fees• National consultant fees

Appendix C: Other Documents | 129
• Office space, equipment, materials and furniture
• IT hardware, software• IT maintenance Survey costs• Analysis costs• Dissemination costs• Costs of using health expenditure
information• Travel• International training• Training in the continent• National training
A comment on which of these costs your gov-ernment may expect external sources to meet and their approximate value
6. Is your country likely to support one or more innovative financing mechanisms to sustain institutionalization? You may sug-gest any other financing mechanism best suited to your country’s situation.
• Loan buy-down (loan buy-down or loans to grants conversion triggered by the achievement of pre-defined results)
• Results-based transfers of donor aid to the government
• Debt2Health like instrument (Donors cancel a fraction of debt held by recipi-ent countries in return for specific invest-ments in health projects)
An innovative mechanism to raise internal or external finance that will work well for your country
7. Establishing a Health Policy Analysis Center in a University setting is one way to build capacity in the country for analyzing and using health expenditure information. Which new investments aimed at building analytical capacity is your country likely to propose? Please name these investments and their likely cost. Please tell us also about what investments in Information Technol-ogy, Survey and other physical infrastruc-
ture and human resources your country is likely to make and their likely cost.
1 Investments in analytical capacity2 Investments in capacity to use NHA3 Information Technology infrastruc-
ture4 Survey infrastructure5 Other physical infrastructure6 New Investments in Human Resources
8. Provide us with a cost estimate of the lat-est health accounts in your country. If you are not sure of precise figures, please use estimates.
• Government paid what percentage of the total cost
• Donors paid what percentage of the total cost
• Name of the donor or donors (if applicable)• Total cost of the last health accounts in
local currency• Total cost of the last health accounts in US
dollars• Cost of staff salaries and benefits• Consultant fees• Cost of office space, equipment and
furniture• Cost of information technology• Travel costs• Training costs• Survey costs• Dissemination costs• Analysis and use costs• Other costs• Name of the local currency• US dollar conversion rate
9. International technical assistance is expensive and often does not result in trans-fer of capacity and skills to country officials. Institutionalization can help bring down this cost through gradual substitution of international consultants by regional and national consultants eventually building the capacity within the government. Please

130 | Where Is the Money and What Are We Doing with It?
tell us about costs related to international technical assistance for health accounts in your country in the latest 5 health accounts. You may base on the best of information you have given number of international consul-tants, time they worked, name of the donor who funded them and cost in US dollars or local currency (in brief: number of interna-tional consultants/duration/donor/cost).
• The latest health accounts• The second latest health accounts• The third latest health accounts• The fourth latest health accounts• The fifth latest health accounts• Compare the overall cost of donor-funded
NHA versus government-funded NHA
10. Please answer the following questions related to health sub-accounts.
• Do you track HIV/AIDS expenditures? *Please answer the following questions related to health sub-accounts
• Do you track Tuberculosis expenditures?
• Do you track Malaria expenditures?• Do you track any other disease-specific
expenditures?• Do you track public expenditures on
Maternal and Child Health?• Do you track private expenditures on
Maternal and Child Health?• Do you track donor expenditures on
Maternal and Child Health?• Do you track public expenditures on
Family Planning?• Do you track private expenditures on
Family Planning?• Do you track donor expenditures on
Family Planning?• Would you be willing to share the sub-
accounts with us?• Would you be willing to integrate
Maternal and Child Health sub-accounts in your national institutionalization plan?


THE WORLD BANK
1818 H Street, N.W.Washington, DC 20433