where's waly - aileen clarke and sian taylor-phillips
TRANSCRIPT

Where’s WALY?
Aileen Clarke and Sian Taylor-Phillips

Prevention and DetectionTheme 3 – CLAHRC West Midlands
Division of Health SciencesWarwick Medical School
The research was funded by the National Institute for Health Research (NIHR) Collaboration for Leadership in Applied Health Research and Care (CLAHRC) West Midlands.

“Where’s WALY” teamJason MadanRebecca JohnsonDavid JenkinsonSian Taylor-PhillipsWendy RobertsonHendramoorthy MaheswaranStavros PetrouSarah Stewart-BrownAileen Clarke
Advisory group: Paul Dolan (LSE), Ewen Mackinnon (Well-being and Civil Society Policy Team, Cabinet Office), Paul Litchfield (Chair, What Works - Centre for Wellbeing)

Well-being as a cross-sectoral measure of benefit.
Instruments such as the EQ-5D allow policy-makers to prioritise health spending based on public values. The use of EQ-5D – derived QALYs to maximise the benefits from health spending is well established in health technology assessment Many public sector interventions improve lives in ways that are not adequately captured by EQ-5DWell-being is a concept that captures many of the ways in which public sector spending benefits populations (health, safety, social connections, etc.)The Warwick-Edinburgh Mental Wellbeing Scale (WEMWBS) has been widely used to measure well-being.

The problem There are outcomes and effects of interventions other than on healthDecisions may impact on other sectors: wider social benefits/effects– social networks, relations, friends, family income– public health, social care, transport, leisure, agriculture
Even in health care, EQ-5D has been questioned. May not capture all the aspects of quality of life that matter……
So….

Where’s WALY – development of a preference based well-being measure
Research is planned to develop a preference-based tariff for the WEMWBS.This will allow calculation of WALYs for economic evaluations. The tariff will be based on responses from a large representative UK sample.Follow-on research questions include:– How do values vary across populations (e.g. service users, general
population)?– What types of intervention give benefits that should be measured
in terms of WALYs?

Study design for estimating the WALY tariff
Tariff will be based on the short form - sWEMWBS to reduce the number of states (78125 vs 6.1 billion)Subset selected for valuation (balanced on overall severity and mix of severity across dimensions). Hybrid TTO – DCS method will be used for preference elicitationUse professional survey organisation to ensure representative sample.Minimum of 25 participants per health state (so 200 health states would imply sample size of 5000+)
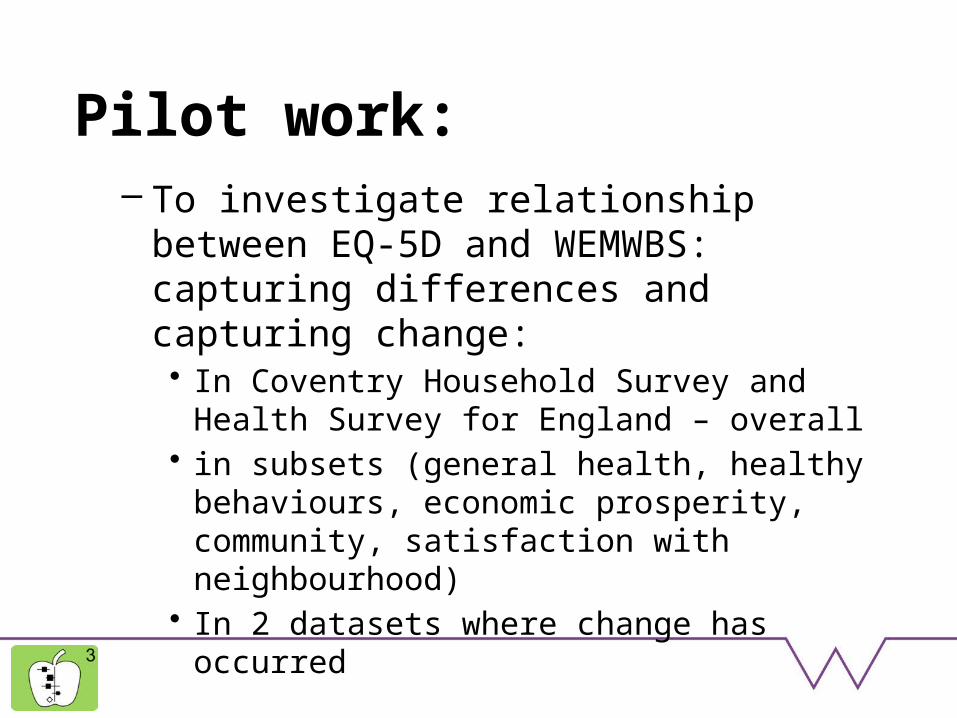
Pilot work: – To investigate relationship between EQ-5D and
WEMWBS: capturing differences and capturing change:• In Coventry Household Survey and Health Survey
for England – overall• in subsets (general health, healthy behaviours,
economic prosperity, community, satisfaction with neighbourhood)
• In 2 datasets where change has occurred

DataData from Coventry Household Survey (CHS)
Year 2011 2012 2013 Total
Cases 3144 2117 2208 7469
No individual has taken part in more than one year

DemographicsAGE Frequency Percentage GENDER Frequency Percentage
16-24 1221 16.3 Male 3628 48.6
25-34 1339 17.9 Female 3839 51.4
35-44 1160 15.5 NA 2 0.0
45-54 997 13.3 IMD
55-64 971 13.0 1st Quintile 2289 30.6
65-74 733 9.8 2nd Quintile 1822 24.4
75+ 511 6.8 3rd Quintile 1315 17.6
NA 537 7.2 4th Quintile 1234 16.5
5th Quintile 809 10.8

WEMWBS and EQ-5DWarwick Edinburgh Mental Well-being Scale - WEMWBS – 14 items, 5 point scale for each item– Sum scores across the 14 items; total - 14-70
EQ-5D: total score: 0-1– five dimensions, scored between 1-3 and a VAS – mobility, – self-care, – usual activities, – pain or discomfort and – anxiety or depression

Scores in Coventry’s general population
118 183 60 198
923
399
5552
EQ-5D
(-0.6,0] (0,0.2] (0.2,0.4] (0.4,0.6](0.6,0.8] (0.8,1) 1
13 64152
726
1565
2643
1423
757
WEMWBS
(14,21] (21,28] (28,35] (35,42] (42,49] (49,56] (56,63] (63,70]

Joint Distribution - TableEQ-5D (-0.6,0] (0,0.2] (0.2,0.4] (0.4,0.6] (0.6,0.8] (0.8,1) 1 TotalWEMWBS(14,21] 1 0 1 3 2 0 5 12
(21,28] 13 9 5 5 11 7 13 63
(28,35] 17 21 6 11 36 19 41 151
(35,42] 29 48 15 54 117 71 385 719
(42,49] 29 43 14 60 268 115 1032 1561
(49,56] 16 38 9 41 303 108 2119 2634
(56,63] 9 17 5 11 136 49 1193 1420
(63,70] 0 4 4 9 39 23 677 756
Total 114 180 59 194 912 392 5465 7316
Only includes cases where both scores were available

Joint Distribution - Scatterplot


MappingLinear Model.– EQ-5D as the response (dependent) variable– WEMWBS as the covariate (independent variable)
Term Coefficient 95% CI p-value
Constant 0.468 0.438 0.498 <0.001
WEMWBS 0.008 0.008 0.009 <0.001
ANOVA Sum of Squares df Mean Square F SignificanceRegression 38.86 1 38.862 846.84 <0.001
Residual 336.33 7329 0.046
Total 375.19 7330 R2 0.104

Capturing Differences on CHSGeneral health– Single scale rating
Healthy Behaviours– 5 or more fruit & veg/day and – 3 or more exercise/weeks and– Never smoked
Economic prosperity– Own home and– Degree level qualification and– F/T employment
Community– Feels very safe during day and at night and– Very satisfied with neighbourhood as a place to live

General health

General health

Healthy Behaviours

Economic prosperity

Community

Conclusions
WEMWBS explains little of the variation of EQ-5D. In one between-subjects dataset we found– WEMWBS may be better than EQ5D at detecting very good self
rated health, because EQ5D has ceiling effects– WEMWBS was superior in measuring differences in healthy
behaviours and community satisfaction between subjects
Next steps i) to determine whether WEMWBS is superior in detecting differences within subjects before and after a range of community, economic and health related interventions ii) to develop the tariff

What does this mean…Individuals can be in ‘good’ health but wellbeing can be low.Interventions can improve wellbeing WALYs are needed to prioritise public sector spending on such interventions.

Summary statisticsEQ-5D Frequency Percentage WEMWBS Frequency Percentage
(-0.6,0] 118 2% (14,21] 13 0%
(0,0.2] 183 2% (21,28] 64 1%
(0.2,0.4] 60 1% (28,35] 152 2%
(0.4,0.6] 198 3% (35,42] 726 10%
(0.6,0.8] 923 12% (42,49] 1565 21%
(0.8,1) 399 5% (49,56] 2643 36%
1 5552 75% (56,63] 1423 19%
(63,70] 757 10%
NA 36 NA 111
Total 7469 7469