white paper measuring research output through bibliometrics · white paper measuring research...
TRANSCRIPT

White Paper Measuring Research Output through Bibliometrics Winter, 2016
DOI: 10.13140/RG.2.1.3302.5680


White Paper Measuring Research Outputs through Bibliometrics
Prepared by the Working Group on Bibliometrics, University of Waterloo Winter, 2016
For further information regarding this report, please contact: Working Group on Bibliometrics, University of Waterloo 200 University Avenue West Waterloo, ON Canada N2L 3G1 Email: [email protected]
Suggested Citation University of Waterloo Working Group on Bibliometrics, Winter 2016 White Paper on Bibliometrics, Measuring Research Outputs through Bibliometrics, Waterloo, Ontario: University of Waterloo Prepared by Lauren Byl, Jana Carson, Annamaria Feltracco, Susie Gooch, Shannon Gordon, Tim Kenyon, Bruce Muirhead, Daniela Seskar-Hencic, Kathy MacDonald, Tamer Özsu, Peter Stirling, of the University of Waterloo Working Group on Bibliometrics

ii White Paper Measuring Research Output through Bibliometrics
Table of Contents Table of Contents ................................................................................................................................................ ii
Purpose .............................................................................................................................................................. iv
Background ....................................................................................................................................................... v
Key Findings ..................................................................................................................................................... v
Summary .......................................................................................................................................................... vii
Recommended Practices for Bibliometric Analysis ...................................................................... vii
Foreword............................................................................................................................................................... ix
1. Measuring Research Output through Bibliometrics ......................................................................... 1
1.1 Purpose ........................................................................................................................................................... 1
2. Overview ........................................................................................................................................................ 2
2.1 Bibliometric Measures and their Use in the Post-Secondary Sector ....................................... 3
3. Common Databases, Measures and Limitations .................................................................................. 5
3.1 Citation-tracking Databases .................................................................................................................. 5
3.1.1 Limitations of citation-tracking databases ................................................................................ 6
Figure 1: Discipline and Web of Science Coverage ....................................................................... 10
Figure 2: Publication Behaviour Across Disciplines ....................................................................... 12
3.1.2 Summary ............................................................................................................................................. 14
3.2 Bibliometric Measures ........................................................................................................................... 15
3.2.1 Publication Counts ...........................................................................................................................16
3.2.2 Citation Counts ................................................................................................................................. 17
3.2.3 H-index and other combined measures ................................................................................. 20
3.2.4 Collaboration Networks .............................................................................................................. 20
3.2.5 Journal Impact Ranking ................................................................................................................ 22
3.2.6 Top Percentiles ................................................................................................................................ 23
3.2.7 Summary ............................................................................................................................................ 23
Table 1 Bibliometric Measures, Definitions, Uses and Possible Levels of Use ..................... 24
Figure 3: Recommended Uses of Bibliometric Data by Analysis Level ................................. 27
3.3 Implications of Bibliometric Analysis .............................................................................................. 27
4. Summary and Recommendations .......................................................................................................... 28
Table 2 Bibliometric Analysis Comparison Parameters by Levels and Types of Inquiry . 29
4.1 Recommended Practices for Bibliometric Analysis ................................................................... 34

iii White Paper Measuring Research Output through Bibliometrics
Appendix A: Working Group on Bibliometrics Members ................................................................... 36
Appendix B: Evidence-gathering Process Used ..................................................................................... 37
Appendix C: White Paper Consultation Process .................................................................................... 38
References .......................................................................................................................................................... 39

White Paper Measuring Research Output through Bibliometrics iv
Executive Summary and Recommended Practices Research output may be measured by assessing a wide variety of research outputs. These include:
research published and cited in refereed journals,
conference proceedings,
books,
policy reports,
works of fine art,
software and hardware, artifacts,
scholarly blogs,
the type and amount of intellectual property produced (e.g., patents, licenses, spin-offs),
the type and amount of research awards,
the nature and number of highly qualified personnel developed by the researcher or group, and
publication acceptance rates (the proportion of papers or conference presentations accepted compared to the number submitted).
Bibliometrics is one family of measures that uses a variety of approaches for counting publications, citations, and authorship.
Purpose
This White Paper provides a high-level review of issues relevant to understanding bibliometrics, and practical recommendations for how to appropriately use these measures. This is not a policy paper; instead, it defines and summarizes evidence that addresses appropriate use of bibliometric analysis at the University of Waterloo. Issues identified and recommendations will generally apply to other academic institutions. Understanding the types of bibliometric measures and their limitations makes it possible to identify both appropriate uses and crucial limitations of bibliometric analysis. Recommendations offered at the end of this paper provide a range of opportunities for how researchers and administrators at Waterloo and beyond can integrate bibliometric analysis into their practice. Additionally, Table 2 provides a summary of levels and types of inquiry that were considered by the working group as appropriate, and not, in a variety of situations. Further efforts will build on this White Paper, including sharing practice-based suggestions with members of the University community and creation of an online research guide exploring this topic to facilitate access to background research literature in bibliometrics. This

v White Paper Measuring Research Output through Bibliometrics
process will support efforts to recognize appropriate and inappropriate uses of bibliometrics in the Waterloo context.
Background
Important stakeholders, including funders and ranking organizations, increasingly use bibliometrics as a measure of research output to encourage university accountability for funding, and to determine how to distribute funding or with whom to partner. In 2011, the University of Waterloo, along with other Canadian universities, began to build institutional understanding and awareness of bibliometrics.1
In 2012, key University stakeholders including the Library, Office of Research, Institutional Analysis and Planning (IAP), and representatives from all Faculties formed a Working Group on Bibliometrics (WGB). A full listing of members is provided in Appendix A. The purpose of the WGB is to assist the University in understanding new realities of how bibliometrics are used, and provide resources to support researchers and administrators to use them more effectively. One of the Working Group’s initial steps was to identify the need for resources, including a White Paper, to foster a common institutional understanding of bibliometrics and its role in capturing research performance. A sub-committee, with a faculty member and representatives from the Library, IAP, and the Office of Research, was tasked with creating the White Paper. This sub-committee conducted a comprehensive literature review of peer-reviewed literature published within the past four years and an extensive grey literature search to identify relevant position papers. The group identified, reviewed, and summarized key articles and drafted the White Paper with support of a principal writer. The evidence gathering process is outlined in Appendix B. The resulting document is a resource for institutional and Faculty leadership and researchers, students, and other members of the campus community who are interested in better understanding bibliometrics.
Key Findings
This review of peer-reviewed literature and selected grey literature indicates that bibliometrics offers a useful approach for measuring some aspects of research output and impact, yet is subject to significant limitations on its responsible use. Bibliometrics are most useful when employed in combination with peer and other expert review to assess the categorical or non-comparative impact and volume of scholarly work. Differences in disciplinary cultures are too strong an effect for most cross-discipline comparisons to be reliable. For these reasons, assigning a major role to bibliometric measures for hiring, merit review, tenure, and promotion decision-making is strongly discouraged and using bibliometric measures alone as a measure for inter-departmental research activity
1 The U15 Group of Canadian Research Universities (U15) completed some work on comparative bibliometrics with the Observatoire des Sciences et des Technologies (OST) between 2005 and 2009, using Thomson Reuters’ citation tracking databases.

White Paper Measuring Research Output through Bibliometrics vi
comparisons, is not appropriate. The scientific and scholarly content and quality of research outputs, understood by the norms characteristic of the fields in which the research is performed, is more important than simple publication metrics for these purposes.
Limitations on the effective use of bibliometrics include the following:
Citation-tracking databases use different methodologies for collecting and reporting bibliometric measures, and their indexing of research publications from various fields of study can produce significant limitations to some disciplines.
Proprietary citation-tracking databases (such as Web of Science and Scopus) index different collections defined by the publications their commercial enterprises hold. Google Scholar, while not defined by proprietary collections, is limited by search conventions that can include-non-scholarly works. No citation-tracking database indexes every type of publication, and comprehensive coverage of research publications is not possible. This limited coverage is reflected in the research analytic tools (such as InCites and SciVal) that draw on data from citation-tracking databases.
Academic disciplines produce a range of research outputs, and not all of these are indexed equally well by citation-tracking databases. These outputs include number of patents, papers in conference proceedings, produced systems developed and widely used, data sets, or hardware and software artifacts, policy papers, white papers, and reports produced for government and other public organizations, books, or works produced and exhibitions.
Citation-tracking databases do not have good coverage of research that is not published in English, interdisciplinary research or research of regional importance, and cannot provide field-specific context for research outputs like the extent and type of some research collaborations.
The practice of attributing citations, and collecting citation data, differs across disciplines and fields. In some fields citations accrue only many years after a work is published, in other fields citations accrue primarily within only a few years after publication. Differences in citation practices carry over into every bibliometric measure that uses citations as part of calculating the metric, including the h-index.
There is evidence of gender bias in citation practices. This bias underestimates contributions made by women researchers. This factor must be taken into consideration when conducting bibliometric analysis.
Bibliometric measures taken at different times cannot always be meaningfully compared. First, citations, a key research bibliometric measure, accrue with time after publication. Second, the time required for understanding the impact of a paper using citations differs by discipline. Finally, citation databases themselves change their methodology and journal coverage over time.

vii White Paper Measuring Research Output through Bibliometrics
The use of bibliometric measures may lead to changes not only in how researchers choose to publish, to increase opportunities for enhanced coverage in citation-tracking databases, but also in what they choose to research. It may provide opportunities and incentives to manipulate metrics. Cross-disciplinary differences in the ease of use for bibliometric tools, moreover, may be misinterpreted as cross-disciplinary differences in research activity or impact itself.
Summary
In aggregate, these factors strongly suggest that bibliometric comparisons across disciplines or sub-disciplines, or longitudinal comparisons within a group, may generate unclear or misleading results. The recommendations offered in this paper provide important practices and considerations for optimizing the use of bibliometrics. Table 2 also provides a useful tool that applies the limitations and recommended practices for bibliometrics at levels and types of inquiry in a variety of typical situations for measuring research outputs.
Recommended Practices for Bibliometric Analysis
The use of bibliometrics, and bibliometric analysis, is a common approach for measuring research outputs. These recommendations speak only to the methodological reliability of bibliometric measures, as indicated in the relevant literature. University policies (such as Waterloo's Policy 77 on Tenure and Promotion) may direct the use of these measures. If used carefully, bibliometric measures can provide a data point, in conjunction with others, for evaluating research outputs. The following recommendations are geared toward researchers, administrators, and others interested in using bibliometrics or assessing the relevance of bibliometric results.
For Researchers:
Define a researcher’s identity convention as an author early, and use that convention systematically throughout their career. Appropriate affiliation to the University of Waterloo is also important. As an example, researchers can increase the likelihood that their works will be accurately attributed to them within citation-tracking databases by proactively determining how their name will appear in published form throughout their career by creating an author profile such as an Open Researcher and Contributor ID (ORCID).
For All Users:
Approach the process of analysing research outputs in the same way that one would conduct good research:
develop a strong research question with the scope and clarity appropriate to the discipline and issue under consideration,
assess whether bibliometric measures can appropriately provide the information required to answer the research question; if not, it may be necessary to revise the research question or use other measures,

White Paper Measuring Research Output through Bibliometrics viii
if bibliometric measures are indicated, select appropriate tools and measures to investigate the research question,
be explicit about other non-bibliometric data sources that should also be considered, and
understand the research and comparison context, including discipline-specific effects and the implications of sample size.
Consider bibliometrics as one measure among a set of others for understanding research output and impact. Best practice is to work from a basket of measures. It is impossible for any bibliometric analysis to present a complete picture. Bibliometrics is optimally used to complement, not replace, other research assessment measures, such as peer review, keeping in mind that “both need to be used with wisdom, discretion and the rigorous application of human judgement” (Phillips & Maes, 2012, p. 3).
Understand and account for variations in how disciplines produce and use research publication. Avoid comparisons that the measurement tools and key concepts cannot support. The nature of research (and more generally, scholarly) output (e.g., journal articles, books and book chapters, conference proceedings, performances, social outputs, research artifacts) differs across disciplines, and thus the relevance and applicability of bibliometrics also differs across disciplines. It is important to use bibliometric measures relevant for each discipline and to recognize that meaningful comparisons across those measures may not be possible.
Involve those being evaluated in the process and provide them with interpretive information. Given the significant role and impact of context in the use of bibliometrics, researchers in the field or discipline in question may be best equipped to understand and explain the variability of how bibliometric measures capture and reflect research outputs in their field. This will help to ensure that using bibliometric measures incorporates a full understanding of their limitations, particularly at the discipline level.
Understand the distinctions among bibliometric measures. Be aware of the methodology, purpose, and limitations of bibliometric databases (such as Web of Science, Scopus, and Google Scholar) and of individual bibliometric measures (such as the Journal Impact Factor and h-index). As an example, it is important to recognize the value of normalized measures compared to whole/raw count while also recognizing that normalized measures can be vulnerable to outliers (e.g., a single highly cited paper can increase the average somewhat artificially). Regular review and updating of research methods and definitions will ensure a strong and current understanding of methodologies used.
Exercise caution when using journal impact rankings. Journal impact rankings such as JIF or SCImago Journal Rank (SJR) should not be broadly used as a surrogate measure of the quality of individual research articles or an individual’s overall performance when opportunities exist for an in-depth evaluation of individual publications.

ix White Paper Measuring Research Output through Bibliometrics
Foreword The University of Waterloo is committed to better understanding how to measure and reflect research output and impact using a range of measures. Important stakeholders, including funders, ranking organizations, and various accountability organizations, are increasingly using bibliometrics as one way to understand research outputs. Further, individual academics want to better understand bibliometrics and how they are used.
In 2012, the University of Waterloo formed the Working Group on Bibliometrics (WGB) comprised of key stakeholders across the University, including the Library, Office of Research, Institutional Analysis and Planning (IAP), and representatives from all Faculties. A full listing of members is available in Appendix A. The WGB established a sub-committee tasked with creating resources to better support institutional understanding of bibliometrics and their effective use. A key deliverable was to create a white paper to explore and understand the use of bibliometrics as one approach to monitoring research performance at all levels.
With representatives from the Library, IAP, and Office of Research, the Sub-Committee conducted an environmental scan of current bibliometric practices through a comprehensive literature review. This process involved identifying articles from peer-reviewed journals published within the last four years, as well as position papers via grey literature. These findings were managed by RefWorks, a bibliographic management system. Team members then reviewed findings of the literature search, a process that involved identifying key publications by reading and summarizing article content. The evidence-gathering process is outlined in Appendix B.
Through a collaborative process, the group developed an outline for the White Paper, which was shared with the WGB for feedback. Following approval of the outline, the Sub-Committee developed the White Paper with support of a principal writer. A draft of the White Paper was shared widely on campus, and feedback received during consultations in fall 2015 was incorporated into this final draft. Appendix C provides an overview of the consultation process.
This White Paper is a contribution to Waterloo’s evolving understanding of how to use bibliometrics to measure research output and impact. It provides a high-level review of issues relevant to understanding this topic and practical recommendations for how to improve our bibliometric practices. Further efforts will build on this White Paper, including the creation of an online guide which will synthesize content from this paper and provide recommended readings.
For more information, please contact: Working Group on Bibliometrics [email protected]


1 White Paper Measuring Research Output through Bibliometrics
1. Measuring Research Output through Bibliometrics Post-secondary institutions face increasing pressures from funding bodies, the public, and other institutions to measure and understand the amount, and impact of, research conducted by their institution. Bibliometrics are a series of measures used by universities, funders, ranking organizations and others to assess research outputs. However, bibliometrics present both opportunities and challenges for accurate assessment. The process of understanding bibliometric analysis and measures can be significant given the time and expense it takes to collect, analyse, and report on this analysis. In organizations where resources are limited, staff and researcher time and funds spent on research metrics has both real and opportunity costs (Van Raan, 2007). A thorough understanding of limitations can optimize the appropriate use of bibliometric measures and ensure that resources used to collect and analyse them are well spent.
1.1 Purpose
The purpose of this White Paper is to define and summarize evidence that addresses appropriate use of bibliometric analysis at the University of Waterloo and to develop recommendations to support appropriate use of these measures.
The European Commission on Research and Innovation has defined bibliometrics as “a
statistical or mathematical method for counting the number of academic publications, citations and authorship” and notes that it is frequently used as a measure of academic output (Directorate-General for Research, Assessing Europe’s University-Based Research, 2010). This White Paper describes commonly used citation-tracking databases and bibliometric measures, describes its proper uses, and provides an overview of the limitations of bibliometric analysis as both a method and within various disciplines. Recommendations provide a thoughtful approach for how bibliometrics can be used effectively.
Bibliometrics serve as one tool, among many, used by universities, funders, ranking organizations, and others to measure research outputs.
A good understanding of the various types of bibliometric measures and their limitations makes it possible to identify how, and under what circumstances, bibliometrics can be used effectively.

White Paper Measuring Research Output through Bibliometrics 2
2. Overview In academia, the culture of ‘publish or perish’ has long been linked to determining the success of individual researchers. However, in recent years, there has been a shift from the understanding that publishing is an important result of research productivity, to a market competitions approach driven by the need to produce a variety of quantitative measures of research impact (Van Dalen & Henkens, 2012).
Bibliometric analysis is one important tool among a basket of potential processes and related tools used to understand aspects of research output. Common assessment activities
that incorporate bibliometric measures can include: individual peer review of funding applications and institutional funding, rankings, individual assessment for promotion and tenure, and granting of awards. A few definitions provide context for this discussion.
Research impact is considered to be “...the social, economic, environmental and/or cultural benefit of research to end users in the wider community regionally, nationally, and/or internationally” (Bornmann & Marx, 2014, p. 212). Also, “the impact of a piece of research is the degree to which it has been useful to other researchers” (Bornmann, Mutz, Neuhaus, & Daniel, 2008, p. 93). Assessing research impact in a fulsome way is not possible without a complex set of indicators, some of which may include bibliometrics, but others that are not. However there is often a demand for simple measures because they are easier to use and can facilitate comparisons. In part, interest in trying to understand research impact gave rise to interest in measurement of research outputs, including bibliometrics.
Research output is the measure of the research activity. It is considered a key element of a university’s and an academic’s achievements and is typically defined by the number and quality of research products a researcher, department, or institution has produced within a specific timeframe. Typical research outputs can include research published in refereed journals, conference proceedings, books, patents, policy reports, and other artifacts (e.g., exhibitions, developed systems, data sets, software, and hardware artifacts). Depending on the context, scholarly blogs and radio or television broadcasts may be categorized as research output.
Research metrics are the quantitative measures that are used to quantify research output. These measures may include, but are not limited to, bibliometrics. Other commonly used research metrics include research funding, awards, publication acceptance rates, and the development of highly qualified personnel (HQP).
In recent years, there has been a shift from the understanding that publishing is an important result of research productivity, to a market competitions approach driven by the need to produce a variety of quantitative measures of research impact.
Bibliometric analysis is one important tool among a basket of potential processes and related tools used to understand aspects of research output.

3 White Paper Measuring Research Output through Bibliometrics
Bibliometric measures are used to express an amount or degree of research or academic output. Measures typically include the number of academic publications and citations of a single researcher, group of researchers, or an institution. An important component of bibliometric measures are the citation-tracking databases that capture and report bibliometrics.
Citation-tracking databases track citations by counting how many times a particular work has been cited in other works included in the same database. As each of these databases are closed systems (each one indexing different content and considering only citations within their collections), citation counts will naturally differ based on the data resource. Common citation-tracking databases include Web of Science, Scopus, and Google Scholar. Data collected and indexed by citation-tracking databases are often used as the basis of bibliometric measures.
2.1 Bibliometric Measures and their Use in the Post-Secondary Sector
In the last decade, the use of bibliometrics has gained popularity in the post-secondary sector. A variety of important stakeholders – governments, industry partners, other funders, and academics – use them to understand and compare research outputs.
As an example of how stakeholders use bibliometric measures, the Ministry of Training, Colleges and Universities (MTCU) in Ontario has developed Strategic Mandate Agreements (SMA) with each of the province’s colleges and universities. The Agreements outline key areas of differentiation for the institutions and how each institution is meeting those goals, along with the metrics that will be used to assess their progress. The province has identified the number of publications (five-year total and per full-time faculty member), number of citations (five-year total and per full-time faculty member), and citation impact (normalized average citation per paper) as measures it intends to use to understand institutional research impact across Ontario. Understanding these bibliometric measures will give Waterloo a better understanding of how the University itself, and centres, institutes, departments, and schools within the University, may be assessed by external stakeholders. It will also enable Waterloo to engage the external stakeholders in a discussion on reasonable uses of bibliometric measures.
University ranking programs produce a rank-ordered list of post-secondary institutions based, in part, on bibliometric measures (Marope, Wells, Hazelkorn, & UNESCO, 2013). There is no universally accepted set of measures that fully
and appropriately assesses university research outputs. Nonetheless, bibliometrics as a component of research output have been used for this purpose (Van Vught & Ziegele, 2011).
Key stakeholders – governments, industry partners, and other funders – use bibliometric measures to assess research outputs.
There is no universally accepted set of measures that fully and appropriately assesses research output.

White Paper Measuring Research Output through Bibliometrics 4
In addition to external assessment, bibliometric analysis has been used to understand and interpret research outputs internally within institutions. For example, some bibliometric measures may be used as a proxy for research quality or scholarship excellence. University researchers within a department or institute commonly track bibliometric measures of their own research performance at a single point, or over time, as a way to gauge their productivity against peers or those with whom they seek to collaborate.
Hiring committees sometimes use selected bibliometric measures for an individual researcher to assess the relative quality of prospective faculty members. From an institutional perspective, bibliometrics have been used to inform a discussion about areas of strength and weakness relative to wider institutional and disciplinary performance. This information has been used to inform strategic planning and to support grant applications (Morphew & Swanson, 2011).
Funders (governments, industry, and organizations) are also using bibliometric analysis to provide and assess evidence of the impact of their investments and to assess social, economic, industrial, and cultural impacts of research (Bornmann & Marx, 2014). For example, in 2007 the Canadian Federal Government developed the Mobilizing Science and Technology to Canada’s Advantage plan, which outlined federal government support for ‘world-class research excellence’ in priority areas. The federal government, among other funders, is using bibliometric measures and other means to inform decisions about funding opportunities in priority areas.
It is clear that the uses for bibliometric measures extend even further in both external and internal environments. However, there are systemic issues associated with the use of bibliometrics, and they must be carefully identified and considered before making judgements based on these measures.
Common bibliometric databases, measures, and their limitations are described in section 3. In section 4, appropriate uses and recommended approaches for using bibliometric measures and analysis provide guidance to support more effective use by a variety of stakeholders.
Systemic issues with bibliometric measures and their use, however, do exist. These limitations must be carefully identified and considered before making any determinations or judgements using bibliometrics analysis.

5 White Paper Measuring Research Output through Bibliometrics
3. Common Databases, Measures and Limitations This section describes the products and measures used to capture and report bibliometric data, and their limitations. Citation-tracking databases and common bibliometric measures are all used to report bibliometric data. Before interpreting the bibliometric outputs, it is critical to understand how citation-tracking databases capture and report data and
measures, what they quantify, how the data are collected and when, and to use that information to select meaningful measures appropriate to the subject area and the context that is being measured.
Some post-secondary institutions and academic-industry collaborations have developed their own bibliometric measures using citation-tracking databases. For example, the Centre for Science and Technology Studies at Leiden University has developed a set of bibliometric measures to support the Leiden Ranking, and a consortium of academic-industry partners have developed a “recipe book” called “Snowball Metrics” to create global standards for institutional benchmarking. These tools are referenced in the examples below and use elements of the same citation-tracking databases and bibliometric measures described here.
Section 3.1 describes citation databases and outlines their limitations. Many of these limitations pertain to the nature of academic research and the commercial enterprises that produce citation-tracking databases. Section 3.2 defines six common bibliometric measures and provides an understanding of how each is used. Limitations for each measure are also described. The final section, 3.3, reflects on the impacts of using bibliometric analysis on research production.
3.1 Citation-tracking Databases
Citation-tracking databases are used extensively to collect and report a range of bibliometric measures. Citation-tracking databases are proprietary databases that index citations among the publications within their collection; key tools includeThomson Reuters’ Web of Science and Elsevier’s Scopus. Google Scholar is a another tool that generates bibliometric measures and it uses the Google search engine to crawl and index content on the Web that is considered to be scholarly. Each citation-tracking database, such as Web of Science or Scopus, applies its unique methodological approach to determine how to
Understanding how citation-tracking databases capture and report data and measures, what they quantify, how the data is collected and when, and using that information to select meaningful measures appropriate to the subject area and the context that is being measured, is a crucial task.
Each citation-tracking database applies its unique methodological approach to determine how to collect data, which journals and other works to index, as well as preferred document types. These differences, combined with differences in areas or disciplines covered by it and the methodologies used by the database, directly impact the bibliometric measures derived from using each database.

White Paper Measuring Research Output through Bibliometrics 6
collect data, which journals and other works to index, as well as preferred document types. These differences, combined with differences in areas or disciplines covered by it and the methodologies used by the database, directly impact the bibliometric measures derived from using each database.
Other research analytic products are commercially available tools that generate bibliometric data based on underlying data of citation-tracking databases. One of these products is InCites, a web-based Thomson Reuters product which uses Web of Science as a data source. SciVal, a similar Elsevier product, uses the Scopus database as a data source which makes SciVal data naturally limited to Scopus content. Products like InCites and SciVal offer institutions unique ways to explore research outputs which are not possible in a citation-tracking database’s native interface (Web of Science and Scopus). They allow institutions to analyze their research output and to benchmark against institutions on a global scale, offer opportunities to observe research outputs across a period of time, and enable institutional comparisons which can inform strategic decision making.
3.1.1 Limitations of citation-tracking databases
Citation-tracking databases are susceptible to limitations based on a number of factors:
a) the accuracy of the data, b) the parameters of their proprietary collections, c) disciplines, sub-disciplines, and related impacts d) authorship attribution methods, and e) gender bias.
Research analytic tools like InCites and SciVal are based on an underlying proprietary tracking database as the data source. Thus, while they offer interesting opportunities for different types of analysis, they retain the flaws of the underlying citation-tracking database on which they are based.
3.1.1a Data accuracy
A fundamental limitation of citation-tracking databases is that the accuracy of the data reported through the database is dependent on the accuracy of how the data is initially entered. As an example, misspellings in author names and errors in institutional attribution are commonly found in these resources. A citation-tracking database is only as good as the data that it indexes. An important approach researchers can use to ensure that their works are accurately attributed to them within citation-tracking databases is to create an author
Citation-tracking databases are susceptible to limitations resulting from the data accuracy; parameters of their proprietary collections; the nature of disciplines, sub-disciplines, and related impacts; how authorship is attributed; and gender bias.
A fundamental limitation of citation-tracking databases is that the data reported through the database is dependent on the accuracy of how the data is initially entered.

7 White Paper Measuring Research Output through Bibliometrics
profile like Open Researcher and Contributor ID (ORCID) that will proactively determine how their name will appear in published form throughout their career.
3.1.1b Collection Scope
No citation-tracking database is comprehensive. At best, each tool offers a large dataset of research outputs based on specific collection parameters. No single database indexes every type of publication, and no single citation-tracking database has the same coverage. Databases typically do not index grey literature
well, which limits the potential for understanding research impact in some disciplines. Citation analysis does not provide a comprehensive indication of a given researcher’s, or institution’s, research output.
As an example, Waterloo used InCites, a research analytic tool to analyze research productivity within a sample of researchers affiliated with the Institute for Quantum Computing (IQC). This exercise compared IQC’s Publications Database to the results of a search for publications produced by IQC researchers within InCites. While the results revealed a comparable trend between the two sources, there were important differences. InCites contained 94% of the publications that were part of the IQC Publications Database. IQC used multiple data sources to gather citation data for these publications (Web of Science, Scopus, and Google Scholar). The use of InCites (which relies on Web of Science data alone) resulted in a 23% lower citation count for the publications in the IQC Publications Database. This exercise indicates that it may be impossible to reproduce bibliometric data generated from one citation-tracking database with that created by another.
Bibliometric measures cannot offer a comprehensive data set. Consequently, anyone using bibliometric measures is advised to consider bibliometrics as reflecting a certain degree of arbitrariness. Provided that one does not expect too much precision from the exercise, one may treat the range of such analyses as a large sample of data indicating trends over time within a specific context (Allen, 2010).
Even analysing data collected from the same citation-tracking database can be problematic. If one were to compare research outputs over a ten-year timeframe using a particular set of bibliometrics, the methodology used to gather data may have changed, and certainly the data
sets themselves (authors, publications) are constantly evolving. This makes it problematic to compare the data over time. As is the case for all databases, Web of Science and Scopus
No single database indexes every type of publication, and no single citation-tracking database has the same coverage. Citation analysis does not provide a comprehensive indication of a given researcher’s, or institution’s, research output.
Bibliometrics cannot offer a comprehensive data set.
Comparing research outputs over time can be problematic. Methodology used to gather data may have changed and the data sets themselves are constantly evolving.

White Paper Measuring Research Output through Bibliometrics 8
are continuously indexing more items, which increases their coverage. This means that increased citations over time may be partly due to the fact that the underlying database simply includes more material.
Google Scholar, a popular citation-tracking tool, has its own caveats. Google Scholar finds citations by searching the web, which means that citations to papers are not always from scholarly or peer-reviewed sources. For example, an undergraduate thesis or an acknowledgement from a paper might be counted as a citation. Google Scholar searches offer limited precision for author names and lack the capability for searching affiliations/institutions. This can result in problematic results for common author names, as it is difficult to do proper refinement. Further, Google Scholar only provides bibliometric measures (h-indexes, among others) for researchers that have a Google Scholar Citations Profile, a service which requires researchers to set up a profile and
validate the publications that Google Scholar has suggested are their own.
It is impossible to reproduce bibliometric data generated from one citation-tracking database with that created by another for three main reasons:
Citation-tracking databases calculate their bibliometric data based on the items they index. For example, Web of Science does not index the journal 21st Century Music. Therefore, if a researcher publishes an article in 21st Century Music, neither that article, nor any citations it garners, will be captured by bibliometrics that use data from the Web of Science.
Bibliometric indicators offered by one source may not be offered by another source. For example InCites, which uses Web of Science data, offers the metric ‘Impact Relative to Subject Area’. In contrast, SciVal is based on Scopus data and does not offer a metric by this name.
Validation of data is difficult within sources. To report the number of citations a paper receives, Web of Science and Scopus match the references from the end of each paper to other papers that they index. When the reference matches the paper information exactly, a citation is added. The problem arises when authors incorrectly cite a paper; even a simple error in the page numbers of a reference can mean that a citation is not counted. Completely accurate citation counts are a myth.2
2 The University of Waterloo offers a number of resources to support researchers and academics to build strong tracking practices. One of these resources is the Library’s Academic Footprint Guide. This resource was developed to give authors a process that makes tracking citation counts and the h-index relatively self-sustaining over time.
Citations derived from Google Scholar are not always from scholarly or peer-reviewed sources.
It is impossible to reproduce bibliometric data generated from one citation-tracking database with that created by another. Completely accurate citation counts are a myth.

9 White Paper Measuring Research Output through Bibliometrics
The lack of grey literature in many databases also means that citation-tracking databases and bibliometric data capture only a snapshot of academically acknowledged research output and research. This is problematic where grey literature such as white papers or policy papers produced for governmental and other public organizations are important research outputs within a discipline.
3.1.1c Discipline Variations
Proprietary citation databases only include publications within their collection, but their coverage may also differ by discipline or sub-discipline. Each citation-tracking database offers different coverage of disciplines by nature of the publications in their collections. Therefore, individuals or groups interested in understanding bibliometrics within a specific discipline must acknowledge the discipline-specific effects of using that citation-tracking database on research outputs (Mryglod, Kenna, Holovatch, & Berche, 2013).
In 2005, Moed summarized the extent to which various disciplines were ‘covered’ within the Web of Science database. Moed’s summary of how extensively the Web of Science database documented research publications by disciplines is summarized in Figure 1 (Moed, 2005). Further, Wainer, and Jacques noted in 2011 that even within a discipline, bibliometric database coverage can vary significantly. As an example, discipline subsets of computer science may have very different coverage in Web of Science (Wainer, Goldenstein, & Billa, 2011). While the specific level of coverage may have changed in the ensuing years, this example provides an important demonstration of the variability with which research output is captured within various disciplines. Dorta-Gonzalez et al. suggest that important variations in publication cultures are likely only understood by individuals within that field (Dorta-Gonzalez & Dorta-Gonzalez, 2013; Stidham, Sauder, & Higgins, 2012).
Coverage in citation-tracking databases differs by discipline or sub-discipline.

White Paper Measuring Research Output through Bibliometrics 10
Figure 1: Discipline and Web of Science Coverage
A study of highly cited papers in the environmental sciences done by Khan and Ho (2012) noted that due to the interdisciplinary nature of this field, it was difficult to track publications in this subject area. The study used Web of Science categories to find environmental science articles, but found that many of the discipline’s landmark articles were not published in the journals included in this subject area.
Like interdisciplinary researchers, researchers that focused on regional issues are also at a disadvantage. As an example, major databases do not provide adequate coverage of regional journals. A researcher who publishes about New Brunswick history, or another regionally specific topic, may produce excellent quality research in regional publications; however, those publications may not necessarily be covered by citation-tracking databases. Using these databases to assess research output for individuals or institutions that publish
regionally or in interdisciplinary journals will under-represent actual output, and comparing them against researchers who publish in different regional, national, international, or discipline-specific journals is not appropriate (Moed, 2005; Van Raan, 2005).
Using citation-tracking databases to assess research output for individuals or institutions that publish regionally or in interdisciplinary journals will under-represent actual output.

11 White Paper Measuring Research Output through Bibliometrics
Disciplines also vary by the type of research output that is produced. In some disciplines, aspects of output are well captured by journal publications and citations. However, in other disciplines, the number of journal article publications and times cited can be less of an indicator of impact than is the number of patents, papers in conference proceedings, produced systems developed and widely used, data sets, or hardware and software artifacts. In the social sciences and humanities, policy papers, white papers, reports produced for government and other public organizations, and books can provide more accurate understanding of research output. In the arts, works produced, exhibitions, and performances may be more important.
Furthermore, researchers in disciplines such as Computer Science or Engineering who predominantly publish via conference proceedings will have a different understanding of their research output depending on whether they use Web of Science or Scopus. The presence of conference proceedings in Web of Science and Scopus differs. The Scopus database indexes 6.8 million conference records from 83,000 conference proceedings, including 1996 to present and back files for 1823-1996 (Elsevier, 2015). In contrast, Web of Science indexes 8.2 million conference records from 160,000 conference proceedings, including 1900 to present (Thomson Reuters, 2015). As both data sources are unique, this means that Computer Science or Engineering researchers using Scopus will have a different understanding of their output vis a vis conference proceedings compared to those using Web of Science.
In some fields of the arts and humanities, books and book chapters – not journals – constitute the major scholarly publication venues (Federation for the Humanities and Social Sciences, 2014). These are notoriously absent in tracking databases. By contrast, in the medical sciences almost all research publications are made through serial publications (Archambault & Larivière, 2010; Chang, 2013) that are very well covered in the same databases. This means that the use of bibliometrics to assess research output would not be effective for disciplines such as language and linguistics, law, political science, sociology, and educational sciences (Van Raan, 2007). The Federation for the Humanities and Social Science Research recommends that bibliometrics should not be the only tool used to assess
research productivity and outputs in the humanities and the social sciences (2014). How representative the bibliometric data are for different disciplines and their coverage of different research outputs make it integral to understand the strengths and weaknesses of a data source in order for the data to be meaningful.
Disciplines also vary by the type of research output that is produced. In some disciplines, aspects of output are well captured by journal publications and citations. In others, conference proceedings, books and book chapters constitute the major scholarly publication venues.
How representative the bibliometric data are for different disciplines and their coverage of different research outputs is integral to understand the strengths and weaknesses of a data source, and to understand the meaningfulness of the data.

White Paper Measuring Research Output through Bibliometrics 12
Citation-tracking databases do not consistently capture the various types of research productivity produced by different disciplines. As a result, there is frequently a disconnect between the amount and calibre of research produced by various disciplines and the research productivity and output data indexed by bibliometric services. Figure 2 developed by Colledge and Verlinde in 2014 illustrates, at a high level, publication behaviours across disciplines. It is necessary for users of bibliometric measures to develop a deeper understanding of how publication behaviours vary within disciplines and how that translates into coverage by citation-tracking databases. Moreover, recognition of the capacity of bibliometric measures to effectively represent discipline-level research publication and impact is also required.
Figure 2: Publication Behaviour Across Disciplines
Another issue of concern regarding citation-tracking databases is their coverage of non-English publications. Citation-tracking databases such as Web of Science favour English-speaking countries and institutions (Paul-Hus, & Mongeon, 2014; Van Raan, Leeuwen, &
Visser, 2011). Moreover, some disciplines publish primarily in English, while others do not. For example, a 2005 analysis by Archambault et al. showed that more research in the social sciences and humanities is published in languages other than English than in the natural sciences and engineering. Citation-tracking databases favour English publications; this language bias means that the social sciences and humanities are less
Citation-tracking databases favour English publications; this language bias means that the social sciences and humanities are less well represented than other disciplines where publishing in English is the norm (Archambault, Vignola-Gagnè, Côtè, Larivière & Gingras 2006).

13 White Paper Measuring Research Output through Bibliometrics
well represented than other disciplines where publishing in English is the norm (Archambault, Vignola-Gagnè, Côtè, Larivière & Gingras 2006).
In practice, awareness of language bias would influence how an individual uses a tool to make international comparisons. For example, a researcher publishing in another language should not be compared with those publishing in English. Van Raan, Leeuwen, and Visser (2011) note that the language bias in bibliometrics is carried over into university ranking programs that use bibliometrics as a measure of institutional success.
3.1.1d Attributing Authorship
Another limitation of citation-indexing databases stems from the different ways in which authorship of multi-authored publications can be attributed in citation analyses. Authorship can be attributed to all of a publication’s authors equally (full counting), or ‘fractional counting’ might be used, in which relative weights are given to authors in collaborative publications.3 This means that when citation-tracking databases are used in ranking programs and full counting authorship is used, when an author from Institution A collaborates with an author from Institution B, both institutions get credit for this paper. When fractional counting is used, weights are provided on some basis (for example, first-listed author might be weighted at 1, second-listed author at 0.8, and third-listed author at 0.6, etc.).
Authorship is assigned differently across disciplines, and sometimes even within a discipline (Abramo, D’Angelo, & Rosati, 2013; Retzer & Jurasinski, 2009). For example, in one discipline author names might be placed in alphabetical order, while in another, author names might be placed in order of contribution level. Citation databases lack the subtlety to differentiate between disciplines and how they attribute authorship.
3 The Leiden Ranking methodology provides the following example, “For instance, if the address list of a publication contains five addresses and two of these addresses belong to a particular university, then the publication has a weight of 2/5 = 0.4 in the calculation of the indicators for this university” (Centre for Science and Technology Studies, Leiden University, 2015). InCites uses whole counting for authorship and credits all authors of a paper equally (http://researchanalytics.thomsonreuters.com/m/pdfs/indicators-handbook.pdf] and Leiden provides users the option to use full or fractional counting for authorship. It is unclear whether QS uses whole or fractional counting for faculty and citation attributions. Similarly, Webometrics uses an excellence rating provided by ScImago (10% of papers by citations) but it is unclear if it is fractional. In contrast, ARWU distinguishes the order of authorship using weightings to credit the institutions to which the author is affiliated. This means that a 100% weight is assigned for corresponding author affiliation with 50% for first author affiliation (or second author affiliation if the first author is the same as the corresponding author affiliation), 25% for the next author’s affiliation, and 10% for subsequent authors (Shanghai Ranking Consultancy, 2014).
Authorship can be attributed to all of a publication’s authors equally (full counting), or relative weights can be given to authors in collaborative publications (fractional counting). Authorship is assigned differently across disciplines and citation databases lack the subtlety to differentiate between disciplines and how they attribute authorship.
White Paper Measuring Research Output through Bibliometrics 14
3.1.1e Gender Bias
Citation-tracking databases are also susceptible to gender bias. Evidence shows that in countries that produce the most research, "all articles with women in dominant author positions receive fewer citations than those with men in the same positions" (Larivière, Ni, Gingras, Cronin & Sugimoto, 2013). Women also tend to publish in predominantly domestic publications compared to their male colleagues, limiting potential international citations (Larivière, Ni, Gingras, Cronin & Sugimoto, 2013). Other research shows that authors tend to cite work of individuals of the same sex, perpetuating gender bias in male-dominated fields (Ferber & Brün, 2011; Maliniak, Powers, and Walter, 2013). Evidence also indicates that the habit of self-citing is more common among men than women (Maliniak, Powers & Walter, 2013). Further research illustrates that women are particularly disadvantaged by gender-based citation bias early in their career, a limitation which persists throughout an academic's career (Ferber & Brün, M 2011).
Recently, the Washington Post and the New York Times featured articles discussing the pervasive gender bias in both the awarding of authorship in economics research and the crediting of work produced by women and men (Guo, 2015; Wolfers, 2015). The impact of gender bias on tenure outputs is highlighted in a recent working paper by Sarsons (2015), who finds that women experience a “co-author penalty.” That is, women with a higher
proportion of co-authored papers are less likely to receive tenure. For men, whether a large fraction of their papers are sole or co-authored has no impact on their tenure prospects (Sarsons, 2015). Gender bias limits the reliability and utility of citation-based measures.
3.1.2 Summary
Citation-tracking databases are widely used tools to collect and report research outputs using a series of bibliometric measures. Understanding how these databases work and their limitations supports more effective use and accurate reporting of bibliometric measures. In Section 3.2, the bibliometric measures are captured by citation-tracking databases are described and their limitations assessed to further advance the understanding and reliability of bibliometric reporting.
Understanding how citation-tracking databases work and their limitations supports more effective use and accurate reporting of bibliometric measures.
Gender bias limits the reliability and utility of citation-based measures.
15 White Paper Measuring Research Output through Bibliometrics
3.2 Bibliometric Measures
Bibliometric measures are one type of metric, within a basket of different measures, used to assess research outputs. Other measures to understand research output exist. The most commonly known measure is peer review. The scholarly review of a researcher’s body of work by a group of peers, or experts in the same field, has long been considered the gold standard for understanding output (Abramo, D’Angelo, & Di Costa, 2011a; Abramo, D’Angelo, & Di Costa, 2011b; Haeffner-Cavaillon & Graillot-Gak, 2009; Lovegrove & Johnson, 2008; Lowry et al., 2013; Mryglod et al., 2013; Neufeld & von Ins, 2011; Rodríguez-Navarro, 2011; Taylor, 2011; Wainer & Vieira, 2013). Other measures of research output include:
the type and amount of intellectual property produced (e.g., patents, licenses, spin-offs);
the type and amount of research awards received;
the nature and number of highly qualified personnel developed by the researcher or group;
Altmetrics;4 and
publication acceptance rates (the proportion of papers or conference presentations accepted compared to the number submitted).
Acceptance rates are sometimes used as a proxy for scholarly quality.
Bibliometric measures can offer important contributions to understanding research output when used in conjunction with other measures (Pendlebury, 2009; Rodríguez-Navarro, 2011). As an example, the League of European Research Universities and the Australian Group of Eight
Coalition of research universities each identify the use of bibliometrics as one tool, among a suite of tools, to assess research output (Phillips, & Maes, 2012; Rymer, 2011). Moreover, there are cases where some papers considered in the field as ‘the best’ by experts in that field are not always the most highly cited (Coupe, 2013). Since it is widely acknowledged
4 Online events could include: • Scholarly activity - the number of times an institution’s output has been posted in commonly-used academic online tools.
For example: Mendeley, CiteULike or SlideShare. • Scholarly commentary - the number of times an institution’s output has been commented on in online tools that are
typically used by academic scholars. See above examples. • Social activity - the number of times an institution’s output has stimulated social media posts. For example: Facebook,
Twitter, and blogs (either public- or science-based). • Mass media - the number of times an institution’s output has been referred to by news websites and online media. • Online sources that have been indexed also continue to evolve, and the tools identified are not a definitive list but instead
provide examples of the type of activity that should be counted in each category (Colledge, 2014)
Bibliometric measures can offer important contributions to understanding research output when used in conjunction with other measures (Pendlebury, 2009; Rodríguez-Navarro, 2011).

White Paper Measuring Research Output through Bibliometrics 16
that the peer-review process is susceptible to bias (Butler & McAllister, 2009; Van Raan, 1996), Van Raan recommends that blending of bibliometrics and peer review could possibly mitigate prominent concerns with both methods.
This section provides a description of six of the most common bibliometric measures used by post-secondary institutions, along with limitations of their use. In addition to the definitions and limitations outlined here, Table 1 provides a brief look at each measure, its intended function, and its appropriate use. Because data for bibliometric measures are collected and analysed using citation-tracking databases, the concerns outlined for using citation-tracking databases should be considered in concert with these measures.
3.2.1 Publication Counts
Absolute number of publications. An absolute count is the cumulative total number of publications produced by an entity (researcher, centre, institute, department, institution, etc.). Publication counts are a basic component of the formula used to calculate other measures, such as citation counts, h-index, normalized citation impact, international and industrial collaborations, among others.
It is important to recognize that the terminology used to describe publications sometimes differs across resources. InCites, for example, uses the term ‘Web of Science Documents’ to capture total publications indexed by Web of Science. In contrast, Snowball Metrics, which was initially developed with SciVal, uses the term ‘Scholarly Output’ for the same purpose within the context of its data source (Colledge, 2014). Regardless, the term ‘publication count’ represents the total number of publications indexed by a particular database, within a specified area.
Bibliometric databases also use different methodologies for counting publications based on authorship. These different methods are discussed under section 3.1.1c.
3.2.1a Limitations
A simple count of publications cannot always be considered a positive indicator of research impact or quality. The significance of the publication to other researchers in the field, the type of publication in which the researcher’s work is published, and the number of collaborators on the paper are other issues related to publication counts that must be considered.
Citation-tracking databases, which provide publication count data, are inherently limited by their proprietary collection. Publication counts are only provided for the articles found in the journals indexed by that particular database. This is explored in section 3.1.
Research output also differs across disciplines. Academic disciplines – and sub-disciplines – each have their own traditions and practices for publishing and disseminating research outputs. For example, in a discipline like physics, one might expect a researcher to produce
A simple count of publications cannot always be considered a positive indicator of research impact or quality.
17 White Paper Measuring Research Output through Bibliometrics
many publications with many collaborators. In the humanities, a single author may produce a book within a much longer timeframe. Analysing publication counts across disciplines is not advised.
Analysis of publication counts among small sample sizes can lead to challenges with outliers – one, or a couple, of researchers with heavily-cited papers. It is difficult to normalize for these outlier effects. This is particularly true where research units are small and in low-citation culture disciplines (Vieira & Gomes, 2010; Abramo, D’Angelo, & Viel, 2013; Hicks, et al., 2015). At the institutional level, or in disciplines that do not publish frequently, publication counts are susceptible to outliers.
Normalizing a measure such as a publication count provides a more appropriate metric for comparing research productivity across research areas, document type, and time period. For example, Institution X has a total of 2,000 published journal articles indexed in Web of Science. Normalized publication counts may weigh an institution’s publication rate against the expected performance in the specific field or discipline (field normalized publications). While normalized measures are powerful, normalized measures with small sample sizes may be susceptible to outliers. As a result, percentiles may be a more suitable approach depending on the context in such cases.
3.2.2 Citation Counts
Absolute number of times that a given article is cited. For example, Article X has been cited 11 times, by documents indexed by Scopus. As with publication counts, citation counts may also be normalized or refined to reflect expected performance within a specific field or discipline. For example, mean normalized citation score normalizes citation counts by subject category and publication year (Waltman & Eck, 2013). The mean normalized citation score is used in the Leiden Ranking as one measure of impact.
Measures based on citations are among the most frequently used bibliometric indicators, and they are used in a myriad of ways (Mercier & Remy-Kostenbauer, 2013). As an example, a partial list of citation count based research productivity metrics used by InCites includes:
Total citations - the absolute number of citations to a specific work or group of publications.
Proportion of documents cited - the proportion of publications cited one or more times.
Citation impact - average (mean) number of citations per paper.
Normalized citation impact - citation impact (citations per paper) normalized for subject, year and document type.
Normalizing a measure such as a publication count provides a more appropriate metric for comparing research productivity across research areas, document type, and time period.

White Paper Measuring Research Output through Bibliometrics 18
Highly cited papers - papers that rank in the top 1% by citations for field and year (Thomson Reuters, 2015).
Citation-tracking databases use different types of counting to report citations. Understanding how these databases report citations is important, as they typically offer differing snapshots of research impact. For example, applying whole counting to citations for all co-authors on a given paper would typically result in higher citation totals, whereas applying fractional counting to citations for co-authored papers based on a protocol would most often present a slightly different snapshot of a researcher’s impact. As an example, consider a single paper with 100-plus contributors. University ranking results have been directly skewed by incidences of 100-plus contributors in situations where citation data was not normalized (Holmes, 2013).
3.2.2a Limitations
Bibliometric measures that use citations are fundamentally limited by the scope or coverage of the citation-tracking tools on which they rely (see section 3.1.1c). While citations offer many opportunities as a bibliometric measure, questions exist about how citation counts contribute to bibliometric analysis. Fundamentally, citation counts are based on the assumption that the greater the number of citations a publication receives, the more influential it is. Publications, however, might be cited for reasons other than direct influence:
to support arguments, as an example of a flawed methodology or weak analysis, or to indicate the amount of research conducted on an issue. The fact that an article has been cited does not necessarily indicate the influence or impact of a particular researcher (Johnson, Cohen, & Grudzinskas, 2012).
Citations can also include self-citations. A self-citation is a citation from a citing article to a source article, where the same author name is on both the source and citing articles (Thomson Reuters, 2010). Self-citations can be perceived as inflating an individual researcher’s citation count. However, there are contexts where self-citations are warranted. For example, an individual researcher may have published seminal work earlier that is relevant to the current paper, and not citing that work would be ill-advised (Carley, Porter & Youtie, 2013).
There also may be occasions where a discredited paper may receive many citations before it is retracted, and it may continue to receive citations post-retraction. In a well-publicized case, a study on genetics predicting longevity was retracted before publication in Science due to technical errors in the scientific data (Ledford, 2011). However, before the paper could be retracted it was published in PLoS One, resulting in 57 citations to the 2010 pre-print, and 73 citations to the 2012 published version. In
Publications might be cited for reasons other than direct influence. The fact that an article has been cited does not necessarily indicate the influence or impact of a particular researcher (Johnson, Cohen, & Grudzinskas, 2012).
Articles of questionable research quality can receive numerous citations before it is retracted.

19 White Paper Measuring Research Output through Bibliometrics
this case, an article of questionable research quality still received numerous citations before it was retracted.
Citation counts can also be manipulated. In one example, a university actively recruited highly cited researchers to become “distinguished adjunct professors” at its institution. In exchange for a fee, airfare, and hotel stays to visit the institution, the researchers were asked to update their Thomson Reuters’ highly cited researcher listing to include their affiliation to the university and occasionally attach the university’s name to papers that they publish. The result of this “citation for sale” approach is that the university’s rankings in certain areas were raised to levels that are generally considered unjustified (Messerly, 2014).
Another limitation is that citations are time-sensitive. A researcher’s impact is understood to change over time. More established researchers will naturally have higher citation counts than researchers early in their career, regardless of the quality of their research or findings. Citations accrue over time, thus the number of citations a publication receives will differ based on how long the publication has been published. To address this issue, citation counts should be normalized over time. However, some authors suggest citations within one to two years of publication cannot be counted accurately, even with field normalization efforts (Wang, 2013).
Moreover, each discipline is unique in how new research is disseminated and integrated into a field. The time required for research impact to be understood in the field varies by discipline. Chang notes that researchers in arts and humanities tend to cite older literature (Chang, 2013). In anatomy it can take fifty years or longer for a publication’s findings to be analyzed. Taxonomy papers, the branch of science that classifies organisms, are regularly cited decades, even 100 years, after publication (Cameron, 2005). A three-to-five year window from publication time is recommended as the ideal choice for citations within the natural sciences and engineering (Council of Canadian Academies, 2012). Others have suggested a three-year citation window is necessary for effective citation analysis (Bornmann, 2013; Wang, 2013). Using citations to understand research impact must reflect the citation culture of the discipline(s) being assessed.
Despite these limitations, citation analysis remains one of the most commonly used bibliometric measures, as well as a component of other measures, including the h-index and its related iterations. Using citation rates as a bibliometric measure can be problematic because of limitations of citation-tracking databases, differing rationale for citing publications, potential for reporting citations on retracted works, inflated citation records, opportunities for manipulation, and the time-sensitive nature of citations. Solutions are being proposed to address some of the complexity of citation analysis to achieve greater objectivity (Retzer & Jurasinski, 2009).

White Paper Measuring Research Output through Bibliometrics 20
3.2.3 H-index and other combined measures
A researcher’s h-index is x if the researcher has x papers each of which has received at least x citations. The h-index is one of a series of measures that captures output using both total number of publications and number of citations. This index is a productivity measure that can be useful for a focused snapshot of an individual’s research performance, but is not useful as a means to compare between researchers. A further discussion of the h-index can be found at http://nfgwin.uni-duesseldorf.de/sites/default/files/Ireland.pdf (Ireland, MacDonald & Stirling, 2012).
Other measures have been developed which are generalizations of the h-index, such as the g-index (“h-index for an averaged citations count”), the i10-index (number of publications with at least ten citations), the m-index (”the m-index is a correction of H-index for time”), and the Py-index (”the mean number of published items per year”) (Halbach, 2011). Measures like the h-index, m-index, and Py-index suggest trends and provide a snapshot of performance over the career of the researcher (Bornmann, 2013).
Total publication and citation counts can also be combined to create new measures of research output. The Snowball Metrics initiative uses citations per output (average citations received by each output in a particular dataset) as a measure.
3.2.3a Limitations
Using measures that combine publication and citation outputs provides opportunities to mitigate some of the limitations of using citation and publication counts alone; however, some of the limitations remain. For example, any measure that uses citations must consider that citation measures require time to accumulate and are time-dependent. In context, this means that most recent publications (those published within the last three years) should not be analyzed.
3.2.4 Collaboration Networks
The type and extent of research collaborations in publications. How collaboration is measured depends on the discipline being examined. Measuring publishing collaborations may refer to collaborations with researchers from different geographic regions, in different sectors (industry, government), or among defined groups of individuals (service providers, participants). Collaborations in the industry sector may identify opportunities for funding and partnerships. Spinoffs of industry collaborations can result in real world experiences in the form of co-op placements as well as job prospects for recent graduates. International or industry collaborations are sometimes given significance based on the citation impact of the paper produced; however, collaborations are by their nature context-dependent (Moed, 2005). As the proportion of international collaborations captures an institution’s international research collaborations, and the proportion of industry collaborations captures
Any measure that uses citations must consider that citation measures require time to accumulate and are time-dependent.

21 White Paper Measuring Research Output through Bibliometrics
an institution’s research collaborations with industry, this information can provide useful data to inform strategic directions.
InCites uses both international collaborations (number of papers having one or more international co-authors, and the proportion of publications having international co-authors) and industry collaborations (proportion of publications having co-authors from industry). The Leiden Ranking shows collaboration measures based on Web of Science data. A range of both impact and collaboration measures are presented for institutions, including collaboration with international co-authors and collaboration with industry partners.
3.2.4a Limitations
Collaboration measures are fundamentally contextual in nature. They have limited application because their meaning is specific to a field of study and the measure itself is imprecise. For example, research collaborations with industry may be more common within certain disciplines, and international collaborations may be more common within specific nations or geographic regions. Industry collaborations may be governed by non-disclosure agreements regarding intellectual property policy, and so the research results of these collaborations may never be published in peer-reviewed venues. As well, a high proportion of collaborations with industry or international peers could reflect a few collaborations among many researchers, or a high proportion of collaborations could represent numerous collaborations with a single researcher, making the measure ill-defined.
It is also true that collaboration practices change over time and, to a certain extent, are influenced by an institution’s local culture and traditions. The internet age has directly influenced a researcher’s ability to more easily explore collaborative opportunities. This could possibly complicate a retrospective analysis of collaborative measures data if the
context for collaborative practices at different points of time, within the context of a specific discipline, is unknown. Ultimately, measures of collaboration only have meaning if they are considered within the discipline and relevant time period in which the data were collected.
Ultimately, measures of collaboration only have meaning if they are considered within the discipline and relevant time period in which the data were collected.

White Paper Measuring Research Output through Bibliometrics 22
3.2.5 Journal Impact Ranking
The relative importance of the journal, not individual articles in the journal. This measure uses aggregate data of citations from articles published in the journal to determine the journal’s impact ranking (Falagas & Alexiou, 2008; Krauskopf, 2013). Thomson Reuters’ Journal Impact Factor (JIF) is a widely known example of this measure. The common rationale is that an individual researcher who publishes their research in journals with a high impact ranking produces work of higher quality.
3.2.5a Limitations
Researchers generally believe that the quality of an individual publication should be judged on its own merit. Individual article-based citation counts, rather than journal-based citation counts, are the preferred metric. Harnad (2008) observes, “comparing authors in terms of their JIFs [journal impact factors] is like comparing university student applicants in terms of the average marks of the secondary schools from which they graduated, instead of comparing them in terms of their own individual marks” (p. 104). The key to understanding this metric is that the JIF is a journal-level metric, not an article-level measure.
The JIF is also problematic when considering the differences in citation culture between disciplines. Dorta-Gonzalez compared science and social science using the JIF (2013). She noted that while there are, on average, 30% more references in social science publications than in science publications, 40% of the sources in social science are not indexed by the Thomson Reuters’ Journal Citation Reports (JCR) and therefore do not have a journal impact factor, compared to only 20% of science references that are not indexed in the same. As a result, the aggregate impact factor in science is 58% higher than in social science (Dorta-Gonzalez, 2013, p. 667-8).
This evidence does not mean that journal impact factor measures do not have a place in bibliometrics. What it does mean is that bibliometric measures need to be validated to ensure that metrics are being used for their intended purpose and capable of measuring
what they were intended to measure. The fundamental point should be to encourage researchers to publish in venues where their publications are likely to have the highest impact on the field, as opposed to publications that only provide high impact factor scores.
Researchers generally believe that the quality of an individual publication should be judged on its own merit. Individual article-based citation counts, rather than journal-based citation counts, are the preferred metric.
Researchers should be encouraged to publish in venues where their publications are likely to have the highest impact on the field, as opposed to publications that only provide high impact factor scores.

23 White Paper Measuring Research Output through Bibliometrics
3.2.6 Top Percentiles
The top percentile (for example 1% or 10%) is typically a measure of the most cited documents or citations in a subject area, document type, and year. For example, the top 10% most cited works in a specific discipline or among an institution’s publication output. The Snowball Metrics Recipe Book includes several metrics that use impact factors as part of bibliometric measures. The Publications in Top Journal Percentiles measure establishes citation limits for the top 1%, 5%, 10%, and 25% of journals being used in each publication year, and it measures the absolute count, and the proportion of total counts, of outputs that fall within each of the identified limits.
3.2.6a Limitations
Top percentiles measures require medium to large datasets to be reliable.
3.2.7 Summary
Bibliometric measures, when used appropriately and with a good understanding of the underlying limitations of citation-tracking databases used to collect them, may offer meaningful insight into research outputs. For example, when working with a large sample of works predominantly published in English which are well-represented in citation-tracking databases, it may be possible to conduct a bibliometric analysis via journal-level subject categories. In situations like this, close and careful collaboration with the researchers who produced the work is critical, and such collaboration can also support identifying peer institutions with which the final data can be compared against.
Table 1 provides a summative view of appropriate uses for bibliometric measures commonly used to assess research outcomes. Figure 3 (Abbott et a., 2010; Gagolewski, 2013, 2011; Johnson, Cohen & Grudzinkas, 2012) provides a summative illustration of the recommended uses of bibliometrics by level of analysis. These summative products can guide researchers, administrators, and others in making decisions about which measures to use for research assessment activities, as well as in interpreting the relevance and accuracy of bibliometric measures already in use.
Bibliometric measures, when used appropriately and with a good understanding of the underlying limitations of citation-tracking databases used to collect them, may offer meaningful insight into research outputs.

White Paper Measuring Research Output through Bibliometrics 24
Table 1 Bibliometric Measures, Definitions, Uses and Possible Levels of Use
Publication Count: The total count of items identified as scholarly output. For example: journal articles, books, conference proceedings, etc.
USEFUL FOR NOT USEFUL FOR POSSIBLE LEVEL OF USE AND EXAMPLES Assessing outputs of an
individual, discipline, or institution.
Assessing quality of a work. Individual Subject / Discipline Institutional E.g., Peer review, research funding
applications, researcher CVs, collaborations, research impact.
Citation count: The total number of citations received to date by the publications of a researcher, department or institution.
USEFUL FOR NOT USEFUL FOR POSSIBLE LEVEL OF USE AND EXAMPLES Measuring an element of
impact of a work or set of works.
Understanding context of the Impact (positive vs negative impacts).
Individual Subject / Discipline Institutional E.g., Peer review, research funding
applications, researcher CVs, collaborations, research impact.
Normalized Citation Impact: Actual citation impact (cites per paper) in comparison to expected citation impact (cites per paper) of subject area globally. This measure is normalized for subject area, document type, and year. A value of 1.00 indicates that the work performs at the expected global average. A value >1.00 indicates that the publication exceeds the world average.
USEFUL FOR NOT USEFUL FOR POSSIBLE LEVEL OF USE AND EXAMPLES Comparing between different
subjects and sample. Small sets of publications, as a
single highly cited paper can easily skew the calculation through inflation.
Individual Subject / Discipline Institutional E.g., Peer review, research funding
applications, researcher CVs, collaborations, research impact.

25 White Paper Measuring Research Output through Bibliometrics
H-Index: As a productivity measure, an author’s h-index can be calculated by locating citation counts for all published papers and ranking them numerically by the number of times cited. A researcher’s h-index will be the point where the number of citations most closely match the rank of the publication (or the point where all the papers ranked lower have an equal or less number of citations).
USEFUL FOR NOT USEFUL FOR POSSIBLE LEVEL OF USE AND EXAMPLES Comparing researchers of
similar career length. Comparing researchers in
similar field / subject / department and who publish in the same journal categories.
Obtaining a focused snapshot of a researcher’s performance.
Comparing researchers from different fields /disciplines /subjects.
Assessing fields / departments /subjects where research output is typically books or conference proceedings as they are not well represented by databases providing h-indices.
A focused snapshot of an individual’s performance. Caution should be used when comparing between researchers.
E.g., Peer review, research funding applications, researcher CVs.
Proportion of International Collaborations: Proportion of publications having at least two difference countries among the co-authors affiliations.
USEFUL FOR NOT USEFUL FOR POSSIBLE LEVEL OF USE AND EXAMPLES Capturing a researcher’s or
institution’s proportion of work that is co-authored with international colleagues.
Capturing research with industry that may be affected by non-disclosure agreements (NDAs), and hence not subject to publishing.
Subject / Discipline E.g., Research funding application,
strategic planning, institutional accountability process.
Proportion of Industry Collaborations: Proportions of publications having the organization type “corporate” for one or more co-author affiliation
USEFUL FOR NOT USEFUL FOR POSSIBLE LEVEL OF USE AND EXAMPLES Capturing an author’s or
institution’s proportion of work that is co-authored with industry.
Department Institutional E.g., Research funding application,
strategic planning, institutional accountability process.

White Paper Measuring Research Output through Bibliometrics 26
Journal Impact Ranking: Measures of this type use aggregate citation data of articles published in a journal to capture the journal’s relative important
USEFUL FOR NOT USEFUL FOR POSSIBLE LEVEL OF USE AND EXAMPLES Identifying relative
importance of a journal. Identifying relative importance
of individual journal articles. Determining quality of
individual journal article.
Individual Discipline Institutional
Percentiles: Top percentile (for example, 1% or 10%) is typically a measure of the most cited documents in a subject area, document type, and year. For example, the top 10% reflects the top 10% most cited works in the above context.
USEFUL FOR NOT USEFUL FOR POSSIBLE LEVEL OF USE AND EXAMPLES “Only appropriate for large to
medium size data sets as a way to measure impact by the number of works located in the top 10%” (Thomson Reuters, 2014, p. 15).
Significant caution should be used when assessing small datasets.
Subject / Discipline Institutional E.g., Research funding application,
peer review.
Highly Cited Researchers: A controversial list of highly cited Sciences and Social Sciences researchers created by Thomson Reuters. Highlights researchers whose work represents the top 1% of researchers in a field for citations.
USEFUL FOR NOT USEFUL FOR POSSIBLE LEVEL OF USE AND EXAMPLES Understanding an individual
researcher’s impact as it relates other papers in the subject matter in which they have published.
Only relevant for researchers publishing in the Sciences and Social Sciences.
Comparing researchers from different fields / subjects / departments.
Not relevant for researchers outside the Sciences or Social Sciences.
Sciences and Social Sciences Useful for peer review, research
application funding, CVs, research collaborations.
Altmetrics: Methods of evaluating and discovering scholarly work that focuses on the use of open data and social media sources. Altmetrics diverge from the traditional, where traditional is defined by publication and citation counts and their derivatives (ex. Journal impact factor and h-index).
USEFUL FOR NOT USEFUL FOR POSSIBLE LEVEL OF USE AND EXAMPLES Elements of online attention
to research. As atlmetrics are still in their infancy, researchers are just beginning to understand how atlmetrics measure impact. Generally, altmetrics providers suggest usefulness to include helping author’s see the kind of attention their work is receiving and from whom.
Analysis of a researcher/ department/ institutions work before ~2011. This is due to the reliance of atlmetric providers on social media sources, many of which were only recently created. Additionally these providers reply heavily on DOIs which have only been around since 2000.
Individual Useful for peer review, research
funding applications, CVs, strategic planning, institutional accountability planning, research collaborations.

27 White Paper Measuring Research Output through Bibliometrics
Figure 3: Recommended Uses of Bibliometric Data by Analysis Level
3.3 Implications of Bibliometric Analysis
The very process of measuring research can lead to practices that challenge research integrity. Whenever productivity is measured, the opportunity to manipulate metrics (even to commit academic misconduct) exists (Furner, 2014; Gagolewski, 2013; Hazelkorn, 2013; Hicks Wouters, Waltman, de Rijcke, & Rafols, 2015). For
example, researchers, funders, and institutions may elect to pursue research in areas that are more highly cited in the short term, rather than focusing on the researchers’ areas of interest (Wouters, 2014). A focus on only highly cited research may draw attention away from research areas that may be just as worthwhile, but are less highly cited (Michels & Schmoch, 2014; Paiva, da Silveira Nogueira Lima, & Ribeiro Paiva, 2012; Van Vught & Ziegele, 2013).
The very process of measuring research can lead to practices that challenge research integrity. Whenever productivity is measured, the opportunity to manipulate metrics (even to commit academic misconduct) exists.

White Paper Measuring Research Output through Bibliometrics 28
Post-doctoral fellows and new faculty are under particular pressure to publish in order to build their academic profiles and be considered for grants (Lawrence, 2008). Consequences of these pressures to publish range from researchers reading fewer papers, reduced interest in producing research in layperson’s terms for policy papers and for the public, and lowered incentives to publish work in domestic journals (Van Dalen & Henkens, 2012). Additionally, Van Dalen notes that researchers are more likely to engage in behaviours that will produce impressive metrics for themselves, rather than behaviours that will benefit a larger group of people. Lawrence (2008) and Retzer & Jurasinski (2009) suggest that bibliometric measures will lose meaning over time, as individuals adjust their behaviour.
4. Summary and Recommendations This examination of peer-reviewed literature and selected grey literature offers an exploration of common bibliometric measures and the databases used to capture them. Bibliometrics offer a useful approach for measuring some aspects of research outputs. Table 1 provides a helpful summary of bibliometric measures, their limitations, and their appropriate uses. A summary of the levels and types of inquiry that are appropriate, and not, in a variety of situations is provided in Table 2.
Bibliometric measures increase in utility when they are used in combination with other measures – most notably peer and other expert review – to assess research outputs. As an example of this principle, Waterloo’s Policy on Tenure and Promotion stipulates that “The
primary assessment of quality, originality and impact is made by referees and DTPC [Department Tenure and Promotion Committee] members on the basis of examining examples of the candidate’s work.” Other less direct indicators include the rigour of the review processes for journals and conferences in which the candidate has published, the standards of publishing houses for books, and the extent to which other scholars have made reference to the work. Moreover, bibliometric measures cannot reliably be used as a single indicator to reflect the breadth and depth of an academic research programme. They should not be used to compare research outputs across disciplines, or across academic units or institutions of varying sizes or research orientations, without considering context.
Bibliometric measures cannot reliably be used as a single indicator to reflect the breadth and depth of an academic research programme. They should not be used to compare research outputs across disciplines, or across academic units or institutions of varying sizes or research orientations, without considering context.
Bibliometrics offer a useful approach for measuring some aspects of research outputs.
Bibliometric measures increase in utility when they are used in combination with other measures – most notably peer and other expert review – to assess research outputs.

29 White Paper Measuring Research Output through Bibliometrics
Table 2 Bibliometric Analysis Comparison Parameters by Levels and Types of Inquiry
LEVELS AND TYPES OF INQUIRY
COMPARISON PARAMETERS FOR BIBLIOMETRIC ANALYSIS
APPROPRIATE INAPPROPRIATE Individual Researchers: 1. Understand which of
their articles have been cited, and how many times their articles have been cited within specific citation-tracking databases.
2. Gain insight into citing works and authors to assess possibilities for collaboration.
Types of analysis: Person-level analysis, to offer a personal
understanding of research output and impact examples.
Individual researchers may highlight highly cited documents in funding competitions, awards applications, or advancement packages.
Possible measures: Total publications Number of publications per year Number of citations, total and per document Highly cited publications H-index or variant Caveats and considerations: Comparisons must use same citation-tracking
database for data collection (e.g., Web of Science or Scopus).
Measures in areas that are not robust or well captured in citation tracking databases. For example, regional and interdisciplinary disciplines, or fields where books or conference proceedings are the primary forms of research output.
Performance measurement between researchers for personnel decisions, including hiring, merit review, and tenure.
Comparisons of research output among individual researchers from different disciplines or fields, at different stages of career (early or established) or with different research foci (regional-focussed research versus research focussed at a broader level).
Comparisons of women researchers’ cited works with men (there is a known bias).
Unit Heads, Faculty Deans, Centre / Institute / School Directors and Planning Staff: 1. Understand their
group’s research activity in terms of production of publication outputs and associated citations.
2. Understand performance over time, or compared with peers.
3. Validate data that external agencies have published.
Types of analysis: Research publications and citations in fields or
disciplines that are well covered in citation-tracking databases.
Performance measurement and reporting analysis may appropriately examine total documents in a citation-tracking database, in selected journal classifications where faculty members are most active. As an example, Waterloo’s Faculty of Engineering has used bibliometric measures reported using InCites along with other measures (research funding and research chairs, honours and awards) as part of a data package to support its annual strategic plan evaluation process. In 2014/15, Waterloo Engineering used:
- Total Web of Science publications in three major journal classifications in which faculty members are most active,
- Category-normalized citation impact of the above publications, and
Measures that use the H-index of researchers as the only basis for comparison, individually or across fields or disciplines without appropriate normalizations.
Measures in areas that are not robust or well captured in citation-tracking databases. For example, regional and interdisciplinary disciplines, fields where books or conference proceedings are the primary forms of research output.
Performance measurement between different Faculties or institutes; for example, comparing the Waterloo Institute for Nanotechnology with the National Institute for Nanotechnology, a joint initiative of the Government of Alberta, University of Alberta and the National Research Council.

White Paper Measuring Research Output through Bibliometrics 30
LEVELS AND TYPES OF INQUIRY
COMPARISON PARAMETERS FOR BIBLIOMETRIC ANALYSIS
APPROPRIATE INAPPROPRIATE - Percentage of documents in the top
10%, based on citations, of the selected publications (above).
The Faculty has also used bibliometric measures internally to test the validity of data that other institutions or agencies have published about Waterloo Engineering or to provide input to internal exercises to better understand Waterloo Engineering relative to key peers.
Internal reporting may examine the validity of data that other institutions or agencies have published (for example, examining Waterloo’s performance in a specific subject area as captured by a journal subject category). Note: This can only be completed at the journal classification level, and will not map directly onto the work of the faculty members within the department, Faculty or centre under consideration.
Internal reporting to provide an input to exercises aimed at better understanding the unit under consideration relative to key peers.
Performance measurement relative to a similar Faculty, Department or Centre / Institute at another university only with acknowledgement and consideration of differing contexts that would impact comparison including different missions (research or teaching), program mixes or sub-disciplines within the overall unit, regional or international foci, age of the unit, dominant language for publishing, and administrative / funding environment . For example, a comparison of the Faculty of Engineering at Waterloo with that at the University of Toronto must consider the types and numbers of researchers in each sub-discipline, the age and stage of researchers, and the age of the Faculty.
Possible measures: Number of documents cited (over time) Category normalized citation impact at the
journal subject category level
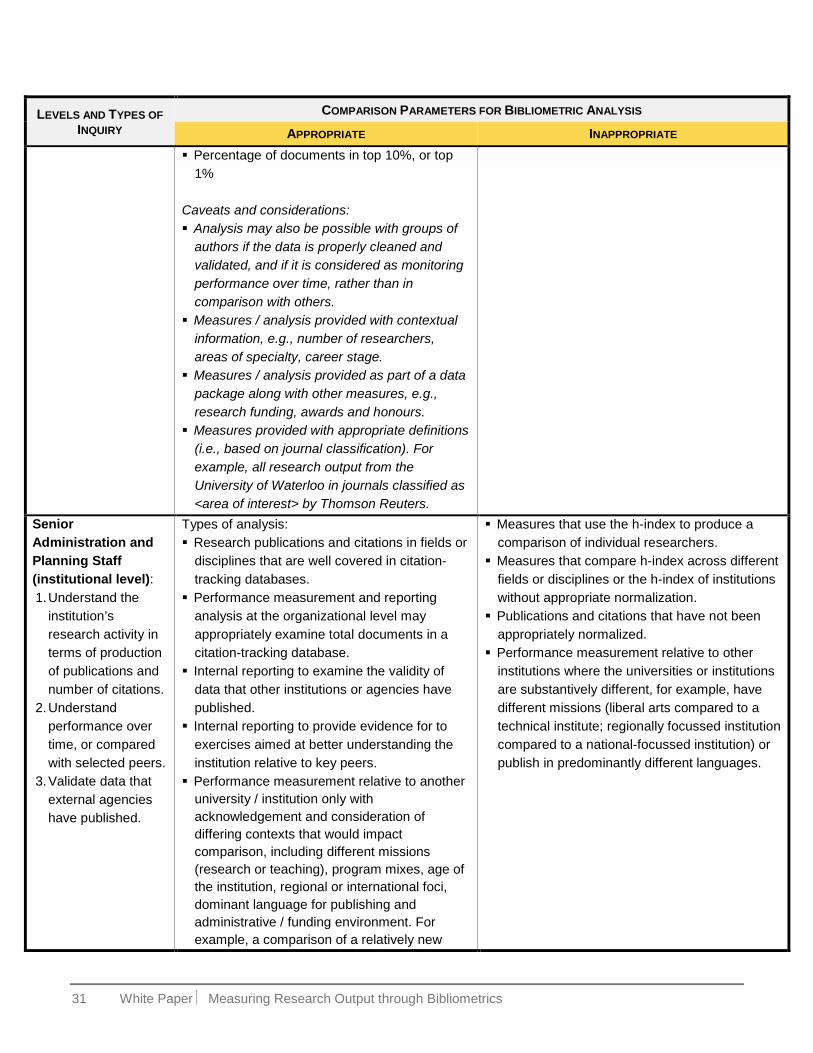
31 White Paper Measuring Research Output through Bibliometrics
LEVELS AND TYPES OF INQUIRY
COMPARISON PARAMETERS FOR BIBLIOMETRIC ANALYSIS
APPROPRIATE INAPPROPRIATE Percentage of documents in top 10%, or top
1% Caveats and considerations: Analysis may also be possible with groups of
authors if the data is properly cleaned and validated, and if it is considered as monitoring performance over time, rather than in comparison with others.
Measures / analysis provided with contextual information, e.g., number of researchers, areas of specialty, career stage.
Measures / analysis provided as part of a data package along with other measures, e.g., research funding, awards and honours.
Measures provided with appropriate definitions (i.e., based on journal classification). For example, all research output from the University of Waterloo in journals classified as <area of interest> by Thomson Reuters.
Senior Administration and Planning Staff (institutional level): 1. Understand the
institution’s research activity in terms of production of publications and number of citations.
2. Understand performance over time, or compared with selected peers.
3. Validate data that external agencies have published.
Types of analysis: Research publications and citations in fields or
disciplines that are well covered in citation-tracking databases.
Performance measurement and reporting analysis at the organizational level may appropriately examine total documents in a citation-tracking database.
Internal reporting to examine the validity of data that other institutions or agencies have published.
Internal reporting to provide evidence for to exercises aimed at better understanding the institution relative to key peers.
Performance measurement relative to another university / institution only with acknowledgement and consideration of differing contexts that would impact comparison, including different missions (research or teaching), program mixes, age of the institution, regional or international foci, dominant language for publishing and administrative / funding environment. For example, a comparison of a relatively new
Measures that use the h-index to produce a comparison of individual researchers.
Measures that compare h-index across different fields or disciplines or the h-index of institutions without appropriate normalization.
Publications and citations that have not been appropriately normalized.
Performance measurement relative to other institutions where the universities or institutions are substantively different, for example, have different missions (liberal arts compared to a technical institute; regionally focussed institution compared to a national-focussed institution) or publish in predominantly different languages.

White Paper Measuring Research Output through Bibliometrics 32
LEVELS AND TYPES OF INQUIRY
COMPARISON PARAMETERS FOR BIBLIOMETRIC ANALYSIS
APPROPRIATE INAPPROPRIATE research-intensive institution with a liberal arts primarily undergraduate university must consider and acknowledge the institutional mission, Faculties and program mix, the number of researchers at the institution by discipline, and the age of the institution.
Performance measurement can help an institution to understand and plan for strategic development of the institute. As an example, the Waterloo Institute of Nanotechnology’s (WIN) International Science Advisory Board reviews the Institute's publication counts, top journals in which Institute researchers publish, citations and funding performance to provide advice and recommendations, including strategic directions and potential partnership opportunities with similar institutes.
Possible measures: Total documents in Web of Science in selected
journal classifications (where faculty members are most active)
Category normalized citation impact Percentage of documents in top 10% or top
1% Caveats and considerations: Analysis may also be possible with groups of
authors if the data is properly cleaned and validated, and if it is analyzed over time only and not in comparison with others.
Measures / analysis provided with contextual information, e.g., number of researchers, areas of specialty, career stage.
Measures / analysis provided as part of a data package along with other measures, e.g., research funding, awards and honours.

33 White Paper Measuring Research Output through Bibliometrics
Bibliometric measures cannot be considered in isolation from the citation-tracking databases that are used to capture and report them. Taken together, these measures and the databases have important limitations to their use. These limitations include:
Citation-tracking databases use different methodologies for collecting and reporting bibliometric measures and their indexing of research publications from various fields of study can produce significant limitations to some disciplines.
Proprietary citation-tracking databases (Web of Science and Scopus) index different collections defined by the publications their commercial enterprises hold. Google Scholar, while not defined by proprietary collections, is limited by search conventions that can include-non-scholarly works. No bibliometric database indexes every type of publication, and comprehensive coverage of research publications is not possible. This limited coverage is reflected in the analytic tools (such as InCites and SciVal) using citation-tracking databases to analyse bibliometrics.
Academic disciplines produce a range of research outputs, and not all of these are indexed equally well by citation-tracking databases. These outputs include number of patents, papers in conference proceedings, produced systems developed and widely used, data sets, hardware and software artifacts, policy papers, white papers, reports produced for government and other public organizations, books, or exhibitions.
Citation-tracking databases do not have good coverage of research that is not published in English, interdisciplinary research or research of regional importance, and cannot provide field-specific context for research outputs like the extent and type of some research collaborations.
The practice of attributing citations, and collecting citation data, differs across disciplines and fields. In some fields citations accrue only many years after a work is published, in other fields citations accrue primarily within only a few years after publication. Differences in citation practices carry over into every bibliometric measure that uses citations as part of calculating the metric, including h-index.
There is evidence of gender bias in citation practices. This bias underestimates contributions made by women researchers. This factor must be taken into consideration when conducting citation analysis.
Bibliometric measures taken at different times cannot always be meaningfully compared. First, citations, a key research bibliometric measure, accrue with time after publication. Second, the time required for understanding the impact of a paper using citations differs by discipline. Finally, citation databases themselves change their methodology and journal coverage over time.
The use of bibliometric measures may lead to changes not only in how researchers choose to publish, to increase opportunities for enhanced coverage in citation databases, but also in what they choose to research. It may provide opportunities

White Paper Measuring Research Output through Bibliometrics 34
and incentives to manipulate metrics. Cross-disciplinary differences in the ease of use for bibliometric tools, moreover, may be misinterpreted as cross-disciplinary differences in research activity or impact itself.
4.1 Recommended Practices for Bibliometric Analysis
The use of bibliometrics, and bibliometric analysis, is a common approach for measuring research outputs. If used carefully, bibliometric measures can provide a data point, in conjunction with others, for evaluating research outputs. The following recommendations are suggested to researchers, administrators, and others interested in using bibliometrics or assessing the relevance of bibliometric results. These recommendations speak only to the methodological reliability of bibliometric measures, as indicated in the relevant literature. University policies (such as Waterloo's Policy 77 on Tenure and Promotion) may direct the use of these measures.
For Researchers:
Define a researcher’s identity convention as an author early, and use that convention systematically throughout their career. Appropriate affiliation to the University of Waterloo is also important. As an example, researchers can increase the likelihood that their works will be accurately attributed to them within citation-tracking databases by proactively determining how their name will appear in published form throughout their career by creating an author profile such as an Open Researcher and Contributor ID (ORCID).
For All Users:
Approach the process of analysing research outputs in the same way that one would conduct good research:
develop a strong research question with the scope and clarity appropriate to the discipline and issue under consideration,
assess whether bibliometric measures can appropriately provide the information required to answer the research question; if not, it may be necessary to revise the research question or use other measures,
if bibliometric measures are indicated, select appropriate tools and measures to investigate the research question,
be explicit about other non-bibliometric data sources that should also be considered, and
understand the research and comparison context, including discipline-specific effects and the implications of sample size.
Consider bibliometrics as one measure among a set of others for understanding research output and impact. Best practice is to work from a basket of measures. It is impossible for any bibliometric analysis to present a complete picture. Bibliometrics is optimally used to complement, not replace, other research assessment measures, such as peer review,

35 White Paper Measuring Research Output through Bibliometrics
keeping in mind that “both need to be used with wisdom, discretion and the rigorous application of human judgement” (Phillips & Maes, 2012, p. 3).
Understand and account for variations in how disciplines produce and use research publication. Avoid comparisons that the measurement tools and key concepts cannot support. The nature of research (and more generally, scholarly) output (e.g., journal articles, books and book chapters, conference proceedings, performances, social outputs, research artifacts) differs across disciplines, and thus the relevance and applicability of bibliometrics also differs across disciplines. It is important to use bibliometric measures relevant for each discipline and to recognize that meaningful comparisons across those measures may not be possible.
Involve those being evaluated in the process and provide them with interpretive information. Given the significant role and impact of context in the use of bibliometrics, researchers in the field or discipline in question may be best equipped to understand and explain the variability of how bibliometric measures capture and reflect research outputs in their field. This will help to ensure that using bibliometric measures incorporates a full understanding of their limitations, particularly at the discipline level.
Understand the distinctions among bibliometric measures. Be aware of the methodology, purpose, and limitations of bibliometric databases (such as Web of Science, Scopus, and Google Scholar) and of individual bibliometric measures (such as the Journal Impact Factor and h-index). As an example, it is important to recognize the value of normalized measures compared to whole/raw count while also recognizing that normalized measures can be vulnerable to outliers (e.g., a single highly cited paper can increase the average somewhat artificially). Regular review and updating of research methods and definitions will ensure a strong and current understanding of methodologies used.
Exercise caution when using journal impact rankings. Journal impact rankings such as JIF or SCImago Journal Rank (SJR) should not be broadly used as a surrogate measure of the quality of individual research articles or an individual’s overall performance when opportunities exist for an in-depth evaluation of individual publications.
White Paper Measuring Research Output through Bibliometrics 36
Appendix A: Working Group on Bibliometrics Members
Advisory Group Members:
Director, Institutional Analysis & Planning: Allan Starr University Librarian: Mark Haslett Vice President, University Research: George Dixon
Working Group Members:
Chair: Bruce Muirhead (to August, 2015), Tamer Ozsu (beginning September 2015) Office of Research: John Thompson, Brenda MacDonald Institutional Analysis & Planning: Daniela Seskar-Hencic, Jana Carson, Kerry Tolson Library: Kathy MacDonald, Shannon Gordon, Pascal Calarco, Peter Stirling, MLIS co-op student AHS: Brian Laird Arts: Tim Kenyon, Angela Roorda, Jennifer Simpson Science: Alain Francq, Bernie Duncker Math: Tamer Özsu, Kim Tremblay Engineering: Anwar Hasan, Martha Foulds Environment: Maren Oelberman
Past Working Group Members:
AHS: John Mielke Library: Lauren Byl (Graduate Student), Susie Gooch (Graduate Student) Science: Marc Gibson

37 White Paper Measuring Research Output through Bibliometrics
Appendix B: Evidence-gathering Process Used
1 Searching was conducted during January through August 2014. Note that as additional, relevant literature was discovered throughout the project, further items were added to RefWorks and reviewed as required.
2Searching was led by a Master of Library and Information Science student, working in a co-op position, with the support of a Professional Librarian, as well as the White Paper Working Group. Sample search strings included: “citation analysis” AND “best practices” “citation analysis” AND standards “citation analysis” AND “current uses” “bibliometrics” OR “citation analysis” (“bibliometrics” OR “citation analysis”) AND humanities (“bibliometrics” OR “citation analysis”) AND science (“bibliometrics” OR “citation analysis”) AND “peer review” (“bibliometrics” OR “citation analysis”) AND manipulation
3 This work was also completed by a Master of Library and Information Science student, employed in a co-op position.
Keywords and concepts identified by White Paper
Working Group to determine scope and coverage of
evidence-gathering. Inclusion criteria identified as 2010-
2014.1
Compressive literature search conducted in: Library and
Information Science & Technology Abstracts, Web
of Science, Scopus, and Google Scholar.2
Team members identified relevant position papers (grey
literature) through a further environmental scan.
Bibliographic information for all publications collected and
managed in a RefWorks database.
First-level review: Publications reviewed to
identify obviously irrelevant items.3 204 items remained.
Second-level review: team members reviewed title,
abstract and keywords for each item. 114 items
remained.
Team members reviewed remaining 114 items; citations
were reviewed and papers scanned for relevance. Team
members read and summarized remaining key
articles.
As additional, relevant literature was discovered
throughout the project, items were added to RefWorks and
reviewed as required. Included 48 items.
~70 items included as evidence in the White Paper.

White Paper Measuring Research Output through Bibliometrics 38
Appendix C: White Paper Consultation Process A three-step consultation process was used to consult with and gain input from stakeholders representing a variety of University groups. This process was robust and integral to the development of the White Paper. Stakeholders made important contributions to the White Paper, adding additional dimensions of analysis and understanding and enhancing clarity and relevance. After each consultation step, the suggestions and comments were consolidated, reviewed and assessed by the Working Group on Bibliometrics and relevant changes made by the Principal Writer. Once the White Paper is finalized, it will be shared with administrators and researchers at other universities.
The phases, timeline and audiences for the consultation are outlined in the following table.
Phase Timeline Stakeholders
1. Bibliometrics Leadership
June – August, 2015
Working Group on Bibliometrics Advisory Group Provost
2. Broad Campus October – November, 2015
Deans’ Council Associate Deans, Research Faculty Association of the
University of Waterloo Undergraduate Student Relations
Committee Graduate Student Relations
Committee Library staff Institutional Analysis and Planning
unit Campus at large
3. Executive & Senior Institutional Leadership
February, 2016 Senate Graduate and Research Council
Senate

39 White Paper Measuring Research Output through Bibliometrics
References Abbott, A., Cyranoski, D., Jones, N., Maher, B., Schiermeier, Q., & Van Noorden, R. (2010). Do metrics matter? Nature, 465(7300), 860-862. doi:10.1038/465860a
Abramo, G., D’Angelo, C. A., & Di Costa, F. (2011a). National research assessment exercises: a comparison of peer review and bibliometrics rankings. Scientometrics, 89(3), 929-941. doi:10.1007/s11192-011-0459-x
Abramo, G., D’Angelo, C. A., & Di Costa, F. (2011b). A national-scale cross-time analysis of university research performance. Scientometrics, 87(2), 399-413. doi:10.1007/s11192-010-0319-0
Abramo, G., D’Angelo, C. A., & Viel, F. (2013). The suitability of h and g indexes for measuring the research performance of institutions. Scientometrics, 97(3), 555-570. doi:10.1007/s11192-013-1026-4
Abramo, G., D’Angelo, C., & Rosati, F. (2013). Measuring institutional research productivity for the life sciences: the importance of accounting for the order of authors in the byline. Scientometrics, 97(3), 779-795. doi:10.1007/s11192-013-1013-9
Allen, M. A. (2010). On the current obsession with publication statistics. Scienceasia, 36(1), 1-5. doi:10.2306/scienceasia 1513-1874.2010.36.001
Archambault, E., Vignola-Gagnè, E., Côtè, G., Larivière, V., & Gingras, Y. (2005). In Ingwersen P. L.,B. (Ed.), Welcome to the Linguistic Warp Zone: Benchmarking scientific output in the social sciences and humanities
Archambault, E., & Larivière, V. (2010). The limits of bibliometrics for the analysis of the social sciences and humanities literature. World Social Science Report: Knowledge Divides. (pp. 251-254). Paris: UNESCO Publishing and International Social Science Council.
Archambault, E., Vignola-Gagnè, E., Côtè, G., Larivière, V., & Gingras, Y. (2006). Benchmarking scientific output in the social sciences and humanities: The limits of existing databases. Scientometrics, 68(3), 329-342. doi:10.1007/s11192-006-0115-z
Bartneck, C., & Kokkelmans, S. (2011). Detecting h-index manipulation through self-citation analysis. Scientometrics, 87(1), 85-98. doi:10.1007/s11192-010-0306-5
Bornmann, L. (2013). The problem of citation impact assessments for recent publication years in institutional evaluations. Journal of Informetrics, 7(3), 722-729. doi:10.1016/j.joi.2013.05.002
Bornmann, L., & Marx, W. (2014). How should the societal impact of research be generated and measured? A proposal for a simple and practicable approach to allow interdisciplinary comparisons. Scientometrics, 98(1), 211-219. doi:10.1007/s11192-013-1020-x
Bornmann, L., Mutz, R., Neuhaus, C., & Daniel, H. (2008). Citation counts for research evaluation: standards of good practice for analyzing bibliometric data and presenting and interpreting results. Ethics in Science and Environmental Politics, 8(1), 93-102.
Butler, L., & McAllister, I. (2009). Metrics or peer review? Evaluating the 2001 UK research assessment exercise in political science. Political Studies Review, 7(1), 3-17. doi:10.1111/j.1478-9299.2008.00167.x
Cameron, B. (2005). Trends in the usage of ISI bibliometric data: Uses, abuses, and implications. Portal-Libraries and the Academy, 5(1), 105-125. doi:10.1353/pla.2005.0003
Carley, S., Porter, A. L., & Youtie J. (2013). Toward a more precise definition of self-citation. Scientometrics, 94(2), 777-780. doi:10.1007/s11192-012-0745-2
Centre for Science and Technology Studies, Leiden University. (2015). Indicators. Retrieved from http://www.leidenranking.com/methodology/indicators
Chang, Y. (2013). A comparison of citation contexts between natural sciences and social sciences and humanities. Scientometrics, 96(2), 535-553. doi:10.1007/s11192-013-0956-1

White Paper Measuring Research Output through Bibliometrics 40
Colledge, L. (2014). Snowball Metrics Recipe Book. Retrieved from http://issuu.com/elsevier_marketing/docs/ snowball_recipe_book?e=6626520/8370502
Colledge, L., & Verlinde, R. (2014). SciVal: SciVal Metrics Guidebook. Retrieved from http://www.elsevier.com/__data/ assets/pdf_file/0020/53327/scival-metrics-guidebook-v1_01-february2014.pdf
Council of Canadian Academies. Expert Panel on Science Performance and Research Funding (Ed.). (2012). Informing research choices: Indicators and judgement. Ottawa: Council of Canadian Academies.
Coupe, T. (2013). Peer review versus citations - An analysis of best paper prizes. Research Policy, 42(1), 295-301. doi:10.1016/j.respol.2012.05.004
Dorta-Gonzalez, P., & Dorta-Gonzalez, M. I. (2013). Comparing journals from different fields of science and social science through a JCR subject categories normalized impact factor. Scientometrics, 95(2), 645-672. doi:10.1007/s11192-012-0929-9 research/science-society/document_library/pdf_06/assessing-europe-university-based-research_en.pdf
Elsevier. (2015). Content. Retrieved from http://www.elsevier.com/solutions/scopus/content
Falagas, M. E., & Alexiou, V. G. (2008). The top-ten in journal impact factor manipulation. Archivum Immunologiae Et Therapiae Experimentalis, 56(4), 223-226. doi:10.1007/s00005-008-0024-5
Federation for the Humanities and Social Sciences. (2014). The Impacts of Humanities and Social Science Research: Working Paper. Retrieved from http://www.ideas-idees.ca/sites/default/files/2014-10-03-impact-project-draft-report-english-versionfinal2.pdf
Ferber, M. A., Brün, M. (2011) The gender gap in citations: Does it persist? Feminist Economics, 17(1):151-158. doi:10.1080/13545701.2010.541857
Furner, J. (2014). The ethics of evaluative bibliometrics. In B. Cronin, & C. R. Sugimoto (Eds.), Beyond bibliometrics: harnessing multidimensional indicators of scholarly impact (pp. 85-85-107). Cambridge, Massachusetts: MIT Press.
Friedman, B., & Schneider, F. B. (2015). Computing Research Association: Incentivizing Quality and Impact: Evaluating Scholarship in Hiring, Tenure, and Promotion. Retrieved from http://www.cra.org/uploads/documents/resources/ bpmemos/BP_Memo
Gagolewski, M. (2013). Scientific impact assessment cannot be fair. Journal of Informetrics, 7(4), 792-802. doi:10.1016/j. joi.2013.07.001
Haeffner-Cavaillon, N., & Graillot-Gak, C. (2009). The use of bibliometric indicators to help peer-review assessment. Archivum Immunologiae Et Therapiae Experimentalis, 57(1), 33-38. doi:10.1007/s00005-009-0004-2
Harnad, S. (2008). Validating research performance metrics against peer rankings. Ethics in Science and Environmental Politics, 8(1), 103-107.
Hazelkorn, E. (2013). World-class universities or world-class systems? Rankings and higher education policy choices. In P. T. M. Marope, P. J. Wells, E. Hazelkorn & UNESCO (Eds.), Rankings and accountability in higher education : uses and misuses (pp. 72). Paris: UNESCO.
Hicks, D., Wouters, P., Waltman, L., de Rijcke, S., & Rafols, I. (2015). Leiden Manifesto for research metrics. Nature, 520, 429-431.
Holmes, R. (2013, June 29). Competition and controversy in global rankings. University World News. Retrieved from http:// www.universityworldnews.com/article.php?story=20130626160718267
Institute of Electrical and Electronics Engineers. (2013). Appropriate use of bibliometric indicators for the assessment of journals, research proposals, and individuals. Geoscience and Remote Sensing Magazine, IEEE, 1(4), 54-55. doi:10.1109/ MGRS.2013.2289876
Ireland, T., MacDonald K., & Stirling P. (2012). The H-index: what is it, how do we determine it, and how can we keep up with it? In A. Tokar, B. Beurskens, S. Keuneke, M. Mahrt, I. Peters, C. Puschmann, T. van Treeck & K. Weller (Eds.), Science and the internet (pp. 237-247). Düsseldorf: Düsseldorf University Press. Retrieved from http://nfgwin.uni-duesseldorf.de/sites/default/files/Ireland.pdf
Johnson, M. H., Cohen, J., & Grudzinskas, G. (2012). The uses and abuses of bibliometrics. Repoductive BioMedicine Online (Elsevier Science), 24(5), 485-486. doi:10.1016/j.rbmo.2012.03.007

41 White Paper Measuring Research Output through Bibliometrics
Khan, M. A., & Ho, Y. (2012). Top-cited articles in environmental sciences: Merits and demerits of citation analysis. Science of the Total Environment, 431, 122-127. doi:10.1016/j.scitotenv.2012.05.035
Krauskopf, E. (2013). Deceiving the research community through manipulation of the impact factor. Journal of the American Society for Information Science & Technology, 64(11), 2403-2403. doi:10.1002/asi.22905
Larivière V., Ni C., Gingras Y., Cronin B. & Sugimoto C. R. (2013,December 12). Global gender disparities in science. Nature, 504, 211-213. Retrieved from http://doc.sciencenet.cn/upload/file/20131212152030894.pdf
Lawrence, P. A. (2008). Lost in publication: how measurement harms science. Ethics in Science and Environmental Politics, 8(1), 9-11.
Ledford, H. (2011). Paper on genetics of longevity retracted. Retrieved from http://www.nature.com/news/2011/110721/full/ news.2011.429.html
Lovegrove, B. G., & Johnson, S. D. (2008). Assessment of Research Performance in Biology: How Well Do Peer Review and Bibliometry Correlate? Bioscience, 58(2), 160-164. doi:10.1641/B580210
Lowry, P. B., Moody, G. D., Gaskin, J., Galletta, D. F., Humpherys, S. L., Barlow, J. B., & Wilson, D. W. (2013). Evaluating journal quality and the association for information systems senior scholars’ journal basket via bibliometric measures: do expert journal assessments add value? Mis Quarterly, 37(4), 993-1012.
Maliniak D., Powers R., & Walter B. (2013). The gender citation gap in international relations. International Organization, 67(4), 889-922. doi:10.1017/S0020818313000209.
Marope, P. T. M., Wells, P. J., Hazelkorn, E., & UNESCO. (2013). Rankings and accountability in higher education: uses and misuses. Paris: UNESCO.
Mercier, P., & Remy-Kostenbauer, P. (2013). Citations impact at the University of Ottawa. (Internal). Institutional Research and Planning.
Messerly, M. (2014, December 05). Citation for sale. The Daily Californian. Retrieved from http://www.dailycal.org/2014 /12/05/citations-sale
Michels, C., & Schmoch, U. (2014). Impact of bibliometric studies on the publication behaviour of authors. Scientometrics, 98(1), 369-385. doi:10.1007/s11192-013-1015-7
Moed, H. (2005). Citation analysis in research evaluation. Dordrecht : Springer.
Morphew, C. C., & Swanson, C. (2011). On the efficacy of raising your university’s rankings. In J. C. Shin, R. K. Toutkoushian & U. Teichler (Eds.), University rankings: Theoretical basis, methodology and impacts on global higher education. (pp. 185) Springer.
Mryglod, O., Kenna, R., Holovatch, Y., & Berche, B. (2013). Comparison of a citation-based indicator and peer review for absolute and specific measures of research-group excellence. Scientometrics, 97(3), 767-777. doi:10.1007/s11192-013-1058-9
Neufeld, J. ö., & von Ins, M. (2011). Informed peer review and uninformed bibliometrics? Research Evaluation, 20(1), 31-46. doi:10.3152/095820211X12941371876382
O’Neill-Yates, C. (2006). The Secret Life of Ranjit Chandra. Retrieved from http://www.infactcanada.ca/Chandra_Jan30_ 2006.htm
ORCID. (2014). What is ORCID? Retrieved from http://orcid.org/about/what-is-orcid
Paiva, C., da Silveira Nogueira Lima, J., & Ribeiro Paiva, B. (2012). Articles with short titles describing the results are cited more often. Clinics, 67(5), 509-513. doi:10.6061/clinics/2012(05)17
Paul-Hus, A. & Mongeon, P. (2014). The journal coverage of bibliometric databases: A comparison of Scopus and Web of Science. Retrieved from http://www.asis.org/SIG/SIGMET/data/uploads/sigmet2014/mongeon.pdf
Pendlebury, D. (2009). The use and misuse of journal metrics and other citation indicators. Archivum Immunologiae Et Therapiae Experimentalis, 57(1), 1-11. doi:10.1007/s00005-009-0008-y
Phillips, M. & Maes, K. (2012). Research universities and research assessment. Retrieved from http://www.leru.org/files/ publications/LERU_PP_2012_May_Research_Assesment.pdf

White Paper Measuring Research Output through Bibliometrics 42
Retzer, V., & Jurasinski, G. (2009). Towards objectivity in research evaluation using bibliometric indicators - A protocol for incorporating complexity. Basic and Applied Ecology, 10(5), 393-400. doi:10.1016/j.baae.2008.09.001
Rodríguez-Navarro, A. (2011). Measuring research excellence number of Nobel Prize achievements versus conventional bibliometric indicators. Journal of Documentation, 67(4), 582-600. doi:10.1108/00220411111145007
Rymer, L. (2011). Group of Eight backgrounder: Measuring the impact of research - the context for metric development. Turner, ACT, Australia: Group of Eight. San Francisco declaration on research assessment. (2012). Retrieved from http://www.ascb.org/dora-old/files/SFDeclarationFINAL.pdf
Sarsons, H. (2015). Gender differences in recognition for group work. Retrieved from http://scholar.harvard.edu/files/ sarsons/files/gender_groupwork.pdf?m=1449178759
Shanghai Ranking Consultancy. (2014). Academic ranking of world universities: Methodology. Retrieved from http://www. shanghairanking.com/ARWU-Methodology-2014.html
Stidham, R. W., Sauder, K., & Higgins, P. D. R. (2012). Using bibliometrics to advance your academic career. Gastroenterology, 143(3), 520-523.
Taylor, J. (2011). The assessment of research quality in UK universities: Peer review or metrics? Blackwell Publishing Ltd, 22(2), 202-217. doi:10.1111/j.1467-8551.2010.00722.x
Thomson Reuters. (2010). Glossary. Retrieved from http://incites.isiknowledge.com/common/help/h_glossary.html
Thomson Reuters. (2014). InCites indicators handbook. Retrieved from https://researchanalytics.thomsonreuters.com/m/ pdfs/indicators-handbook.pdf
Thomson Reuters. (2015). Conference proceedings citation index. Retrieved from http://thomsonreuters.com/en/products-services/scholarly-scientific-research/scholarly-search-and-discovery/conference-proceedings-citation-index.html
Todd, P. A., & Ladle, R. J. (2008). Hidden dangers of a ‘citation culture’. Ethics in Science and Environmental Politics, 8(1), 13-16.
Van Dalen, H. P., & Henkens, K. (2012). Intended and unintended consequences of a publish-or-perish culture: A worldwide survey. Journal of the American Society for Information Science and Technology, 63(7), 1282-1293. doi:10.1002/asi.22636
Van Raan, A. F. J. (1996). Advanced bibliometric methods as quantitative core of peer review based evaluation and foresight exercises. Scientometrics, 36(3), 397-420.
Van Raan, A. F. J. (2005). Fatal attraction: Conceptual and methodological problems in the ranking of universities by bibliometric methods. Scientometrics, 62(1), 133-143.
Van Raan, A. F. J. (2007). Challenges in the ranking of universities. In J. Sadlak, & L. N. Cai (Eds.), The world-class university and ranking: Aiming beyond status. (pp. 87-88-121). Shanghai: Cluj University Press.
Van Raan, A. F. J., Leeuwen, T., & Visser, M. (2011). Severe language effect in university rankings: particularly Germany and France are wronged in citation-based rankings. Scientometrics, 88(2), 495-498. doi:10.1007/s11192-011-0382-1
Van Vught, F., & Ziegele, F. (Eds.). (2011). Design and testing the feasibility of a multidimensional global university ranking: Final report. Consortium for Higher Education and Research Performance Assessment. Retrieved from http://ec.europa.eu/education/library/study/2011/multirank_en.pdf
Van Vught, F., & Ziegele, F. (2013). U-Multirank: A user-driven and multi-dimensional ranking tool in global higher education and research. In P. T. M. Marope, P. J. Wells, E. Hazelkorn & UNESCO (Eds.), Rankings and accountability in higher education: uses and misuses (pp. 258). Paris: UNESCO.
Vieira, E. S., & Gomes, J. A. N. F. (2010). A research impact indicator for institutions. Journal of Informetrics, 4(4), 581-590. doi:10.1016/j.joi.2010.06.006
Von Bohlen, U. H. O. (2011). How to judge a book by its cover? How useful are bibliometric indices for the evaluation of “scientific quality” or “scientific productivity”? Annals of Anatomy-Anatomischer Anzeiger, 193(3), 191-196. doi:10.1016/j.aanat.2011.03.011
Wainer, J., Goldenstein, S., & Billa, C. (2011). Invisible work in standard bibliometric evaluation of computer science. Communications of the ACM, 54(5), 141-146. doi:10.1145/1941487.1941517

43 White Paper Measuring Research Output through Bibliometrics
Wainer, J., & Vieira, P. (2013). Correlations between bibliometrics and peer evaluation for all disciplines: the evaluation of Brazilian scientists. Scientometrics, 96(2), 395-410. doi:10.1007/s11192-013-0969-9
Waltman, L., & Eck, N. (2013). Source normalized indicators of citation impact: an overview of different approaches and an empirical comparison. Scientometrics, 96(3), 699-716. doi:10.1007/s11192-012-0913-4
Wang, J. (2013). Citation time window choice for research impact evaluation. Scientometrics, 94(3), 851-872. doi:10.1007/ s11192-012-0775-9
Wouters, P. (2014). The citation: From culture to infrastructure. In B. Cronin, & C. R. Sugimoto (Eds.), Beyond bibliometrics: harnessing multidimensional indicators of scholarly impact (pp. 47-47-66). Cambridge, Massachusetts: MIT Press.