who closed the schools?
TRANSCRIPT
Who Closed the Schools?
Joshua Coval
Working Paper 21-127
Working Paper 21-127
Copyright © 2021 by Joshua Coval.
Working papers are in draft form. This working paper is distributed for purposes of comment and discussion only. It may not be reproduced without permission of the copyright holder. Copies of working papers are available from the author.
Funding for this research was provided in part by Harvard Business School.
Who Closed the Schools? Joshua Coval Harvard Business School
Who closed the schools?
Joshua Coval* Harvard Business School
Abstract
This paper examines the differences in characteristics between US public schools that opted for virtual instruction because of Covid-19, and schools that did not. Much of the variation can be explained by measures of the degree to which districts favored teachers over students before the pandemic: Districts that chose virtual instruction exhibited a far greater willingness to prioritize teacher interests over those of students and the interests of teachers with seniority over younger and/or higher-performing teachers. We provide evidence that this prioritization is associated with significant costs in terms of student test results and graduation rates.
* I would like to thank, without implicating, Malcolm Baker, Robin Greenwood, Jeff Pontiff, Rick Ruback, Erik Stafford, and seminar participants at the University of Mannheim for invaluable comments and suggestions.
During the 2020-2021 school year, the average US public school student spent over 38 percent of the year receiving virtual instruction. Behind this average is a highly variable district-level response. Of the 48 million public school students we studied, 18.5 million, or 38 percent spent almost their entire year receiving in-person instruction. 4.5 million, or 9 percent, spent most of their year online. Although it will take time to assess the learning lost as a result of virtual instruction, we already know that it will be significant1, with some studies2 suggesting that the 4.5 million students that spent the year online will begin this fall a full year academically behind their peers at in-person schools. If this turns out to be accurate, the year of lost schooling will come at tremendous cost – in terms of life expectancy3, incarceration rates4, and lifetime income5 – to these students and to society at large.
What explains these vast differences in how districts responded to the pandemic? For instance, why does the response of the average district in New Jersey look quite similar to that of the average district in Kentucky (42.5-44.6% in-person) but entirely different from that of DC (0% in-person) or Florida (100% in-person)? A natural explanation is that Covid rates were higher – and therefore the risks from in-person instruction where greater – in the States and districts that chose virtual instruction. A quick look at the Table 1 reveals the opposite to be the case. Cumulative Covid rates at the start of the academic year as well as those at the end of the year were significantly lower in states that chose virtual learning.
One approach to understanding school policy is to recognize it as weighing the sometimes-conflicting interests of its three main constituents: teachers, students and their families, and taxpayers. Along many dimensions, the interests of students and teachers are aligned. For instance, both benefit from small class sizes and higher pay that helps attract high-quality teachers. Along other dimensions, such as the length of the school day or reliance on seniority over teacher skill, student and teacher interests diverge. The pandemic unquestionably brought their interests into sharp conflict, as the costs of virtual instruction fell disproportionately on students, whereas the health risks from live instruction fell disproportionately on teachers.
In this study, we assemble data on the largest 150 school districts in the United States, including a large set of characteristics of performance, demographics, and geography. For each of these districts, we track weekly instruction format – in-person, virtual, or hybrid – throughout the 2020-2021 academic year along with weekly county-level Covid rates. This data is then merged with district-level characteristics of teachers’ employment contracts prior to the pandemic.
Which schools chose to favor teacher interests over those of their students? The answer turns out to be quite simple: it was those schools that had demonstrated a willingness to do so in the past. Schools that chose virtual instruction during the 2020-2021 school year were schools that, prior to the pandemic, had a history of favoring teachers over students. During the 2018-2019 year, students at schools that would later opt for online instruction had school days that were 18 minutes (4 percent) shorter. Their teachers spent 30 fewer minutes at school each day and 1.5 fewer non-teaching days at school each year.
1 See Chen et al., 2021, Norris, 2021, and Dickler, 2021. 2 Engzell et al., 2021. 3 Lleras-Muney, 2005. 4 Jackson et al., 2013. 5 Ahmad and Miller, 2015.
Taken together, these numbers mean that at the schools that chose to be online the average teacher works 100 fewer hours per year than the average teacher in the schools that chose to educate their students in person. For the K-12 student in an online school, this difference in hours cumulates to over a half-year less instruction by the time they graduate relative to their peer at an in-person school.
Online schools also favor teachers with seniority over teachers that are new and/or high-performing. For new instructors, annual salaries are 6 percent above those at in-person schools. But after 10 years, this gap grows to 11 and the maximum pay of teachers at online schools is 19 percent greater than those of in-person schools. Online districts are also 36 percent less likely to include any form of additional compensation related to performance. Almost all grant teacher tenure – 20 percent more likely than their in-person counterparts. And when teachers need to be transferred to another school to address changes in enrollment or to meet specific teaching needs, online districts are almost twice as likely to use seniority (or lack thereof) as the sole criteria for determining who will be transferred.
To be sure, there are important geographic and demographic differences that relate to the extent to which a school district tends to favor teachers over students. Teacher-favoring districts tend to be more urban, to have more minorities, and to have more students from low socioeconomic status households. However, the relationship between teacher-favoring districts and the decision to provide virtual instruction during the 2020-2021 year is robust to controlling for these differences.
But it does raise an important question. Why do districts vary so widely with respect to their willingness to provide teachers more favorable conditions of employment – even if these come at the expense of the children? There are two main possibilities: 1) that the political/bargaining power of parents relative to teachers varies widely across districts, and 2) the priorities of parents in districts that favor teachers over their children lie elsewhere (e.g., public safety, food security, or employment).
We are unable to say which of these is behind the variation. But we do know that in districts that prioritize teachers over students, student outcomes are significantly worse. Prior to the pandemic, elementary students in teacher-favoring districts tested at a level that that was over a year behind their counterparts at student-favoring schools in math and reading. Teacher-favoring districts also had 26 percent more students failing to graduate from high school. These achievement gaps are only somewhat smaller when we control for geographic and demographic characteristics of school districts. And while we do not claim these controls are sufficient to establish causality, the size of the achievement gap that remains is large enough to raise concerns in this regard.
Data
The data for this paper comes from several sources. First, we use school closing data collected by Burbio.com on 1146 school districts across the country covering over 48.4 million students. These data report the status for each school district – which grades are in-person, virtual, or hybrid – for each week of the 2020-2021 academic year. Burbio actively monitors these districts and plans are reviewed every 72 hours to identify changes.6
We also use data from the National Council on Teacher Quality (nctq.org) to assemble information on the teaching contracts and schedules of 145 districts across the country, including the 100 largest
6 Similar results were obtained using the fall 2020 school closure data collected by MCH Strategic Data (mchdata.com).

districts in the country, the largest district in each state, and member districts of the Council of Great City Schools. These districts cover over 25.1 million children. We use data from Stanford University’s Educational Opportunity Project (https://edopportunity.org/) for district test scores as well as geographic and demographic information. We use the US Department of Education’s EDFacts datafiles (https://www2.ed.gov/about/inits/ed/edfacts/data-files/index.html#acgr) for graduation rates. And we obtain state and county-level covid rates from the New York Times Covid github data repository (https://github.com/nytimes/covid-19-data).
Throughout the 2020-2021 academic year, school districts selected and moved between virtual, in-person, and hybrid instruction. To measure the amount of in-person schooling offered by each district in our sample, our first task is to determine how to treat a hybrid teaching day. Since Burbio defines hybrid teaching as 1-3 days of in-class instruction per week, we will measure each hybrid teaching day as equivalent to half an in-person teaching day. Using this and cumulating across the year for each of the 1146 districts in the Burbio sample, we have a measure of how much in-person schooling students in each of our districts received during the 2020-2021 academic year. Summary statistics of these measures are reported in Table 1. We report them separately for the full Burbio sample as well as the subset of large districts that are included in the NCTQ database.
Across the full set of districts in the Burbio sample, students were in the classroom for just under 63% of the year during the pandemic. In the 145 larger school districts, students received in-person instruction 60.5% of the time. But districts varied widely in their approach. A quarter of the schools spent virtually their entire year in the classroom and a quarter spent less than 42 percent of their year in the classroom. Across the larger schools, the range is even wider, with a quarter of the districts spending less than 23 percent of their year in the classroom and 12 districts (2.9M students) missing essentially the entire year of in-person instruction.
States also varied widely in terms of how much in-class instruction the average student received. As reported in Table 2, schools in the top 10 states provided in-class instruction 95% of the time. Students in the bottom 10 states were in the classroom 29% of the time during the pandemic.
Table 2 also reports state-level Covid rates as of August 31, 2020 and May 17, 2021. Interestingly, there does appear to be some relation between school closures and Covid cases. Districts in the top 10 in terms of in-person schooling were in states that began the school year with elevated Covid rates and ended the year with significantly greater Covid rates. The fact that in-person learning is negatively correlated with initial Covid rates runs counter to the argument that school closures were a response to high community-level transmission.
Characteristics of Online and In-Person Schools
Table 3 describes the characteristics of schools separated by whether their students missed more than half a year of in-person instruction. Here, we focus on the 145 largest school districts for which we have detailed data – though the patterns are highly similar for the broader sample for the variables where data is available. Several differences emerge between in-person and online schools. Students attending schools that chose remote learning are more likely to be minorities and come from households of lower
socioeconomic7 status. Remote learning schools are more likely to be urban and, for the subset of schools for which we have funding data, have per-student resources that are almost 25% greater than those at in-person schools.
There is also some evidence that county-level covid rates were different between schools that were online and those that offered in-person instruction. At the start of the 2020-2021 school year, Covid rates in the counties of in-person schools were 2 percent versus 1.7% in online schools. By May 17, 2021, Covid rates had risen to 10.2% in in-person school counties versus 8.9% in those of online schools.
Prior to the pandemic, student performance was quite different between school districts that chose online instruction versus in-person instruction. Judged by elementary school test scores (from exams taken during the 3rd, 4th, and 5th grades), the knowledge of students at online school districts was almost a year behind that of their in-person counterparts in math and reading.8 High-school dropout rates were almost one and half times as large in online districts. Of course, test scores and dropout rates are well-known to be related to socioeconomics, so we do not yet know the extent to which this is just mirroring the socioeconomic differences between online and in-person schools.
Teacher Contracts
Next, we use the NCTQ teacher contract data to study whether employment conditions differ between online and in-person schools. We report averages for each set of schools in Table 4. The first fact that shows up clearly is that the average online school district pays its teachers more than the average in-person district. Starting salaries are $47,862 vs. $44,873, a gap of 6.3%. Interestingly, this gap widens for teachers with greater seniority. The average online district pays a teacher with 10 years of experience 26.5% more than a starting teacher; for in-person schools this figure is 21.1%. The maximum salary for online districts is 95% greater than that of a starting teacher. For in-person districts, this figure is 73.7%.
Prior to the pandemic, teachers at online schools worked significantly less – at least from the perspective of contractual time requirements – than those at in-person schools. In-person schools had school days that were longer – 18 minutes or 4.1% longer. Their school years were similar in length, but teachers were required to spend 1.5 or 17.7% more non-instructional days at school. The average online district required its teachers to remain at school for 29.7 minutes outside of the student’s school day; for the average in-person district, this figure was 41.5 minutes. Online schools offer an additional 1.4 days (11%) of paid leave which, while beneficial to teachers, means more substitute teachers for students.
Contracts at online schools also favor job security and teachers that are senior over those that are new and high-performing. 58 of the 61 online schools (95%) offer teacher tenure; 64 of the 84 in-person schools (76%) offer tenure. 56% of in-person schools offer some form of performance-based pay, whereas only 39% of online schools offer pay related to performance. When teachers need to be transferred from one school district to another – due to changes in school enrollments or instructional needs – online schools favor teacher interests over those of students. 61 percent of online schools use
7 This measure comes from the Stanford University’s Educational Opportunity Project (https://edopportunity.org/) and summarizes a variety of socioeconomic information, including average income, unemployment rate, and fraction of single-parent households. 8 This measure averages up to five years of past test scores within each school district for grades 3-5. To include a given year within our district average, we require at least 50 tests to be graded in each of the three grades.
teacher seniority as the sole criteria for determining who is transferred. Only 36 percent of in-person schools rely exclusively on seniority.
Explaining School Closures
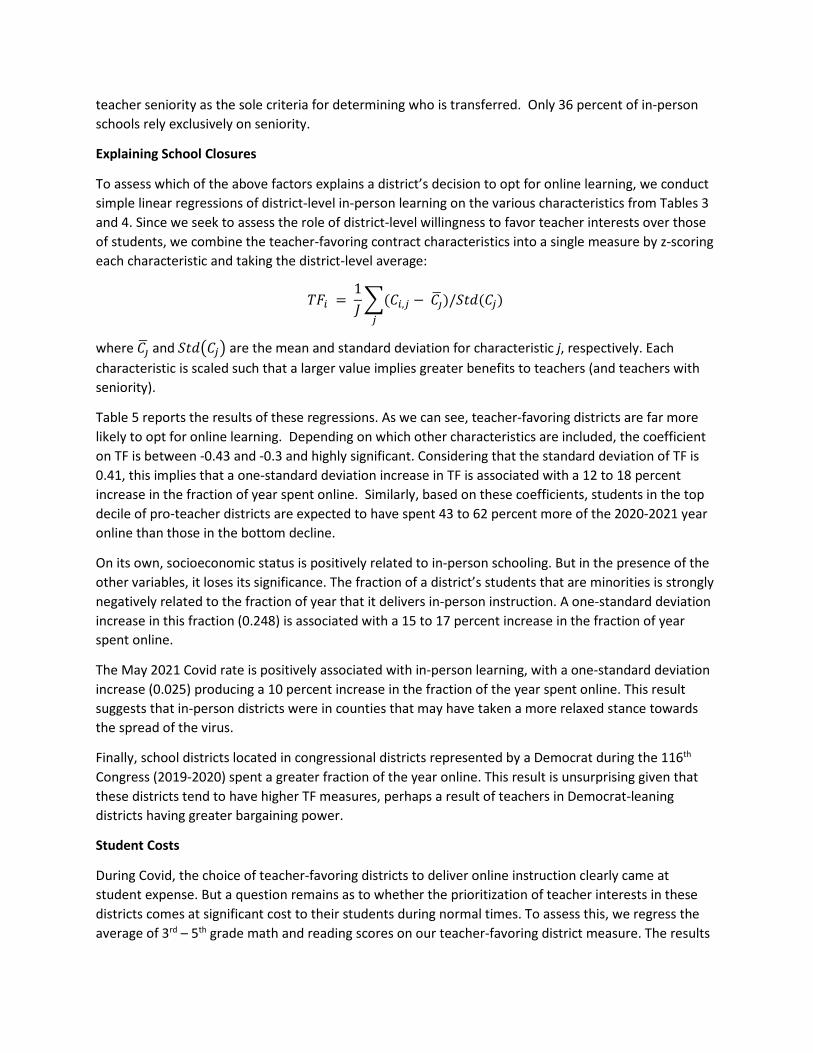
To assess which of the above factors explains a district’s decision to opt for online learning, we conduct simple linear regressions of district-level in-person learning on the various characteristics from Tables 3 and 4. Since we seek to assess the role of district-level willingness to favor teacher interests over those of students, we combine the teacher-favoring contract characteristics into a single measure by z-scoring each characteristic and taking the district-level average:
𝑇𝑇𝑇𝑇𝑖𝑖 = 1𝐽𝐽�(𝐶𝐶𝑖𝑖,𝑗𝑗 − 𝐶𝐶𝚥𝚥� )/𝑆𝑆𝑆𝑆𝑆𝑆(𝐶𝐶𝑗𝑗)𝑗𝑗
where 𝐶𝐶𝚥𝚥� and 𝑆𝑆𝑆𝑆𝑆𝑆�𝐶𝐶𝑗𝑗� are the mean and standard deviation for characteristic j, respectively. Each characteristic is scaled such that a larger value implies greater benefits to teachers (and teachers with seniority).
Table 5 reports the results of these regressions. As we can see, teacher-favoring districts are far more likely to opt for online learning. Depending on which other characteristics are included, the coefficient on TF is between -0.43 and -0.3 and highly significant. Considering that the standard deviation of TF is 0.41, this implies that a one-standard deviation increase in TF is associated with a 12 to 18 percent increase in the fraction of year spent online. Similarly, based on these coefficients, students in the top decile of pro-teacher districts are expected to have spent 43 to 62 percent more of the 2020-2021 year online than those in the bottom decline.
On its own, socioeconomic status is positively related to in-person schooling. But in the presence of the other variables, it loses its significance. The fraction of a district’s students that are minorities is strongly negatively related to the fraction of year that it delivers in-person instruction. A one-standard deviation increase in this fraction (0.248) is associated with a 15 to 17 percent increase in the fraction of year spent online.
The May 2021 Covid rate is positively associated with in-person learning, with a one-standard deviation increase (0.025) producing a 10 percent increase in the fraction of the year spent online. This result suggests that in-person districts were in counties that may have taken a more relaxed stance towards the spread of the virus.
Finally, school districts located in congressional districts represented by a Democrat during the 116th Congress (2019-2020) spent a greater fraction of the year online. This result is unsurprising given that these districts tend to have higher TF measures, perhaps a result of teachers in Democrat-leaning districts having greater bargaining power.
Student Costs
During Covid, the choice of teacher-favoring districts to deliver online instruction clearly came at student expense. But a question remains as to whether the prioritization of teacher interests in these districts comes at significant cost to their students during normal times. To assess this, we regress the average of 3rd – 5th grade math and reading scores on our teacher-favoring district measure. The results
of these regressions are reported in Table 6. As we can see, teacher-favoring variable comes in significantly in all three specifications. The coefficient of -0.49 suggests that, controlling for other district characteristics, a district that is at the 90th percentile (TF = 0.57) tests over a half-year behind a district at the 10th percentile (TF = -0.57).
Graduation rates in teacher-favoring districts are also significantly below those of student-favoring districts. The final specification produces a coefficient of -3.11, which implies that a district that is a student attending a district that is in the 90th percentile is 3.5% less likely to graduate than one attending a school at the 10th percentile.
Conclusion
Schools that opted for virtual instruction during the 2020-2021 year were schools with a history of favoring teachers over students and teachers with seniority over teachers that are new and/or high-performing. Online schools also tended to be schools in urban settings, schools with more minorities, schools with more students from low socioeconomic status households, and schools located in low Covid rate counties – all of which are also characteristics of schools that favor teachers. However, teacher-favoring schools continue to strongly opt for virtual instruction even in the presence of these controls for demographics and geography.
The costs borne by students in districts that prioritize teachers are significant. In elementary school, they test at a level that is over a year behind those in districts that favor students, and roughly a half-year in the presence of controls. Their high-school graduation rates are also significantly lower.
References
Ahmad, Farah Z. and Tiffany Miller, “The High Cost of Truancy.” Center for American Progress. (August 2015), https://cdn.americanprogress.org/wp-content/uploads/2015/07/29113012/Truancy-report4.pdf
Chen, Li-Kai Chen, Emma Dorn, Jimmy Sarakatsannis, and Anna Wiesinger. “Teacher survey: Learning loss is global—and significant.” McKinsey.com. (2021, March 1) https://www.mckinsey.com/industries/public-and-social-sector/our-insights/teacher-survey-learning-loss-is-global-and-significant
Dickler, Jessica. “Learning loss from virtual school due to covid is significant.” cnbc.com. (2021, March 30). https://www.cnbc.com/2021/03/30/learning-loss-from-virtual-school-due-to-covid-is-significant-.html
Engzell, Per, Arun Frey, and Mark D. Verhagen. “Learning loss due to school closures during the COVID-19 pandemic.” Proceedings from the National Academy of Sciences of the United States of America. (2021). https://www.pnas.org/content/118/17/e2022376118
Jackson, David and Gary Marx. “Prison data, court files show link between school truancy and crime.” Chicago Tribune. (2013, February 19). https://www.chicagotribune.com/ct-met-prison-truancy-20130219-story.html
Lleras-Muney, Adriana. "The Relationship between Education and Adult Mortality in the United States." The Review of Economic Studies 72, no. 1 (2005): 189-221. http://www.jstor.org/stable/3700689.
Norris, Manuel. “Lessons from the disaster of zoom teaching.” Current Affairs. (2021, April 29). https://www.currentaffairs.org/2021/04/lessons-from-the-disaster-of-zoom-teaching
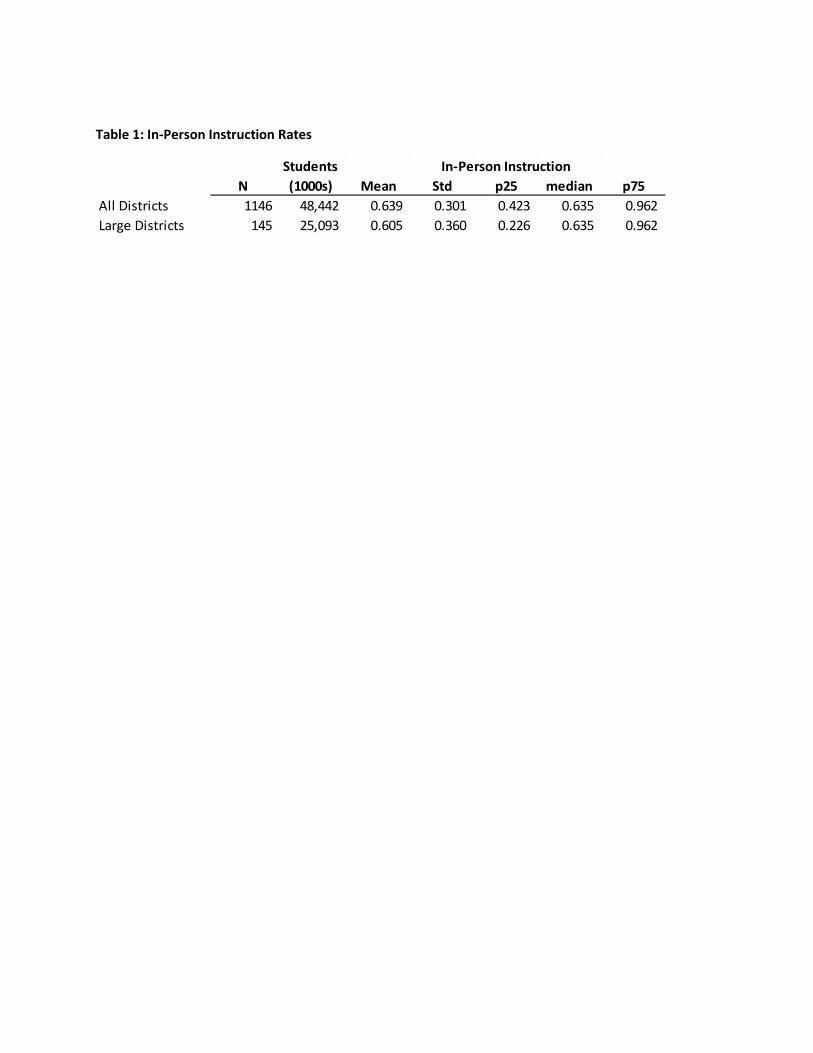
Table 1: In-Person Instruction Rates
N Mean Std p25 median p75All Districts 1146 48,442 0.639 0.301 0.423 0.635 0.962 Large Districts 145 25,093 0.605 0.360 0.226 0.635 0.962
In-Person InstructionStudents (1000s)
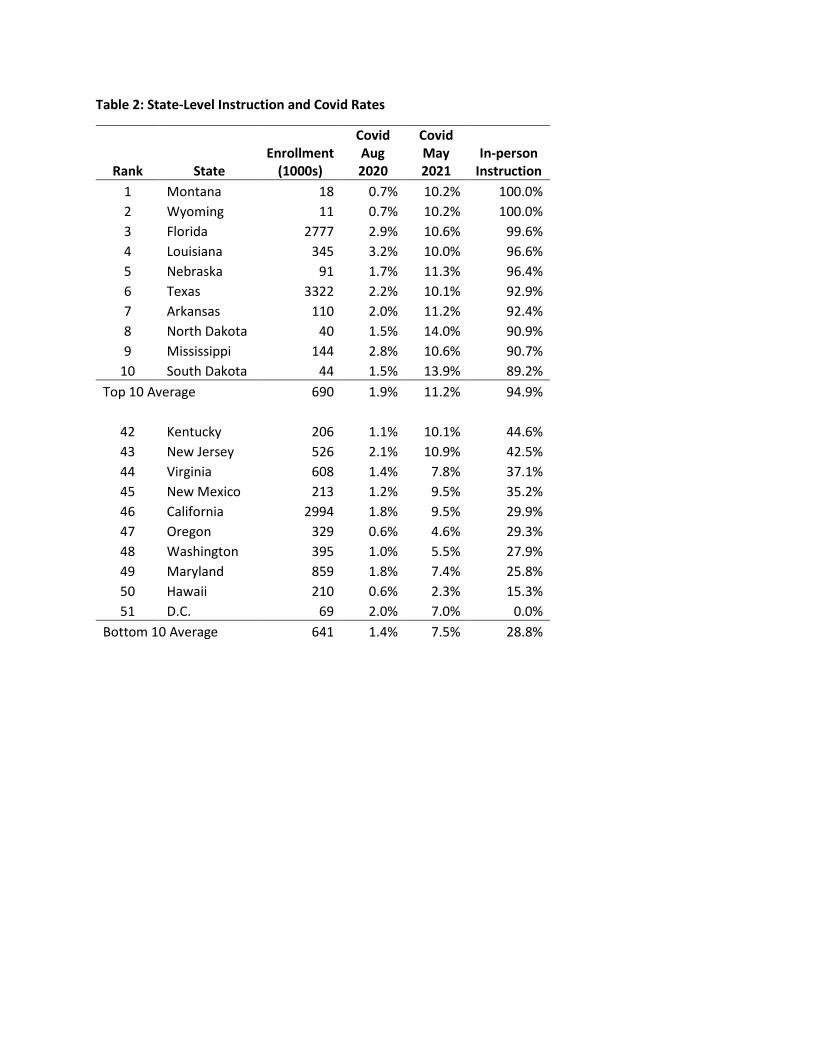
Table 2: State-Level Instruction and Covid Rates
Rank State Enrollment
(1000s)
Covid Aug 2020
Covid May 2021
In-person Instruction
1 Montana 18 0.7% 10.2% 100.0% 2 Wyoming 11 0.7% 10.2% 100.0% 3 Florida 2777 2.9% 10.6% 99.6% 4 Louisiana 345 3.2% 10.0% 96.6% 5 Nebraska 91 1.7% 11.3% 96.4% 6 Texas 3322 2.2% 10.1% 92.9% 7 Arkansas 110 2.0% 11.2% 92.4% 8 North Dakota 40 1.5% 14.0% 90.9% 9 Mississippi 144 2.8% 10.6% 90.7%
10 South Dakota 44 1.5% 13.9% 89.2% Top 10 Average 690 1.9% 11.2% 94.9%
42 Kentucky 206 1.1% 10.1% 44.6% 43 New Jersey 526 2.1% 10.9% 42.5% 44 Virginia 608 1.4% 7.8% 37.1% 45 New Mexico 213 1.2% 9.5% 35.2% 46 California 2994 1.8% 9.5% 29.9% 47 Oregon 329 0.6% 4.6% 29.3% 48 Washington 395 1.0% 5.5% 27.9% 49 Maryland 859 1.8% 7.4% 25.8% 50 Hawaii 210 0.6% 2.3% 15.3% 51 D.C. 69 2.0% 7.0% 0.0%
Bottom 10 Average 641 1.4% 7.5% 28.8%
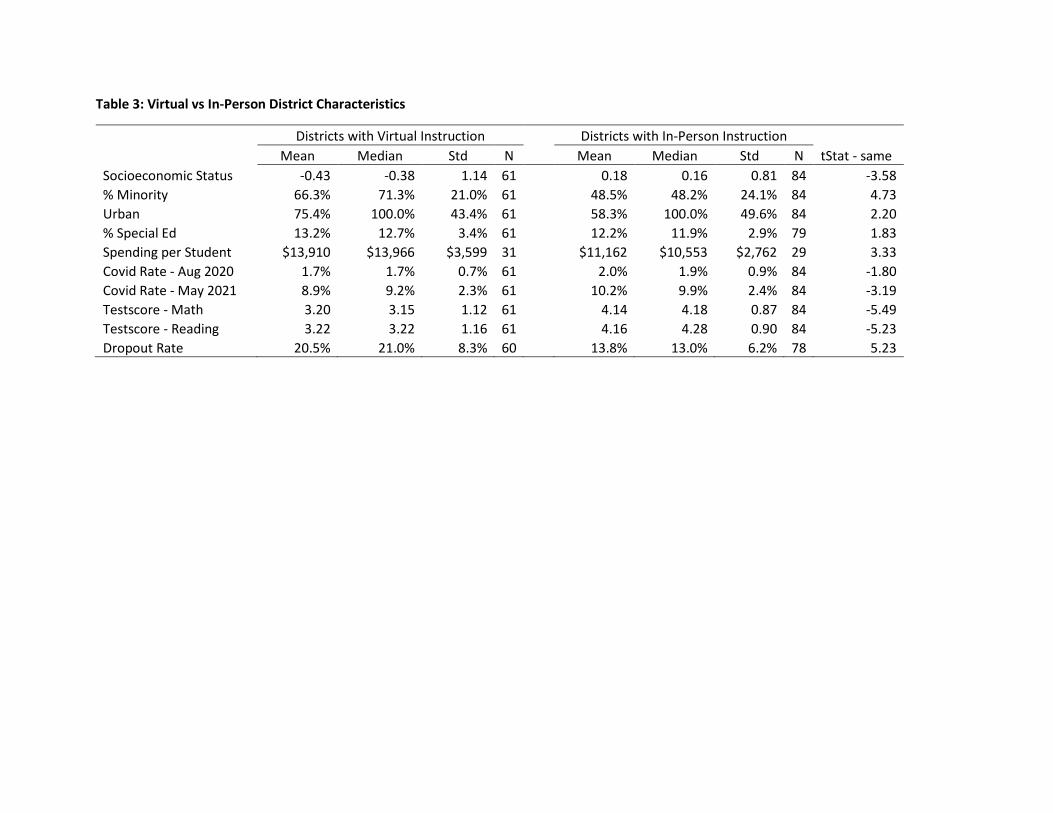
Table 3: Virtual vs In-Person District Characteristics
Districts with Virtual Instruction Districts with In-Person Instruction Mean Median Std N Mean Median Std N tStat - same Socioeconomic Status -0.43 -0.38 1.14 61 0.18 0.16 0.81 84 -3.58 % Minority 66.3% 71.3% 21.0% 61 48.5% 48.2% 24.1% 84 4.73 Urban 75.4% 100.0% 43.4% 61 58.3% 100.0% 49.6% 84 2.20 % Special Ed 13.2% 12.7% 3.4% 61 12.2% 11.9% 2.9% 79 1.83 Spending per Student $13,910 $13,966 $3,599 31 $11,162 $10,553 $2,762 29 3.33 Covid Rate - Aug 2020 1.7% 1.7% 0.7% 61 2.0% 1.9% 0.9% 84 -1.80 Covid Rate - May 2021 8.9% 9.2% 2.3% 61 10.2% 9.9% 2.4% 84 -3.19 Testscore - Math 3.20 3.15 1.12 61 4.14 4.18 0.87 84 -5.49 Testscore - Reading 3.22 3.22 1.16 61 4.16 4.28 0.90 84 -5.23 Dropout Rate 20.5% 21.0% 8.3% 60 13.8% 13.0% 6.2% 78 5.23
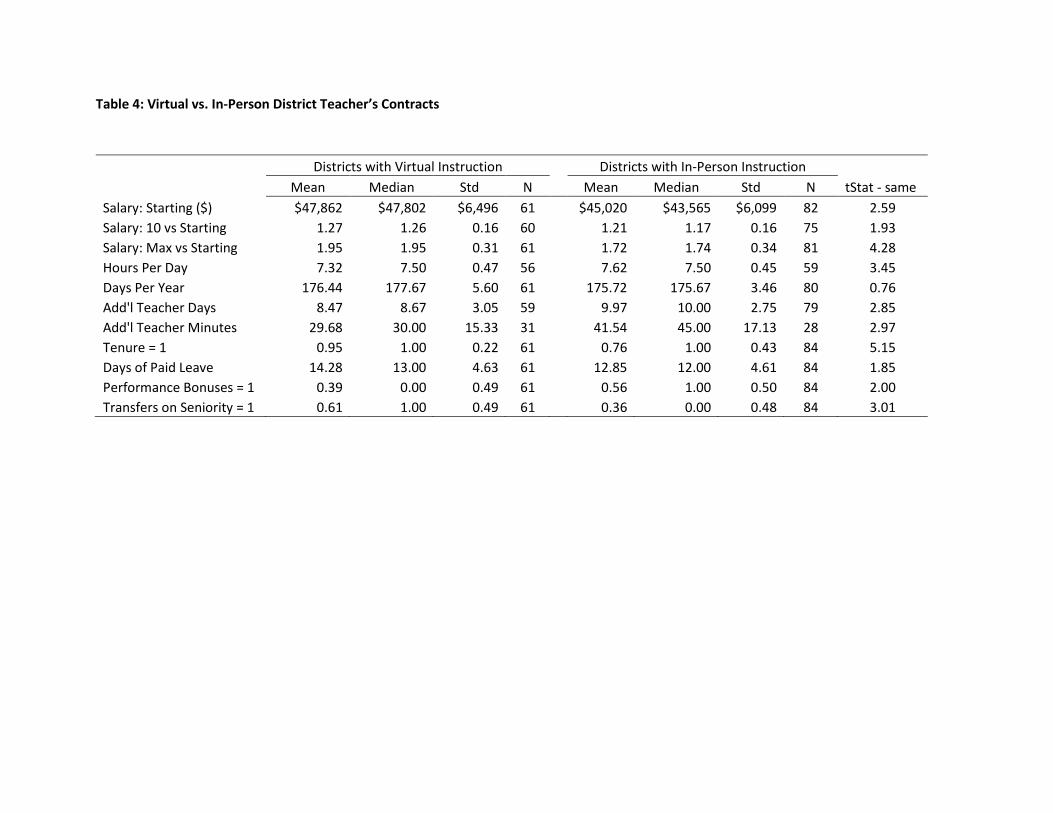
Table 4: Virtual vs. In-Person District Teacher’s Contracts
Districts with Virtual Instruction Districts with In-Person Instruction Mean Median Std N Mean Median Std N tStat - same Salary: Starting ($) $47,862 $47,802 $6,496 61 $45,020 $43,565 $6,099 82 2.59 Salary: 10 vs Starting 1.27 1.26 0.16 60 1.21 1.17 0.16 75 1.93 Salary: Max vs Starting 1.95 1.95 0.31 61 1.72 1.74 0.34 81 4.28 Hours Per Day 7.32 7.50 0.47 56 7.62 7.50 0.45 59 3.45 Days Per Year 176.44 177.67 5.60 61 175.72 175.67 3.46 80 0.76 Add'l Teacher Days 8.47 8.67 3.05 59 9.97 10.00 2.75 79 2.85 Add'l Teacher Minutes 29.68 30.00 15.33 31 41.54 45.00 17.13 28 2.97 Tenure = 1 0.95 1.00 0.22 61 0.76 1.00 0.43 84 5.15 Days of Paid Leave 14.28 13.00 4.63 61 12.85 12.00 4.61 84 1.85 Performance Bonuses = 1 0.39 0.00 0.49 61 0.56 1.00 0.50 84 2.00 Transfers on Seniority = 1 0.61 1.00 0.49 61 0.36 0.00 0.48 84 3.01
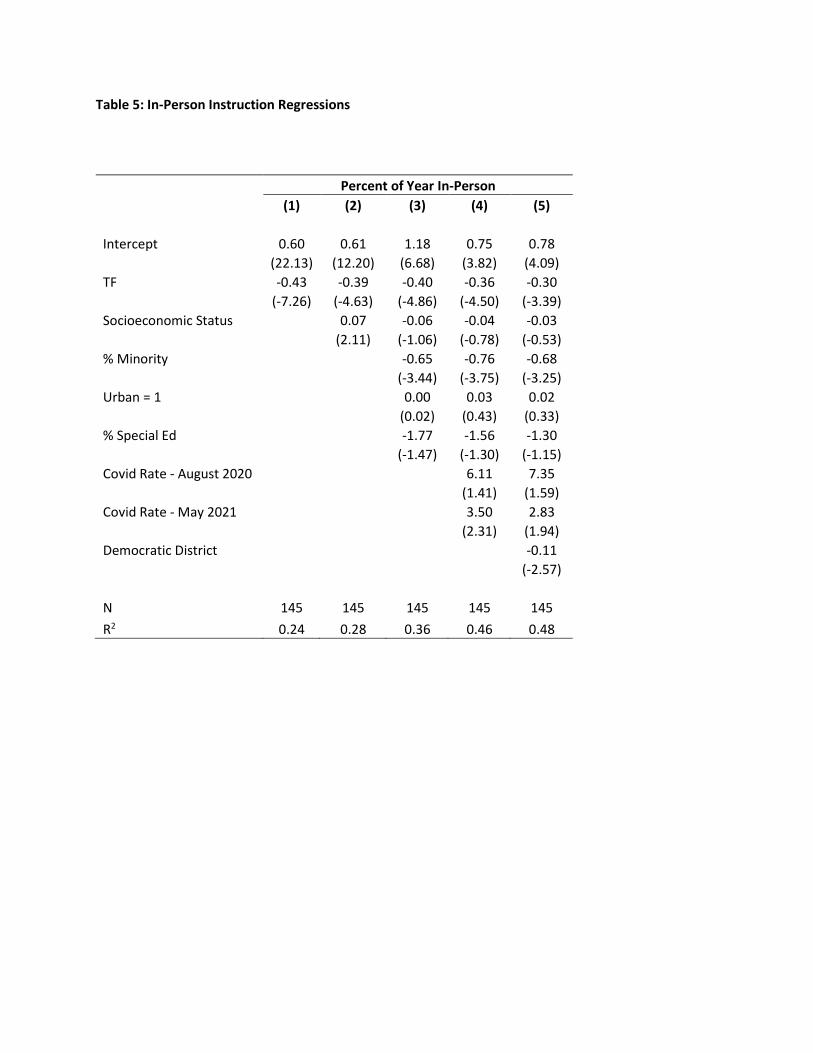
Table 5: In-Person Instruction Regressions
Percent of Year In-Person
(1) (2) (3) (4) (5)
Intercept 0.60 0.61 1.18 0.75 0.78 (22.13) (12.20) (6.68) (3.82) (4.09)
TF -0.43 -0.39 -0.40 -0.36 -0.30 (-7.26) (-4.63) (-4.86) (-4.50) (-3.39)
Socioeconomic Status 0.07 -0.06 -0.04 -0.03 (2.11) (-1.06) (-0.78) (-0.53)
% Minority -0.65 -0.76 -0.68 (-3.44) (-3.75) (-3.25)
Urban = 1 0.00 0.03 0.02 (0.02) (0.43) (0.33)
% Special Ed -1.77 -1.56 -1.30 (-1.47) (-1.30) (-1.15)
Covid Rate - August 2020 6.11 7.35 (1.41) (1.59)
Covid Rate - May 2021 3.50 2.83 (2.31) (1.94)
Democratic District -0.11 (-2.57)
N 145 145 145 145 145 R2 0.24 0.28 0.36 0.46 0.48
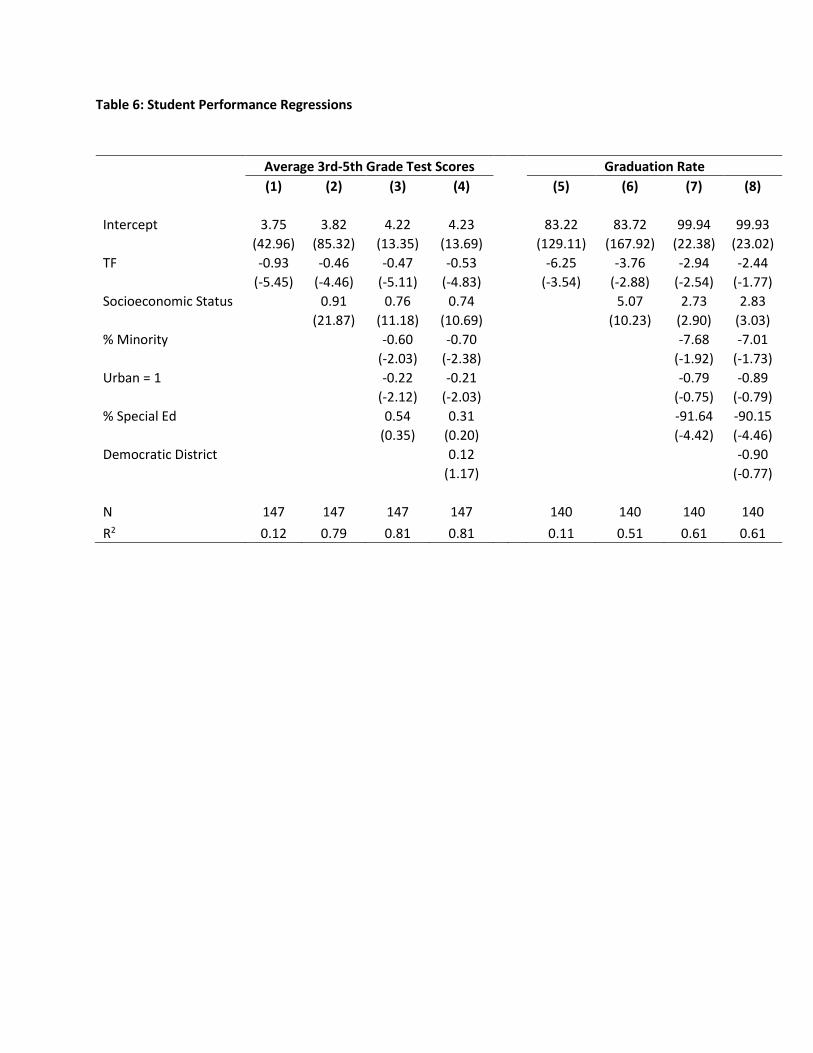
Table 6: Student Performance Regressions
Average 3rd-5th Grade Test Scores Graduation Rate
(1) (2) (3) (4) (5) (6) (7) (8)
Intercept 3.75 3.82 4.22 4.23 83.22 83.72 99.94 99.93 (42.96) (85.32) (13.35) (13.69) (129.11) (167.92) (22.38) (23.02)
TF -0.93 -0.46 -0.47 -0.53 -6.25 -3.76 -2.94 -2.44 (-5.45) (-4.46) (-5.11) (-4.83) (-3.54) (-2.88) (-2.54) (-1.77)
Socioeconomic Status 0.91 0.76 0.74 5.07 2.73 2.83 (21.87) (11.18) (10.69) (10.23) (2.90) (3.03)
% Minority -0.60 -0.70 -7.68 -7.01 (-2.03) (-2.38) (-1.92) (-1.73)
Urban = 1 -0.22 -0.21 -0.79 -0.89 (-2.12) (-2.03) (-0.75) (-0.79)
% Special Ed 0.54 0.31 -91.64 -90.15 (0.35) (0.20) (-4.42) (-4.46)
Democratic District 0.12 -0.90 (1.17) (-0.77)
N 147 147 147 147 140 140 140 140 R2 0.12 0.79 0.81 0.81 0.11 0.51 0.61 0.61