who says public investment in agricultural research doesn
TRANSCRIPT

University of ConnecticutOpenCommons@UConn
Storrs Agricultural Experiment Station College of Agriculture, Health and NaturalResources
7-1989
Who Says Public Investment in AgriculturalResearch Doesn't Pay?Stanley K. SeaverUniversity of Connecticut - Storrs
Follow this and additional works at: https://opencommons.uconn.edu/saes
Part of the Agricultural and Resource Economics Commons, Economic History Commons,Other Economics Commons, and the Public Economics Commons
Recommended CitationSeaver, Stanley K., "Who Says Public Investment in Agricultural Research Doesn't Pay?" (1989). Storrs Agricultural Experiment Station.93.https://opencommons.uconn.edu/saes/93

AESICES RESEARCH REPORT 89-901 July 1989
WHO SAYS
PUBLIC INVESTMENT
IN AGRICULTURAL
RESEARCH
DOESN'T PAY?
By Stanley K. Seaver Professor Emeritus
Department of Agricultural Economics and Rural Sociology
Storrs Agricultural Experiment Station and
Cooperative Extension System
College 0/ Agriculture and Natural Resources University o/Connecticut Storrs, Connecticut 06269

AESICES RESEARCH REPORT 89-90/
July 1989
WHO SAYS
PUBLIC INVESTMENT
IN AGRICULTURAL
RESEARCH
DOESN'T PAY?
By Stanley K_ Seaver Professor Emeritus
Departmtnt of Agricultural Economics and Rural Sociology
TABLE OF CONTENTS
Summary_ ................... ....... ...... ____ .. ......... I
Historical Perspective . . . . . . . . . . . . . . . . . . . . . . . . . . . . . . . . . . . . .. 3 Public Investment in Agricultural Research .................... 4
Research Findings ... ........................ .. ........... 5 Aggregate returns ............................... _ . . .. . .. 5 Returns to hybrid corn research . . . . . . . . . . . . . . . . . . . . . . . . . . .. 7 Over one hundred years of benefits lO society . . . . . . . . . . . • • . . . . 8 Poultry research and extension . ....... .... . ... , .... .... . . . . 10 Payoffs to cash grains. poultry, dairy and livestock .....• __ .... II Results from 1939 to 1972 ................................ 12 Technology and sc ience-oriented returns compared . ........... 13 Intcrnalratesofreturn,1937-72 ............ ..... .... . _ ..... 14 Recent findings, 1978 ....... ........ ............ ....... .. 15 Evidence summarized . ........ . .......... .. ......... .... . 16
Who Benefits From Agricultural Research? ............. ... .... 18 Pol icy Implications . . . . . . . . . . . . . . . . . . . . . . . . . . . . . . . . . . . . . . . . 19 References ......................................... . .. .. 24

LIST OF TABLES
1. Computed Marginal Contribution of Changes in Research and Extension Stock,1948-71 ............................ 9
2. Internal Rates of Agricultural Research Returns for Regions and Extension Service, 1948-71 ................... 10
3. Alternative Internal Rates of Return to Poultry Research in the United States .................................... 11
4. Marginal Products and Marginal Internal Rates of Return to Experiment Station Research .......................... 12
5. Marginal Internal Rates of Return (%) to ProductionOriented Research and Extension During Specific Time Periods .............................................. 13
6. Estimated Impacts of Research and Extension investments in U.S. Agriculture .................................... 14
7. Internal Rates of Return, 1937-72 ......................... 15
8. Marginal Products and Marginal Internal Rates of Return to Experiment Station Research ... , ..................... . 16
9. Summary of Estimates of Retums to Investment in Agricultural Research and Extension . ...................... 17
10. Research Funding for State Agricultural Experiment Stations and for USDA Agencies ......................... 21
II

SUMMARY
Few scientists think of agriculture as the chief or model science. Many, indeed, do nol consider it a science at all. rei it was rhejirSl science-the mother of all sciences; it remains the science which makes human life possible; and it may well be that, before the century is over, the success or failure of science as a whole will be judged by the success or failure of agricuilUTc (Andre and Jean Mayer, [I]).
What have been the benefits to society from its invesuncnts in agricultural research over the last 100 or more years? I suggest that the serious reader. who has only limited time, should 31ieasl study the summary of the evidence in Table 9.
The findings can be briefly summarized and they are astounding. Schultz, [4 J the first researcher to investigate the returns to investment in agricultural research, found Ille imemal rate of return (IRR) to be as high as 171 percent per year, during Ille 1910-50 period. Evenson [6] found Illat agricultural research yielded returns of 65 percent for Ille entire 60 year period from 186& to 1927 and 95 percent from 192610 1950. In 1958, Griliches [5] determined the IRR for hybrid com research 10 be 35-40 percent for the 1933-55 period. It is interesting [0 nOle mal the Connecticut Agricultural Experiment Station in New Haven made a major contribution to the discovery of hybrid com. Bredahl and Peterson [8] reported relurns of 37 percent, per year, for poUltry research. Again, Connectic ut made such a return possible. In the 1940s. SCOll, Singsen and Mattcrson at the Storrs Agricultural Experiment Station were the first to produce a high energy poultry ralion , which led to the development of the broi ler industry.
Imagine these rates of return to society over the last 100 years! The benefits to society from the two Connecticut research contributions just mentioned would more than pay for all the slale and federal appropriations for agricultural research in Connecticut since the establishment of the New Haven station in 1875. Surprising? Not at all. Schultz found that at 1946-48 input prices the savings in inputs in agricultural production in 1950 alone were more than twice as Iilrge as would be/orty years o/research and extension expendilures at the present annual rate. (Emphas is mine] (4: 120).
No mauer what period of time, what researcher, whether in the aggregate or for separate commodities, the IRR has a veraged approximate ly 50 percent for over 100 years. These high rates of return also characterize both technologyoriented and science-oriented research, with the IRR ranging from 45 to llO percent, per year. Illruly is mind boggling.
The evidence clearly substantiates the proposition that investment in agricul tural research and extension has been undervalued for 100 years . Any investment counselor would cenainly recommend additional invesunent when 50 percent rClums have persisted for that long.
Who in socicty has benefited from the huge returns to agricultural research? Ninety-nine percent would answer, the farmer, and all would be wrong. This is no t surpri s ing. Since the farmer is the user of the research findings, it is perfectl y natural for the public to expect the farmer to reap the benefi ts. However, agricul!ural production is a highly competitive industry and invariably the new technology leads to increased output,lower production cost of food and a fall in price. It is true that the fi rst few adopters of the new techn ique benefit in the
I
short run, since their increase in output is not sufficient to cause prices to drop and, hence, they earn some additional profits. But as soon as more farmers adopt the new research findings, output will increase and prices fall. As a matter of fact, some farmers are actually put out of business, since they cannot utilize the new discovery because of hilly land, improper soils, length of growing season and so forth. New technologies, however, keep many farmers in business via new varieties, for example, which extend the growing season and bring new areas into production. Nevertheless, in the longer run, farmers do not gain and some are even forced out of business.
If the farmers do not gain, who does? The direct beneficiaries of agricultural research are conswners or, in other words, all of us. Thus, the farmer only gains over the long-run in his role as a consumer. Today, United States consumers spend less than 13 percent of their total expenditures on food, the lowest of any country in the world. Western EuroJX2ns spend from 17 to 23 percent of their total expenditures on food. Korea spends more than 40 percent and the Philippines more than 50 percent.
In summary, any reduction in the real costs of producing farm products benefits consumers, particularly those with lower income. Because low income consumers spend relatively more of their income on food than high income consumers, they benefit more from lower food prices. Therefore, research effects are truly progressive because of the distribution effects among low and high income families. Schultz succinctly puts the case as follows:
Lower farmfood costs, therefore are important in reducing the inequnlity in personal income. There is much evidence which shows thai the primary accumulalive effect of agricultural modernization, including agricultural research, has not been unjust to poor people; on the contrary, it improves their lot more than it has that 01 the rich. We owe our agricultural scientists a great deal in this connection (13:585).
For more than 100 years, agricultural scientists have been doing noble work. The evidence clearly indicates that all consumers, especially the low-income, should support increased invesUnent in agricultural research.
2
WHO SAYS PUBLIC INVESTMENT IN AGRICULTURAL RESEARCH DOESN'T PAY?
Stanley K. Seaver •
HISTORICAL PERSPECTIVE
The fIrst public support of agricultural research occurred when President Lincoln signed a bill establishing the Department of Agriculture on May 15, 1862. Thus, organized government supported agricultural research is 127 years old.
On July 2. 1862 the Land-Grant College Act was signed. which provides federal assistance to present day Land-Grant Universities. of which The University of Connecticut is one. Individual states soon began providing funds for agricultural research. Connecticut can be proud that it was the first state to establish an agricultural experiment station in 1875. This was done largely through the efforts of Wilbur Atwater, in whose honor the Atwater Building on the Storrs campus is named. He was the first director of the Connecticut Agricultural Experiment Station and served in that capacity for 14 years.
The foundation for the present tremendous agricultural research establishment was completed with passage of the Hatch Act in 1887 which provided for the establishment of stations similar to Connecticut's in all states and territories in the Union. (Not all states were yet admitted to the Union.) The Office of Experiment Stations was established in the Department of Agriculture with Dr. Atwater as its first director. In his first annual report he wrote: In studying the food of animals we have no right to neglect the food of man. The principles involved are essentially the same. The majority of our people and practically all wage-workers spend and must spend at least half the money they earn for food. The need and the wisdom of such studies require no urging (2:26). Dr. Atwater later returned to the Connecticut Station and prepared the first extensive table of food values.
With the groundwork for the establishment of experiment stations completed, one more institution was required to bring the results of research to the millions of small farmers in the late 1800s and early 1900s. In order for the newly discovered research knowledge to be adapted to local conditions, local agents were needed. Therefore, in 19tXi the first county extension agent was appointed to assist in the fight against boll weevils that were destroying cotton in Texas. Other agents were soon appointed not only in the South but also in other regions. In 1914 Congress extended the system with the passage of the Smith-Lever Act, which provided for cooperative financing of the county extension agent system to be operated in each state under the direction of the landgrant college.
There was now in place a system for the discovery of new knowledge, and the dissemination thereof, in which the state and federal governments could
*The author is an emeritus Professor of the Department of Agricultural Economics and Rural Sociology at the University of Connecticut, Scorrs.
3
invest money for the developmem of the agricullural sector of the economy. The lOOth anniversary of the establishment of Agricultural Experimem Stations was in 1987. Over that pericxl, billions of dollars of public money have been invested in agricultural research and extension.
PUBLIC INVESTMENT IN AGRICULTURAL RESEARCH
Almost every American is interested in the subject of investment, whether or not they have much money to invest This interest undoubtedly stems from the fact that everyone, no matter what their economic status, must make many investment decisions during their lifetime, whether this be for a home, a car, an education or simply a bicycle for the children. For many private investmems, similar to those mentioned, a rate of return is not easily determined. But when one invests in stocks, bonds, real estate or life insurance, for example, the rate of return becomes very important and often critical to the investment decision.
While all individuals have some familiarity with private investment decisions, most are only vaguely aware of government investment. This is because most government investments-local, state and federal-are normally classified as expenditures and are not considered investments, since a rate of return is not made available to the public at time of investment. For example, economic literature contains many studies of the rates of return to investment in education, yet I doubt that one-half of one percent of the American public is aware of these data. Yet, surely money allocated for education and agricultural research are investments.
The subject of this article is the returns to agricultural research. As pointed out, public money is appropriated by federal, state and even local governments for conducting all kinds of agricultural research. The expenditure of governmental money for agricultural research was a unique idea. It was argued, and rightly so, by proponents of the idea, that fanns were so small as to preclude research investments by each fann. Hence, if progress in agriculture was to be made, it must be based upon scientific evidence financed by governmental expenditures (investments) with the findings made available to all fanners. Tcxlay that idea is still valid, since even the largest of farms cannot be expected to finance the sophisticated research required for continued progress in food production.
What have been the benefits to the American IXX'pJe of the billions invested in agricultural research and extension over the past 100 years? Most people would be happy with a 15 percent annual pay-off on their holdings in the stock market, grocery store or beer tavern.
If you are satisfied with such returns, then you ought to be ecstatic over the returns to investment in agricultural research. Evidence presented indicates that such returns consistently range from 25 to over 300 percent annually. It is reponed that David StOckman, former head of the Office of Management and Budget, refused to believe such numbers when they were presented to him in defense of requests for federal expenditures for agriculture research. I hope those of you with open minds will at least review the findings on the subjecl.
4

RESEARCH FINDINGS I
It is not necessary to be an economist to understand the pay-off to agricultural research. Only twO concepts are of crucial importance. One is the internal rate of return (JRR), which is defined as the highest interest ralC that could be paid on research outlays and just break even on the investment It is computed as that discount rate which makes the net present value of the marginal product of research investment equal to zero. Put simply. if the discount rate is equal to the market rate of interest (presently about 10 percenO,!he investment could be made for any return aoove 10 percent without losing money. Of COW"Se, assuming two alternative investments to be equally risky, one would prefer to invest in the onc yielding the highest rate of return above to percent.
The second concept is the marginal product of research investment. The marginal product is simply the extra output added by onc additional unit of input. For example. a farmer feeding hogs should always wish to know how much J,X)rk is produced by feeding one more J,X)und of feed. The value of the added pork output should at least be equal to !he cost of the additional pound of feed fed. If it is not. lhe producer is losing money. The same principle holds for research invesunenl. We wish to know if one more dollar is invested. what will be lhe value of the product prodUCed. in this case food. Additional investment should SLOP when the additional cost of research is equal to the value of the additional food output.
FoUowing are summaries of a nwnber of studies which have investigated the returns society has received from public invesunent in agriCUltural research covering many years. We stan with the first study but see no reason to continue a strict chronological order throughout this section, especially since many studies will not be presented. And since all studies will not be summarized. the reader will need to trust the author to present studies other than those which show the highest rates of return.
Aggregate returns
The first resullS were published in 1953 by Theodore W. Schultz in his book The Economic Organization of Agriculture [4 J. Schultz later went on to win the Nobel Prize in Economic Science in 1979 and is presently Professor Emeritus of the Charles L. Hutchinson DistinguiShed Service Chair at the University of Chicago. The Nobel Prize was awarded mainly for his contributions in developing a "critique of the policy of industrialization of the developing countries and neglect in the agricultural field" which encompasses his work on returns to agricultural research.
In 1953, Schultz asked a simple question: what was !he value of inpulS saved. through more efficient production techniques (the end prooucl of research) compared to the cost of research and development? He determined how many more resources would have been required to produce the 1950 output
IFor those interested in a summary of research methodology including index numbers and production/unclion approaches, ex- post and ex-ante studies. costbenefit and mathematical programming analysis, see Norton and Davis [31.
5

using 1910 techniques and 1940 techniques. And in each case Schultz estimated an upper and lower limit. His results, using 1910 techniques for 1950 production, arc as follows:
Upper Limit in Inputs Saved
If inputs are valued at 1946-48 prices and 1910 production techniques are used to produce 1950 output, the results are a 54 percent saving of inputs. This means that the output per unit of input was 54 percent larger (resulting from research developing new techniques) in 1950 than in 1910. In other words. had 1910 tcchniques been employed to produce 1950 agricultural output, 54 percent more inputs would have been required. The inputs saved, valued at 1950 prices, would have cost an additional 16.2 billion dollars.
Lower Limit in Inputs Saved
Using the same method but weighting the inputs used by 1910· 14 prices (instead of 1946-48 prices for the upper limit) resulted in a 32 percent increase in output per unit of input. With inputs weighted at 1910-14 prices, the resources saved in 1950 are valued at 9.6 billion dollars at 1950 prices.
What does all this mean in terms of returns to investment in agricultural research and extension? Dr. Schultz states it so well as:
The savings in inputs in 1950 alone are much larger, even at the lower limit, than all the expenditures 0/ the Federal and State governments on agricultural research and extension work since 1910. The savings in inputs in agricultural production, at the lower limit, in one year, 1950, stand at $9,600 million and!or the upper limit $16,200 mil· lion. Let us suppose that the expenditures had been at an annual rate 0/$100 million/or agricultural research and 0/$75 million/or agricultural extension. We would then have/or forty years (175 x 40) a IOtal expenditure of $7,000 miliion, which is substantially less than the savings in agricultural inpUls in a single year, at the lower limit, weighting inputs at 1910-14 inpUl prices. At 1946-48 inpUl prices (the upper !ifni!), the savings in inputs in agricultural production in 1950 alone were more than twice as large as would be forty years 0/ research and extension expenditures at the present annual rate (4: 120).
But the results shown are for a long ago period. What about a more recent period? Schultz conducted the same analysis by comparing 1940 inputs required for 1950 production. A brief summary is as follows:
Upper Limit in Inputs Saved
Using 1940 techniques to produce 1950 output would have required 18.5 per· cent more inputs, which valued at 1950 input prices, results in a saving of $5.55 billion.
Lower Limit in Inputs Saved
When inputs are valued at 1940 prices, only 3.7 percent additional inputs arc required to produce 1950 production, and the saved inputs would have a value of $1.11 billion.
6

What arc the limitations to the foregoing results? Research and extension expenditures before 1950 were a1l1ower than $175 million per year; expenditures were thus overstated and returns to investment understated. In addition, the activities of the Extension Service ($75 million in 1950) are not all used La induce farmers to adopt beUer techniques, which again would overstate expenditures and understate returns to inveSLmenL On the other hand, private expenditures for agricultural technology are not included in the analysis. Attributing all agricultural production advances to public expenditures would overstate the returns to public invesLment. Considering both overstatement and understatement of returns, Schultz succinctly states:
And, yet, allowing for all these, we are inclined to the view that the returns realized, on the present rate of expenditures on efforts to develop new techniques and to induce farmers to adopt them are exceedingly large, many times as large as are the returns on normal business investments; and therefore, a strong case can be made for a much larger allocation of resources to these organized efforts to provide farmers with better production techniques (4: 121-122).
Returns to hybrid com research
The next major contribution to the literature was, not surprisingly, from a Ph.D. student of Schultz. In 1958, Zvi Griliches of the University of Chicago published an article in The Journal of Political Economy [5J based upon his Ph.D. dissertation.
Griliches introduced a major change in the focus of inquiry by concentrating on a single commodity- hybrid com. He also included, on the cost side, estimates of both public-{U.S.D.A. and experiment stations)-and private expenditures, whereas Schultz considered only public expenditures.
Griliches detennined total research expenditures on hybrid com for the period 1910-55. Costs were accumulated from 1910, since this was the approximate date when hybrid investigation was initiated. Returns to research expenditures were not realized until 1933, when fanners first used hybrid seed for commercial production. Therefore, 23 years (1910-33) of development costs were included prior to receiving returns from research expenditures. With all costs and returns cumulated, an internal rate of return is calculated. Remember- IRR is that rate of interest which equates the discounted flow of costs with the discounted flow of returns over time. The final result was an lRR of between 35 and 40 ~rcent on hybrid com research expenditures.
But the estimate is on the low side, since Griliches insists he always chose the assumption which led to the lowest estimate. For example, he selected a 15 percent increase in yields for hybrid over open pollinated com, when the accepted increase from 1933 to 1955 was 20 percent. And his research expenditures were estimated on the high side.
Griliches also converts the Schultz estimates into annual returns and includes, in the cost, an estimate for private research investment. He finds that the annual social returns (IRR) are 35 and 171 percent at the lower and upper limits, respectively, per dollar spent on agricultural research. In addition, Griliches estimated the IRR for hybrid sorghwn and found it to be approximately 400 percent annually.
7

Over one hundred years of benefits to SOCit!Ly
We are indebted to Professor Robert E. Evenson for providing us with a long his to rical perspective of the benefi ts of investment in agricultural research and extension. He received his Ph.D. in Economics at the University of Chicago in 1968 and, over the last 20 years, has been a constant contributor to the invest· ment literature. From 1966·69 Evenson was Assistant Professor of Agricultural Economics at the University of Minnesota, and since 1969 has been Professor of Economics in the Yale University Economic Growth Center where much of his time has been devoted to analyzing various kinds of agricultural investments.
In 1978, Evenson published results of his inquiry into returns from research and extension investments which dated to 1868 or shortly after Land·Grant Col· leges were established. Some surprising results were obtained for the 1868-1926 period. He found that the contribution of an agric ultural research variable (in a production function study) was ... highly significant and indicates lhat lhe eady experiment station system was highly productive (6:47).
This was an important finding in at least two respects. One, it refuted the contention that agricultural productivity change is unrelated to research investment; and , two, it refuted the belief that soil exhao.'Otion (mining the soil) was a major determinant of productivity change.
What were the returns to research investment over the early 58 year period 1868·1 9267 The marginal re bJrns of a one dollar addition to the research stock resulted in an increase in output worth 512.50 in 1958 dollars. As Evenson says: This implies an internal rate 0/ return oj approximately 65 percent (6:47 Emphasis mine), Also, he points out, 1868-1926 included a period of slow productivity growth which began around 1900.
He nex t considered the 1927·50 period. This was a time of many biological inventions, including hybrid com, improvement in animal health and nutrition, and a change from animal to mechanical power. It was found ... that an added one thousand dollar investment in applied agricultural research would have contributed an additional stream oj production rising to a value 0/ approxi. mo.tely $11,400 alter 5 years, 0/ this, $6,350 would be realized in the form 0/ added product by producers in the state where the im'eSlment was made (6:5 1a). The remainder would accrue to other states with similar soil and
climate. An added one thousand dollars invested in related scientific research would result in added production rising to a value 0/$53,000 after 15 years (6:51a. Emphasis mine). The costs include an estimate of private research expenditures.
For comparison purposes Evenson determined an IRR to agricultural research c1tpcndiuues of 9S percent for the 1927-50 period. He also considered a more recent time pcriod- I948· 71 . As far as I know, Evenson was the first researcher to focus on the measurement of productivity of the Agricultural Extension Service and on the development of return estimates for both scientific (basic) and applied research expenditures. The results arc shown in Table 1.
8

TABLE 1
Computed Marginal Contribution of Changes in Research and Extension Stock 1948-71 I
Change in Farm Production due 10:
Increase in Value of Farm Production
$1,000 added to Extension Applied Economics Stock 2
$1,000 added to Scientific Research Stock
$1,000 added 10 Applied Research Stock
$2,947
$2,330
$12,000
t Adaptedfrom Table 17, pp. 62, of reference [6]. 2 Only applies to production related extension expenditures.
Evenson was also the first researcher to estimate returns to research by regions and these are shown in Table 2.
A brief explanation of the results shown seems necessary. The high returns for the South are undoubtedly caused by the lack of attention to agricultural research before 1948, e spec ia lly during the 193Os. Catching up requires fewer resources than being a leader, especially in basic research. And basic research is often required for applied research.
The rate of return to extension expenditures shown in Table 2 should not be interpreted as the returns to all extension expenditures. The analysis presented includes only extension expenditures directly associated with agricuIturaJ production , hence the high return . A large percent of the federal and state extension budgets are not related 10 agricultural production activity . especially in states such as Connecticul Undoubtedly, the relurns to all extension investme nt would be considerably lower than that indicated. Extension activity is most productive when applied research is producing a flow of new technology. Evenson summarizes his finding s this way:
It has not been possible to achieve complete comparability in terms of data and methodology for the three historical periods examined. Nonetheless, the results are probably comparable enough to indicate thai investment in agricuilural research has been highly productive over the entire period (6:63).
9
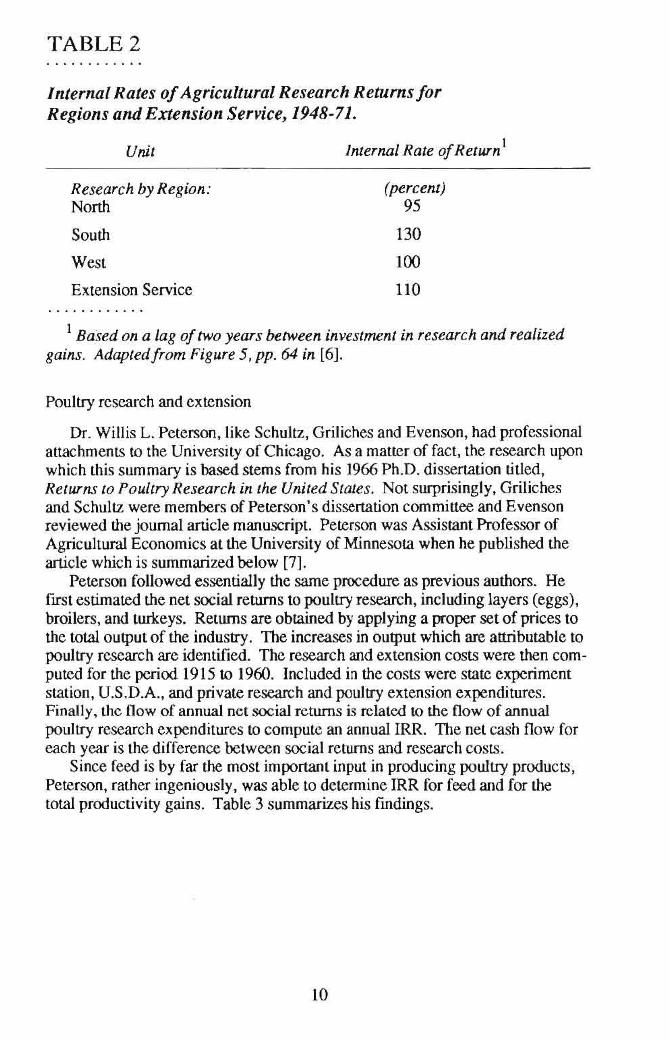
TABLE 2
Internal Rates 0/ Agricultural Research Returns/or Regions and Extension Service, 1948-71.
Unit
Research by Region: North
South
West
Extension Service
Internal Rate of Return 1
(percent) 95
130
100
110
1 Based on a Jag of two years between investment in research and realized gains. Adapted/rom Figure 5, pp. 64 in [6].
Poultry research and extension
Dr. Willis L. Peterson,like Schultz, Griliches and Evenson, had professional attachments to the University of Chicago. As a maller of fact, the research upon which this summary is based stems from his 1966 Ph.D. dissertation titled, Returns to Poultry Research in the United States. Not surprisingly. Griliches and Schultz were members of Peterson's dissertation committee and Evenson reviewed the journal article manuscript. Peterson was Assistant Professor of Agricultural Economics at the University of Minnesota when he published the article which is summarized below [7].
Peterson followed essentially the same procedure as previous authors. He fIrst estimated the net social returns to poultry research, including layers (eggs), broilers, and turkeys. Returns are obtained by applying a proper set of prices to the total output of the industry. The increases in output which are attributable to poultry research are identified. The research and extension costs were then computed for the period 1915 to 1960. Included in the costs were state experiment station, U.S.D.A., and private research and poultry extension expenditures. Finally, the flow of annual net social returns is related to the flow of annual poultry research expenditures to compute an annual IRR. The net cash flow for each year is the difference between social returns and research costs.
Since feed is by far the most important input in producing poultry products, Peterson, rather ingeniously, was able to determine IRR for feed and for the total productivity gains. Table 3 summarizes his findings.
10
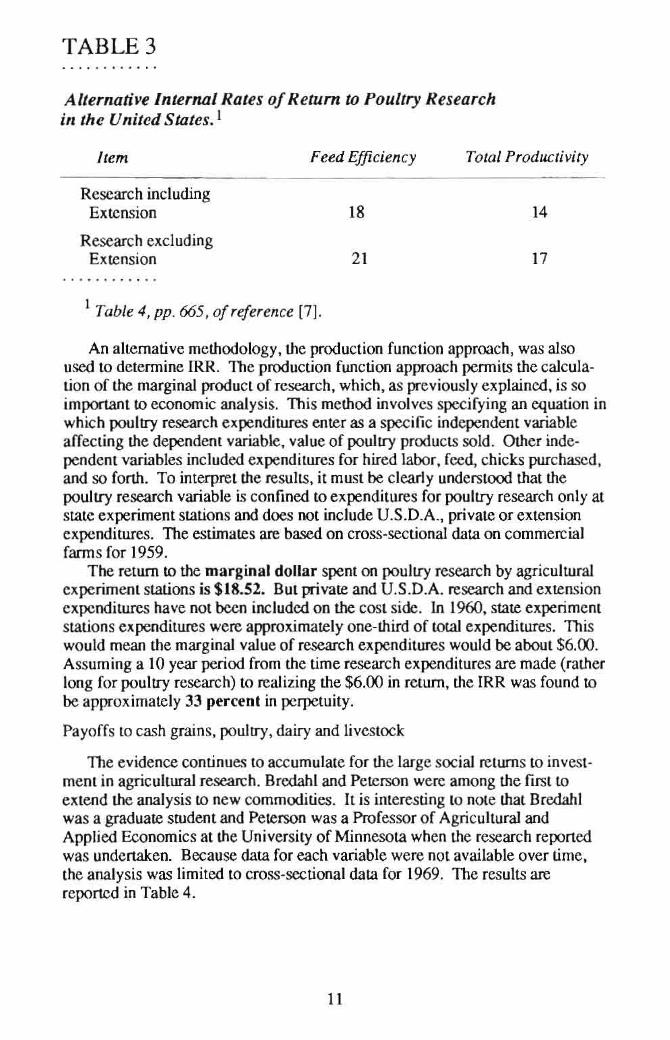
TABLE 3
Alternativelnl£rnal Rates oj Return to Poultry Research in the United States'!
item Feed Efficiency Total Productivity
Research including Extension
Research excluding Extension
I Table 4, pp. 665, of reference [7J.
18 14
21 17
An alternative methodology, the production function approach, was also used to determine IRR. The production function approach permits the ca1culation of the marginal product of research, which, as previously explained, is so important to economic analysis. This method involves specifying an equation in which poultry research expenditures enter as a specific independent variable affecting the dependent variable, value of poultry products sold. Other independent variables included expenditures for hired labor, feed, chicks purchased, and so forth. To interpret the resulls, il must he clearly unders100d that the poUltry research variable is confined to expenditures for poultry research only at state experiment stations and does not include V.S.D.A., private or extension expenditures. The estimates are based on cross-seclional data on commercial farms for 1959.
The return to the marginal dollar spent on poultry resean:h by agricultural experiment stations is $18.52. But private and U.S.D.A. research and extension expenditures have not been included on the cost side. In 1960, state experiment stations expenditures were approximately one-third of total expenditures. This would mean the marginal value of research expenditures would be about $6.00. Assuming a 10 year period from the time research expenditures are made (rather long for poultry research) to realizing the $6.00 in return, the IRR was found to be approximately 33 percent in perpetuity.
Payoffs to cash grains, poultry, dairy and livestock
The evidence conlinues to accumulate for the large social returns to investment in agricultural research . Bredahl and Peterson were among the first to extend the analysis to new commodities. It is interesting to note that Bredahl was a graduate student and Peterson was a Professor of Agricultural and Applied Economics at the University of Minnesota when the research reported was undertaken. Because data for each variable were not available over time, the analysis was limited to cross-sectional data for 1969. The results are rcported in Table 4.
11

TABLE 4
Marginal Products and Marginal Internal Rales oj Return to Experiment Station Research 1
Marginal Products Assumed Lag ($) (years)
Cash Grains 14.09 5
Poultry 19.58 6
Dairy 25.93 6
Livestock 41.76 7 . . . . . . . . . . . .
1 Same as Table 5 in [8], pp. 688.
IRR (%)
36
37
43
46
In order to arrive at estimates of the rates of return shown, the marginal product figures were divided by a factor of three to account for public extension and private research expenditures. This procedure biases the return downward for two reasons. First, even with no extension expenditures devoted to dissemination of research results, it is unlikely that farmers would not have some knowledge of the new technology being developed. Hence, charging all extension expenditures to each commodity certainly would reduce the marginal proouct over what it would be in the complete absence of such expenditures. Second, the cost of private research is already included in the price charged fanners for the inputs purchased. Therefore, some double counting of the cost of private research occurs.
Finally, it is interesting to note that the authors estimated marginal products of research (similar to colwnn I, Table 4) for each of the 48 states. These are the first and only such results I have seen. Connecticut ranked 11th in dairy of 48 states in marginal products of research. 17th in poultry and 40th in livestock. The 1RR in dairy and poultry research would indeed be high, and compare favorably with all other states. Since there are no cash grain fanns in all of New England, obviously marginal products could not be estimated.
Results from 193910 1972
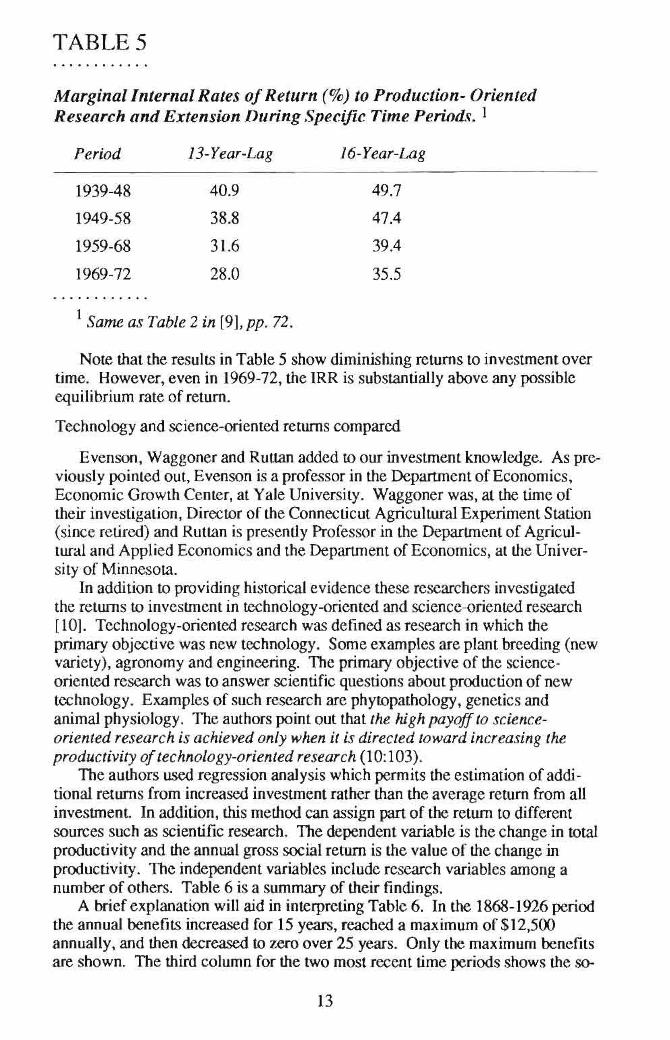
In 1979, Marlys Knutson and Luther Tweeten I published a significant article aimed at projecting marginal products and 1RR from 1976 to 2015 under various scenarios defining the rate of increase in research investment. demand for output and rate of inflation [9]. In addition, they developed some new historic rates ofreturn, with a 13- and 16-year-lag, which are summarized in Table 5. The 16-year-lag is probably the appropriate result and not because the returns are higher. Discussions with agricultural scientists led to the conclusion that at least eight years are r~uired for the average research and extension expenditures to have maximum impact on output and another eight years are required before the new technology no longer influences output.
I Knutson and Tweeten were, respectively, research assistant and Regents Professor of Agricultural Economics at Oklahoma State University.
12
TABLES
Marginal Internal Rates of Return (%) to Production- Oriented Research and Extension During Specific Time Period.'<;. 1
Period J 3-Year-Lag 16-Year-Lag
1939-48 40.9 49.7
1949-58 38.8 47.4
1959-68 31.6 39.4
1969-72 28.0 35.5 . . . . . . . . . . . .
1 Same as Table 2 in [9], pp. 72.
Note that the results in Table 5 show diminishing returns to investment over time. However, even in 1969-72, the IRR is substantially above any possible equilibrium rate of return.
Technology and science-oriented returns compared
Evenson, Waggoner and Ruttan added to our investment knowledge. As previously pointed out, Evenson is a professor in the Department of Economics, Economic Growth Center, at Yale University. Waggoner was, at the time of their investigation, Director of the Connecticut Agricultural Experiment Station (since retired) and Ruttan is presently Professor in the Department of Agricultural and Applied Economics and the DeparUnent of Economics, at the University of Minnesota.
In addition to providing historical evidence these researchers investigated the returns to investment in technology-oriented and science-oriented research [101. Technology-oriented research was defined as research in which the primary objective was new technology. Some examples are plant breeding (new variety), agronomy and engineering. The primary objective of the scienceoriented research was to answer scientific questions about production of new technology. Examples of such research arc phytopathology. genetics and animal physiology. The authors point out that the high payoff to scienceoriented research is achieved only when it is directed toward increasing the productivity of technology-oriented research (10: 103).
The authors used regression analysis which penn its the estimation of additional returns from increased investment rather than the average return from all investment. In addition, this method can assign part of the return to different sources such as scientific research. The dependent variable is the change in total productivity and the annual gross social return is the value of the change in productivity. The independent variables include research variables among a number of others. Table 6 is a summary of their findings.
A brief explanation will aid in interpreting Table 6. In the 1868-1926 period the annual benefits increased for 15 years, reached a maximum of $12,500 annually. and then decreased to zero over 25 years. Only the maximum benefits are shown. The third column for the two most recent time periods shows the so-
13

TABLE 6
EstillUlted Impacts of Research and Extension Investments in U.S. Agriculture I
Percentage of Maximum productivity
annual benefit Annual change realized from $1,000 rate oj in slate under-
Time investment return taking the Subject Period (dol/ars) (%) research
All agricultural research 1868·1926 $12,500 60 not estimated
Agricultural research 1927·1950 TechJ;1o1ogy-oriented 11,400 95 55 Science-oriented 53,000 110 33
Agricultural research 1948·1971 Technology-oriented
South 21,000 130 67 North 11,600 93 43 West 12,200 95 67
Science-oriented 1948· 1971 4,500 45 32 Farm management and
agricultural extension 1948·1971 2,173 110 100 . . . . . . . . . . . . 1 A reproduction of Table 3 in [9],
called "spillover" of research. Of the total productivity change attributed to technology-oriented research, 55 percent, (1927-50), occurred in the state undertaking the research and the remaining 45 percent to other states. The results of experimentation in one state changes productivity in many other stales because the results of agricultural research are made readily available to everyone. Agriculture is probably the only industry where such a situation exists. But the state undertaking the research still retains a surprisingly large amount of the productivity change. As expected, states retain much less of science-orientcd research.
The high pay·off in the south (130 percent) is largely the result of a lag in research effort in this region during earlier periods. The rather large returns to farm management and extension investment (110 percent) should not be misinterpreted. Such a high return applies only to expenditures associated with agriculLural production and not to returns on all extension expenditures.
Internal rates ofretum, 1937·72
In an article published in 1977, Peterson and Fitzharris obtained the results shown in Table 7 [11]. In calculating the internal rate of return, it was assumed that the average value of the marginal inputs saved over the six-year period would continue in perpetuity. Because of the high discount rate, future returns have a very small influence on the rate of return.
14
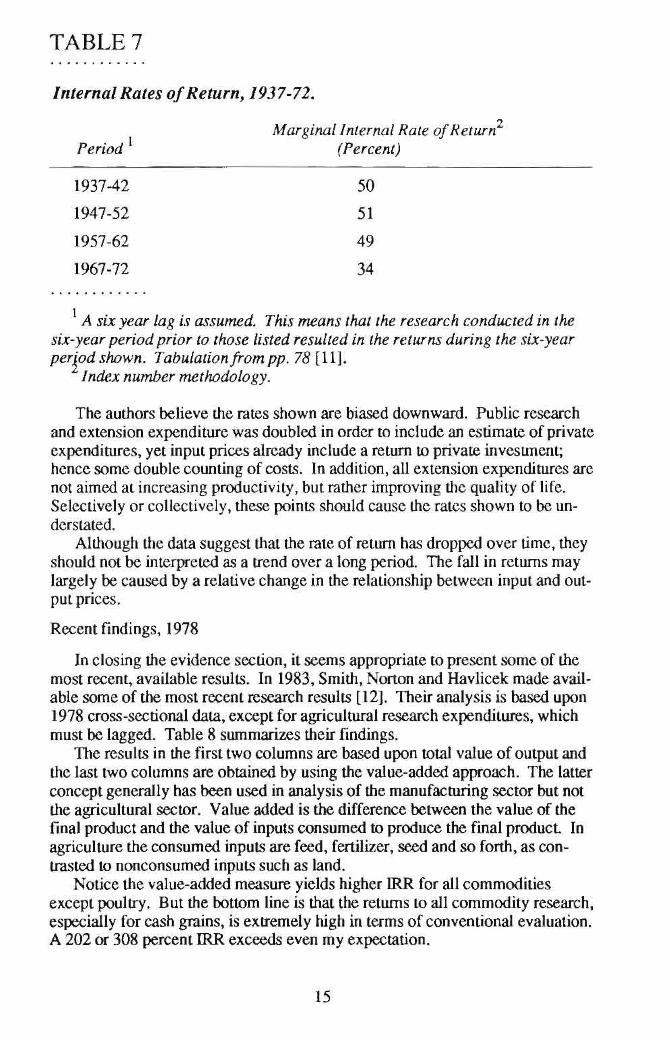
TABLE 7
Tnternal Rates of Return, 1937-72.
Period I
1937-42
1947-52
1957-62
1967-72
Marginal Internal Rate of Return2
(Percent)
50
51
49
34
1 A six year lag is assumed. This means that the research conducted in the six-year period prior to those listed resulted in the returns during the six-year perjod shown. Tabulation/rom pp. 78 [l1J.
Index number methodology.
The authors believe the rates shown are biased downward. Public research and extension expenditure was doubled in order to include an estimate of private expenditures, yet input prices already include a return to private invesunent; hence some double counting of costs. In addition, all extension expenditures arc not aimed at increasing productivity, but rather improving the quality of life. Selectively or collectively, these points should cause the rates shown to be understated.
Although the data suggest that the rate of return has dropped over time, they should not be interpreted as a trend over a long period. The fall in returns may largely be caused by a relative change in the relationship between input and output prices.
Recent findings, 1978
In closing the evidence section, it seems appropriate to present some of the most recent, available results. In 1983, Smith. Norton and Havlicek made available some of the most recent research results [12]. Their analysis is based upon 1978 cross-sectional data, except for agricultural research expenditures, which must be lagged. Table 8 summarizes their findings.
The results in the first two columns are based upon total value of output and the last two columns are obtained by using the value-added approach. The latter concept generally has been used in analysis of the manufacturing sector but not the agricultural sector. Value added is the difference between the value of the final product and the value of inputs consumed to produce the final product In agriculture the consumed inputs are feed, fenilizer, seed and so forth, as contrasted to nonconsumed inputs such as land.
Notice the value-added measure yields higher IRR for all commodities except poultry. But the bottom line is that the returns to all commodity research, especially for cash grains, is exttemely high in terms of conventional evaluation. A 202 or 308 percent IRR exceeds even my expectation.
15

TABLE 8
Marginal Products and Marginal " lIernal Rates oj Retllrn /0 Experiment Statio II Nesearch.
Commodity
Gross Production Function
Mpl IRR'
Value -Added Function
Mpl IRR2 Group (1978 Dol/ars) (Percem) (1978 Dol/ars) (Percent)
Cash Grains 3 95.80 202.0 103.70 307.9
D ' 4 airY 9.78 24.87 14.78 38.78
Poultry 3 24.10 60.9 9.80 25.5
Other Livestock 8.70 22.3 16.50 43.3 . . . . . . . . . . . .
IMP = Marginal Product. ~ IRR = Internal Rate of Return .
4 ~~~:~ ~;;heast alone. (Reproduced/rom [1 2J Table 5 . pp. 1l4).
Evidence summarized
The results have cove red over 100 years of agricultural research. While the IiteralUre on the subject is very extensive, only a small sample can be presented. For the benefit of the reader, a summary of the ev idence is provided in Table 9. Incidentally. the reported rates of return have been replicated many times by studies conducted for other cQumrics. Some of the [RR for foreign countries, in annual percen!., are: Mexico-wheat 90, maize 35; Brazil-cotton 77; Japan- rice 73·75; Colombia- soybeans 79-96; and India-sugarcane 60, to mention only a few. All are reasonably consistent with United States findings.
I view the results as remarkably consistent, although the reader may not. But the central point is that the IRR is exceedingly high, no matter what the me thod of detennination or the researcher conducting the analysis.
The big picture is painted so excellently by Schultz , as follows:
... the increase in the social product likely to be achieved is so much larger than the prospective social cost that all mistakes lhat are made because o[ hasty decisions, poorly trained scientific personnel, some overlapping and duplications (much of which is necessary) and the lost motion that has characterized some aspects of this growth in research become quite wtimportant when seen against the net gains thaI are realized despite the' wtnecessary' ineffiCiencies (4: 11 8).
16

TABLE 9
Summary of Estimates of Returns to Investment in Agricultural Research and Extension.
Time Study Year Commodity
Schultz 1953 Aggregrate
Gritiches 1958 Hybrid Com Evenson 1978 Aggregate
Aggregate Regions
North South West
Extension Peterson, Bredahl and Peterson
1967 Poultry 1976 Cash Grains
Poultry Dairy Livestock
Knutson and Tweetcn 1979 Aggregate
Evenson, Waggoner and Ruttan 1979 Aggregate Technology oriented Science-oriented Technology oriented
South North West
Period
1910·50
1933·55 1868·1927 1926·50
1948·71 1948·71 1948·71 1948·71
1915·60 1969 1969 1969 1969
Annual Internal Rate of Return
(Percent)
Lower limit 35 Upper limit 171
35·40 65 95
95 130 100 110
20·30 36 37 43 46
13 yr.lag 16 yr. lag
1939·48 40.9 1949·58 38.8 1959·68 31.6 1969·72 28.0
1868·26 1927·50
1948·71
49.7 47.4 39.4 35.5
65 95
110
Aggregate-Science-Oricnted Aggregate-Fann Mgt.-Agr. Ext.
130 93 95 45
110 Peterson and Fitzharris
1977 Aggregate
Smith, Norton and Havlicek 1
1983 Cash grains Dairy Poulu-y Livestock
193742 1947·52 1957·62 1967·72
1978
50 51 49 34
202 25 61 22
I Rates reported are determined by the gross production/unction method and are considerably lower than those determined by the value added method except for pOUltry.
17

WHO BENEFITS FROM AGRICULTURAL RESEARCH?
Many misconceptions exist about who benefits from the high returns to agricultural research. These misconceptions are widely held by individuals in all walks of life. The general belief being held is that farmers are the sole beneficiaries of agricultural research. I find over many years of discussion at meetings, barbecues and cocktail parties that such a view is widely held by lawyers, housewives. college professors, doctors, scientists, politicians, laborers and, yes, even farmers, to name only a few categories of the general population.
The holding of such a view is almost entirely without foundation. The adoption of the results of most agricultural research, both science- and lcchnologyoriented, leads to increased output or reduced costs of production or both. As output increases, food prices fall. Further, since the demand for most food products is inelastic, prices fall more than output increases: hence, the farmer is left with reduced income. Most research reduces per unit costs of production and reduced costs, under the competitive conditions faced by farmers, invariably leads to increased output and lower prices. It is not by chance that United States consumers spend less than 13 percent of their total expenditures on food, the lowest of any country in the world. In the late 1800s consumers spent at least half the money they earned on food. As the saying gocs "we've come a long way, baby." Western Europeans spend 17-23 percent of their total expenditures on food while Korea spends over 40 percent and the Philippines over 50 percent. Americans are among the best fed people in the world and at the lowest cost due in large part to the research contribution.
Another misconception associated with this issue is that all farmers gain. Sad as it may be, the truth is that many farmers are put out of business by the development of new technology. Why? Of the more than 2 million farms in 1986, many are simply not in a position to adopt new technologies because of weather, soil conditions, topography, or size of land holdings. Farms which adopt the new technology increase output and hence prices fall, as previously stated. As a result, the "nonadaptable" farmers find themselves in an economic squeeze with no way to respond.
If farmers in general are losers, who benefits from the large returns of agricultural research? First, farmers who originally introduce the new technique will benefit in the short run. That is, they will benefit until the price of the product falls as a result of expanding output. But because of the competitive structure of agricultural production, with thousands of producers of a given commodity, those who initially gain cannot hold on to those gains for long. Consequently, in the longer run all farmers are faced with reduced incomes.
Second, consumers are the real beneficiaries of agricultural research. The only benefits that fanners receive in the long-run are those which accrue to them as consumers. Any reduction in the real costs of producing food benefits the consumer. It is crucial for everyone to understand that the real income of low income families is increased relatively more than that of high income families. We owe our agricullural scientists Q great deal in this connection (13:585). This fact alone gocs a long way in justifying continued and increased public support of agricultural research.
18

POLICY 1M PLICA nONS
One of the most important issues facing the United States and the world in providing adequate food is a continuing flow of new LCchnologies. Yet, in attempting to meet such a goal, agricultural scientists are blamed for much of our nation's and the world's agricultural ills. They are held responsible for soil erosion, chemical pollution of the soil and food supply, poor quality of food products, high energy usc, and even U.S. agricultuml surpluses. And on the latter point there exists a rather powerful school of critics which proJXJses the curtailment of agricultural research as the solution to the surpluses. To which Bressler replied:
To follow this path would mean to gamble with our future in the hope of solving problems that have been stimulated if not created by past programs and policies. Agriculture can continue to make great advances in efficiency and productivity and so contribUle substantially to growth and development of the total economy, but agriculture cannot be expected to maintain and increase past trends in efficiency and productivity unless supplied with a continuing stream of new technological innovations-a stream that must originate in research and be disseminated through education (14:363-64).
If, in the past, continued expansion of the agricultural research budget has been justified on the basis of its contribution to the U.S. economy and essentially the American consumer, it clearly in the fulure need not be confined to that issue. We are now in a period of what might be called "global agriculture" in which we are in a battle to maintain our competitive position in the world. In 1980 and 1981 agricultural eXIX>rts averaged about $42 billion while competitive imports, products similar to those produced commercially in the United States, averaged $10.5 billion or an agricultural commodity trade balance of $31.5 billion. In those years agricultural exports accounted for 19 percent of all exports. By 1986 agricultural exports had dropped to $26 billion and competitive imports had increased to almost $14 billion, thus dropping the trade balance to $12 billion and agriculture's share of total exports to 13 percent. While a fall in the value of the dollar would have some effect on the foregoing numbers, most of the change in dollar values occurred after 1986. The trends indicate that the competitive position of one of our few remaining industries producing a surplus balance of trade is being allowed to slip away. We will remain competitive in the world only by enhancing productivity growth; and, to assure this happening, investment in research cannot be allowed to stagnate.
Recently, a well known authority on world food problems, Dr. Lester Brown, fears the battle is being lost. Dr. Brown has written extensively over the last 20 years on both domestic and world food problems. Among his many books are Man and His Environment: Food, 1972; Seeds of Change: The Green Revolution and Development in the 1970' s, 1970; By Bread Alone, 1974; and State of the World, 1987. He is presently president of World Watch Institute.
Brown recently wrote an editorial which appeared in The Washington POSl
and The Hartford Courant, (September 19, 1988) [15]. He points out that global grain output grew 260 percent between 1950 and 1984, but has since slowed markedly, caused in part by the lack of new agricultural techniques. As he says:
19
The loss of momentum since 1984 is, in part because of a diminishing backlog of new technology. Indeed, in some countries, the grain yields achieved by the beller farmers are approaching those reached by scientists on experimental pIOlS.
Unfortunately, there are no identifiable technologies waiting in the wings that will lead to quanzumjumps in worldfood output such as those associated with the spread of hybrid corn, the ninefold increase infer/ilizer use between 1950 and 1984, the near tripling of irrigated area during the same period or the relatively recent rapid spread of high-yielding wheals and rices in Third World Countries [15).
He goes on to state that biotechnology will not end hunger since it docs not promise any alternatives to the photosynthetic process that is the ultimate constraint onfood production /15/.
Clearly, a continuous now of agricultural technologies is necessary to avoid serious.food problems in the future. This is, of course, con trary to the popular belief that agriculture is a comracting industry and that a continued commitment to research is not essential.
The data presented clearly call for consideration or reconsideration of the issue of investment in agricultural research by the public whose taxes are involved and by politicians whose support of expenditures is required. Annual returns of approximately 50 percent is clear evidence of underinvestment. Such a rate of return in most any sector of the economy would be expected to attract additional invesunent capital. It is difficult to believe that the private sector, faced with rates of return at such a level, would not have made additional investments. Why not the public sector? ... a nation could have expanded its investment in agricultural research and earned a rate ofre/umfar higher thanfrom almosl any other investment (10: 11(6).
With benefits greatly in excess of costs, additional investment in agricultural research is clearly indicated. Yel, as Table 10 shows, increases in combined federal and slate appropriations have been modest. Total slate and federal resean:h funding increased from 429.9 million in 1967 to 664.0 million in 1987, a 54 percent increase in twenty years. This translates into a 2.7 percent average growth rate per year. From 1967 to 1979 the constant 1967 dollar funding increased only 12 percent or one percent per year, which is clearly inadequate. This will be shown in what follows.
20
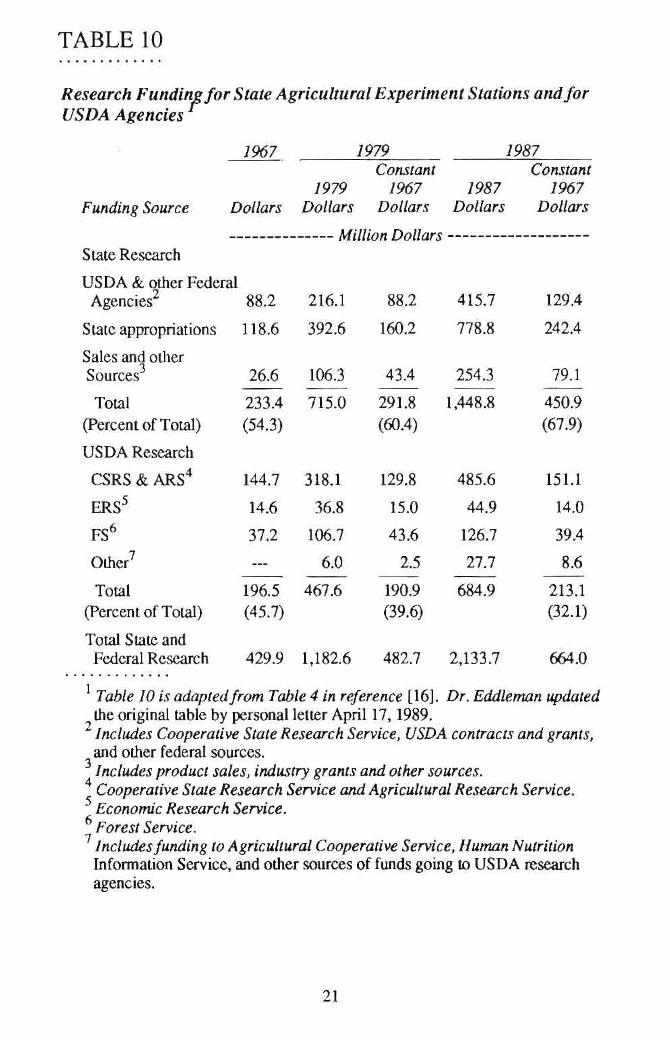
TABLE 10
Research Fundi"! for State Agricultural Experiment Stations andfor USDA Agencies
1967 1979 1987 Constant Constant
1979 1967 1987 1967 Funding Source Dollars Doilars Dollars Dollars Dollars
-------------- Million Dollars -------------------State Research
USDA & other Federal Agencies2 88.2 216.1 88.2 415.7 129.4
S late appropriations 118.6 392.6 160.2 778.8 242.4
Sales and other Sources3 26.6 106.3 43.4 254.3 79.1
- - - - --Total 233.4 715.0 291.8 1,448.8 450.9
(percent ofTotal) (54.3) (60.4) (67.9)
USDA Research
CSRS & ARS4 144.7 318.1 129.8 485.6 151.1
ERS5 14.6 36.8 15.0 44.9 14.0
FS6 37.2 106.7 43.6 126.7 39.4
Olller7 6.0 2.5 27.7 8.6
-- - - --Total 196.5 467.6 190.9 684.9 213.1
(percent of Total) (45.7) (39.6) (32.1)
Total State and Federal Research 429.9 1,182.6 482.7 2,133.7 664.0 . . . . . . . . . . . . .
1 Table 10 is adaptedfrom Table 4 in reference [16]. Dr. Eddleman updated Ille original table by personal letter April 17, 1989.
2 Includes Cooperative State Research Service, USDA contracts and grants, and other federal sources.
3 Includes product sales, industry grants and other sources. 4 Cooperative State Research Service and Agricultural Research Service. 5 Economic Research Service. 6 Forest Service. 7 Includes/unding to Agricultural Cooperative Service, Human Nutrition
Infonnation Service, and other sources of funds going to USDA research agencies.
21

A study of Table 10 shows a drastic shift in the sources of research funds. From 1967 to 1979 the USDA research effort actually dropped three percent from 196.5 10 190.9 million in constant dollars. It was fortunate that during thi s same period the states' expenditures increased 25 percent, but notice that federal support for StaLe Agricultural Experiment Stations (SAES) remained constant at 88.2 million. Note also that if it were not for the slates the agricultural research establishment would be in dire straits. The states have increased their financial support from 54.3 percent of the to tal research effort in 1967 to 67.9 percent in 1987, while the USDA support has dropped from 45.7 to 32.1 percent over the same twenty years. How long can this continue before a highly productive research organization is jeopardized? Eddleman pulS it well when he says:
Even with all the evidence abouJ the large and positive contributions to producriviry, governments (and particularly the/ederal government) continue to underinvesl in agricultural research and education. This factor is a constraint on the development and application of new kno'wledge for agriculture. l16:7. Emphasis mine].
The high rates ofretum which have existed for 100 years mean that the United States has continually undervalued agricultural research. A cure for such a long-time disequilibrium in the economy has been and remains ava ilable; name ly, increased public investment in agricultural research. The National Research Counc il of the National Academy of Sc iences, came to the following conclusion concerning the amount by which research expenditures should Increase.
The steering committee does not know what the optimum/ood and nutrition budget level should befor the next few years ... We believe that an overall food and nutrition research budget increase, compared to FY 1974, 0/ at least 50 percent in real terms over the next /WO or three years is needed to make a strong start on Ihe new priorities, and that a steadily rising real expenditure trend is essential over the nexl decade and beyond to do justice to the purpose of reducing world hunger and malnutrition [17 J.
The Board of Agriculture and Renewable Resources came to a similar conclusion in the same year, 1975.
We recommend a substantial increase of support for research directed toward the production, dependability, and quality of the food supply. Financial support for such research should be increased 10
restore at leasl the 1966 buying power ... Siale and federal support now totaling about $450 million per year for research related to agricultural productivity should be increased immedia tely by 40 percent lI 8].
Thus, 13 years after the foregoing recommendations, little o r nothing has happened.
The general policy recommendations of the two di stinguished committees is correct, but the period over which the recommended budgetary increases lake place is probably too short. A 40-50 percent increase over a 2 10 3 year period would not penn it efficient use of the money, since properly trained research per-
22
sonnel would not be available. While proper facilities are necessary, research results are largely dependent upon trained scientists.
What, then, is an alternative policy which would meet the committee's recommendations, yet assure efficient use of the budgetary increases? Knutson and Tweeten [9] addressed the issue by determining the future research investment required for the 1976-2015 period to fund all agricultural research activities with an expected rate of return above the generally prevailing marginal rate of return on investments in our economy. Since the marginal IRR to agricultural research is approximately 50 percent, annual investment in research should be increased up to the point where the marginal IRR is equal to the generally prevailing interest rate of 10 to 15 percent. The two researchers developed a number of scenarios, mainly dependent upon the growth in demand for food. Two likely scenarios may be summarized as follows:
If demand is expected to grow 15 percent annually, increase real R (research investment) by 10 percent for four years and at an annual rate of 3 percent per year thereafter. If demand is expected to grow at afaster rate increase real R by 10 percent per year for four to five years, then reduce the rate of increase to 3 to 5 percent per year (9:75).
Already 12 years have been lost in following the investment recommenda-tion. It is now time for local, state. and federal governmental bodies and LandGrant Universities to take action to increase funding for agricultural research. It does seem that government at the Federal, State, and Local levels, had greater wisdom and vision 100 years ago than today.
23

REFERENCES
[1) Mayer, Andre and Jean. "Agriculture: The Island Empire," in Science and lIs Public: The Changing Relationships, summer 1974 issue of Daedalus. pp. 83-95.
[21 U.S.D.A., After A Hundred Years. The Yearbook of Agticulture, U.S. Government Printing Office, Washington, D.C., 1962.
[3J Norton, George W. and Jeffrey S. Davis. "Evaluating Returns to Agricultural Research: A Review." American Journal of Agricultural Economics, 63(1981):685-699.
[4) Schultz, Theodore W. The Economic Organization of Agricu//ure. New York: McGraw-HiU Book Co., 1953, pp. 99-124.
[5J Griliches, Zvi. "Research COSlS and Social Returns: Hybrid Com and Related Innovations." Journal of Political Economy, 66(1958):419-31.
(6J Evenson, Robert E. "A Century of Productivity Change in U.S. Agriculture: An Analysis of the Role of Invention, Research and Extension ," Center Discus· sion Paper No. 296. Economic Growth Center, Yale University. August, 1978.
[7J Peterson, Willis L. "Remrn to Poultry Research in the United SUlIeS." Journal of Farm Economics, 49( 1967):656-669.
[8J Bredahl , Maury and Will is Peterson. "The Productivity and Allocation of Research: U.S. Agricultural Experiment Stations." American Journal of Agricultural EcoMmics , 58(1976):684-692.
[9] Knutson, Marlys and Luther O. Twcctcn. "Toward an Optimal Rate of Growth in Agricultuml Production Research and Extension." American Journal of Agricultural Economics, 6 1( 1979):70-76.
(lOJ Evenson, Robert E.. Paul E. Waggoner and Vernon W. Ruttan. "Economic Benefits from Research: An Example from Agricuhure." Science 205 ( 1979): I WI-II07.
[III Pelerson, Willis L. and Joseph C. Fitzharris. "Organizations and Productivity of the Federal-State Research System in the United Stales." Chapter 3. Resource Allocation and Productivity in National and International Agricultural Research, cd. T.M. Arndt, D.O. Dalrymple and V. W. Ruttan. Minneapoli s: University of Minnesota Press, 1977.
[12J Smith, Blair L., George W. Nonon and Joseph Havlicek Jr. "Impacts of Public Research Expeoditures on Agricultural Value- Added in the U.S. and the Northeast." Journal a/the Northeast Agricultural Economic CounCil, Vol. XII, No.2, pp. 109-114, Fall, 1983.
[I3J Schultz , Theodore W. "Uneven Prospects for Gains from Agricultural Resean:h Related to Economics Policy." Chapter 28, Resource Allocation and Produc ~ (ivi(y in National and international Agricultural Research, ed. T.M. Arndt, D.G . Dalrymple and Y.M. Ruttan, Minneapolis: University of Minnesota Press, 1977.
[14J Bressler, R. G. Jr. "Farm Technology and the Race With Population." Journal of Farm Economics. Volume 39-1 (1957):849- 864.
[1 5] Brown, Lesler R. "To Fight Food Shonages, more Binh Control." The Hanford Courant Editorial page. Seplember 19, 1988.
24

[16J Eddleman, B.R. "Impacts of Reduced Federal Expendilures for Agricultural Research and Education." IR-6 Infonnation Re)X>rt No. 60. Interregional Cooperative Publicalion, May 1982.
[17J National Research Council, National Academy of Science. World Food and Nutrition Study: lnlerimReport, Washington, D.C. , 1975.
(18] Board of Agricuhure and Renewable Resources. Commission on Natural Resources, National Research Council, National Academy of Sciences. World Food and Nutrition Study: Enhancement of Food Production/or the U.S. Washinglon, D.C., 1975.
25

ACKNOWLEDGMENTS
Capable and critical colleagues are necessary to writing and publishing in one's professional field. This article has been revised and rewritten several times in order to incorporate valuable suggestions from reviewers Emilio Pagoulatos, Boris E. Bravo-Ureta, Robert L. Leonard and Tsoung-Chao Lee, all Professors in the Department of Agricultural Economics and Rural Sociology at the University of Connecticut. Many thanks for your substantive and editorial contributions. I must, of course, accept full responsibility for the content, especially the summations of various authors' research fmdings, which I hope have been accurately presented.
Finally, no article can be wriuen without a supporting cast. Karen Nyc typed numerous drafts with skill and efficiency and was especially patient with me. Thank you Karen. Thanks also go to Bud Gavitt who has, over the years, edited my numerous manuscripts. He always has been most cooperative and is a pleasure to work with.
26