who seminar by the cfwi 12 december 2014
TRANSCRIPT

Making the right decisions in a complex world
WHO seminar, Geneva12th December, 2014
Dr. Graham WillisHead of Research and Development, CfWI
Matt EdwardsHead of Horizon scanning and International, CfWI

Many years ago…

How many trained hospital doctors will we have by 2040?
Cost

How many do we need?
Do we trust this?
Trai
ne
d h
osp
ital
do
cto
rs
(th
ou
san
ds)
60
50
40
30
Year2014 2040
Supply
Demand
?
Policy
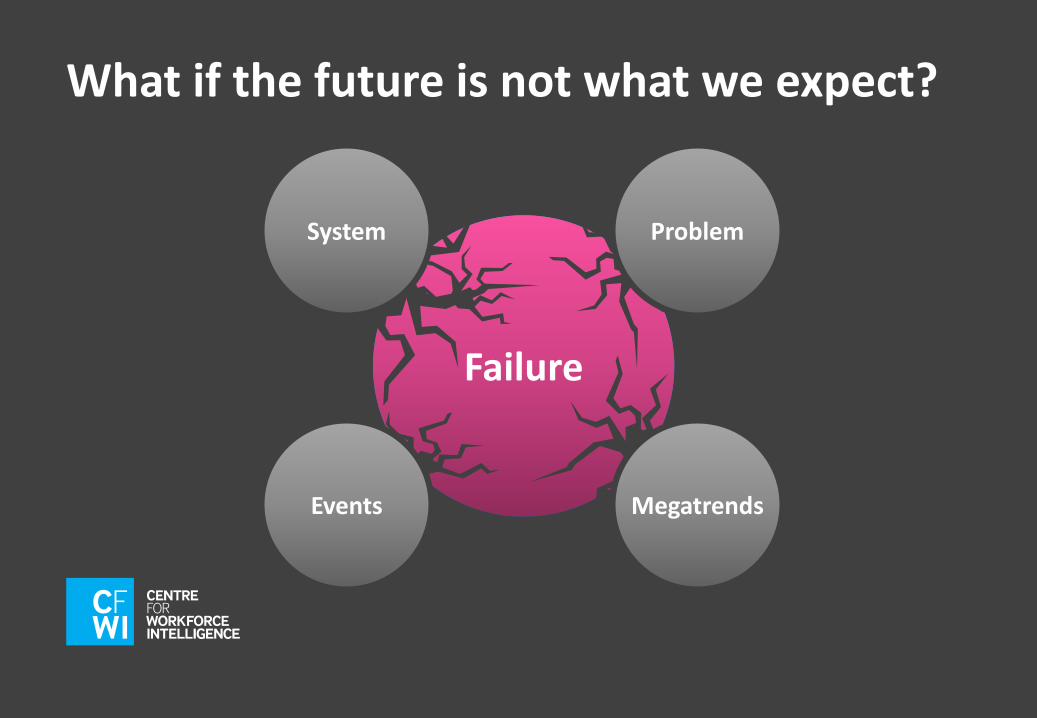
What if the future is not what we expect?
Failure
Megatrends
ProblemSystem
Events

Consider many futures…
Expected future
Use plausible, challenging and consistent futures to test policies

Principles
Systemic
Future-oriented
Flexible
Transparent
Inclusive
Comprehensive
Understandable
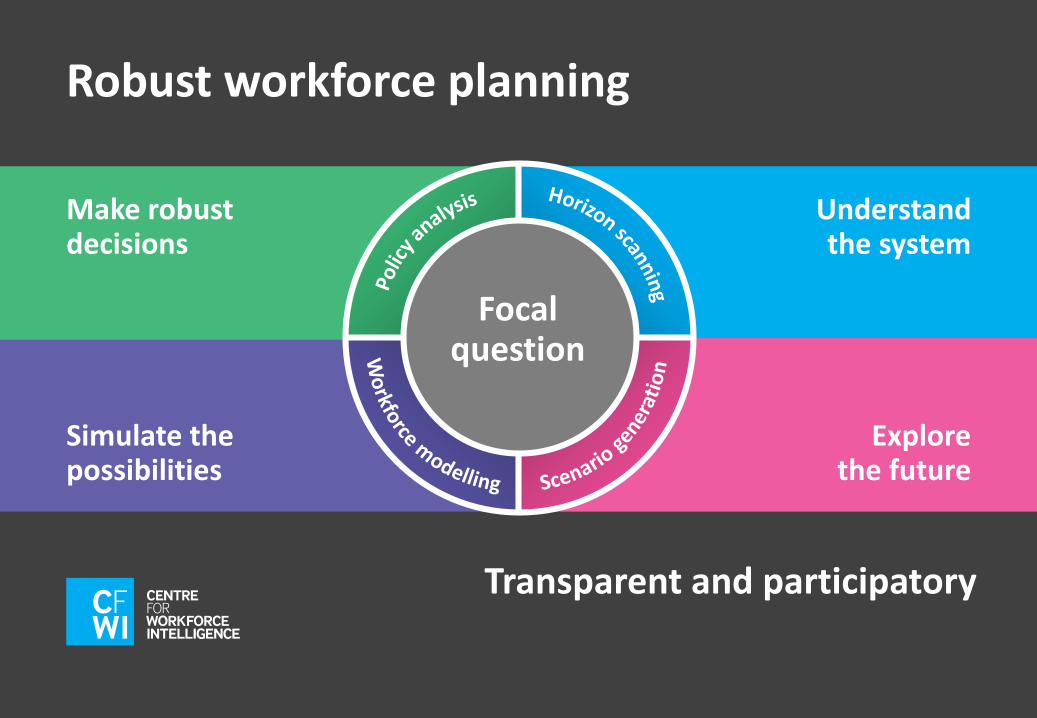
Robust workforce planning
Understand the system
Explore the future
Simulate the possibilities
Make robust decisions
Focal question
Transparent and participatory
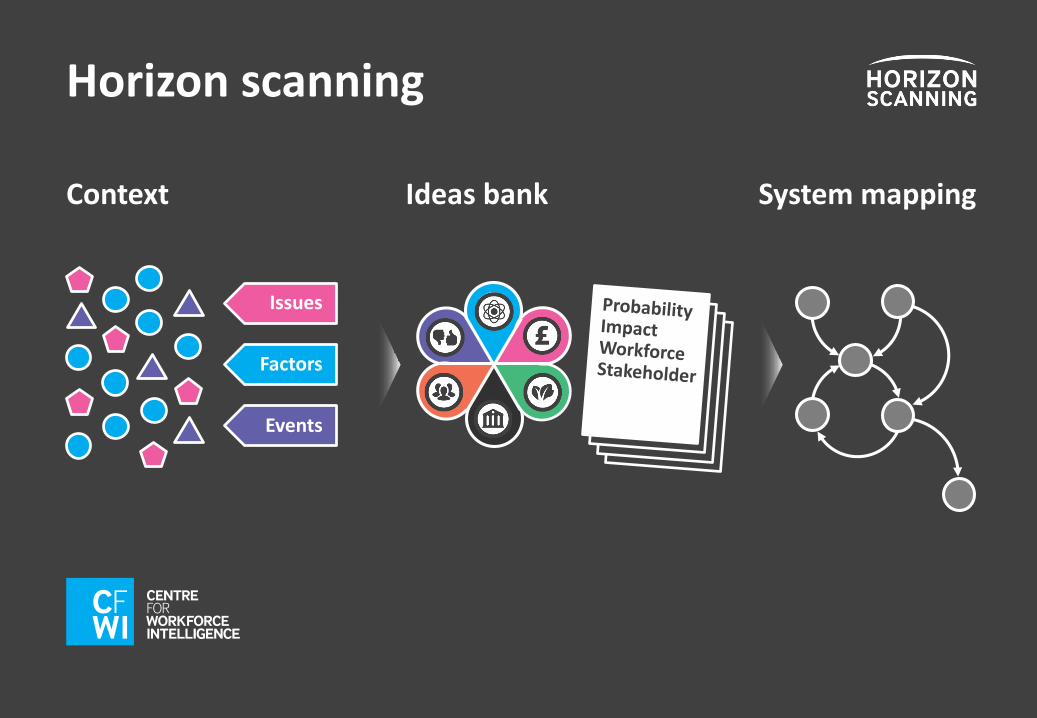
Horizon scanning
Context
Issues
Factors
Events
Ideas bank System mapping

Scenario generationStakeholder workshops
Influencing factors
Keyfactors
Consistency check
Narrative scenarios
Quantified scenarios

Scenario generation workshopKey factors
Low
Imp
act
Hig
h
Low Uncertainty High
Predetermined Key factors
Secondary

Scenario generation workshop
Population GDP growth Energy usageCarbon
emissions
High
LowCA
B
Consistency analysis

Scenario generation workshop
Vary across different futures
Formal elicitation protocol
Monte Carlo simulation
Pro
bab
ility
Value
Quantify critical parameters

Modeling and simulation
Demand side
OutputsSupply
side

Po
licy
ou
tco
me
s
Policy analysis
Policy options: A
B
C
D

Pharmacy exampleScenarios
Scenario 1Narrower
Scenario 2Internet-driven
Scenario 3Broader
Pharmacists role
Enabling technology
Projection 1
Projection 2 Scenario 4e-Pharmacy

Nu
mb
er
of
ph
arm
acis
ts (
full
-tim
e e
qu
ival
en
t)
20
12
20
14
20
16
20
18
20
20
20
22
20
24
20
26
20
28
20
30
20
32
20
34
20
36
20
38
20
40
100,000
80,000
60,000
40,000
20,000
0
20
12
20
14
20
16
20
18
20
20
20
22
20
24
20
26
20
28
20
30
20
32
20
34
20
36
20
38
20
40
100,000
80,000
60,000
40,000
20,000
0
20
12
20
14
20
16
20
18
20
20
20
22
20
24
20
26
20
28
20
30
20
32
20
34
20
36
20
38
20
40
100,000
80,000
60,000
40,000
20,000
0
20
12
20
14
20
16
20
18
20
20
20
22
20
24
20
26
20
28
20
30
20
32
20
34
20
36
20
38
20
40
100,000
80,000
60,000
40,000
20,000
0
Year
Scenario 1
Scenario 3
Scenario 2
Scenario 4
Pharmacy exampleHow uncertain is the future?

Pharmacy examplePolicy options
20%
35%
50%
5%10%
15%
A B C D E F
3%
One-off supply reduction Phased supply reduction
5 Years 10 Years

Po
licy
ou
tco
me
s
Pharmacy example
2
31
4
Policy options: A
B
C
D
E
F
Policy analysis

What about the rest of the system?
Health
Public health
Social care
2%
98%Workforces not yet
modelled
Workforces modelled to date

What about the rest of the system?
Health
Public health
Social care
10% Other health and support
21% Paid adult care and support
24%
Volunteer adult care and support
43%
Unpaid adult care and support
2% Workforces modelled to date
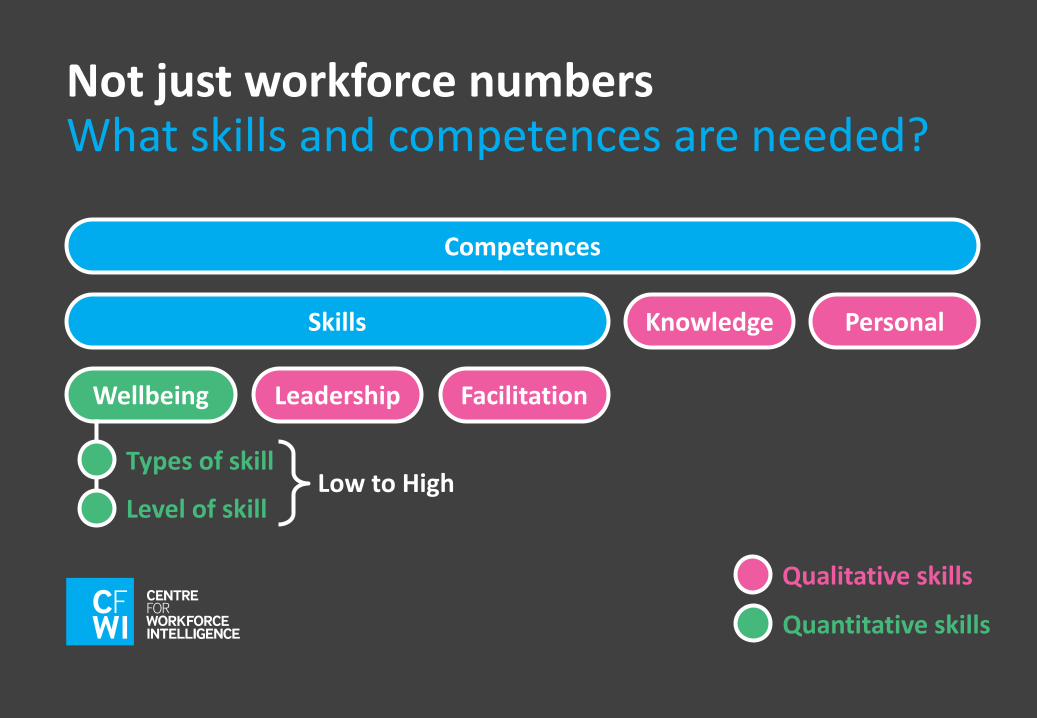
Not just workforce numbersWhat skills and competences are needed?
Competences
Skills
FacilitationLeadershipWellbeing
Knowledge Personal
Types of skill
Level of skillLow to High
Quantitative skills
Qualitative skills

Not just the skillsWhat drives the demand?
Demand for skills
Long-termconditions
Infectiousdiseases
Births
One-offevents
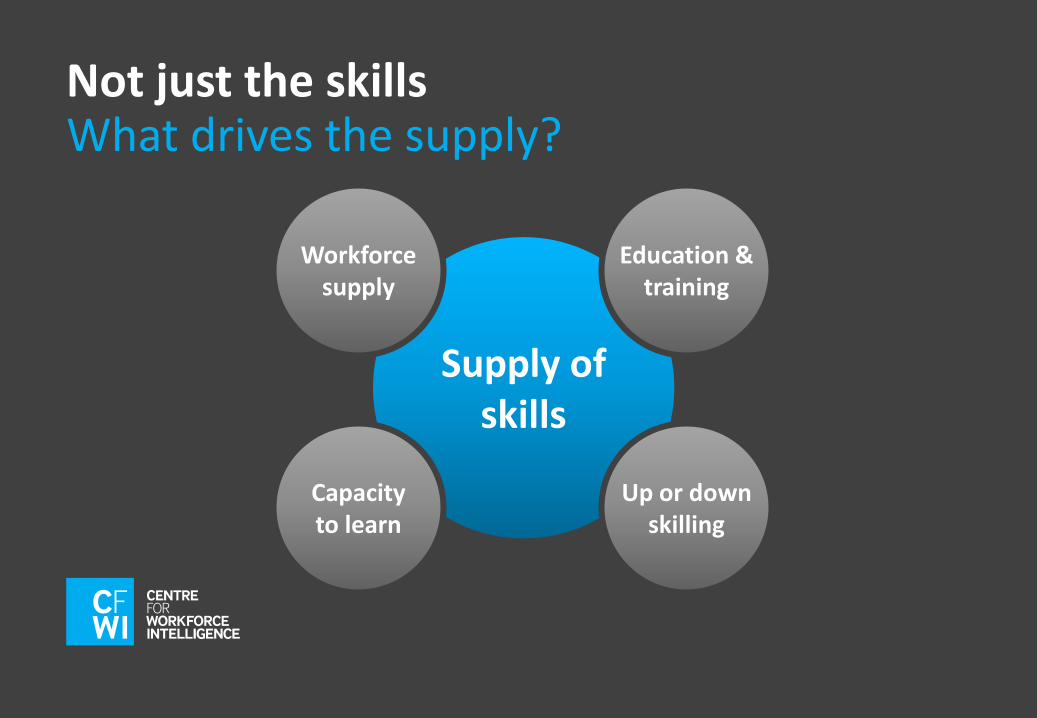
Not just the skillsWhat drives the supply?
Supply of skills
Up or downskilling
Education &training
Workforcesupply
Capacityto learn

Po
pu
lati
on
Learning disabilities
Oral health
Singular demand for service
Maternal and perinatal
Infectious disease
Mental long-term conditions
Physical long-term conditions
Skill level: 1 2 3 4 5
We need a new framework
Prevent
Enable
Assess
Plan
Treat
Rehabilitate
Relieve
Link
Unpaid adult social care workforce
Nurses
Dentists
Medical generalists
Medical specialists
Volunteer care and support workforce
Other workforce groups
Horizon 2035 workforce groups
Increasing concentration and experience

A new challenge: Horizon 2035
What skills and competences do we have?
What might we need in future?

Future demand for skillsSk
ill h
ou
rs/Y
ear
(B
illio
ns)
2012 2016 2020 2024 2028 2032 2036
Time (Year)
Probability: 80% 100%Central estimate:

5 Skill levels
4
3
2
1
Super-specialist
Specialist
Generalist
Increasing length of training
Skill dimensions
Visualising the system
Learning disabilities
Oral health
Singular demand for service
Maternal and perinatal
Infectious disease
Mental long-term conditions
Physical long-term conditions
Demand sourcesMedical Specialist

Visualising the system
Learning disabilities
Oral health
Singular demand for service
Maternal and perinatal
Infectious disease
Mental long-term conditions
Physical long-term conditions
Demand sources
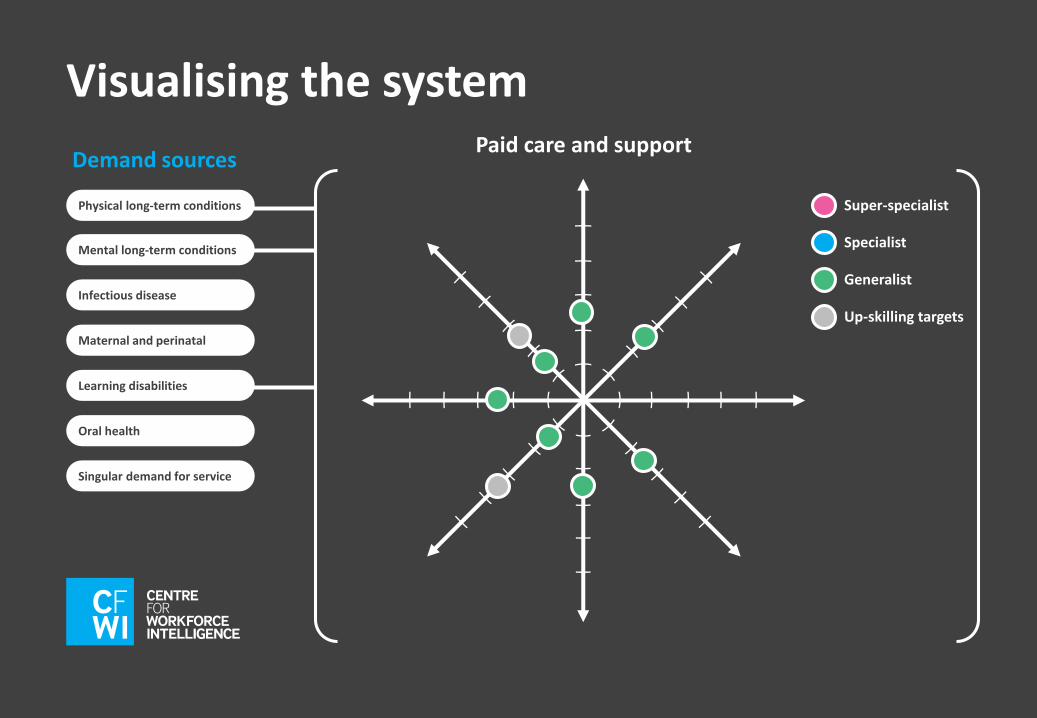
Super-specialist
Specialist
Generalist
Up-skilling targets
Midwife
Super-specialist
Specialist
Generalist
Up-skilling targets
Visualising the system
Learning disabilities
Oral health
Singular demand for service
Maternal and perinatal
Infectious disease
Mental long-term conditions
Physical long-term conditions
Demand sourcesPaid care and support
Stress testing

European perspective

EU Joint Action
Work packages Objectives
Increased knowledge
Improved tools
Higher effectiveness
Horizon scanning and qualitative
Quantitative
Data, migrationand mobility
Coordination
Dissemination
Evaluation
Sustainability
69 partners
Funded by the Health Programme of the European Union
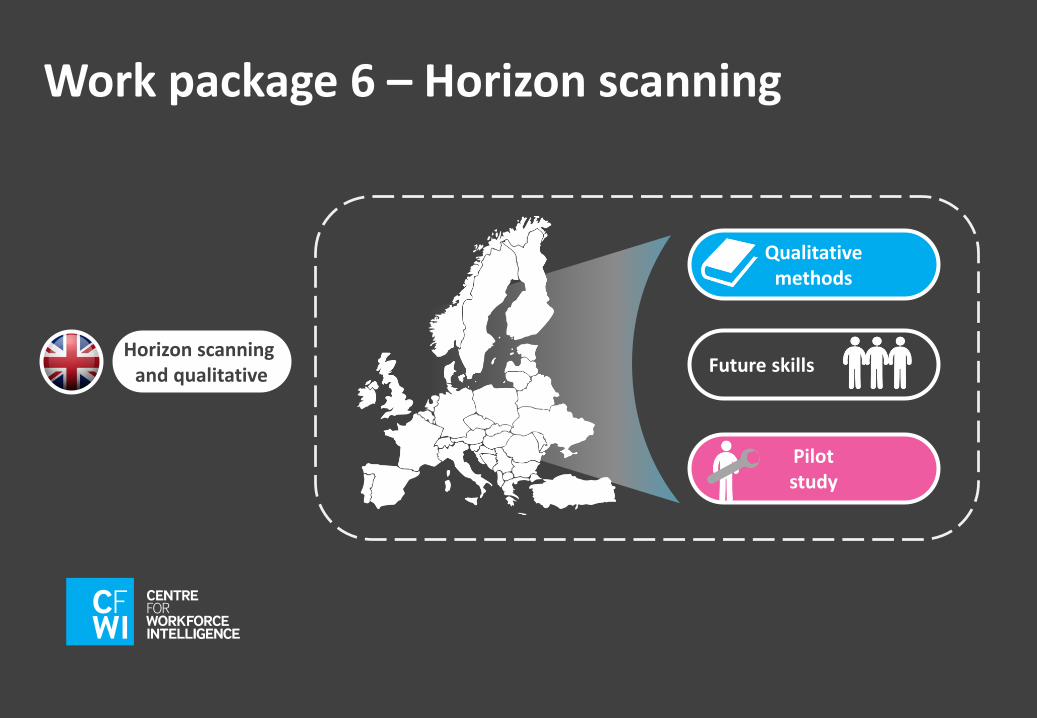
Work package 6 – Horizon scanning
Horizon scanning and qualitative
Qualitativemethods
Pilotstudy
Future skills

User guidelines – qualitative methods
Published 27 November 2014www.euhwforce.eu www.horizonscanning.org
Examples of methods in use across EU e.g. scenarios, surveys, Delphi
Helps deal with inherent complexity and uncertainty of workforce planning
Descriptions of health workforce planning and forecasting approaches for Belgium, Finland, Germany, Hungary, Netherlands, Spain and the United Kingdom
Qualitative methods
1
2
3

User guidelines – qualitative methods
Published 27 November 2014www.euhwforce.eu www.horizonscanning.org
Use alongside quantitative methods to achieve integrated approaches across Europe
Recommends taking into account the different useful approaches for different contexts
Methods can be used to systematically investigate different workforce futures and deal with uncertainty
4
5
6
Qualitative methods

Future drivers and skills across Europe?
Provide an estimation of the future needs of skills and competencies needed in the health workforce and their distribution.
Drivers and trends
Report on Future Skills and Competencies
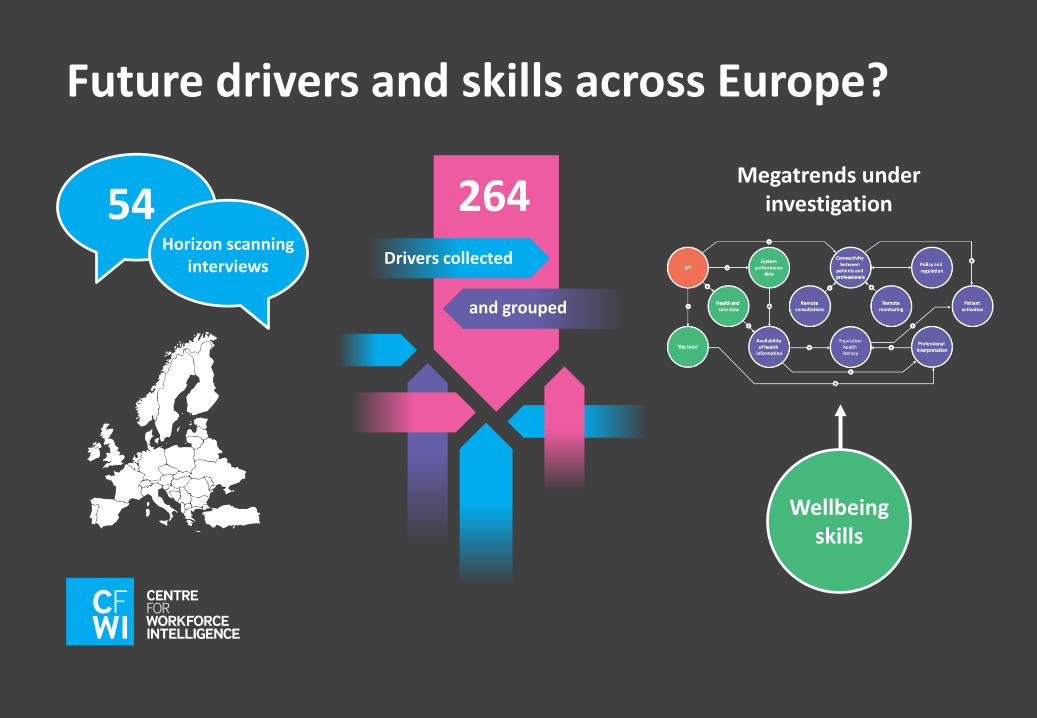
Future drivers and skills across Europe?
54Horizon scanning
interviews
264Drivers collected
and grouped
Megatrends under investigation
Wellbeing skills

Visual key
Van der Heijden (2005) Scenarios – the art of conversation
Different environments of influence
7 indicative causal loop diagrams
These guide the identification of megatrends.
FocalSkills and
competence of the health workforce
in 2035.

1. Connecting and enabling technologyEnable. Effective engagement with engaged ‘consumers’. Patient engagement/partnership/ empowerment. Interpretation of data/statistics. Interpersonal and communication skills.
Availability of health
information
System performance
data
Patient empowerment
Policy and regulation
Professional interpretation
Remote consultations
Connectivity between
patients and professionals
Health and care data
Remote monitoring
ICT
Population health literacy
‘Big Data’
+
+
+
+
+
+
+ +
+
+
+
+
+
+
Working
Transactional
Contextual
Focal

2. Demographic demandRelieve. Enable. Link. Chronic disease management/supported self-management. Coordination/linking skills. Multidisciplinary coordination and team working allied with generalist skills. Long-term care skills. Challenge to single disease framework. Communication skills.
Working
Transactional
Contextual
Focal
Multi-morbidity
Chronicconditions
EU fertility rate
Healthy cohort of older
people
Prevention
EU life expectancy
+
=+
+‘Age’ of the population
+
=
+
-
Economic and social inequality
+

2. Demographic demand
Working
Transactional
Contextual
Focal
Multi-morbidity
Chronicconditions
EU fertility rate
Healthy cohort of older
people
Prevention
EU life expectancy
+
+ =
+‘Age’ of the population
+
=
+
-
Economic and social inequality
+
Attach indicators which describe the current state or trend

2. Demographic demand
Working
Transactional
Contextual
Focal
Multi-morbidity
Chronicconditions
EU fertility rate
Healthy cohort of older
people
Prevention
EU life expectancy
+‘Age’ of the population
+
+
Economic and social inequality
+
< 5
10 - 14
20 - 24
30 - 34
40 - 44
50 - 54
60 - 64
70 - 74
80 - 84
2035
2010
Source: Eurostat
Source: Barnett et al, 2012

3. MobilityEducation, registration, licensing and regulation of skills. Workforce planning skills. Health system and workforce system incentives.
Working
Transactional
Contextual
Focal
Mobile health professionals
National skillsdistribution
European skills distribution
Healthoutcomes
National skillsrequirements
Mobile patient
‘consumers’+
+ +
European health market
for skills
+
Freedom of movement
+

4. ProductivityEnable. Self-care and self-management. Task allocation. Leadership skills. Productive teams.
Working
Transactional
Contextual
Focal
Location of care
GDP allocated to ‘healthcare’
Skill mix
Resistanceto change
Complexcomorbidities
Public health expenditure
Health systemefficiency
Patient/public expectations
Gross DomesticProduct
Access to care
Quality of care
+
--

5. PersonalisationAssess. Enable. Treat. Communication of risk. Shared decision making. Translation of research developments. Task allocation.
Working
Transactional
Contextual
Focal
Workforceproductivity
Behaviouralsciences
Population health literacy
Personalised care
Innovation genomics, Pharmaco-
genetics
Diagnostics Decision aids
Industrialinnovation
Riskstratification
+
+
Therapeutics+
+
+
+
+
+
+
+
Data collected by individuals
+

6. Future patientsAssess. Enable. Prevent. Communication skills. Coaching skills. Broader skill base and competence of healthcare in the population. Mobility. Role changes or partnerships. Defensive medicine.
Working
Transactional
Contextual
Focal
Proportionof types of
care
Ageingpopulations
Complexdemand
Diversepopulations
Proportion of generalists to specialists
Climate change
+
+
+
Diseaseprofiles
+
+
Patientempowerment
Informedpatients
+
+

7. SupplyLink. Cooperation. Task allocation. Supply of skills and competences. Workforce planning skills. Leadership skills. Multidisciplinary teams/integration. Workforce flexibility. Skill mix. Task shifting.
Working
Transactional
Contextual
Focal
Mobile healthprofessionals
Workforce roles
Healthworkforceheadcount
Attractiveness of career
Labour forceWork-lifebalance
expectations
Age of the population
- -
Induced demand
-Workforceinteraction
Quality of care

7. Supply
Working
Transactional
Contextual
Focal
Mobile healthprofessionals
Workforce roles
Healthworkforceheadcount
Attractiveness of career
Labour forceWork-lifebalance
expectations
Age of the population
- -
Induced demand
-Workforceinteraction
Quality of care

Demand is increasing and accelerating
(World Bank)
Global population
Global and national imbalances of workforces
6.9Bn
9.5Bn
2010 2050

World population by 2100
UN Population Division (UNPD) projects an 80 percent probability that the world’s population will be between 9.6 and 12.3 billion by 2100.
www.sciencemag.org/content/ 346/6206/234.abstract
http://www.newsecuritybeat.org/2014/10/refines-population-projections-80-percent-probability-10-12-billion-people-2100/
Wo
rld
po
pu
lati
on
(B
illio
ns)
2010 2020 2030 2040 2050 2060 2070 2080 2090 2100
13
12
11
10
9
8
7
6
UNPD and IIASA Projections, 2010-2100
IIASA SSP2 medium variant
UN medium variant
UN 80% upper probability
UN 80% lower probability

Key shifts and possible solutions?
Integrated care
24/7 and tech enabled working
24/7
Care model shifts
Secondary Care
Patient and service user empowerment / self-
management
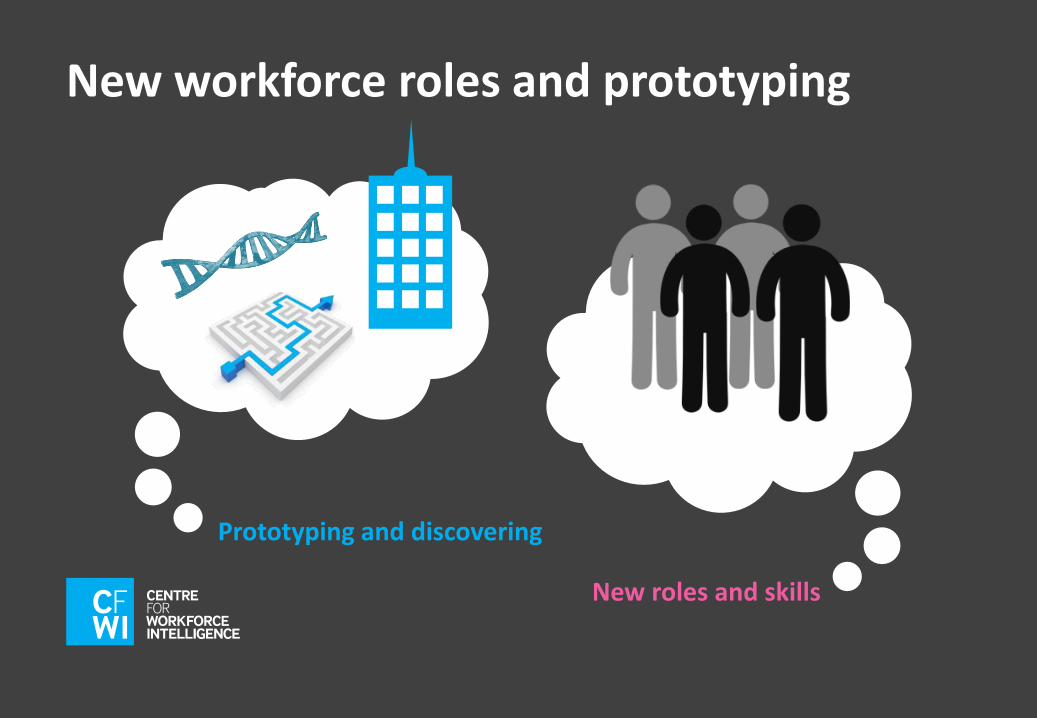
New workforce roles and prototyping
Prototyping and discovering
New roles and skills

Key points
What if the future is not what we expect?
Consider many futures Transparent and participatory approach

Scaling skills analysis to new levels?
Country Continent Global

Acknowledgements
Thanks to Jim Campbell, the WHO and GHWA for the invitation and hosting of this session.
Dr Delanyo Dovlo for chairing.
Also to acknowledge the continued support from the EU Commission, EU Joint Action, the Department of Health, UK and our national and international partners and advisors for participating in our research.

Contact details
Dr Graham WillisHead of Research and DevelopmentCfWI, England
@
+44(0)7812 340 405
www.cfwi.org.uk | www.horizonscanning.org.uk
Matt EdwardsHead of Horizon Scanning & InternationalCfWI, England
+44(0)7834 800 393
Questions welcomed…