who uses telecare - policystrategicsociety.org.uk/.../2013/01/who-uses-telecare-slide-pack.pdf ·...
TRANSCRIPT

Who Uses Telecare?
Andy Ross and James Lloyd September 2012 www.strategicsociety.org.uk

Acknowledgements This research was made possible by a grant from Age UK. The authors would particularly like to thank Matthew Norton of Age UK for comments and suggestions during the analysis, and advice from expert practitioners working in the field. English Longitudinal Study of Ageing data were made available through the UK Data Archive (UKDA). ELSA was development a team of researchers based the National Centre for Social Research, University College London and the Institute for Fiscal Studies. The data were collected by the National Centre for Social Research. The funding is provided by the National Institute of Aging in the United States, and a consortium of UK government departments co-ordinated by the Office for National Statistics. The developers and funders of ELSA and the Archive do not bear any responsibility for the analyses or interpretations presented here. Published by The Strategic Society Centre. © The Strategic Society Centre, 2012

Stage 1: Telecare users aged 50+ in England (2008)

Prevalence of Telecare among older population (aged 50+)
Personal alarm†
Alerting devices (households)
Overall prevalence 4.0% 6.0 % Private funding* 53 % 29.2 % Non-private funding** 49.5 % 57.4 % Already in property n/a 13.0 % weighted n 224 395
† Among the population of individuals aged 50+ who report at least one mobility, one ADL or one IADL problem
* Funding from “Self or partner” or “Other family member”
** Funding from NHS, Social services, Care home/landlord/housing authority, Charity or voluntary organisation
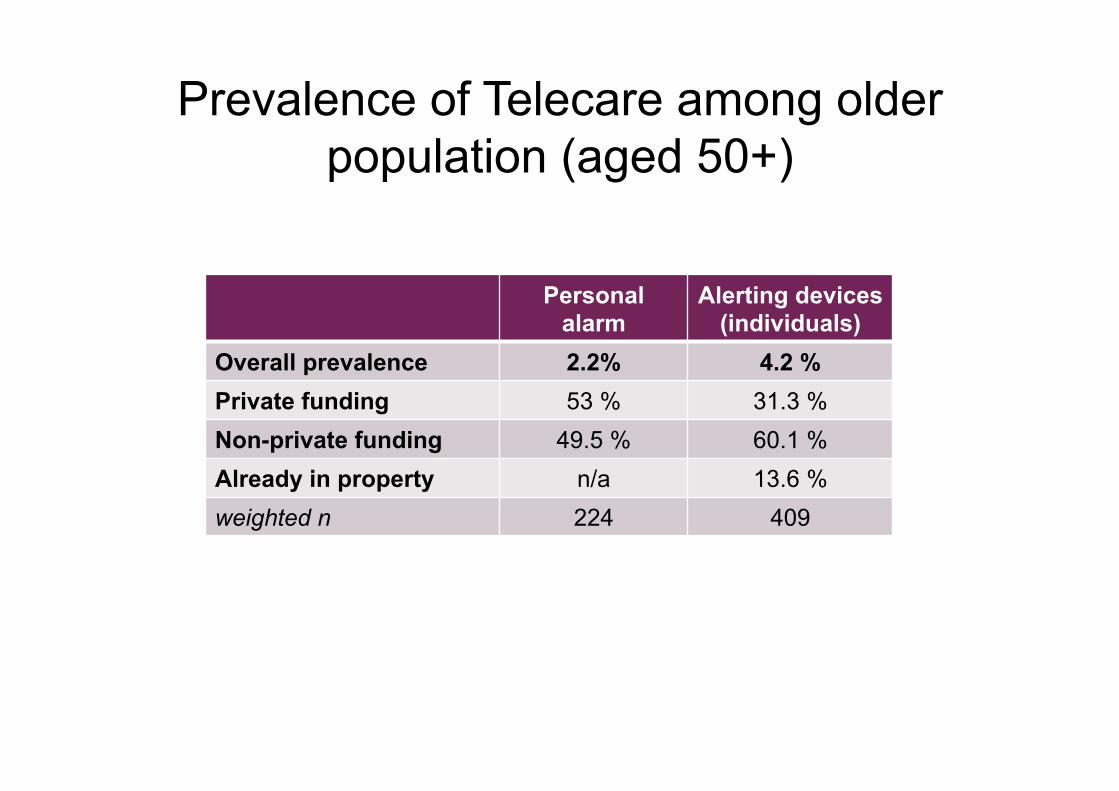
Prevalence of Telecare among older population (aged 50+)
Personal alarm
Alerting devices (individuals)
Overall prevalence 2.2% 4.2 % Private funding 53 % 31.3 % Non-private funding 49.5 % 60.1 % Already in property n/a 13.6 % weighted n 224 409

Personal Alarms
Descriptive statistics comparing personal alarm users with nonusers among individuals with at least one mobility, ADL or IADL issue

Age
0%
5%
10%
15%
20%
25%
50 52 54 56 58 60 62 64 66 68 70 72 74 76 78 80 82 84 86 88 90
Age
Personal alarm No alarm

Age group
0%
10%
20%
30%
40%
50%
50-59 60-69 70-79 80-89 90+ Age
Personal alarm No alarm
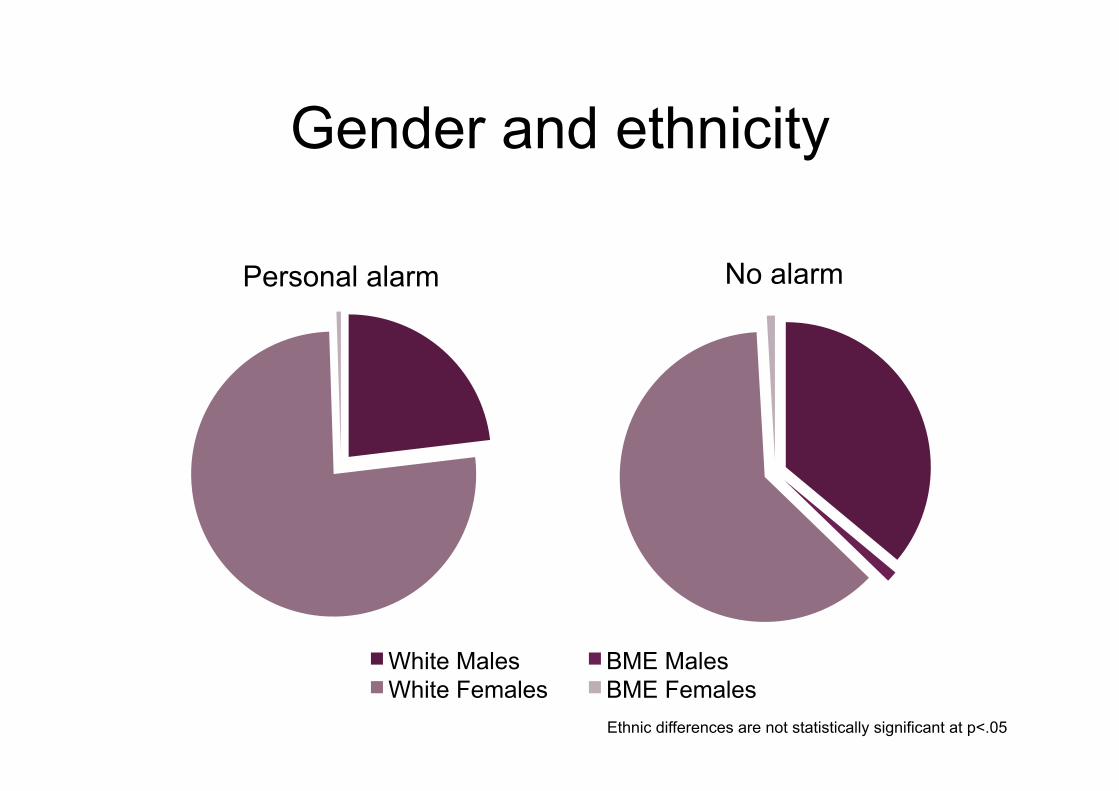
Gender and ethnicity
Personal alarm No alarm
White Males BME Males White Females BME Females
Ethnic differences are not statistically significant at p<.05

Subjective social class
0%
10%
20%
30%
Subjective social class
Personal alarm No alarm
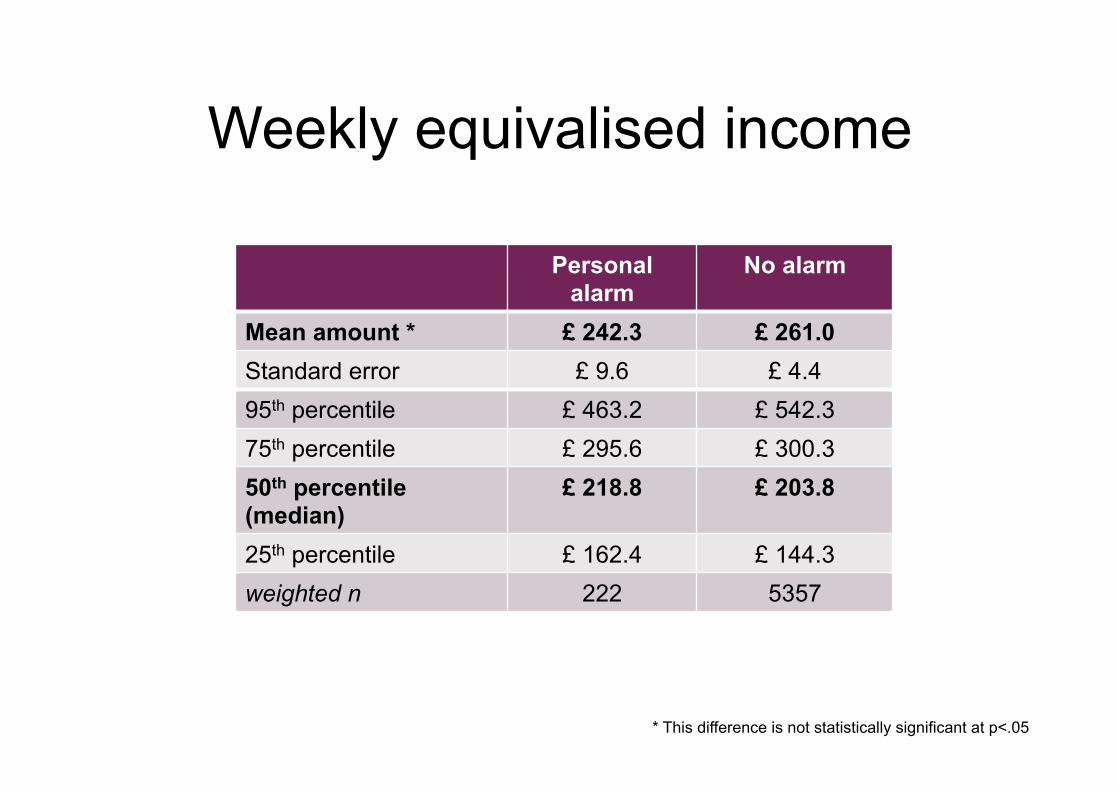
Weekly equivalised income
Personal alarm
No alarm
Mean amount * £ 242.3 £ 261.0 Standard error £ 9.6 £ 4.4 95th percentile £ 463.2 £ 542.3 75th percentile £ 295.6 £ 300.3 50th percentile (median)
£ 218.8 £ 203.8
25th percentile £ 162.4 £ 144.3 weighted n 222 5357
* This difference is not statistically significant at p<.05

Total (non-pension) wealth
Personal alarm
No alarm
Mean amount £ 139,438 £ 218,110 Standard error £ 16,772 £ 5,553 95th percentile £ 423,179 £ 677,410 75th percentile £ 205,277 £ 298,172 50th percentile (median)
£ 60,649 £ 161,120
25th percentile £ 4,000 £ 12,000 weighted n 222 5298

How often they have too little money to spend on their needs*
Personal alarm No alarm
Never Rarely Sometimes Often Most of the time
* This difference is not statistically significant at p<.05
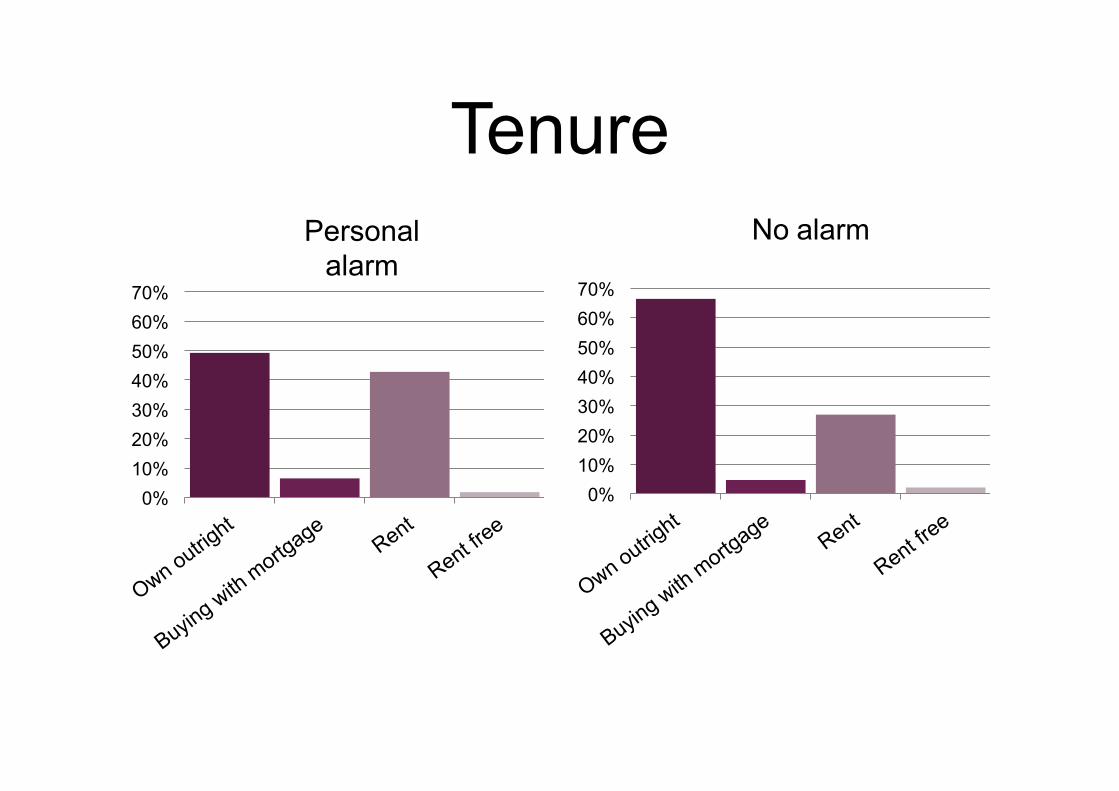
Tenure
0% 10% 20% 30% 40% 50% 60% 70%
0% 10% 20% 30% 40% 50% 60% 70%
No alarm Personal alarm
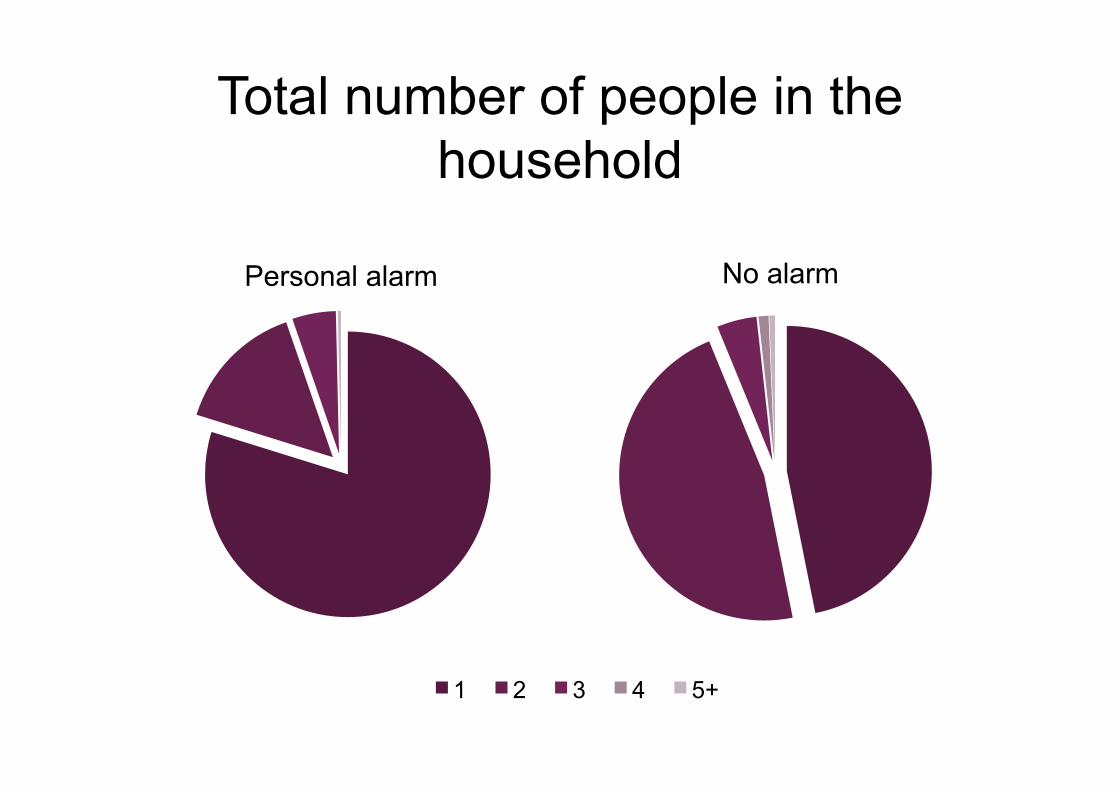
Total number of people in the household
Personal alarm No alarm
1 2 3 4 5+
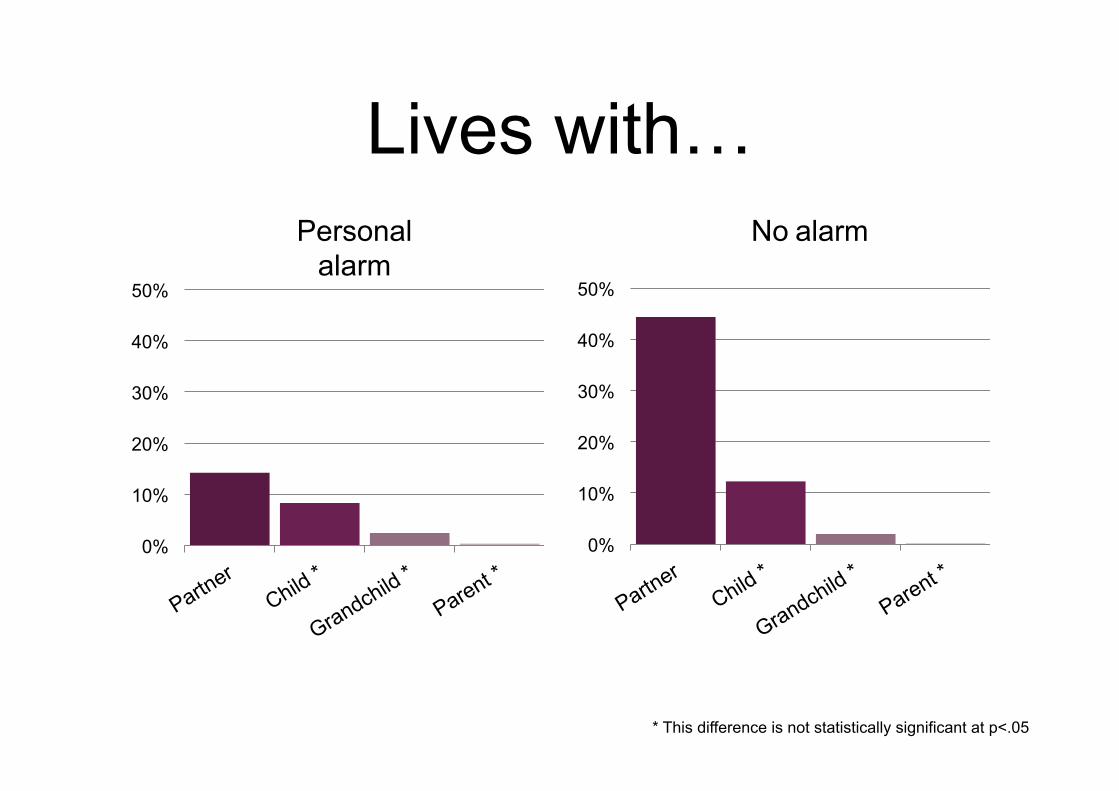
Lives with…
0%
10%
20%
30%
40%
50%
0%
10%
20%
30%
40%
50%
No alarm Personal alarm
* This difference is not statistically significant at p<.05
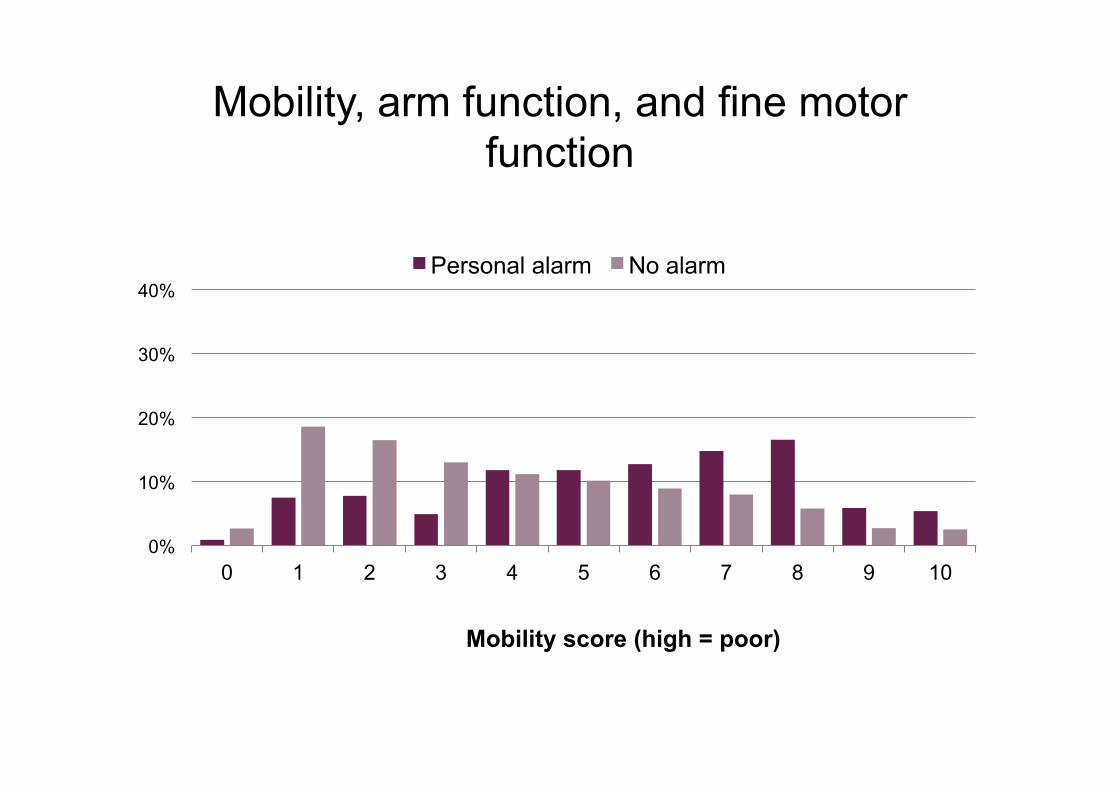
Mobility, arm function, and fine motor function
0%
10%
20%
30%
40%
0 1 2 3 4 5 6 7 8 9 10
Mobility score (high = poor)
Personal alarm No alarm

Mobility, arm function, and fine motor function
0% 10% 20% 30% 40% 50% 60% 70% 80% 90%
Picking up a 5p coin from a table
Lifting or carrying weights over 10 pounds
Pulling or pushing large objects
Reaching or extending arms above shoulder level
Stooping, kneeling or crouching
Climbing one flight of stairs without resting
Climbing several flights of stairs without resting
Getting up from a chair after sitting for long periods *
Sitting for about two hours
Walking 100 yards
Personal alarm No alarm
* This difference is not statistically significant at p<.05

Activities of Daily Living (ADLs)
0%
10%
20%
30%
40%
50%
60%
0 1 2 3 4 5 6
ADL score (high = poor)
Personal alarm No alarm
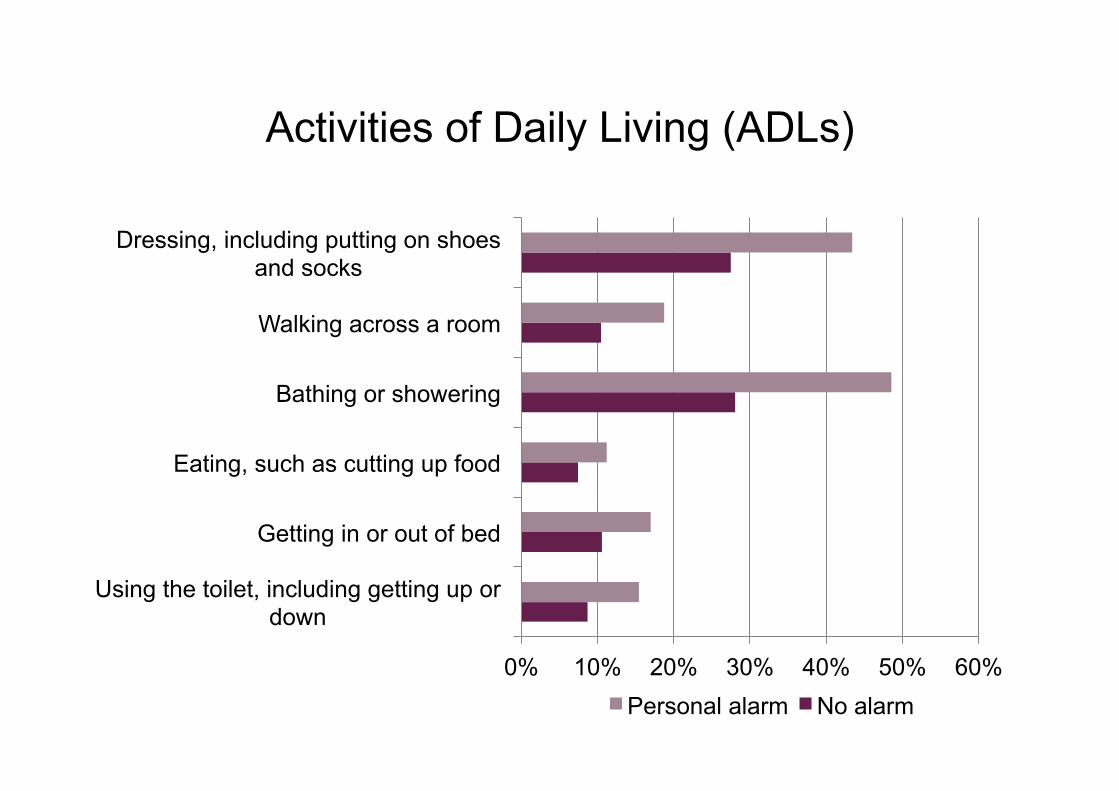
Activities of Daily Living (ADLs)
0% 10% 20% 30% 40% 50% 60%
Using the toilet, including getting up or down
Getting in or out of bed
Eating, such as cutting up food
Bathing or showering
Walking across a room
Dressing, including putting on shoes and socks
Personal alarm No alarm

Instrumental Activities of Daily Living (IADLs)
0%
10%
20%
30%
40%
50%
0 1 2 3 4 5 6 7 8 9
IADL score (high = poor)
Personal alarm No alarm

Instrumental Activities of Daily Living (ADLs)
0% 10% 20% 30% 40% 50% 60% 70%
Using a map to figure out how to get around
Recognising when you are in physical danger *
Preparing a hot meal
Shopping for groceries
Making telephone calls *
Communicating (speech, hearing or eyesight)
Taking medications
Doing work around the house or garden
Managing money
Personal alarm No alarm * This difference is not statistically significant at p<.05
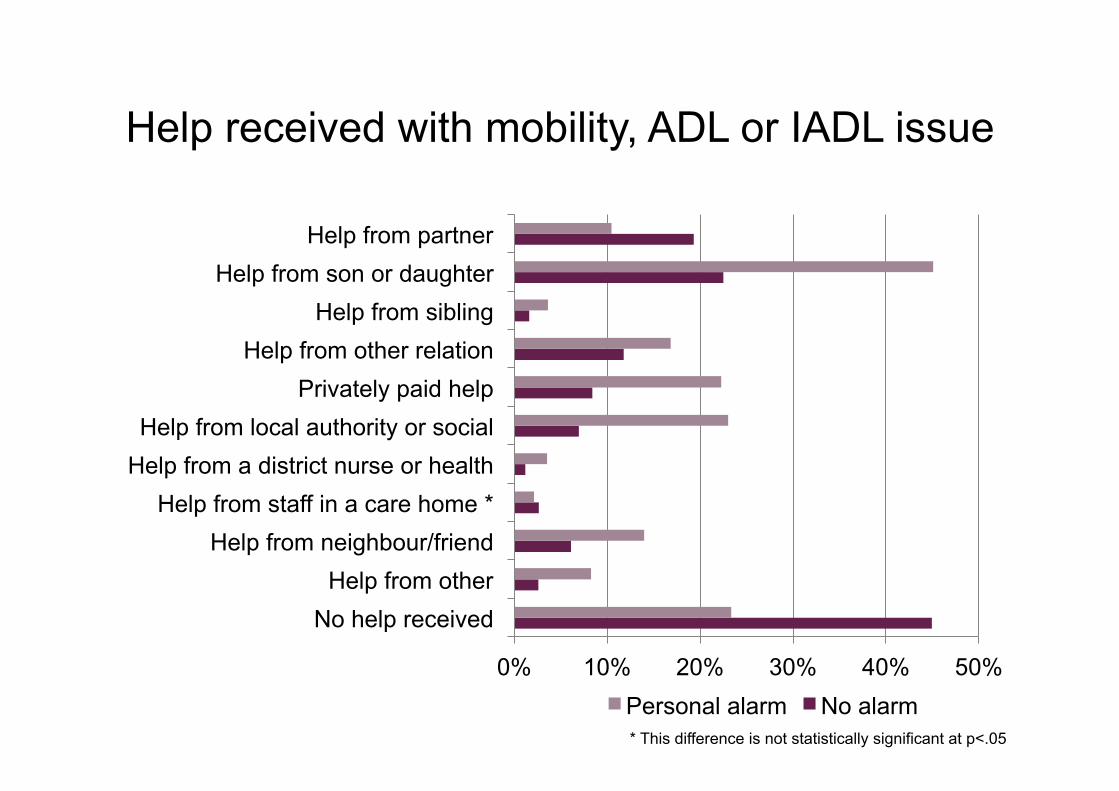
Help received with mobility, ADL or IADL issue
0% 10% 20% 30% 40% 50%
No help received Help from other
Help from neighbour/friend Help from staff in a care home *
Help from a district nurse or health Help from local authority or social
Privately paid help Help from other relation
Help from sibling Help from son or daughter
Help from partner
Personal alarm No alarm * This difference is not statistically significant at p<.05
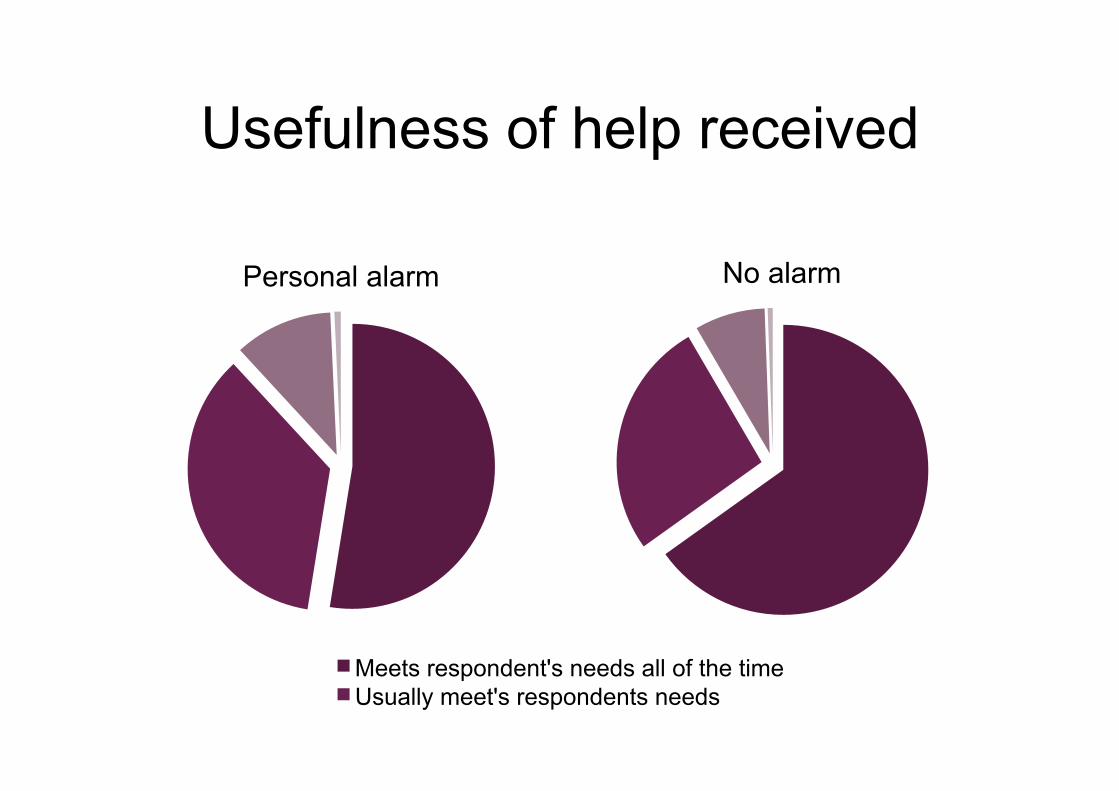
Usefulness of help received
Personal alarm No alarm
Meets respondent's needs all of the time Usually meet's respondents needs
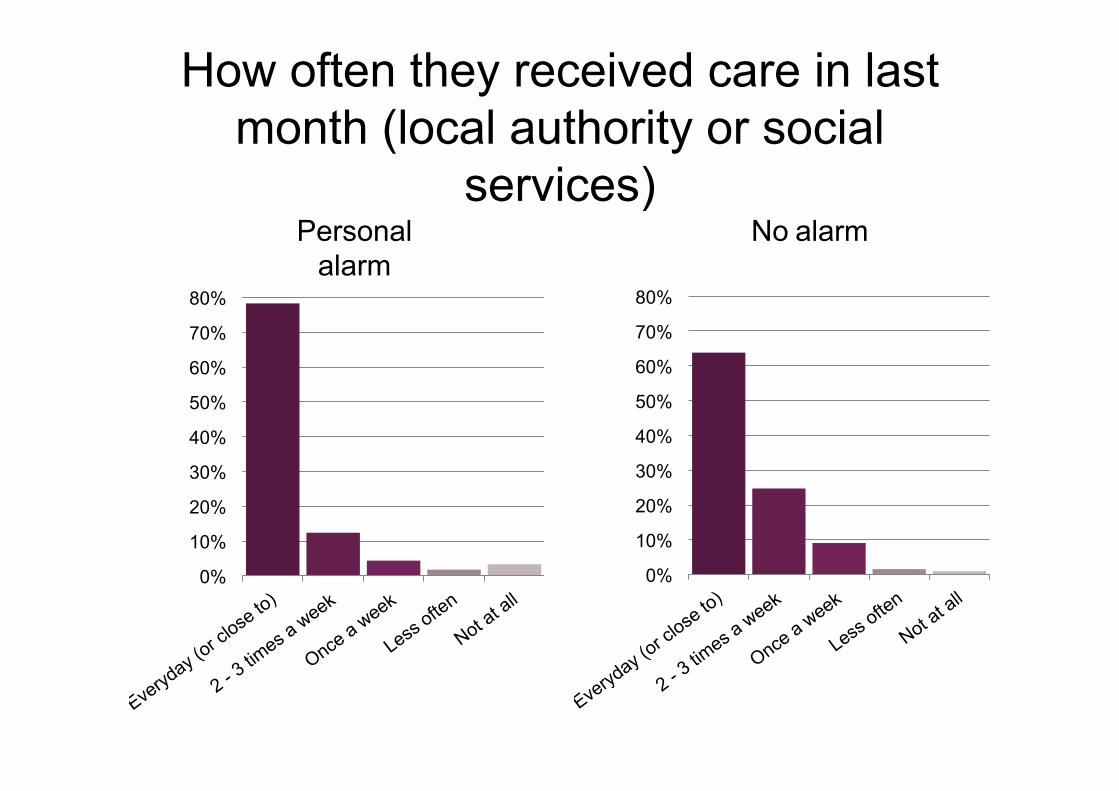
How often they received care in last month (local authority or social
services)
0%
10%
20%
30%
40%
50%
60%
70%
80%
0%
10%
20%
30%
40%
50%
60%
70%
80%
No alarm Personal alarm
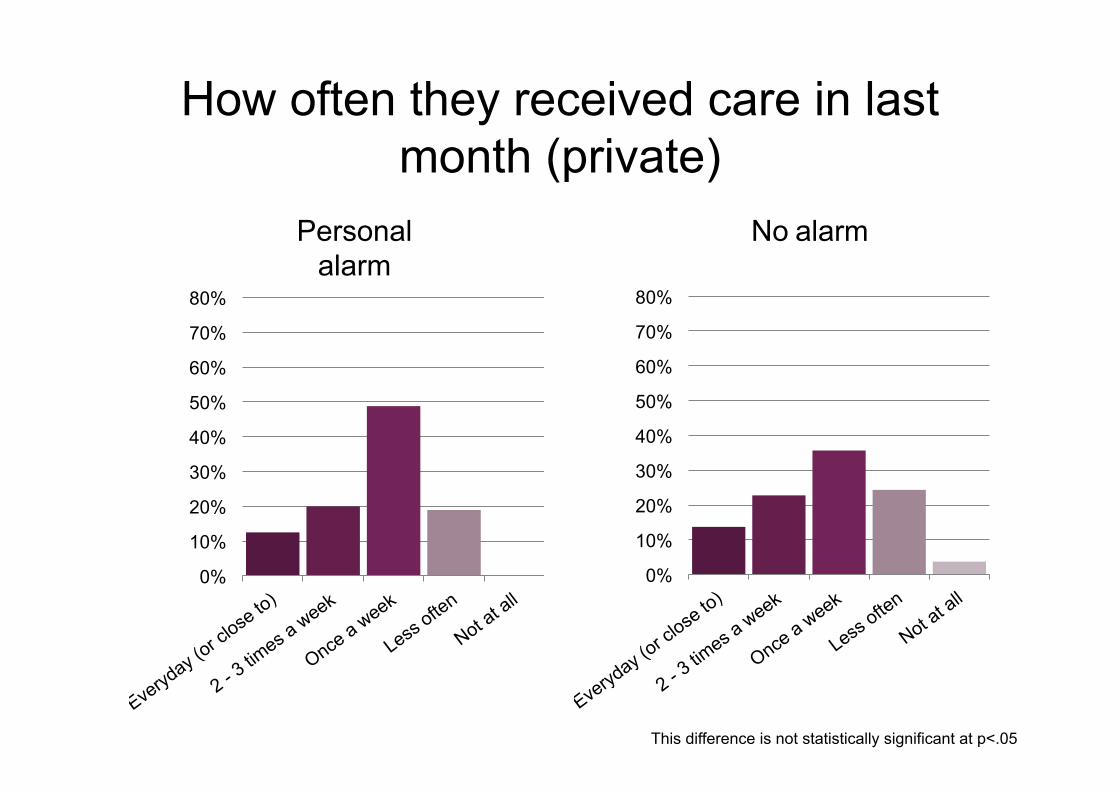
How often they received care in last month (private)
0%
10%
20%
30%
40%
50%
60%
70%
80%
0%
10%
20%
30%
40%
50%
60%
70%
80%
No alarm Personal alarm
This difference is not statistically significant at p<.05

Disability benefits currently received
0% 5% 10% 15% 20% 25% 30% 35% 40% 45%
Carers Allowance *
Disability Living Allowance
Attendance Allowance
Personal alarm user
0% 5% 10% 15% 20% 25% 30% 35% 40% 45%
Attendance Allowance
Disability Living Allowance
Carers Allowance
Partner†
Personal alarm † The sample of personal alarm users living with a partner is extremely small (n = 21) * This difference is not statistically significant at p<.05

Use of other aids
0% 10% 20% 30% 40% 50% 60% 70% 80%
None
Elbow crutches
Special eating utensils*
Buggy or scooter
Electric wheelchair
Manual wheelchair
Zimmer frame or walker
Cane or walking stick
Personal alarm No alarm * This difference is not statistically significant at p<.05

Use of services**
0% 10% 20% 30%
Has ever used meals on wheels
Has ever used a day centre*
Has ever used a lunch club
Personal alarm No alarm
** Only asked of those aged 65 or older * This difference is not statistically significant at p<.05

Other adaptations to the property
0% 10% 20% 30% 40% 50% 60% 70%
None of these Other special features
Alerting devices Chair lift or stair glide
Lift Kitchen modifications
Bathroom modifications Accessible parking or drop off site
Automatic or easy open doors* Hand rails
Ramps or street level entrances Widened doorways or hallways
Personal alarm No alarm * This difference is not statistically significant at p<.05
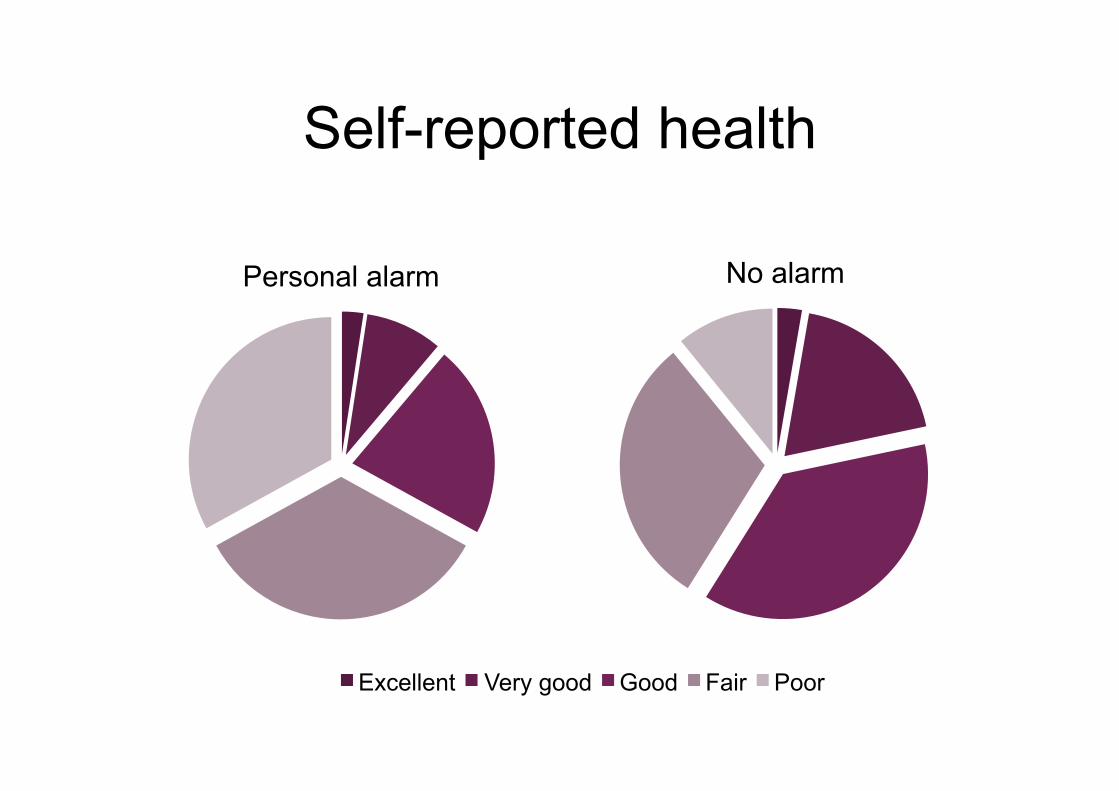
Self-reported health
Personal alarm No alarm
Excellent Very good Good Fair Poor

Diagnosed Cardio Vascular Disease
0% 10% 20% 30% 40% 50% 60%
Other heart disease*
High cholesterol*
Stroke*
Diabetes or high blood sugar*
Abnormal heart rhythm*
Heart murmurs
Congestive heart failure
Heart attack*
Angina
High Blood pressure*
Personal alarm No alarm * This difference is not statistically significant at p<.05

Diagnosed Chronic illness
0% 10% 20% 30% 40% 50% 60% 70%
Psychiatric*
Dementia*
Alzheimer’s*
Parkinson’s disease*
Cancer
Osteoporosis
Arthritis
Asthma*
Lung disease
Personal alarm No alarm * This difference is not statistically significant at p<.05

Self-reported eyesight (whilst wearing lenses, if appropriate)
Personal alarm No alarm
Excellent Very good Good Fair Poor*
* Includes spontaneous responses denoting that the person is registered or legally blind

Diagnosed eye conditions
0% 10% 20% 30% 40%
Cataracts*
Macular degeneration
Diabetic eye disease*
Glaucoma*
Personal alarm No alarm
* This difference is not statistically significant at p<.05

Self-reported hearing
Personal alarm No alarm
Excellent Very good Good Fair Poor

Difficulty walking ¼ mile unaided
Personal alarm No alarm
No difficulty Some difficulty Much difficulty Unable to do this
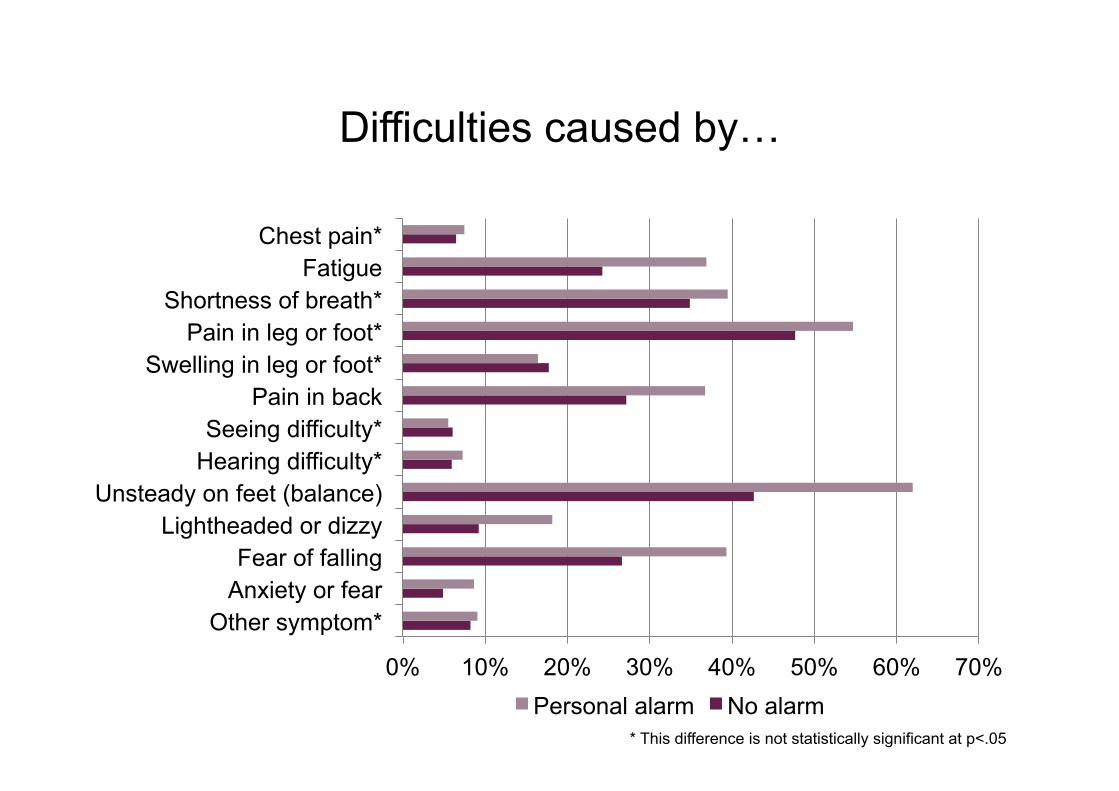
Difficulties caused by…
0% 10% 20% 30% 40% 50% 60% 70%
Other symptom* Anxiety or fear Fear of falling
Lightheaded or dizzy Unsteady on feet (balance)
Hearing difficulty* Seeing difficulty*
Pain in back Swelling in leg or foot*
Pain in leg or foot* Shortness of breath*
Fatigue Chest pain*
Personal alarm No alarm * This difference is not statistically significant at p<.05

Has problems with balance when walking on a level surface
Personal alarm No alarm
Never Sometimes Often Very often Always Cannot or does not walk
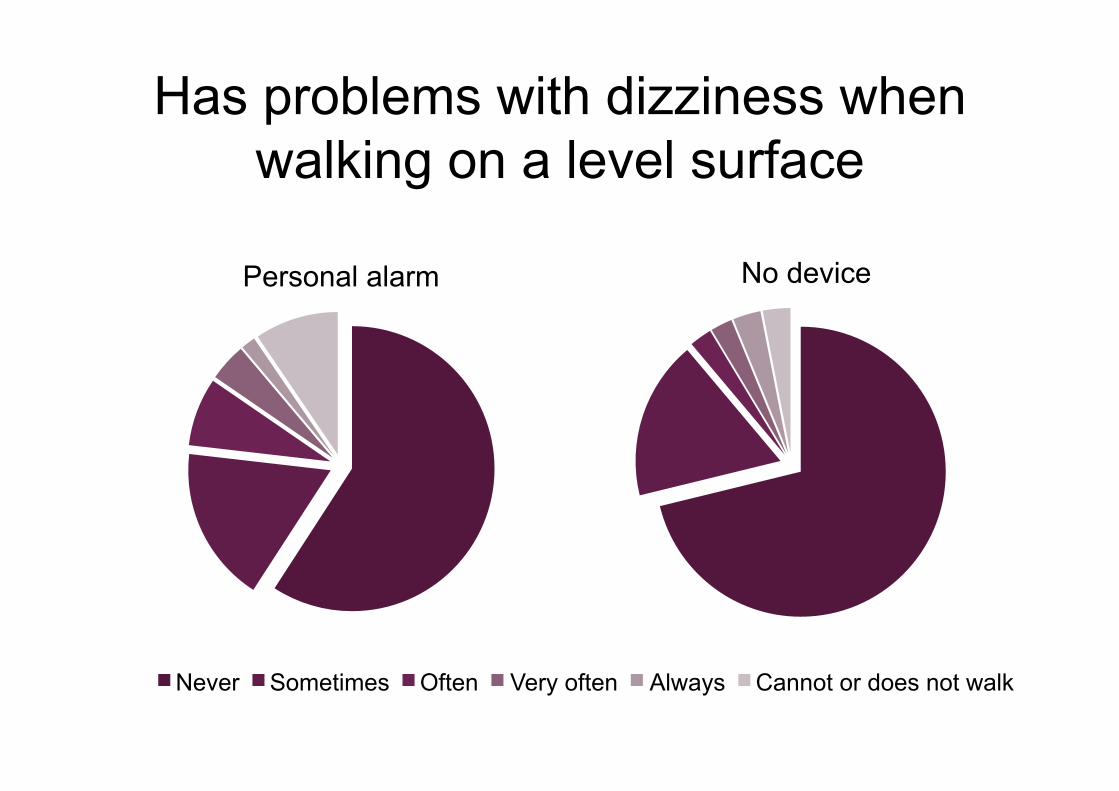
Has problems with dizziness when walking on a level surface
Personal alarm No device
Never Sometimes Often Very often Always Cannot or does not walk

How many falls in the last year (age 60+)
0%
10%
20%
30%
40%
50%
60%
70%
0 1 2 3 4 5 6 7 8 9 10 11+
Personal alarm No alarm

Caused an injury requiring medical treatment*
Personal alarm No alarm
Yes No
* This difference is not statistically significant at p<.05
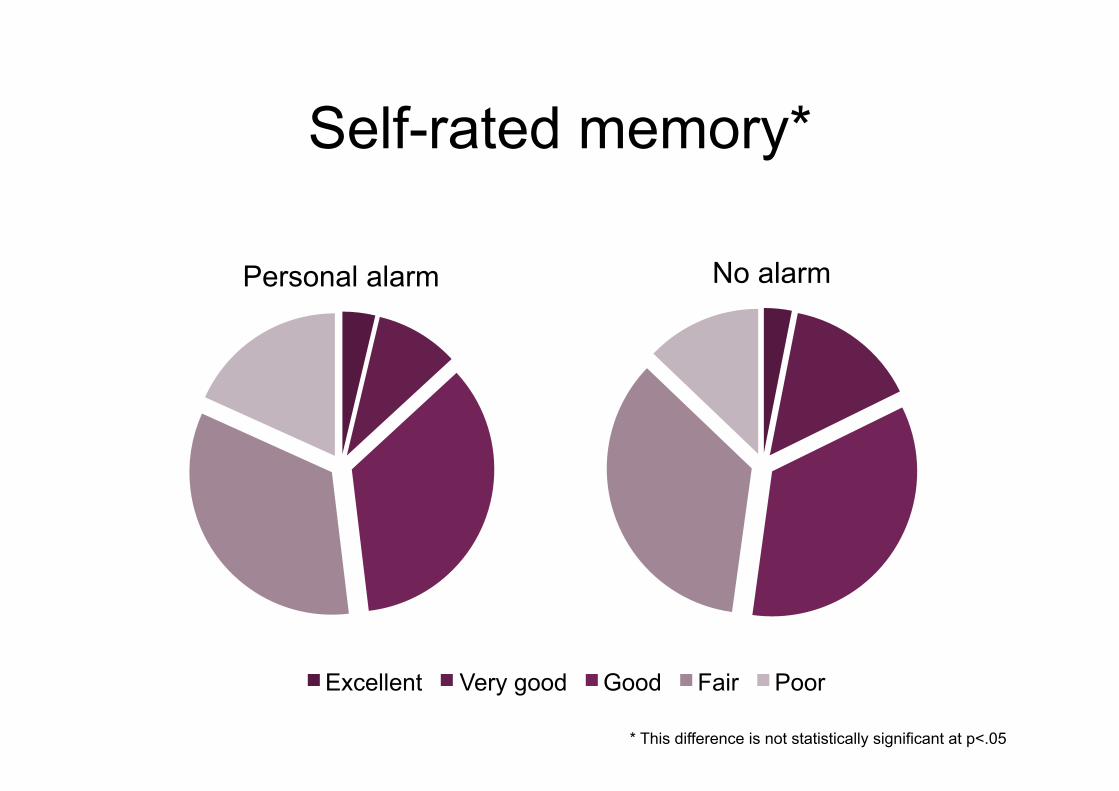
Self-rated memory*
Personal alarm No alarm
Excellent Very good Good Fair Poor
* This difference is not statistically significant at p<.05
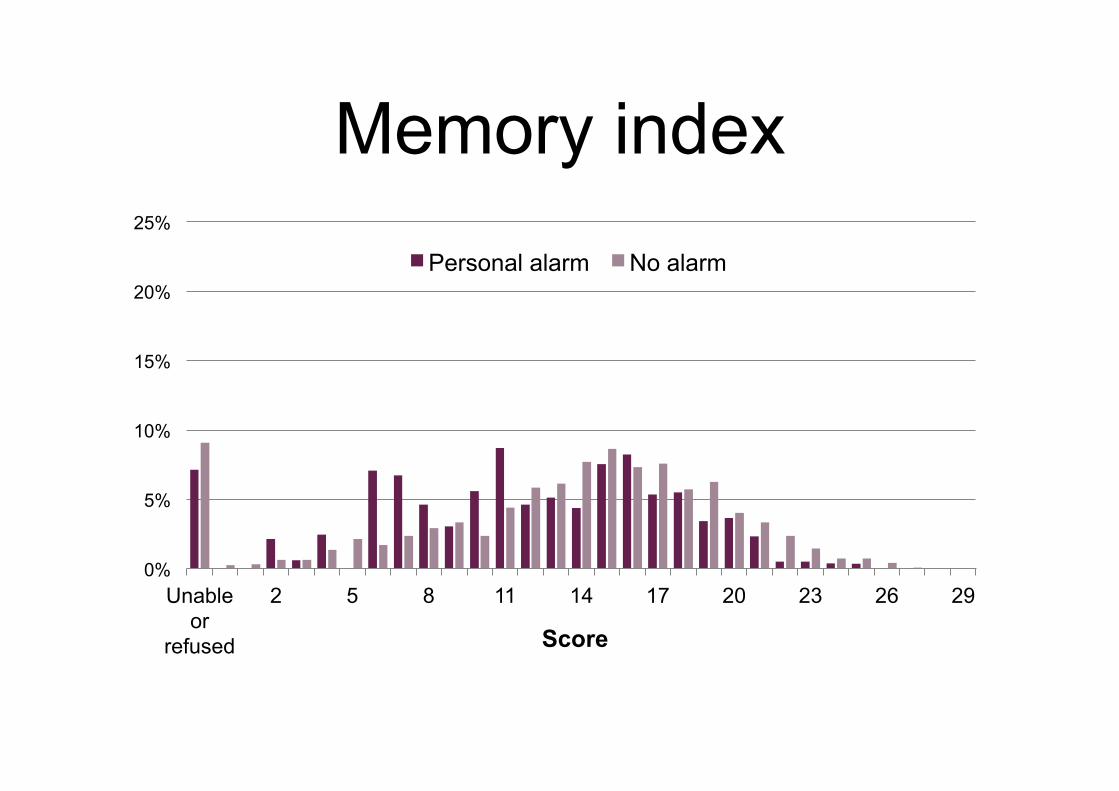
Memory index
0%
5%
10%
15%
20%
25%
Unable or
refused
2 5 8 11 14 17 20 23 26 29
Score
Personal alarm No alarm

Executive function
0%
5%
10%
15%
20%
25%
Unable or
refused
4 6 8 10 12 14 16 18 20 22
Score
Personal alarm No alarm
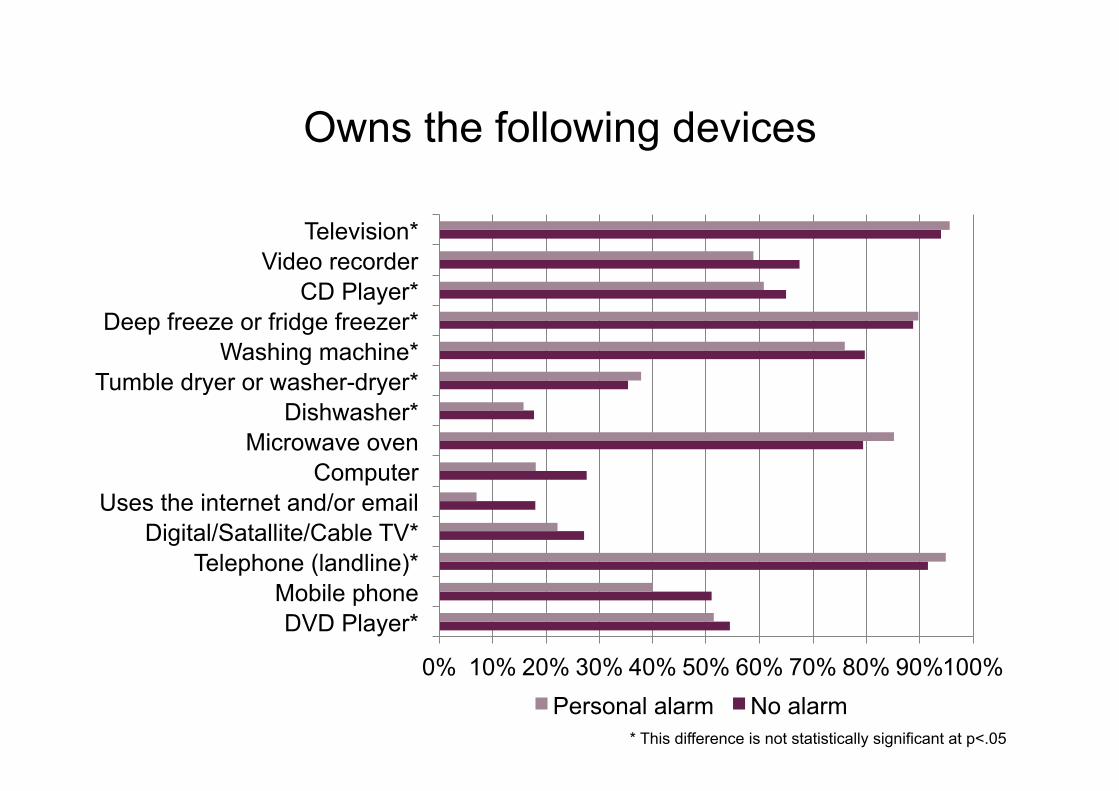
Owns the following devices
0% 10% 20% 30% 40% 50% 60% 70% 80% 90% 100%
DVD Player* Mobile phone
Telephone (landline)* Digital/Satallite/Cable TV*
Uses the internet and/or email Computer
Microwave oven Dishwasher*
Tumble dryer or washer-dryer* Washing machine*
Deep freeze or fridge freezer* CD Player*
Video recorder Television*
Personal alarm No alarm * This difference is not statistically significant at p<.05

Alerting device
Descriptive statistics comparing alerting device owners with non-owners

Age
0%
5%
10%
15%
20%
25%
50 52 54 56 58 60 62 64 66 68 70 72 74 76 78 80 82 84 86 88 90
Age
Alerting device No device

Age group
0%
10%
20%
30%
40%
50%
50-59 60-69 70-79 80-89 90+ Age
Alerting device No device

Gender and ethnicity
Alerting device No device
White Males BME Males White Females BME Females
Ethnic differences are not statistically significant at p<.05
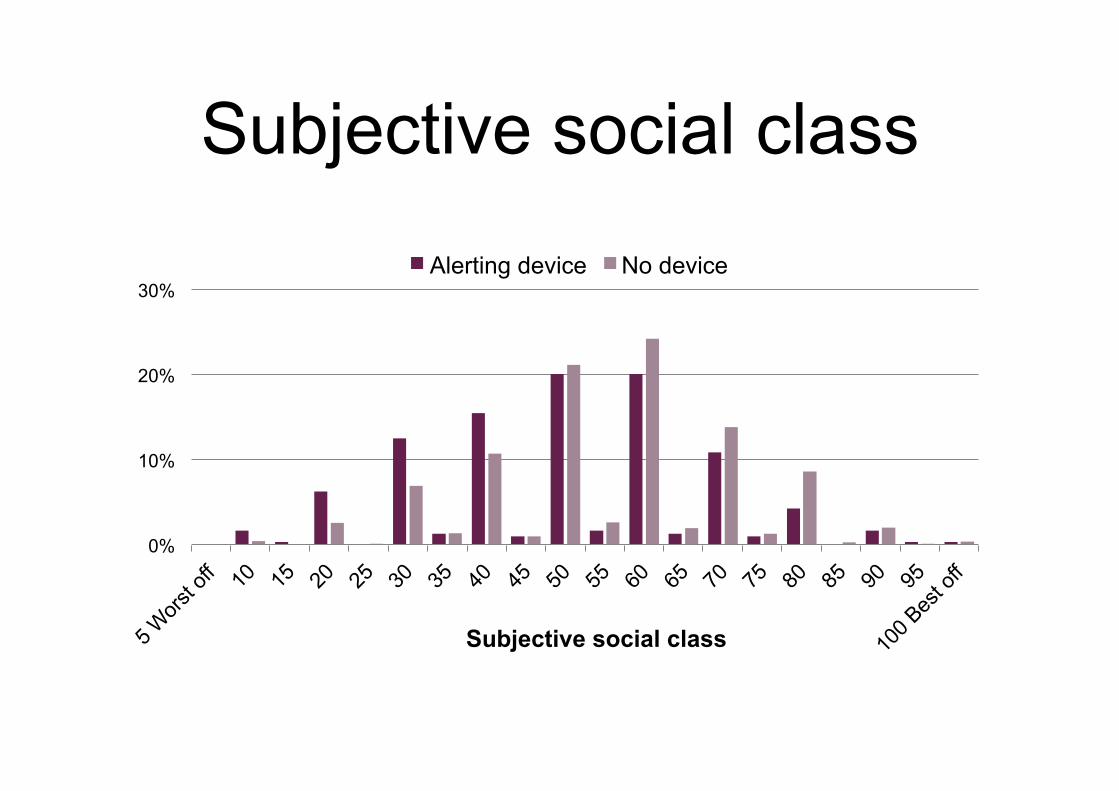
Subjective social class
0%
10%
20%
30%
Subjective social class
Alerting device No device
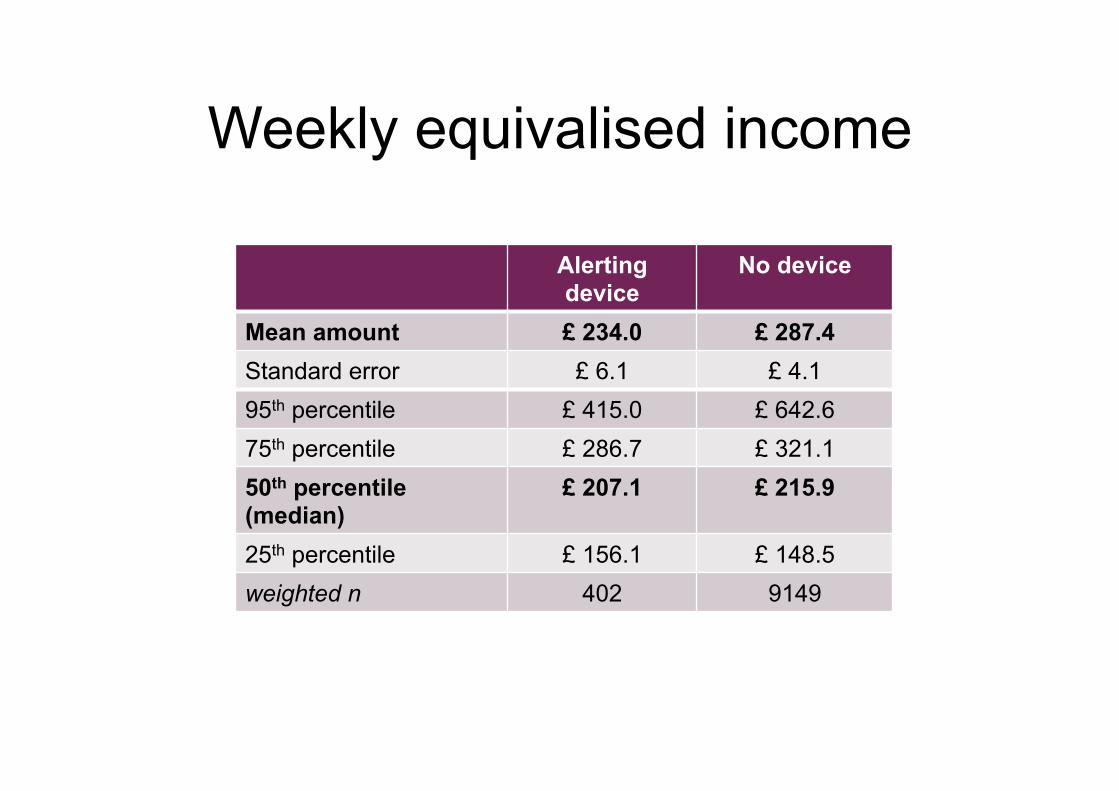
Weekly equivalised income
Alerting device
No device
Mean amount £ 234.0 £ 287.4 Standard error £ 6.1 £ 4.1 95th percentile £ 415.0 £ 642.6 75th percentile £ 286.7 £ 321.1 50th percentile (median)
£ 207.1 £ 215.9
25th percentile £ 156.1 £ 148.5 weighted n 402 9149

Total (non-pension) wealth
Alerting device
No device
Mean amount £ 106,378 £ 269,289 Standard error £ 9,370 £ 5,211 95th percentile £ 460,291 £ 747,180 75th percentile £ 155,146 £ 327,381 50th percentile (median)
£ 10,283 £ 192,816
25th percentile £ 1,500 £ 77,000 weighted n 402 9149
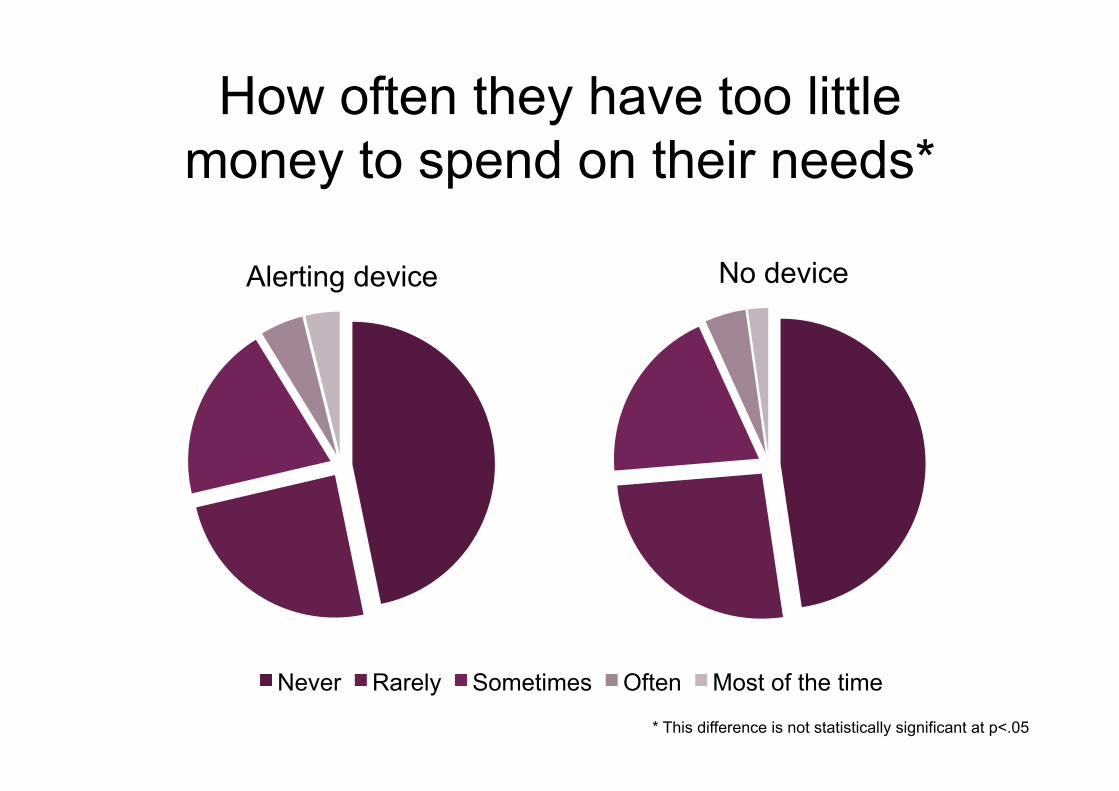
How often they have too little money to spend on their needs*
Alerting device No device
Never Rarely Sometimes Often Most of the time
* This difference is not statistically significant at p<.05

Tenure
0% 10% 20% 30% 40% 50% 60% 70% 80%
0% 10% 20% 30% 40% 50% 60% 70% 80%
No device Alerting device

Total number of people in the household
Alerting device No device
1 2 3 4 5+
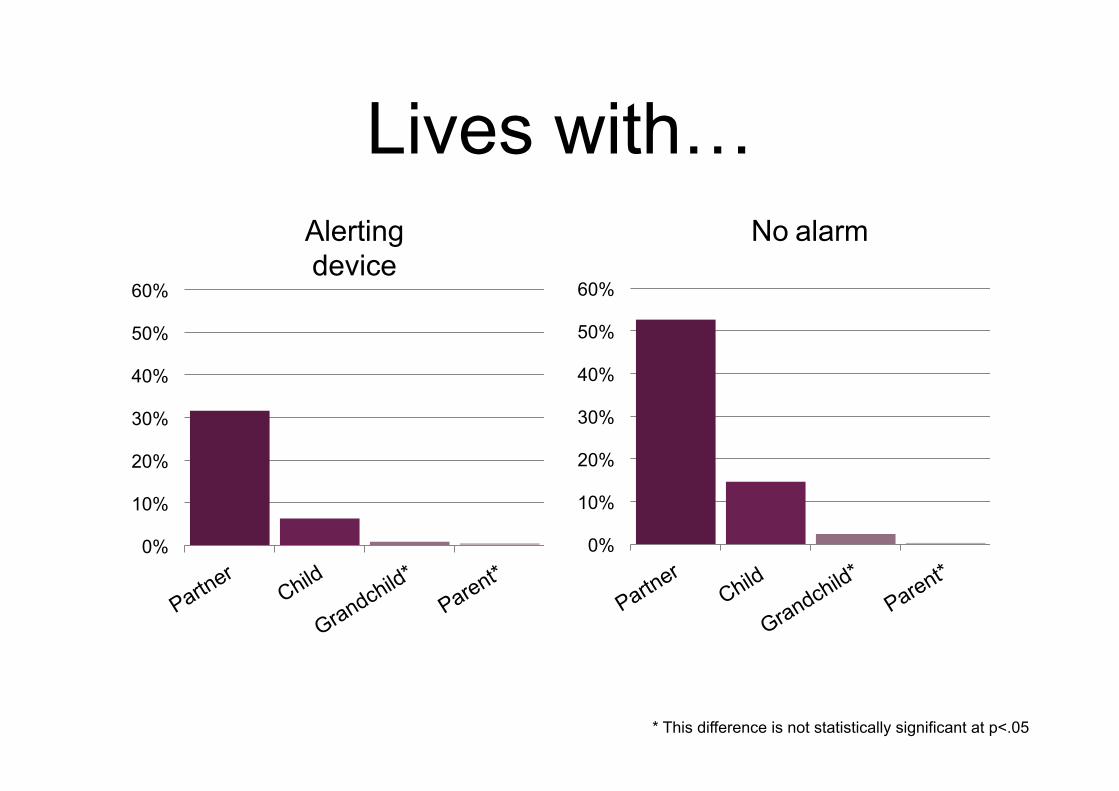
Lives with…
0%
10%
20%
30%
40%
50%
60%
0%
10%
20%
30%
40%
50%
60%
No alarm Alerting device
* This difference is not statistically significant at p<.05
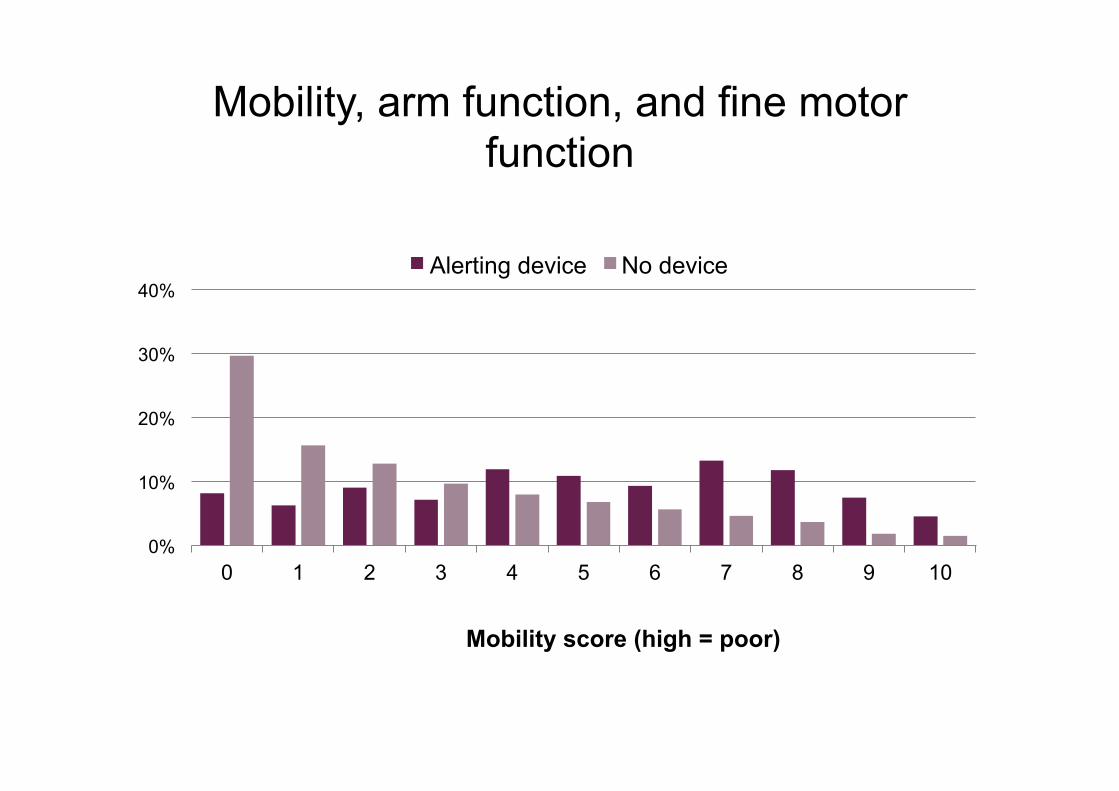
Mobility, arm function, and fine motor function
0%
10%
20%
30%
40%
0 1 2 3 4 5 6 7 8 9 10
Mobility score (high = poor)
Alerting device No device

Mobility, arm function, and fine motor function
0% 10% 20% 30% 40% 50% 60% 70% 80% 90%
Picking up a 5p coin from a table
Lifting or carrying weights over 10 pounds
Pulling or pushing large objects
Reaching or extending arms above shoulder level
Stooping, kneeling or crouching
Climbing one flight of stairs without resting
Climbing several flights of stairs without resting
Getting up from a chair after sitting for long periods
Sitting for about two hours
Walking 100 yards
Alerting device No device

Activities of Daily Living (ADLs)
0%
10%
20%
30%
40%
50%
60%
70%
80%
0 1 2 3 4 5 6
ADL score (high = poor)
Alerting device No device

Activities of Daily Living (ADLs)
0% 5% 10% 15% 20% 25% 30% 35% 40% 45%
Using the toilet, including getting up or down
Getting in or out of bed
Eating, such as cutting up food
Bathing or showering
Walking across a room
Dressing, including putting on shoes and socks
Alerting device No device
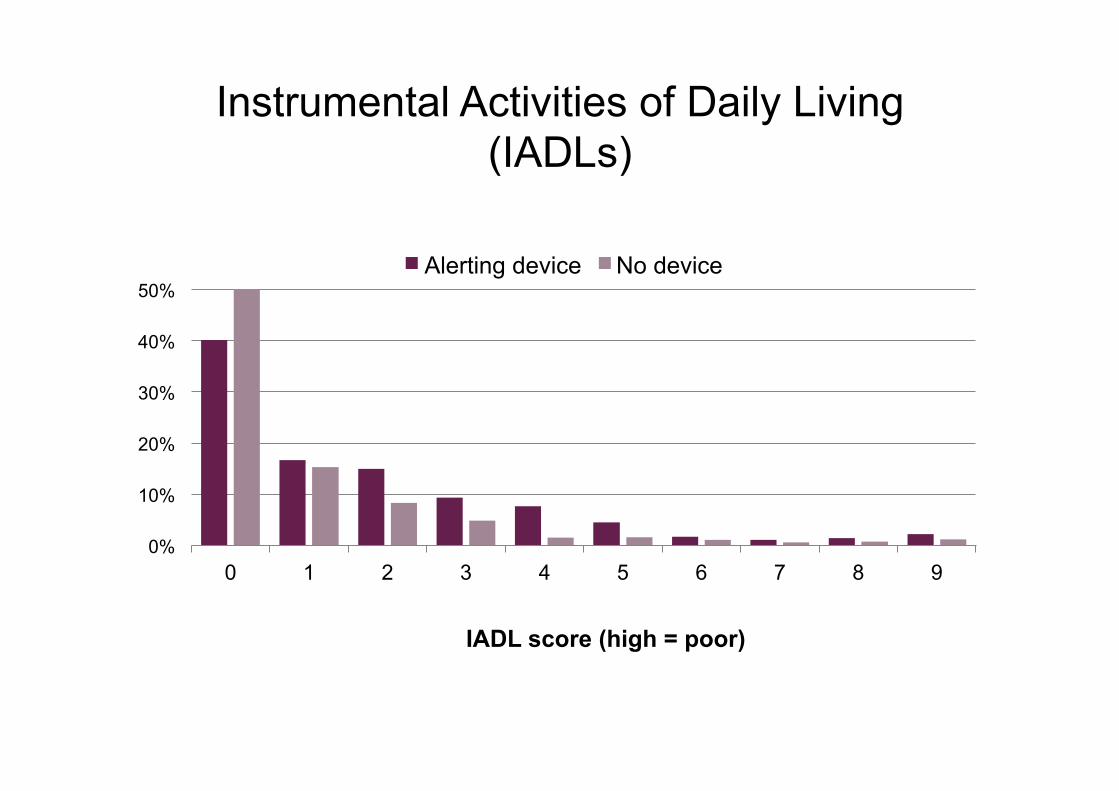
Instrumental Activities of Daily Living (IADLs)
0%
10%
20%
30%
40%
50%
0 1 2 3 4 5 6 7 8 9
IADL score (high = poor)
Alerting device No device

Instrumental Activities of Daily Living (ADLs)
0% 5% 10% 15% 20% 25% 30% 35% 40% 45% 50%
Using a map to figure out how to get
Recognising when you are in physical
Preparing a hot meal
Shopping for groceries
Making telephone calls
Communicating (speech, hearing or
Taking medications
Doing work around the house or garden
Managing money
Alerting device No device

Help received with mobility, ADL or IADL issue
0% 10% 20% 30% 40% 50% 60%
No help received Help from other
Help from neighbour/friend Help from staff in a care home
Help from a district nurse or health Help from local authority or social
Privately paid help Help from other relation
Help from sibling Help from son or daughter*
Help from partner*
Alerting device No device * This difference is not statistically significant at p<.05

Usefulness of help received
Alerting device No device
Meets respondent's needs all of the time Usually meet's respondents needs
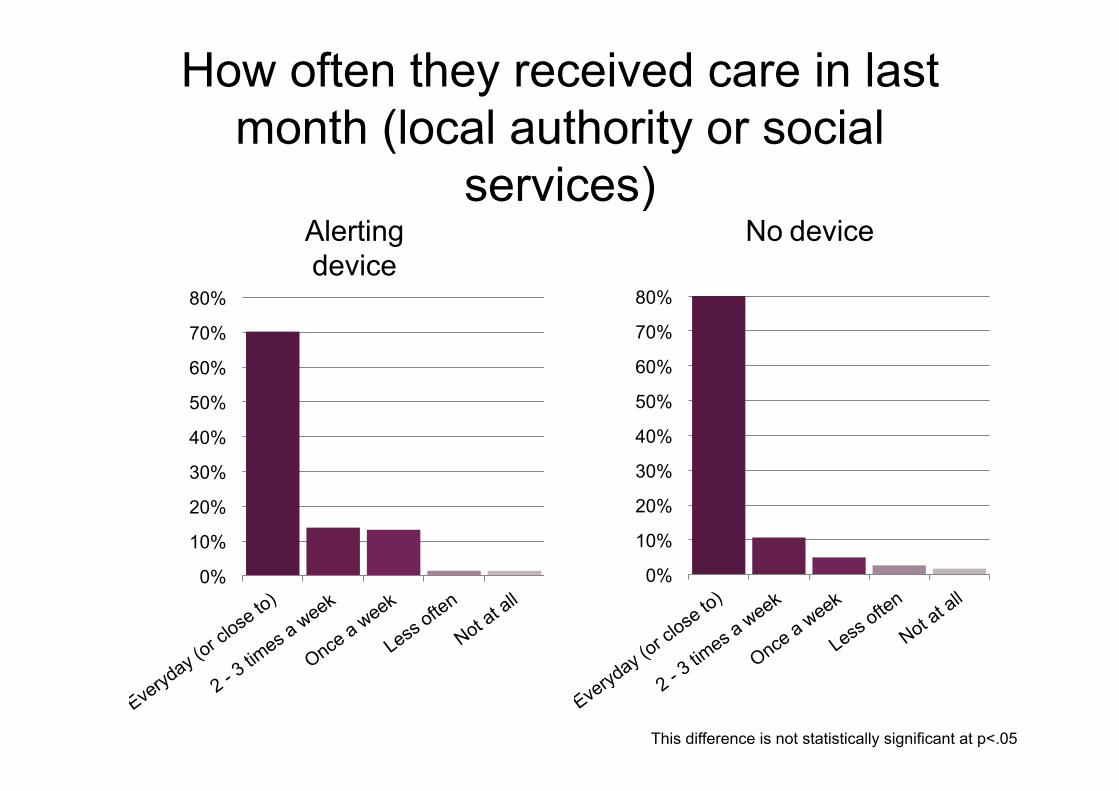
How often they received care in last month (local authority or social
services)
0%
10%
20%
30%
40%
50%
60%
70%
80%
0%
10%
20%
30%
40%
50%
60%
70%
80%
No device Alerting device
This difference is not statistically significant at p<.05

How often they received care in last month (private)
0%
10%
20%
30%
40%
50%
60%
70%
80%
0%
10%
20%
30%
40%
50%
60%
70%
80%
No device Alerting device
This difference is not statistically significant at p<.05
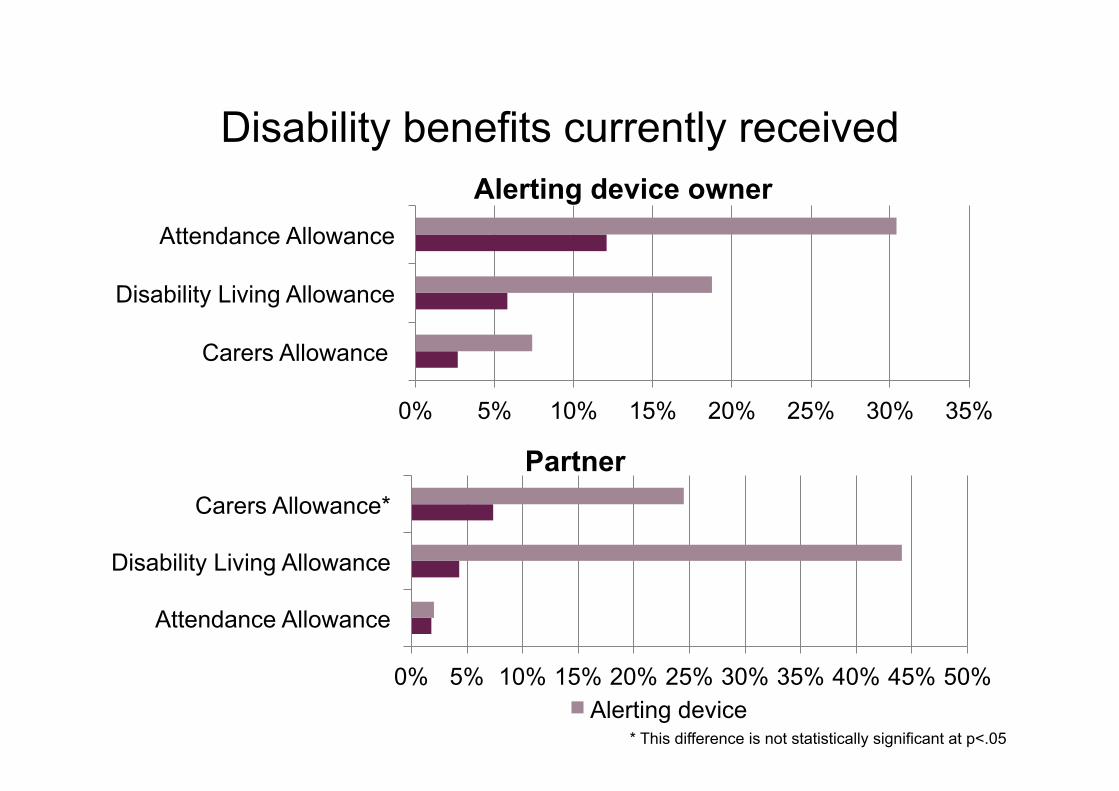
Disability benefits currently received
0% 5% 10% 15% 20% 25% 30% 35%
Carers Allowance
Disability Living Allowance
Attendance Allowance
Alerting device owner
0% 5% 10% 15% 20% 25% 30% 35% 40% 45% 50%
Attendance Allowance
Disability Living Allowance
Carers Allowance*
Partner
Alerting device * This difference is not statistically significant at p<.05

Use of other aids
0% 10% 20% 30% 40% 50% 60% 70%
None
Elbow crutches
Personal alarm
Special eating utensils*
Buggy or scooter
Electric wheelchair
Manual wheelchair
Zimmer frame or walker
Cane or walking stick
Alerting device No device

Use of services**
0% 10% 20% 30%
Has ever used meals on wheels
Has ever used a day centre
Has ever used a lunch club
Alerting device No device
** Only asked of those aged 65 or older

Other adaptations to the property
0% 10% 20% 30% 40% 50% 60% 70%
None of these Other special features Chair lift or stair glide
Lift Kitchen modifications
Bathroom modifications Accessible parking or drop off site
Automatic or easy open doors Hand rails
Ramps or street level entrances Widened doorways or hallways
Alerting device No device
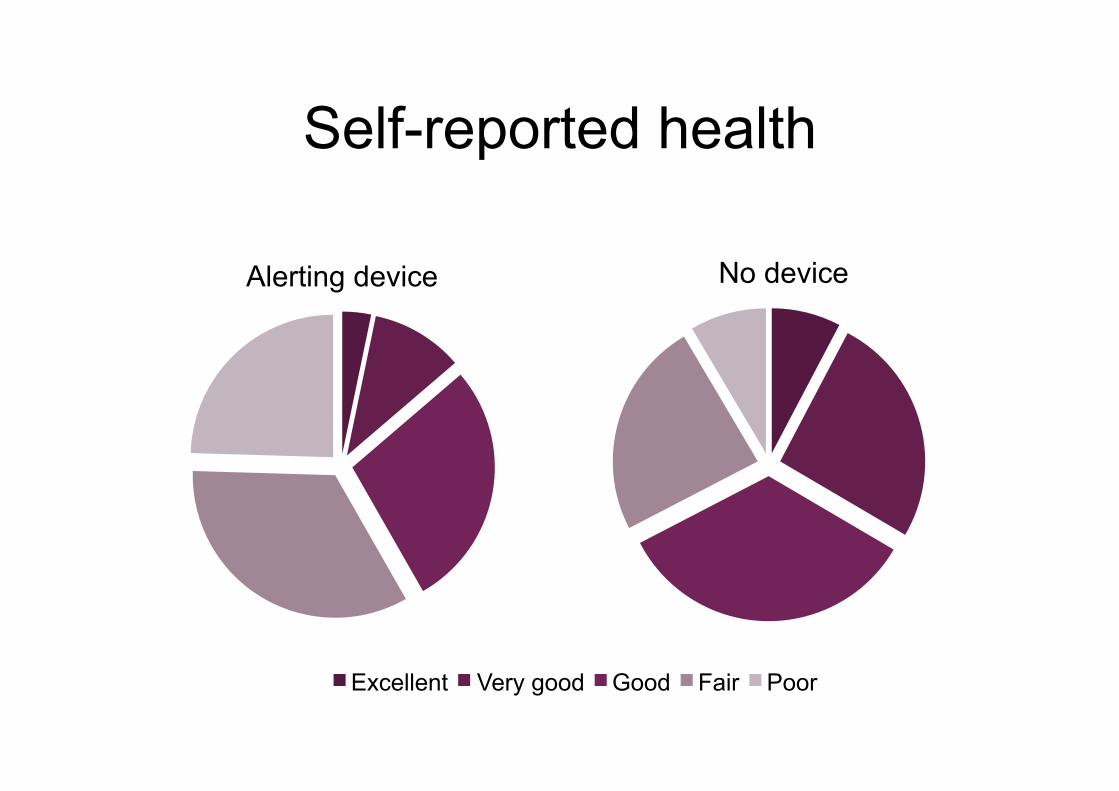
Self-reported health
Alerting device No device
Excellent Very good Good Fair Poor

Diagnosed Cardio Vascular Disease
0% 10% 20% 30% 40% 50%
Other heart disease
High cholesterol*
Stroke
Diabetes or high blood sugar
Abnormal heart rhythm
Heart murmurs
Congestive heart failure*
Heart attack
Angina
High Blood pressure*
Alerting device No device * This difference is not statistically significant at p<.05

Diagnosed Chronic illness
0% 10% 20% 30% 40% 50% 60% 70%
Psychiatric
Dementia*
Alzheimer’s
Parkinson’s disease*
Cancer
Osteoporosis
Arthritis
Asthma
Lung disease
Alerting device No device * This difference is not statistically significant at p<.05
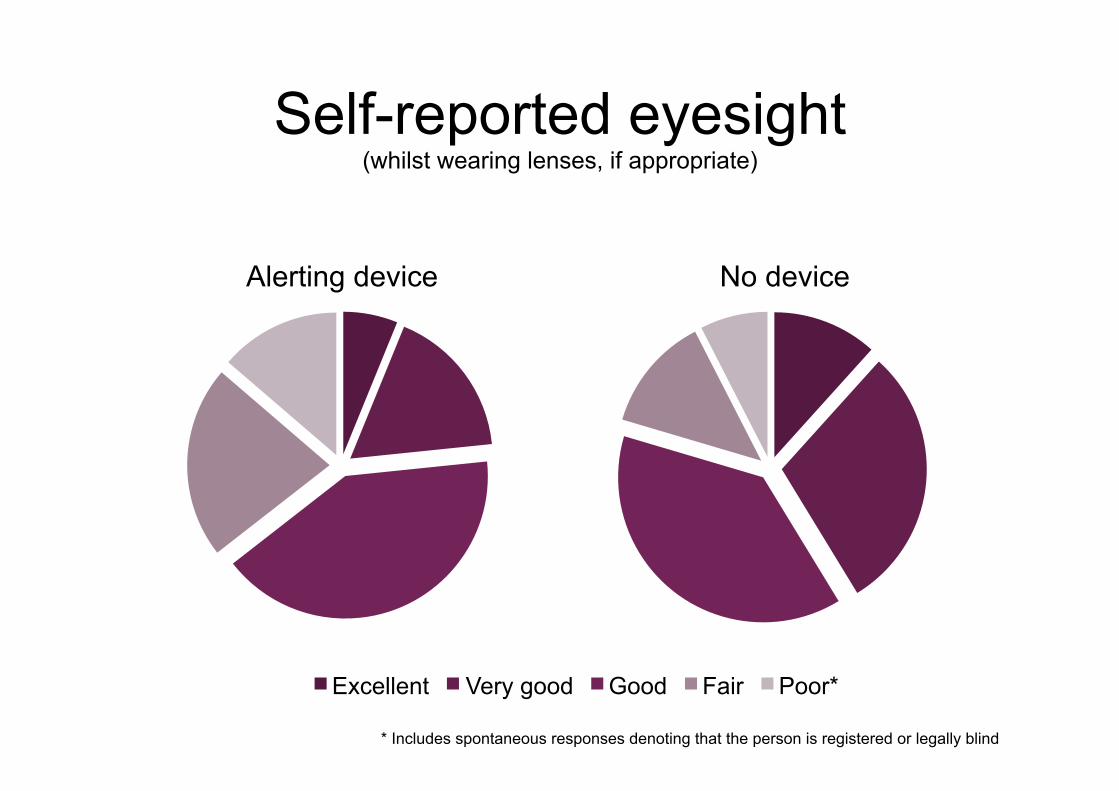
Self-reported eyesight (whilst wearing lenses, if appropriate)
Alerting device No device
Excellent Very good Good Fair Poor*
* Includes spontaneous responses denoting that the person is registered or legally blind

Diagnosed eye conditions
0% 10% 20% 30% 40%
Cataracts
Macular degeneration*
Diabetic eye disease
Glaucoma
Alerting device No device
* This difference is not statistically significant at p<.05

Self-reported hearing
Alerting device No device
Excellent Very good Good Fair Poor

Difficulty walking ¼ mile unaided
Alerting device No device
No difficulty Some difficulty Much difficulty Unable to do this

Difficulties caused by…
0% 10% 20% 30% 40% 50% 60%
Other symptom* Anxiety or fear*
Fear of falling Lightheaded or dizzy
Unsteady on feet (balance) Hearing difficulty*
Seeing difficulty Pain in back*
Swelling in leg or foot Pain in leg or foot
Shortness of breath Fatigue
Chest pain*
Alerting device No device * This difference is not statistically significant at p<.05
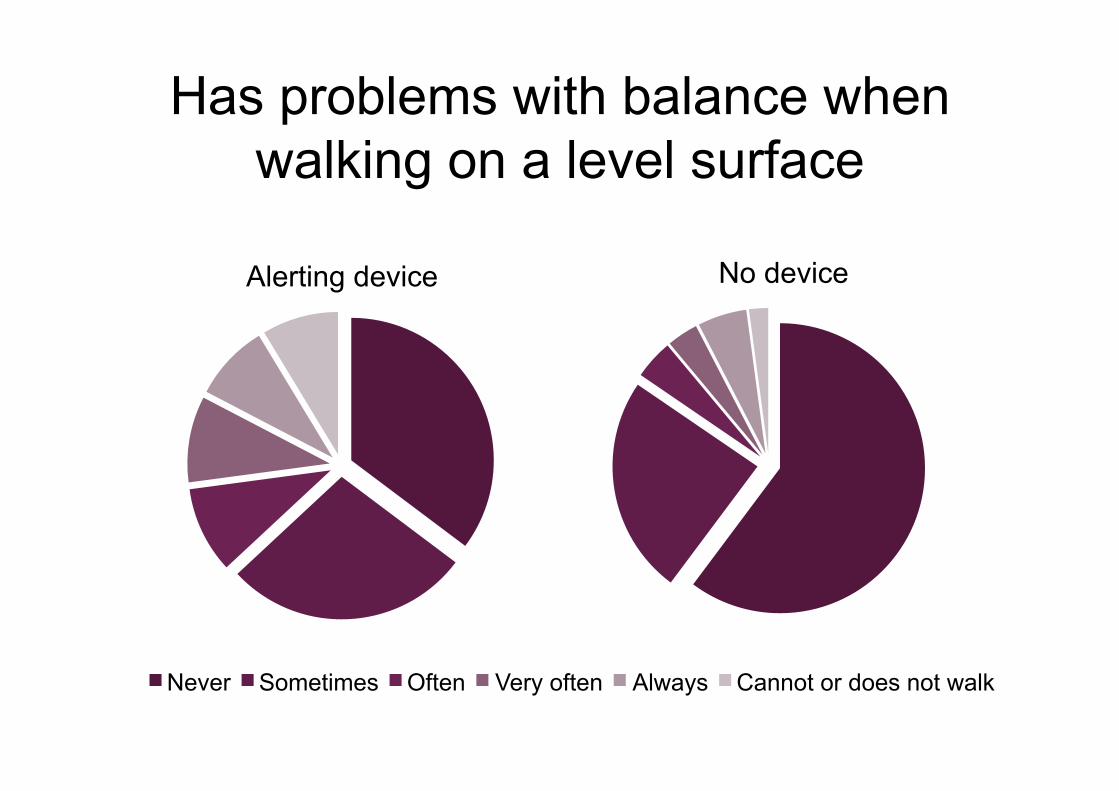
Has problems with balance when walking on a level surface
Alerting device No device
Never Sometimes Often Very often Always Cannot or does not walk

Has problems with dizziness when walking on a level surface
Alerting device No device
Never Sometimes Often Very often Always Cannot or does not walk

How many falls in the last year (age 60+)
0%
10%
20%
30%
40%
50%
60%
70%
0 1 2 3 4 5 6 7 8 9 10 11+
Alerting device No device

Caused an injury requiring medical treatment*
Alerting device No device
Yes No
* This difference is not statistically significant at p<.05
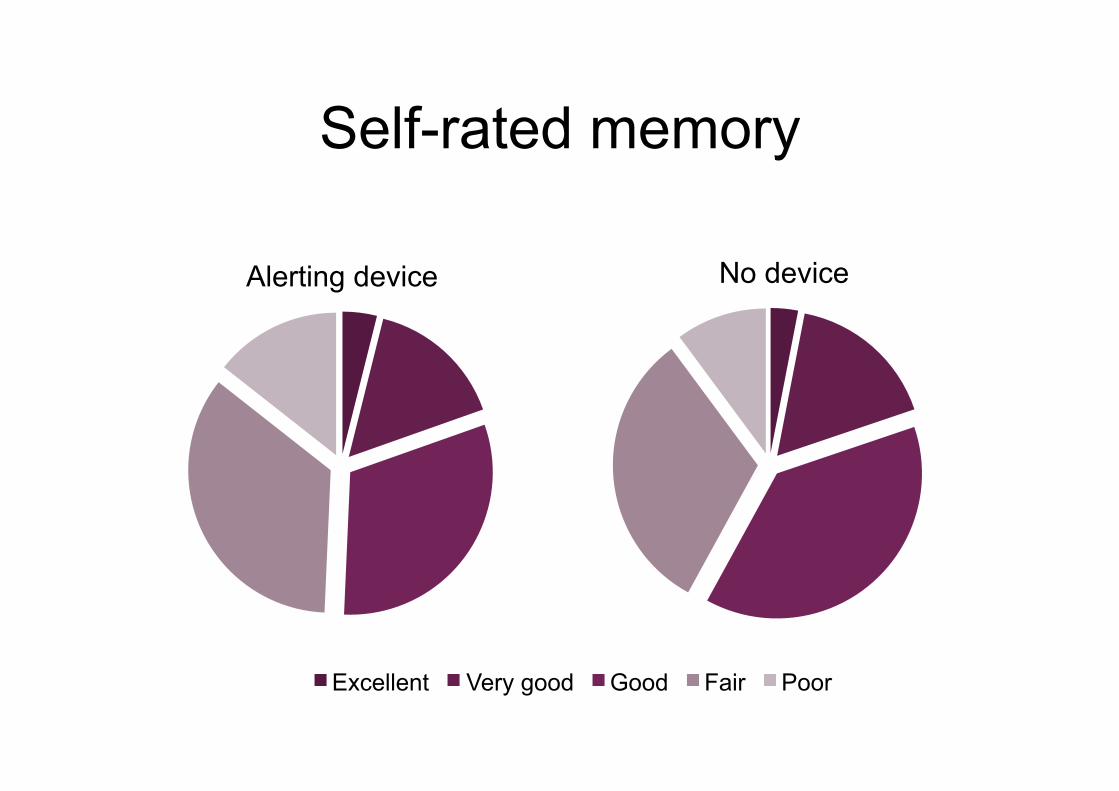
Self-rated memory
Alerting device No device
Excellent Very good Good Fair Poor

Memory index
0%
5%
10%
15%
20%
25%
Unable or
refused
2 5 8 11 14 17 20 23 26 29
Score
Alerting device No device
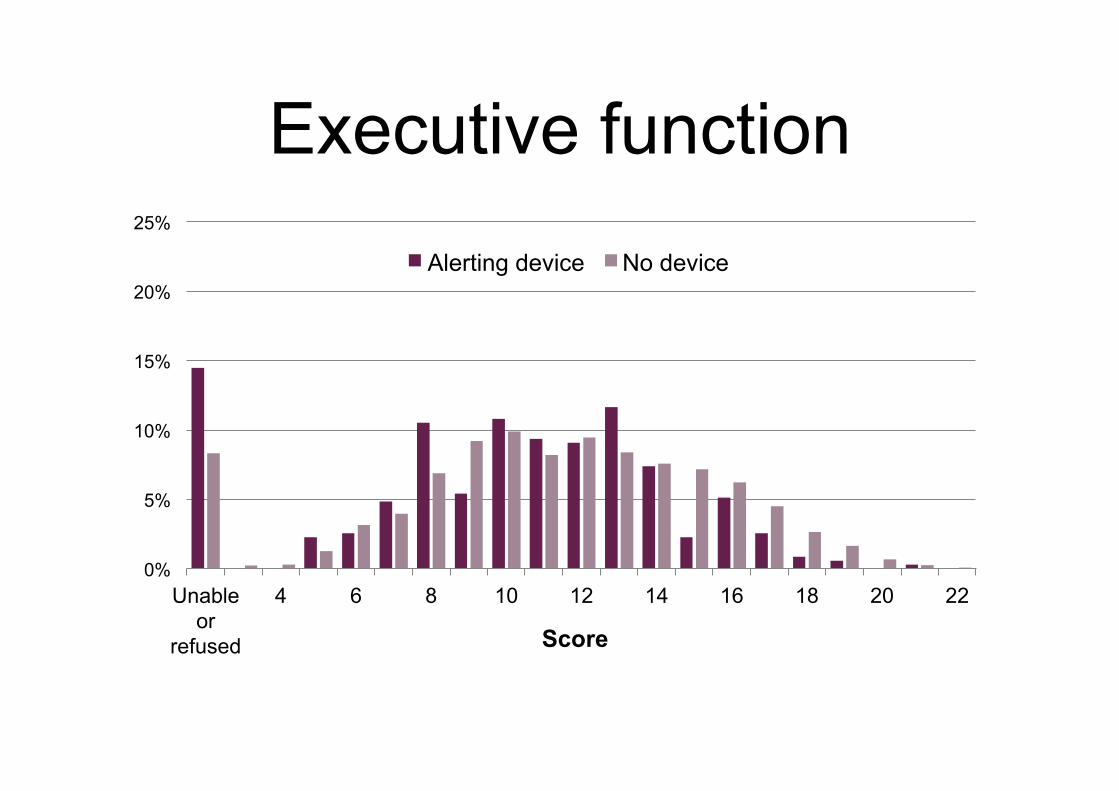
Executive function
0%
5%
10%
15%
20%
25%
Unable or
refused
4 6 8 10 12 14 16 18 20 22
Score
Alerting device No device
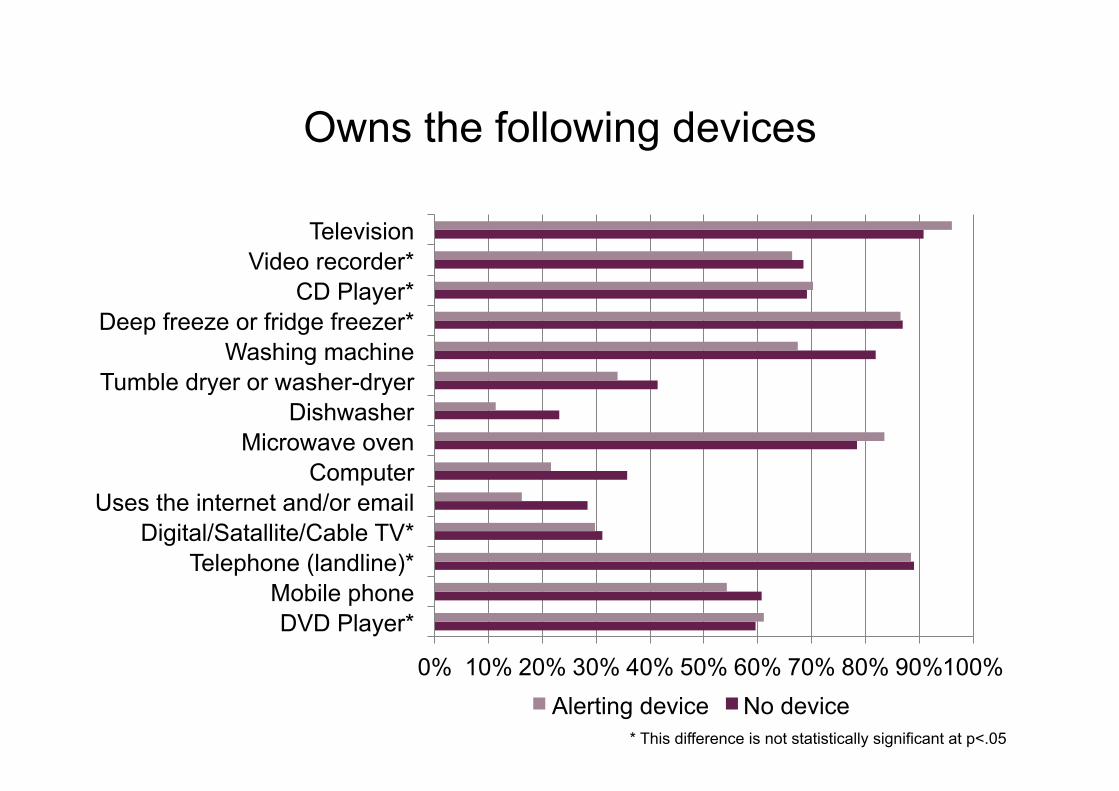
Owns the following devices
0% 10% 20% 30% 40% 50% 60% 70% 80% 90% 100%
DVD Player* Mobile phone
Telephone (landline)* Digital/Satallite/Cable TV*
Uses the internet and/or email Computer
Microwave oven Dishwasher
Tumble dryer or washer-dryer Washing machine
Deep freeze or fridge freezer* CD Player*
Video recorder* Television
Alerting device No device * This difference is not statistically significant at p<.05

Personal Alarms
Descriptive statistics comparing personal alarm users who are private funded (100) with those who
are non-privately funded (108)
Differences between the two groups are statistically different at p<.05 unless stated otherwise Five cases in which personal alarms are part private and part non-private funded have been excluded
from the analysis
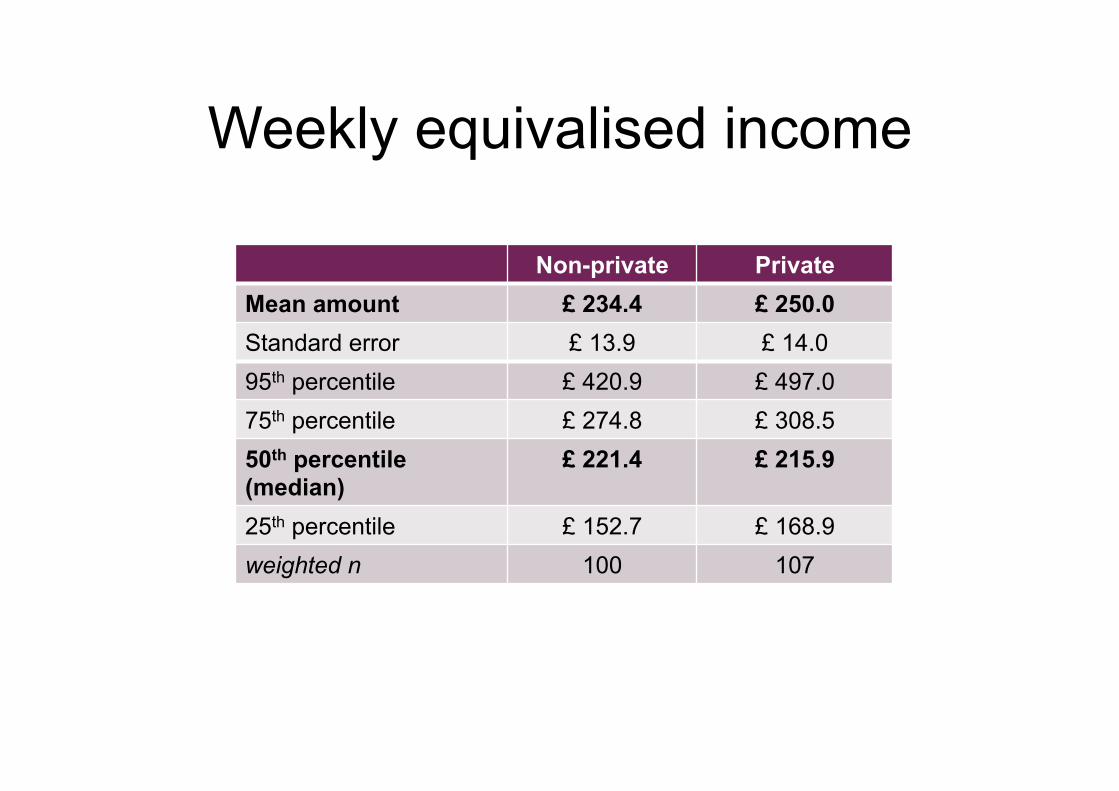
Weekly equivalised income
Non-private Private Mean amount £ 234.4 £ 250.0 Standard error £ 13.9 £ 14.0 95th percentile £ 420.9 £ 497.0 75th percentile £ 274.8 £ 308.5 50th percentile (median)
£ 221.4 £ 215.9
25th percentile £ 152.7 £ 168.9 weighted n 100 107

Total (non-pension) wealth
Non-private Private Mean amount £ 69,216 £ 215,356 Standard error £ 12,404 £ 31,260 95th percentile £ 301,419 £ 607,466 75th percentile £ 111,047 £ 259,191 50th percentile (median)
£ 6,881 £ 174,070
25th percentile £ 2,604 £ 23,007 weighted n 100 107
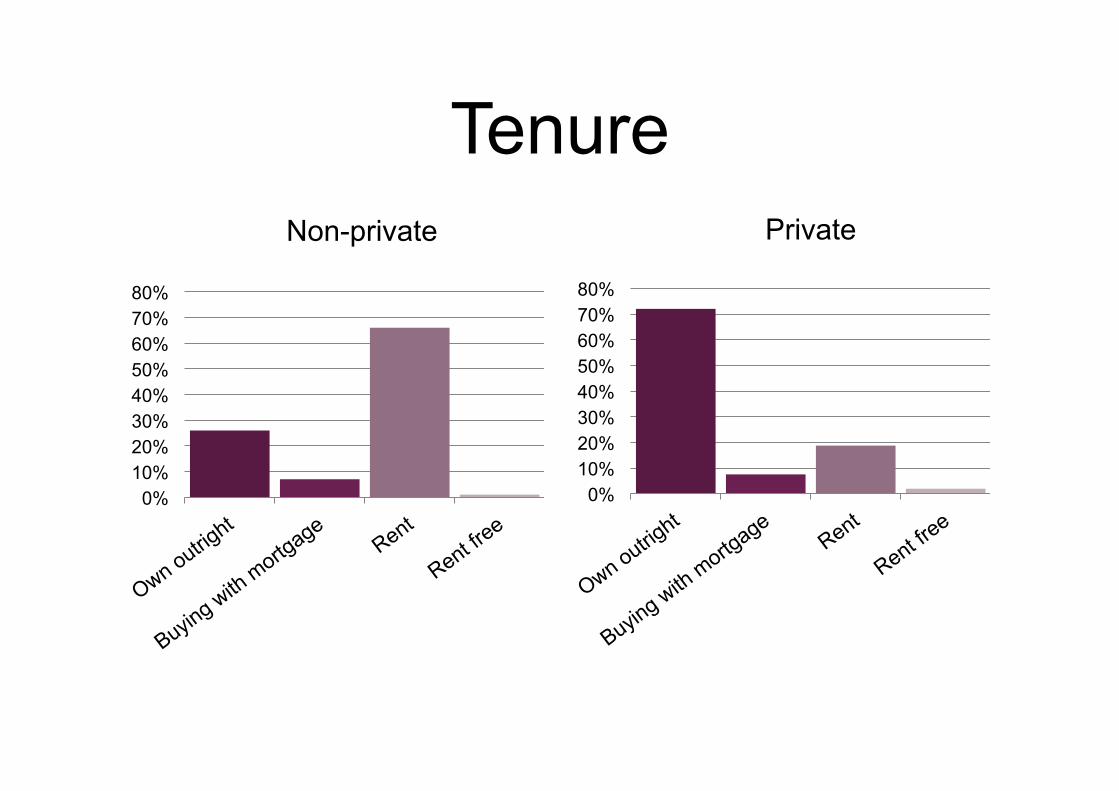
Tenure
0% 10% 20% 30% 40% 50% 60% 70% 80%
0% 10% 20% 30% 40% 50% 60% 70% 80%
Private Non-private

Mobility, arm function, and fine motor function
0% 10% 20% 30% 40% 50% 60% 70% 80% 90% 100%
Picking up a 5p coin from a table*
Lifting or carrying weights over 10
Pulling or pushing large objects*
Reaching or extending arms above
Stooping, kneeling or crouching*
Climbing one flight of stairs without
Climbing several flights of stairs without
Getting up from a chair after sitting for
Sitting for about two hours*
Walking 100 yards
Non-private Private
* This difference is not statistically significant at p<.05

Help received with mobility, ADL or IADL issue
0% 10% 20% 30% 40% 50%
No help received* Help from other*
Help from neighbour/friend* Help from staff in a care home*
Help from a district nurse or health Help from local authority or social
Privately paid help Help from other relation*
Help from sibling* Help from son or daughter*
Help from partner*
Non-private Private * This difference is not statistically significant at p<.05
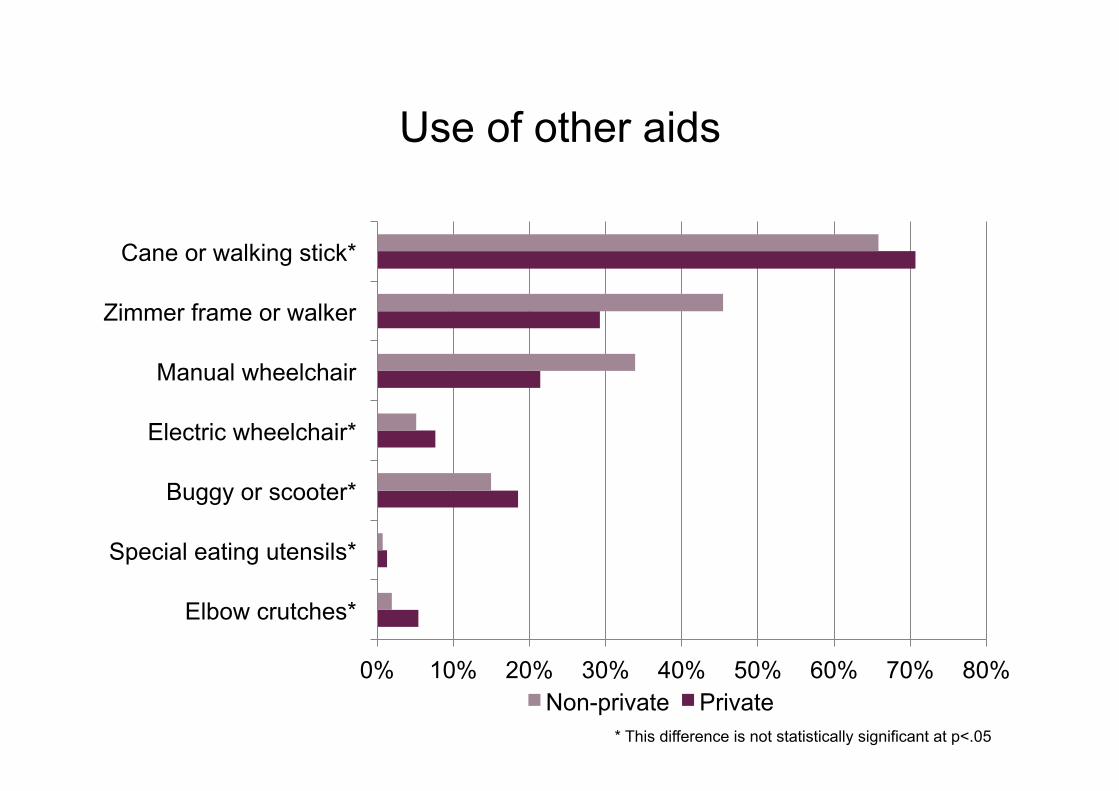
Use of other aids
0% 10% 20% 30% 40% 50% 60% 70% 80%
Elbow crutches*
Special eating utensils*
Buggy or scooter*
Electric wheelchair*
Manual wheelchair
Zimmer frame or walker
Cane or walking stick*
Non-private Private * This difference is not statistically significant at p<.05

Other adaptations to the property
0% 10% 20% 30% 40% 50% 60% 70%
None of these* Other special features*
Alerting devices Chair lift or stair glide*
Lift Kitchen modifications*
Bathroom modifications* Accessible parking or drop off site
Automatic or easy open doors* Hand rails*
Ramps or street level entrances Widened doorways or hallways
Non-private Private * This difference is not statistically significant at p<.05
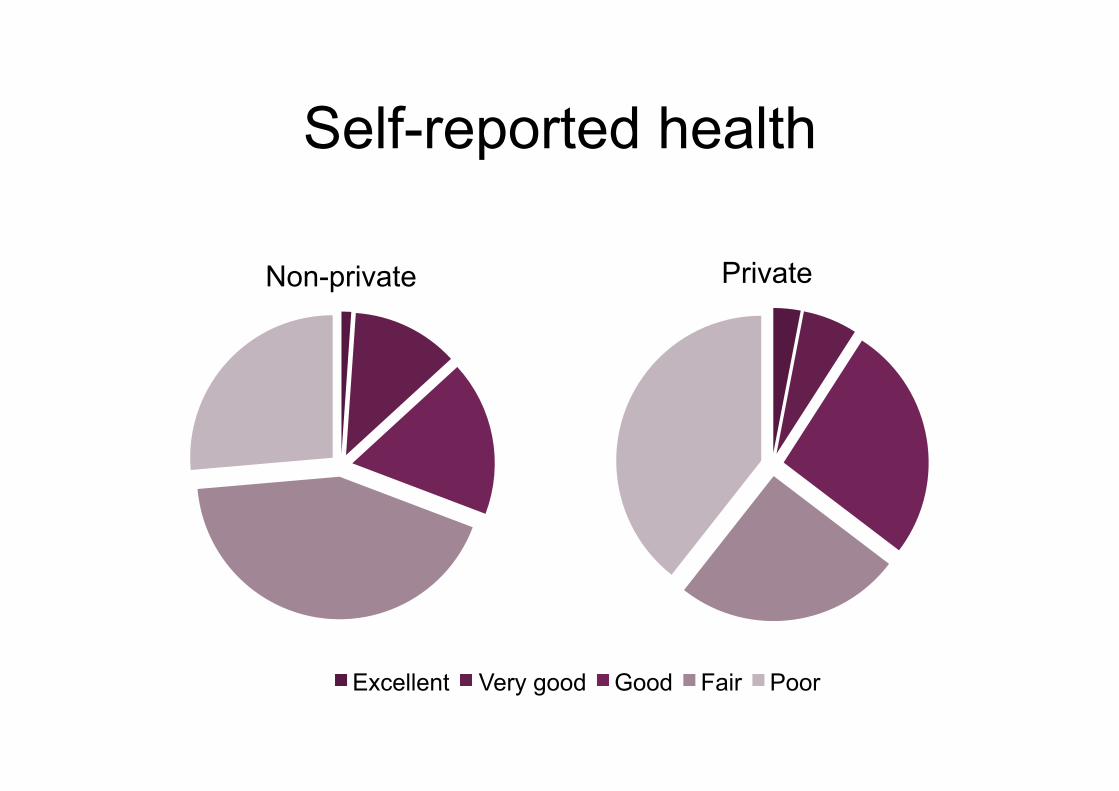
Self-reported health
Non-private Private
Excellent Very good Good Fair Poor
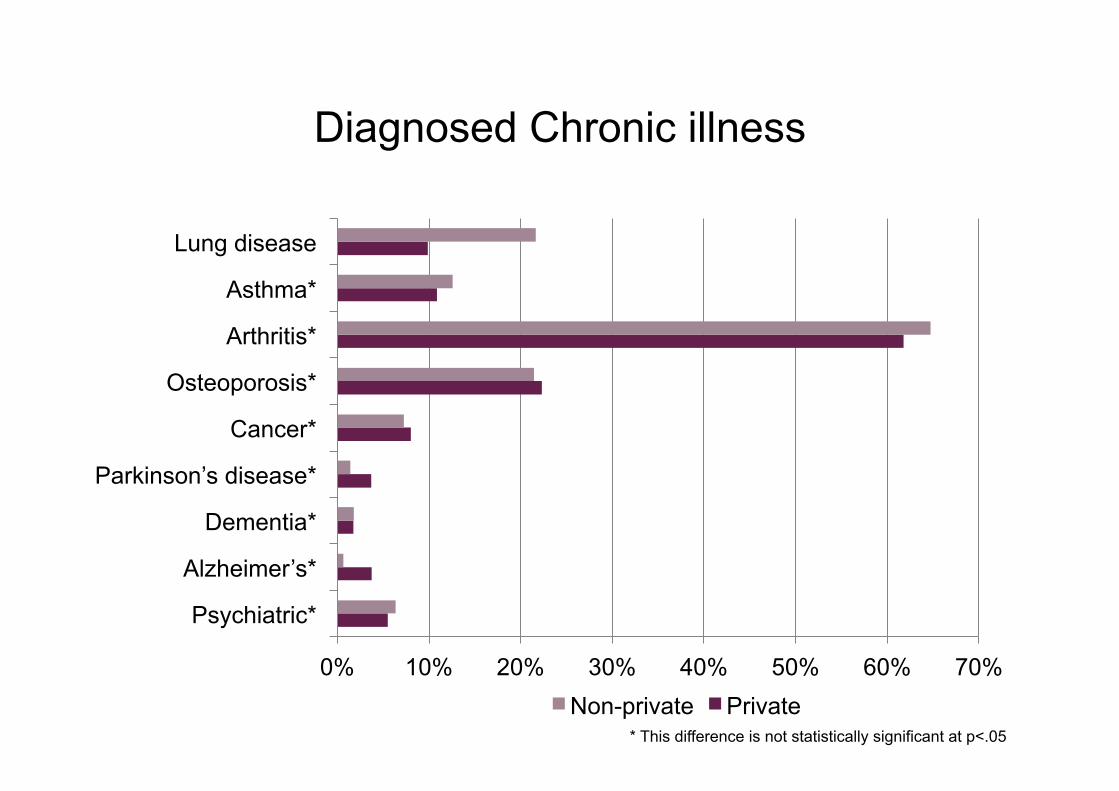
Diagnosed Chronic illness
0% 10% 20% 30% 40% 50% 60% 70%
Psychiatric*
Alzheimer’s*
Dementia*
Parkinson’s disease*
Cancer*
Osteoporosis*
Arthritis*
Asthma*
Lung disease
Non-private Private * This difference is not statistically significant at p<.05

Self-reported eyesight (whilst wearing lenses, if a appropriate)
Non-private Private
Excellent Very good Good Fair Poor*
* Includes spontaneous responses denoting that the person is registered or legally blind

Self-reported hearing
Non-private Private
Excellent Very good Good Fair Poor

Difficulty walking ¼ mile
Non-private Private
No difficulty Some difficulty Much difficulty Unable to do this

Difficulties caused by…
0% 10% 20% 30% 40% 50% 60% 70%
Other symptom* Anxiety or fear* Fear of falling*
Lightheaded or dizzy* Unsteady on feet (balance)*
Hearing difficulty Seeing difficulty*
Pain in back* Swelling in leg or foot*
Pain in leg or foot* Shortness of breath
Fatigue* Chest pain*
Non-private Private * This difference is not statistically significant at p<.05

Has problems with balance when walking on a level surface
Non-private Private
Never Sometimes Often Very often Always Cannot or does not walk
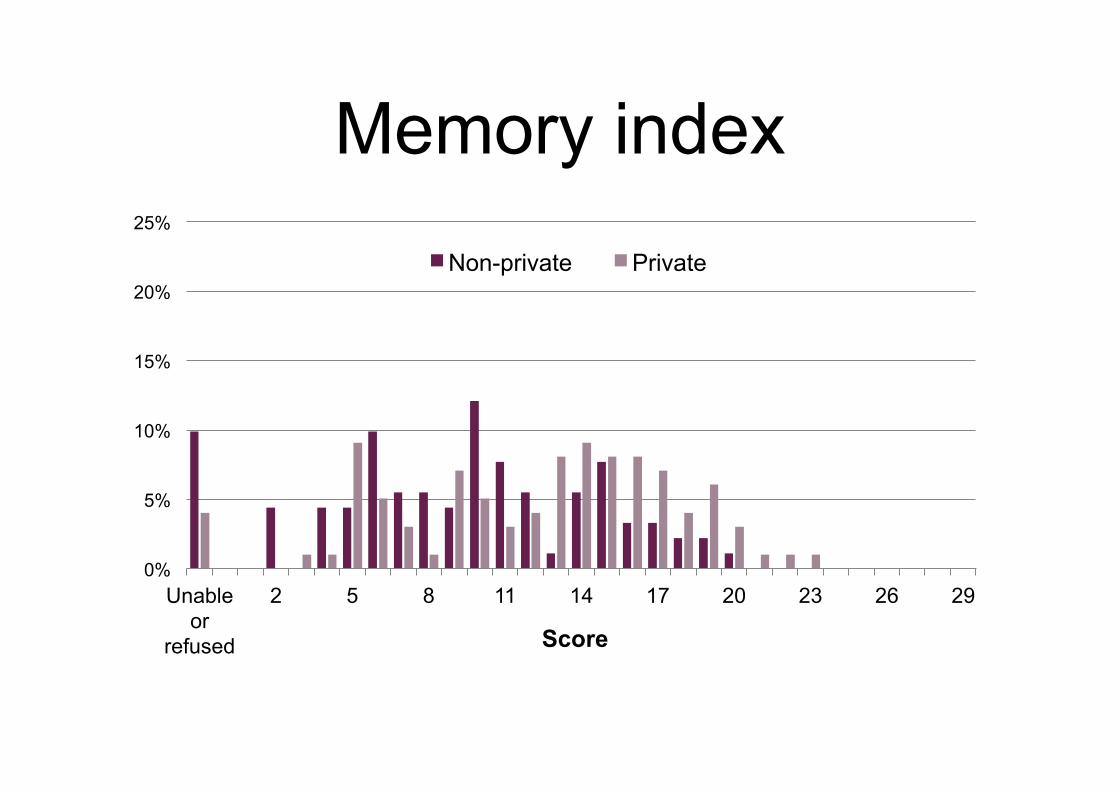
Memory index
0%
5%
10%
15%
20%
25%
Unable or
refused
2 5 8 11 14 17 20 23 26 29
Score
Non-private Private

Owns the following devices
0% 10% 20% 30% 40% 50% 60% 70% 80% 90% 100%
DVD Player* Mobile phone
Telephone (landline)* Digital/Satallite/Cable TV*
Uses the internet and/or email Computer
Microwave oven* Dishwasher
Tumble dryer or washer-dryer Washing machine*
Deep freeze or fridge freezer* CD Player*
Video recorder* Television*
Non-private Private * This difference is not statistically significant at p<.05
Alerting devices
Descriptive statistics comparing personal alarm users who are private funded (100) with those who
are non-privately funded (219)
Differences between the two groups are statistically different at p<.05 unless stated otherwise Four cases in which alerting devices are part private and part non-private funded have been excluded
from the analysis

Age
0%
5%
10%
15%
20%
25%
30%
51 53 55 57 59 61 63 65 67 69 71 73 75 77 79 81 83 85 87 89
Age
Non-private Private

Age group
0%
10%
20%
30%
40%
50%
50-59 60-69 70-79 80-89 90+ Age
Non-private Private

Subjective social class
0%
10%
20%
30%
Subjective social status
Non-private Private

Weekly equivalised income
Non-private Private Mean amount £ 223.0 £ 254.5 Standard error £ 7.5 £ 12.7 95th percentile £ 392.1 £ 595.2 75th percentile £ 274.3 £ 315.7 50th percentile (median)
£ 205.5 £ 224.8
25th percentile £ 149.0 £ 169.2 weighted n 216 97

Total (non-pension) wealth
Non-private Private Mean amount £ 47,088 £ 226,441 Standard error £ 8,034 £ 25,547 95th percentile £ 293,080 £ 700,646 75th percentile £ 18,000 £ 298,065 50th percentile (median)
£ 3,950 £ 153,321
25th percentile £ 988 £ 59,752 weighted n 216 97

Tenure
0%
20%
40%
60%
80%
100%
0%
20%
40%
60%
80%
100%
Private Non-private

Private
1 2 3 4 5
Total number of people in the household
Non-private

Lives with…
0%
10%
20%
30%
40%
50%
60%
70%
0%
10%
20%
30%
40%
50%
60%
70%
Private Non-private
* This difference is not statistically significant at p<.05
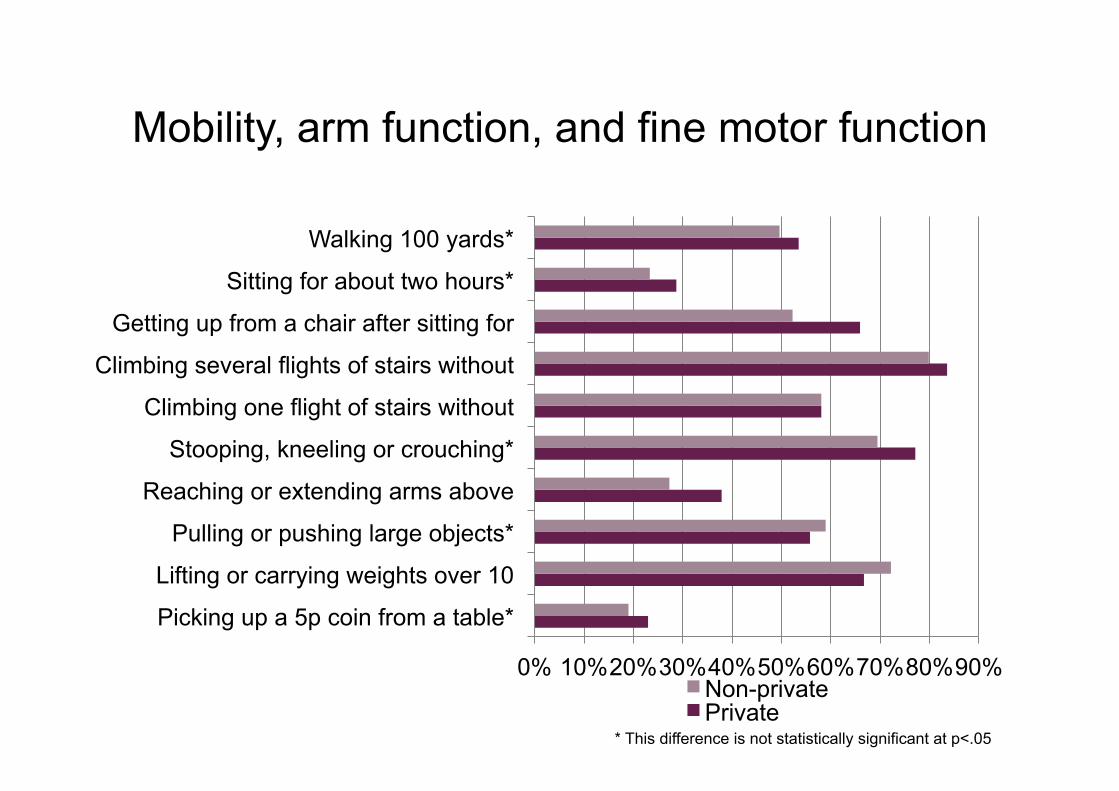
Mobility, arm function, and fine motor function
0% 10% 20% 30% 40% 50% 60% 70% 80% 90%
Picking up a 5p coin from a table*
Lifting or carrying weights over 10
Pulling or pushing large objects*
Reaching or extending arms above
Stooping, kneeling or crouching*
Climbing one flight of stairs without
Climbing several flights of stairs without
Getting up from a chair after sitting for
Sitting for about two hours*
Walking 100 yards*
Non-private Private
* This difference is not statistically significant at p<.05

Activities of Daily Living (ADLs)
0% 5% 10% 15% 20% 25% 30% 35% 40% 45% 50%
Using the toilet, including getting up or down
Getting in or out of bed
Eating, such as cutting up food*
Bathing or showering*
Walking across a room*
Dressing, including putting on shoes and socks*
Non-private Private
* This difference is not statistically significant at p<.05

Help received with mobility, ADL or IADL issue
0% 10% 20% 30% 40% 50%
No help received* Help from other*
Help from neighbour/friend* Help from staff in a care home
Help from a district nurse or health Help from local authority or social
Privately paid help Help from other relation*
Help from sibling* Help from son or daughter*
Help from partner*
Non-private Private * This difference is not statistically significant at p<.05

Private
Meets respondent's needs all of the time Usually meet's respondents needs
Usefulness of help received
Non-private

Use of other aids
0% 10% 20% 30% 40% 50% 60% 70%
Elbow crutches*
Personal alarm
Special eating utensils
Buggy or scooter*
Electric wheelchair
Manual wheelchair
Zimmer frame or walker*
Cane or walking stick*
Non-private Private * This difference is not statistically significant at p<.05

Other adaptations to the property
0% 10% 20% 30% 40% 50% 60% 70% 80%
Other special features*
Chair lift or stair glide*
Lift
Kitchen modifications*
Bathroom modifications
Accessible parking or drop off site*
Automatic or easy open doors
Hand rails*
Ramps or street level entrances
Widened doorways or hallways
Non-private Private * This difference is not statistically significant at p<.05

Diagnosed Chronic illness
0% 10% 20% 30% 40% 50% 60% 70%
Psychiatric*
Alzheimer’s*
Dementia*
Parkinson’s disease*
Cancer*
Osteoporosis*
Arthritis*
Asthma
Lung disease*
Non-private Private * This difference is not statistically significant at p<.05

Difficulties caused by…
0% 10% 20% 30% 40% 50% 60% 70%
Other symptom* Anxiety or fear Fear of falling*
Lightheaded or dizzy Unsteady on feet (balance)*
Hearing difficulty* Seeing difficulty*
Pain in back* Swelling in leg or foot*
Pain in leg or foot* Shortness of breath*
Fatigue* Chest pain*
Non-private Private * This difference is not statistically significant at p<.05

Memory index
0%
5%
10%
15%
20%
25%
Unable or
refused
2 5 8 11 14 17 20 23 26 29
Score
Non-private Private

Executive function
0%
5%
10%
15%
20%
25%
Unable or
refused
4 6 8 10 12 14 16 18 20 22
Score
Non-private Private

Owns the following devices
0% 10% 20% 30% 40% 50% 60% 70% 80% 90% 100%
DVD Player* Mobile phone
Telephone (landline)* Digital/Satallite/Cable TV*
Uses the internet and/or email Computer
Microwave oven* Dishwasher
Tumble dryer or washer-dryer Washing machine
Deep freeze or fridge freezer* CD Player
Video recorder* Television
Non-private Private * This difference is not statistically significant at p<.05

Stage 2: Identifying potential telecare users (2008)

Prevalence of potential Telecare users among older population (aged 60+)
Personal alarm Overall prevalence 38.2 % Currently receives informal care 44.4 % (18.0 %) Currently receives social services or Local Authority care
2.7 % (1.0 %)
Currently receives paid for care services
5.4 % (2.1 %)
Currently receives ‘other types’ of care
2.3 % (1.0 %)
Currently receives no care 44.5 % (18.0%) Not asked about care use 7.7 % (2.7 %)

Age
-1.0%
1.0%
3.0%
5.0%
7.0%
9.0%
11.0%
13.0%
15.0%
60 62 64 66 68 70 72 74 76 78 80 82 84 86 88 90+
Age
Potential user 60+ population

Age group
0%
10%
20%
30%
40%
50%
60-69 70-79 80-89 90+ Age
Potential User 60+ population

Gender and ethnicity
Potential users 60+ population
White Males BME Males White Females BME Females
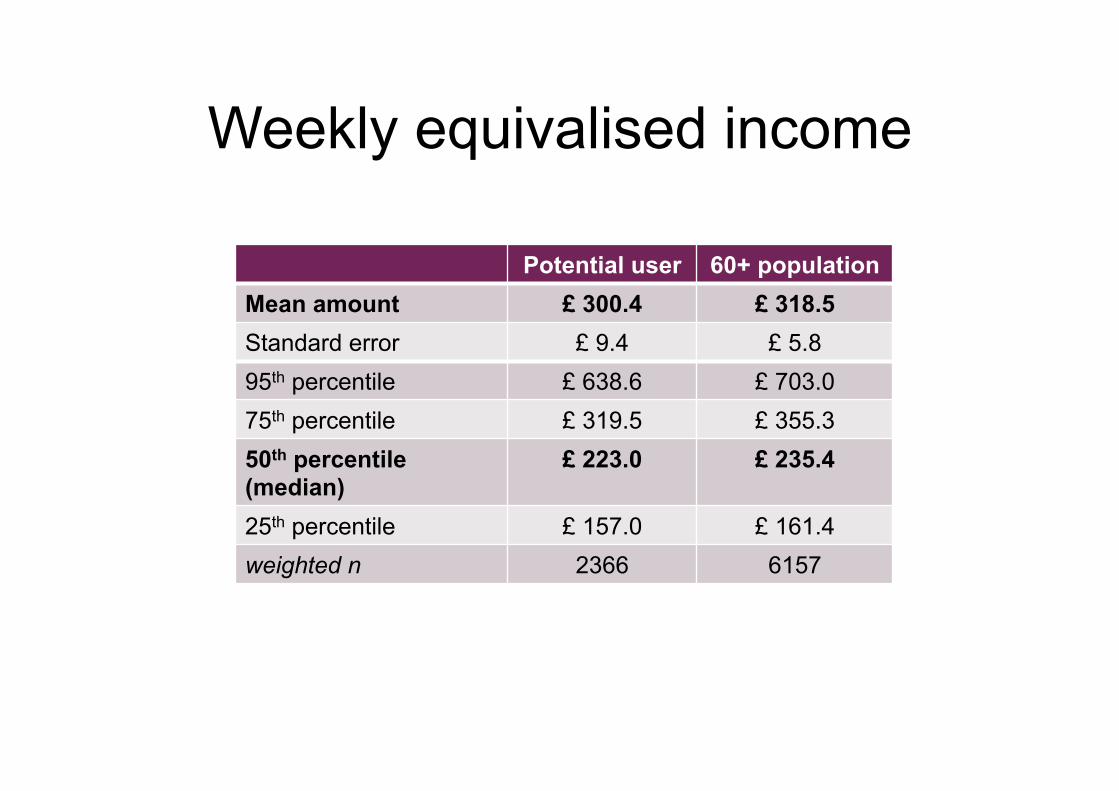
Weekly equivalised income
Potential user 60+ population Mean amount £ 300.4 £ 318.5 Standard error £ 9.4 £ 5.8 95th percentile £ 638.6 £ 703.0 75th percentile £ 319.5 £ 355.3 50th percentile (median)
£ 223.0 £ 235.4
25th percentile £ 157.0 £ 161.4 weighted n 2366 6157
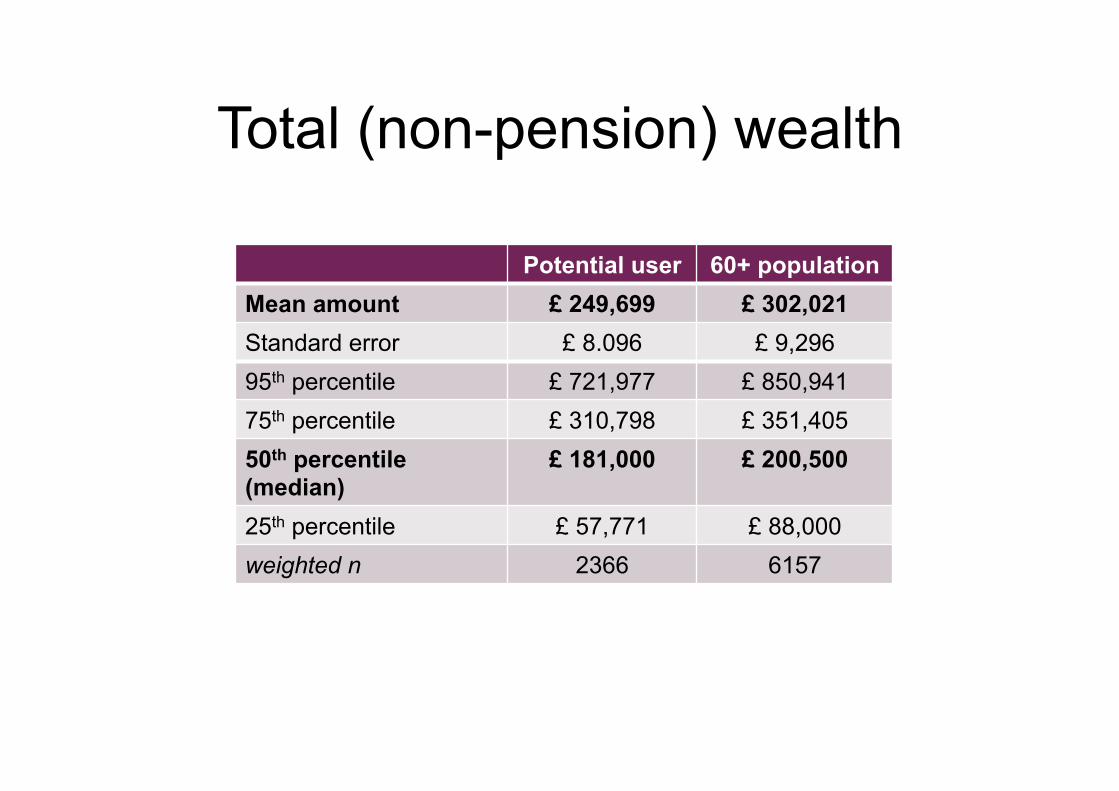
Total (non-pension) wealth
Potential user 60+ population Mean amount £ 249,699 £ 302,021 Standard error £ 8.096 £ 9,296 95th percentile £ 721,977 £ 850,941 75th percentile £ 310,798 £ 351,405 50th percentile (median)
£ 181,000 £ 200,500
25th percentile £ 57,771 £ 88,000 weighted n 2366 6157

Tenure
0% 10% 20% 30% 40% 50% 60% 70%
0% 10% 20% 30% 40% 50% 60% 70%
60+ population
Potential user

Total number of people in the household
Potential users 60+ population
1 2 3 4 5+

Lives with…
0%
10%
20%
30%
40%
50%
60%
70%
0%
10%
20%
30%
40%
50%
60%
70%
60+ population
Potential user

Usefulness of help received
Potential user 60+ population
Meets respondent's needs all of the time Usually meet's respondents needs

Disability benefits currently received
0% 2% 4% 6% 8% 10% 12% 14% 16%
Carers Allowance
Disability Living Allowance
Attendance Allowance
Individual
0% 2% 4% 6% 8% 10% 12%
Attendance Allowance
Disability Living Allowance
Carers Allowance
Partner
Potential user 60+ population
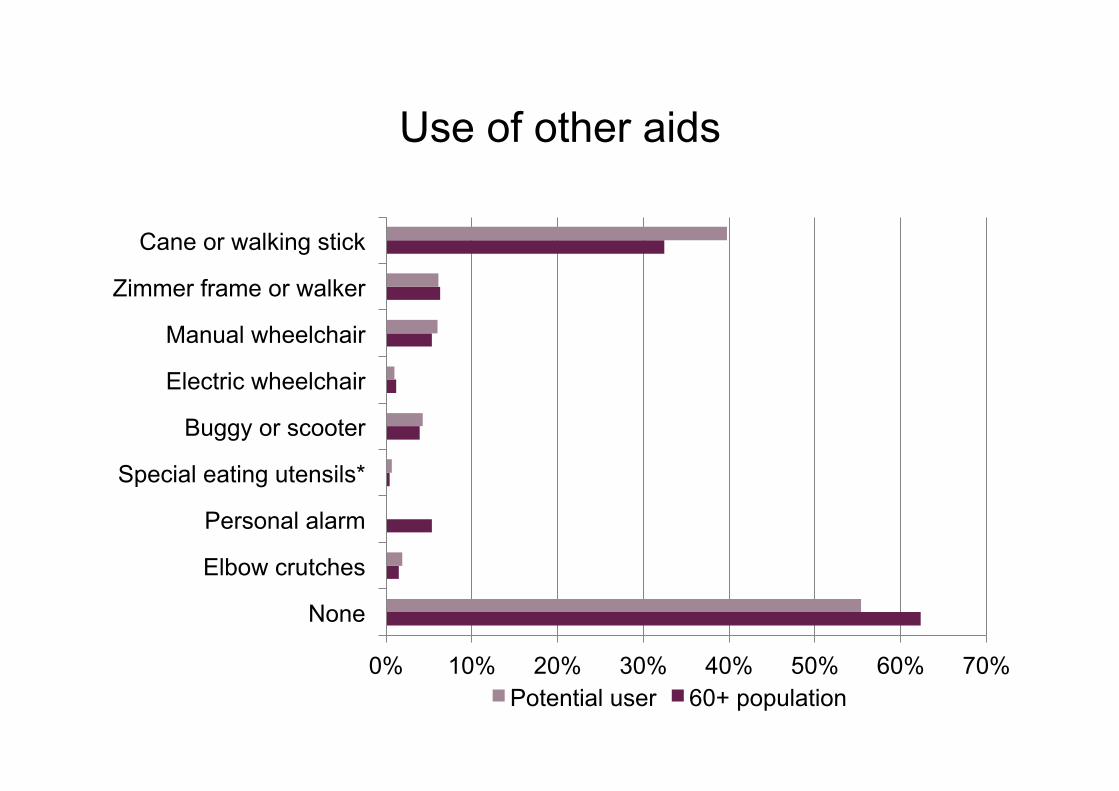
Use of other aids
0% 10% 20% 30% 40% 50% 60% 70%
None
Elbow crutches
Personal alarm
Special eating utensils*
Buggy or scooter
Electric wheelchair
Manual wheelchair
Zimmer frame or walker
Cane or walking stick
Potential user 60+ population

Use of services**
0% 10% 20%
Has ever used meals on wheels
Has ever used a day centre
Has ever used a lunch club
Potential user
** Only asked of those aged 65 or older
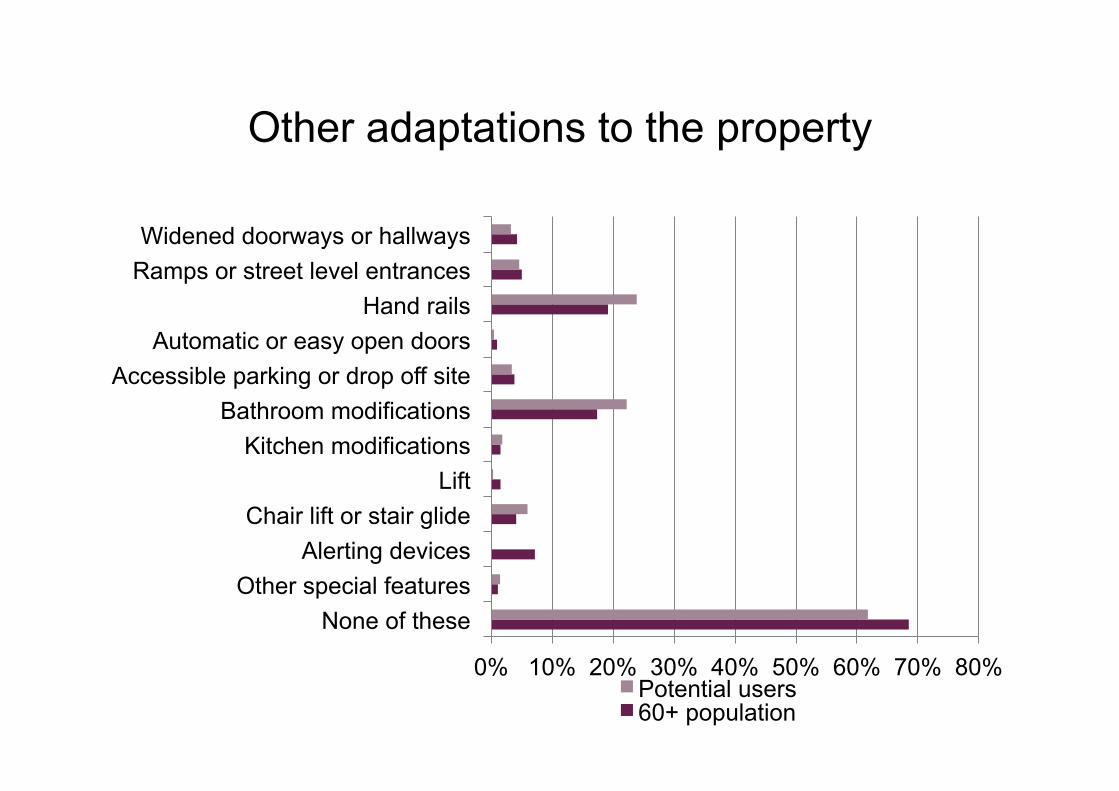
Other adaptations to the property
0% 10% 20% 30% 40% 50% 60% 70% 80%
None of these Other special features
Alerting devices Chair lift or stair glide
Lift Kitchen modifications
Bathroom modifications Accessible parking or drop off site
Automatic or easy open doors Hand rails
Ramps or street level entrances Widened doorways or hallways
Potential users 60+ population
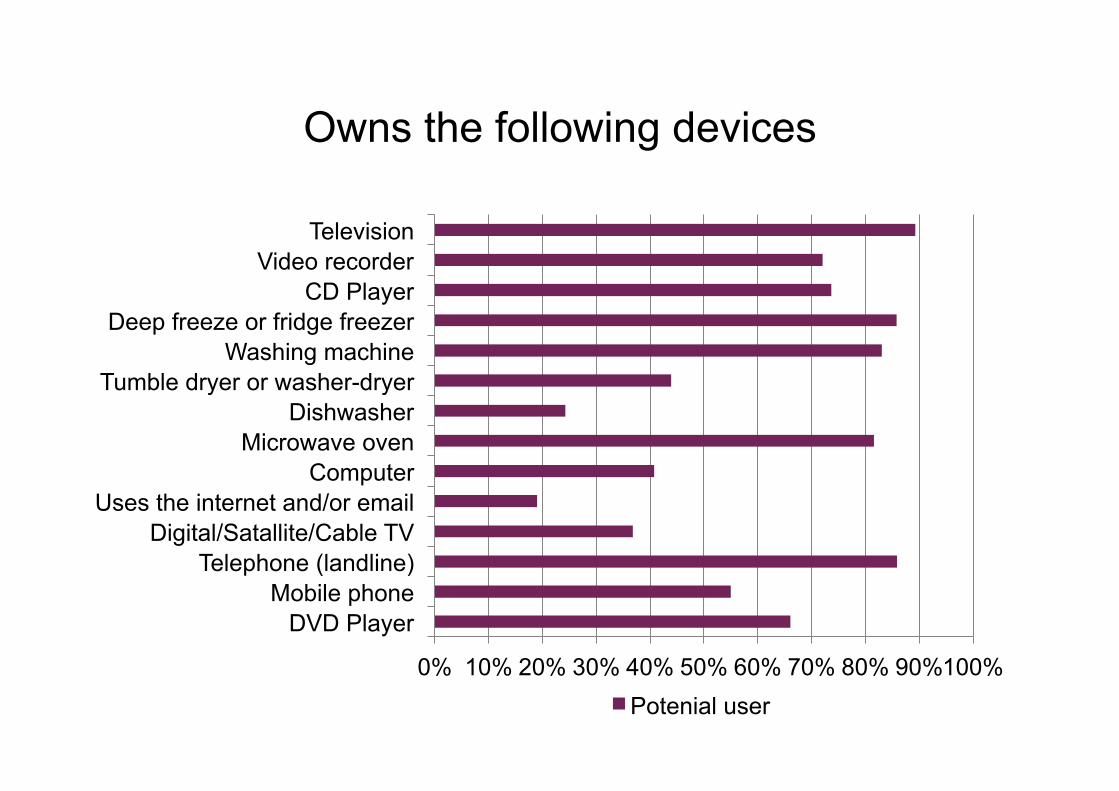
Owns the following devices
0% 10% 20% 30% 40% 50% 60% 70% 80% 90% 100%
DVD Player Mobile phone
Telephone (landline) Digital/Satallite/Cable TV
Uses the internet and/or email Computer
Microwave oven Dishwasher
Tumble dryer or washer-dryer Washing machine
Deep freeze or fridge freezer CD Player
Video recorder Television
Potenial user

Published by The Strategic Society Centre. © The Strategic Society Centre, 2012 The Strategic Society Centre 145-157 St John Street London EC1V 4PY www.strategicsociety.org.uk [email protected] The Strategic Society Centre is a registered charity (No. 1144565) incorporated with limited liability in England and Wales (Company No 7273418).