who watches presidential debates? - princeton universitymprior/priorpoq2012 debates.pdf · who...
TRANSCRIPT
© The Author 2012. Published by Oxford University Press on behalf of the American Association for Public Opinion Research. All rights reserved. For permissions, please e-mail: [email protected]
Public Opinion Quarterly, Vol. 76, No. 2, June 2012, pp. 350–363
doi:10.1093/poq/nfs019
Who Watches Presidential debates? MeasureMeNt ProbleMs iN CaMPaigN effeCts researCh
MarKus Prior*
abstract to examine whether a campaign event affected candidate preferences or candidate knowledge, survey researchers need to know who was exposed to the event. using the example of presidential debates, this study shows that survey respondents do not accurately report their exposure to even the most salient campaign events. two independent methods are used to assess the validity of self-reported debate exposure. first, survey estimates are compared to Nielsen estimates, which track exposure automatically. second, the temporal stability of self-reports across independent daily estimates in the National annenberg election survey is analyzed. both approaches indicate low validity of self-reports. self-reported debate audiences are approximately twice as big as comparable Nielsen estimates. independent random samples generate widely divergent audience estimates for the same debate depending on when the survey was conducted. the second finding demonstrates low validity of self-reports without assuming validity of Nielsen estimates (or any other benchmark). the low validity of self-reported debate expo-sure poses a major obstacle for campaign effects research. Without valid measures of who was exposed to a campaign event, research cannot establish the causal impact of the event.
Candidate debates are important campaign events. research aims to char-acterize the difference in attitudes and preferences between debate viewers and non-viewers (e.g., benoit and hansen 2004; fridkin et al. 2007; holbert 2005) or explain who watches debates and why (e.g., baum and Kernell 1999; Kenski and stroud 2005). Yet, as this study demonstrates, many non-viewers inaccurately claim to have watched debates, raising doubts about research that treats self-reported debate exposure as valid.
Markus Prior is associate Professor of Politics and Public affairs at Princeton university, Prince-ton, NJ, usa. shim reza provided research assistance on this project. *address correspondence to Markus Prior, Woodrow Wilson school and Department of Politics, Princeton university, Princeton, NJ 08544-1013, usa; e-mail: [email protected].
Overreporting Debate Exposure 351
this study assesses the validity of self-reported debate exposure using two independent validation strategies. the first compares self-reports to Nielsen audience estimates. the second does not rely on Nielsen data, but instead compares survey estimates of the same debate taken at different times. if self-reports are valid, the time of the report should not affect the audience estimate.
behavioral self-reports and Misreporting
a large literature shows that behavioral self-reports are fraught with error (e.g., bradburn, rips, and shevell 1987; hadaway, Marler, and Chaves 1993, 1998; schwarz and oyserman 2001). regarding campaign exposure, research shows that respondents often inaccurately report exposure to news (Price and Zaller 1993; Prior 2009a) and campaign advertising (ansolabehere and iyengar 1998; Vavreck 2007).1 however, these findings may not extend to self-reported exposure to presidential debates. reporting exposure to a discrete and relatively salient presidential debate involves different cognitive mecha-nisms than reporting exposure to regularly available news or short, discrete advertisements.
self-reports can be based exclusively on enumeration of discrete occur-rences of a behavior or on estimation of the rate at which one engages in the behavior. survey methodologists have suggested different sources of error for reports of frequent and infrequent behaviors (Conrad, brown, and Cashman 1998; burton and blair 1991; Menon 1993). When respondents believe that they have recalled some but not all episodes of the behavior, they will estimate its frequency. estimation is important for regular behaviors, such as network news exposure, because respondents are unlikely to recall all specific instances of exposure (Prior 2009b).
trying to recall exposure to a debate might be easier because it constitutes a discrete, infrequent event. several studies suggest that estimation tends to generate higher self-reports than does enumeration (brown and sinclair 1999; burton and blair 1991). if easier recall makes estimation unnecessary, over-reporting might be less severe. even then, schwarz (1999, p. 97) concludes, self-reports will be unreliable “unless the behavior is rare and of considerable importance.” although presidential debates are relatively rare, they may not be important enough for many people to be reliably recalled.
self-reported debate exposure may also suffer from social-desirability bias if respondents perceive debate viewing as a component of “good citi-zenship.” social-desirability pressure is the most prominent explanation for
1. ansolabehere and iyengar (1998) and Vavreck (2007) examine the validity of self-reported exposure to ads that were shown in a setting created by the researchers, not naturally occurring ads.
352 Prior
turnout overreporting (belli et al. 1999; bernstein, Chadha, and Montjoy 2001; holbrook and Krosnick 2010; Presser 1990). even though one study did not find any support for social-desirability bias in self-reporting of news exposure (Prior 2009b), the high salience of presidential debates may amplify the pressure to report exposure.
comparing self-reports to independent benchmarks
the first part of this analysis compares survey-based estimates to Nielsen estimates of audiences for the 2000, 2004, and 2008 presidential debates. it uses the National annenberg election survey (Naes), which consists of phone interviews with rDD samples of u.s. residents (romer et al. 2006). survey data are weighted to adjust for the number of adults and phone lines in the household, and to match census distributions of race/ ethnicity, age, sex, and education. respondents were asked, “Did you happen to watch the [ vice-presidential/presidential] debate on [date] between [names of candidates]?” exact wordings are given in figures 2–4. (in 2008, the Naes modified its debate question on october 22; see the online appen-dix and table 2.) Naes estimates are compared to national estimates by Nielsen compiled through “people meters” that monitor television viewing in a random sample of at least 5,000 u.s. households. Nielsen estimates use post-stratification weights to match the Current Population survey on age, gender, race/ ethnicity, and education.
between 47 and 63 percent of voting-age residents reported watching the presidential debates in the Naes. self-reported audiences for vice- presidential debates have a wider range, from 32 percent in 2000 to twice that in 2008. table 1 presents Naes audience estimates for all twelve debates.
even with generous allowances for small audience segments that Nielsen might miss, the self-reported audience is about double the Nielsen estimate for most debates. for this comparison, Nielsen ratings—the average per-minute audience of a program or channel, expressed as a percentage of all households or persons with television—are inappropriate. instead, it is necessary to use cumulative audience or “reach”—the number of people who watch some part of a program—which exceeds the average audience, and may exceed it by a lot for a ninety-minute program.
for the first presidential and vice-presidential debates in 2008, Nielsen released cumulative audience estimates (Nielsen Company 2008). of individ-uals aged 18 years and older, 28.6 percent watched at least six minutes of the first presidential debate on september 26, 2008, on a commercial network. the average audience for this debate in the same population was 21.9 percent. the vice-presidential debate drew a cumulative audience of 35.6 percent and an average audience of 29.4 percent. the cumulative audiences were thus 31 and 21 percent larger than the average audiences, respectively.

Overreporting Debate Exposure 353
table 1. debate audiences 2000–2008, nielsen and national annenberg election surveys
nielsen naes
(Viewers P2+ plus Pbs) × .943/VaP
rating
reach
Mean
N
2000 Oct. 4–29 first 22.5 47.7 [46.5; 49.0] 6318 second 17.9 47.3 [45.7; 48.9] 3912 third 18.3 49.5 [47.9; 51.1] 3657 VP 13.0 31.7 [30.5; 32.9] 5777
2004 Oct. 1–Nov. 1 first 28.0 63.0 [62.1; 63.9] 11329 second 21.2 57.0 [56.0; 58.1] 8620 third 23.3 58.8 [57.6; 59.9] 7053 VP 18.6 49.7 [48.7; 50.7] 9568
2008 Sept. 27–Nov. 1 first 22.4 21.9 28.6 62.3 [61.3; 63.3] 8675 second 27.0 62.9 [61.7; 64.1] 6306 third 24.4 59.4 [58.0; 60.8] 4512 VP 30.0 29.4 35.6 63.8 [62.7; 64.9] 7232
Reach by Age Segment (2008) first age 18–24 10.4 50.2 [44.2; 56.2] 269
age 25–34 20.6 51.8 [48.3; 55.2] 809age 35–44 25.3 60.9 [58.3; 63.4] 1427age 45–54 30.2 64.2 [62.1; 66.3] 2004age 55+ 41.4 70.4 [69.0; 71.8] 4166
VP age 18–24 13.2 43.3 [36.9; 49.8] 230age 25–34 27.2 58.4 [54.6; 62.1] 669age 35–44 34.3 60.9 [58.1; 63.7] 1180age 45–54 39.0 64.2 [62.1; 66.3] 1697age 55+ 47.9 71.5 [70.0; 73.0] 3456
first or VP age 18–24 19.5 62.0 [55.6; 68.3] 230age 25–34 36.6 71.2 [67.8; 74.7] 669age 35–44 44.2 74.5 [72.1; 77.0] 1180age 45–54 49.3 78.6 [76.7; 80.6] 1697age 55+ 59.5 81.8 [80.5; 83.1] 3456
Note.—Nielsen measured audiences on abC, Cbs, NbC, CNN, MsNbC, and fox News in 2000. audiences on the foX network are added in 2004 and 2008. in 2008, CNbC, bbC america, telemundo, telefutura (first debate), and univision (second and third) were also added.
the first column adds Pbs projections to Nielsen’s average audience estimates for viewers aged 2 and older, multiplies by .943 (the share of viewers 18+ for the two available 2008 debates), and divides by the size of the voting age population.
rating and reach estimates are live and same day from Nielsen Company (2008). rating is the percentage of viewers aged 18 and older as a percentage of Nielsen population estimate. reach is the percentage of viewers aged 18 and older who watched at least six minutes. rating and reach estimates do not include Pbs audiences. see text for more information.

354 Prior
Nielsen estimates include only commercial networks, thus omitting Pbs and CsPaN viewers. Pbs provided its own audience projections2 of 2.6 million and 3.5 million Pbs viewers, respectively, for the first presidential and the vice-presidential debate in 2008. assuming that Pbs viewers were aged 18 years or older, average audiences for these debates would rise by 1.2 and 1.6 percentage points to 23.1 and 31.0 percent of adult residents. it would be technically incorrect to add Pbs projections to the reach because they are not cumulative audience estimates, and because projected Pbs viewers may have watched portions of the debate on other channels and would thus already be included in Nielsen’s cumulative audience estimate. these biases operate in opposite directions. as a rough approximation, i add Pbs projections to Nielsen’s cumulative estimates.
Combining Nielsen and Pbs data yields a cumulative audience of 29.8 percent for the first presidential debate. in the Naes, in contrast, 62.3 per-cent of respondents reported watching at least some of this debate. for the vice-presidential debate, the Nielsen/Pbs cumulative estimate is 37.2 percent. according to Naes, the audience was 63.8 percent. self-reported audiences thus exceed automatically tracked3 audiences by factors of 2.1 and 1.8, respect-ively. Judging by self-reports, both debates had about the same audience. according to Nielsen, however, the audience for the vice-presidential debate exceeded the audience for the first presidential debate by a quarter, or about 16.5 million viewers.
this mismatch is unlikely to be explained by Nielsen undercounts or atyp-ical Naes survey procedures. some self-reported viewers may have watched the debate online, but the online audience was probably less than one or two percent of the adult population in 20084—clearly not large enough to change the diagnosis of massive overreporting. the Naes is no more prone to over-reporting than other surveys. seven of eight other polls that measured debate viewing in 2008 generated higher estimates than the Naes in the same period (see the online appendix).
for other debates, Nielsen released only the average audience estimates for individuals older than one (P2+). i use the relationships observed for the two 2008 debates with more detailed Nielsen data to impute the aver-age and cumulative P18+ audiences. those two debates had 3.1 million and
2. according to robert flynn, Vice President of Communications and Marketing at MacNeil lehrer Productions, Pbs projections are based on Nielsen data for local markets (phone conver-sation, october 1, 2010).3. television viewing is automatically tracked in Nielsen households, but individuals still need to identify themselves by pushing a button. Prior (2009a) shows that substantial overreporting of news exposure occurs among members of one-person households, for whom failure to sign in does not generate measurement error.4. according to stelter (2008), 285,000 live streams of the 2008 vice-presidential debate were initiated on MsNbC.com, and “CNN reported 2.1 million streams of live video from 9 p.m. to 11 p.m.” the CNN figure appears to include post-debate analysis, and neither estimate excludes viewers outside the united states.
Overreporting Debate Exposure 355
3.9 million viewers between ages 2 and 17, according to Nielsen average audience estimates, which represent 5.9 percent and 5.5 percent of the P2+ audience. hence, i impute average P18+ audiences for other debates by multi-plying the sum of the Nielsen P2+estimate and Pbs audience projections by .943 (= 1 – (.059+.055)/2) and then dividing by the size of the voting age population. table 1 (first column) shows these estimates. to impute cumula-tive audiences, i multiply the average P18+ audience imputation by 1.26, the factor by which cumulative and average audiences differ for the two debates for which i have data.
averaged across the ten debates for which Nielsen did not release P18+ or cumulative estimates, self-reported debate viewing in the Naes exceeds imputed average audiences by a factor of 2.5 (ranging from 2.1 to 2.8) and imputed cumulative audiences by a factor of 2.0 (ranging from 1.7 to 2.2).
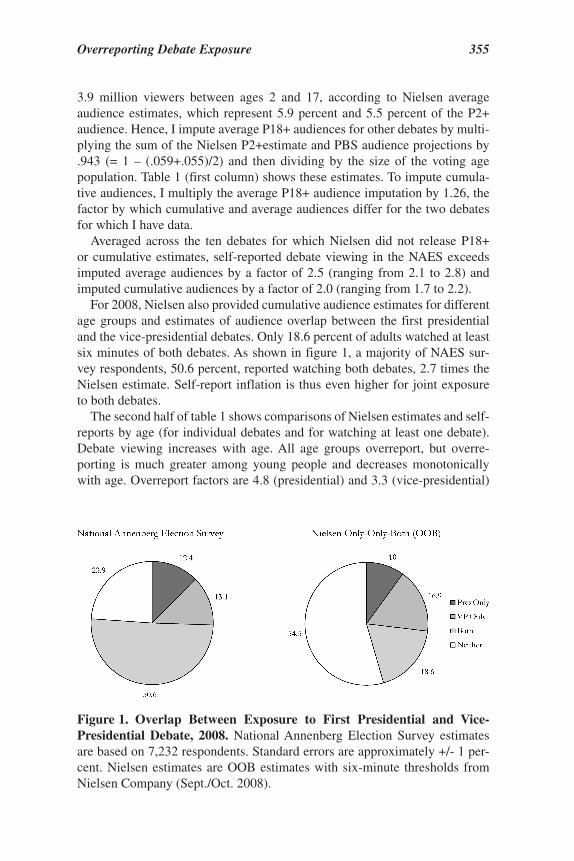
for 2008, Nielsen also provided cumulative audience estimates for different age groups and estimates of audience overlap between the first presidential and the vice-presidential debates. only 18.6 percent of adults watched at least six minutes of both debates. as shown in figure 1, a majority of Naes sur-vey respondents, 50.6 percent, reported watching both debates, 2.7 times the Nielsen estimate. self-report inflation is thus even higher for joint exposure to both debates.
the second half of table 1 shows comparisons of Nielsen estimates and self-reports by age (for individual debates and for watching at least one debate). Debate viewing increases with age. all age groups overreport, but overre-porting is much greater among young people and decreases monotonically with age. overreport factors are 4.8 (presidential) and 3.3 (vice-presidential)
Figure 1. overlap between exposure to First Presidential and Vice-Presidential debate, 2008. National annenberg election survey estimates are based on 7,232 respondents. standard errors are approximately +/- 1 per-cent. Nielsen estimates are oob estimates with six-minute thresholds from Nielsen Company (sept./oct. 2008).
356 Prior
among adults under 25. omission of online debate viewing probably affects young people the most, yet greater overreporting among younger people has also been observed (for network news) at a time (in 2000) when newscasts were not yet available online (Prior 2009a).
the temporal consistency of self-reported debate audiences
Due to lack of information about the quality of Nielsen’s sample and the reli-ability of its tracking method, skeptics might dismiss a mismatch between self-reports and Nielsen data as an indication of low validity of the Nielsen benchmark. a second approach therefore assesses validity of self-reported debate viewing without relying on external benchmarks.
Naes surveys were conducted as rolling cross-sections. by randomly releasing new phone numbers every day and retrying those that did not gen-erate contacts for an equal number of days, this design yields independent random daily samples because “the date on which a respondent is interviewed is as much a product of random selection as the initial inclusion of the respond-ent in the sample” (Johnston and brady 2002, p. 283). if respondents reported their debate exposure accurately, the daily means should be statistically indis-tinguishable because time of interview does not affect true exposure.
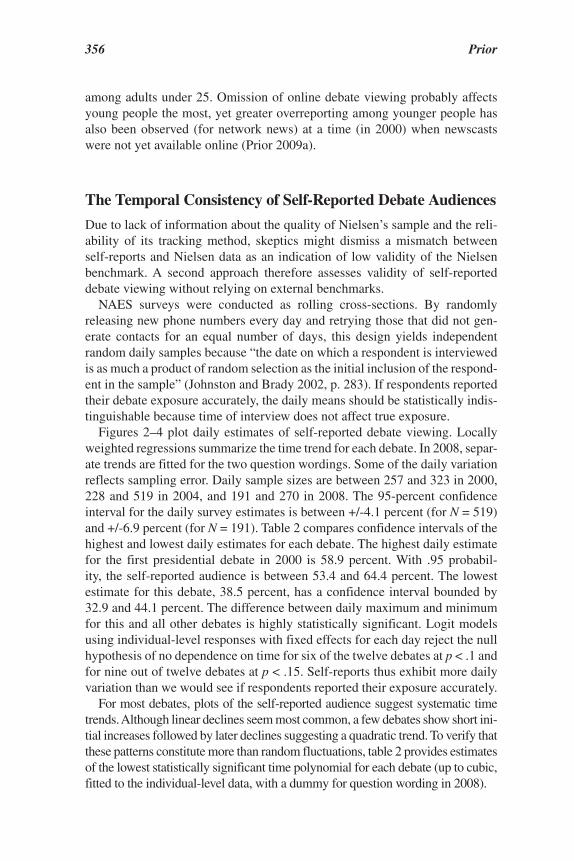
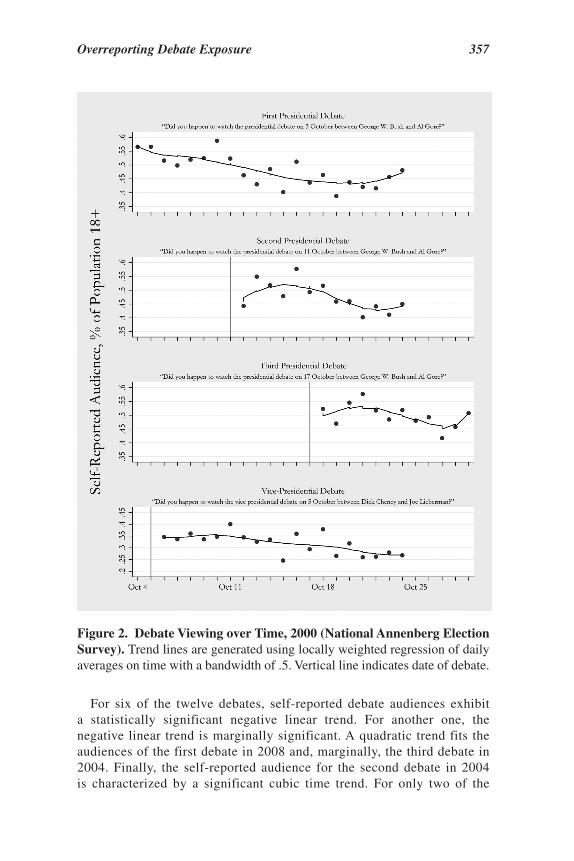
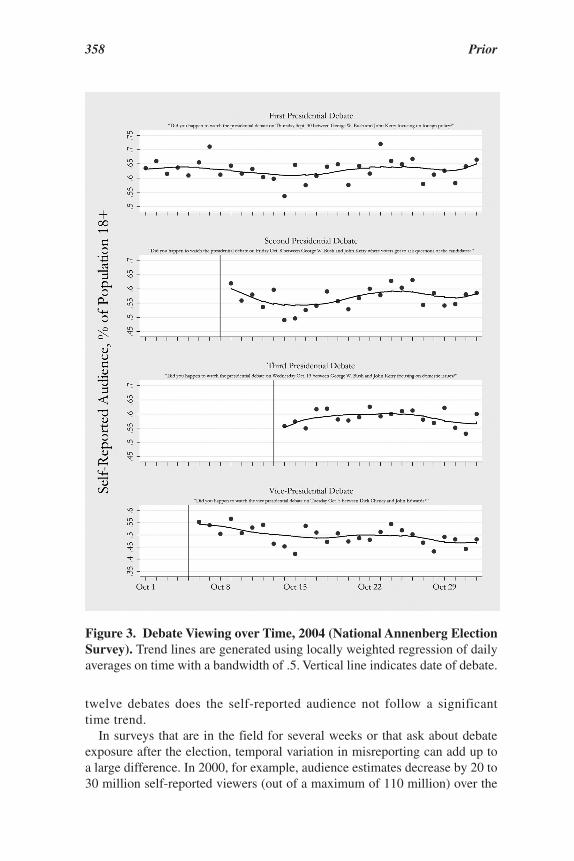
figures 2–4 plot daily estimates of self-reported debate viewing. locally weighted regressions summarize the time trend for each debate. in 2008, separ-ate trends are fitted for the two question wordings. some of the daily variation reflects sampling error. Daily sample sizes are between 257 and 323 in 2000, 228 and 519 in 2004, and 191 and 270 in 2008. the 95-percent confidence interval for the daily survey estimates is between +/-4.1 percent (for N = 519) and +/-6.9 percent (for N = 191). table 2 compares confidence intervals of the highest and lowest daily estimates for each debate. the highest daily estimate for the first presidential debate in 2000 is 58.9 percent. With .95 probabil-ity, the self-reported audience is between 53.4 and 64.4 percent. the lowest estimate for this debate, 38.5 percent, has a confidence interval bounded by 32.9 and 44.1 percent. the difference between daily maximum and minimum for this and all other debates is highly statistically significant. logit models using individual-level responses with fixed effects for each day reject the null hypothesis of no dependence on time for six of the twelve debates at p < .1 and for nine out of twelve debates at p < .15. self-reports thus exhibit more daily variation than we would see if respondents reported their exposure accurately.
for most debates, plots of the self-reported audience suggest systematic time trends. although linear declines seem most common, a few debates show short ini-tial increases followed by later declines suggesting a quadratic trend. to verify that these patterns constitute more than random fluctuations, table 2 provides estimates of the lowest statistically significant time polynomial for each debate (up to cubic, fitted to the individual-level data, with a dummy for question wording in 2008).
Overreporting Debate Exposure 357
for six of the twelve debates, self-reported debate audiences exhibit a statistically significant negative linear trend. for another one, the negative linear trend is marginally significant. a quadratic trend fits the audiences of the first debate in 2008 and, marginally, the third debate in 2004. finally, the self-reported audience for the second debate in 2004 is characterized by a significant cubic time trend. for only two of the
Figure 2. debate Viewing over time, 2000 (national annenberg election survey). trend lines are generated using locally weighted regression of daily averages on time with a bandwidth of .5. Vertical line indicates date of debate.
358 Prior
twelve debates does the self-reported audience not follow a significant time trend.
in surveys that are in the field for several weeks or that ask about debate exposure after the election, temporal variation in misreporting can add up to a large difference. in 2000, for example, audience estimates decrease by 20 to 30 million self-reported viewers (out of a maximum of 110 million) over the
Figure 3. debate Viewing over time, 2004 (national annenberg election survey). trend lines are generated using locally weighted regression of daily averages on time with a bandwidth of .5. Vertical line indicates date of debate.

Overreporting Debate Exposure 359
Figure 4. debate Viewing over time, 2008 (national annenberg election survey). trend lines are generated using locally weighted regression of daily averages on time with a bandwidth of .8. solid vertical lines indicate date of debate. Dashed vertical red lines indicate change in question wording (see the online appendix). starting october 22, Naes asked, “Which of the following election debates, if any, have you watched?” and then cycled through the four debates, accepting a separate answer for each.

360 Prior
tabl
e 2.
tem
pora
l dep
ende
nce
of s
elf-
rep
orte
d d
ebat
e V
iew
ing,
nat
iona
l ann
enbe
rg e
lect
ion
surv
ey
l
owes
t Dai
ly M
ean
hig
hest
Dai
ly M
ean
low
est-
sign
. tim
e Po
lyno
mia
l
2000
fi
rst
38.5
[32
.9; 4
4.1]
58.9
[53
.4; 6
4.4]
lin
ear:
χ2 (
1) =
30.
0, p
= .0
00
seco
nd39
.5 [
33.9
; 45.
1]56
.9 [
51.0
; 62.
8]l
inea
r: χ
2 (1)
= 1
0.2,
p =
.001
t
hird
41.6
[36
.2; 4
7.0]
57.5
[51
.8; 6
3.1]
lin
ear:
χ2 (
1) =
3.9
, p =
.05
V
P24
.4 [
19.6
; 29.
1]39
.8 [
34.4
; 45.
2]l
inea
r: χ
2 (1)
= 1
8.0,
p =
.000
2004
fi
rst
53.6
[48
.2; 5
9.1]
72.2
[67
.6; 7
6.8]
n.s.
se
cond
49.0
[43
.6; 5
4.4]
63.2
[58
.0; 6
7.7]
Cub
ic: χ2
(3)
= 9
.0, p
= .0
3
thi
rd53
.0 [
48.7
; 57.
3]62
.6 [
57.3
; 67.
9]Q
uadr
atic
: χ2
(2)
= 3
.9, p
= .1
4
VP
42.2
[35
.7; 4
8.6]
56.7
[51
.1; 6
2.1]
lin
ear:
χ2 (
1) =
8.1
, p =
.004
2008
For
mat
1F
orm
at 2
For
mat
1F
orm
at 2
firs
t53
.8 [
47.1
; 60.
4]57
.9 [
51.7
; 64.
0]67
.4 [
61.2
; 73.
5]74
.7 [
68.7
; 80.
7]Q
uadr
atic
: χ2
(2)
= 1
0.9,
p =
.004
se
cond
56.2
[49
.8; 6
2.6]
49.6
[43
.4; 5
5.6]
69.4
[63
.2; 7
5.5]
70.4
[64
.7; 7
6.1]
n.s.
t
hird
53.8
[47
.3; 6
0.2]
52.4
[45
.7; 5
9.2]
68.7
[63
.0; 7
4.3]
65.6
[59
.5; 7
1.7]
lin
ear:
χ2 (
1) =
1.6
, p =
.21
V
P57
.8 [
51.2
; 64.
2]51
.5 [
45.4
; 57.
5]74
.5 [
68.9
; 80.
2]66
.1 [
60.2
; 72.
0]l
inea
r: χ
2 (1)
= 1
1.7,
p =
.001
Not
e.—
Cel
l ent
ries
are
mea
ns w
ith 9
5-pe
rcen
t con
fide
nce
inte
rval
s in
bra
cket
s. in
the
2008
Na
es,
the
form
at o
f the
deb
ate
ques
tions
cha
nged
on
oct
ober
22.
for
ea
ch o
f th
e fo
ur d
ebat
es, 3
,071
res
pond
ents
ans
wer
ed th
e qu
estio
n in
the
seco
nd f
orm
at. e
stim
ates
of
func
tiona
l for
m f
or 2
008
incl
ude
a du
mm
y fo
r qu
estio
n fo
rmat
.
Overreporting Debate Exposure 361
course of three weeks. for the three vice-presidential debates, regressing peo-ple’s self-reported debate viewing on a linear time trend generates statisti-cally significant logit coefficients between -.009 and -.032. for every week that passes between the debate and the self-report, the probability of reporting debate exposure thus declines by about .04.
there is no indication that the variation in self-reports is caused by sys-tematic differences in the composition of the sample. Polynomial time trends to predict education and age yield non-significant fits up to cubic. the share of registered voters or respondents who cast a vote in a primary did not vary significantly as a function of interview date, either. the most likely expla-nations for the significant time dependence of self-reported debate exposure thus involve changing recall, modified estimation rules, or varying social- desirability pressure.
conclusion
for every survey respondent who correctly reports exposure to a presidential debate, there is one who claims to have watched but did not in fact do so. for young adults, overreporting is considerably higher yet. there are several rea-sons, unmeasured online viewing among them, to doubt any precise estimate of overreporting, yet the magnitude of the mismatch between self-reports and Nielsen data is so large that nibbling around the edges does little to question the bottom line: surveys dramatically exaggerate debate viewing.
serious doubts about validity of self-reported campaign exposure also emerge from the rolling cross-section design of the National annenberg election survey. independent random samples—drawn and interviewed according to the same procedures—provide widely divergent estimates of exposure to the same campaign event. the average difference between the highest and lowest daily estimates for a debate is 17 percentage points. averaged across debates, the daily high exceeds the daily low by 40 percent. these differences are much too large to be explained by sampling error alone.
if self-reports of debate viewing were valid, they would not depend on the date of the interview. however, independent random samples yield estimates of the same debate audience that drop by up to 30 million viewers over a few weeks. at first glance, one might conclude that waiting a few weeks helps reduce the overreport problem, but it is entirely possible that people who actually watched the debate become less likely to say they did. the nega-tive time trends are inconsistent with the claim that some respondents who did not see a debate use the question to report exposure to debate excerpts in later news reports, through social media, or on the internet. the opposite is true for most debates examined here: self-reports are highest right after a debate.

362 Prior
low validity of self-reported debate exposure challenges conclusions about debate impact derived from survey research. if those who falsely report debate exposure learn about candidates from other campaign events, surveys might incorrectly credit debates with voter education. if the overreporters have little political information and change vote intention more frequently than actual viewers, studies using self-reports will underestimate learning effects and overestimate effects on candidate preference.
other studies of debate impact forego self-reports of exposure and instead compare candidate support before and after a debate (e.g., holbrook 1996, pp. 106–14; shaw 1999). these aggregate estimates are not strictly estimates of debate impact and cannot distinguish between competing explanations for a before/after shift in vote intention. Did a debate change viewers’ opinions? Did post-debate analysis affect vote intention of viewers and non-viewers alike? or did other events that occurred at about the same time cause the before/after shift? arbitrating between different causal explanations requires meas-uring debate exposure without bias. understanding the bias better—through techniques such as list experiments and baseline primes (see Miller 1984; Prior 2009b), for example—is a first step. ultimately, increasing validity of self-reports may require automatically and unobtrusively recording media exposure of survey respondents.
supplementary data
supplementary data are freely available online at http://poq.oxfordjournals.org/.
references
ansolabehere, stephen, and shanto iyengar. 1998. “Message forgotten: Misreporting in surveys and the bias toward Minimal effects.” unpublished manuscript.
baum, Matthew a., and samuel Kernell. 1999. “has Cable ended the golden age of Presidential television?” American Political Science Review 93(1):99–114.
belli, robert f., Michael W. traugott, Margaret Young, and Katherine a. Mcgonagle. 1999. “reducing Vote overreporting in surveys: social Desirability, Memory failure, and source Monitoring.” Public Opinion Quarterly 63(1):90–108.
benoit, W. l., and g. J. hansen. 2004. “Presidential Debate Watching, issue Knowledge, Character evaluation, and Vote Choice.” Human Communication Research 30(1):121–44.
bernstein, robert, anita Chadha, and robert Montjoy. 2001. “overreporting Voting: Why it happens and Why it Matters.” Public Opinion Quarterly 65(1):22–44.
bradburn, Norman M., lance J. rips, and steven K. shevell. 1987. “answering autobiographical Questions: the impact of Memory and inference on surveys.” Science, (april 10):157–61.
brown, Norman r., and robert C. sinclair. 1999. “estimating Number of lifetime sexual Partners: Men and Women Do it Differently.” Journal of Sex Research 36(3):292–97.
burton, scot, and edward blair. 1991. “task Conditions, response formulation Processes, and response accuracy for behavioral frequency Questions in surveys.” Public Opinion Quarterly 55(1):50–79.
Conrad, frederick g., Norman r. brown, and erin r. Cashman. 1998. “strategies for estimating behavioral frequency in survey interviews.” Memory 6(4):339–66.

Overreporting Debate Exposure 363
fridkin, K. l., P. J. Kenney, s. a. gershon, K. shafer, and g. s. Woodall. 2007. “Capturing the Power of a Campaign event: the 2004 Presidential Debate in tempe.” Journal of Politics 69(3):770–85.
hadaway, C. Kirk, Penny long Marler, and Mark Chaves. 1993. “What the Polls Don’t show: a Closer look at u.s. Church attendance.” American Sociological Review 58(6):741–52.
———. 1998. “overreporting Church attendance in america: evidence that Demands the same Verdict.” American Sociological Review 63(1):122–30.
holbert, r. l. 2005. “Debate Viewing as Mediator and Partisan reinforcement in the relationship between News use and Vote Choice.” Journal of Communication 55(1):85–102.
holbrook, allyson l., and Jon a. Krosnick. 2010. “social-Desirability bias in Voter turnout reports: tests using the item Count and randomized response technique.” Public Opinion Quarterly 74:37–67.
holbrook, thomas M. 1996. Do Campaigns Matter? thousand oaks, Ca: sage Publications.Johnston, richard, and henry e. brady. 2002. “the rolling Cross-section Design.” Electoral
Studies 21(2):283–95.Kenski, K., and N. J. stroud. 2005. “Who Watches Presidential Debates? a Comparative
analysis of Presidential Debate Viewing in 2000 and 2004.” American Behavioral Scientist 49(2):213–28.
Menon, geeta. 1993. “the effects of accessibility of information in Memory on Judgments of behavioral frequencies.” Journal of Consumer Research 20(3):431–40.
Miller, Judith D. 1984. “a New survey technique for studying Deviant behavior.” Doctoral dissertation, george Washington university, Washington, DC.
Nielsen Company. 2008. “Nielsen examines the tV Viewership to the Presidential and VP Debates.” http://blog.nielsen.com/nielsenwire/wp-content/uploads/2008/10/2008-debate-tv-ratings-analysis-final.pdf.
Presser, stanley. 1990. “Can Changes in Context reduce Vote overreporting in surveys?” Public Opinion Quarterly 54:586–93.
Price, Vincent, and John Zaller. 1993. “Who gets the News? alternative Measures of News reception and their implications for research.” Public Opinion Quarterly 57(2):133–64.
Prior, Markus. 2009a. “the immensely inflated News audience: assessing bias in self-reported News exposure.” Public Opinion Quarterly 73(1):130–43.
———. 2009b. “improving Media effects research through better Measurement of News exposure.” Journal of Politics 71(3):893–908.
romer, Daniel, Kate Kenski, Ken Winng, Christopher adasiewicz, and Kathleen hall Jamieson. 2006. Capturing Campaign Dynamics 2000 & 2004: The National Annenberg Election Survey. Philadelphia: university of Pennsylvania Press.
schwarz, Norbert. 1999. “self-reports: how the Questions shape the answers.” American Psychologist 54(2):93–105.
schwarz, Norbert, and Daphna oyserman. 2001. “asking Questions about behavior: Cognition, Communication, and Questionnaire Construction.” American Journal of Evaluation 22(2):127–60.
shaw, D. r. 1999. “a study of Presidential Campaign event effects from 1952 to 1992.” Journal of Politics 61(2):387–422.
stelter, brian. 2008. “record audience for Debate.” New York Times, oct. 4 Vavreck, lynn. 2007. “the exaggerated effects of advertising on turnout: the Dangers of
self-reports.” Quarterly Journal of Political Science 2(4):287–305.