whp cruise summary information - cchdowhp cruise and data information instructions: click on...
TRANSCRIPT

A. Cruise Narrative: A06 and A07
A.1. Highlights
.129 .139
.149
.159
.169 .179 .189 .199
.209
.219
.9.19
.29
.39
.49
.59
.69
.79
.89
.99
.109
.119
A07
A06
A06A07
WHP Cruise Summary Information
WOCE section designation A07 A06Expedition designation (EXPOCODE) 35A3CITHER1_1 35A3CITHER1_2
Chief Scientists and their affiliation Alain Morliere/ORSTOM Christian Colin/ORSTOMDates 1993.01.02 – 1993.02.10 1993.02.13 - 1993.03.19
Ports of call Pointe Noire (Congo)JAN 2
Natal (Brazil)JAN 23
Cayenne (French Guiana)FEB 10
CayenneFEB 13
Abidjan (Ivory Coast)MAR 08
Pointe NoireMAR 19
Geographic boundaries7° 30.09'N
35° 8.02'W 10° 50.39'E4° 47.94'S
8˚ 1.95'N51° 19.5W 3° 48.59'W
4° 0.02'S
Ship L'ATALANTENumber of stations 224 (total, both legs)
Floats and drifters deployed noneMoorings deployed or recovered none
Contributing Authors (In order of appearance): T. Mueller A. Billant M. Arhan
Alain MorliereInstitut Français de Recherche Scientifique pour le Developpement en Cooperation (ORSTOM)currently at: Universite Pierre et Marie Curie (Paris 6) • Tour 14 2eme Etage • 4 Place Jussieu
Paris Cedex 05, 75252 • FRANCE • FAX: 33-1-44-27-3805
Christian ColinInstitut Français de Recherche Scientifique pour le Developpement en Cooperation (ORSTOM)
P.O. Box 165 • Cayenne Cedex, 97323 • FRENCH GUIANATEL: 594-302-785 • FAX: 594-319-855

WHP Cruise and Data Information
Instructions: Click on headings below to locate primary reference or use navigation toolsabove. (Shaded headings were not available when this report wasassembled)
Cruise Summary Information Hydrographic Measurements
Description of scientific program CTD DataCTD - general
Geographic boundaries of the survey CTD - pressureCruise track (figure) CTD - temperatureDescription of stations CTD - conductivity/salinityDescription of parameters sampled CTD - dissolved oxygenBottle depth distributions (figure)Floats and drifters deployed Bottle DataMoorings deployed or recovered Salinity
OxygenPrincipal Investigators for all measurements NutrientsCruise Participants CFCs
HeliumProblems and goals not achieved TritiumOther incidents of note Radiocarbon
CO2 system parametersUnderway Data Information Other parameters
Navigation DQE ReportsBathymetryAcoustic Doppler Current Profiler (ADCP) CTDThermosalinograph and related measurements S/O2/nutrientsXBT and/or XCTD CFCsMeteorological observations 14CAtmospheric chemistry data
Acknowledgments References Data Processing Notes

80˚W
80˚W
70˚W
70˚W
60˚W
60˚W
50˚W
50˚W
40˚W
40˚W
30˚W
30˚W
20˚W
20˚W
10˚W
10˚W
0˚
0˚
10˚E
10˚E
20˚E
20˚E
30˚E
30˚E
30˚S 30˚S
20˚S 20˚S
10˚S 10˚S
0˚ 0˚
10˚N 10˚N
20˚N 20˚N
30˚N 30˚N
.129
.139
.149
.159
.169
.179
.189 .199
.209
.219
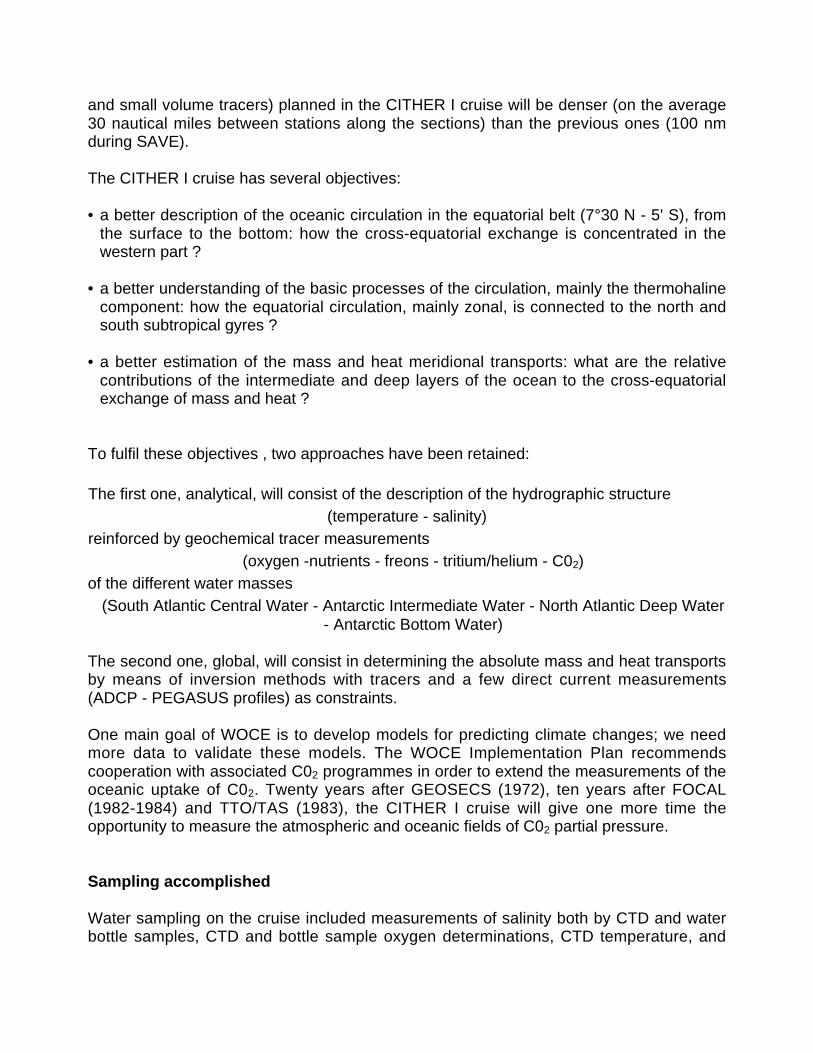
Station locations for A06 : MORLIERE
Station Locations for A06 and A07, C. Oudot, 1993
Produced from .sum file by WHPO-SIO
.9.19.29.39.49.59.69.79.89.99
.109
.119
A07
A06
A06A07

Cruise Summary
Cruise Track
The cruise track and station locations are shown above.
Scientific Goals
An important question, which directly influences the climate changes, is the northwardredistribution of the excess of heat flux gained at the low latitudes. The Atlantic ocean isunique compared to the Pacific and Indian Oceans because it receives heat from thesetwo oceans. The northward heat transport is large according to the 3D-model of Philanderand Pacanovski (1986). It mainly crosses the equator along the western boundary, andbecause of the size of the equatorial Atlantic belt it is easier for the observation.
Intensive studies of the surface circulation devoted to the tropical Atlantic ocean tookplace few years ago through international or national experiments: GATE (1974), FGGE(1979), recently FOCAL/SEQUAL (1983-1984) and TOGA (since 1985). At the presenttime, STACS/NOE programme, carried out in the western area, leads to a betterdescription (time and space scales) of the intermediate and deep circulation along thewestern boundary However the estimation of mass and heat inter-hemispheric transportsrequires transects of hydrography and geochemical tracers observations over the entireequatorial area, from the sea surface to the bottom, in order to characterize (qualitativelyand quantitatively) the water masses, which are involved in the cross-equatorial fluxes ofmass and heat.
Among all the water masses, the North Atlantic Deep Water is the main component of the"cold water" system of the global oceanic circulation, according to the thermoclinecirculation cell associated with NADW production (Gordon, 1996). This water mass,issued from the two northern sites (Labrador Sea and Greenland Sea - Norwegian Seaoverflow), spreads to the south, between 1000 and 4000 in depth in connection with thedeep western boundary current. A large part of this water mass crosses the equator andflows on along the south American shelf, but tracer distributions (oxygen, nutrients, freons)suggest an eastward spreading of NADW along the equator. There must be acompensating flow of upper layer moving northward to compensate NADW production.According to Gordon (1996), this continuity is accomplished primarily within the oceanwarm water thermocline layer (Pacific to Indian flow within Indonesian Seas, then entryinto South Atlantic by Agulhas Current), the Pacific to Atlantic transport of Subantarcticwater ("cold water route") through the Drake Passage being considered of secondaryimportance. The information on the cross-equatorial fluxes of all these water masses areeasy to be computed in the equatorial Atlantic ocean.
Knowledge on the intermediary and deep circulation in this part of the ocean are drawnfrom German cruise (Wüst, 1935), IGY cruise (1958) and American cruises (GEOSECS,1972 - TTO and AJAX, 1983 - SAVE, 1986-1987). The network of stations (hydrography
and small volume tracers) planned in the CITHER I cruise will be denser (on the average30 nautical miles between stations along the sections) than the previous ones (100 nmduring SAVE).
The CITHER I cruise has several objectives:
• a better description of the oceanic circulation in the equatorial belt (7°30 N - 5' S), fromthe surface to the bottom: how the cross-equatorial exchange is concentrated in thewestern part ?
• a better understanding of the basic processes of the circulation, mainly the thermohalinecomponent: how the equatorial circulation, mainly zonal, is connected to the north andsouth subtropical gyres ?
• a better estimation of the mass and heat meridional transports: what are the relativecontributions of the intermediate and deep layers of the ocean to the cross-equatorialexchange of mass and heat ?
To fulfil these objectives , two approaches have been retained:
The first one, analytical, will consist of the description of the hydrographic structure(temperature - salinity)
reinforced by geochemical tracer measurements(oxygen -nutrients - freons - tritium/helium - C02)
of the different water masses(South Atlantic Central Water - Antarctic Intermediate Water - North Atlantic Deep Water
- Antarctic Bottom Water)
The second one, global, will consist in determining the absolute mass and heat transportsby means of inversion methods with tracers and a few direct current measurements(ADCP - PEGASUS profiles) as constraints.
One main goal of WOCE is to develop models for predicting climate changes; we needmore data to validate these models. The WOCE Implementation Plan recommendscooperation with associated C02 programmes in order to extend the measurements of theoceanic uptake of C02. Twenty years after GEOSECS (1972), ten years after FOCAL(1982-1984) and TTO/TAS (1983), the CITHER I cruise will give one more time theopportunity to measure the atmospheric and oceanic fields of C02 partial pressure.
Sampling accomplished
Water sampling on the cruise included measurements of salinity both by CTD and waterbottle samples, CTD and bottle sample oxygen determinations, CTD temperature, and

nutrients (silicate, phosphate, nitrate, nitrite). Tracer analyses were made for CFC-11 andCFC-12 as well as sampling for tritium/helium.
Besides water sampling was made for measurements of CO2 system parameters (TCO2,pH, fugacity of CO2), dissolved gases (nitrogen, argon, methane and nitrous oxide).
Type and number of stations
During the two legs of the cruise a total of 224 CTDO/Rosette stations were occupiedusing a 32-bottle IFREMER rosette equipped with 8 liters PVC water sampling bottles.
The usual spacing of stations was 30 nm, except over the continental slope (4 to 5 nm)and the abyssal plains (40 nm).
List of Principal Investigators
The parameters with the principal investigators and their affiliation are listed in Table 1.
Table 1: List of measured parameters and the Principal Investigators for each.
Parameters Sampling Group Principal InvestigatorCTDO2 / Rosette LPO/IFREMER-Brest M. Arhan / H. MercierS, O2 LPO/IFREMER-Brest M. Arhan / H. Mercier
ORSTOM-Brest C. OudotNO3, NO2, PO4, Si(OH)4
LOC/UBO-Brest P. MorinCFC-11, CFC-12 ORSTOM/LODYC-Paris C. AndrieTritium, Helium LMCE-Saclay P. Jean-BaptisteCO2 system ORSTOM-Brest C. OudotDissolved gases (N2, Ar) ORSTOM-Brest C. OudotTrace gases (N2O, CH4) LOC/UBO-Brest M. Guevel
ORSTOM/LODYC-Paris A. MorliereADCPLPO/IFREMER-Brest H. MercierIfM-Kiel F. SchottPEGASUSORSTOM-Cayenne C. Colin

Preliminary results
The R/V L'ATALANTE departed Pointe Noire, Congo for the WHP Section A7 on January2nd, 1993. The first station near 5˚04 N, 10˚40 E (bottom depth = 2100 m) was to test oneof the two CTD systems and its rosette water sampling equipment. The CTDs are EG&GNeil Brown Mark III equipped with Beckman dissolved oxygen sensor. The first CTDequipment was replaced by the second one at station 83 (January 29, 1993) owing toproblems with the conductivity sensor. All the CTD temperature, pressure andconductivity sensors were calibrated at the IFREMER calibration facility both before andafter the cruise. The conductivity and oxygen sensors were also calibrated at sea usingdata from the analyses of the salinity and oxygen samples collected at each station.Water samples were collected from 32 PVC sampler bottles (capacity 8 liters)) mountedon the two-storied IFREMER Rosette sampler. The water sample conductivitymeasurements and oxygen titrations were made in a constant temperature (20˚C) portablelaboratory.
Additional samples were also collected from each PVC bottle for the shipboard analysis ofnutrients (silicate, phosphate, nitrate, nitrite) and chlorofluorocarbons CFC-11 and CFC-12(every other station until station number 66, every station beyond and until the laststation). Helium and tritium samples were also collected at many of the stations (a total of58): the analysis of these samples will be later carried out in a shore-based laboratory.
Other samples were also collected from PVC bottles for the shipboard analysis ofdissolved gases (nitrogen - argon - total CO2 - methane and nitrous oxide) and thedetermination of pH and fugacity of CO2 (in surface water and in atmosphere). Thephytoplankton biomass (chlorophyll) was also sampled for shore-based analysis.
Underway ADCP and thermosalinograph data were recorded along the track of the ship(10 154 nm). Twelve PEGASUS profilings were done near the western coast in theboundary currents.
Problems
During the first leg (station number 83) we must have to replace the CTD system: shift andnoises of the conductivity sensor. The second CTD system will be used until the end ofthe cruise without problems.
Through the cruise we used successively three Guildline salinometers: one Autosal andtwo Portasal. The problems were a shift of the calibration between the stations; or driftwithin a series of measurements. The later acquired Portasal model has given the bestresults and was used to measure all the salinities during the leg 2.
With the analytical measurements of the tracers, the most serious problem was the CFCcontamination from the PVC sampling bottles, mainly due to the grease of the stopcocks.A few special stations (5) were made to test the contamination's, by closing all the bottles

at the same depth where the CFC concentrations were the lowest (generally around 2500m depth). The mean contamination is estimated to about 0.005 ± 0.002 pmol/l for F-12and to about 0.008 ± 0.002 pmol/l for F-11.
STATION SUMMARY
The station positions, time, etc are tabulated in a summary file. This file (CITHER1.SUM)is reported on attached pages (numbered 1 to 12) and on attached floppy disk in MS-DOSformat (ASCII characters).
The parameter numbers are defined in Table 3.

Table 2: Cruise participants
Participants Role Affiliation LegChantal Andrie CFCs ORSTOM/LODYC-Paris 1 2Michel Arhan CTDO2 LPO/IFREMER-Brest 1Sabine Arnault Tritium, Helium ORSTOM/LODYC-Paris 2François Baurand Nutrients ORSTOM-Brest 1 2Andre Billant S, O2 LPO/IFREMER-Brest 2Jean-Michel Bore CTDO2 ORSTOM-Cayenne 1 2Bernard Bourles CTDO2 ORSTOM-Cayenne 1 2Pierre Branellec S, O2 LPO/IFREMER-Brest 1Elisabete Braga Oxygen IOUSP-Sao Paulo 2Remy Chuchla Oxygen ORSTOM-Cayenne 1Souleymane Cissoko CTDO2 CRO-Abidjan 2Christian Colin Chief Scientist, Pegasus ORSTOM-Cayenne 2Daniel Corre CTDO2 ORSTOM-Brest 2François Dangu Salinity - CTDO2 ORSTOM-Cayenne 1 2Nathalie Daniault CTDO2 LPO/IFREMER-Brest 1Andre Dapoigny Tritium, Helium LMCE/CEN-Saclay 1Alain Dessier CO2, N2, Ar ORSTOM-Brest 2Jean-Pierre Girardot CTDO2 LPO/IFREMER-Brest 2Jean-Pierre Gouillou CTDO2 LPO/IFREMER-Brest 1Yves Gouriou CTDO2 ORSTOM-Brest 1 2Stephanie Gueneley Nutrients ORSTOM-Brest 1Mickael Guevel Trace gases LOC/UBO-Brest 1 2Catherine Hemon CTDO2 LPO/IFREMER-Brest 2Philippe Hisard Salinity ORSTOM-Brest 2Philippe Jean-Baptiste Tritium, Helium LMCE/CEN-Saclay 2Milton Kampel CTDO2 INPE-Brazil 1Lamine Keita CTDO2 CERESCOR-Conakry 2Jean-Jacques Lechauve CTDO2 ORSTOM-Brest 1Jerome Lecomte CO2, N2, Ar ORSTOM-Cayenne 1 2Nathalie Lefevre CO2 Fugacity LODYC-Paris 2Jean-François Maguer Nutrients LOC/UBO-Brest 1Jean-François Makaya CTDO2 ORSTOM-Pte Noire 1Laurent Memery CFCs LODYC-Paris 1Herle Mercier CTDO2, ADCP LPO/IFREMER-Brest 2Marie-Jose Messias CFCs LODYC-Paris 2Pascal Morin Nutrients LOC/UBO-Brest 2Alain Morliere Chief scientist, ADCP ORSTOM/LODYC-Paris 1Claude Oudot CO2, N2, Ar ORSTOM-Brest 1 2Christophe Peignon CO2, N2, Ar ORSTOM-Lome 1Jean-Paul Rebert Tritium, Helium ORSTOM-Brest 1Joerg Reppin Pegasus IFM-Kiel 1Birane Samb CTDO2 CRO-Dakar 2Jean-François Ternon CFCs ORSTOM-Brest 1 2Mohideen Wafar Nutrients LOC/UBO-Brest 1

Table 3: Parameter numbers in the CITHER1.SUM file
Parameter No. name
WOCEmnemonic
Units
1 Salinity SALNTY PSS-782 Oxygen OXYGEN µmol/kg3 Silicate SILCAT µmol/kg4 Nitrate NITRAT µmol/kg5 Nitrite NITRIT µmol/kg6 Phosphate PHSPHT µmol/kg7 Freon-11 CFC-11 pmol/kg8 Freon-12 CFC-12 pmol/kg9 Tritium TRITUM Tritium units
10 Helium HELIUM nmol/kg11 Helium DELHE3 %
15 Argon ARGON nmol/kg
23 Total carbon TCARBN µmol/kg24 Total alkalinity ALKALI µmol/kg25 Partial pressure of CO2 PCO2 µatm26 pH pH none
31 Methane CH4 nmol/kg32 Nitrogen (dissolved organic) DON µumol/kg33 Nitrous oxide N2O nmol/kg34 Chlorophyll a CHLORA µg/kg35 Phaeophytin PPHYTN µg/kg

Data Quality Expert (DQE) Report on CTD O2 Data(Thomas J. Müller*)02 Oct, 1996
*Institut für Meereskundean der Universität Kiel
Duesternbrooker Weg 2024105 KIEL, Germany
e-mail: [email protected]
Introduction
The French written cruise report consists of four volumes:• Volume 1 with general cruise information. Also, procedures of calibration and
processing of 'En Route' data, ship borne ADCP, and some PEGASUS stations aredescribed.
• Volume 2 (Le Groupe CITHER-1, 1994) with a description of CTD-O2 data calibration,processing and extensive hard copy displays.
• Volumes 3 and 4 with geochemical measurements.
Also, an English written cruise report is available at the WHPO (6 pages plus -.SUM file).
The present DQE report deals with the CTD-O2 data from A6 and A7. It consists of threeparts:
(A) A brief summary of the French written A6/A7 CTD-O2 data report (Le GroupeCITHER-1, 1994; GC1 henceforth) which describes the procedures of laboratorycalibrations, data acquisition and processing, in-situ calibrations and verifications.Along with this summary, I have included (and flagged as such) some comments atthe end of sections where appropriate. No figures and tables are available inelectronic form from the above report, and therefore reference is made to figures andtables as they appear in the report.
(B) A report of evaluation of the A6 and A7 CTD-O2 data as they were available at theWHP-O in September 1996.
(C) Recommendations

Part A.
Campagne CITHER-1 of R/V L'ATALANTE (2 janvier-19 mars 1993). Recueil de donnees,Volume 2: CTD-O2
(English summary by DQE with comments added at ends of sections; sections, figuresand tables are numbered as in the French report)
I The CITHER-1 Group
To obtain WOCE one time zonal sections A6 (along 07N30') and A7 (04S30') is oneamong other French contributions to WOCE. The cruise in 1993 was divided into twolegs. In addition to stations along A6 and A7, two meridional sections were obtainedbetween A6 and A7, along 035˚W and 004˚W.
PI's for CTD-O2/rosette were Michel Arhan (leg 1) and Herle Mercier (leg 2); see Table 1in the report for other PI's.
II Cruise participants with respect to CTD-O2 work
see Table 2
III Calibration of CTD-O2 measurements(A. Billant and P. Branellec, LPO)
1. Acquisition of CTD-O2 dataA total of 223 stations with two Mark III CTD-O2 systems were obtained along with a 36x8 lbottle rosette PASH 6000 developed by LPO. For locations of stations see Figure 1.
Major events
(i) Section A7 was interrupted westbound after Stat. 77 before the vessel entered the200 nm EEZ of Brazil. Prior to continuing A7, L'ATALANTE had to call port ofNatal, Brazil, to pick up a Brazilian observer. Five days later, A7 was continuedwith Stat. 78 as repeat station on the position of Sta. 77.
(ii) The first CTD-O2, S/N 2521, was replaced due to problems with the conductivitysensor after Stat. 82 by the second CTD-O2, S/N 2782.
(iii) Stations 27, 75, 118 and 190 were taken in between WHP stations, with bottlebeing closed at special depths for calibration and test purposes.
Data acquisition and processing
The CTD's data cycles were transferred to the computer at a 32 Hz rate and on-lineprocessed. Processed data then were stored on magnetic tape. Two steps of processingwere applied. First, each data value was compared with the one in the preceding cycle. If

the absolute difference of a value to the preceding one exceeded a certain amount (seetable below), the complete cycle was omitted. The parameters for this comparison were:
Pressure 0.5 dbarTemperature 0.032 K for pressure < 1500 dbar
0.005 K for pressure > 1500 dbarConductivity 0.032 mS/cm for pressure < 1500 dbar
0.005 mS/cm for pressure > 1500 dbarOxygen curr. 0.010 UAOxygen temp. 0.3 K
Next, cycles were averaged in pressure intervals. The intervals were chosen such that ofall data cycles at least 25% were kept as 'good' and contribute to the average. For alowering speed of 1 m/s, this means that at least 8 cycles contribute to an average over 1dbar.
Only, lowering profiles are considered.
DQE's comments on section 1:
From the French report, I understand that the original data set is not stored but only the(single value) de-spiked and averaged cycles with no other processing steps beingapplied before or afterwards. If this is true, I see some principal problems with thisprocedure. Although such a procedure may not affect very much CTDs that behave well,and although the non-averaged data may not be available any longer (as I understand thereport), let me describe some steps necessary in processing open sensor CTD data.
(i) the de-spiking method as described above can only recognize single spikes. It alsois problematic in that it compares only with preceding values. If two or more spikesoccur in turn (which to my experience may happen) these are smeared into theaverage during the averaging process; they can never be re-identified, and it ishard to detect and remove such 'bad' averages.
(ii) Bef ore averagin g or low pass filt ering, other impor tant p rocessing st eps ar e perf ormedfor 'open senso r' CTD's by other instit utes like WHOI (se e Yang and Millard , 199xx)and IfM Kiel. They a re not descr ibed f or A6 and A7 . The steps are:
• create (if not already available) a cycle number or time and keep it throughoutthe processing.
• check the (single value) despiked series for further spikes.• apply a low pass filter to the pressure series; this matches the pressure sensor
resolution (0.1 dbar) to the lowering speed which at 1 m/s requires a resolutionof 0.03 dbar.
• monotonize the profile with respect to pressure; conductivity and oxygen sensorrespond quite differently under different lowering speeds. Even better would beto first apply a 'minimum lowering speed' criterion to the profile and thenmonotonizing.

• match the time constants of the (combined) temperature signal and theconductivity sensor. This can be done either 'by eye' looking at salinity spikes insharp gradient regions, or more objectively by looking at the coherence andphase spectra.
• apply a low pass filter to 0.5 dbar response and average on 0.5 dbar intervals.• apply the (static) calibrations for pressure, temperature and conductivity.• apply a low pass filter to 2 dbar response.• apply the correction for the dynamic response of the pressure sensor to
temperature changes• average on 2 dbar intervals• calculate follow up quantities (salinity, pot. temperature, pot. density)• apply the calibration of the oxygen sensor.
2. Sampling
Sampling was done with a 36 x 8 l bottle rosette PASH 6000 developed by LPO. Bottleswere closed on the way up (see Fig. 2, 3). A total of 6269 samples for salinity and 6460samples of analysis of dissolved oxygen were taken. 12 bottles carried reversingtemperature and pressure sensors made by SIS. Samples from bottles were drawnaccording to the instructions in the WOCE operation manual.
DQE's comment on section 2ok
3. Sample analysis for salinity and dissolved oxygen
3.1 Salinity
Samples for salinity were drawn to 125 ml flasks, stored in a constant temperature (20˚C ±1 K) laboratory and analyzed within 20 h to 30 h.
Standard seawater, batch P120 (K15=0.99985) from Wormley by 06 April 1992, was usedto standardize the salinometers. Standardizations were performed before analysis startedeach day. After 36 bottles, standardization was verified and the result noted in a log.Each sample was rinsed three times before measuring and read three times.
Due to stability problems of order 0.003 psu within a series of 36 bottles, salinometerswere changed:
Stat ID Stability 36 samples001 to 010 PORTASAL A 0.001 psu011 to 018 AUTOSAL 8400 B <0.003 psu019 to 119 PORTASAL A 0.001 psu120 to 223 PORTASAL B <0.001 psu

Whenever unstable conditions were observed, standard seawater was used and salinitylinearly corrected for drift.
At four (non-WHP) stations, bottles were closed at same depths to get multiple samplesfor comparison. The maximum deviations from the means were less 0.003 psu. From thefollowing statistics it follows that the precision is better 0.002 psu.
Test stations: Salinity
Stat depth Bottles close Stand. dev27 2000 32 0.000975 4400 26 0.0018
118 2500 27 0.0011190 1000 24 0.0016
Figures 4 and 5 show the results from 275 double samples from pairs of bottles takenthroughout the cruise from the whole water column. Of these, 51% differ by less than0.001 psu, and 85% by less than 0.003 psu. This result is not significantly improved whenonly samples from deeper than 980 dbar are considered.
DQE's comment on section 3.1
All salinity measurements were done and reported thoroughly. As the comparisons ofoxygen measurements (see 3.2 below) from the same test stations with significantlyimproved results from deeper levels show, the relative high value in salinity precisionseems not to be due to mistakes in sampling but to the trouble with drifts in all 3salinometers, rather. Nevertheless, from the high number of samples one may expect agood calibration the CTD's salinities.
3.2 Dissolved Oxygen
Samples for oxygen were drawn after those for CFCs and helium into flasks of 120 ml.Temperature of the sample was measured before rinsing the flask three times. Sampleswere measured along the guidelines of the WOCE Operations Manual in constanttemperature (20˚C ± 1 K) laboratory. The method included to automatically detect theinflection.
Multiple samples from same depths at three test stations show that a precision of 0.01 ml/lis expected.

Test stations: Oxygen
Stat depth Bottles close Stand. dev27 2000 32 0.00375 4400 26 0.007
190 1000 24 0.009
In figures 6 and 7 the results from 297 double samples from pair of bottles throughout thecruise and the water column are displayed. Of all double samples, 39% agree to within0.005 ml/l, and 70% to within 0.015 ml/l. This result is much improved if one restricts tothe 213 samples from depths larger than 980 m: then, even 45% agree to within 0.005ml/l. For depths larger 2480 m, the standard deviation is 0.013 ml/l.
DQE's comment on section 3.2
As the multiple and the double samples show, oxygen measurements meet therequirements of the WHP.
4. CTD pressure sensor calibration
Both CTD's carried a Paine strain gauge sensor. These sensors routinely are calibratedat IFREMER's calibration center which is certified by the 'Bureau National de Metrologie'(BNM). A dead weight tester made by 'Desgranges et Huot' with an accuracy of ± 0.75dbar at 6000 dbar is used.
4.1 Calibration under laboratory conditions (20˚C)
Pre- and post cruise calibrations were made for both CTD's with repeated loading (upperpanels in fig. 8, 9) and unloading (lower panels) cycles. Third order polynomials haveresiduals less 2 dbar.
4.2 Static temperature effects
Pressure sensor temperature was measured during the profiles. Laboratory calibrationsat 7 different temperatures that cover the range are available. The effect is less 5 dbar.The additional corrections are necessary after having applied the 20˚C basic calibrationless than 3 dbar. The inner sensor temperature is modeled for a typical decent andhatched in figure 10.
4.3 Dynamic effects of temperature changes
The dynamic responses to about 20 K temperature shocks were measured in thelaboratory for both CTD's (fig. 11). The corrections applied for CTD profiles assume asingle shock of this order within the thermocline, a lowering speed of 1m/s, 13 minutes atmaximum pressure before the up-profile starts, and a 1 minute stop to close a bottle.

4.4 Corrections of pressure measurements
Taking the 20 C basic 3rd order regressions at the 400 dbar interval calibration points, thecorrections for the effects of both, static and dynamic temperature corrections are added.For the combined effects, a 5th order polynomial regression is applied to all pressuremeasurements (fig. 12, 13: loading mode in upper panels, unloading mode in lowerpanels).
4.5 Verifications after corrections
For both CTDs, the differences at the surface before and after the profile correspondedwell to the overall laboratory calibrations displayed in figures 12 and 13.
Reversing electronic pressure sensors of SIS were used on the up profile. Pre- and postcruise calibrations were performed at 2.5˚C at 7 points between 0 dbar and 6000 dbar.The corrected values of CTD and SIS sensors compare well within 2 dbar which may beassumed to be the overall accuracy of pressure measurements for WHP cruises A6 andA7.
DQE's comment on section 4
Both sensors show a major change in their response characteristics at pressures largerthan 4500 dbar in the post cruise calibration (fig. 8, 9) which appears strange to me.While the pre cruise calibration has the 3rd order polynomial response as it is typical forthe Paine sensor, the post cruise calibrations for both sensors are more or less parabolic.The effect results in an order 3.5 dbar change for CTD2521 at 5400 dbar, which is themaximum pressure during the cruise; the effect is less for CTD2782. I wonder if such achange in the response characteristics found in other sensor calibrations from this periodof time in which case they might indicate a shift in reference rather than CTD sensors.
Hysteresis may depend on the maximum pressure to which the sensor was exposedbefore unloading, with maximum hysteresis being expected at the high end of the range at6000 dbar. During these calibrations, the maximum pressure was kept to 6000 dbar. Thisexcludes check of hysteresis effects at lower maximum pressures. However, sincehysteresis was less than about 1.5 dbar at all pressures this will have a minor effect on thefinal calibration.
The corrections for static temperature responses could better have been applied directlyby linear interpolation since the inner temperature was measured, as I understand.However, the effect will be small, anyway. The same holds for the dynamic response.
All corrections are modeled empirically into one 5th order polynomial for each, loading andunloading mode. As the comparison of corrected CTD pressures with corrected SISpressures shows this method was able to meet the WHP requirements for CTD pressuremeasurements.

5. CTD temperature sensor calibration
The measurements of a high precision Rosemount and that of a fast response NTCresistance are combined to standard MKIIIB temperature output at a resolution of 5 mK.
5.1 Operational mode
CTD temperature sensors are routinely calibrated at IFREMER before and after a cruise.During calibration, the CTD is completely immersed into the temperature stabilizedcalibration bath. Temperature readings are compared to a reference Rosemount sensorwhich ITS90 calibration is traced back on a regular basis to the BNM.
Both CTDs were in use since 1982 with changes in calibration not exceeding 10 mK.While CTD2521 stayed stable during the cruise (fig. 16a), CTD2782 showed a clear offsetof 2 mK at 0˚C and 8 mK at 25˚C (fig. 16b). The uncertainty of CTD2782 is 2 mK up to5˚C, and 4 mK for larger temperatures.
5.2 Verification after correction
Seven reversing electronic thermometers made by SIS and calibrated, both before andafter the cruise, were used throughout the cruise. After the change of CTDs betweenstations 82 and 83, a 'jump' in the difference to all SIS sensors is observed (15 mK ± 1mK) that corresponds well to the difference in the CTD laboratory calibration at 2˚C (16mK; see fig. 17 for temperature range 2.5 to 5˚C and fig 18 for the 1˚C to 2.5˚C range).Final offsets between SIS and CTD are probably due to a pressure effect on the SISsensors.
For stations 1 to 82, accuracy as derived from figures 17 and 18 is of order 1 mK, over thewhole cruise 2 mK.
DQE's comment on section 5
From the calibration curve of CTD2521, its uncertainty seems to be of the order of 1 mK.As for CTD2782, it might be interesting to search for similar 'jumps' in earlier calibrations.
Accuracy of CTD temperatures as estimated from pre- and post cruise calibrations, andfrom comparisons with the seven SIS thermometers seems better than 2 mK, thusmeeting WHP requirements.
6. CTD conductivity sensor in-situ calibration
6.1 Operational mode
The conductivity sensor output is averaged while bottles are closed. This average issubject to the cell's pressure and temperature correction. The result is compared to in-situ

conductivity values as derived from bottle salinities. A first order linear polynomialregression is calculated for stations or groups of stations:
COR=C0 + C1*COS
Outliers are removed until all differences are within 2.8*STDEV, STDEV being thestandard deviation.
6.2 Station grouping
CTD2782 stayed rather stable for large groups of stations. CTD2521, however, needed astation by station calibration from station 57 on until its exchange after station 82. Sincethe linear coefficient C1 did not change when calculated for stations 1 to 56 or station 1 to77, the change in calibration was totally due to the offset C0. Thus, taking C1 as fixed, C0was adjusted for station 57 to 77. For stations 78 (after the call of port) to 82, bothcoefficients were calculated station by station. See table III-1 for a complete listing ofcoefficients.
6.3 Overview profile calibration
With the 5580 samples (89%) used for the calibration (see fig. 19, 20 for conductivity; fig.21 for salinity), the overall standard deviation of the residuals is 0.0023 mS/cm. Onlystation group 204 to 219 is slightly worse (0.0029 mS/cm). Overall the cells' in-situcalibrations are close to WHP standards.
6.4 Verification
Stations 31 and 119 were repeated with a different CTD at stations 223 and 156,respectively. Also, positions of stations 211 and 145 are close to SAVE station 45 andTTO station 63, respectively. All 4 theta-S diagrams coincide well in the deep sea withsalinity deviations of just 0.001 psu.
DQE's comment on section 6
The method applied to determine the calibration coefficients is well established.Comparison in theta-S space of two 'cross stations' of this cruise and two 'cross stations'with stations from SAVE and TTO establish an accuracy in salinity close to 0.001 psumeeting WHP standards.
7. CTD dissolved oxygen sensor in-situ calibration
7.1 Operational modes
The calibration of the oxygen sensor followed the method described first by Millard (1982,see GC1 for the complete reference). The formula models the effects of temperature,inner and outer temperature difference and pressure, and salinity through the saturation

formula by Krause (1984, see CG1 for the complete reference) on the electrical current(OC) that is measured in the cell. Compared are averages of OC over a 15 dbar intervalfrom those depths of the lowering profile where sample oxygen were measured. Thecalibration coefficients are determined for groups of stations.
7.2 Units of dissolved oxygen
The calibration is performed and reported in units of ml/l. All units are converted then toµmol/Kg keeping those values in ml/l.
7.3 Station groupingThree sensors were used:
Stat. CTD Oxygen sensor001-069 2521 A070-082 2521 B083-223 2782 C
Sensor A, in addition to Millard's regression needed a 5th order polynomial regression inpressure. Sensor B needed a calibration by stations. Only sensor C was stable overlarge parts. See Tables III-2 and III-3 for coefficients and details.
7.4 Overview of profile calibration
The results are presented in figures 24 and 25. A total of 6052 samples (93.7%) wereused in the calibration procedure. Of these 42.4% have residuals less 0.025 ml/l, and83.9% less 0.075 ml/l with a standard deviation of 0.066 ml/l. Disregarding samples fromdepths less 980 dbar, this result improves to 49.8% and 92.2%, respectively and astandard deviation of 0.041. The subset of stations 70 to 223 has an overall (all depths)standard deviation of 0.046 ml/l.
7.5 Verification
One station pair (Stat. 119, 156) from this cruise with different sensors, and two SAVEstations can be compared (fig. 26, 27). The obvious differences between stations 119 and156 also show up in other chemical parameters, and thus probably are due to a change indeep water masses at that position during the cruise.
Stations 218 and 130 compare well with SAVE station 158 and TTO station 25.
DQE's comment on section 7
The formula used to model the oxygen sensor response did not account for the sensor'sspeed through the water as requested in a later version in the WHP Operations andMethods Handbook. Nevertheless, the standard deviations reported for the residuals ofthe sensor calibration meet well the WHP requirements.

Part B. CTD data evaluation
8. Basics
A6 and A7 data available at the WHP-O were:
•.SUM file•.WCT CTD data•.HY2 bottle data
and additional two meridional sections linking A6 and A7.
CTD data were on 1 dbar intervals. WHP requirements are 2 dbar intervals; the highervertical resolution has led to problems with computer (PC) storage and computing timeusing the programs kindly provided by R. Millard, WHOI.
CTDTMP and CTDSAL in the CTD files are reported with 4 decimal places, however withtailoring zeros. This is not WHP standard. Also, the quality byte for oxygen was set tozero throughout the CTD-files.
Although the overall quality of the data set is expected to meet WHP standards, theremarks above and the quick evaluation below will show that some revision of the dataneeds to be made. I therefore restrict to the (more problematic section A7 plus somemeridional stations (Stat. 1 - 99); nevertheless, all recommendations made below alsohold for A6.
The set of DQE programs allows to compare the CTD files with the CTD values in thebottle file. Only data flagged as 'good' were used. The following checks including someblow-up figures (not always shown) were made:
• theta-CTDSAL, overall in the east and in the west• theta-CTDOXY, overall in the east and in the west• deviations CTDSAL and SALNTY on pressure levels by station• deviations CTDOXY(downcast) and OXYGEN on pressure levels by stations• same by pressure in station groups (waterfall plots)• noise level in the deep ocean• static stability in profiles

9. Theta-CTDSAL, Theta-SALNTY
These plots are grouped for Stat. 1-50, and 41 -91. For stations 1 - 50 in the easternbasin, the overall plot (*Fig. 28a) shows extremely low salinities at the surface as a resultof the Congo River plume. At least two non-flagged CTDSAL outliers from the upcast atthe high end are detectable (and marked in *fig. 28a). Others are identified at lowertemperatures (*Fig. 28b). In the deep ocean (*Fig. 28c), some SALNTY values are asidethe bunch. An example (*Fig 28c) shows that large deviations between samples and theCTD are observed at Stat. 9. This station needs to be compared directly with neighboringstations for the salinity calibration. A more careful check will later identify other stationswith calibration offsets.
In *Fig. 29a to 29c the same is repeated for Stat. 41 to 91. Again, some few outliers ofSALNTY are identified in the deep ocean.
Overall, flags need to be checked.
10. Theta-Oxygen
Station groups 1 to 51 (*Fig. 30a-c) and 41 to 91 (*Fig. 31 a-c), both show some extremenon-flagged spikes (Stat. 7, Stat. 38) in CTDOXY and some bad non-flagged values in thesamples. Also, some CTDOXY profiles look rather noisy. Overall, flags need to beset/checked.
11. Residuals in calibration
11.1 CTDSAL
In *figure 32a these differences are plotted as single dots by STNNBR for all depths(upper panel), for depths larger 1000 dbar (middle) and by pressure (lower panel). Alsoincluded are the mean differences for each station (bold line). *Fig. 32b gives a blow-upof the upper and lower panels of *Fig. 32a. Some non-flagged outliers are marked.
The marked minima and the maxima of the bold line in the *Fig. 32a (middle panel)identify those stations, where the differences between CTDSAL and SALNTY need acheck of the CTDSAL calibration by comparing neighboring deep CTD stations: This isrecommended for the following stations: 009, 010, 023, 033, 035, 048, 076, 077, 078.
A more severe problem is obvious from *Fig. 32b: It shows a bias in CTDSAL calibrationat pressures higher than 4000 dbar. Perhaps, the pressure compensation that has beenapplied is not sufficient. To my experience, these sensors may need additionalcorrections to the linear one applied to the compensated raw data.
While *Fig. 32 allows one to identify stations with suspicious overall calibration, thewaterfall plots in *Fig. 33a to 33i give insight to the residuals' distribution over singleprofiles. Although the resolution is sparse, some stations can be identified to have a

systematic bias against the samples on that station. This holds for almost all stationswhich have samples from depths larger than 4000 dbar (as seen already in *Fig. 32). In*Fig. 33a and 33b, the subset shallow stations may have calibration problems: stations005, 006, 010 and 097.
11.2 CTDOXY
In *Figure 34, the residuals between the CTD downcast and the sample oxygen areshown. Some non-flagged outliers are marked (*Fig. 34a). With better resolution, *Fig.34b (middle) shows the station mean residuals well within ± 5 µMol/Kg for pressures >1000 dbar. Problems may occur at the beginning (Sta. 6), and only a few other stations. Irecommend comparison of neighboring stations in the deep ocean: 57, 58, 88, 95 andmaybe 86. Station 6 is shallow and may checked against station 008.
In the waterfall plots of *Fig. 35 those stations are marked that over wider parts of a profileshow a bias in the residuals. At these stations, the CTDOXY should be compared toneighboring stations to verify the calibration.
12. Noise level in CTD profiles
Since the data are provided on a 1-dbar interval rather than on 2-dbar intervals, the noiselevel maybe expected higher than usual for 2-dbar WOCE data. The method calculatesmeans and rms over 2 - 12 dbar high pass filtered data.
For the deep ocean (*Fig. 36a), the rms of CTDSAL is well below 0.001 psu (upper panel),that of CTDOXY generally below 0.5 µMol/Kg (middle panel). The mean rms for salinity is0.0004 psu is slightly higher than for other WOCE cruises with low values in the deepeastern basin (stations 10 to 50) and high values between station 55 and 86 reflectingmore variability in the deep western basin.
The station averaged rms for oxygen (0.24 µMol/Kg is twice as high as the so far bestWOCE cruises show probably reflecting the fact that the sensor's speed through the watercolumn was not taken into account during the calibration. Some stations (around 20, 43,51, and 75) peak in scatter and may be re-examined.

Part C. Recommendations
Resubmit the data set subject to:
** check for the calibration procedure of CTDSAL for high pressures** incorporate the oxygen sensor's speed through the water column into the calibration to
improve the noise level.** deliver downcasts at:
2 dbar intervals4 digit places for CTDTMP, CTDSAL, SALNTY (no zeros tailoring)
** set flags for CTDOXY** carefully check all flags for SALNTY, CTDSAL, CTDOXY; setting flags may make use
of the known standard deviations for the calibration.
I'm prepared to inspect the complete data set when resubmitted.
Acknowledgements
The WHP-O at WHOI again has been a friendly and effective host. Software used for partB of this evaluation, was kindly made available by Bob Millard; special thanks to him forhis helpful guidance. This work was supported by the Bundesminister für Bildung undWissenschaft, Bonn, Germany, under grant WOCE IV.
References
Le Groupe CITHER-1: Campagne CITHER-1 N/O L'ATALANTE (2 janvier-19 mars 1993).Recueil de donnees, Vol 2: CTD-O2. Rap. Interne LPO 94-04, Laboratoire de Physiquedes Oceans, IFREMER, Brest, France, 1994.
Millard, R.R. and K.E. Yang. CTD calibration and processing methods used at WHOI.WHOI Techn. Rep. 93-44, 1993
For further references see Le Groupe CITHER-1 (1994), there especially Billant (1985) forCTD calibration methods as applied at IFREMER; Billant (1990) for SIS pressure metercharacteristics; Millard (1982) for the calibration of the oxygen sensor.

Table III-1 Bilan de la calibration des profils de conductivité de la campagne CITHER 1
CoefficientsSondeutilisée
Station ougroupe
Nombre d’é chanti llonsconsidérés
Nombre d’échantillonsretenus par le calcul
DéviationStandard (0-6000) C1 C0
1 => 56 1367 1187 0.0024 0.999357 0.032057 32 28 “ 0.029058 32 29 “ 0.022759 32 28 “ 0.023360 32 27 “ 0.023961 32 29 “ 0.024562 32 31 “ 0.025263 32 28 “ 0.025864 32 29 “ 0.026465 32 27 “ 0.027066 32 29 “ 0.027767 32 30 “ 0.028368 32 30 “ 0.027169 32 26 “ 0.027770 32 28 “ 0.028471 32 31 “ 0.029072 32 28 “ 0.029673 32 30 “ 0.0302
2521
74 32 30 “ 0.03092782 75 32 32 0.0017 0.999022 0.0423
76 32 30 0.999357 0.030377 32 27 “ 0.031078 32 19 0.999492 0.041579 32 29 0.0024 0.999716 0.025880 32 30 0.0021 0.999520 0.033281 32 29 0.0021 0.999382 0.0323
2521
82 32 29 0.0019 0.999096 0.040583=>91 237 211 0.0022 0.999781 0.00632782
92=>118 769 686 0.0021 0.999695 0.00722521 119 32 29 0.0013 0.999862 0.0379
120=>203 2425 2164 0.0021 0.999589 0.0112204=>219 479 442 0.0029 0.999545 0.0106
2782
220=>223 128 117 0.0020 0.999687 0.0106

Tableau III-2 Bilan de la calibration des profils d’oxygène dissous de la campagne CITHER 1
Déviation Standard CoefficientsCapteurutilisé
Station ougroupe
Nombre d’échantillonsconsidérés
Nombre d’échantillonsretenus par le calcul 0-6000 0-1000 1000-6000 SOC OXPC OXTC OXC2
1 => 11 189 184 0.179 0.244 0.053 0.0356 0.000193 -0.0169 3.55212 30 30 0.103 0.165 0.044 0.0394 0.000165 -0.0334 0.76913 30 30 0.093 0.185 0.045 0.0404 0.000153 -0.0246 1.51114 31 31 0.095 0.156 0.038 0.0398 0.000163 -0.0227 1.49715 31 31 0.098 0.209 0.035 0.0409 0.000149 -0.0252 167716 32 32 0.131 0.240 0.029 0.0403 0.000155 -0.0260 1.553
17 => 21 160 143 0.061 0.120 0.045 0.0468 0.000122 -0.0348 2.67822 32 32 0.076 0.135 0.027 0.0408 0.000154 -0.0239 1.79123 29 29 0.059 0.103 0.032 0.0425 0.000147 -0.0261 1.31124 32 31 0.054 0.088 0.023 0.0404 0.000162 -0.0237 1.42025 31 31 0.037 0.070 0.025 0.0444 0.000141 -0.0285 1.341
26 et 27 35 34 0.063 0.111 0.030 0.0422 0.000155 -0.0256 1.34728 => 67 1251 1216 0.082 0.127 0.046 0.0430 0.000149 -0.0267 1.402
68 * 32 27 0.102 0.148 0.118 0.0430 0.000128 -0.0270 1.210
Capteur A
69 * 32 31 0.049 0.064 0.046 0.0440 0.000137 -0.0272 0.972
Correctionsupplément
aire parpolynomede degré 5
70 32 32 0.062 0.111 0.043 0.0658 0.000138 -0.0348 0.59671 32 31 0.051 0.087 0.041 0.0712 0.000131 -0.0335 0.93372 32 30 0.065 0.113 0.053 0.0750 0.000125 -0.0349 1.11173 32 31 0.047 0.047 0.047 0.0732 0.000131 -0.0343 0.820
Capteur B
74 32 32 0.036 0.042 0.035 0.0712 0.000139 -0.0328 1.10275• 32 29
* Les profils 68 et 69 sont partiellement inexploitables.• Le profil 75 est totalement inexploitable

Tableau III - 3 Bilan de la calibration des profils d'oxyène dissous de la campagne CITHER I
Déviation Standard CoefficientsCapteur utilisé
Station ougroupe
Nombred'échantillons
considérés
Nombred'échantillonsretenus par le
calcul0-6000 0-1000 1000-6000 SOC OXPC OXTC OXC2
76 32 31 0.037 0.043 0.037 0.0683 0.000143 -0.0326 0.79977 32 31 0.031 0.033 0.031 0.0698 0.000142 -0.0341 0.65778 32 32 0.066 0.077 0.063 0.0698 0.000140 -0.0331 0.93879 32 32 0.044 0.080 0.029 0.0689 0.000144 -0.0328 0.68780 32 29 0.016 0.008 0.018 0.0694 0.000144 -0.0331 0.52181 32 29 0.048 0.043 0.050 0.0703 0.000142 -0.0333 0.817
Capteur B
82 32 32 0.052 0.082 0.042 0.0707 0.000143 -0.0345 0.75383=>91 236 221 0.059 0.086 0.043 0.0566 0.000148 -0.0307 0.563Capteur C
92=>118 769 717 0.054 0.074 0.044 0.0559 0.000149 -0.0295 0.658Capteur B 119 32 31 0.046 0.083 0.027 0.0679 0.000157 -0.0316 0.698
120=>203 2423 2213 0.045 0.058 0.040 0.0562 0.000147 -0.0304 0.609Capteur C204=>223 607 557 0.037 0.048 0.033 0.0551 0.000149 -0.0294 0.642

Fig. 1: Position géographique des 223 stations de la campagne CITHER 1Les principaux ‘évènements’ intervenus en cours de campagne sont répertoriés.
Fig. 2: Coupes synoptiques indiquant le niveau des prélèvements à chaque station surles radiales 4°30S et 35°W.

Fig. 3: Coupes synoptiques indiquant le niveau des prélèvements à chaque station surles radiales 7°30S et 4°W.

Fig. 4: Ecarts de salinité entre deux bouteilles fermées au même niveau:a) en fonction du numéro de station à laquelle a été réalisé le doublet,b) en fonction de la pression à laquelle a été réalisé le doublet.

Fig. 5: Histogramme des écarts de salinité:a) pour les 275 doublets de la campagne,b) pour les 209 doublets réalisés à pression supérieure à 980 dbars.

Fig. 6: Ecarts en oxygène entre deux bouteilles fermées au même niveau:a) en fonction du numéro de station à laquelle a été réalisé le doublet,b) en fonction de la pression à laquelle a été réalisé le doublet.

Fig. 7: Histogramme des écarts en oxygène:a) pour les 275 doublets de la campagne,b) pour les 209 doublets réalisés à pression supérieure à 980 dbars.

Fig. 8: Répartition des écarts, tous les 400 dbars, entre la pression de référence et lapression indiquée par le capteur Neil-Brown (sonde 2521) lors de l’étalonnagepré- et post- campagne à la température de 20°C:a) cycles montée en pression (profil descente),b) cycles descente en pression (profil montée).Le courbe de degré 3 qui réduit ces écarts est représentée.

Fig. 9: Répartition des écarts, tous les 400 dbars, entre la pression de référence et lapression indiquée par le capteur Neil-Brown (sonde 2782) lors de l’étalonnagepré- et post- campagne à la température de 20°C:a) cycles montée en pression (profil descente),b) cycles descente en pression (profil montée).Le courbe de degré 3 qui réduit ces écarts est représentée.

Fig. 10: Ecarts, tous les 1000 dbars, entre la pression référence et la pression indiquéepar le capteur Neil-Brown à différentes températures expérimentales. Leslimites de la surface pointillée sont, d'une part, la courbe obtenue à latempérature à 20°C et, d'autre part, celle d'une température à la températureéquivalente interne du capteur Neil-Brown mesurée sur les profils "bathysonde":cette surface correspond à la correction de température statique.

Fig. 11: Etude de l’effet dynamique de température sur les capteurs de pression Neil-Brown (2521 et 2782) en laboratoire. Après immersion de la sonde dans unbain plus froid, les paramètres pression, température et température interne ducapteur de pression sont représentés en fonction du temps. Le choc thermiqueprovoque un décalage de l’indication de pression qui atteint environ 5 dbarsaprès 30 minutes.

Fig. 12: Ecarts, tous les 400 dbars, entre la pression de référence et la pressionindiquée par le capteur Neil-Brown (sonde 2521) après correction de la linéaritédu capteur à 20° (figure 8), de l’influence de température statique (figure 10) etde l’effet dynamique de température (figure 11).a) montée en pression (profil descente),b) descente en pression (profil montée).La courbe de degré 5 qui corrige la pression sur les profils est représentée.

Fig. 13: Ecarts, tous les 400 dbars, entre la pression de référence et la pressionindiquée par le capteur Neil-Brown (sonde 2782) après correction de la linéaritédu capteur à 20° (figure 9), de l’influence de température statique (figure 10) etde l’effet dynamique de température (figure 11).a) montée en pression (profil descente),b) descente en pression (profil montée).La courbe de degré 5 qui corrige la pression sur les profils est représentée.

Fig. 14: Ecarts obtenus, à chaque station, entre la lecture de 3 pressiomètres SIS et lapression indiquée par le capteur Neil-Brown en fonction de la pressiond’observation. Les écarts, concernant les deux sondes utilisées pendant lacampagne sont différenciés. Les courbes (en trait plein pour la sonde 2521 eten pointillé pour la sonde 2782) représentent la correction d’étalonnage àapporter à la lecture des deux instruments comparés (SIS et Neil-Brown).Lorsque les étalonnages pré- et post- campagne du pressiomètre sontdifférents, deux courbes sont présentées.Les points comparés à ces courbes montrent que, après correction, la pressionSIS est égale à la pression CTD à 2 dbars près (le pressiomètre 6199 estdevenu défectueux en cours de campagne).

Fig. 15: même légende que la figure 14 pour une autre série de 3 pressiomètres.- A noter le mauvais fonctionnement intermittent du pressiomètre 6196.- Dans le cas du pressiomètre 6137, les écarts observés après correction sont
de l’ordre de 4 dbars : cette différence est attribuée à un étalonnage incorrectdu pressiomètre.

Fig. 16: Ecarts entre la température de référence et la température indiquée par lecapteur Neil-Brown lors de l’étalonnage pré- et post- campagne:a) sonde 2521,b) sonde 2782.La courbe de degré 2 qui corrige la température sur les profils est représentée.

Fig. 17: Ecarts obtenus, à chaque station, entre la lecture de 3 thermomètres SIS, et latempérature indiquée par le sonde Neil-Brown: la température expérimentale estcomprise entre 2.5 et 5.0˚C.Les segments de droites représentent la correction d’étalonnage à apporter àl’indication du capteur Neil-Brown additionnée à celle du thermomètre SIS. Ladérive des thermomètres a été compensée à raison de 0.001˚ entre les stations1 et 82 et de 0.002˚C entre les stations 83 et 223.Le décalage des points par rapport à ces segments de droites est attribué à uneffet de pression sur le thermomètre SIS.

Fig. 18: même légende que figure 17 pour 4 autres thermomètres. (entre 1˚C et 2.5˚C)

Fig. 19: Ecarts entre la conductivité des 5580 échantillons validés et la conductivité‘bathysonde’, au niveau du prélèvement, après recalage:a) en fonction du numéro de la station concernée,b) en fonction de la pression au niveau du prélèvement.

Fig. 20: Histogramme des écarts entre la conductivité des échantillons et la conductivité‘bathysonde’, au niveau du prélèvement, après recalage:a) pour la totalité des 5580 échantillons validés sur la campagne,b) pour les 3852 échantillons validés et prélevés à pression supérieure à 980dbars.

Fig. 21: même légende que figure 20 pour les écarts en salinité.

Fig. 22: Comparaison de diagrammes θ-S tracés d’après les données de la campagneCITHER 1.Dans les deux cas, les stations ont été réalisées à la même positiongéographique avec unesonde différente.

Fig. 23: Comparaison de diagrammes θ-S de la campagne CITHER 1 avec les donnéesd’autres campagnes obtenues à une position géographique proche:a) statio n 211 de CIT HER 1 et sta tion 4 5 de SAVE (leg 2) (donné es ‘ba thyson de’),b) station 145 de CITHER 1 et station 63 de TTO-TAS (données ‘rosette’).

Fig. 24: Ecarts entre la valeur d’oxygène mesurée sur les 6052 échantillons validés etcelle du profil descente ‘bathysonde’ à la pression du prélèvement, aprèsrecalage:a) en fonction du numéro de la station concernée,b) en fonction de la pression au niveau du prélèvement.

Fig. 25: Histogramme des écarts en oxygène entre la valeur mesurée sur leséchantillons validés et celle du profil descente ‘bathysonde’ à la pression duprélèvement, après recalage:a) pour la totalité des 6052 échantillons validés sur la campagne,b) pour les 4387 échantillons validés et prélevés à pression supérieure à 980dbars.

Fig. 26: Profils d’oxygène dissous obtenus à la campagne CITHER 1. Les stations 119et 156 ont été réalisé à la même position géographique avec deux sondesdifférentes. L’oxygène mesuré sur les prélèvements de chaque station estreporté sur les profils avec un signe distinctif.

Fig. 27: Profils d’oxygène dissous obtenus aux stations 218 et 130 de CITHER 1. Lesvaleurs d’oxygène mesurées sur les prélèvements de ces 2 stations sontindiquées.Pour comparaison, les mesures d’oxygène extraites de stations, réalisées à uneposition géographique proche, au cours d’autres campagnes sont portées surces figures.a) les valeurs de la station SAVE 158 (leg 3) sont les données ‘bathysonde’,b) les valeurs de la station TTO-TAS 25 sont les données ‘rosette’.

Comments on the DQE recommendations for the CTD-O2 data of WHP lines A6 and A7( M. Arh a n, A. Billa n t)
T he DQE co nside re d the da ta as mee tin g th e WHP st an da rd , yet ma de se ve ra lr ecom me n da tio ns ( Pa r t C of th e rep or t ).
• Che ck fo r th e calib r at io n pro ce d ur e of CT DSAL fo r hig h pre ssu re s. We have che cke d th e calib ra t io n pro ce du r e: It is th e one re co mm e nd ed in the WHP ope ra tio ns ma nu al, and d escr ib e d in th e UNESCO Techn ica l Pa p er in Mar in e Scien ce nb 54 (19 8 8) . Wh en usin gt his pr o ce du r e, som e dep t h- de pe n de ncy of th e residu als at hig h pr essur es (> 500 0 dba r )can no t be avo id ed (a s an exam ple , se e fig ur e 3.8 of the UNESCO re po r t) at lea st in cer ta in ocea n ic a re a .
• O xyge n sen so r spe ed : No a ccura te me asur e me nt of t he time wa s ava ilab le on t h at cr uise ,f or which th e in sit u re f er en ce pa ra m et er wa s pr e ssur e. We usu ally re mo ve th e hea ve e ff ect fro m the o xyg en p r of iles by a ~1 0 db a r ru n ning m e an .
• F ou r dig it places fo r CT DTM P, CT DSAL , SAL NT Y: As said in the cove r le t te r, we can cre at e new e xch an ge file s a t th is fo r ma t if yo u jud ge it n ece ssar y.
• Set fla g s fo r CTDOXY: Th ese are oxyg en va lu es fr om th e do wn- pr of ile s, aver ag e d ove r a1 5 db ar pr essur e ra n ge ce nt er ed at th e pr essur es of bot t le tr ig ge rin g. Th ese va lue s are com pa re d wit h the wa te r sam ple dat a and , in ca se of a discre p an cy exce ed ing 2.8 sta nd ar d deviat io n, we ch oo se to fla g the bo tt le va lu e, no t the CTD on e. This is a mat te ro f co nve nt io n , an d the DQ E is righ t in po in t in g out t ha t , in so me ca se s, th e hig h dif fe re nce is ca use d by in accu r at e CTD valu es. As the se CT DOXY va lue s are only use d for th ecalib ra t io n, we did no t jud ge it nece ssar y to exa mine th e pr o blem at ic ca ses to decid e which pa ra me t er sho u ld be fla gg e d. Had we don e it, the ch oice co uld only have bee nsub je ct ive in m ost cases.
• Car ef ully ch e ck all flag s for SALNTY, CTDSAL , CT DOXY. ( Se e the se t of figu re s wit h the p ro blem a tic point s mar ke d ). In se ve r al pro p er ty- pr op er t y plo ts (e. g . 28 b , c, d) , so m ep oint s are fo un d sligh tly aside of th e ma in << clou d of po in t s >>, alt ho u gh the diff e re nce<< CT D min us wa te r sam ple >> wa s less tha n 2.8 st an da rd de via tion s, an d the valu eswer e th e re fo r e no t fla gg e d. Ag a in , this is a ma t te r of co nve nt io n.
I n se ve r al ot he r plo ts (e .g . 30 a , 31 a , 32 a, 33 , 34a ), diff er e nces CT D- wa t er sam p le we re r ep or te d , alt ho ug h the wa te r sa m ple dat a we r e fla gg ed to eit h er 5 or 3. Th is le ad s toa pp ar en t p ro b le ms ( o nly app ar en t , be cau se t h e da t a we re flag g ed ). For in st an ce , t he va lu e- 9 wa s set wh en the r e wa s no da t a, with a flag of 5 (ab sen ce of dat a ) in th e WS file s.T akin g int o accou nt th e value –9 lea d s to se ve ra l dif fe r en ce s at ~4 4 (~3 5 –(- 9) ) in fig ur e3 2a , or ~2 09 (= 200 -( -9 ) ) on figu re 34 a. The sa me cau se le a ds to hor izo nt al line s on th e<<wat er f all plo ts>>, and to poin ts asid e of th e <<m ain clo ud >> in th e pr o pe rt y- p ro pe r typ lo ts. In pa rt icula r, alth ou gh CT DO XY wa s not me asur ed at st at io n 75 (a ll flag s at 5) an dwas only par t ia lly pre se n t at st at io n s 68 , 69 (se nsor pr ob le m s) , er r on eo u s po in t s fo r the se sta tion s a re re po rt e d on figu re 34 a.

WHPO Data Processing Notes
A06
Date Contact Data Type Data Status Summary
03/01/96 Oudot BTL/CFCs Submitted for DQE
03/28/96 Oudot Carbon Data Submitted for DQE
TCARBN, CHLA, ALKALI, FCO2 (pCO2), PH
07/09/96 Mueller CTD Agreed to do DQE
07/09/96 Koltermann NUTs/S/O Agreed to do DQE
09/18/96 Koltermann NUTs/S/O Sent data to DQE
10/03/96 Mueller CTD DQE Report submitted
03/14/97 Arhan CTD DQE Complete DQE Report sent to PI
01/22/98 Oudot Tracer Submitted for DQE
asking for est. time of DQE completion
02/10/98 Arhan CTD DQE Issues Resolved
"Following my previous letter of November 13, 1997, this one is to confirm that weare releasing the CTD-O2 data of the WHP sections A6 and A7 to the publicdomain".
07/06/98 Oudot BTL PI OK'd Public Release; Data still w/ DQE
12/03/98 Guinehut CTD/BTL Pressures updated on website
• S/O2, NUTs, CFCs, CTD Pressures are not always in ascending order.• The pressure 2220. is everywhere replaced by the pressure 2222..• The CTD data are not reported in a uniform pressure series in order of incresing
pressure with a pressure resolution of 2 dbar.• The CTD data have a pressure resolution 2 dbar in some files and of 1 dbar with
large gaps with no data in most of files. For example, in the file CTH10123.WCTthere are no data between 78. and 82. dbar and between others pression ondepth.
01/13/99 Jean-Baptiste HE/TR Ready to submit
02/09/99 Koltermann NUTs/S/O DQE Report Requested by js
02/10/99 Koltermann NUTs/S/O DQE not begun
I agreed (to do the dqe) but never was able to get the software of Terry's to work. Itold him and still we never succeeded. So at one time I had counted myself out. I amnot sure how go from there. At that time I had time and interest, but that faded awaywhen it didn't work. I might reconsider if things are easier now and Viktor might helpon my end of things.
02/10/99 Oudot DOC Report at WOCE is correct

WHPO Data Processing Notes
03/11/99 Jean-Baptiste He/Tr Submitted for DQE
04/20/99 Kappa DOC PDF DOC assembled
contents:• a06-7_ctd.dqe.pdf• a06-7.pdf• a06-7_ctd.dqe.pdf• a06_ctd.readme.pdf• a06-7.pdf• a06-7_ctd.dqe.pdf• a06_ctd.readme.pdf
04/30/99 Kappa DOC PDF Directory Updated
added:
• a06-7_notes.pdf,• a06_cruzpln.pdf,• a07_cruzpln.pdf
10/13/99 Bartolacci SUM Update needed; files incomplete
sumfiles for A6 and A7 are incomplete. They were split from one large file, and arecurrently missing stations. I have put the original all-inclusive sumfile in my incomingftp area under A6A7 subdirectory along with a readme file. The sumfiles need to bere-created from the original.
10/14/99 Bartolacci SUM Data Update
I have replaced the old incomplete sumfiles with the newly split and reformattedversions, thanks to Sarilee. I have also regenerated the station plots for both lines toinclude the additional stations, and have updated the table to reflect the change insumfiles.
10/14/99 Anderson SUM Data Update
I have reformatted and separated A06 and A07 into individual .sum files, leaving inthe stations that were previously missing.
The files are in my ftp area on whpo in subdirectory A06A07.
11/11/99 Alfultis SUM Data Update
Two stations appear ro have incorrect longitudes -
• station 51 has a longitude of 13 59.90 E and• station 72 has a longitude of 26 29.97 E while
all the surrounding stations have Western Longitudes.
02/29/00 Huynh DOC pdf updated, txt version added to website

WHPO Data Processing Notes
03/08/00 Diggs CTD/BTL Data Update
I have separated 35A3CITHER1(1/2) which is A06/A07. The CTD and HYD filesnow have different files which reflect the contents of the SUM file. All tables andHTML files have been updated as well.
In addition, I have corrected the EXPOCODES in all of the CTD and hydro files.
09/19/00 Huynh DOC Website Updated w/ CTDOXY dqe report
CTD/OXY dqe for A06 and A07 added to doc files
12/11/00 Uribe DOC Partial text doc submitted; put online
Files, received 1997 AUG 15, were found in incoming directory under whp_reports.This directory was zipped, files were separated and placed under proper cruise. Allof them were labled as sum files.
These are CRUISE SUMMARIES and NOT sumfiles.
06/20/01 Uribe BTL Website Updated; EXCHANGE File Added
Bottle file in exchange format has been linked to website.
06/21/01 Uribe CTD/BTL File modified/added
The exchange bottle file name in directory and index file was modified to lower case.
CTD exchange files were put online.
12/21/01 Hajrasuliha CTD Internal DQE completed
created *check.txt file for the cruise. created .ps files.
12/21/01 Uribe CTD EXCHANGE File Modified
CTD exchange files were slightly modified. The stations that were missing the SECTID were given a name according to the cruise name. CITHER1L2; standing forCITHER 1, leg 2. This naming convention will be a standard for sumfiles missing theSECT ID.
12/21/01 Uribe CTD EXCHANGE File Added
CTD has been converted to exchange using the new code and put online.
The bottom half of the sumfile is missing the WOCE SECT ID. This was causing aproblem with the exchange code. For the purpose of the conversion the column wasfilled in with A06.
06/19/02 Klein NEON/He/Tr Submitted with updated QUALT 2 words
The whpo file was basically fine, but compared to our file 22 tritium values and 56neon values were missing. I therefore included the tritium and neon values in the fileI am sending you. The quality flags in byte 2 are updated for the tracers. CFC dataare from the french, they were notified about changes in quality flags.

WHPO Data Processing Notes
08/16/02 Diggs CFCs/HE/TR Update Needed
Here's what Birgit had to say about these data (A06):
• The bottle data files we used and the one at your side are identical.• The CFC data (F11,F12) are from a french group, we have notified them for minor
changes we made to the quality flags.• The quality byte 2 now contains the revised quality flags for f11 and f12.• We also controlled the tritium and helium data set for this cruise. But it seems they
have not been submitted to you yet. I will write to Jean-Baptiste and ask him, if hewants to submit the data.
• The helium data for this cruise turned out to be very poor quality and we haveflaged them 3 for the entire data set anyway.
08/19/02 Anderson HE/TR WebsData merged into online file
DELHE3, HELIUM, and TRITIUM was merged into the online file by Sharon Escher.Made new exchange file.
Merge notes:
• Started with a06/original/TRACERS_19990311/WOCE_A6A7.dat and in a06 & a07(in original) under 2002_KLEIN A6hy.txt & A7hy.txt
• Merged ( using mrgsea ) delhe3, helium, and tritum into EACH of the existing filesA6hy.txt and A7hy.txt sent by Birgit Klein that contained the changes in the qualityflags mentioned in e-mail.

WHPO Data Processing Notes
A07
Date Contact Data Type Data Status Summary
10/14/99 Anderson SUM Data Update
• Record 284, sta. 93 had the time as 15 8, changed to 1508.• Record 298 sta. 97 had the date as 200193 changed to 020193.• Stations 63 and 64 at CODE BO had E longitude, changed to W to conform with
the other longitudes.
11/16/99 Bartolacci SUM Data Update, corrected .sum file
As per Dave's notes below, I have corrected the A07 sumfile, time/date stamped itand placed it back out on the web. As far as I know, these two errors in hemispherewere the only things in question
11/16/99 Muus SUM Data Update
The A07 summary file problem brought to our attention by the US Coast GuardAcademy is two typographic errors in the original French data:
• Stations 51 and 72 EN longitudes should be "W" instead of "E".• The BE and BO longitudes for these stations are correct ("W").• The web site should be corrected and this could be added to any errata that may
be planned for CDROMs.
06/20/01 Uribe BTL Website Updated; EXCHANGE File put online
Bottle file in exchange format has been linked to website.
06/21/01 Uribe CTD/BTL EXCHANGE Files added/modified/online:
• The exchange bottle file name in directory and index file was modified to lowercase.
• CTD exchange files were put online.
07/19/01 Thurnherr CTD Update Needed pressure values incorrect
I have noticed that the CTD files of the WOCE A07 section have erroneous pressurevalues of 2222dbar instead of 2220dbar. E.g. station 007 contains the followingrecords
press temp salnty oxy nobs qual--------- --------- ----------- -------- ------- ------2219.0 3.2740 34.9430 244.3 1 22222222.0 3.2730 34.9430 244.2 1 22222221.0 3.2710 34.9430 244.2 1 22222222.0 3.2680 34.9420 244.5 1 22222223.0 3.2650 34.9420 244.7 1 2222
All stations therefore have double records at 2222dbar with the exception of thefollowing list
000 002 004 006 037 075 081 091 093001 003 005 027 054 079 090 092 115
Both the original and the the exchange format are affected.

WHPO Data Processing Notes
09/05/01 Uribe CTD Update Needed files have bad OXY values
Email from Andreas Thurnherr indicates 5 CTD files of the WOCE A07 section haveranges of erroneous oxygen values. In those files (stations 000, 007, 068, 069, 075)some or all oxygen data appear to be replaced by (rounded) temperature data. Boththe original and the exchange formats are affected. This problem has not been ad-dressed at this time.
12/21/01 Hajrasuliha CTD Internal DQE completed
created *check.txt file for the cruise. create .ps files.
12/21/01 Uribe CTD Website Updated; EXCHANGE File Added
CTD has been converted to exchange using the new code and put online.
08/16/02 Diggs CFCs/HE/TR Update Needed
Here's what Birgit had to say about these data: a7: the same comments as for a6.
The bottle data files we used and the one at your side are identical. The CFC data(F11,F12) are from a french group, we have notified them for minor changes wemade to the quality flags.
The quality byte 2 now contains the revised quality flags for f11 and f12. We alsocontrolled the tritium and helium data set for this cruise. But it seems they have notbeen submitted to you yet.
I will write to Jean-Baptiste and ask him, if he wants to submit the data. The heliumdata for this cruise turned out to be very poor quality and we have flaged them 3 forthe entire data set anyway.
08/19/02 Anderson He/TR Data merged into online file
The DELHE3, HELIUM, and TRITIUM were merged into the file with the Q2 flage forCFCs sent by Birgit Klein re Steve's e-mail. Made new exchange file. Sent notes toJerry.
see 08/19/02 Anderson HE/TR Merge notes
04/11/03 Kappa DOC PDF & Text files updated
PDF docs: A06 and A07 Station Plots combined into one map
PDF & Textdocs:
• First Page Data Summaries for A06 and A07 were previouslycombined. Now expocodes, chief scientists, cruise dates, ports ofcall, geographic boundaries are specified by line.
• Cruise goals added