whp cruise summary information - university of … · 2015-04-23 · whp cruise summary information...
TRANSCRIPT

A. Cruise Narrative: A01E
.567
.577
.587
.598
.608 .618
A.1. HighlightsWHP Cruise Summary Information
WOCE section designation A01EExpedition designation (EXPOCODE) 06MT18_1
Chief Scientist(s) and their affiliation Jens Meincke/IfMH*Dates 1991.SEP.02 � 1991.SEP.26
Ship METEORPorts of call Reyjavik, Iceland to Hamburg, Germany
Number of stations 64
Geographic boundaries of the stations60°00.00� N
42°30.60� W 14°15.20� W52°10.10� N
Floats and drifters deployed 0Moorings deployed or recovered 6 moored current meter arrays
Contributing Authors A. Sy, M. Bersch, A. Mittelslaedt,R. Bayer, B. Hoffahrt, A. Putzka,K. Blusiewicz, G. Fraas, B. Schneider,K. Johnson, L. Mintrop, H.-J. Isemer,J. Sußebach, H. Sonnabend, D. Ellett
Institut für Meereskunde � Universität HamburgTroplowitzstrasse 7 � 22529 Hamburg � GERMANY
Email: [email protected] � phone: 49-40-4123-5985 � fax: 49-40-4123-4644

WHP Cruise and Data Information
Click on any item to locate primary reference or use PDF navigation tools above.
Cruise Summary Information Hydrographic Measurements
Description of scientific program CTD measurements 18Temperature
Geographic boundaries of the survey Oxygen 19Cruise track (figure) Pressure 20Description of stations Salinity 21Description of parameters sampled Temperature 21Bottle depth distributions (figure)Floats and drifters deployed Bottle DataMoorings deployed or recovered Oxygen 25Principal Investigators for all measurements Salinity 25Cruise Participants Nutrients 26
CFC-11 and CFC-12Helium/Tritium/C14Carbonate System
Underway Data Information DQE Reports
Navigation CTD Bottle
Acoustic Doppler Current Profiler (ADCP)Thermosalinograph and related measurementsXBT and/or XCTDMeteorological observationsAtmospheric chemistry data
Data Processing Notes 13 References
CTD and hydrology measurements 13 HYD/BTL

70˚W
70˚W
60˚W
60˚W
50˚W
50˚W
40˚W
40˚W
30˚W
30˚W
20˚W
20˚W
10˚W
10˚W
0˚
0˚
10˚E
10˚E
30˚N 30˚N
40˚N 40˚N
50˚N 50˚N
60˚N 60˚N
70˚N 70˚N
.567
.577
.587
.598
.608 .618
Station locations for A01E: Meincke, 1991

Abstract
The METEOR cruise no. 18 was aimed at contributing to the World Ocean CirculationExperiment (WOCE) in particular to the one-time survey of the WOCE-HydrographicProgramme. The survey line from Ireland to Kap Farvel crosses the North Atlantic just to thesouth of the major convective regimes, so that transport estimates for the warm and the coldwater masses can be used to estimate the North Atlantic overturning rate. This quantity is oneof the key figures for the ocean's role in climate.
Measurements were carried out as outlined in the WOCE-documentation, i.e. the full suite ofhydrographical and nutrient parameters and tracer substances as tritium, helium, CFCs andradiocarbon. In addition the quantities relevant to determine the ocean carbon cycle weresampled. The measurements on stratification were complemented by direct currentmeasurements, employing an acoustic doppler current profiling system for the upper 300mand deploying long term moored current meter arrays at six locations along the survey line.The quality of the data obtained was generally confirming to the standards set by WOCE.
Zusammenfassung
Die 18. Reise der METEOR ist ein deutscher Beitrag zum World Ocean CirculationExperiment (WOCE), in diesem Falle sum sog. �one time survey� des WOCE-HydrographicProgramme. Der bearbeitete hydrographische Schnitt von der Sudspitze Gronlands bis nachIrland quert den nordwärtsgerichteten Warmwassertransporte und die südwartsgerichtetenKaltwassertransporte bilanziert werden, un die für Klimabetrachtungen wichtige Umwalzratedes Nordatlantiks zu erhalten.
Das Meß p ro gr a mm ent spr ach den Vo rg ab e n vo n WOCE, d. h. zu den hydr og r ap hisch en Par am et e rn wie Te mp e ra tu r , Sa lzg eh alt und Sa ue rst of fg eh a lt ka me n Nä h rsalze un dSpu re nst of fe wie Tr itium , Heliu m , FCKWs und 14C hin zu . In en ge r Abspr a ch e mit dem int er na t io na len Join t Glo ba l Oce an Flux Stu d y (JG OF S) wu rd en die Ko m po ne n te n zu r Bestimm u ng de s Ko hle nsto f fkre islau fe s im Me e r eb e nf alls ge me sse n. Zur dire kt en Bestimm u ng de r St rö m un g kam ein akust isch er Pr of ilm esse r für die ob e re n 400 m vo mf ah re nd e n Sch if f au s zum Einsat z und es wur d en an 6 Position e n St ro m un gsm esse rke tt en zu rL an gzeit re gistr ie ru n g ve r an ke rt . Die Dat en q ua lit ät e nt spr ach g en er e ll d e m WO CE- St an d ar d.
1 Research Objectives
The North Atlantic Ocean is characterized by an intense meridional circulation cell, carryingnear surface waters of tropical and subtropical origin northwards and deep waters of arcticand subarctic origin southwards. The related "overturning" is driven by sinking of watermasses at high latitudes. The overturning rate and thus the intensity of the meridionaltransports of mass, heat and salt is an important control parameter for the modeling of theocean's role in climate. Certainly such estimates require more than one survey of the studyarea and therefore the METEOR cruise no. 18 was one in a series of cruises, which started inMarch 1991 and is expected to continue into 1995. This effort, which is a joint project of the

Institut für Meereskunde, University of Hamburg and the Bundesamt für Seeschiffahrt undHydrographie, Hamburg in cooperation with varying groups from other marine institutions,serves two purposes: On the one hand it is a German contribution to the international WorldOcean Circulation Experiment, WOCE-Hydrographic-Program, in particular to the WHP one-lime survey of the eastern part of the hydrographic section A1 and the repeats thereof(ANON, 1988). On the other hand it serves the national project WOCE-NORD (North AtlanticOverturning Rate Determination). Its objective is to determine directly the overturning ratesby means of seasonally repeated hydrographic sections between the southern tip ofGreenland and Ireland in combination with current measurements from long-term mooredarrays (see Figure 1). The location of the section was chosen to be to the south of the majorwintertime convection regions to avoid water mass formation processes and to stay awayfrom shallow topography in order to avoid difficulties in applying the geostrophic method forvolume transport estimates.
The occasion of the cruise M 18 was also used to contribute to the global study of thecarbonate system, which is carried out in the framework of the Joint Global Ocean Flux Studyin close coordination with WOCE.
2 Participants
Name Specialty InstituteBassek, D., Technician Meteorology SWABayer, R., Dr. Tracer-Physics IUPHBeckmann, U., Technician Oceanography IFMKBersch, M., Dipl.-Oz. Oceanography IFMHBos, D., Technician Tracer-Physics SIO-ODFBraun, W., Guest, State Dep Oceanography IFMHBrunßen, J. v., Dipl.-Phys. Tracer-Physics UBPBulsewiecz, K., Technician Tracer-Physics UBPFalk, G., Technician Tracer-Physics UBPFraas, G., Technician Tracer-Physics UBPIsemer, H.-J., Dr. Meteorology IFMKJohnson, K., Dr. Geochemistry BNLKorves, A., Technician Geochemistry IFMKMaus, S., Student Oceanography IFMHMay, H., Technician Oceanography BSHMeincke, J., Prof. Dr. Oceanography IFMHMorak, A., Technician Geochemistry IFMKMuus, D., Technician Tracer-Physics SIO-ODFNesemann, M., Student Oceanography IFMHPaul, U., Dipl.-Oz. Oceanography BSHPutzka, A., Dr. Tracer-Physics UBPRamirez, R., Technician Geochemistry BNLReichert, K., Student Oceanography IFMH
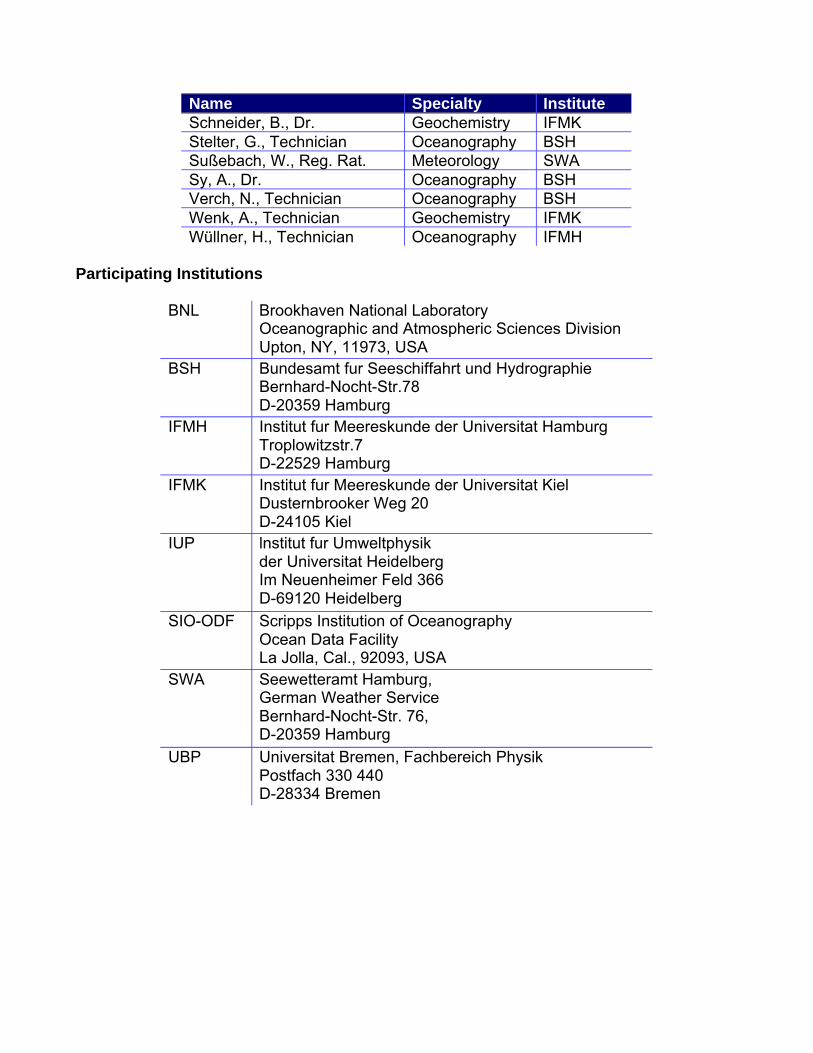
Name Specialty InstituteSchneider, B., Dr. Geochemistry IFMKStelter, G., Technician Oceanography BSHSußebach, W., Reg. Rat. Meteorology SWASy, A., Dr. Oceanography BSHVerch, N., Technician Oceanography BSHWenk, A., Technician Geochemistry IFMKWüllner, H., Technician Oceanography IFMH
Participating Institutions
BNL Brookhaven National LaboratoryOceanographic and Atmospheric Sciences DivisionUpton, NY, 11973, USA
BSH Bundesamt fur Seeschiffahrt und HydrographieBernhard-Nocht-Str.78D-20359 Hamburg
IFMH Institut fur Meereskunde der Universitat HamburgTroplowitzstr.7D-22529 Hamburg
IFMK Institut fur Meereskunde der Universitat KielDusternbrooker Weg 20D-24105 Kiel
IUP lnstitut fur Umweltphysikder Universitat HeidelbergIm Neuenheimer Feld 366D-69120 Heidelberg
SIO-ODF Scripps Institution of OceanographyOcean Data FacilityLa Jolla, Cal., 92093, USA
SWA Seewetteramt Hamburg,German Weather ServiceBernhard-Nocht-Str. 76,D-20359 Hamburg
UBP Universitat Bremen, Fachbereich PhysikPostfach 330 440D-28334 Bremen

3 Research Programme
3.1 Physical Oceanography
The physical oceanography programme consisted of two parts: Along the section betweenGreenland and Ireland 64 hydrographic stations were occupied. On each station the verticaldistribution of temperature, salinity, dissolved oxygen content and nutrient content (NO3, NO2,SIO3 and PO4) was obtained, using continuously measuring CTDO2-sondes as well as watersamples from discrete depths. This data set will allow to determine the distribution of watermasses and to estimate the relative transport distribution during the summer season.
At six locations near strong gradients of the bottom topography current meter moorings weredeployed. These records will allow to quantify the transports of deep topographically steeredboundary currents as well as their temperature fluctuations over the period of one year.Combining this information with the hydrographic data will result in total transport estimates ofthe various water masses present.
Th ro ugh out the cru ise cont in uou s cur ren t pro files using th e ship-m ou nte d aco ust ic do pplercu rr ent pr of ile r wer e m easur ed as we ll as se a surf ace t emp er atu re an d salinity. T o increa se th esp at ial re so lut ion o f t he hydro gra ph ic sam pling , tem per atu re an d salinity pr ofiles u p t o a d ept h o f80 0 m were also ob ta ine d by use of expe nda ble sond es (XBTs). These dat a wer e tran sm itt eddire ctly t o the IG OSS ( Int eg rat ed Glo ba l Oce an Ser vices Syste m) dat a ban k via sa tellite.
3.2 Tracer Oceanography
Measurements of geochemical and radioactive tracers of anthropogenic origin allow an agedetermination of water masses if the atmospheric input function into the ocean is known.Thus they complement the classical hydrographic work for the determination of watermasses.
Tracer measurements carried out on the hydrographic section between Greenland andIreland may serve as northern-boundary values, as needed for evaluations of Atlantic tracerdistributions. The observations will specifically give starting concentrations for the NorthAtlantic Deep Water. Tracer concentrations within the overflows will moreover yieldinformation on the turnover of the water masses feeding the overflows. Tracermeasurements in the area have been carried out repeatedly since 1972, but for the first time,a complete section valuable in determining the temporal evolutions further on. The point isthat the main information content of the distribution is contained in their transient nature, aswell as in differences in between the various tracers.
Measurements were carried out of the CFC�s F11 and F12. Samples for 3He, tritium and 14C,were taken for sample preparation and measurement at Heidelberg, the 14C-measurementsas such being carried out at Eidgenössische Technische Hochschule Zürich (ETH). A newseagoing 3He sample extraction was tested, that is expected to improve sample quality andreduce the time lag until measurements can be made available. All measurements were tomeet WOCE quality standards.

3.3 Marine Chemistry
The focus of the chemistry programme was on the carbonate system, which is studiedglobally within the frame of the JGOFS and which is tightly co-ordinated with WOCE.
CO2 partial pressure difference (∆pCO2) between the atmosphere and the sea surface wasmeasured along the section. This quantity is the driving force for the air/sea exchange of CO2
into the ocean, provided sufficient information about the global distribution of ∆pCO2 isavailable.
Vertical profiles of the parameters of the carbonate system were determined at selectedstations. Such data, in connection with oxygen and nutrient concentration, may be used toreconstruct the conditions in pre-industrial ocean surface waters and thus identify theanthropogenic signal.
The stations were partly located at positions where previous investigations of the carbonatesystem have been made. This will allow to assess the seasonal variability, partial pressure,and pH. By this over-determination (two parameters are sufficient to describe the system) themeasured data may be checked for the thermodynamical consistency.
The chemical analysis of all components of the carbonate system was performed on board.For the coulometric determination of the total carbonate, an additional system was used by acolleague from the Brookhaven National Laboratory (USA). This allowed an intercomparisonof methods and data.
3.4 Marine Meteorology
The meteorological part of the cruise was aimed at instrument developments to measureprecipitation. The ocean�s thermohaline circulation is driven by density gradients that are to alarge extent influenced by the freshwater balance at the sea surface. Hence, measurementsof precipitation at sea are needed. Also, ground truth is still lacking for verification of both,numerical model results as well as satellite measurements and algorithms. Unfortunately,reliable methods to measure rain from ships are not available, and hence it is not possible torely on the several thousands of voluntary observing ships that by routine provide the bulk ofreliable values of other parameters for weather forecasting and climatology.
During METEOR cruise no. 14, newly developed rain measuring equipment with noveltechniques has been tested. The experiences gained by these tests has led toimprovements. Two advanced instruments with mechanical and optical gauging techniqueswere tested on METEOR cruise no. 18. This cruise was especially suited to test rain gaugingequipment since the cruise lead right into the centre of the Atlantic storm activity. Themeteorological program is a contribution to WOCE. In addition routine meteorologicalobservation were made from the met-station aboard METEOR, to provide:
• short term weather and sea state forecasts,

• syn op tic obse rvat io n s (e ver y th r ee ho ur s) an d ra d io so nd e mea sur em en t s (e ver y twe lveh ou rs) tra nsm it te d to th e G TS f o r use in th e wor ld- wide we at h er f or e ca st ce nt re s,
• continuous registration of basic meteorological data for use by the scientific workinggroups aboard METEOR.
4 Narrative of the Cruise(J. Meincke)
METEOR left Reykjavik on September 2, 1991, 11:00 UTC. With heavy south-westerly windsfor the first two days the progress towards the starting position of WOCE section A1/east (seeFigure 1) was rather slow. Two stations for testing the CTDs and the rosette sampling systemwere carried out en route to Kap Farvel before the hydrographic sampling was resumed withstation 558 (see chapter 7) on September 5, 13:40 on the SE-Greenland shelf. The densestation spacing over the slope, in conjunction with quiet weather, made the establishing of thenecessary routine in the station work a fast process. However, electrical problems with thesliprings of the CTD winch, the failure of a diode in the CTD fish and irregularities in therosette bottle-release interrupted the routine on September 6 and 7. On September 9, thefirst two moored current meter arrays were deployed over the western flank of the ReykjanesRidge (Positions A and B on Figure 1), then hydrographic station work continued until thedeployment of mooring C on September 10 and mooring D on September 11. All mooringswere deployed over rough topography, appropriate locations were found by means of shorthydrosweep-surveys preceding each launch. Meanwhile winds had steadily increased,coming from SE. Upon completion of station 591 on September 13 all sampling had to bestopped for 16 hours because of winds with gale force up to 10, turning from SE to WNW.CTD work was resumed on September 14 without the rosette because of heavy seas andswell on stations 592 to 595. These stations were oriented normal to the WOCE section andup slope over the southern flank of the Eriador Seamount which forms the southwestern tip ofthe Hatton Bank. With this station arrangement, completed by the deployment of mooring Eclose to the intersection of the two hydrographic lines it is expected that the regional effect oftopography on the flow pattern can be resolved.
The WOCE section was continued with full hydrography and reasonable weather conditionson September 15 and 16, only interrupted by the necessity to replace the electronics of therosette underwater unit. On September 17, work had to be interrupted for about 9 hours,because of winds up to Beaufort 10 to 11. Measurements on station 606 were resumed withthe CTD without water samples on the next two stations only 12 out of 24 sampling bottleswere mounted on the rosette frame to minimize the risk of damaging gear and cable in theheavy seas. This "reduced" sampling again was restricted to another short hydrographic linenormal to the WOCE line at the southern tip of Rockall Plateau. The WOCE section wascontinued with complete profiling from station 611 onwards.
Although the weather remained rough with SW-winds around Beaufort 7, all stations and thedeployment of mooring F could be completed. The WOCE section was finished with station622 on the Porcupine Shelf on September 21. Because of the weather forecasts the originalplans to return to Hamburg via the northern route through the Pentlands in a partly repeat of

JGOFS-CO2 measurements during the METEOR cruise no. 10 were dropped. Instead, thevessel set course for the English Channel and reached Hamburg on September 25, 06:00 LT.
5 Operational Details and Preliminary Results
5.1 Hydrographic Measurements(A. Sy)
Hydrographic casts were carried out with a NBIS MK-III CTDO2 unit mounted on a GO rosetteframe with 24 x 10 litre Niskin bottles. EG&G�s Oceansoft rev. 3.1 was used for dataacquisition at a rate of 32 ms/cycle. The �NB3� CTD underwater unit was provided by IFMKiel. Pre-and post-cruise calibrations were carried out in July and December 1992 by thecalibration laboratory at IFM Kiel. This instrument ran without major problems during thewhole cruise . However, all the rosette systems used proved to be poorly adapted to the CTDsystem and/or were subject to various mechanical/electrical problems. Three differentsystems were used. Nevertheless, tripping failures occurred more or less at most stations inparticular at nos. 596 to 613 and additionally, CTD trip recording problems were experiencedat station nos. 599 to 613. Repeated checks on board and several careful verifications withthe complete bottle data set, however, should ensure that all the samples will finally beassigned to their correct pressure levels.
The bottle sampling sequence was as follows. Oxygen samples were collected soon after theCTD system was brought on board and after CFC and 3He were drawn. The sample watertemperature was measured immediately before the oxygen sample was drawn. The nextsamples collected were pCO2, TCO2 alkalinity, 14C, 3H, nutrients (NO2, NO3, SIO3, PO4) andsalinity.
Salinity samples were drawn into dry 200 ml BSH salinity bottles (Besser, Hamburg) withpolyethylene stoppers and external thread screw caps. It was found by KIRKWOOD andFOLKARD (1986) that these bottles guarantee best long-term storage conditions. Bottleswere rinsed three times before filling. Samples were collected twice, once for shipboardsalinity measurements and once for the possibility of cross checks by later shore-basedsalinity analyses. The rosette sampling procedure was completed by readings of electronic(SIS, Kiel) and mechanic (Gohla, Kiel) deep sea reversing thermometers (DSRT) for a firstquick check of the scheduled bottle pressure level and for in situ control of the CTD pressureand temperature calibration.
Sixty-four CTD casts were carried out along section A1/East (Figure 1); one cast failed andhad to be repeated. Four casts were used for rosette sample quality tests by means ofmultitrips at the same level. The number of water sampling levels was 1208. A distribution ofwater sample depths is given in Figure 2. An overview of activities, occurrences andmeasured parameters is summarized in the station listing (chapter 7).

To meet WOCE quality requirements, the processing and quality control of CTD and bottledata followed the published guideline of the WOCE Operations Manual (WHPO 91-9) as faras their realization was technically possible on this cruise.
CTD data were processed at BSH. As a first step, physical time series were generated fromraw binary data for which the EG&G standard hardware calibration file was used (nolaboratory calibration was applied at this stage) to allow pre-cruise, post-cruise and in situcorrection comparisons as well as comparisons with the sensor history. It turned out that thepre- and post-cruise laboratory calibration of pressure and temperature was stable (nosignificant differences) and thus this function was used for the final correction of the field data.
The difference between in situ and laboratory correction functions of the low-gradienttemperature domain was found to be +1 mK to +2 mK which corresponds well with the resultsof a temperature calibrations intercomparison carried out between 4 laboratories in January1992. Whereas up to 12 electronic (SIS) DSRTs (calibrated in July and October 1992 by SIS,Kiel) are used in a rotating mode for in situ temperature comparisons, this cruise had at hitsdisposal only 2 electronic (SIS) DSR pressure sensors which were insufficient for in situcorrection. In addition to the electronic DSRTs, 12 lowrange Hg DSRTs were used in thesame mode. These were calibrated by Gohla Precision in Kiel in July and October 1992.However, whereas the reproducibility of the Hg DSRT readings was found to be better than 3mK (reproducibility of electronic DSRTs was better than 2 mK), the much larger differencebetween the CTD and SRT means was interpreted as a DSRT calibration problem. Thus HgDSRT readings were not used for CTD quality evaluation.
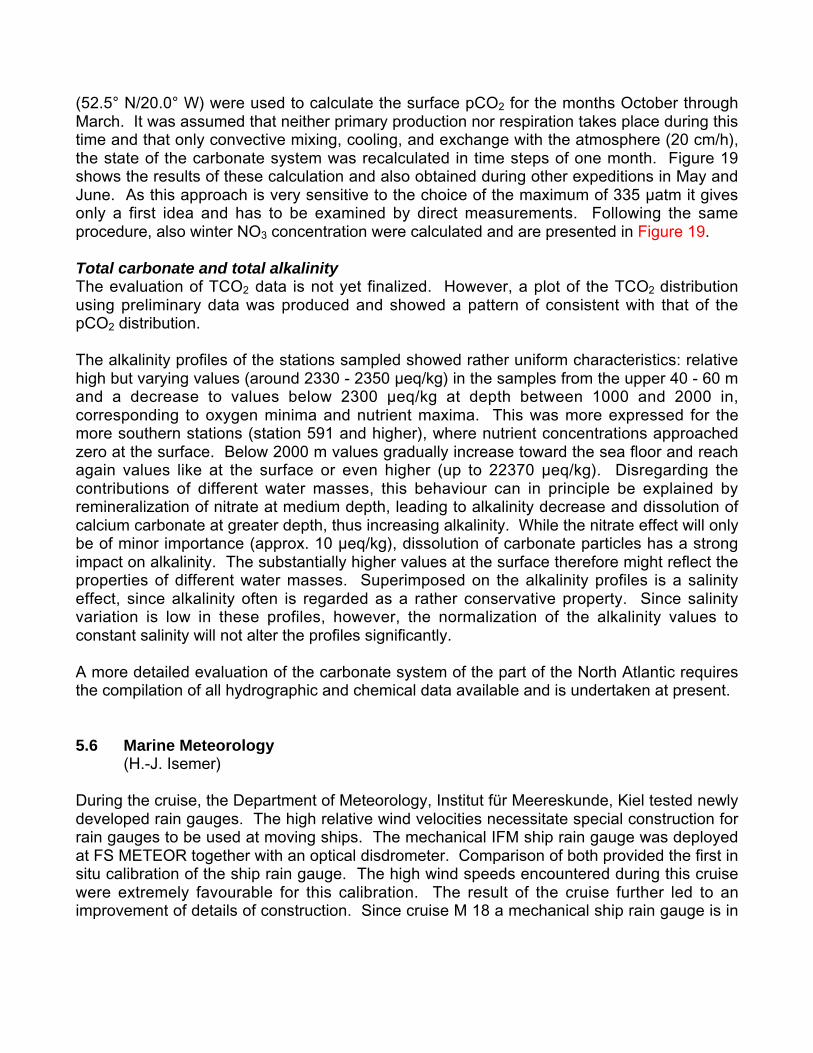
T he salinity co rr ect io n was car r ie d out usin g in situ da ta on ly beca use it wa s fou nd th at th elab or at o ry ca libr at ion f a cility wa s not suf f icie n tly accur at e t o me e t th e WOCE req uir em en ts. Fo r salin it y mea sur em en t s a sta nd ar d Guildlin e Aut osa l sa lin om et e r wa s use d on bo ar d as was 1a mp ou le of IAPSO St a nd ar d Sea wa t er (b at ch P 11 2) pe r st a tion . Sa lin it y was mea sur ed 1 �2 d ays af t er wa te r co lle ct ion . Owin g to te mp o ra l con du ct ivity se nsor sh if t s, the co rr e ct io n wascar ried ou t for sta t io n nos. 55 8 -5 66 , 5 67 -6 0 2 an d 6 03 -6 2 2 se p ar at ely ( F ig ur e 3) .
Because oxygen sensors cannot be calibrated satisfactorily on the laboratory, field calibrationis the only alternative. This procedure was carried out in line with the guideline given byMILLARD (1991) by merging the down-profile CTD data with corresponding up-profile watersamples. Oxygen residuals of the final fit versus stations are shown in Figure 4.
Oxygen and nutrient measurements were carried out by ODF-technicians: The bottle datawere made useable on board. The final state, however, was obtained later by completerecalculation and verification at ODF in La Jolla.
Aft er re ad in g the wa te r sam ple tem pe r at ur e, oxyg e n sa mp les we re dra wn in t o 12 5 ml io d in ef la sks which we re rinsed ca re fu lly with min ima l agita tio n, th en filled via a dr a wing tu be an da llowed to over flow fo r at le ast two flask volum e s. Re a ge nt s wer e add ed to fix th e oxyge nb ef or e sto pp e ring . Th e fla sks wer e sha ke n twice � im me d ia te ly an d aft er 20 min u te s � toe nsur e tho ro u gh d isp er sio n of t h e Mn ( OH)2 pr ecip ita te . Th e sam ple s we re an alyze d wit hin 4 t o3 6 ho ur s aft e r wa te r collection . Disso lved oxyg e n me asu re me n ts wer e per f or me d via titr at io n

in th e volum e -calib r at ed io dine flasks with a 1 ml micr o bu re t , using who le- bo tt le Win kler t itr at ion t echn iq u e af t er CARPENTER (19 65 ) wit h mod if ica tio ns by CUL BERSO N et al. (19 91 ) excep t t ha t st a nd ar d s an d bla nks wer e run in sea wa t er . Th is p a ra me t er is rep or t ed in ml/ 1 units.
A BSH technician, using distilled water with a commercially prepared standard, drew samplesfrom most of the test rosette stations and ran them on the BSH Dosimat dead stop indicatortitration system. She consistently got lower values, from 0.20 ml/l on the first test cast toabout 0.11 ml/l on the others. Standards were exchanged, but the difference in standardswas much less than that in data. The reason for the difference was never conclusivelydetermined. Laboratory temperature ranged from 20° to 22°C in the hood where the O2-ringwas set up based on periodic checks with the draw temperature. Several standards weremade up and compared to ensure reproducibility of the results and to avoid basing the entirecruise on one standard. A correction was made for the amount of oxygen added with thereagents. Combined reagent/seawater blanks were determined to account for oxidizing orreducing materials in the reagents. The oxygen thionormality values and blanks werereviewed for possible problems and smoothed if necessary.
Nu tr ie n t sa m ple s we r e dr a wn in t o 45 cc hig h den sit y po lye t h yle n e , na r ro w mou t h , scre wca pp e d bo t t le s which we r e rin se d twice bef o r e fillin g . Th e wa t e r sa m ple s ma y have b e en re fr ig e ra t e d at 2° to 6° C fo r a ma xim u m of 15 ho u r s. Nut r ien t ana lyses we re pe rf o r me d o n a Te ch n icon Aut o a n alyze r. The pr oce d ur e s use d ar e descr ibe d in HAGER et al. (1 9 7 2) a n d AT L AS et al. (1 9 7 1) . St a n d ar d izat io ns we re pe rf o r m ed with solu t ion s pre p a r ed on bo a rd f r om pr e- we igh e d st a n da r d s. Th ese solu t io n s we r e use d as wo rkin g st a nd a r d s be f or e and a f te r each cast (a p p r oxim a te ly 36 sa mp le s) to co r r ect inst r u me n t al dr if t dur in g an a lyse s. Se tso f 4 - 6 dif f e re n t co n cen t r a tio n s o f ship b oa r d st a n d ar d s we r e an a lyze d pe r io dica lly to de t er m in et h e lin ea r it y of co lo rim e t er re sp o n se an d th e re su lt in g co r r ect ion fa ct o r s. Ph osp h a te wasa n alyze d using hyd r a zin e red u ct io n of ph osp h o mo lyb dic acid as de scr ib ed by BERNHARDT a n d WI L HEL M S (1 9 67 ) . Silica t e wa s ana lyze d usin g st a n n ou s chlo r id e red u ct io n ofsilico m olb d ic acid . Nit r ite wa s an a lyze d using diazo t iza t io n an d co u plin g to for m dye . Nit r at e wa s re d uce d by cop p e r ize d ca d m ium an d th en an alyze d as nit r ite . T h e se th r ee an alyse s uset h e me t ho d s of ARM ST RONG et al. ( 1 9 6 7) . Nu t r ie n t s a r e re p o r te d in µm ol/ l un it s.
Property sections from CTD data as well as from water sample data, calculated by means ofobjective analyses, are presented in Figures 5 to 11. CTD data processing and qualityevaluation will be discussed in greater detail in a separate data report. Moreover, a scientificanalysis of all hydrographic data is in preparation and will be published elsewhere and thuspreliminary results are not presented here. All hydrographic data are submitted forindependent quality evaluation to the WOCE Hydrographic Programme Office.
For test reasons only, XBT measurements were carried out at selected CTD stations inparallel with CTD casts. The following probes of two manufacturers were tested: 24 SIppian�Deep Blue�, 12 Sparton �Deep Blue�, 12 SParton �T-7�, and 13 Sippican �T-5�. Acquisitionsystems used were Sippican MK-12 and Sparton BT. The purpose of this test was to providedata from the North Atlantic for the international co-ordinated re-evaluation of the probe�sdepth fall rate with the aim of developing community-wide accepted recommendations for anew depth formula or a revision of the standard coefficients respectively (SY, 1991). A similar

XCTD versus CTD test sequence failed to take place because the manufacturer was not ableto provide probes in time.
5.2 Current Measurements (M. Bersch, J. Meincke, A. Mittelstaedt)
Two types of current measurements took place during METEOR cruise no. 18: The recordingof the instantaneous near surface currents by means of an acoustic doppler current profiler(ADCP) and the long-term recording of currents by means of moored current meters.
For the ADCP measurements a hull-mounted system from RD Instruments, San Diego, wasemployed, using a pulse frequency of 150 KHz. The data were sampled continuously andaveraged over intervals of 4 minutes, starting September 2, 18:00 to September 22, 10:37UTC. The parameters recorded were:
a) Hor izon t al an d ve rt ica l velocit y com p on en ts re la t ive to th e ship in ea rt h coo rd ina te s (du e tocou plin g of the ADCP wit h the sh ip �s ma in gyr o) in 30 de p th in te rvals of 16 m th ickne ss in t he u pp e r 50 0 m . T h e ve locit y com po n en ts we re co mp en sa t ed f o r pitch a nd ro ll.
b) Navigation data of the Global Positioning System: latitude, longitude, ship speed, shipcourse, pdop.
c) Sea surface temperature recorded by the ADCP for the computation of the sound speed.
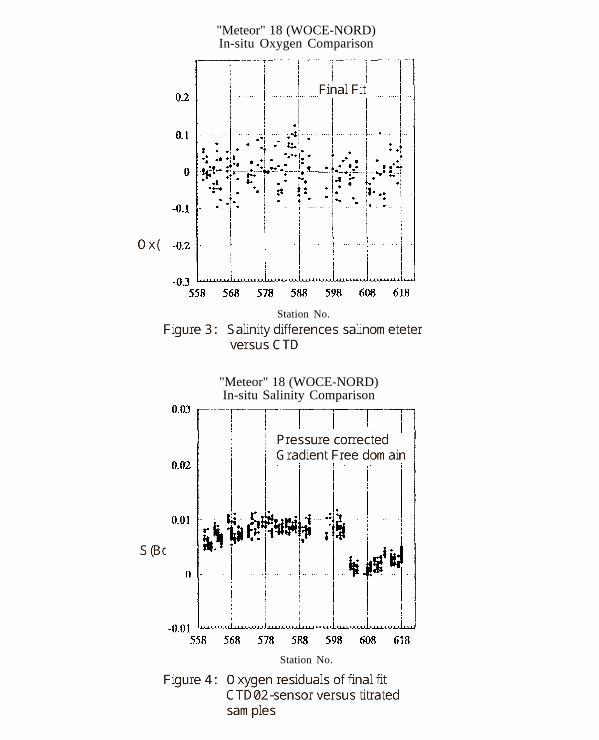
There were no larger gaps in GPS data available. Small data gaps of a few hours in ADCPmeasurements were caused by bad weather conditions and computer problems. In roughseas, which occurred only a few days, the depth penetration of the ADCP pulse reduced toless than 200 m. Most of the time the penetration depth was greater than 300 m. About 7000velocity profiles were recorded during the cruise. Spatial resolution was about 1 km. On theIcelandic and Celtic shelves bottom tracking was activated and the ship speed was activatedand the ship speed was recorded relative to the bottom, which enables a correction of theADCP velocity data for misalignment of the ADCP transducer and the ship�s keel. Figure 12shows the distribution of the currents along the ships track, integrated over a depth intervalfrom 70 to 380 and the tides eliminated (BERSCH, 1993)
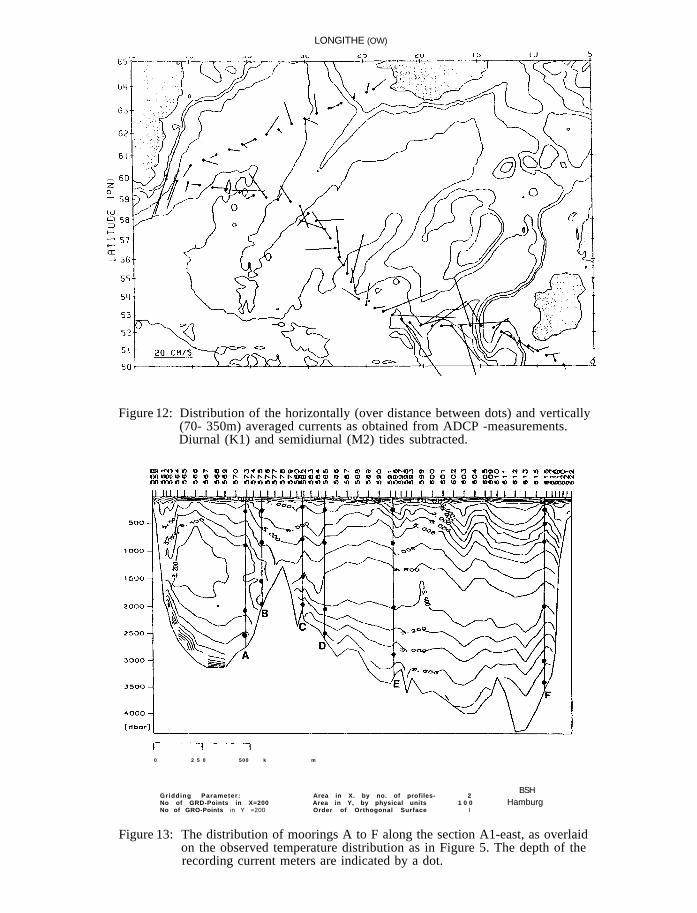
The moored current meter arrays were of standard design by IFMH (moorings A, B, C, D) andBSH (moorings E, F). The deployment procedure was "top-buoyancy first-anchor last". Sinceall moorings were deployed over sloping bottom, a hydrosweep survey was carried out priorto deployment. This avoided effectively misplacements of the systems in the roughtopography. The location of the moored arrays along the WOCE section A1/east and thevertical distribution of the recording instruments is given in Figure 13 as an overlay to thetemperature distribution along the section. The recording instruments were all AanderaaRCMs of the type 4, 5 and 8. Pre-cruise calibration of the sensors was provided by Aanderaafor the instruments in moorings A to D, and by BSH for mooring E and F. Details of themoorings will be part of the data volume, that is expected to be published after recovery of thesystems. So far, Table 1 provides information about the basic instrument locations.

5.3 Tracer Oceanography: Tritium/Helium and Radiocarbon(R. Bayer, B. Hoffarth)
An overview of the total of the stations occupied during M 18 is given in chapter 7. The tracersampling program was performed with regard to the WHP sampling scheme but due to therestricted measurement capacity for tritium 3He/4He and 14C the sampling density particularlyfor these tracers needed to be somewhat coarser. The basic horizontal resolution wasbetween 30 nm and 60 nm with a smaller station spacing near ocean boundaries and large-scale topographic features as the continental slope and the Mid-Atlantic Ridge. The verticalsampling density was guided mainly from hydrographic features encountered with the CTDduring the downcast. Special emphasis was given to obtain a representative tracer data setfrom all the watermasses involved in the North Atlantic Overturning.
All samples were drawn from 10 liter Niskin bottles mounted to a 24 bottles rosette/CTDsystem. Helium and tritium regularly were sampled parallel and only from bottles where alsothe CFCs were done. 450 tritium/helium pairs were derived from 43 stations, i.e. thetritium/helium coverage is about 35% of the total of water samples taken on the section (thelower limit recommended from WHP is about 20%). The typical sampling frequency variedbetween 10 and 14 sample pairs per station. Radiocarbon sampling was restricted only to afew stations to characterize typical watermasses and a total of 80 samples was obtained.
Due to the extremely low concentrations of our tracers special care has to be taken that thetracer content in the water is not altered by contamination with ambient air. To verify that noextraordinary levels for helium or tritium were encountered from the ship both air sampleswere flame sealed and water initially free of tritium was equilibrated with ambient water vaporrepeatedly. As the other samples these background control samples will be analyzed underroutine conditions.
The measurement of tritium/helium and radiocarbon requires extraordinary laboratoryequipment and cannot be done at sea. For that reason our work during the cruise wasrestricted to the sampling program. The data subset reported below was obtained during1992. The complete data set will be available until autumn 1993.
Due to the very low solubility in sea water, helium isotope analyses is very sensitive to anycontamination and for this reason the water was sampled in an all metal pinched-offcontainer. In the home laboratory the samples were degassed in a vacuum extractionsystem. The extracted gasses are transferred to a special mass spectrometer, where heliumis separated from the other gasses and both the 3He/4He ratio and the 4He concentration aremeasured subsequently. The achieved precision is about ±0.15% for the 3He/4He ratio andca. ±0.5% for the 4He concentration. Most of the helium isotope samples obtained from M 18were processed during 1992 and the remaining measurements are scheduled for 1993.
Sam ples fo r tritium an alyse s we r e ta ken and st or e d in 1 lite r gla ss bo tt les. All an a lyse s will bea pp lyin g the 3He in gr o wt h met ho d. For th is th e sa m ple is de ga sse d an d sea led off in a glassb ulb. Dur in g an ap p ro pr iat e tim e 3He will in gr o w fr om tr it ium deca y. The mea sur em e nt of thissma ll ga s am o un t is pe rf o rm ed on the sa me ma ss sp ectr om e te r use d fo r the he lium isot o pe s.

All t he ma ss sp ectr o me tr ic tr it ium m e asur em e nt s are sch e du le d f or 19 93 . Th e tr itium de te ct ion lim it will b e 0.0 5 TU or be tt er an d the m ea sur em e nt p re cisio n will be ar o un d ±1 . 5%. Th e tr itium d at a sh o wn in this rep or t wer e obt ain ed by low-le ve l co u nt in g . The accu r acy ach ie va b le wit h t his cla ssica l me th o d of tr it iu m ana lysis d o es n o t fu lf ill t h e WHP req uir em en ts, b ut it com e s ve r yclo se to the st an da r d re com me nd e d fo r the No rt he r n At la n tic. We pla n to co mp ar e our ma ssspe ct ro m et ric t ritiu m me a su re me n ts with t he re su lts o bt a in ed by b -co un tin g.
Table 1: Details on moored current meter arrays
Mooring ID Latitude LongitudeBottom depth
[m]
Instrumenttype/depth [m]
(Aanderaa)
Date ofdeployment
1991A1 59°08.8 N 34°01.0 W 2855 RCM 8 263 9/8
RCM 8 876RCM 8 2088RCM 8 2551
B1 59°01.0 N 32°48.6 W 2110 RCM 8 209 9/8RCM 8 822RCM 8 1534RCM 8 1996
C1 58°10.9 N 2937.9 W 2067 RCM 8 171 9/10RCM 8 784RCM 8 1496RCM 8 1958
D1 57°22.4 N 28°11.4 W 2633 RCM 8 238 9/11RCM 8 851RCM 8 2063RCM 8 2526
E1 54°18.8 N 25°52.2 W 3123 RCM 8 222 9/14RCM 8 822RCM 8 2022RCM 8 2872
F1 52°20.5 N 16°20.1 W 3481 RCM 8 210 9/19RCM 8 510RCM 8 810RCM 8 2010RCM 8 3010RCM 8 3460
For 14C analyses the water was transferred from the Niskin bottle into an evacuated glassbulb. On-shore the total inorganic carbon contained in the bulb was converted to carbondioxide and the latter was extracted quantitatively. Afterwards carbon was reduced viacombustion and pressed inside a so-called target. The carbon isotope ratio of the materialderived is determined using accelerator mass spectrometry (co-operation with ETH-Zürich,Switzerland). The precision of the data is estimated to about ±0.5%.
An ou tline of the tr it iu m distr ibu tio n on th e M 18 se ct ion is given in F ig ur e 14. De nm a rk St ra it O ve rf lo w Wat e r (DSO W) de r ived fro m the Ice lan dic Sea is cle a rly in d icat e d by high tr it iu mcon ce nt r at io n s in a de ep bo un da r y cu r re nt a t t he we st er n con t in en ta l slop e of t h e Ir m in ge r Sea .T he trit iu m value s are close to th e recen t sur fa ce le ve l and re flect the ra pid ren ewa l of th iswat er ma ss. The sam e fea t ur e is visib le at the ea st er n slo pe of the Mid- Atlan tic Rid g e, whe r eI ce la nd Scot lan d Ove rf lo w Wat er (I SO W) is sp re ad ing sou t hwar d . The tr it ium con cen tr a tion sa re m od e ra te ly lo we r com p ar ed t o t he DSOW a n d display b o th t h e high e r age o f ISO W an d t he str on ge r dilu tion by mixing wit h su r ro un din g wa t er ma sse s. In th e dee p easte rn pa rt of the section th e tritium va lu e s dr op be lo w the de te ct ion lim it. Her e also extr em ely low CF Ccon ce nt r at io n s an d an in cre ased silicat e co n te nt we re ob se rve d an d may be ind ica tive fo r an or th wa r d mo vin g wa t er ma ss or ig ina tin g in th e so u th . In the up pe r wat er co lu mn on th e we st a nd on the ea st sid e of the sect io n the East Gre e nlan d Cur re n t an d the No rt h At lan tic Cur re n ta re deline at e d with re la t ively hig h tritium co nce nt ra tio ns do wn to abo ut 40 0 m dep th . In int er me d ia te de pths th er e see ms to b e a west t o east tr itium gr adie n t with high e r co n ce ntra t io nsin th e west whe re t h e wa t er colu mn is r en ewe d by wint er co nve ct io n mor e eff ectively.
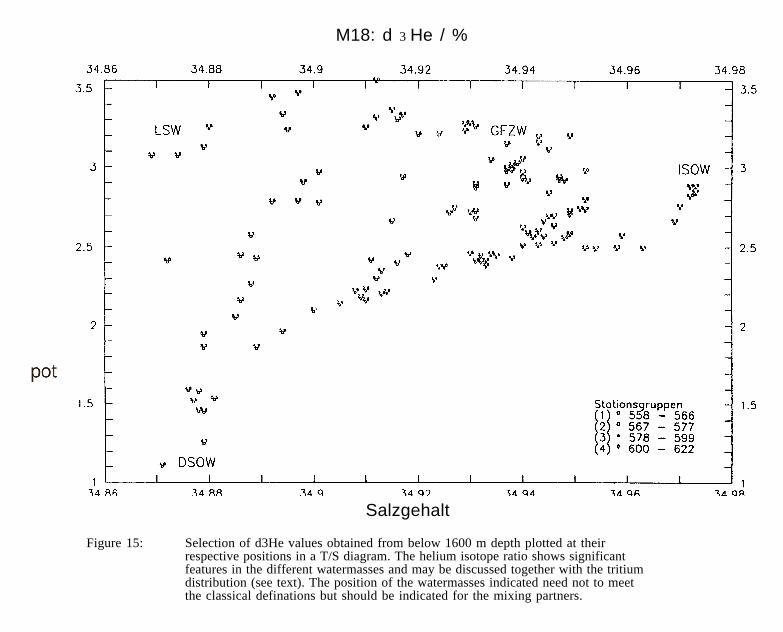
Figure 15 shows a part of the helium isotope data actually available (only some of the dataobtained from below 1600 m depth are included) together the hydrographic measurements.The helium values are given as d3He (the relative deviation of the samples 3He/4He ratio fromthat of atmospheric air), and the numbers are plotted at their respective positions in the T/Sdiagram. Apparently the DSOW obtained in the deep western Irminger Sea (stations 558-566) shows the lowest d3He values (4.5-5.5%) in this part of the section. The samplesobtained above and east from the DSOW (stations 558-577) show in three different branchesthe transition to Labrador Sea Water (LSW, d3He ~5.5%) and to Gibbs Fracture Zone Water(GFZW, d3He ~7.5%). On these branches from west to east (left to right in the Figure) d3Hetends to increase slightly and reflects the successively growing influence of waters derivedfrom the Northeast Atlantic. Directly east of the Mid-Atlantic Ridge (stations 578-599) d3Hevaries between 5% and 7% and in the branch connected to the IOSW a relative uniformdistribution of d3He (~6%) is observed. The lowest d3He values obtained from the M 18cruise were sampled in the deep eastern part of the section (2%<d3He<4%, stations 600-622)where also zero tritium concentrations were detected. We attribute this feature to the highage of this watermass and part of the 3He excess might be from terrigenic origin.
A rough sketch of tritium/3He age distribution is given in Figure 16. Except the regions wheredeep western boundary currents are present ages apparently increase with depth. In thedeep eastern part of the section values rise above 30 years and the tritium/3He age is nottrustworthy any longer. More information about this watermass will be obtained from theradiocarbon measurements. Minimum ages in DSOW (formal tritium/3He age about 10 years)and in ISOW (~14 years) reflect their higher ventilation rates compared to the surroundingwatermasses. To evaluate the ventilation age of both NADW constituents a model taking intoaccount mixing effects and the mean residence time of the overflow waters in the EuropeanPolar Seas is needed. For a first order approximation we may neglect any mixing effects andcompare the 14 years obtained in the ISOW to the Tritium/3He age observed in the Faeroe-Bank-Channel (ca. 10 years, unpublished measurements). The resulting traveling time forISOW of about 4 years is an upper limit, as the dilution by surrounding waters results in an

overestimation of the apparent age. Therefore the mean propagation traveling velocitydeduced from this guess (~1.3 cm/s) may be accepted as a lower limit.
The further evaluation will include the complete data set derived from M 18. Especially weplan to compare the tritium/3He information with the CFC data obtained parallel to ourmeasurements. In addition we plan to verify the potential of transient tracer ratios: we feelthat the CFC/tritium ratio is a powerful tool to study watermass formation and circulation onthe time scale of the last two decades. CFC/tritium will yield information orthogonal to boththe tritium/3He and the CFC-11 /CFC-12 age.
5.4 Tracer Oceanography(A. Putzka, K. Bulsiewicz, G. Fraas)
CFC-WorkSamples were taken according the WOCE scheme using glass syringes. The capacity formeasurements allowed to analyze every second water sample for F-11 and F-12. Thedetection limits were 0.005 pmol/kg, and the precision for surface water concentrations betterthan 1% for both F-11 and F-12.
Industrial production of the CFC's F-11 and F-12 since the 1940ies caused increasingconcentrations in the atmosphere, and, due to interfacial gas exchange, in the surface layerof the oceans. By transport processes surface water is transferred into the interior of theocean where it can be traced by measuring distributions of non-steady state tracers (transienttracer concept). 'Younger' (age since leaving the surface) water is generally tagged withhigher CFC concentration in comparison with 'older' water. Additionally, the F-11/F-12-ratiosupplies information since the atmospheric ratios have changed with time.
• Deep water formation processes within the North Atlantic and Labrador Sea,• overflows from the northern basins, ISOW and DSOW and,• abyssal waters influenced by Antarctic Bottom Water supplied by eastern intensified
northward flow mainly in the eastern Atlantic.
Overflow and formation processes supply 'young' (tagged with high CFC concentration) watermasses, whereas original east Atlantic abyssal water is 'old', i.e. free of CFCs. In Figure 17the CFC F-11 section for the cruise is shown. Except for the deep eastern part, we foundCFC-concentrations of at least ten times the detection limit throughout the section.
At the bottom of the Irminger Basin (stations 558 to 573) high F-11 concentration of 3.1pmol/kg were found, indicating, together with temperature and salinity, Denmark Straitoverflow water (DSOW). A thin tongue reaching LIP to nearly 1500 m depth of DSOW-influenced water with high CFC concentration is met also at the slope to the Greenlandcontinent. At the western slope of the Reykjanes ridge a water mass with substantially lowerCFC-concentration was found. This CFC minimum spreads at mid-depth (about 2300 m)over nearly the whole basin except for the most western part. This water is believed to becoming from the Charles-Gibbs Fracture Zone south of the Reykjanes Ridge.

At the slope east of the Reykjanes Ridge within the Iceland Basin (stations 573 to 596) higherCFC concentrations were found. These waters belong to the Iceland Scotland OverflowWater (ISOW). For all stations within the Iceland Basin, aside from the shallow ones at thetop of the ridge, the bottom CFC-concentrations were higher than those one to two hundredmeters further up. Downwards the slope, the bottom CFC and the corresponding F-11/17-12values decrease steadily. This indicates increasing 'age' of the corresponding waters. A firstorder estimate (comparing measured ratios and concentrations with that of the atmosphericinput history) leads to about 13 years for water masses just at the top of the ridge and 20years for the waters at the deepest part of the Iceland Basin. This age reflects the age of the'youngest' component of the water considered, The parallel smooth increase of silicateconcentrations downwards the slope indicates increasing contribution of deep east Atlanticwater, providing together with T and S characteristics, evidence for eastern Atlantic deepwater spreading into the Iceland Basin.
The stations 599 to 609 were south of the Rockall Plateau. The lowest CFC concentrationswere detected at the bottom, decreasing from west to east. Both features signify westwardflowing eastern Atlantic abyssal water.
The final part of the section (stations 611 to 622) covers the entrance of the Rockall Trough.The structure of the isolines in Figure 17 clearly indicates that the 'older' (lower CFC) waterwas intensified at the eastern slope as expected for northward flowing water. CFC valuesnear the bottom below 4000 m were close to the detection limit but certainly significant. Sincethere are no other sources or 'young' bottom water in the East Atlantic aside from ISOW, thisfact might be interpreted that at least part of the ISOW, this fact might be interpreted that atleast part of ISOW mixes into the deep eastern Atlantic south of this section.
Two types of Labrador Sea Water (LSW) were observed during the cruise: one west ofReykjanes Ridge, the other east of it. Both types have homogeneous properties: LSW (west)with 3.46 pmol/kg and LSW (east) with 1.9 pmol/kg F-11. The downward CFC decreasebelow the two types of LSW were different: steep for the western, but gradual for most of theeastern type LSW. In the eastern part of the section below 2000 m substantial CFCconcentrations were found down to more than 3000 m.
CFC Calibration(Roether)
Only CFC11 and CFC12 have been measured during the cruise. The gas chromatograph wasequipped with a packed column (Porasil C). Standard gas by Ray Weiss has been used forcalibration. The original data have been reported against SIO86 and have now beencorrected for SIO93. Quality flags for CFC11 and CFC12 follow Woce standard.
Problems noticed: Some F11 and F12 ratios show rather high values for low concentrations.Since no water was encountered during the cruise with vanishing CFC concentrations it couldbe not be ruled out if some of the rosette water samplers were contaminated.

Reproducibility:F-11: 0.7 % or 0.006 pmol/kg (whichever is greater)F-12: 0.8 % or 0,005 pmol/kg (whichever is greater)
Precision:F11: 0.35% for concentrations >0.5 pmol/kg and 3 fmol/kg for concentrations <0.5 pmol/kgF12: 0.41% for concentrations >0.5 pmol/kg and 2 fmol/kg for concentrations <0.5 pmol/kg
Mean water blank, detection limit:(Has been measured in the lab after the cruise)F-11: 0,00096 pmol/kg +/- 0.001F-12: 0,0044 pmol/kg +/- 0.002
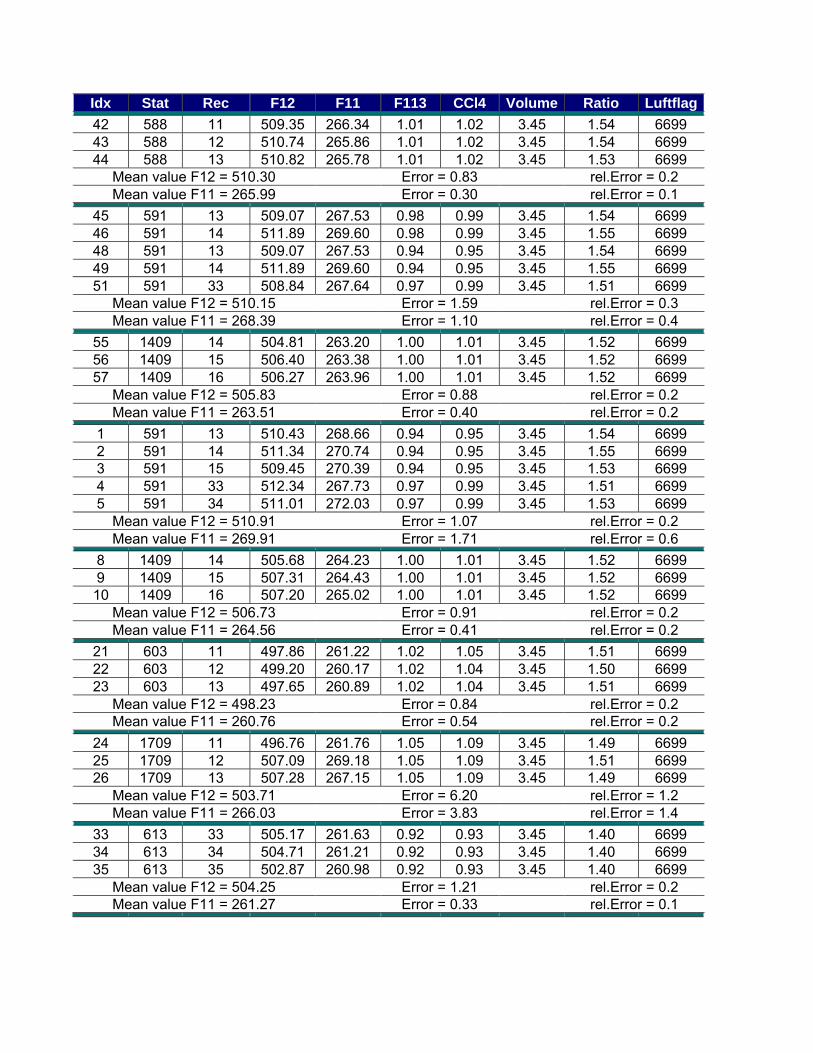
Air measurements:Individual air measurements performed during the cruise (SIO 93 scale):
Quality byte: F-11 F-12 F-113 F-101 2 3 4
Idx Stat Rec F12 F11 F113 CCl4 Volume Ratio Luftflag
1 563 11 510.64 267.61 1.00 1.01 3.45 -1.47 66992 563 12 510.44 266.66 1.00 1.01 3.45 -1.46 66993 563 13 514.02 271.11 1.00 1.01 3.45 -1.48 6699
Mean value F12 = 511.70 Error = 2.01 rel.Error = 0.4Mean value F11 = 268.46 Error = 2.35 rel.Error = 0.9
31 571 21 504.25 265.57 1.00 1.01 3.45 1.49 669932 571 22 506.62 265.90 1.00 1.01 3.45 1.48 669933 571 23 505.98 266.07 1.00 1.01 3.45 1.49 6699
Mean value F12 = 505.62 Error = 1.22 rel.Error = 0.2Mean value F11 = 265.85 Error = 0.26 rel.Error = 0.1
34 581 15 511.46 267.72 1.00 1.00 3.45 1.50 669935 581 16 510.55 267.01 1.00 1.00 3.45 1.50 6699
Mean value F12 = 511.01 Error = 0.65 rel.Error = 0.1Mean value F11 = 267.37 Error = 0.50 rel.Error = 0.2
36 584 28 516.07 270.90 0.98 0.97 3.45 1.53 669937 584 29 514.32 268.06 0.98 0.97 3.45 1.52 669938 584 30 518.84 268.97 0.98 0.97 3.45 1.51 6699
Mean value F12 = 516.41 Error = 2.28 rel.Error = 0.4Mean value F11 = 269.31 Error = 1.45 rel.Error = 0.5
39 585 21 515.44 270.09 0.97 0.96 3.45 1.54 669940 585 22 514.60 271.50 0.97 0.96 3.45 1.56 669941 585 23 515.37 270.09 0.97 0.96 3.45 1.55 6699
Mean value F12 = 515.14 Error = 0.47 rel.Error = 0.1Mean value F11 = 270.56 Error = 0.81 rel.Error = 0.3
Idx Stat Rec F12 F11 F113 CCl4 Volume Ratio Luftflag
42 588 11 509.35 266.34 1.01 1.02 3.45 1.54 669943 588 12 510.74 265.86 1.01 1.02 3.45 1.54 669944 588 13 510.82 265.78 1.01 1.02 3.45 1.53 6699
Mean value F12 = 510.30 Error = 0.83 rel.Error = 0.2Mean value F11 = 265.99 Error = 0.30 rel.Error = 0.1
45 591 13 509.07 267.53 0.98 0.99 3.45 1.54 669946 591 14 511.89 269.60 0.98 0.99 3.45 1.55 669948 591 13 509.07 267.53 0.94 0.95 3.45 1.54 669949 591 14 511.89 269.60 0.94 0.95 3.45 1.55 669951 591 33 508.84 267.64 0.97 0.99 3.45 1.51 6699
Mean value F12 = 510.15 Error = 1.59 rel.Error = 0.3Mean value F11 = 268.39 Error = 1.10 rel.Error = 0.4
55 1409 14 504.81 263.20 1.00 1.01 3.45 1.52 669956 1409 15 506.40 263.38 1.00 1.01 3.45 1.52 669957 1409 16 506.27 263.96 1.00 1.01 3.45 1.52 6699
Mean value F12 = 505.83 Error = 0.88 rel.Error = 0.2Mean value F11 = 263.51 Error = 0.40 rel.Error = 0.2
1 591 13 510.43 268.66 0.94 0.95 3.45 1.54 66992 591 14 511.34 270.74 0.94 0.95 3.45 1.55 66993 591 15 509.45 270.39 0.94 0.95 3.45 1.53 66994 591 33 512.34 267.73 0.97 0.99 3.45 1.51 66995 591 34 511.01 272.03 0.97 0.99 3.45 1.53 6699
Mean value F12 = 510.91 Error = 1.07 rel.Error = 0.2Mean value F11 = 269.91 Error = 1.71 rel.Error = 0.6
8 1409 14 505.68 264.23 1.00 1.01 3.45 1.52 66999 1409 15 507.31 264.43 1.00 1.01 3.45 1.52 669910 1409 16 507.20 265.02 1.00 1.01 3.45 1.52 6699
Mean value F12 = 506.73 Error = 0.91 rel.Error = 0.2Mean value F11 = 264.56 Error = 0.41 rel.Error = 0.2
21 603 11 497.86 261.22 1.02 1.05 3.45 1.51 669922 603 12 499.20 260.17 1.02 1.04 3.45 1.50 669923 603 13 497.65 260.89 1.02 1.04 3.45 1.51 6699
Mean value F12 = 498.23 Error = 0.84 rel.Error = 0.2Mean value F11 = 260.76 Error = 0.54 rel.Error = 0.2
24 1709 11 496.76 261.76 1.05 1.09 3.45 1.49 669925 1709 12 507.09 269.18 1.05 1.09 3.45 1.51 669926 1709 13 507.28 267.15 1.05 1.09 3.45 1.49 6699
Mean value F12 = 503.71 Error = 6.20 rel.Error = 1.2Mean value F11 = 266.03 Error = 3.83 rel.Error = 1.4
33 613 33 505.17 261.63 0.92 0.93 3.45 1.40 669934 613 34 504.71 261.21 0.92 0.93 3.45 1.40 669935 613 35 502.87 260.98 0.92 0.93 3.45 1.40 6699
Mean value F12 = 504.25 Error = 1.21 rel.Error = 0.2Mean value F11 = 261.27 Error = 0.33 rel.Error = 0.1
Idx Stat Rec F12 F11 F113 CCl4 Volume Ratio Luftflag
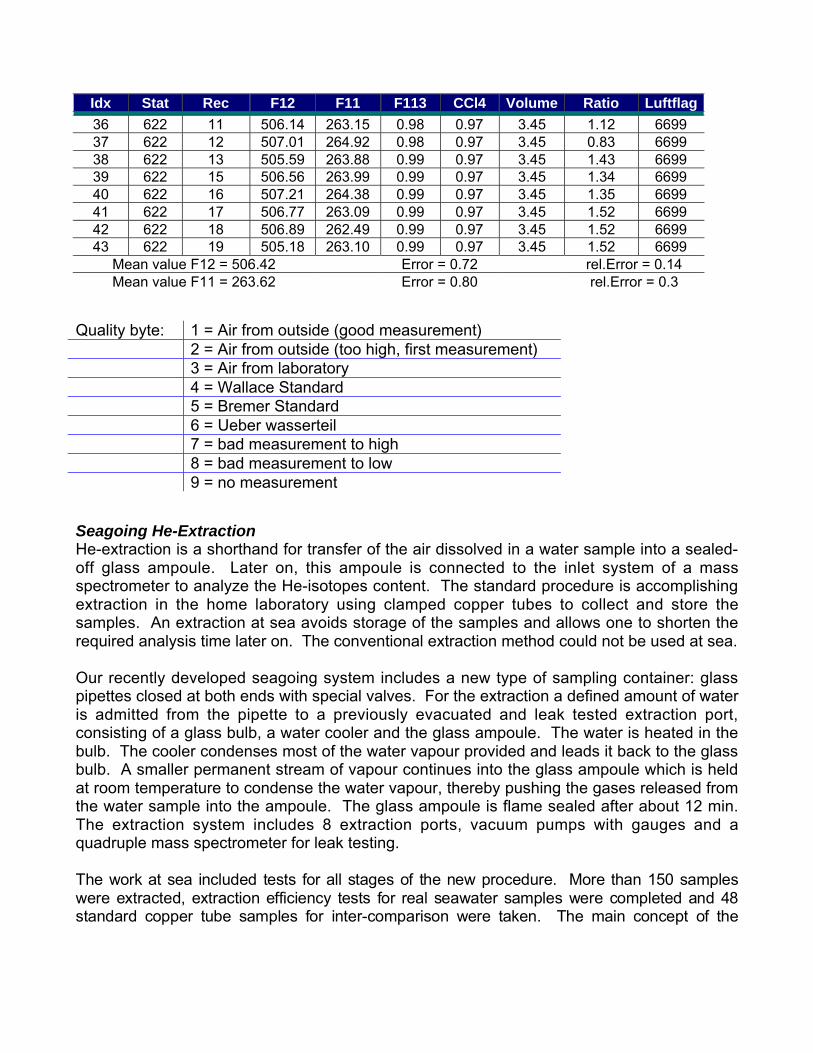
36 622 11 506.14 263.15 0.98 0.97 3.45 1.12 669937 622 12 507.01 264.92 0.98 0.97 3.45 0.83 669938 622 13 505.59 263.88 0.99 0.97 3.45 1.43 669939 622 15 506.56 263.99 0.99 0.97 3.45 1.34 669940 622 16 507.21 264.38 0.99 0.97 3.45 1.35 669941 622 17 506.77 263.09 0.99 0.97 3.45 1.52 669942 622 18 506.89 262.49 0.99 0.97 3.45 1.52 669943 622 19 505.18 263.10 0.99 0.97 3.45 1.52 6699
Mean value F12 = 506.42 Error = 0.72 rel.Error = 0.14Mean value F11 = 263.62 Error = 0.80 rel.Error = 0.3
Quality byte: 1 = Air from outside (good measurement)2 = Air from outside (too high, first measurement)3 = Air from laboratory4 = Wallace Standard5 = Bremer Standard6 = Ueber wasserteil7 = bad measurement to high8 = bad measurement to low9 = no measurement
Seagoing He-ExtractionHe-extraction is a shorthand for transfer of the air dissolved in a water sample into a sealed-off glass ampoule. Later on, this ampoule is connected to the inlet system of a massspectrometer to analyze the He-isotopes content. The standard procedure is accomplishingextraction in the home laboratory using clamped copper tubes to collect and store thesamples. An extraction at sea avoids storage of the samples and allows one to shorten therequired analysis time later on. The conventional extraction method could not be used at sea.
Our recently developed seagoing system includes a new type of sampling container: glasspipettes closed at both ends with special valves. For the extraction a defined amount of wateris admitted from the pipette to a previously evacuated and leak tested extraction port,consisting of a glass bulb, a water cooler and the glass ampoule. The water is heated in thebulb. The cooler condenses most of the water vapour provided and leads it back to the glassbulb. A smaller permanent stream of vapour continues into the glass ampoule which is heldat room temperature to condense the water vapour, thereby pushing the gases released fromthe water sample into the ampoule. The glass ampoule is flame sealed after about 12 min.The extraction system includes 8 extraction ports, vacuum pumps with gauges and aquadruple mass spectrometer for leak testing.
T he wor k at sea includ ed te st s for all st ag e s of th e ne w pro ced ur e. Mor e tha n 150 sa mp le swer e ext ra ct e d, ext r actio n ef ficie ncy tests fo r rea l se a wa te r sam ple s we r e co mp let ed an d 48 sta nd ar d cop p er tub e sam p le s fo r int e r- co mp a riso n wer e taken . Th e main con ce pt of th e

e xt ra ct ion syst em wa s su cce ssfu l a lt h ou gh cr it ica l po in t s in ha nd lin g an d e qu ip m en t wer e fo u nd d ur in g the cr uise . Th e tests un de r rea l co n ditio ns on a cru ise pro ved to be in d ispe n sa ble ino rd er t o e st a blish the se ag oing extr a ct io n as a sta nd ar d p ro ced ur e for f u tu re He -t ra cer wor k.
5.5 Marine Chemistry: The Carbonate System(B. Schneider, K. Johnson, L. Mintrop)
Ext en de d mea sur em en t s of th e pa r am et e rs of the ocea nic car bo n at e syste m wer e pe r fo rm e dd ur in g M 1.8 . Th e CO2 pa rt ia l pre ssu re (p CO 2) in su r fa ce wa te r was me asur ed co nt inu ou slya lo ng th e WO CE line an d also be t we en Re ykja vik an d Ca pe Fa rve l. Hyd ro ca st sa mp les we re a na lyze d for to ta l car bo n at e (T CO2) , to ta l alka linity (T A) , and pCO2. Ho we ver , due to the time con su min g an a lytica l p ro ced ur e, no t all the sa mp les cou ld be an alyze d. T CO 2 wa s de t er min ed f or each seco nd pro f ile, wh er ea s TA and pCO 2 we re me asur e d at 13 sta t io ns fo r 12 se le ct e dd ep th s.
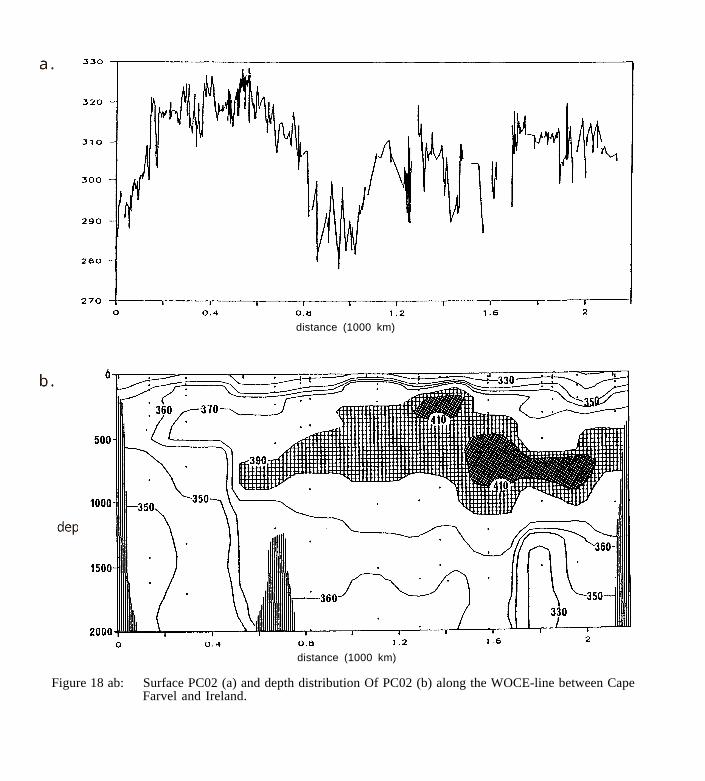
The CO2 partial pressureThe pCO2 of surface water along the WOCE line (Figure 18a) varies between about 330 µatmand 280 µatm and corresponds to a partial pressure difference between seawater and theatmosphere of -53 atm to -73 µatm. Hence, this area acts as a strong source for atmosphericCO2 during this time of the year. But the pCO2 is not evenly distributed along the transectand as a first approximation to regimes may be distinguished.
Between Cape Farvel and the Reykjanes Ridge an extended area (150 km - 650 km) ofrelatively high (320 µatm) and uniform pCO2 is observed. Nitrate surface concentration alsoshow elevated levels of about 9 µmol/kg. Moreover, the pCO2 changes only slightly withdepth (Fig. 18b) and is close to equilibrium with the atmosphere even in depths down to 2000m. This indicates that deep mixing occurs, inhibiting primary production in surface water andconsequently preventing decomposition of sinking organic matter in deep water. Thesefindings are consistent with the oxygen distribution in this area (Figure 7).
East of Reykjanes Ridge (800 km) the pCO2 drops to values of roughly 285 µatm, but is thenincreasing to about 310 µatm, west of Ireland (2200 km). This increase is superimposed bystrong small scale fluctuations with amplitudes up to ±15 µatm. Low nitrate concentrations inthis area indicate that production of biomass has drawn down the pCO2. However, nitrateconcentrations cannot explain the increase of pCO2 between 800 km and 2200 km as NO3 isdecreasing from about 3 µmol/kg to <0.5 µmol/kg). Therefore, the trend in pCO2 has to beexplained by the increasing surface temperature and possibly by an enhanced uptake Of CO2
from the atmosphere due to an earlier onset of the spring bloom in the Southeast. Thedistribution of pCO2 with depth (Fig. 18b) in the area between the Reykjanes Ridge andIreland shows a distinct pCO2 maximum with values up to 410 µatm between 200 in and 1000m. This is obviously an older water mass that is enriched in CO2 and consequently depletedin O2 (Figure 7) due to the decomposition of sinking organic matter. As this layer is close tothe surface, local upwelling may introduce CO2-enriched water to the surface and is thuscausing the observed small scale variability of pCO2. As no pCO2 measurements for thewinter months exist for the North Atlantic, the depth profile for TCO2 and pCO2 at station 607
(52.5° N/20.0° W) were used to calculate the surface pCO2 for the months October throughMarch. It was assumed that neither primary production nor respiration takes place during thistime and that only convective mixing, cooling, and exchange with the atmosphere (20 cm/h),the state of the carbonate system was recalculated in time steps of one month. Figure 19shows the results of these calculation and also obtained during other expeditions in May andJune. As this approach is very sensitive to the choice of the maximum of 335 µatm it givesonly a first idea and has to be examined by direct measurements. Following the sameprocedure, also winter NO3 concentration were calculated and are presented in Figure 19.
Total carbonate and total alkalinityThe evaluation of TCO2 data is not yet finalized. However, a plot of the TCO2 distributionusing preliminary data was produced and showed a pattern of consistent with that of thepCO2 distribution.
The alkalinity profiles of the stations sampled showed rather uniform characteristics: relativehigh but varying values (around 2330 - 2350 µeq/kg) in the samples from the upper 40 - 60 mand a decrease to values below 2300 µeq/kg at depth between 1000 and 2000 in,corresponding to oxygen minima and nutrient maxima. This was more expressed for themore southern stations (station 591 and higher), where nutrient concentrations approachedzero at the surface. Below 2000 m values gradually increase toward the sea floor and reachagain values like at the surface or even higher (up to 22370 µeq/kg). Disregarding thecontributions of different water masses, this behaviour can in principle be explained byremineralization of nitrate at medium depth, leading to alkalinity decrease and dissolution ofcalcium carbonate at greater depth, thus increasing alkalinity. While the nitrate effect will onlybe of minor importance (approx. 10 µeq/kg), dissolution of carbonate particles has a strongimpact on alkalinity. The substantially higher values at the surface therefore might reflect theproperties of different water masses. Superimposed on the alkalinity profiles is a salinityeffect, since alkalinity often is regarded as a rather conservative property. Since salinityvariation is low in these profiles, however, the normalization of the alkalinity values toconstant salinity will not alter the profiles significantly.
A more detailed evaluation of the carbonate system of the part of the North Atlantic requiresthe compilation of all hydrographic and chemical data available and is undertaken at present.
5.6 Marine Meteorology(H.-J. Isemer)
During the cruise, the Department of Meteorology, Institut für Meereskunde, Kiel tested newlydeveloped rain gauges. The high relative wind velocities necessitate special construction forrain gauges to be used at moving ships. The mechanical IFM ship rain gauge was deployedat FS METEOR together with an optical disdrometer. Comparison of both provided the first insitu calibration of the ship rain gauge. The high wind speeds encountered during this cruisewere extremely favourable for this calibration. The result of the cruise further led to animprovement of details of construction. Since cruise M 18 a mechanical ship rain gauge is in

continuous use onboard METEOR. The instrument has been replaced in mid 1992 with theimproved version. The help of the personal of the Deutscher Wetterdienst is acknowledged.
6 Ship's Meteorological Station(J. Sußebach, H. Sonnabend)
Cruise M 18 began under rough weather conditions. A low with S to SW winds of gale force 8to 9 Beaufort moved from the Irminger Sea into NE direction. The following quiet period untilSeptember 10 was characterized by warm and humid air masses with weak fronts overrelatively cold water, resulting in extended fog coverage of the central and southwesternIrminger Sea. On September 11, a cold front of a low pressure system betweenNewfoundland and Cape Farvel developed a wave, which intensified into a large scale stormsystem about 400 nm SE of Greenland. With pressure failing to 980 hPa, its center passedMETEOR slightly to the north and moved into the Norwegian Sea. This development resultedin two days of unfavourable weather conditions with wind from cast turning through south towest and gale force 8 to 9, gusting up to 11 Beaufort, and wave heights reaching 8 m.
Extreme temperatures up to 18'C were reported on this occasion from Narssarssuaq in S-Greenland, which was caused by foehn at the edge of the a.m. depression.
Following another period of 3 days with relatively quiet weather, an initially minor lowapproached from SW of the Azores. It suddenly deepened and in passing METEOR slightlyto the NW of her position it brought an outburst of a SSW gale with 10 to 11 Beaufort forseveral hours. There were two other days with reasonable wind conditions, before a rapidsuccession of two lows with S to SW winds up to 9 Beaufort brought about difficult workingconditions for the oceanographic programme for the period September 19 to 22.
En route to Hamburg via the English Channel the strong winds related to the warm sector of alow near the Faeroe Islands were from astern and helped with a fast journey.
The statistics of the cruise are given in Figure 20 (winds) and 21 (waves) in addition to theactual observations at the synoptic hours (Table 2). In total 187 weather observations weretaken. 186 of them were transmitted into the GTS, 40 radiosondes were launded (0 and 12UTC) and automatically transmitted into the GTS.

Table 2 Graphical listing of weather observations during METEOR cruise 18. The standardmeteorological station code is given for the synoptic hours 00, 06, 12, 18 UTC. Thepositions at the synoptic hours are indicated on top of each entry.

8 Concluding Remarks
The 18th cruise of METEOR turned out to be an extremely rewarding effort with respect toparticipating expertise on water mass issues for the northern North Atlantic. We expect fromthe Joint analysis of the most complete data set describing water mass properties in eddy-resolving section mode a reliable quantification of North Atlantic overturning rates.
A large portion of the success of this cruise has to be attributed to the captain and crew ofMETEOR who provided a reliable and enjoyful platform for our work under not always niceenvironmental conditions.
We appreciate the support from the Bundesminister ftir Forschung und Technologie (WOCE)and the Deutsche Forschungsgerneinschaft.
9 References
ANON (1988): World Ocean Circulation Experiment Implementation Plan, Vol. I + II. WorldClimate Research Programme, Pub. WCRP 11 + 12, World MeteorologicalOrganization, Geneva 1988, 145 pp. and 128 pp.
ANON (1991): WOCE Operational Manual, Vol. 3, Sect. 3. 1, Part 3.1.2: Requirements forWHP Data Reporting, WHP Office Report WHPO 90-1, WOCE Report No 67/91,Woods Hole 1991, 71 pp.
ARMSTRONG, F.A.J., C.R. STEARNS and J.D.H. STRICKLAND (1967): The measurementof upwelling and subsequent biological processes by means of the TechniconAutoanalyzer and associated equipment. Deep-Sea Research, 14, 381-389.
ATL AS, E. L., S. W. HAG ER, L. I. GORDON an d P.K. PARK (1971) : A Pr actica l Manu al for Use ofthe Techn icon Autoana lyzer in Sea water Nutrie nt Ana lyses; Revised. Te chnica l Repo rt215 , Refe rence 71-22. Orego n Stat e University, Depa rtment of Oceanogr aphy. 49 pp.
BERNHARDT, H. and A. WILHELMS (1967): The continuous determination of low level iron,soluble phosphate and total phosphate with the AutoAnalyzer®. Technicon Symposia,Volume 1, 385-389.
BERSCH, M, (1993): On the upper layer circulation of the North Eastern North Atlantic. Deep-Sea Research (submitted).
CARPENTER, J.H. (1965): The Chesaspeake Bay Institute technique for the Winklerdissolved oxygen method. Limnology and Oceanography, 10, 141-143.
CUL BERSO N, C. H. , WI L LI AM S, R. T. , et al. (19 9 1) : A com pa r ison of met h od s for the d et er min at io n o f disso lve d oxyg e n in se awat e r. WHP Of fice Re p or t, WHPO 9 1 -2 , 15 pp .
HAGER, S.W., E.L. ATLAS, L.D. GORDON, A.W. MANTYLA and P.K. PARK (1972): Acomparison at sea of manual and autoanalyzer analyses of phosphate, nitrate, andsilicate. Limnology and Oceanography, 17, 931-937.
KIRKWOOD D.S. and A. R. FOLKARD (1986): Results of the ICES salinity sample bottleinter-comparison. ICES C.M. 1986, mimeo, 16 pp.
MILLARD, R.C. (1991): CTD oxygen calibration procedure. VVHP Operations and Methods,WHP Office Report, WHPO 91-1, 27 pp.
SY. A. (1991): XBT measurements. WHP Operations and Methods, WHP Office Report,WHPO 91-1, 19 pp.

R.V."METEOR" cruise # 18 (WHP A1 05.09.1991 - 21.09.1991) • CTD-station o mooring B.S.H. M442
Figure 1: The WOCE A1-cast section. CTD02-stations are marked by dots. Station numbers are indicated. The circles denotedA to F are locations of moored current meter arrays.

0 250 500 km
FS Meteor 18
Gridding Parameter: Area in X, by no. of profiles=No of GRD-Points in X= Area in Y, by physical units =
BSHHomburg
Figure 2: Distribution of water sample taken along the section
"Meteor" 18 (WOCE-NORD)In-situ Oxygen Comparison
Station No.
"Meteor" 18 (WOCE-NORD)In-situ Salinity Comparison
Station No.

0 2 5 0 5 0 0 k m
FS Meteor 18 TEMPERATUR/ degC
Gridding Parameter: Area in X. by no. of profiles= 2No of GRD-Points in X-200 Area in Y, by physical units = 100No of GRD-Points in Y-200 Order of Orthogonal Surface = 1
BSHHamburg
Figure 5: CTD temperature section (°C)
0 2 5 0 5 0 0
FS Meteor 18 SALINITY/ PSOI
Gridding Parameter: Area in X. by no. of profiles= 2No of GRD-Points in X=200 Area in Y, by physical units = 100No of GRD-Points in Y-200 Order of Orthogonal Surface = 1
BSHHamburg

Gridding Parameter: Area in X, by no. of profiles= 2No -of GRD-Points in X=200 Area in Y, by physical units = 100No of GRD-Points in Y=200 Order of Orthogonal Surface = 1
BSHHomburg
Figure 7: CTD oxygen section (ml/l)
0 250 500 km
Gridding Parameter: Area in X, by no. of profiles= 2No of GRD-Points in X=200 Area in Y, by physical units = 100No of GRD-Points in Y=200 Order of Orthogonal Surface = 1
BSHHomburg
Figure 8: CTD density section (sig-t)

0 250 500 km
Gridding Parameter: Area in X, by no. of profiles= Auto.No of GRD-Points in X= 99 Area in Y, by physical units Auto.
BSH
Homburg
Figure 9: Sample nitrate section (µmol/l)
Gridding Parameter: Area in X, by no. of profiles= Auto.BSH
Hamburg
Figure 10: Sample phosphat section (µmol/I)

0 250 500 km
FS Meteor 18: SILCAT/ UMOL/L
Gridding Parameter: Area in X, by no. of profiles= Auto,
No of GRD-Points in X= 99 Area in Y, by physical units Auto.
BSHHamburg
Figure 11: Sample silicate section (µmol/l)
LONGITHE (OW)
Figure 12: Distribution of the horizontally (over distance between dots) and vertically (70- 350m) averaged currents as obtained from ADCP -measurements. Diurnal (K1) and semidiurnal (M2) tides subtracted.
0 2 5 0 500 k m
Gridding Parameter: Area in X. by no. of profiles- 2No of GRD-Points in X=200 Area in Y, by physical units 1 0 0No of GRO-Points in Y =200 Order of Orthogonal Surface I
BSHHamburg
Figure 13: The distribution of moorings A to F along the section A1-east, as overlaid on the observed temperature distribution as in Figure 5. The depth of the recording current meters are indicated by a dot.

Länge
Figure 14: Rough sketch of the tritium distribution on the M 18 section (see text)
M18: Tritium / TUD
ruck
/ db
ar
M18: d 3 He / %
Salzgehalt
Figure 15: Selection of d3He values obtained from below 1600 m depth plotted at theirrespective positions in a T/S diagram. The helium isotope ratio shows significantfeatures in the different watermasses and may be discussed together with the tritiumdistribution (see text). The position of the watermasses indicated need not to meetthe classical definations but should be indicated for the mixing partners.

M18: Tritium/He3 -Alter
Länge
Figure 16: Flirst overview on the distribution of tritium/3He ages. The deep boundary currentsconnectcd to the overflowing waters from the European Polar Seas are indicated bylower apparent ages (see text).

Distance [km]
Figure 17: CFC F-11 section. Values given in pmol/kg
distance (1000 km)
distance (1000 km)
Figure 18 ab: Surface PC02 (a) and depth distribution Of PC02 (b) along the WOCE-line between CapeFarvel and Ireland.

Figure 19: The seasonal cycle Of PC02 at 52.5° N/20.0° W. the values for June, September andMay are based on direct measurements. The data for October to March are computedfrom measurements in September.

FS METEOR\DBBHWindstatistik
Windgeschwindigkeit in Beaufort
Bordwetterwarte
Figure 20: Percentage of windspeeds (in Beaufort) for the period Sept. 2 to Sept. 25, 1991.
FS METEOR M/18 vom 02.09 - 25.09.1991Wellenstatistik
Wellenhöhe in Meter StufenBordwetterwarte
Figure 21: Percentage of the wave heights (in Meter) for the period Sept. 2 to Sept. 25, 1991.
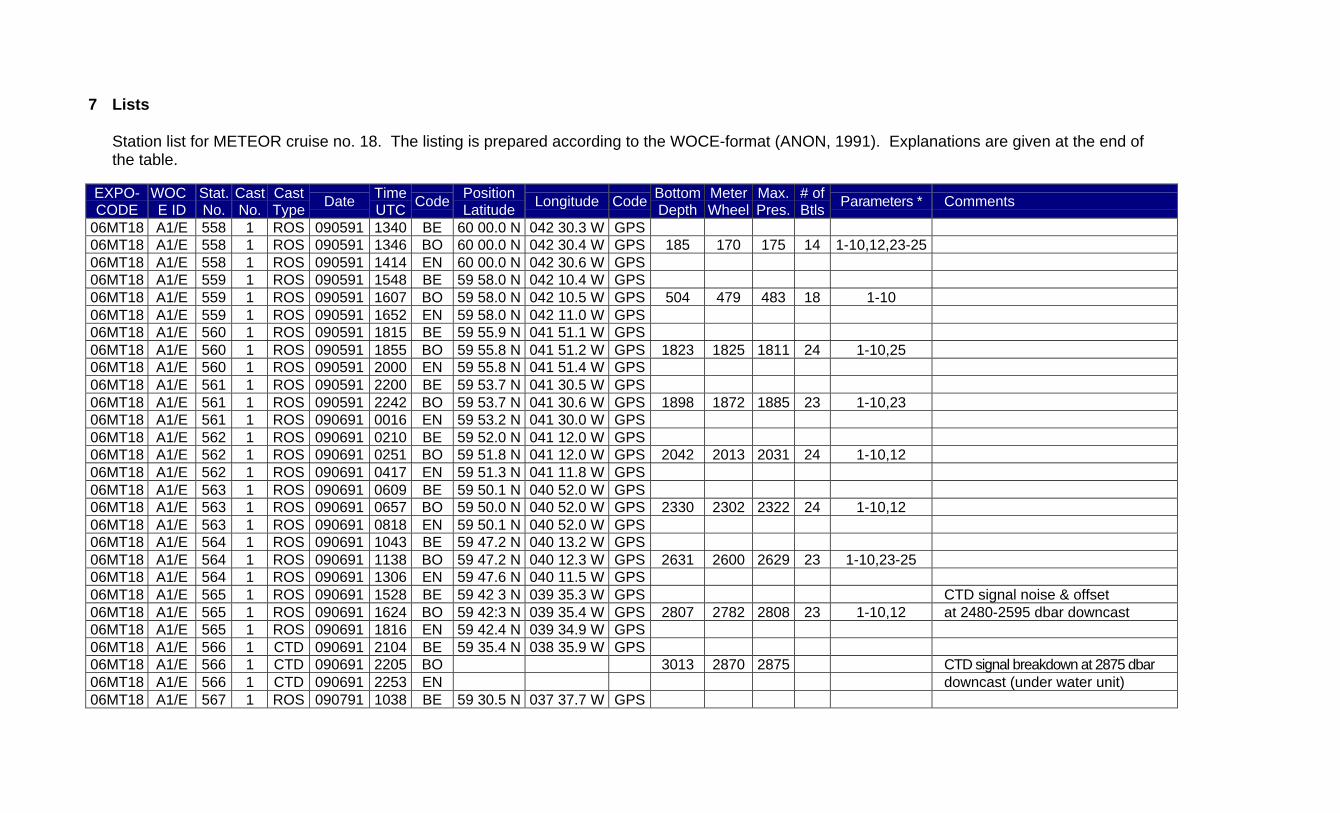
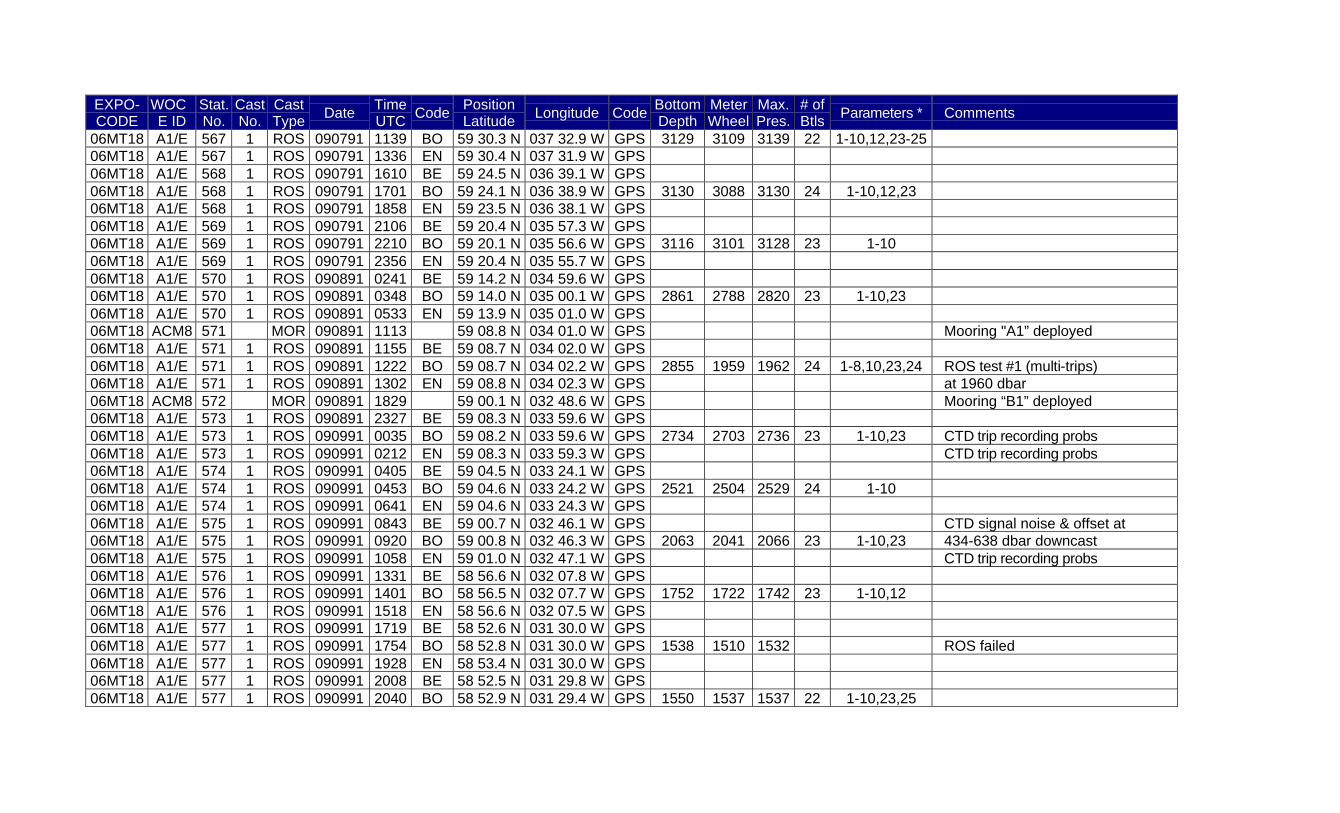
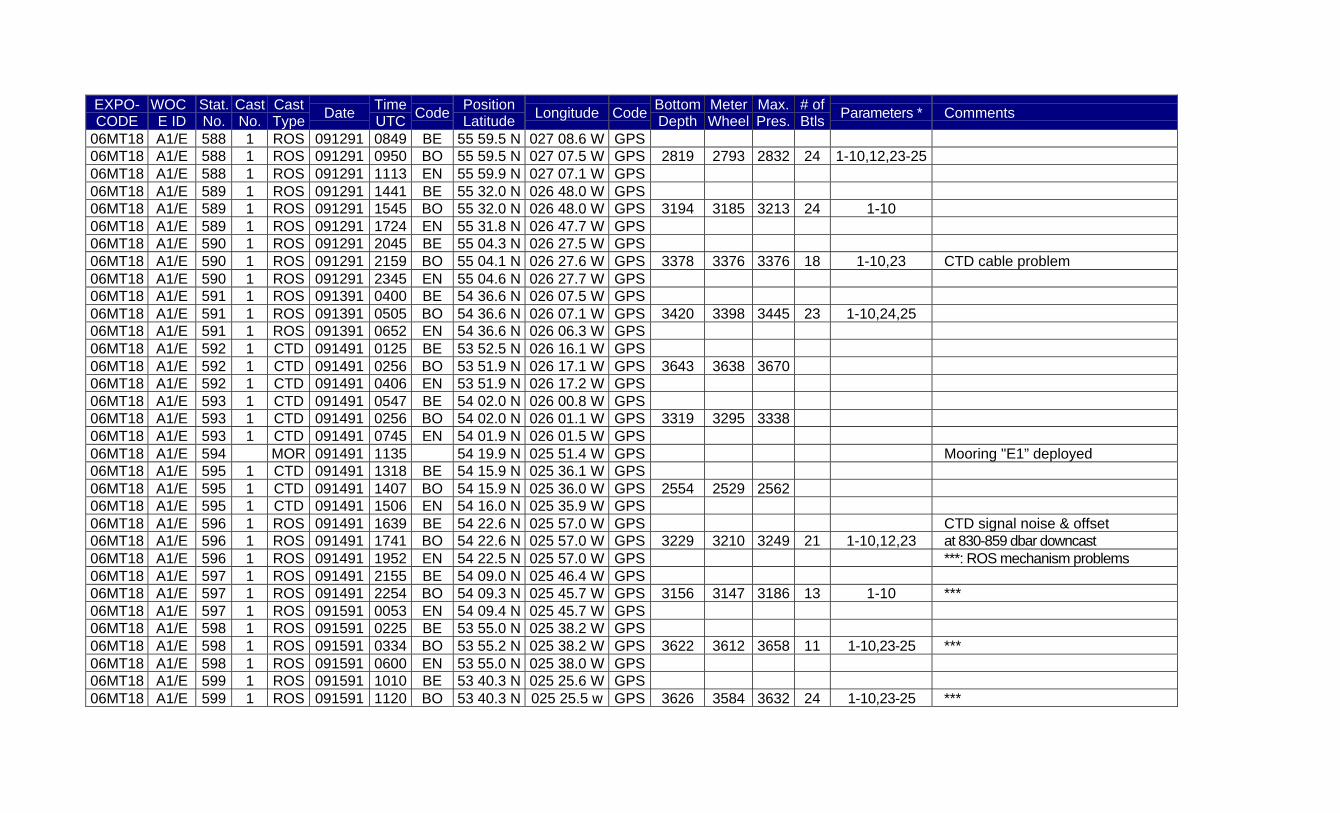
7 Lists
Station list for METEOR cruise no. 18. The listing is prepared according to the WOCE-format (ANON, 1991). Explanations are given at the end ofthe table.
EXPO-CODE
WOCE ID
Stat.No.
CastNo.
CastType
DateTimeUTC
CodePositionLatitude
Longitude CodeBottomDepth
MeterWheel
Max.Pres.
# ofBtls
Par ameters * Comments
06MT18 A1/E 558 1 ROS 090591 1340 BE 60 00.0 N 042 30.3 W GPS06MT18 A1/E 558 1 ROS 090591 1346 BO 60 00.0 N 042 30.4 W GPS 185 170 175 14 1-10,12,23-2506MT18 A1/E 558 1 ROS 090591 1414 EN 60 00.0 N 042 30.6 W GPS06MT18 A1/E 559 1 ROS 090591 1548 BE 59 58.0 N 042 10.4 W GPS06MT18 A1/E 559 1 ROS 090591 1607 BO 59 58.0 N 042 10.5 W GPS 504 479 483 18 1-1006MT18 A1/E 559 1 ROS 090591 1652 EN 59 58.0 N 042 11.0 W GPS06MT18 A1/E 560 1 ROS 090591 1815 BE 59 55.9 N 041 51.1 W GPS06MT18 A1/E 560 1 ROS 090591 1855 BO 59 55.8 N 041 51.2 W GPS 1823 1825 1811 24 1-10,2506MT18 A1/E 560 1 ROS 090591 2000 EN 59 55.8 N 041 51.4 W GPS06MT18 A1/E 561 1 ROS 090591 2200 BE 59 53.7 N 041 30.5 W GPS06MT18 A1/E 561 1 ROS 090591 2242 BO 59 53.7 N 041 30.6 W GPS 1898 1872 1885 23 1-10,2306MT18 A1/E 561 1 ROS 090691 0016 EN 59 53.2 N 041 30.0 W GPS06MT18 A1/E 562 1 ROS 090691 0210 BE 59 52.0 N 041 12.0 W GPS06MT18 A1/E 562 1 ROS 090691 0251 BO 59 51.8 N 041 12.0 W GPS 2042 2013 2031 24 1-10,1206MT18 A1/E 562 1 ROS 090691 0417 EN 59 51.3 N 041 11.8 W GPS06MT18 A1/E 563 1 ROS 090691 0609 BE 59 50.1 N 040 52.0 W GPS06MT18 A1/E 563 1 ROS 090691 0657 BO 59 50.0 N 040 52.0 W GPS 2330 2302 2322 24 1-10,1206MT18 A1/E 563 1 ROS 090691 0818 EN 59 50.1 N 040 52.0 W GPS06MT18 A1/E 564 1 ROS 090691 1043 BE 59 47.2 N 040 13.2 W GPS06MT18 A1/E 564 1 ROS 090691 1138 BO 59 47.2 N 040 12.3 W GPS 2631 2600 2629 23 1-10,23-2506MT18 A1/E 564 1 ROS 090691 1306 EN 59 47.6 N 040 11.5 W GPS06MT18 A1/E 565 1 ROS 090691 1528 BE 59 42 3 N 039 35.3 W GPS CTD signal noise & offset06MT18 A1/E 565 1 ROS 090691 1624 BO 59 42:3 N 039 35.4 W GPS 2807 2782 2808 23 1-10,12 at 2480-2595 dbar downcast06MT18 A1/E 565 1 ROS 090691 1816 EN 59 42.4 N 039 34.9 W GPS06MT18 A1/E 566 1 CTD 090691 2104 BE 59 35.4 N 038 35.9 W GPS06MT18 A1/E 566 1 CTD 090691 2205 BO 3013 2870 2875 CTD signal breakdown at 2875 dbar06MT18 A1/E 566 1 CTD 090691 2253 EN downcast (under water unit)06MT18 A1/E 567 1 ROS 090791 1038 BE 59 30.5 N 037 37.7 W GPS
EXPO-CODE
WOCE ID
Stat.No.
CastNo.
CastType
DateTimeUTC
CodePositionLatitude
Longitude CodeBottomDepth
MeterWheel
Max.Pres.
# ofBtls
Par ameters * Comments
06MT18 A1/E 567 1 ROS 090791 1139 BO 59 30.3 N 037 32.9 W GPS 3129 3109 3139 22 1-10,12,23-2506MT18 A1/E 567 1 ROS 090791 1336 EN 59 30.4 N 037 31.9 W GPS06MT18 A1/E 568 1 ROS 090791 1610 BE 59 24.5 N 036 39.1 W GPS06MT18 A1/E 568 1 ROS 090791 1701 BO 59 24.1 N 036 38.9 W GPS 3130 3088 3130 24 1-10,12,2306MT18 A1/E 568 1 ROS 090791 1858 EN 59 23.5 N 036 38.1 W GPS06MT18 A1/E 569 1 ROS 090791 2106 BE 59 20.4 N 035 57.3 W GPS06MT18 A1/E 569 1 ROS 090791 2210 BO 59 20.1 N 035 56.6 W GPS 3116 3101 3128 23 1-1006MT18 A1/E 569 1 ROS 090791 2356 EN 59 20.4 N 035 55.7 W GPS06MT18 A1/E 570 1 ROS 090891 0241 BE 59 14.2 N 034 59.6 W GPS06MT18 A1/E 570 1 ROS 090891 0348 BO 59 14.0 N 035 00.1 W GPS 2861 2788 2820 23 1-10,2306MT18 A1/E 570 1 ROS 090891 0533 EN 59 13.9 N 035 01.0 W GPS06MT18 ACM8 571 MOR 090891 1113 59 08.8 N 034 01.0 W GPS Mooring "A1” deployed06MT18 A1/E 571 1 ROS 090891 1155 BE 59 08.7 N 034 02.0 W GPS06MT18 A1/E 571 1 ROS 090891 1222 BO 59 08.7 N 034 02.2 W GPS 2855 1959 1962 24 1-8,10,23,24 R OS test #1 ( mul ti -tr ips) 06MT18 A1/E 571 1 ROS 090891 1302 EN 59 08.8 N 034 02.3 W GPS at 1960 dbar06MT18 ACM8 572 MOR 090891 1829 59 00.1 N 032 48.6 W GPS Mooring “B1” deployed06MT18 A1/E 573 1 ROS 090891 2327 BE 59 08.3 N 033 59.6 W GPS06MT18 A1/E 573 1 ROS 090991 0035 BO 59 08.2 N 033 59.6 W GPS 2734 2703 2736 23 1-10,23 CTD trip recording probs06MT18 A1/E 573 1 ROS 090991 0212 EN 59 08.3 N 033 59.3 W GPS CTD trip recording probs06MT18 A1/E 574 1 ROS 090991 0405 BE 59 04.5 N 033 24.1 W GPS06MT18 A1/E 574 1 ROS 090991 0453 BO 59 04.6 N 033 24.2 W GPS 2521 2504 2529 24 1-1006MT18 A1/E 574 1 ROS 090991 0641 EN 59 04.6 N 033 24.3 W GPS06MT18 A1/E 575 1 ROS 090991 0843 BE 59 00.7 N 032 46.1 W GPS CTD signal noise & offset at06MT18 A1/E 575 1 ROS 090991 0920 BO 59 00.8 N 032 46.3 W GPS 2063 2041 2066 23 1-10,23 434-638 dbar downcast06MT18 A1/E 575 1 ROS 090991 1058 EN 59 01.0 N 032 47.1 W GPS CTD trip recording probs06MT18 A1/E 576 1 ROS 090991 1331 BE 58 56.6 N 032 07.8 W GPS06MT18 A1/E 576 1 ROS 090991 1401 BO 58 56.5 N 032 07.7 W GPS 1752 1722 1742 23 1-10,1206MT18 A1/E 576 1 ROS 090991 1518 EN 58 56.6 N 032 07.5 W GPS06MT18 A1/E 577 1 ROS 090991 1719 BE 58 52.6 N 031 30.0 W GPS06MT18 A1/E 577 1 ROS 090991 1754 BO 58 52.8 N 031 30.0 W GPS 1538 1510 1532 ROS failed06MT18 A1/E 577 1 ROS 090991 1928 EN 58 53.4 N 031 30.0 W GPS06MT18 A1/E 577 1 ROS 090991 2008 BE 58 52.5 N 031 29.8 W GPS06MT18 A1/E 577 1 ROS 090991 2040 BO 58 52.9 N 031 29.4 W GPS 1550 1537 1537 22 1-10,23,25

EXPO-CODE
WOCE ID
Stat.No.
CastNo.
CastType
DateTimeUTC
CodePositionLatitude
Longitude CodeBottomDepth
MeterWheel
Max.Pres.
# ofBtls
Par ameters * Comments
06MT18 A1/E 577 1 ROS 090991 2202 EN 58 53.9 N 031 29.8 W GPS06MT18 A1/E 578 1 ROS 091091 0013 BE 58 47.8 N 030 49.9 W GPS06MT18 A1/E 578 1 ROS 091091 0041 BO 58 47.9 N 030 49.9 W GPS 1272 1262 1255 19 1-806MT18 A1/E 578 1 ROS 091091 0157 EN 58 48.0 N 030 50.0 W GPS06MT18 A1/E 579 1 ROS 091091 0406 BE 58 33.7 N 030 23.2 W GPS06MT18 A1/E 579 1 ROS 091091 0437 BO 58 33.7 N 030 23.2.W GPS 1736 1700 1721 24 1-10,1206MT18 A1/E 579 1 ROS 091091 0607 EN 58 33.7 N 030 23.1 W GPS06MT18 A1/E 580 1 ROS 091091 0815 BE 58 19.5 N 029 56.6 W GPS06MT18 A1/E 580 1 ROS 091091 0858 BO 58 19.3 N 029 56.5 W GPS 2369 2361 2370 23 1-10,23,2506MT18 A1/E 580 1 ROS 091091 1034 EN 58 20.2 N 029 56.3 W GPS06MT18 ACM8 581 MOR 091091 1443 58 10.9 N 029 37.9 W GPS Mooring "C1” deployed06MT18 A1/E 581 1 ROS 091091 1513 BE 58 11.1 N 029 37.1 W GPS06MT18 A1/E 581 1 ROS 091091 1547 BO 58 11.1 N 029 37.1 W GPS 2070 2023 2039 22 1-10,23 ROS test #2 (multi-trips)06MT18 A1/E 581 1 ROS 091091 1641 EN 58 11.0 N 029 37.1 W GPS at 2036 dbar06MT18 A1/E 582 1 ROS 091091 1901 BE 58 05.2 N 029 30.0 W GPS06MT18 A1/E 582 1 ROS 091091 1944 BO 58 05.1 N 029 30.0 W GPS 2252 2220 2248 24 1-10,23-2506MT18 A1/E 582 1 ROS 091091 2125 EN 58 05.2 N 029 30.4 W GPS06MT18 A1/E 583 1 ROS 091091 2337 BE 57 51.1 N 029 04.2 W GPS06MT18 A1/E 583 1 ROS 091191 0020 BO 57 51.5 N 029 03.4 W GPS 2333 2318 2341 24 1-806MT18 A1/E 583 1 ROS 091191 0200 EN 57 52.1 N 029 02.3 W GPS06MT18 A1/E 584 1 ROS 091191 0428 BE 57 36.9 N 028 38.1 W GPS06MT18 A1/E 584 1 ROS 091191 0519 BO 57 37.0 N 028 38.1 W GPS 2420 2398 2422 24 1-10,1206MT18 A1/E 584 1 ROS 091191 0723 EN 57 37.0 N 028 38.1 W GPS06MT18 ACM8 585 MOR 091191 1153 57 22.4 N 028 11.4 W GPS Mooring "D1” deployed06MT18 A1/E 585 1 ROS 091191 1230 BE 57 22.2 N 028 09.6 W GPS06MT18 A1/E 585 1 ROS 091191 1321 BO 57 22.2 N 028 09.5 W GPS 2645 2614 2647 24 1-10,2306MT18 A1/E 585 1 ROS 091191 1515 EN 57 22.2 N 028 09.1 W GPS06MT18 A1/E 586 1 ROS 091191 1916 BE 56 54.7 N 027 50.7 W GPS06MT18 A1/E 586 1 ROS 091191 2005 BO 56 54.7 N 027 50.4 W GPS 2922 2897 2926 24 1-1006MT18 A1/E 586 1 ROS 091191 2205 EN 56 56.0 N 027 49.6 W GPS06MT18 A1/E 587 1 ROS 091291 0150 BE 56 27.3 N 027 30.0 W GPS06MT18 A1/E 587 1 ROS 091291 0242 BO 56 27.6 N 027 29.6 W GPS 2779 2758 2781 13 1-8 C TD si gnal loss (cabl e) , no06MT18 A1/E 587 1 ROS 091291 0441 EN 56 28.0 N 027 29.0 W GPS bottles above 1271 dbar
EXPO-CODE
WOCE ID
Stat.No.
CastNo.
CastType
DateTimeUTC
CodePositionLatitude
Longitude CodeBottomDepth
MeterWheel
Max.Pres.
# ofBtls
Par ameters * Comments
06MT18 A1/E 588 1 ROS 091291 0849 BE 55 59.5 N 027 08.6 W GPS06MT18 A1/E 588 1 ROS 091291 0950 BO 55 59.5 N 027 07.5 W GPS 2819 2793 2832 24 1-10,12,23-2506MT18 A1/E 588 1 ROS 091291 1113 EN 55 59.9 N 027 07.1 W GPS06MT18 A1/E 589 1 ROS 091291 1441 BE 55 32.0 N 026 48.0 W GPS06MT18 A1/E 589 1 ROS 091291 1545 BO 55 32.0 N 026 48.0 W GPS 3194 3185 3213 24 1-1006MT18 A1/E 589 1 ROS 091291 1724 EN 55 31.8 N 026 47.7 W GPS06MT18 A1/E 590 1 ROS 091291 2045 BE 55 04.3 N 026 27.5 W GPS06MT18 A1/E 590 1 ROS 091291 2159 BO 55 04.1 N 026 27.6 W GPS 3378 3376 3376 18 1-10,23 CTD cable problem06MT18 A1/E 590 1 ROS 091291 2345 EN 55 04.6 N 026 27.7 W GPS06MT18 A1/E 591 1 ROS 091391 0400 BE 54 36.6 N 026 07.5 W GPS06MT18 A1/E 591 1 ROS 091391 0505 BO 54 36.6 N 026 07.1 W GPS 3420 3398 3445 23 1-10,24,2506MT18 A1/E 591 1 ROS 091391 0652 EN 54 36.6 N 026 06.3 W GPS06MT18 A1/E 592 1 CTD 091491 0125 BE 53 52.5 N 026 16.1 W GPS06MT18 A1/E 592 1 CTD 091491 0256 BO 53 51.9 N 026 17.1 W GPS 3643 3638 367006MT18 A1/E 592 1 CTD 091491 0406 EN 53 51.9 N 026 17.2 W GPS06MT18 A1/E 593 1 CTD 091491 0547 BE 54 02.0 N 026 00.8 W GPS06MT18 A1/E 593 1 CTD 091491 0256 BO 54 02.0 N 026 01.1 W GPS 3319 3295 333806MT18 A1/E 593 1 CTD 091491 0745 EN 54 01.9 N 026 01.5 W GPS06MT18 A1/E 594 MOR 091491 1135 54 19.9 N 025 51.4 W GPS Mooring "E1” deployed06MT18 A1/E 595 1 CTD 091491 1318 BE 54 15.9 N 025 36.1 W GPS06MT18 A1/E 595 1 CTD 091491 1407 BO 54 15.9 N 025 36.0 W GPS 2554 2529 256206MT18 A1/E 595 1 CTD 091491 1506 EN 54 16.0 N 025 35.9 W GPS06MT18 A1/E 596 1 ROS 091491 1639 BE 54 22.6 N 025 57.0 W GPS CTD signal noise & offset06MT18 A1/E 596 1 ROS 091491 1741 BO 54 22.6 N 025 57.0 W GPS 3229 3210 3249 21 1-10,12,23 at 830-859 dbar downcast06MT18 A1/E 596 1 ROS 091491 1952 EN 54 22.5 N 025 57.0 W GPS ***: ROS mechanism problems06MT18 A1/E 597 1 ROS 091491 2155 BE 54 09.0 N 025 46.4 W GPS06MT18 A1/E 597 1 ROS 091491 2254 BO 54 09.3 N 025 45.7 W GPS 3156 3147 3186 13 1-10 ***06MT18 A1/E 597 1 ROS 091591 0053 EN 54 09.4 N 025 45.7 W GPS06MT18 A1/E 598 1 ROS 091591 0225 BE 53 55.0 N 025 38.2 W GPS06MT18 A1/E 598 1 ROS 091591 0334 BO 53 55.2 N 025 38.2 W GPS 3622 3612 3658 11 1-10,23- 25 ***06MT18 A1/E 598 1 ROS 091591 0600 EN 53 55.0 N 025 38.0 W GPS06MT18 A1/E 599 1 ROS 091591 1010 BE 53 40.3 N 025 25.6 W GPS06MT18 A1/E 599 1 ROS 091591 1120 BO 53 40.3 N 025 25.5 w GPS 3626 3584 3632 24 1-10,23- 25 ***

EXPO-CODE
WOCE ID
Stat.No.
CastNo.
CastType
DateTimeUTC
CodePositionLatitude
Longitude CodeBottomDepth
MeterWheel
Max.Pres.
# ofBtls
Par ameters * Comments
06MT18 A1/E 599 1 ROS 091591 1333 EN 53 40.3 N 025 25.3 W GPS +++ : CTD trip recording probs06MT18 A1/E 600 1 ROS 091591 1610 BE 53 27.9 N 024 41.0 W GPS06MT18 A1/E 600 1 ROS 091591 1715 BO 53 27.8 N 024 41.1 W GPS 3570 3565 3605 24 1-10,23 ***, +++06MT18 A1/E 600 1 ROS 091591 1939 EN 53 28.0 N 024 41.0 W GPS06MT18 A1/E 601 1 ROS 091591 2226 BE 53 16.0 N 023 54.2 W GPS06MT18 A1/E 601 1 ROS 091591 2340 BO 53 16.0 N 023 53.9 W GPS 3718 3703 3749 24 1-10 ***, +++06MT18 A1/E 601 1 ROS 091691 0206 EN 53 16.0 N 023 54.0 W GPS06MT18 A1/E 602 1 ROS 091691 0444 BE 53 04.0 N 023 07.7 W GPS Jellyfish in C-sensor at 236006MT18 A1/E 602 1 ROS 091691 0559 BO 53 04.1 N 023 07.8 W GPS 3875 3884 3923 24 1-10,12,23-25 dbar downcast06MT18 A1/E 602 1 ROS 091691 0825 EN 53 04.0 N 023 07.3 W GPS ***, +++06MT18 A1/E 603 1 ROS 091691 1111 BE 52 52.0 N 022 23.2 W GPS06MT18 A1/E 603 1 ROS 091691 1236 BO 52 51.5 N 022 22.6 W GPS 4005 4001 4057 24 1-10,12,23 ***, +++ 06MT18 A1/E 603 1 ROS 091691 1450 EN 52 50.5 N 022 21.6 W GPS06MT18 A1/E 604 1 ROS 091691 1728 BE 52 40 0 N 021 36.8 W GPS06MT18 A1/E 604 1 ROS 091691 1846 BO 52 39.3 N 021 36.8 W GPS 3990 3996 4045 24 1-8,10 ***, +++ 06MT18 A1/E 604 1 ROS 091691 2106 EN 52.37.8 N 021 36.6 W GPS06MT18 A1/E 605 1 ROS 091791 0006 BE 52 28.0 N 020 51.9 W GPS06MT18 A1/E 605 1 ROS 091791 0114 BO 52 28.0 N 020 51.8 W GPS 3739 3739 3787 23 1-10,12 ***, +++ 06MT18 A1/E 605 1 ROS 091791 0300 EN 52 28.2 N 020 50.9 W GPS06MT18 A1/E 606 1 ROS 091791 1136 BE 52 39.8 N 020 00.1 W GPS06MT18 A1/E 606 1 ROS 091791 1226 BO 52 39.6 N 019 59.6 W GPS 2593 2573 259406MT18 A1/E 606 1 ROS 091791 1325 EN 52 39.3 N 019 59.3 W GPS06MT18 A1/E 607 1 ROS 091791 1503 BE 52 29.9 N 020 00.0 W GPS06MT18 A1/E 607 1 ROS 091791 1601 BO 52 29.8 N 020 00.0 W GPS 2803 2782 2816 12 23-25 ***, +++ 06MT18 A1/E 607 1 ROS 091791 1710 EN 52 30.0 N 020 00.0 W GPS06MT18 A1/E 608 1 ROS 091791 2000 BE 52 10.1 N 020 00.0 W GPS06MT18 A1/E 608 1 ROS 091791 2123 BO 52 10.5 N 019 59.6 W GPS 3783 3776 3826 12 1-18,10 ROS test #3 (multi-trips)06MT18 A1/E 608 1 ROS 091791 2300 EN 52 10.3 N 019 59.3 W GPS at 3815 dbar06MT18 A1/E 609 1 ROS 091891 0231 BE 52 21.8 N 020 27.8 W GPS06MT18 A1/E 609 1 ROS 091891 0345 BO 52 21.5 N 020 28.1 W GPS 3646 3588 3627 15 1-8 ***, +++ 06MT18 A1/E 609 1 ROS 091891 0606 EN 52 21.9 N 020 28.3 W GPS leaking bottl es (r ough sea)06MT18 A1/E 610 1 ROS 091891 0809 BE 52 20.0 N 020 00.0 W GPS06MT18 A1/E 610 1 ROS 091891 0920 BO 52 20.2 N 020 00.0 W GPS 3308 3275 3309 22 1-10,23 ***, +++

EXPO-CODE
WOCE ID
Stat.No.
CastNo.
CastType
DateTimeUTC
CodePositionLatitude
Longitude CodeBottomDepth
MeterWheel
Max.Pres.
# ofBtls
Par ameters * Comments
06MT18 A1/E 610 1 ROS 091891 1140 EN 52 21.1 N 019 58.7 W GPS06MT18 A1/E 611 1 ROS 091891 1348 BE 52 20.3 N 019 24.7 W GPS06MT18 A1/E 611 1 ROS 091891 1459 BO 52 20.2 N 019 24.7 W GPS 3600 3630 3651 22 1-8,10,25 ***, +++ 06MT18 A1/E 611 1 ROS 091891 1715 EN 52 19.7 N 019 24.3 W GPS06MT18 A1/E 612 1 ROS 091891 1942 BE 52 19.9 N 018 37.8 W GPS Offset in S at 4034 dbar downcast06MT18 A1/E 612 1 ROS 091891 2103 BO 52 19.4 N 018 37.2 W GPS 4329 4331 4391 22 1-10,12 ***, +++ 06MT18 A1/E 612 1 ROS 091891 2351 EN 52 19.4 N 018 37.4 W GPS06MT18 A1/E 613 1 ROS 091991 0240 BE 52 20.1 N 017 49.8 W GPS Offset in S at 3974 dbar downcast06MT18 A1/E 613 1 ROS 091991 0402 BO 52 19.9 N 017 48.9 W GPS 4292 4331 4370 22 1-8,10,24-25 ***, +++ 06MT18 A1/E 613 1 ROS 091991 0632 EN 52 19.3 N 017 48.0 W GPS06MT18 ACM8 614 MOR 091991 1253 52 20.5 N 016 20.1 W GPS06MT18 A1/E 615 1 ROS 091991 1740 BE 52 20.0 N 016 59.8 W GPS Mooring "F1” deployed06MT18 A1/E 615 1 ROS 091991 1859 BO 52 19.6 N 016 59.3 W GPS 3931 3927 3981 22 1-10,12,2306MT18 A1/E 615 1 ROS 091991 2121 EN 52 18.4 N 016 58.0 W GPS06MT18 A1/E 616 1 ROS 092091 0008 BE 52 20.0 N 016 12.0 W GPS06MT18 A1/E 616 1 ROS 092091 0119 BO 52 19.5 N 016 12.1 W GPS 3465 3451 3492 23 1-806MT18 A1/E 616 1 ROS 092091 0337 EN 52 19.0 N 016 11.0 W GPS06MT18 A1/E 617 1 ROS 092091 0552 BE 52 20.1 N 015 47.0 W GPS06MT18 A1/E 617 1 ROS 092091 0706 BO 52 20.3 N 015 46.3 W GPS 3273 3264 3305 23 1-10,23-2506MT18 A1/E 617 1 ROS 092091 0912 EN 52 21.2 N 015 46.7 W GPS06MT18 A1/E 618 1 ROS 092091 1110 BE 52 20.1 N 015 30.0 W GPS06MT18 A1/E 618 1 ROS 092091 1207 BO 52 20.1 N 015 30.1 W GPS 2839 2805 2830 20 1-10,2306MT18 A1/E 618 1 ROS 092091 1358 EN 52 20.6 N 015 29.7 W GPS06MT18 A1/E 618 2 ROS 092091 1611 BE 52 20.0 N 015 30.0 W GPS06MT18 A1/E 618 2 ROS 092091 1657 BO 52 20.1 N 015 30.0 W GPS 2834 1955 1978 23 1-8 ROS test #4 (multi-trips)06MT18 A1/E 618 2 ROS 092091 1748 EN 52 20.2 N 015 29.9 W GPS at 1855 dbar06MT18 A1/E 619 1 ROS 092091 2223 BE 52 20.0 N 015 13.0 W GPS06MT18 A1/E 619 1 ROS 092091 2251 BO 52 19.9 N 015 13.1 W GPS 1262 1250 1259 12 1-8,10,2306MT18 A1/E 619 1 ROS 092091 2353 EN 52 20.3 N 015 13.3 W GPS06MT18 A1/E 620 1 ROS 092191 0154 BE 52 20.1 N 014 56.0 W GPS06MT18 A1/E 620 1 ROS 092191 0220 BO 52 20.0 N 014 55.9 W GPS 839 832 839 12 1-8,2306MT18 A1/E 620 1 ROS 092191 0312 EN 52 19.8 N 014 55.7 W GPS06MT18 A1/E 621 1 ROS 092191 0452 BE 52 20.0 N 014 38.7 W GPS
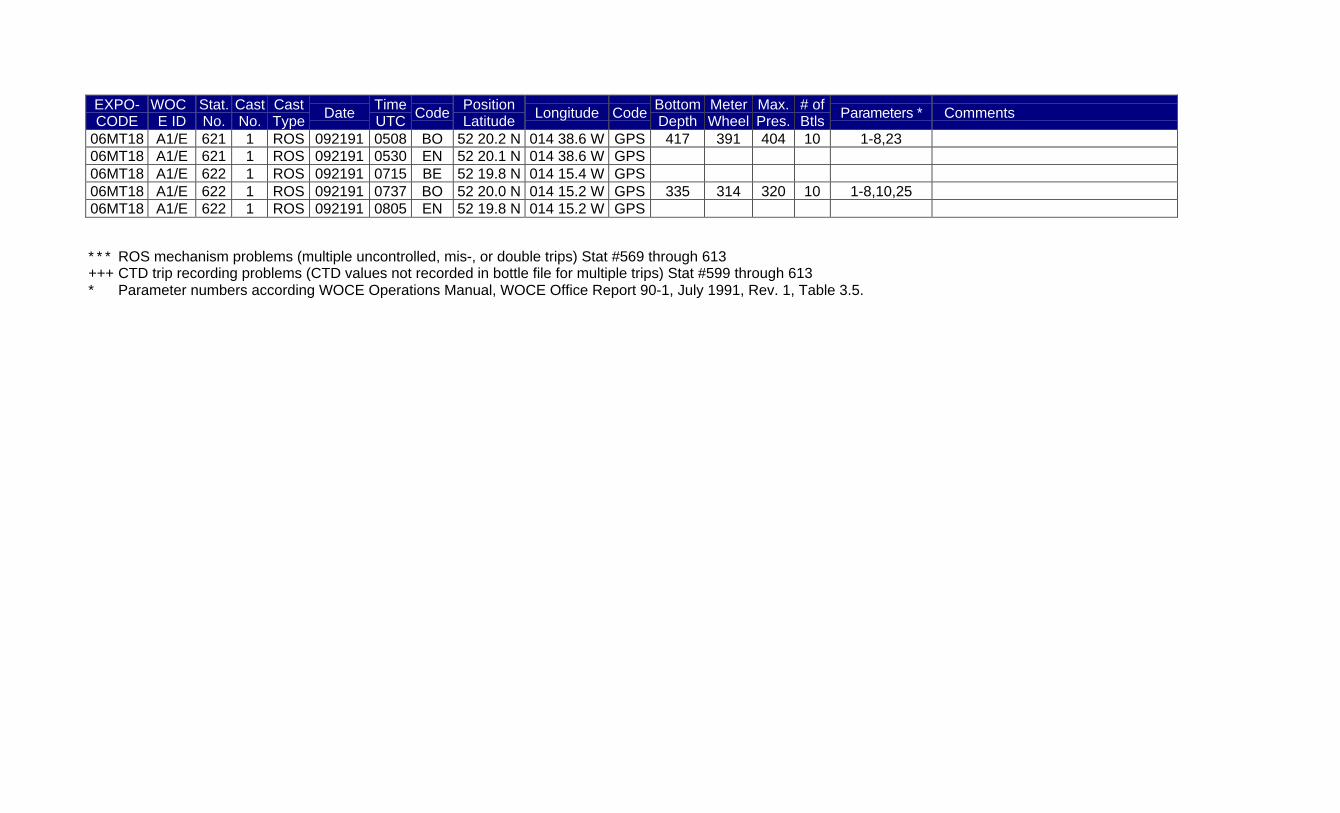
EXPO-CODE
WOCE ID
Stat.No.
CastNo.
CastType
DateTimeUTC
CodePositionLatitude
Longitude CodeBottomDepth
MeterWheel
Max.Pres.
# ofBtls
Par ameters * Comments
06MT18 A1/E 621 1 ROS 092191 0508 BO 52 20.2 N 014 38.6 W GPS 417 391 404 10 1-8,2306MT18 A1/E 621 1 ROS 092191 0530 EN 52 20.1 N 014 38.6 W GPS06MT18 A1/E 622 1 ROS 092191 0715 BE 52 19.8 N 014 15.4 W GPS06MT18 A1/E 622 1 ROS 092191 0737 BO 52 20.0 N 014 15.2 W GPS 335 314 320 10 1-8,10,2506MT18 A1/E 622 1 ROS 092191 0805 EN 52 19.8 N 014 15.2 W GPS
* * * ROS mechanism problems (multiple uncontrolled, mis-, or double trips) Stat #569 through 613+++ CTD trip recording problems (CTD values not recorded in bottle file for multiple trips) Stat #599 through 613* Parameter numbers according WOCE Operations Manual, WOCE Office Report 90-1, July 1991, Rev. 1, Table 3.5.

Oxygen and Nutrient measurements
The oxygen and nutrient data were entered into ODF's ship board data system andprocessed as the analyses were completed. Pressure and temperature informationwere given to ODF by the German group. The bottle data were brought to a useable,though perhaps not final, state at sea. ODF data checking procedures includedverification that the sample was assigned to the correct level. This was accomplishedby checking the raw data sheets, which included the raw data value and the watersample bottle, versus the sample log sheets. Any comments regarding the watersamples were investigated. The raw data computer files were also checked for entryerrors. Investigation of the data included reviewing plots of the station profiles andcomparing these to nearby stations.
If a data value did not agree with other nearby data, then analyst and sampling notes,plots, and nearby data were reviewed.
If any problem was indicated the data value was flagged. The Bottle Data ProcessingNotes section includes comments regarding investigation of flagged samples.
The WOCE codes were assigned to the oxygen and nutrient data using the criteria:
code 9 = Sample not drawn.
code 5 = Data value deleted. Value did not fit station profile or adjoining station datacomparison. Comments were made that clearly indicated a leak andcontamination of the samples. This code was not assigned to any of thedata in the .sea file. The data that has been deleted from the .sea files areincluded in a separate file.
code 4 = Does not fit station profile and/or adjoining station comparisons. There areanalytical notes indicating a problem, but data values were reported. ODFrecommends deletion of these data values.
code 3 = Does not fit station profile or adjoining station comparisons and noanalytical notes indicate a problem. The data could possibly be real, butdecision as to whether it is acceptable needs to be made by a scientistrather than ODF's technicians.
code 2 = Acceptable measurement.
code 1 = Sample for this measurement was drawn from the bottle, but data was notreceived and is not recoverable.
The following table is a tabulation of the number of ODF samples with a count for eachof the different codes.Stations 558-622
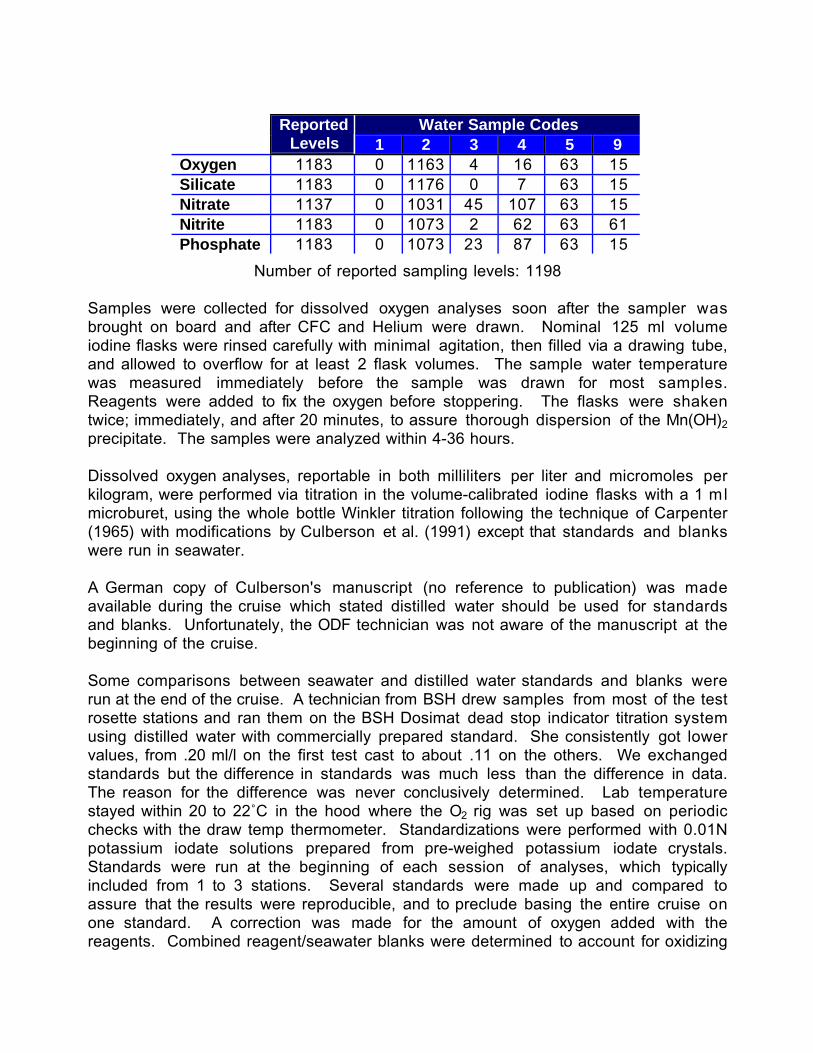
Water Sample CodesReportedLevels 1 2 3 4 5 9
Oxygen 1183 0 1163 4 16 63 15Silicate 1183 0 1176 0 7 63 15Nitrate 1137 0 1031 45 107 63 15Nitrite 1183 0 1073 2 62 63 61Phosphate 1183 0 1073 23 87 63 15
Number of reported sampling levels: 1198
Samples were collected for dissolved oxygen analyses soon after the sampler wasbrought on board and after CFC and Helium were drawn. Nominal 125 ml volumeiodine flasks were rinsed carefully with minimal agitation, then filled via a drawing tube,and allowed to overflow for at least 2 flask volumes. The sample water temperaturewas measured immediately before the sample was drawn for most samples.Reagents were added to fix the oxygen before stoppering. The flasks were shakentwice; immediately, and after 20 minutes, to assure thorough dispersion of the Mn(OH)2
precipitate. The samples were analyzed within 4-36 hours.
Dissolved oxygen analyses, reportable in both milliliters per liter and micromoles perkilogram, were performed via titration in the volume-calibrated iodine flasks with a 1 mlmicroburet, using the whole bottle Winkler titration following the technique of Carpenter(1965) with modifications by Culberson et al. (1991) except that standards and blankswere run in seawater.
A German copy of Culberson's manuscript (no reference to publication) was madeavailable during the cruise which stated distilled water should be used for standardsand blanks. Unfortunately, the ODF technician was not aware of the manuscript at thebeginning of the cruise.
Some comparisons between seawater and distilled water standards and blanks wererun at the end of the cruise. A technician from BSH drew samples from most of the testrosette stations and ran them on the BSH Dosimat dead stop indicator titration systemusing distilled water with commercially prepared standard. She consistently got lowervalues, from .20 ml/l on the first test cast to about .11 on the others. We exchangedstandards but the difference in standards was much less than the difference in data.The reason for the difference was never conclusively determined. Lab temperaturestayed within 20 to 22ûC in the hood where the O2 rig was set up based on periodicchecks with the draw temp thermometer. Standardizations were performed with 0.01Npotassium iodate solutions prepared from pre-weighed potassium iodate crystals.Standards were run at the beginning of each session of analyses, which typicallyincluded from 1 to 3 stations. Several standards were made up and compared toassure that the results were reproducible, and to preclude basing the entire cruise onone standard. A correction was made for the amount of oxygen added with thereagents. Combined reagent/seawater blanks were determined to account for oxidizing

or reducing materials in the reagents. The oxygen thionormality values and blanks havebeen reviewed for possible problems and smoothed as necessary.
The temperature of the samples was measured at the time the sample was drawn fromthe bottle, and are included in this data submission. On several stations, thethermometer used to measure the draw temperature failed to operate properly. Onthese stations the in situ temperature is reported and comments to this effect are in thedata remarks section documentation.
Nutrients
Nutrients (phosphate, silicate, nitrate and nitrite) analyses, reported in micromoles/liter,were performed on a Techni- con® AutoAnalyzer®. The procedures used are describedin Hager et al. (1972) and Atlas et al. (1971). Standardizations were performed withsolutions prepared aboard ship from pre-weighed standards; these solutions wereused as working standards before and after each cast (approximately 36 samples) tocorrect for instrumental drift during analyses. Sets of 4-6 different concentrations ofshipboard standards were analyzed periodically to determine the linearity of colorimeterresponse and the resulting correction factors. Phosphate was analyzed using hydrazinereduction of phosphomolybdic acid as described by Bernhardt & Wilhelms (1967).Silicate was analyzed using stannous chloride reduction of silicomolybdic acid. Nitritewas analyzed using diazotization and coupling to form dye; nitrate was reduced bycopperized cadmium and then analyzed as nitrite. These three analyses use themethods of Armstrong et al. (1967).
Sampling for nutrients followed that for the tracer gases, CFC's, He, tritium, anddissolved oxygen. Samples were drawn into ~45 cc high density polyethylene, narrowmouth, screw-capped bottles which were rinsed twice before filling. The samples mayhave been refrigerated at 2 to 6ûC for a maximum of 15 hours.
DATA COMPARISONS
The oxygen and nutrient data were compared by ODF with those from the adjacentstations.
DATA COMMENTS
Remarks for deleted and/or missing samples or WOCE codes other than 2 from WOCENORD A1/E. Investigation of data may include review of data plots of station profile andadjoining stations, rereading of charts (i.e., nutrients). Comments from the SampleLogs and ODF's results of investigation of oxygen and nutrients are included in thisreport.

Station 556
1all Test station, no final CTD data was submitted. ODF has included the oxygen andnutrients in a separate file.
106 O2 .13 high on calib station (all bottles tripped same level). Calc ok. Note on datasheet "strong blue return" Nutrient ok so probably over titrated, not bottle tripproblem. Footnote oxygen bad.
118 O2 .27 high on calib station (all bottles tripped same level). Calc ok. Note on datasheet "slight blue return" Nutrient ok so probably over titrated, not bottle tripproblem. Footnote oxygen bad.
122 Sample Log: "No samples taken."123 Sample Log: "No samples taken."
Station 557
1all Test station, no final CTD data was submitted. ODF has included the oxygen andnutrients in a separate file.
108 108-110 Appears .07 low on calib cast (all bottles tripped same level). PO4 calcok, peaks poor, no notes. Other nutrients & oxygens ok. Footnote PO4 bad.
109 See 108 comments, footnote PO4 bad.110 See 108 comments, footnote PO4 bad.123 Sample Log: No samples taken.124 Sample Log: No samples taken.
Station 558
1all 14 bottles.101 @ 171db - Nutrient: "Begin End NO2, NO3, PO4 must be SSW being used - too
much bio activity!" Same problem Stations 558 through 560. Footnote NO2 bad.Footnote PO4 bad. Footnote NO3 bad.
102 @ 171db - Didn't trip as scheduled per final data submission. Oxygen agrees withduplicate trip data. See 101 comment, footnote NO2 bad. See 101 comment,footnote NO3 bad. See 101 comment, footnote PO4 bad.
103 @ 151db - See 101 comment, footnote #2 bad. See 101 comment, footnote NO3
bad. See 101 comment, footnote PO4 bad.104 @ 131db - See 101 comment, footnote #2 bad. See 101 comment, footnote NO3
bad. See 101 comment, footnote PO4 bad.105 @ 111db - See 101 comment, footnote NO2 bad. See 101 comment, footnote NO3
bad. See 101 comment, footnote PO4 bad.106 @ 99db - See 101 comment, footnote NO2 bad. See 101 comment, footnote NO3
bad. See 101 comment, footnote PO4 bad.107 @ 86db - See 101 comment, footnote NO2 bad. See 101 comment, footnote NO3
bad. See 101 comment, footnote PO4 bad.108 @ 66db - See 101 comment, footnote NO2 bad. See 101 comment, footnote NO3
bad. See 101 comment, footnote PO4 bad.

109 @ 47db - See 101 comment, footnote NO2 bad. See 101 comment, footnote NO3
bad. See 101 comment, footnote PO4 bad.110 @ 27db - See 101 comment, footnote NO2 bad. See 101 comment, footnote NO3
bad. See 101 comment, footnote PO4 bad. Oxygen: "Noticed a very small bubblein burette." Data looks ok.
111 @ 9db - See 101 comment, footnote NO2 bad. See 101 comment, footnote NO3
bad. See 101 comment, footnote PO4 bad.112 @ 8db - See 101 comment, footnote NO2 bad. See 101 comment, footnote NO3
bad. See 101 comment, footnote PO4 bad.113 @ 8db - See 101 comment, footnote NO2 bad. See 101 comment, footnote NO3
bad. See 101 comment, footnote PO4 bad.114 @ 9db - See 101 comment, footnote NO2 bad. See 101 comment, footnote NO3
bad. See 101 comment, footnote PO4 bad.
Station 559
1all 18 bottles.101 @ 477db - Nutrient: "End NO2 STDs no good, use begin" "SSW affecting
stdizations!" 101-118 Same problem Stations 558 through 560. Footnote NO2
bad. Footnote NO3 bad. Footnote PO4 bad.102 @ 458db - See 101 comments, footnote NO2 bad. See 101 comments, footnote
NO3 bad. See 101 comments, footnote PO4 bad.103 @ 439db - See 101 comments, footnote NO2 bad. See 101 comments, footnote
NO3 bad. See 101 comments, footnote PO4 bad.104 @ 419db - See 101 comments, footnote NO2 bad. See 101 comments, footnote
NO3 bad. See 101 comments, footnote PO4 bad.105 @ 398db - See 101 comments, footnote NO2 bad. See 101 comments, footnote
NO3 bad. See 101 comments, footnote PO4 bad.106 @ 377db - See 101 comments, footnote NO2 bad. See 101 comments, footnote
NO3 bad. See 101 comments, footnote PO4 bad.107 @ 329db - See 101 comments, footnote NO2 bad. See 101 comments, footnote
NO3 bad. See 101 comments, footnote PO4 bad.108 @ 278db - See 101 comments, footnote NO2 bad. See 101 comments, footnote
NO3 bad. See 101 comments, footnote PO4 bad.109 @ 229db - See 101 comments, footnote NO2 bad. See 101 comments, footnote
NO3 bad. See 101 comments, footnote PO4 bad.110 @ 198db - See 101 comments, footnote NO2 bad. See 101 comments, footnote
NO3 bad. See 101 comments, footnote PO4 bad.111 @ 156db - See 101 comments, footnote NO2 bad. See 101 comments, footnote
NO3 bad. See 101 comments, footnote PO4 bad.112 @ 97db - See 101 comments, footnote NO2 bad. See 101 comments, footnote NO3
bad. See 101 comments, footnote PO4 bad.113 @ 57db - See 101 comments, footnote NO2 bad. See 101 comments, footnote NO3
bad. See 101 comments, footnote PO4 bad.114 @ 26db - See 101 comments, footnote NO2 bad. See 101 comments, footnote NO3
bad. See 101 comments, footnote PO4 bad.
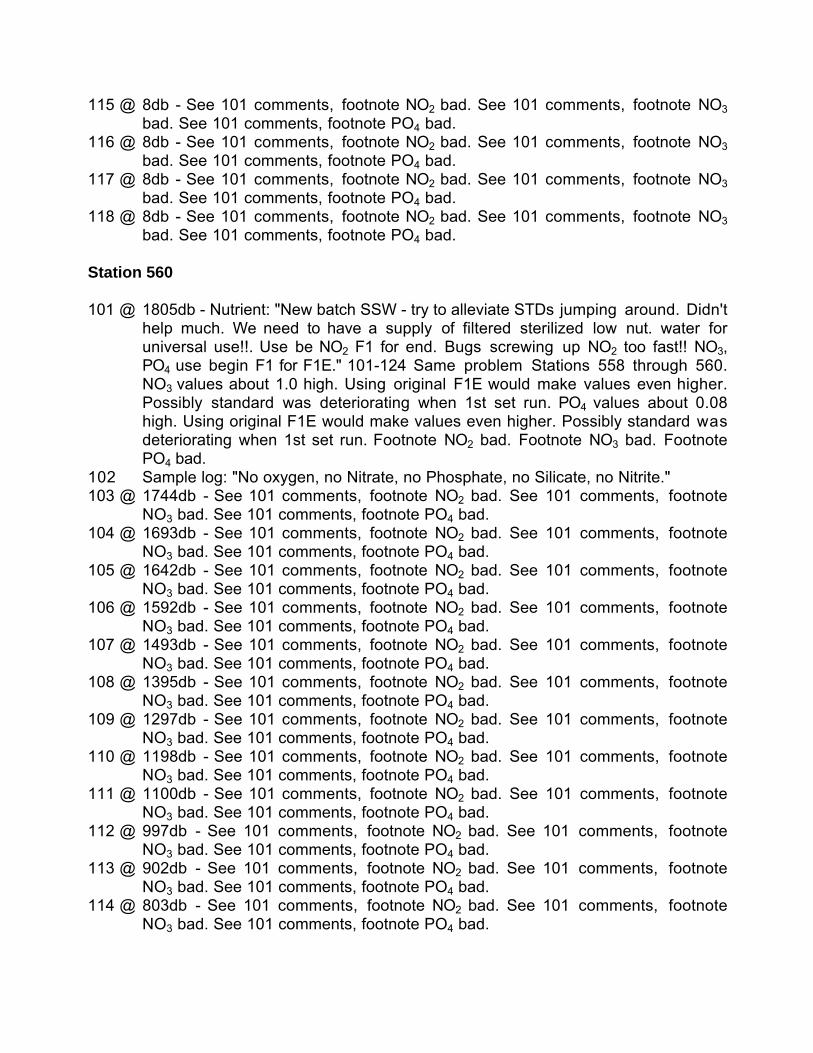
115 @ 8db - See 101 comments, footnote NO2 bad. See 101 comments, footnote NO3
bad. See 101 comments, footnote PO4 bad.116 @ 8db - See 101 comments, footnote NO2 bad. See 101 comments, footnote NO3
bad. See 101 comments, footnote PO4 bad.117 @ 8db - See 101 comments, footnote NO2 bad. See 101 comments, footnote NO3
bad. See 101 comments, footnote PO4 bad.118 @ 8db - See 101 comments, footnote NO2 bad. See 101 comments, footnote NO3
bad. See 101 comments, footnote PO4 bad.
Station 560
101 @ 1805db - Nutrient: "New batch SSW - try to alleviate STDs jumping around. Didn'thelp much. We need to have a supply of filtered sterilized low nut. water foruniversal use!!. Use be NO2 F1 for end. Bugs screwing up NO2 too fast!! NO3,PO4 use begin F1 for F1E." 101-124 Same problem Stations 558 through 560.NO3 values about 1.0 high. Using original F1E would make values even higher.Possibly standard was deteriorating when 1st set run. PO4 values about 0.08high. Using original F1E would make values even higher. Possibly standard wasdeteriorating when 1st set run. Footnote NO2 bad. Footnote NO3 bad. FootnotePO4 bad.
102 Sample log: "No oxygen, no Nitrate, no Phosphate, no Silicate, no Nitrite."103 @ 1744db - See 101 comments, footnote NO2 bad. See 101 comments, footnote
NO3 bad. See 101 comments, footnote PO4 bad.104 @ 1693db - See 101 comments, footnote NO2 bad. See 101 comments, footnote
NO3 bad. See 101 comments, footnote PO4 bad.105 @ 1642db - See 101 comments, footnote NO2 bad. See 101 comments, footnote
NO3 bad. See 101 comments, footnote PO4 bad.106 @ 1592db - See 101 comments, footnote NO2 bad. See 101 comments, footnote
NO3 bad. See 101 comments, footnote PO4 bad.107 @ 1493db - See 101 comments, footnote NO2 bad. See 101 comments, footnote
NO3 bad. See 101 comments, footnote PO4 bad.108 @ 1395db - See 101 comments, footnote NO2 bad. See 101 comments, footnote
NO3 bad. See 101 comments, footnote PO4 bad.109 @ 1297db - See 101 comments, footnote NO2 bad. See 101 comments, footnote
NO3 bad. See 101 comments, footnote PO4 bad.110 @ 1198db - See 101 comments, footnote NO2 bad. See 101 comments, footnote
NO3 bad. See 101 comments, footnote PO4 bad.111 @ 1100db - See 101 comments, footnote NO2 bad. See 101 comments, footnote
NO3 bad. See 101 comments, footnote PO4 bad.112 @ 997db - See 101 comments, footnote NO2 bad. See 101 comments, footnote
NO3 bad. See 101 comments, footnote PO4 bad.113 @ 902db - See 101 comments, footnote NO2 bad. See 101 comments, footnote
NO3 bad. See 101 comments, footnote PO4 bad.114 @ 803db - See 101 comments, footnote NO2 bad. See 101 comments, footnote
NO3 bad. See 101 comments, footnote PO4 bad.
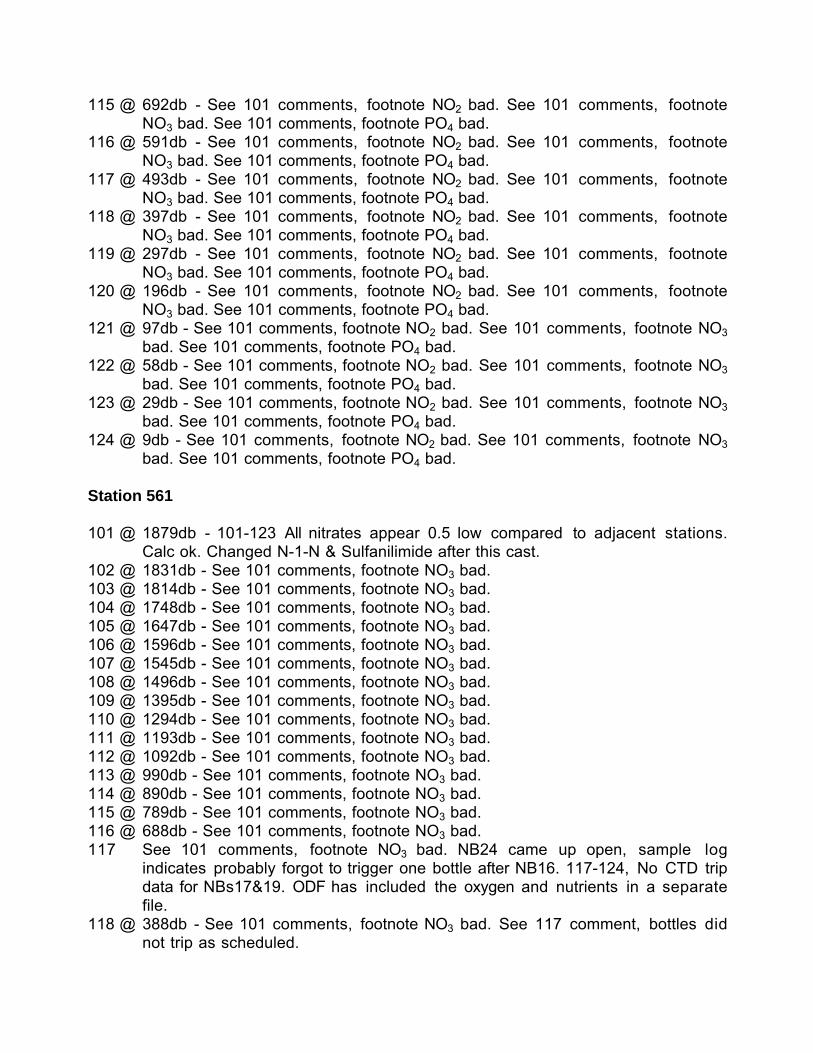
115 @ 692db - See 101 comments, footnote NO2 bad. See 101 comments, footnoteNO3 bad. See 101 comments, footnote PO4 bad.
116 @ 591db - See 101 comments, footnote NO2 bad. See 101 comments, footnoteNO3 bad. See 101 comments, footnote PO4 bad.
117 @ 493db - See 101 comments, footnote NO2 bad. See 101 comments, footnoteNO3 bad. See 101 comments, footnote PO4 bad.
118 @ 397db - See 101 comments, footnote NO2 bad. See 101 comments, footnoteNO3 bad. See 101 comments, footnote PO4 bad.
119 @ 297db - See 101 comments, footnote NO2 bad. See 101 comments, footnoteNO3 bad. See 101 comments, footnote PO4 bad.
120 @ 196db - See 101 comments, footnote NO2 bad. See 101 comments, footnoteNO3 bad. See 101 comments, footnote PO4 bad.
121 @ 97db - See 101 comments, footnote NO2 bad. See 101 comments, footnote NO3
bad. See 101 comments, footnote PO4 bad.122 @ 58db - See 101 comments, footnote NO2 bad. See 101 comments, footnote NO3
bad. See 101 comments, footnote PO4 bad.123 @ 29db - See 101 comments, footnote NO2 bad. See 101 comments, footnote NO3
bad. See 101 comments, footnote PO4 bad.124 @ 9db - See 101 comments, footnote NO2 bad. See 101 comments, footnote NO3
bad. See 101 comments, footnote PO4 bad.
Station 561
101 @ 1879db - 101-123 All nitrates appear 0.5 low compared to adjacent stations.Calc ok. Changed N-1-N & Sulfanilimide after this cast.
102 @ 1831db - See 101 comments, footnote NO3 bad.103 @ 1814db - See 101 comments, footnote NO3 bad.104 @ 1748db - See 101 comments, footnote NO3 bad.105 @ 1647db - See 101 comments, footnote NO3 bad.106 @ 1596db - See 101 comments, footnote NO3 bad.107 @ 1545db - See 101 comments, footnote NO3 bad.108 @ 1496db - See 101 comments, footnote NO3 bad.109 @ 1395db - See 101 comments, footnote NO3 bad.110 @ 1294db - See 101 comments, footnote NO3 bad.111 @ 1193db - See 101 comments, footnote NO3 bad.112 @ 1092db - See 101 comments, footnote NO3 bad.113 @ 990db - See 101 comments, footnote NO3 bad.114 @ 890db - See 101 comments, footnote NO3 bad.115 @ 789db - See 101 comments, footnote NO3 bad.116 @ 688db - See 101 comments, footnote NO3 bad.117 See 101 comments, footnote NO3 bad. NB24 came up open, sample log
indicates probably forgot to trigger one bottle after NB16. 117-124, No CTD tripdata for NBs17&19. ODF has included the oxygen and nutrients in a separatefile.
118 @ 388db - See 101 comments, footnote NO3 bad. See 117 comment, bottles didnot trip as scheduled.

119 See 101 comments, footnote NO3 bad. See 117 comment, bottles did not trip asscheduled.
120 @ 236db - See 117 comment, bottles did not trip as scheduled. See 101comments, footnote NO3 bad.
121 @ 236db - See 101 comments, footnote NO3 bad. See 117 comment, bottles didnot trip as scheduled.
122 @ 100db - See 117 comment, bottles did not trip as scheduled. See 101comments, footnote NO3 bad.
123 @ 60db - See 101 comments, footnote NO3 bad. See 117 comment, bottles did nottrip as scheduled.
124 See 117 comment, bottles did not trip as scheduled.
Station 562
101 @ 2027db - 101-124 Preliminary data appears 1.0 high. Note on data sheet says"only 10ml std added" with concentration of 8.75 used from calc on data sheet"NO3 = 8 + .75 = 8.75" Believe calc should be NO3 conc = 11.25*2/3 + .75 = 8.25.Recalculated data looks much better.
124 @ 9db - Delta-S .130 high at 9db. All water samples indicate NB24 closed near790db (NB14). Leave for now. Foot- note oxygen and nutrients bad. Inform PI thatbottle tripped incorrectly. ODF suggests this be coded leaky bottle and samplesbad.
Station 563
1all Nutrient: "NO2 STD - only 10ml? =(.5)" 101-124 "NO2 pipet not delivering right -use 1.62 for F1B & F1E" NO2 appears to be okay, agrees with Stations 562-565.
Station 564
1all Nutrient: "NO2 pipet wrong, use 1.62 for F1B & F1E" 101-123. NO2 appears to beokay, agrees with Stations 562-565.
107 @ 2323db - Phosphate .1 too high. Analyst suspects contamination. Footnote PO4
bad.117 @ 508db - Bottle leaked as per final data submission. Oxygen and nutrients do not
indicate a leak.124 Sample log: "No oxygen, no Nitrate, no Phosphate, no Silicate, no Nitrite." No
CTD trip information.
Station 565
114 @ 1195db - Sample log: "No oxygen (o-ring problem)" Bottle leaked as per finaldata submission. Nutrients agree with duplicate trip data.
117 @ 496db - Bottle leaked as per final data submission. Oxygen appears .07 high,footnote o2 bad, leak affected the sample. Nutrients appear to be okay.

121 @ 58db - O2 appears .5 low at 58db. Calc ok, no notes. Other water samples ok.Footnote o2 uncertain.
124 Sample log: "No oxygen, no Nitrate, no Phosphate, no Silicate, no Nitrite." NoCTD trip information.
Station 566
1all No German trip information as of 27 May 92 kms. ODF has included the oxygenand nutrients in a separate file.
Station 567
102 Sample log: "No samples taken."103 @ 3141db - Bottle leaked as per final data submission. Oxygen and nutrients
appear to be okay.117 @ 1007db - Bottle leaked as per final data submission. Oxygen and nutrients
appear to be okay.124 Sample log: "No samples taken."
Station 568
102 @ 3132db - Didn't trip as scheduled per final data submission. Oxygen agrees withduplicate trip data.
Station 569
103 @ 3103db - Didn't trip as scheduled per final data submission. Oxygen andnutrients data appears okay.
105 @ 2947db - Didn't trip as scheduled per final data submission. Oxygen andnutrients agree with duplicate trip data.
113 Sample log: "No samples taken."
Station 570
117 Sample log: "No oxygen, no Nitrate, no Phosphate, no Silicate, no Nitrite."
Station 571
101 @ 1956db - 101-124 No NO2 run, calib cast, all samples at same level. FootnoteNO2 not analyzed.
102 @ 1956db - See 101 comment, footnote NO2 not analyzed.103 @ 1957db - See 101 comment, footnote NO2 not analyzed.104 @ 1956db - See 101 comment, footnote NO2 not analyzed.105 @ 1957db - See 101 comment, footnote NO2 not analyzed.106 @ 1957db - See 101 comment, footnote NO2 not analyzed.107 @ 1957db - See 101 comment, footnote NO2 not analyzed.

108 @ 1957db - See 101 comment, footnote NO2 not analyzed.109 @ 1957db - See 101 comment, footnote NO2 not analyzed.110 @ 1957db - See 101 comment, footnote NO2 not analyzed.111 @ 1957db - See 101 comment, footnote NO2 not analyzed.112 @ 1958db - See 101 comment, footnote NO2 not analyzed.113 @ 1957db - See 101 comment, footnote NO2 not analyzed.114 @ 1958db - See 101 comment, footnote NO2 not analyzed.115 @ 1957db - See 101 comment, footnote NO2 not analyzed.116 @ 1957db - See 101 comment, footnote NO2 not analyzed.117 @ 1958db - See 101 comment, footnote NO2 not analyzed.118 @ 1958db - See 101 comment, footnote NO2 not analyzed.119 @ 1958db - See 101 comment, footnote NO2 not analyzed. Oxygen: "Apparent
overtitration." Added 1ml std and did normal overtitration procedure. Oxygen okay.120 @ 1958db - See 101 comment, footnote NO2 not analyzed.121 @ 1958db - See 101 comment, footnote NO2 not analyzed.122 @ 1958db - See 101 comment, footnote NO2 not analyzed.123 @ 1958db - See 101 comment, footnote NO2 not analyzed.124 @ 1958db - See 101 comment, footnote NO2 not analyzed.
Station 573
123 @ 13db - Didn't trip as scheduled per final data submission. Oxygen and nutrientsappear to be okay.
124 Sample log: "No oxygen, no Nitrate, no Phosphate, no Silicate, no Nitrite." NoCTD trip information.
Station 574
114 @ 794db - Didn't trip as scheduled per final data submission. Oxygen and nutrientsagree with duplicate trip data.
Station 575
101 Sample log: "No oxygen, no nitrate, no phosphate, no silicate, no nitrite."103 @ 1899db - Didn't trip as scheduled per final data submission. Oxygen and
nutrients agree with duplicate trip data.114 @ 847db - Didn't trip as scheduled per final data submission. Oxygen and nutrients
agree with duplicate trip data.116 @ 538db - Didn't trip as scheduled per final data submission. Oxygen and nutrients
agree with duplicate trip data.
Station 576
101 Sample log: "No oxygen, no nitrate, no phosphate, no silicate, no nitrite."102 @ 1687db - NO3 appears .7 (3%) high compared to adjacent stations. 102-124
Calc & peaks ok. No notes. Leave for now. Footnote NO3 uncertain.

103 @ 1637db - See 102 comments, footnote NO3 uncertain.104 @ 1586db - See 102 comments, footnote NO3 uncertain.105 @ 1535db - See 102 comments, footnote NO3 uncertain.106 @ 1484db - See 102 comments, footnote NO3 uncertain.107 @ 1435db - See 102 comments, footnote NO3 uncertain.108 @ 1333db - See 102 comments, footnote NO3 uncertain.109 @ 1233db - See 102 comments, footnote NO3 uncertain.110 @ 1132db - See 102 comments, footnote NO3 uncertain.111 @ 1031db - See 102 comments, footnote NO3 uncertain.112 @ 829db - See 102 comments, footnote NO3 uncertain.113 @ 728db - See 102 comments, footnote NO3 uncertain.114 @ 569db - See 102 comments, footnote NO3 uncertain. Didn't trip as scheduled per final
data submission. Oxygen and nutrients agrees with duplicate trip data.115 @ 569db - See 102 comments, footnote NO3 uncertain. Oxygen: "Small bubble in
sample." Oxygen agrees with duplicate trip bottle 14. However, o2 does not agreewith Station 577, but it does agree with Station 574. Will leave data as is, noteven footnoting.
116 @ 468db - See 102 comments, footnote NO3 uncertain.117 @ 368db - See 102 comments, footnote NO3 uncertain.118 @ 303db - See 102 comments, footnote NO3 uncertain.119 @ 203db - See 102 comments, footnote NO3 uncertain.120 @ 173db - See 102 comments, footnote NO3 uncertain.121 @ 127db - See 102 comments, footnote NO3 uncertain.122 @ 90db - See 102 comments, footnote NO3 uncertain.123 @ 40db - See 102 comments, footnote NO3 uncertain.124 @ 12db - See 102 comments, footnote NO3 uncertain.
Station 577
201-203 Sample log: "No oxygen, no nitrate, no phosphate, no silicate, no nitrite." NoCTD trip information.
223-224 Sample log: "No oxygen, no nitrate, no phosphate, no silicate, no nitrite." NoCTD trip information.
Station 578
1all 19 bottles.
Station 579
103 @ 1615db - Bottle leaked as per final data submission. Oxygen and nutrients donot indicate a leak.
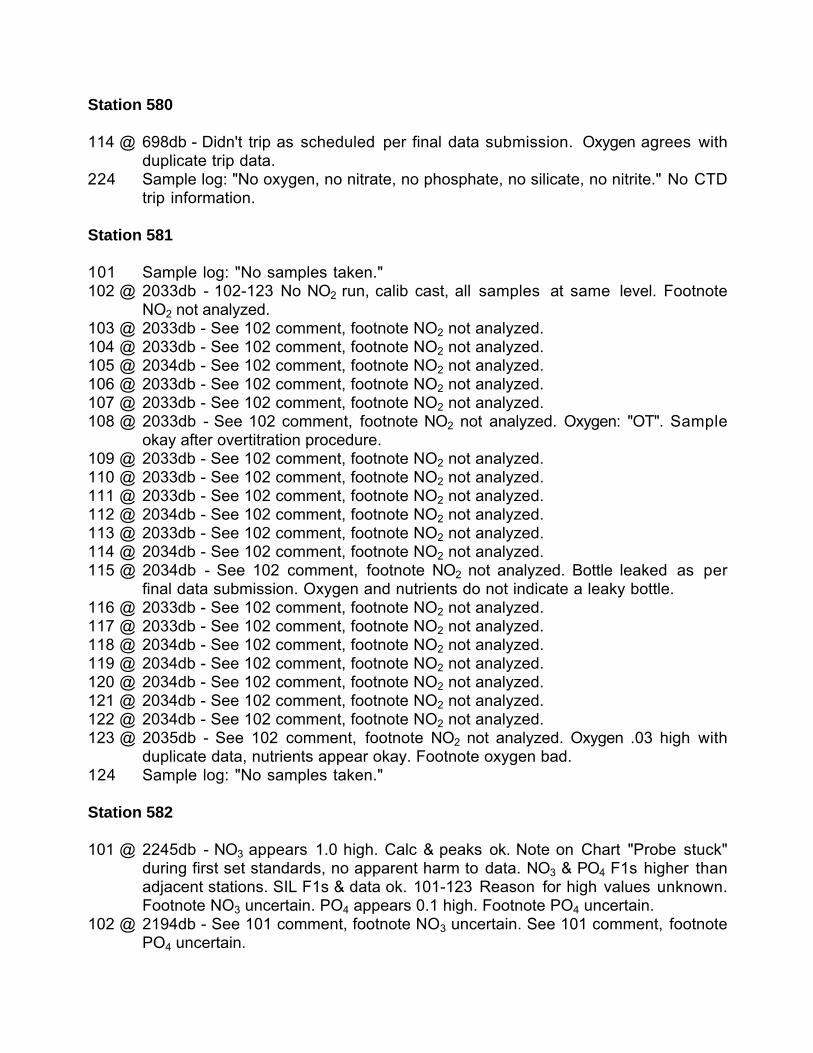
Station 580
114 @ 698db - Didn't trip as scheduled per final data submission. Oxygen agrees withduplicate trip data.
224 Sample log: "No oxygen, no nitrate, no phosphate, no silicate, no nitrite." No CTDtrip information.
Station 581
101 Sample log: "No samples taken."102 @ 2033db - 102-123 No NO2 run, calib cast, all samples at same level. Footnote
NO2 not analyzed.103 @ 2033db - See 102 comment, footnote NO2 not analyzed.104 @ 2033db - See 102 comment, footnote NO2 not analyzed.105 @ 2034db - See 102 comment, footnote NO2 not analyzed.106 @ 2033db - See 102 comment, footnote NO2 not analyzed.107 @ 2033db - See 102 comment, footnote NO2 not analyzed.108 @ 2033db - See 102 comment, footnote NO2 not analyzed. Oxygen: "OT". Sample
okay after overtitration procedure.109 @ 2033db - See 102 comment, footnote NO2 not analyzed.110 @ 2033db - See 102 comment, footnote NO2 not analyzed.111 @ 2033db - See 102 comment, footnote NO2 not analyzed.112 @ 2034db - See 102 comment, footnote NO2 not analyzed.113 @ 2033db - See 102 comment, footnote NO2 not analyzed.114 @ 2034db - See 102 comment, footnote NO2 not analyzed.115 @ 2034db - See 102 comment, footnote NO2 not analyzed. Bottle leaked as per
final data submission. Oxygen and nutrients do not indicate a leaky bottle.116 @ 2033db - See 102 comment, footnote NO2 not analyzed.117 @ 2033db - See 102 comment, footnote NO2 not analyzed.118 @ 2034db - See 102 comment, footnote NO2 not analyzed.119 @ 2034db - See 102 comment, footnote NO2 not analyzed.120 @ 2034db - See 102 comment, footnote NO2 not analyzed.121 @ 2034db - See 102 comment, footnote NO2 not analyzed.122 @ 2034db - See 102 comment, footnote NO2 not analyzed.123 @ 2035db - See 102 comment, footnote NO2 not analyzed. Oxygen .03 high with
duplicate data, nutrients appear okay. Footnote oxygen bad.124 Sample log: "No samples taken."
Station 582
101 @ 2245db - NO3 appears 1.0 high. Calc & peaks ok. Note on Chart "Probe stuck"during first set standards, no apparent harm to data. NO3 & PO4 F1s higher thanadjacent stations. SIL F1s & data ok. 101-123 Reason for high values unknown.Footnote NO3 uncertain. PO4 appears 0.1 high. Footnote PO4 uncertain.
102 @ 2194db - See 101 comment, footnote NO3 uncertain. See 101 comment, footnotePO4 uncertain.

103 @ 2144db - See 101 comment, footnote NO3 uncertain. See 101 comment, footnotePO4 uncertain.
104 @ 2103db - See 101 comment, footnote NO3 uncertain. See 101 comment,footnote PO4 uncertain.
105 @ 2053db - See 101 comment, footnote NO3 uncertain. See 101 comment, footnotePO4 uncertain.
106 @ 2002db - See 101 comment, footnote NO3 uncertain. See 101 comment, footnotePO4 uncertain.
107 @ 1952db - See 101 comment, footnote NO3 uncertain. See 101 comment, footnotePO4 uncertain.
108 @ 1901db - See 101 comment, footnote NO3 uncertain. See 101 comment, footnotePO4 uncertain.
109 @ 1698db - See 101 comment, footnote NO3 uncertain. See 101 comment, footnotePO4 uncertain.
110 @ 1495db - See 101 comment, footnote NO3 uncertain. See 101 comment, footnotePO4 uncertain.
111 @ 1293db - See 101 comment, footnote NO3 uncertain. See 101 comment, footnotePO4 uncertain. O2 appears .1 high at 1293db. Calc ok. No notes. Salinity min.Nutrients have normal gradient. Footnote oxygen uncertain.
112 @ 1091db - See 101 comment, footnote NO3 uncertain. See 101 comment, footnotePO4 uncertain. Oxygen: bubble (1/8" dia.)" Oxygen appears to be okay.
113 @ 889db - See 101 comment, footnote NO3 uncertain. See 101 comment, footnotePO4 uncertain.
114 @ 637db - See 101 comment, footnote NO3 uncertain. See 101 comment, footnotePO4 uncertain.
115 @ 586db - See 101 comment, footnote NO3 uncertain. See 101 comment, footnotePO4 uncertain.
116 @ 485db - See 101 comment, footnote NO3 uncertain. See 101 comment, footnotePO4 uncertain. Oxygen: "bubble." Oxygen appears to be okay.
117 @ 385db - See 101 comment, footnote NO3 uncertain. See 101 comment, footnotePO4 uncertain.
118 @ 284db - O2 appears .3 low at 284db. Calc ok, no notes. Other water samplesincluding salinity have bump this level. Delta-S .000. ODF suggests this becoded leaky bottle and samples bad. Footnote oxygen and nutrients bad. Iftripping is resolved, then code PO4 and NO3 as uncertain. Inform PI that bottletripped incorrectly.
119 @ 184db - See 101 comment, footnote NO3 uncertain. See 101 comment, footnotePO4 uncertain.
120 @ 84db - See 101 comment, footnote NO3 uncertain. See 101 comment, footnotePO4 uncertain.121 @ 43db - See 101 comment, footnote NO3 uncertain. See101 comment, footnote PO4 uncertain.
122 @ 23db - See 101 comment, footnote NO3 uncertain. See 101 comment, footnotePO4 uncertain.
123 @ 13db - See 101 comment, footnote NO3 uncertain. See 101 comment, footnotePO4 uncertain.
124 @ 13db - Sample log: "No o2, NO3, PO4, sil or NO2."

Station 583
103 @ 2242db - See 101 comment. Oxygen: "Bubble - strong blue back(?)" O2 appears.14 high at 2242db. Calc ok. Other water samples ok. Footnote oxygen bad.
114 @ 702db - Didn't trip as scheduled per final data submission. Oxygen agrees withduplicate trip data.
Station 584
109 @ 1379db - Didn't trip as scheduled per final data submission. Oxygen does notagrees with duplicate trip data. O2 .05 low. Footnote oxygen bad.
115 @ 596db - Bottle leaked as per final data submission. There is a feature at thislevel which does not show in the adjoining stations. However, if this is not a realfeature then bottle 14 is incorrect also.
Station 586
115 @ 1173db - Didn't trip as scheduled per final data submission. Oxygen andnutrients agree with duplicate trip data.
117 @ 969db - Didn't trip as scheduled per final data submission. Oxygen and nutrientsagree with duplicate trip data.
119 @ 470db - Didn't trip as scheduled per final data submission. Oxygen and nutrientsagree with duplicate trip data.
124 @ 14db - NO3 appears 5um/l high at 14db. Calc & peak ok. Delta- S .129 high at14db. All water samples indicate NB24 tripped just below NB23 at 34db. It didnot trip with bottle 23, but rather between bottles 22 and 23. Footnote oxygen andnutrients bad. Inform PI that bottle tripped incorrectly. ODF suggests this becoded leaky bottle and samples bad.
Station 587
111 @ 1465db - Didn't trip as scheduled per final data submission. Oxygen andnutrients agree with duplicate trip data.
124 No CTD trip data available. ODF has included the oxygen and nutrients in aseparate file.
114-123 Sample log: No samples taken. No CTD trip information.
Station 588
1all Oxygen draw temperature was not recorded. Used in situ temperature.114 @ 712db - Didn't trip as scheduled per final data submission. Oxygen and nutrients
agree with duplicate trip data.121 @ 105db - Didn't trip as scheduled per final data submission. Oxygen and nutrients
agree with duplicate trip data.

Station 589
101 @ 28db - NO3 appears 1.5 high. Calc & peaks ok. Notes on nutrient data sheet:"New imidazole buffer". "STDs look low! 4%!" F1s a little higher than adjacentstations.
101-124 Other water samples including silicates ok. Footnote NO3 bad. PO4 appears0.05 high. Footnote PO4 bad. Didn't trip as scheduled per final data submission.Oxygen agrees with duplicate trip data.
102 @ 28db - See 101 comments, footnote NO3 bad. See 101 comments, footnote PO4
bad. Oxygen: "Small bubble." Data okay.103 @ 3215db - See 101 comments, footnote NO3 bad. See 101 comments, footnote
PO4 bad.104 @ 3165db - See 101 comments, footnote NO3 bad. See 101 comments, footnote
PO4 bad.105 @ 3111db - See 101 comments, footnote NO3 bad. See 101 comments, footnote
PO4 bad.106 @ 3063db - See 101 comments, footnote NO3 bad. See 101 comments, footnote
PO4 bad.107 @ 2964db - See 101 comments, footnote NO3 bad. See 101 comments, footnote
PO4 bad.108 @ 2802db - See 101 comments, footnote NO3 bad. See 101 comments, footnote
PO4 bad.109 @ 2597db - See 101 comments, footnote NO3 bad. See 101 comments, footnote
PO4 bad.110 @ 2392db - See 101 comments, footnote NO3 bad. See 101 comments, footnote
PO4 bad.111 @ 1986db - See 101 comments, footnote NO3 bad. See 101 comments, footnote
PO4 bad. Didn't trip as scheduled per final data submission. Oxygen agrees withduplicate trip data.
112 @ 1986db - See 101 comments, footnote NO3 bad. See 101 comments, footnotePO4 bad.
113 @ 1784db - See 101 comments, footnote NO3 bad. See 101 comments, footnotePO4 bad.
114 @ 1696db - See 101 comments, footnote NO3 bad. See 101 comments, footnotePO4 bad. Oxygen: "Bubble." Data okay.
115 @ 1381db - See 101 comments, footnote NO3 bad. See 101 comments, footnotePO4 bad.
116 @ 1195db - See 101 comments, footnote NO3 bad. See 101 comments, footnotePO4 bad. Oxygen: "Bubble." Data okay.
117 @ 585db - See 101 comments, footnote NO3 bad. See 101 comments, footnotePO4 bad. Oxygen: "Bubble." Data okay. Didn't trip as scheduled per final datasubmission. Oxygen agrees with duplicate trip data.
118 @ 585db - See 101 comments, footnote NO3 bad. See 101 comments, footnotePO4 bad.
119 @ 585db - See 101 comments, footnote NO3 bad. See 101 comments, footnotePO4 bad.

120 @ 480db - See 101 comments, footnote NO3 bad. See 101 comments, footnotePO4 bad. Oxygen: "OT" Data okay.
121 @ 383db - See 101 comments, footnote NO3 bad. See 101 comments, footnotePO4 bad.
122 @ 286db - See 101 comments, footnote NO3 bad. See 101 comments, footnotePO4 bad. Oxygen: "Bubble." Data okay.
123 @ 188db - See 101 comments, footnote NO3 bad. See 101 comments, footnotePO4 bad.
124 @ 99db - See 101 comments, footnote NO3 bad. See 101 comments, footnote PO4 bad.
Station 590
1all 18 bottle tripped.108 @ 1813db - Bottle leaked as per final data submission. Oxygen and nutrients look
good and do not indicate leaking bottle.114 @ 104db - Didn't trip as scheduled per final data submission. Oxygen and nutrients
agree with duplicate trip data.117 @ 19db - Didn't trip as scheduled per final data submission. Oxygen and nutrients
agree with duplicate trip data.
Station 591
103 @ 2998db - Didn't trip as scheduled per final data submission. Oxygen andnutrients agree with duplicate trip data.
124 Sample log: "No samples taken."
Station 596
101 Sample log: "No samples taken"107 Sample log: "No samples taken"123 Sample log: "No samples taken"124 Sample log: "No samples taken"
Station 597
102 Sample log: "Bottle didn't close, no samples."104 Sample log: "Bottle didn't close, no samples."105 Sample log: "Bottle didn't close, no samples."106 Sample log: "Bottle didn't close, no samples."107 Sample log: "Bottle didn't close, no samples."109 Sample log: "Bottle didn't close, no samples."110 Sample log: "Bottle didn't close, no samples."111 Sample log: "Bottle didn't close, no samples."112 Sample log: "Bottle didn't close, no samples."113 Sample log: "Bottle didn't close, no samples."115 Sample log: "Bottle didn't close, no samples."

Station 598
102 Sample log: "Bottle didn't close, no samples."103 Sample log: "Bottle didn't close, no samples."104 Sample log: "Bottle didn't close, no samples."107 Sample log: "Bottle didn't close, no samples."109 Sample log: "Bottle didn't close, no samples."110 Sample log: "Bottle didn't close, no samples."111 Sample log: "Bottle didn't close, no samples."112 Sample log: "Bottle didn't close, no samples."115 Sample log: "Bottle didn't close, no samples."121 Sample log: "Bottle didn't close, no samples."122 Sample log: "Bottle didn't close, no samples."123 Sample log: "Bottle didn't close, no samples."124 Sample log: "Bottle didn't close, no samples."
Station 599
122 @ 64db - Didn't trip as scheduled per final data submission. Oxygen and nutrientsagree with duplicate trip data.
123 @ 34db - Sample log: "No nitrate, no phosphate, no silicate, no nitrite."
Station 600
102 @ 3556db - Oxygen: "Bubble." Appears .05 low. Calc ok. Footnote oxygen bad.122 @ 94db - Didn't trip as scheduled per final data submission. Oxygen and nutrients
agree with duplicate trip data.
Station 601
1all Oxygen: Draw temp no good, -0.6 vs 3. Took therm apart to dry out. No oxygendraw temperature, used in situ temperature.
106 Sample log: "No oxygen, no nitrate, no phosphate, no silicate," no nitrite.113 @ 1412db - Bottle leaked as per final data submission. Oxygen and nutrients do
not indicate a bottle leak.121 @ 205db - Didn't trip as scheduled per final data submission. Oxygen and nutrients
agree with duplicate trip data.
Station 602
114 @ 989db - Didn't trip as scheduled per final data submission. Oxygen and nutrientsappear okay.
121 @ 103db - Didn't trip as scheduled per final data submission. Oxygen and nutrientsagree with duplicate trip data.

Station 603
120 @ 304db - Didn't trip as scheduled per final data submission. Oxygen does notagree with duplicate trip data .02 low. Nutrients agree with duplicate trip data.
122 Water samples indicate NB22 tripped near NB13 at 1814db. Leave for now. Notrip information received.
Station 604
122 @ 102db - Didn't trip as scheduled per final data submission. Oxygen .03 lowerthan duplicate trip data. Footnote oxygen bad. Nutrients appear to be okay.
Station 605
1all Oxygen: "No draw temps. therm read 1.6 at 1st NB, T=2.5" No oxygen drawtemperatures, in situ temperature used.
119 @ 201db - Didn't trip as scheduled per final data submission. Oxygen and nutrientsagrees with duplicate trip data.
122 @ 32db - All water samples appear to be from about 300db instead 32db intended.Delta-S .074 high. Inform PI that bottle tripped incorrectly. ODF suggests thisbottle be coded leaky and all samples bad.
124 Sample log: "No samples taken"
Station 608
101 @ 3818db - Sample log: "No samples drawn."103 @ 3820db - Sample log: "No samples drawn."105 @ 3820db - Sample log: "No samples drawn."107 @ 3818db - Sample log: "No samples drawn."109 @ 3820db - Sample log: "No samples drawn."110 @ 3820db - Bottle leaked as per final data submission Oxygen and nutrients also
indicate that this bottle leaked. Footnote oxygen and nutrients bad.111 @ 3821db - Sample log: "No samples drawn."113 @ 3819db - Sample log: "No samples drawn."115 @ 3819db - Sample log: "No samples drawn."116 @ 3819db - Bottle leaked as per final data submission Oxygen and nutrients also
indicate that this bottle leaked. Footnote oxygen and nutrients bad.117 @ 3820db - Sample log: "No samples drawn."119 @ 3818db - Sample log: "No samples drawn."121 @ 3818db - Sample log: "No samples drawn."123 @ 3821db - Sample log: "No samples drawn."

Station 609
103 @ 3534db - NO2 .24 high at 3534db. Calc & peak ok. No obvious relation to spikenoted above. See 104 comment. Footnote NO2 uncertain.
104 @ 3444db - There is a spike after 103 & 104 on NO2. Analyst did not indicate anymechanical problem. NO2 .04 high at 3444db. Calc & peak ok. No obviousrelation to spike noted above.
110 Sample log: "No samples." No CTD trip information.114 @ 1180db - Oxygen: "Small bubble." Data okay. PO4 appears 0.1 low at 1180db.
Calc & peak ok. No notes. Footnote PO4 uncertain.116 Sample log: "No samples drawn."117 Sample log: "No samples drawn."118 Sample log: "No samples drawn."119 Sample log: "No samples drawn."120 Sample log: "No samples drawn."121 Sample log: "No samples drawn."122 Oxygen: "Small bubble. " Intended to trip at 58db with NB23 but water samples
indicate it closed deeper. Nutrients appear to be from about 500db and oxygenfrom about 1700db. oxy may be bad titration. No CTD trip data or bottle salinityavailable tho sample log indicates bottle salinity was drawn.
124 Sample log: "No samples drawn."
Station 610
110 Sample log: "No samples taken"118 @ 304db - Oxygen: "Bubble." Sample log says flask 1041 for this sample as well
as 116. Other stations using this box indicate 1043 as shown on data sheet iscorrect. Value appears high based on gradient but vertical sections indicate it isprobably good. Footnote o2 uncertain.
122 Sample log: "No samples taken"
Station 611
119 @ 100db - Didn't trip as scheduled per final data submission. Oxygen and nutrientsagrees with duplicate trip data.
122 Sample log: "No samples drawn."123 @ 11db - Delta-S .237 high at 11db. All water samples indicate bottle close
between 100 & 200db.124 Sample log: "No samples drawn."Station 612
119 @ 63db - Didn't trip as scheduled per final data submission. Oxygen and nutrientsagrees with duplicate trip data.
122 Sample log: "No samples drawn."124 Sample log: "No samples drawn."

Station 613
110 @ 2078db - Oxygen: "Small bubble." Oxygen high compared with station profile, butagrees with Stations 602-611. Footnote oxygen uncertain.
119 @ 90db - Oxygen: "Bubble." Appears .07 high. All other water samples same asNB19. Footnote oxygen bad.
120 @ 90db - Didn't trip as scheduled per final data submission. Nutrients agrees withduplicate trip data.
121 Oxygen: "Small bubble." Data okay. All water samples indicate NB21 closed near1000db rather than intended 22db level. No CTD trip information. FootnoteOxygen and nutrients bad because bottle did not trip correctly.
122 Sample log: "No samples drawn."124 Sample log: "No samples drawn."
Station 615
113 Sample log: "No samples drawn."119 Sample log: "No samples drawn."
Station 616
116 Sample log: "No samples drawn."
Station 617
116 Sample log: "No samples drawn.
Station 618
203 @ 1850db Oxygen: "Small bubble." Data okay. Bottle leaked as per final datasubmission. Oxygen and nutrients do not indicate a bottle leak. Data agrees withduplicate trip.
121-124 Sample log: "No samples drawn. No CTD trip information.215 Sample log: "No samples taken"
Station 619
101 Sample log: "No oxygen or nutrients drawn."103 Sample log: "No oxygen or nutrients drawn."105 Sample log: "No oxygen or nutrients drawn."106 @ 797db - Didn't trip as scheduled per final data submission. Oxygen and nutrients
agrees with duplicate trip data.107 @ 797db - Sample log: "No oxygen or nutrients drawn."

108 @ 797db - Wrong pressure assigned. Suspect this tripped with 106. Send inquiryto J.Swift. Done, and data changed. Didn't trip as scheduled per final datasubmission. Data looks good with corrected pressure. Oxygen and nutrientsagrees with duplicate trip data.
109 Sample log: "No oxygen or nutrients drawn."111 Sample log: "No oxygen or nutrients drawn."113 Sample log: "No oxygen or nutrients drawn."115 Sample log: "No oxygen or nutrients drawn."117 Sample log: "No oxygen or nutrients drawn."119 Sample log: "No oxygen or nutrients drawn."121 Sample log: "No oxygen or nutrients drawn."123 Sample log: "No oxygen or nutrients drawn."
Station 620
1all 12 bottles tripped.
Station 621
1all 9 bottles tripped.107 @ 98db - Oxygen: "Small bubble." Possibly a little low per %sat. Footnote o2 bad.
Leak must have affected the oxygen. Nutrients appear to be okay. Bottle leakedas per final data submission.
References
Unesco, 1983. International Oceanographic tables. Unesco Technical Papers in MarineScience, No. 44.
Unesco, 1991. Processing of Oceanographic Station Data. Unesco memograph ByJPOTS editorial panel.
WHPO Summary
Several data files are associated with this report. They are the a1e.sum, a1e.hyd,a1e.csl and *.wct files. The a1e.sum file contains a summary of the location, time, typeof parameters sampled, and other pertinent information regarding each hydrographicstation. The a1e.hyd file contains the bottle data. The *.wct files are the CTD data foreach station. The *.wct files are zipped into one file called a1e.wct.zip. The a1e.csl fileis a listing of CTD and calculated values at standard levels.
The following is a description of how the standard levels and calculated values werederived for the a1e.csl file:
Salinity, Temperature and Pressure: These three values were smoothed using thefollowing binomial filter-
t(j) = 0.25ti(j-1) + 0.5ti(j) + 0.25ti(j+1) j=2....N-1
When a pressure level is represented in the *.csl file that is not contained within theCTD values, the value was linearly interpolated to the desired level after applying thebinomial filtering.
Sigma-theta (SIG-TH:KG/M3), Sigma-2 (SIG-2: KG/M3), and Sigma-4(SIG-4: KG/M3):These values are calculated using the practical salinity scale (PSS-78) and theinternational equation of state for seawater (EOS-80) as described in the Unescopublication 44 at reference pressures of the surface for SIG-TH; 2000 dbars for Sigma-2; and 4000 dbars for Sigma-4.Gradient Potential Temperature (GRD-PT: C/DB 10-3) is calculated as the least squaresslope between two levels, where the standard level is the center of the interval. Theinterval being the smallest of the two differences between the standard level and the twoclosest values. The slope is first determined using CTD temperature and then theadiabatic lapse rate is subtracted to obtain the gradient potential temperature.Equations and FORTRAN routines are described in Unesco publication 44.
Gradient Salinity (GRD-S: 1/DB 10-3) is calculated as the least squares slope betweentwo levels, where the standard level is the center of the standard level and the twocloses values. Equations and FORTRAN routines are described in Unesco publication44.

Potential Vorticity (POT-V: 1/ms 10-11) is calculated as the vertical component ignoringcontributions due to relative vorticity, i.e. pv=fN2/g, where f is the coriolius parameter, Nis the buoyancy frequency (data expressed as radius/sec), and g is the localacceleration of gravity.
Buoyancy Frequency (B-V: cph) is calculated using the adiabatic leveling method,Fofonoff (1985) and Millard, Owens and Fofonoff (1990). Equations and FORTRANroutines are described in Unesco publication 44.
Potential Energy (PE: J/M2: 10-5) and Dynamic Height (DYN-HT: M) are calculated byintegrating from 0 to the level of interest. A constant value of specific volume anomaly isassumed. Equations and FORTRAN routines are described in Unesco publication,Processing of Oceanographic station data.
Neutral Density (GAMMA-N: KG/M3) is calculated with the program GAMMA-N (Jackettand McDougall) version 1.3 Nov. 94.
Directory WOCE0: <HYDATA.ONETIME.A1E>
A1E.BAK; 1 18-JUL-1994 - original from ellettA1E.DJE; 1 18-JUL-1994 - manually fixed duplicate tripsA1EDJE.CMP; 2 20-JUL-1994 - o/p compqual2
NUTOX.TEM 14-JUN-1994 - temperatures used to convert liters to kg
A1E.STA; 2 22-JUN-1993 - raw sum fileA1E.SUM; 1 2-NOV-1993
A1ECFC.RAW 28-AUG-1996 - raw cfc data ftp'd to sun fromA1E.CFC 28-AUG-1996 - A. Putzka
A1E.CRB Alex Kozyr =- tcarbn and alkaliMETEOR18.SEA; 1 8-SEP-1993 - raw hydro data, needed re-formatting contains nutl
and oxyl temp cols.A1E.HY2; 1 2-NOV-1993 - hydro dataA1EL.HY2; 1 26-OCT-1993 - "" in liters
A1EDQE.OLD 2-AUG-1994 - A1E.HY2 + A1E.DJE (SALNTY, OXYGEN, SILCAT,NITRAT, NITRIT, PHSPHT)15-SEP-1994 - letter from Sy accepting dqe q2 bytes except for 3samples. q1 bytes flipped accordingly25-Jun-95 - reply to Eugenes dqe. modified only what Sy agreed to.
A1E.DQE 13-JUN-1996 - RE-CALIBRATED pgm CTDSAL

C CTD-Salinity correction for salinity error:C
IF(ISTA .GE. 558 .AND. ISTA .LE. 566)THENSADD1= -0.0177 + 0.000689 * CSAL
ELSE IF(ISTA .GE. 567 .AND. ISTA .LE. 602)THENSADD1= -0.2116 + 0.006299 * CSAL
ELSE IF(ISTA .GE. 603 .AND. ISTA .LE. 622)THENSADD1= 0.0793 - 0.002217 * CSAL
END IFC CTD-Salinity correction for pressure dependence:C
SADD2= 8.3E-5 + 1.374E-6 * PRS - 9.45329E-10 * PRS**2 +& 1.117E-13 * PRS**3
CSALnew= CSAL +SADD1 + SADD2

DQE of CTD data for the 18-th cruise of the r/v "Meteor", WOCE section A1E in theNorthern Atlantic.(Eugene Morozov)
Data quality of 2-db CTD temperature, salinity and oxygen profiles and reference rosettesamples were examined. Vertical distributions and theta-salinity curves were comparedfor individual stations using the data of up and down CTD casts and rosette probes. Dataof several neighboring stations were compared. The distance between stations was notless than 20 miles and the stations were often located in different water structures so thatcomparison of many stations was not reasonable. The data were compared with the 91/1cruise of the r/v "Tyro" carried out in the same region of the Northern Atlantic.Measurements made in April, 1991.
The data were also compared with the atlases:
• North Atlantic Ocean Atlas, vol. 2, L.V. Worthington and W.R. Wright, WHOI, 1970.
• World Ocean Atlas (USSR Navy, 1977)
Questionable data in *.hy2 file were marked in QUALT2 word.
It is necessary to calibrate CTD salinities in upcast measurements. They are on theaverage lower than bottle salinity measurements by 0.01 with lesser differences in deeperwaters.
As CTD oxygen measurements are concerned, it is clear that more work is needed tomake the data acceptable to the requirements of WOCE. The resolution of the sensor isabout 5 Umoles/kg that does not make vertical oxygen profiles smooth. This may be dueto truncation of the original data before conversion to Umol/kg. There are seriousproblems in the measurements in the upper 200 db where the differences betweenCTDOXY and OXYGEN measurements can be as large as 50 Umoles/kg. Beginning withthe station 600 unacceptable differences are found in the entire water depth. Thesediscrepancies can be caused by an incorrect temperature compensation for the oxygensensor as well as by many other reasons. The oxygen measurements made with bottlesamples seem correct. Nevertheless some questionable data were found in thesemeasurements. Duplicate determinations of salinity and oxygen made from rosettesamples at the same level indicate that bottle measurements are a high quality data setthat match WOCE requirements.

Listing of results from the comparison of salinity and oxygen data. Only those stations arelisted which have data remarks.
Sta Pressure Remarks559 56.7 SALNITY low by no less than 0.01 compared with downcast
CTDSAL.458 db I do not agr ee wi th D. El l et t that OXYGEN is hi gh enough to f l ag i t 4. It
i s hi gh only by no mor e than 1. 5 s o flag 3 - ques ti onabl e is bett er . 560 96.8 SALNTY high by no less than 0.01 compared with downcast
CTDSAL. Upcast CTDSAL exceeds SALNTY.691 1 agr ee wi th D. Ell ett . OXYGEN dat a exc eed nor m by 2, t he fl ag is 3.
561 990 OXYGEN measurements exceed norm by 3.5, and no other datashow a maximum here, so I flag it 4.
562 9 db I agree with D. Ellett that SALNTY is high.565 58 db I agree with D. Ellett that OXYGEN is low.
496 db I agree with D. Ellett that OXYGEN is high.568 27.1 db SALNTY exceeds upcast and downcast CTDSAL by no less than
0.01.571 1958 db sample 19 I agree with D. Ellett that OXYGEN is high.
1958 db sample 23 I agree with D. Ellett that OXYGEN is high.573 2535 db I agree with D. Ellett that SALNTY is high.
2586 db I flag SALNTY 4- Bad, it is lower than downcast CTDSAL.574 around 566db CTDOXY low, Changes of temperature are observed near these
levelsaround 726db CTDOXY low, Changes of temperature are observed near these
levelsaround 890db CTDOXY low, CTD data should be checked for temperature
compensation or these CTDOXY extrema are caused byintrusions as well as temperature and salinity changes.
1000-1400 db CTDOXY high, not supported by bottle measurements.575 30 db I agree that SALNTY is high.
59 db I agree that SALNTY is high. CTDTMP and CTDSAL in the interval436 - 636 db seem to be linearly interpolated. It should be flaggedin the quality word as 6 - interpolated over 6 db, if not by 4 - bad.
around 516 db CTDOXY high, CTD measurements do not repeat OXYGENminimum registered by bottle measurements.
around 1200 db CTDOXY high, the maximum is not supported by OXYGENmeasurements, but it may be true. This maximum can also beseen on station 574.
576 around 960 db CTDOXY high. The minimum is not supported by OXYGENmeasurements, nor there are any temperature or salinity extremathat could indicate intrusions.
578 300-380 db CTDOXY low, this minimum is not supported by OXYGENmeasurements, nor by temperature or salinity extrema that couldindicate intrusions or bad temperature compensation.
579 8.1 db SALNTY exceeds upcast and downcast CTDSAL by no less than 0.01.
300-380 db CTDOXY low, this minimum is not supported by OXYGENmeasurements, nor by temperature or salinity extrema that couldindicate intrusions or bad temperature compensation.

Sta Pressure Remarks580 240 - 530 db CTDOXY low, this minimum is not supported by OXYGEN
measurements, nor by temperature or salinity extrema that couldindicate intrusions or bad temperature compensation.
581 2034 db sample 23 I agree with D. Ellett that OXYGEN is high.582 around 1290 db Unsupported CTDOXY maximum. It could be supported if OXYGEN
measurements at 1293 db were not flagged 3.below 2198 db CTDOXY is decreasing to the bottom instead of increasing which is
registered by OXYGEN measurements583 2242 db I agree with D. Ellett that OXYGEN is high.584 197 db SALNTY exceeds upcast and downcast CTDSAL by no less than
0.01.2349 db I do not agree with D. Ellett that SALNTY is high. Downcast
CTDSAL agree well with the SALNTY. I flag it 2.585 200-730db CTDOXY very low, CTDOXY measurements above 200 db are bad
as noted in the text in the beginning of my report.586 33.7 SALNTY exceeds upcast and downcast CTDSAL by no less than
0.01.63.9 SALNTY exceeds downcast CTDSAL by 0.01. Upcast CTDSAL
exceeds SALNTY by 0.04. I flag SALNTY 3 - Qble.104 db I agree with D. Ellett that SALNTY is high.
587 2674 db I agree with D. Ellett that SALNTY is low.589 1783.5 SALNTY is lower than downcast CTDSAL the flag is 3 – Qble.591 2998 db, sample 3 If the bottle was not flagged 4, 1 would consider SALNTY
acceptable, 34.598 is not so high compared with 34.596 for theduplicate sample and agrees well with downcast CTDSAL -34.596. I flag it 3 - Qble.
597 38.2 db SALNTY exceeds downcast CTDSAL by 0.1 and SALNTY is lessthan upcast CTDSAL by 0.04, the flag is 3 - Qble.
68.5 db SALNTY exceeds upcast and downcast CTDSAL by no less than 0.01.
209 db SALNTY is less than upcast CTDSAL by 0.02 and SALNTY is lessthan downcast CTDSAL by 0.05.
600 3556 db I agree with D. Ellett that OXYGEN is low.604 101 db, sample 22 I flag SALNTY 3 the bottle was flagged 4. The difference between
SALNTY and upcast CTDSAL is not very large, upcast CTDSALwas not calibrated, and the vertical salinity gradient is very high.Anyhow the difference between duplicate samples is acceptable(35.183 and 35.181). OXYGEN seems OK.
616 500-700 db CTDOXY low2120 db sample 8 I agree with D. Ellett that SALNTY is high2721 db sample 6 I agree with D. Ellett that SALNTY is high
618 1849. 8 db sampl e 7 1854 db i n the report of D. Ellett ). The value of OXYGEN is 277compared with 278 for dupli cates. I flag it 3-qble not 4 as D.Ellett does.
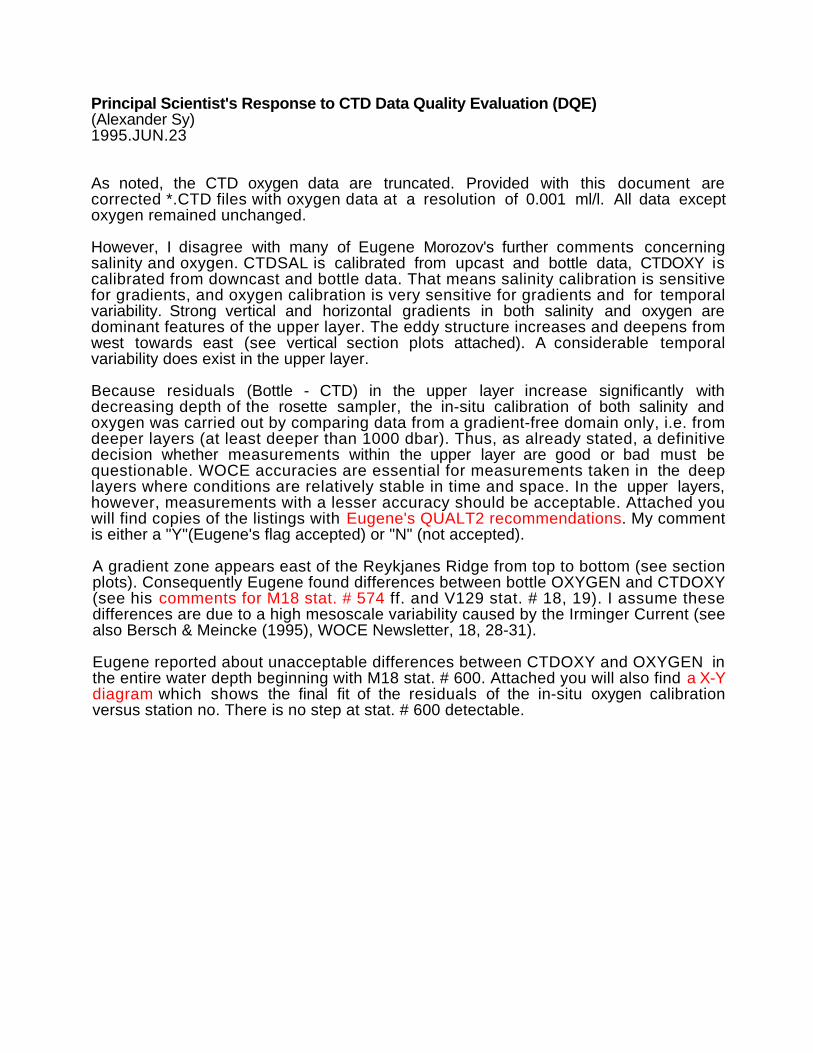
Principal Scientist's Response to CTD Data Quality Evaluation (DQE)(Alexander Sy)1995.JUN.23
As noted, the CTD oxygen data are truncated. Provided with this document arecorrected *.CTD files with oxygen data at a resolution of 0.001 ml/l. All data exceptoxygen remained unchanged.
However, I disagree with many of Eugene Morozov's further comments concerningsalinity and oxygen. CTDSAL is calibrated from upcast and bottle data, CTDOXY iscalibrated from downcast and bottle data. That means salinity calibration is sensitivefor gradients, and oxygen calibration is very sensitive for gradients and for temporalvariability. Strong vertical and horizontal gradients in both salinity and oxygen aredominant features of the upper layer. The eddy structure increases and deepens fromwest towards east (see vertical section plots attached). A considerable temporalvariability does exist in the upper layer.
Because residuals (Bottle - CTD) in the upper layer increase significantly withdecreasing depth of the rosette sampler, the in-situ calibration of both salinity andoxygen was carried out by comparing data from a gradient-free domain only, i.e. fromdeeper layers (at least deeper than 1000 dbar). Thus, as already stated, a definitivedecision whether measurements within the upper layer are good or bad must bequestionable. WOCE accuracies are essential for measurements taken in the deeplayers where conditions are relatively stable in time and space. In the upper layers,however, measurements with a lesser accuracy should be acceptable. Attached youwill find copies of the listings with Eugene's QUALT2 recommendations. My commentis either a "Y"(Eugene's flag accepted) or "N" (not accepted).
A gradient zone appears east of the Reykjanes Ridge from top to bottom (see sectionplots). Consequently Eugene found differences between bottle OXYGEN and CTDOXY(see his comments for M18 stat. # 574 ff. and V129 stat. # 18, 19). I assume thesedifferences are due to a high mesoscale variability caused by the Irminger Current (seealso Bersch & Meincke (1995), WOCE Newsletter, 18, 28-31).
Eugene reported about unacceptable differences between CTDOXY and OXYGEN inthe entire water depth beginning with M18 stat. # 600. Attached you will also find a X-Ydiagram which shows the final fit of the residuals of the in-situ oxygen calibrationversus station no. There is no step at stat. # 600 detectable.

INPUT FILE: A1E.EGMTHE DATE TODAY IS:21-MAR-95
STNNBR
CASTNO
SAMPNO
CTDPRS
CTDSAL
CTDOXY SALNTY OXYGEN QUALT1 QUALT2
559 1 13 56.7 34.7470 ~~2~ ~~4~ N559 1 2 458.3 287.9 ~~~2 ~~~3 Y560 1 21 96.8 35.0370 ~~2~ ~~4~ N560 1 15 691.5 290.3 ~~~2 ~~~3 Y561 1 13 990.1 293.4 ~~~ 2 ~~~4 Y562 1 24 9.0 34.8860 ~~2~ ~~4~ N565 1 21 58.0 269.3 ~~~3 ~~~4 Y568 1 24 27.1 34.7540 ~~2~ ~~4~ N571 1 19 1957.6 278.3 ~~~2 ~~~ 4 Y571 1 23 1958.1 279.3 ~~~ 2 ~~~4 Y573 1 5 2534.6 34.9400 ~~2~ ~~4~ N573 1 4 2585.8 34.9370 ~~2~ ~~4~ Y575 1 23 29.8 34.8630 ~~2~ ~~4~ N575 1 22 58.5 34.8820 ~~2~ ~~4~ N579 1 24 8.1 34.9700 ~~2~ ~~4~ N582 1 11 1292.8 279.3 ~~~3 ~~~2 Y584 1 19 197.2 35.1180 ~~2~ ~~4~ N586 1 23 33.7 34.9800 ~~2~ ~~4~ N586 1 22 63.9 35.1190 ~~2~ ~~3~ N586 1 21 104.1 35.1160 ~~2~ ~~4~ N587 1 3 2674.3 34.9590 ~~3~ ~~4~ Y589 1 13 1783.5 34.9080 ~~2~ ~~3~ Y591 1 3 2997.5 34.9580 ~~2~ ~~3~ Y597 1 23 38.2 34.9670 ~~2~ ~~3~ N597 1 22 68.5 35.2630 ~~2~ ~~4~ N597 1 20 209.0 35.0610 ~~2~ ~~4~ N604 1 22 101.5 35.1830 ~~2~ ~~3~ Y616 1 8 2120.0 34.9510 265.9 ~~22 ~~43 Y16 1 6 2720.7 34.9520 ~~2~ ~~4~ Y
618 2 7 1849.8 277.0 ~~~2 ~~~3 Y

EXPOCODE: 06MT18WHP-ID: A1/ESTNNBR: 622CASTNO: 1NO. RECORDS = 157INSTRUMENT NO: NB3SAMPLING RATE: 31.25 HZ
CTDPRS CTDTMP CTDSAL CTDOXYDBAR DEG C PSS-78 ML/L
NUMBER QUALT1
2.0 14.8242 35.3166 5.259 22224.0 14.8251 35.3173 5.268 22226.0 14.8267 35.3184 5.275 22228.0 14.8259 35.3183 5.273 2222
10.0 14.8252 35.3180 5.269 222212.0 14.8260 35.3185 5.259 222214.0 14.8269 35.3191 5.250 222216.0 14.8289 35.3190 5.244 222218.0 14.8294 35.3188 5.237 222220.0 14.8264 35.3188 5.227 222222.0 14.8234 35.3192 5.193 222224.0 14.8219 35.3193 5.145 222226.0 14.8198 35.3196 5.113 222228.0 14.8185 35.3198 5.119 222230.0 14.8129 35.3199 5.161 222232.0 14.8048 35.3204 5.202 222234.0 14.8035 35.3207 5.228 222236.0 14.8096 35.3200 5.241 222238.0 14.7849 35.3212 5.245 222240.0 14.7137 35.3253 5.241 222242.0 14.6527 35.3280 5.229 222244.0 14.5664 35.3291 5.209 222246.0 14.4222 35.3340 5.172 222248.0 14.3506 35.3391 5.160 2222

"Meteor" 18 (WOCE-NORD)In-situ Oxygen Companson
0.2
0.1
0
-0.1
-0.3558 568 578 588 598 608 618
Station No.
Ox(
Bot
tle)
- O
x(C
TD
) /
ml/l
-02


DQE evaluation for salinity, oxygen, silicate, nitrate, nitrite and phosphate(D.J. Ellett)21 June 1994
64 Hydrographic stations were sampled, using a Neil Brown Mk 3 CTD with GeneralOceanics rosette frames carrying 24 x 10 litre Niskin bottles. Full details of theequipment and sampling methods are given in the cruise report (Meincke, 1993). In thedata received, the oxygen and nutrient data Q1 flags had been set as a result of adetailed examination by the Scripps' Oceanographic Data Facility (ODF), whosetechnicians carried out the analyses on board. The cruise report and ODF reportcontain no analyses of duplicate determinations, though some information is availablefrom four stations where all sampling bottles were triggered at the same depth,including oxygen determinations by a second method. Both reports should beconsulted for full details of the methods used and the corrections applied to the data.
Salinity:
Salinity was sampled in duplicate, one sample being determined aboard and the otherbeing kept for determination ashore if required for cross-checks. It is assumed that thepresent set of salinity values is from single determinations and not the means ofduplicates. Calibration of the CTD salinity values listed in HY2 is being assessed byanother DQE and they have not been examined except as providing a guide to relativechanges. Samples were collected in 200ml bottles with polythene stoppers and screwcaps and measured 1-2 days after collection with a Guildline Autosal salinometer, usingan ampoule of IAPSO standard seawater of batch P 112 per station. No statistics of thereproducibility of salinity determination are given in the cruise report, but the number ofsamples giving rise to queries is very small. Of the total of 77 samples in the fourbatches of replicate samples at the stations, where all bottles were fired at the samedepth, all outliers of the salinity values fell within +0.001 to -0.OOlpsu of the mean for thedepth. And the precision of the salinity data thus appears to adequately meet WOCEstandards.
Oxygen:
These were the first samples drawn from the Niskin bottles at each station, and weredetermined on board within 4 to 36 hours by ODF technicians. The whole-bottle Winklertitration technique described in the WOCE Operations Manual was used with therelevant corrections applied, differing only in that standards and blanks were run inseawater. For the four multi-sampled stations the ranges of values, discarding a smallnumber of outliers, were 0.6 to 1.3 ymol/kg (about 0.015 to 0.030 ml/l). Towards the endof the cruise some comparisons were made between seawater and distilled waterstandards. Consistently lower values by 0.20 to 0.11ml/1 were obtained by a BSHtechnician using a BSH Dosimat deadstop indicator titration system. But despite

exchanges of standards the reason for the difference could not be determined. It isassumed that no further corrections were applied as a result of this investigation.
Nutrients:
Nutrient samples were collected in 45ml polythene bottles. Some may have been keptin a refrigerator at 2◊ to 6◊ for up to 15 hours. Analyses were performed upon aTechnicon® AutoAnalyzer® using the techniques of Hager et al. (1972) and Atlas et al.(1971), silicate, nitrite and nitrate being analyzed by the methods of Armstrong et al.(1967), and phosphate by that of Bernhardt and Williams (1967). Working standardswere used before and after the determinations for each cast in order to correct forinstrumental drift.
At the multi-sampled stations, silicate replicates, after discarding outliers, had ranges offrom 0.20 to 0.29ymol/kg. Similarly, nitrate replicates had ranges at the four stations of0.00 to 0.20ymol/kg and phosphate of 0.01 to0.03ymol/kg. Nitrite levels at the multi-sampled depths were minimal and thus do not yield useful data about precision.
General remarks:
This is a high quality data set with little for the DQE to query, which has not already beenflagged by the originators. Some analysis of duplicate determinations would have beenof value for comparison with previous cruises by other laboratories, but the evidence ofthe four stations where multiple samples were obtained is that the data fully matchWOCE standards.
Queries relating to salinity, oxygen, silicate, nitrate, nitrite and phosphate samples
In the following notes, a question mark implies a flag 3 has been entered and flag 4sare specifically noted.
Stn.No.
SampleNo.
CTDpress.
Query
558 All depths Nutrients flagged 4 in Q1, so flagged 4 in Q2.559 All depths Flag 4 in Q1 adopted also for Q2,559 2 458 Oxygen high. Flagged 4.560 15 691 Oxygen high?562 24 9 Salinity high cf CTD, flagged 4.564 7 2323 Phspht high, flagged 4.565 21 58 Oxygen low, flagged 4.565 17 496 Oxygen high, flagged 4.565 14 1195 Phspht low?
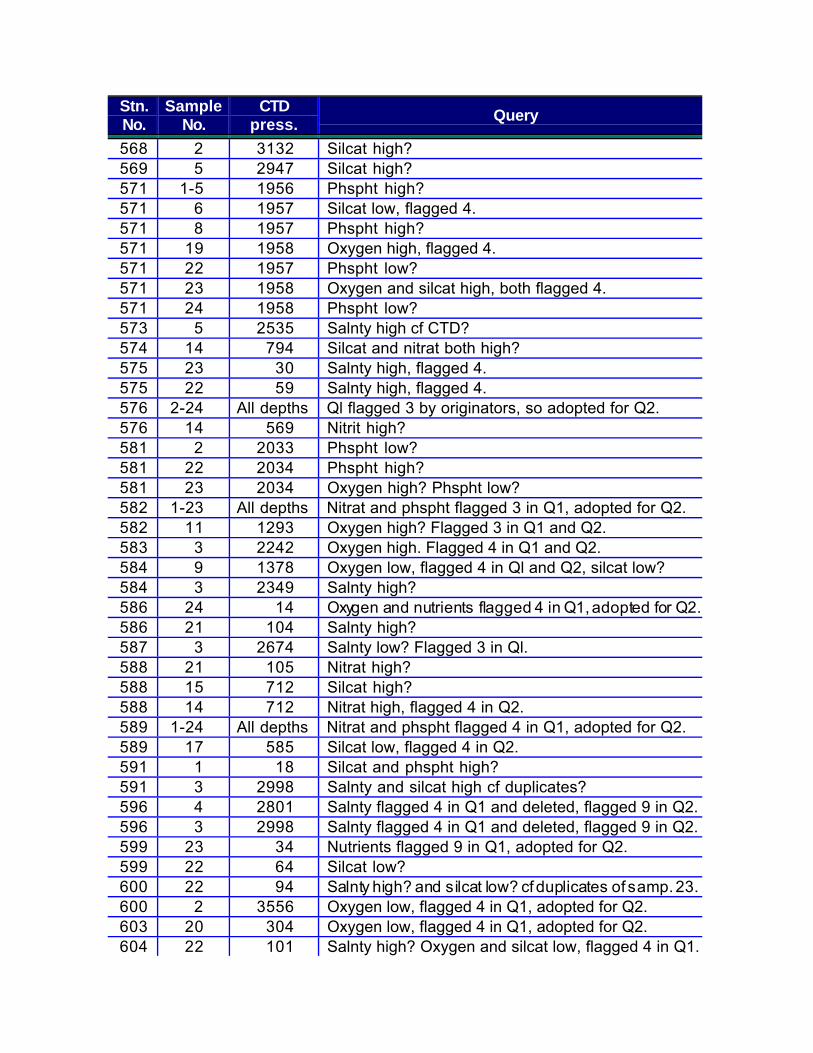
Stn.No.
SampleNo.
CTDpress.
Query
568 2 3132 Silcat high?569 5 2947 Silcat high?571 1-5 1956 Phspht high?571 6 1957 Silcat low, flagged 4.571 8 1957 Phspht high?571 19 1958 Oxygen high, flagged 4.571 22 1957 Phspht low?571 23 1958 Oxygen and silcat high, both flagged 4.571 24 1958 Phspht low?573 5 2535 Salnty high cf CTD?574 14 794 Silcat and nitrat both high?575 23 30 Salnty high, flagged 4.575 22 59 Salnty high, flagged 4.576 2-24 All depths Ql flagged 3 by originators, so adopted for Q2.576 14 569 Nitrit high?581 2 2033 Phspht low?581 22 2034 Phspht high?581 23 2034 Oxygen high? Phspht low?582 1-23 All depths Nitrat and phspht flagged 3 in Q1, adopted for Q2.582 11 1293 Oxygen high? Flagged 3 in Q1 and Q2.583 3 2242 Oxygen high. Flagged 4 in Q1 and Q2.584 9 1378 Oxygen low, flagged 4 in Ql and Q2, silcat low?584 3 2349 Salnty high?586 24 14 Oxygen and nutrients flagged 4 in Q1, adopted for Q2.586 21 104 Salnty high?587 3 2674 Salnty low? Flagged 3 in Ql.588 21 105 Nitrat high?588 15 712 Silcat high?588 14 712 Nitrat high, flagged 4 in Q2.589 1-24 All depths Nitrat and phspht flagged 4 in Q1, adopted for Q2.589 17 585 Silcat low, flagged 4 in Q2.591 1 18 Silcat and phspht high?591 3 2998 Salnty and silcat high cf duplicates?596 4 2801 Salnty flagged 4 in Q1 and deleted, flagged 9 in Q2.596 3 2998 Salnty flagged 4 in Q1 and deleted, flagged 9 in Q2.599 23 34 Nutrients flagged 9 in Q1, adopted for Q2.599 22 64 Silcat low?600 22 94 Salnty high? and silcat low? cf duplicates of samp. 23.600 2 3556 Oxygen low, flagged 4 in Q1, adopted for Q2.603 20 304 Oxygen low, flagged 4 in Q1, adopted for Q2.604 22 101 Salnty high? Oxygen and silcat low, flagged 4 in Q1.

Stn.No.
SampleNo.
CTDpress.
Query
605 22 32 Sal., oxy. and nutr. flagged 4 in Q1, adopted for Q2.607 2-24 All depths Values deleted by originators, flagged 9 in Q1 and Q2.608 1 3817 Values deleted, flagged 9 in Q1 and Q2.608 2 3819 Silcat high, flagged 4 in Q2.608 8 3820 Nitrat high, flagged 4 in Q2.608 10 3820 Oxygen high, silcat, nitrat & phspht low, flagged 4.608 16 3817 Oxygen high, nitrat and phspht low, flagged 4 in Q2.608 24 3819 Silcat low, flagged 4 in Q2.609 14 1180 Silcat, nitrat & phspht low, nitrit high? Flagged 3.609 4 3444 Nitrit high, flagged 4 in Q2.609 3 3534 Nitrit high, flagged 4 in Q2.610 18 304 Oxygen flagged 3 in Q1, adopted for Q2.610 1 3311 Nitrat low?611 23 11 Oxygen & nitrit low, silcat, nitrat & phspht high, all
flagged 4 in Q2.613 19 90 High oxygen? flagged 3 in Q1, adopted for Q2.613 10 2078 High oxygen? flagged 3 in Q2, adopted for Q2.616 8 2120 High Salnty, silcat, nitrat, phspht, low oxygen all
flagged 4 in Q2.616 6 2721 Salnty high?618 3 1850 Silcat low?618 7 1854 Oxygen low, flagged 4 in Q2.619 6 797 Nitrit low?621 7 98 Oxygen flagged 4 in Q1, adopted for Q2.622 10 22 Oxygen low?
Note for WHP Office of Q2 words needing modification ~ METEOR WOCE AGE
Where two or more bottles fired at the same depth and sample values were identical it waspossible to update the Q2 word on the screen, but only one set was updated in HY2.
Stn.No.
Sam#
CTDpress.
Q2 shouldbe
558 13 8 11222444558 12 7.9 11222444558 11 8.5 11222444558 1 170.7 11222444559 18 8.3 11922444559 17 8.3 11922444559 16 8.4 11222444559 15 8.3 11222444559 14 26.1 11222444559 13 56.7 11222444
Stn.No.
Sam#
CTDpress.
Q2 shouldbe
559 12 97.2 11222444559 3 438.7 11222444561 20 235.6 11222422562 21 97.4 11222222562 1 2026.6 11222222563 7 2045.4 11222222565 16 700.7 11222222565 14 1195.2 11292223565 13 1194.9 11222222568 1 3131.9 11222222
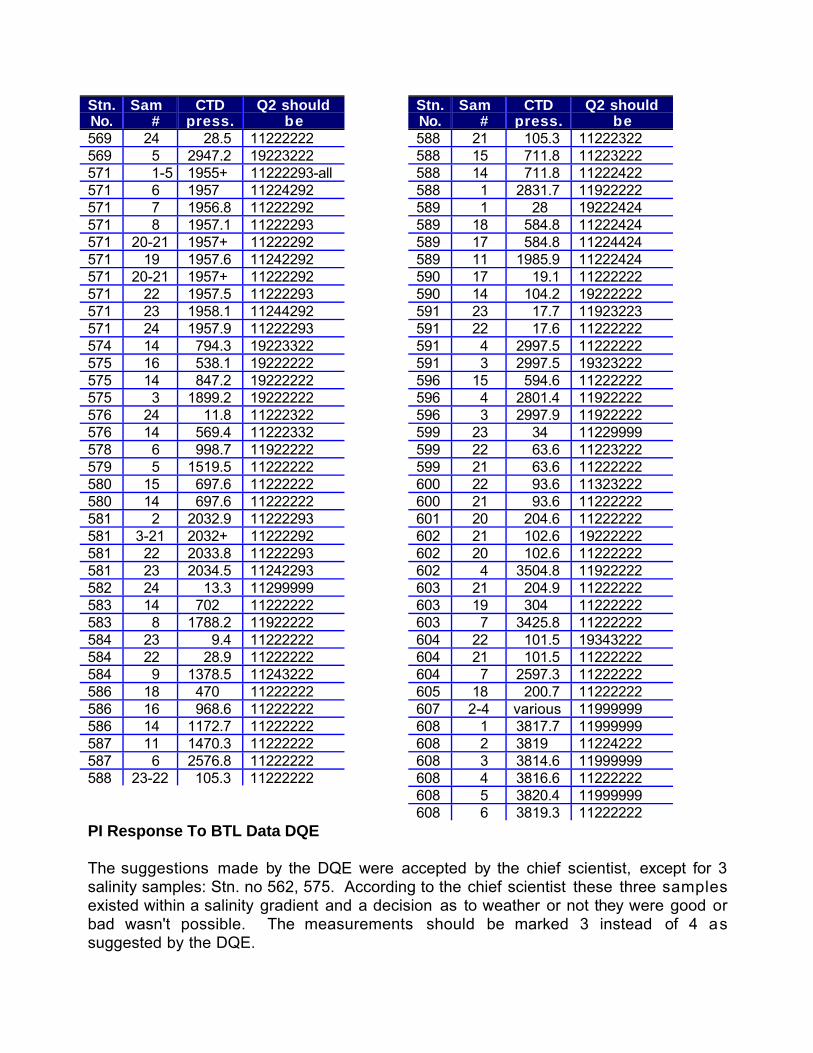
Stn.No.
Sam#
CTDpress.
Q2 shouldbe
569 24 28.5 11222222569 5 2947.2 19223222571 1-5 1955+ 11222293-all571 6 1957 11224292571 7 1956.8 11222292571 8 1957.1 11222293571 20-21 1957+ 11222292571 19 1957.6 11242292571 20-21 1957+ 11222292571 22 1957.5 11222293571 23 1958.1 11244292571 24 1957.9 11222293574 14 794.3 19223322575 16 538.1 19222222575 14 847.2 19222222575 3 1899.2 19222222576 24 11.8 11222322576 14 569.4 11222332578 6 998.7 11922222579 5 1519.5 11222222580 15 697.6 11222222580 14 697.6 11222222581 2 2032.9 11222293581 3-21 2032+ 11222292581 22 2033.8 11222293581 23 2034.5 11242293582 24 13.3 11299999583 14 702 11222222583 8 1788.2 11922222584 23 9.4 11222222584 22 28.9 11222222584 9 1378.5 11243222586 18 470 11222222586 16 968.6 11222222586 14 1172.7 11222222587 11 1470.3 11222222587 6 2576.8 11222222588 23-22 105.3 11222222
Stn.No.
Sam#
CTDpress.
Q2 shouldbe
588 21 105.3 11222322588 15 711.8 11223222588 14 711.8 11222422588 1 2831.7 11922222589 1 28 19222424589 18 584.8 11222424589 17 584.8 11224424589 11 1985.9 11222424590 17 19.1 11222222590 14 104.2 19222222591 23 17.7 11923223591 22 17.6 11222222591 4 2997.5 11222222591 3 2997.5 19323222596 15 594.6 11222222596 4 2801.4 11922222596 3 2997.9 11922222599 23 34 11229999599 22 63.6 11223222599 21 63.6 11222222600 22 93.6 11323222600 21 93.6 11222222601 20 204.6 11222222602 21 102.6 19222222602 20 102.6 11222222602 4 3504.8 11922222603 21 204.9 11222222603 19 304 11222222603 7 3425.8 11222222604 22 101.5 19343222604 21 101.5 11222222604 7 2597.3 11222222605 18 200.7 11222222607 2-4 various 11999999608 1 3817.7 11999999608 2 3819 11224222608 3 3814.6 11999999608 4 3816.6 11222222608 5 3820.4 11999999608 6 3819.3 11222222
PI Response To BTL Data DQE
The suggestions made by the DQE were accepted by the chief scientist, except for 3salinity samples: Stn. no 562, 575. According to the chief scientist these three samplesexisted within a salinity gradient and a decision as to weather or not they were good orbad wasn't possible. The measurements should be marked 3 instead of 4 assuggested by the DQE.
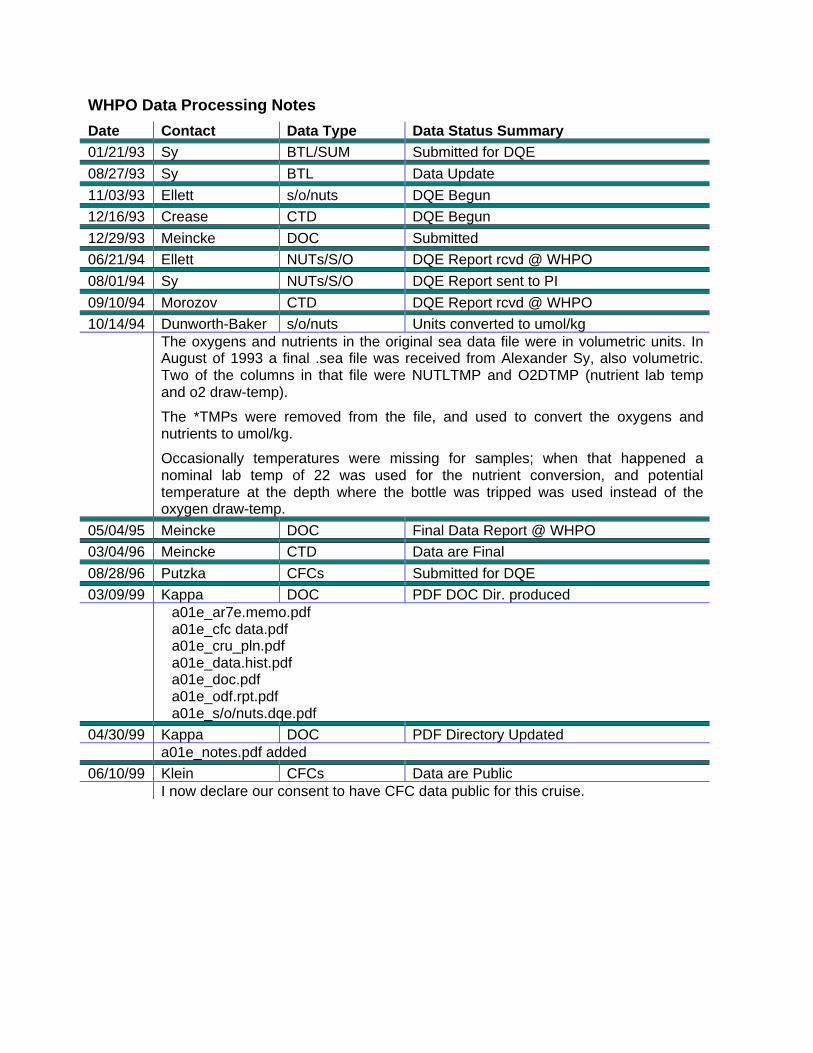
WHPO Data Processing Notes
Date Contact Data Type Data Status Summary
01/21/93 Sy BTL/SUM Submitted for DQE
08/27/93 Sy BTL Data Update
11/03/93 Ellett s/o/nuts DQE Begun
12/16/93 Crease CTD DQE Begun
12/29/93 Meincke DOC Submitted
06/21/94 Ellett NUTs/S/O DQE Report rcvd @ WHPO
08/01/94 Sy NUTs/S/O DQE Report sent to PI
09/10/94 Morozov CTD DQE Report rcvd @ WHPO
10/14/94 Dunworth-Baker s/o/nuts Units converted to umol/kgThe oxygens and nutrients in the original sea data file were in volumetric units. InAugust of 1993 a final .sea file was received from Alexander Sy, also volumetric.Two of the columns in that file were NUTLTMP and O2DTMP (nutrient lab tempand o2 draw-temp).
The *TMPs were removed from the file, and used to convert the oxygens andnutrients to umol/kg.
Occasionally temperatures were missing for samples; when that happened anominal lab temp of 22 was used for the nutrient conversion, and potentialtemperature at the depth where the bottle was tripped was used instead of theoxygen draw-temp.
05/04/95 Meincke DOC Final Data Report @ WHPO
03/04/96 Meincke CTD Data are Final
08/28/96 Putzka CFCs Submitted for DQE
03/09/99 Kappa DOC PDF DOC Dir. produceda01e_ar7e.memo.pdfa01e_cfc data.pdfa01e_cru_pln.pdfa01e_data.hist.pdfa01e_doc.pdfa01e_odf.rpt.pdfa01e_s/o/nuts.dqe.pdf
04/30/99 Kappa DOC PDF Directory Updateda01e_notes.pdf added
06/10/99 Klein CFCs Data are PublicI now declare our consent to have CFC data public for this cruise.

09/12/99 Klein CFC-11/12 ResubmittedI was preparing a CFC data file for John Bullister for the North Atlanic CLIVARactivities. While I was checking the hydrography data of the file that you have at theWHPO I noticed that all the CFC-11 and CFC-12 quality flags in qual1 had been setto 1. Therefore I am submitting the CFC-11 and CFC-12 data again together withtheir quality flags.
The only change is that the CFC-11 and CFC-12 concentrations are now reportedas SIO93 while the earlier data set was reported as SIO86.
The data file is called m18cfc.woc and the corresponding meta information is givenin file m18cfcdoc.txt.
01/24/00 Newton CFCs Data Updated, put online• Corrected EXPO code from 06MT18/1 to 06MT18_1.• Merged in updated CFC's and CFC QUALT1 flags.• QUALT2 flags unchanged.
02/14/00 Kozyr ALKALI/TCARBN Final Data Rcvd @ WHPO
04/13/00 Huynh DOC Updated doc online
04/14/00 Diggs CFCs Data again Updated, put onlineSince the original merge was in error, David Newton re-merged the CFCs for A01E(Meteor 18) and I checked them for accuracy. Data checked out fine, and I placedthe new file on the web. All files and tables updated.
03/16/01 Uribe CTD Expocodes updated, put onlineKarla and I have edited the expocode in all ctd files to match the underscoredexpocode in the sum and bottle files. New files were zipped and replaced existingctd files online. Old files were moved to original directory.
06/20/01 Uribe BTL EXCHANGE File Added to WebsiteBottle file in exchange format has been linked to website.
06/21/01 Uribe CTD/BTL Website updatedThe exchange bottle file name in directory and index file was modified to lowercase. CTD exchange files were put online.
08/09/01 Uribe BTL Exchange file corrected, reformattedBottle exchange file was corrected. The wrong file was online. Bottle file wasformatted by S. Diggs.
12/18/01 Uribe CTD Exchange file modified, put onlineCTD has been converted to exchange using the new code and put online.
12/19/01 Hajrasuliha CTD Internal DQE runproduced *check.txt file. Could NOT produce *.ps files.

09/19/02 Anderson He/Tr, DELC14 Data merged into online fileAdded TRITIUM, HELIUM, DELHE3, DELC14, TRITER, HELIER, DELHER, andC14ERR to online file. Made new exchange file.
Merge notes for a01e:Added TRITIUM, HELIUM, DELHE3, DELC14, TRITER, HELIER, DELHER, andC14ERRfrom file:
06MT18-1.SEA_NEWfound in /usr/export/html-public/data/onetime/atlantic/a01/a01e/original/
1998.08.03_A01E_ HE.TR.C14.ARNOLDinto online file
20000414SIODMN.
11/12/02 Kappa DOC Final PDF, TXT versions compiledUpdated pdf and txt cruise reports now include Eugene Morozov's CTD DQE reportand Alexander Sy's response to it; Wolfgang Roether & Birgit Klein's CFC report;and these Data Processing Notes.