why benchmark? at a glances3-eu-west-1.amazonaws.com/benchmarkplc.com/documents/... ·...
TRANSCRIPT
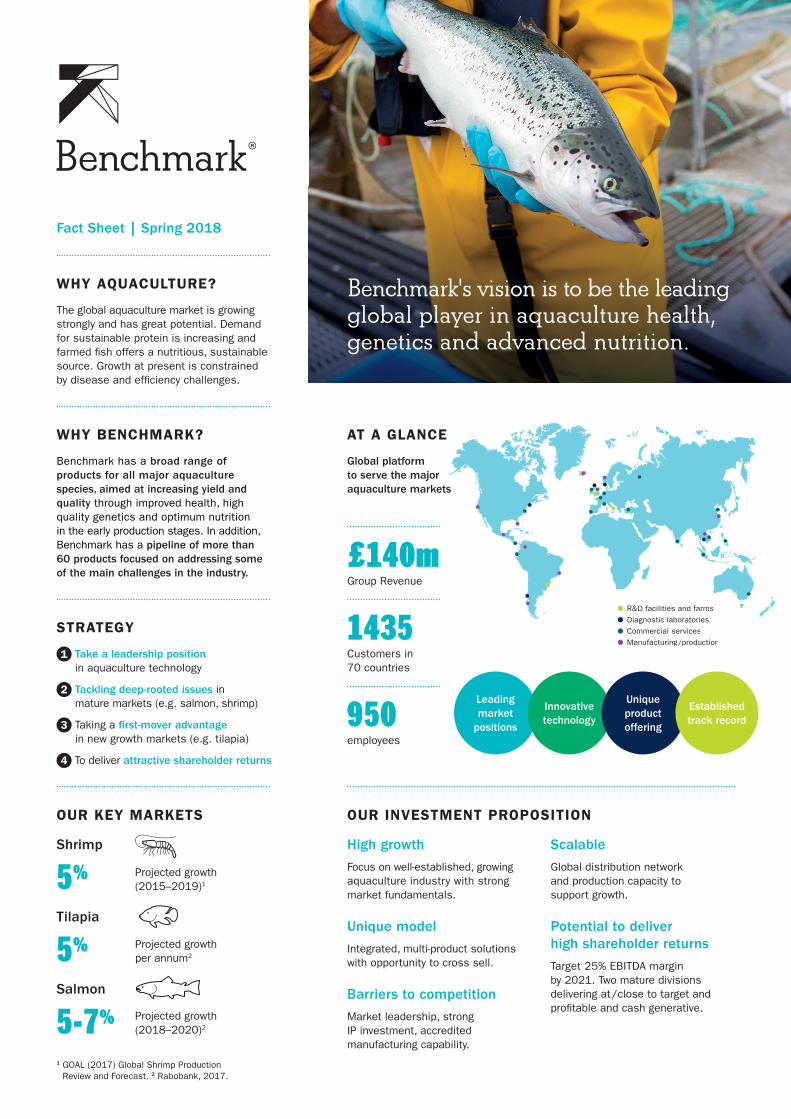
Leading market
positions
Innovative technology
Unique product offering
Established track record
£140mGroup Revenue
1435Customers in 70 countries
950employees
Commercial servicesManufacturing/production
R&D facilities and farmsDiagnostic laboratories
AT A GLANCE
Global platform to serve the major aquaculture markets
OUR INVESTMENT PROPOSITION
High growth Focus on well-established, growing aquaculture industry with strong market fundamentals.
Unique model Integrated, multi-product solutions with opportunity to cross sell.
Barriers to competition Market leadership, strong IP investment, accredited manufacturing capability.
Scalable Global distribution network and production capacity to support growth.
Potential to deliver high shareholder returnsTarget 25% EBITDA margin by 2021. Two mature divisions delivering at/close to target and profi table and cash generative.
Fact Sheet | Spring 2018
WHY AQUACULTURE?
The global aquaculture market is growing strongly and has great potential. Demand for sustainable protein is increasing and farmed fi sh offers a nutritious, sustainable source. Growth at present is constrained by disease and effi ciency challenges.
WHY BENCHMARK?
Benchmark has a broad range of products for all major aquaculture species, aimed at increasing yield and quality through improved health, high quality genetics and optimum nutrition in the early production stages. In addition, Benchmark has a pipeline of more than 60 products focused on addressing some of the main challenges in the industry.
STRATEGY
1 Take a leadership position in aquaculture technology
2 Tackling deep-rooted issues in mature markets (e.g. salmon, shrimp)
3 Taking a fi rst-mover advantage in new growth markets (e.g. tilapia)
4 To deliver attractive shareholder returns
OUR KEY MARKETS
Projected growth (2015–2019)1
Projected growth per annum2
Projected growth (2018–2020)2
Shrimp
5%Tilapia
5%Salmon
5-7%1 GOAL (2017) Global Shrimp Production
Review and Forecast. 2 Rabobank, 2017.
Benchmark's vision is to be the leading global player in aquaculture health, genetics and advanced nutrition.

Three core divisions with strong market positions
• Market position: The leading player in the highly concentrated salmon industry
• Global Customers: 316 customers in c.30 countries; top 5: 29% (FY17 revenue)
• Species: Salmon, shrimp, tilapia and breeding programmes for 15 species
• Main sites: Norway, Iceland, Latam. Land based bio-secure facilities in Iceland and Norway
• Products: High genetic quality ova for salmon, shrimp and tilapia, and breeding programmes
• Employees: 128
• 2017 Revenue: £30.5m
• Market position: 25% estimated share in global hatchery segment (fish and shrimp). (40% of fastest growing Asian market excl. China)
• Global Customers: 614 customers in 70 countries; top 5: 37% (FY17 revenue)
• Species: Shrimp and marine finfish
• Main sites: Thailand, US, Belgium, Italy
• Products: Specialist feeds for early stage shrimp and finfish; probiotics. Access to world’s greatest source of quality artermia
• Employees: 461
• 2017 Revenue: £83.7m
• Market position: a leader in salmon lice treatments and top 4 player in aquaculture health. Product pipeline positioned to become a leading innovator
• Global Customers: 426 customers in c.30 countries; top 5: 53% (FY17 revenue)
• Species: Salmon, shrimp, tilapia, sea bass/sea bream
• Main sites: UK
• Products: Vaccines, biocides, medicines
• Employees: 177
• 2017 Revenue: £51.1m
GENETICS Breeding for the future with genomic precision
ADVANCED NUTRITION High performance and cost-effective nutritional solutions
HEALTHCutting edge health products targeted at the major disease challenges
Focused on the execution and launch of our rich pipeline of products
Total peak projected sales of
£707.2m
£m 2017 2016
Total revenue 140.2 109.4
Research and development costs
(13.1) (11.7)
Adjusted EBITDA 10.0 9.2
Exceptional including acquisition related items
5.6 (13.1)
Loss before tax (8.1) (22.4)
Basic loss per share (pence) (1.4) (4.4)
2017 FINANCIAL HEADLINES
21%
58%
10%
11% Genetics
Advanced Nutrition
Health
Knowledge Services
Revenue split by divisions (FY17)
% of issued share
capital
Woodford Investment Management 22.00
Ferd AS 17.61
Invesco Asset Management Ltd 16.15
Directors and Management 11.73
Lansdowne Partners 9.87
The Royal Bank of Scotland Group plc 6.20
Baillie Gifford 3.93
Harwood Capital 3.69
Wheatsheaf Investments 1.91
Octopus Investments 1.60
CONSENSUS FORECAST FURTHER INFORMATION
Share information Listing: London Stock Exchange Ticker: BMK Sector: Biotechnology
Key management Chairman: Alex Hambro CEO: Malcolm Pye CFO: Mark Plampin
Media contacts MHP Communications: Katie Hunt /Reg Hoare/Alistair de Kare-Silver [email protected]
+44 (0)20 3128 8742 benchmarkplc.com [email protected]
£m 2018 2019
Revenue 158 174.3
Adjusted EBITDA 14.8 19.5
TOP 10 SHAREHOLDERS
RECENT ANNOUNCEMENTS
• Benchmark hosts Capital Markets Day today: 27 March 2018
• Result of AGM: 8 March 2018
• Board Succession: 31 January 2018
• Final Results: 23 January 2018