why do people demand rent control?
TRANSCRIPT
Why Do People Demand Rent Control?
Daniel Müller, Elisabeth Gsottbauer
Working Papers in Economics and Statistics
2021-20
University of Innsbruckhttps://www.uibk.ac.at/eeecon/

University of InnsbruckWorking Papers in Economics and Statistics
The series is jointly edited and published by
- Department of Banking and Finance
- Department of Economics
- Department of Public Finance
- Department of Statistics
Contact address of the editor:research platform “Empirical and Experimental Economics”University of InnsbruckUniversitaetsstrasse 15A-6020 InnsbruckAustriaTel: + 43 512 507 71022Fax: + 43 512 507 2970E-mail: [email protected]
The most recent version of all working papers can be downloaded athttps://www.uibk.ac.at/eeecon/wopec/
For a list of recent papers see the backpages of this paper.

Why Do People Demand Rent Control?
Daniel Muller rO Elisabeth Gsottbauer*
February 4, 2022
Abstract
We conduct a representative survey experiment in Germany to understand
why people support inefficient policies. In particular, we measure beliefs about
and preferences for rent control – a policy that is widely regarded as harmful by
experts. To tease out causal mechanisms, we provide randomly selected sub-
sets of participants with empirical estimates about the effects of rent control
on rent prices and housing supply and with information about the consensus
among economists against rent control. We find that people update their be-
liefs and that this leads to lower demand for rent control. Left-wingers update
their beliefs more strongly, which reduces the ideological gap in support for
rent control by about one quarter. Providing information about economists’
rejection of this policy leads to the largest reduction in support. However, the
main drivers of support for rent control are fairness considerations and profit
motives. Our study also highlights the importance of trust since treatment
effects are consistently larger among those who indicate trust in the scientific
information provided to them.
Keywords: beliefs about rent control, demand for bad policies, sur-
vey experiment, trust in experts.
JEL classification: H10, H30, H31.
*Muller: University of Munich, e-mail: [email protected]. Gsottbauer: University of Innsbruck, e-
mail: [email protected]. We benefited from discussions with Audinga Baltrunaite, Antoine Ferey,
Heiner Schumacher and Francis Wong as well as seminar participants at the Universities of Freiburg, Innsbruck and
Mannheim. We gratefully acknowledge generous financial support from the SFB F63 at the University of Innsbruck
and the Center for Economic Studies at the University of Munich. The order of authors was randomly determined
by the Universe Splitter app.
1

1 Introduction
Economists have long understood the economic costs of price controls theoretically
(Friedman and Stigler, 1946, e.g.) and empirically (Glaeser and Luttmer, 2003;
Davis and Kilian, 2011). Consequently, they overwhelmingly oppose price controls
in general and rent control in particular.1 Regardless, rent control policies (i.e. the
practice of limiting the price a landlord may charge) experience great support among
the general public, which is not only evident in survey data but also from the fact
that rent control policies are frequently implemented in practice.2 It is important
to understand why this is so, not only because housing markets are economically
significant but also because answers to this question might also help understand
differences in opinions of the general public and economists in other areas (e.g. carbon
taxation). One answer to this puzzle might be that economists and the general
public hold different beliefs about the effects of economic policies. Indeed, surveys
indicate that the public’s opinions about economics often differ greatly from those
of economists (Caplan, 2002; Jacob, Christandl, and Fetchenhauer, 2011; Sapienza
and Zingales, 2013). Other reasons might be that people do not trust expert advice
or that they make different equity-efficiency trade-offs.
In this paper, we aim to understand the disconnect between the opinion held by
economic experts and the public in the domain of economic policy. To do so, we con-
duct a survey experiment among a representative sample of the German population,
in which we (i) elicit beliefs about effects of rent control on rental housing supply
and rent prices, (ii) measure demand for rent control and (iii) investigate whether
beliefs about the workings of such a policy causally affect its support, and (iv) ex-
1“IGM Expert Panel” at the University of Chicago: www.igmchicago.org/surveys/rent-control/.2For instance, survey results from the “German Internet Panel’ (Wave 14, from 2015)’, a rep-
resentative online panel from the German population based at the University of Mannheim, show
that 81% of 3,500 participants find rent control in Germany “rather good”, “good” or “very good”.
Only 8% oppose such a regulation. Similar results are found in the US and the UK. The results
from our survey among Germans show that the median support for rent control is a 7 on a 1-10
scale.
2
amine whether people follow expert advice. In particular, we compare demand for
rent control in a control group to demand in three different treatment groups. The
first treatment group, the quantity treatment, is provided with empirical estimates
from Diamond, McQuade, and Qian (2019), who show that a rent control regulation
in San Francisco reduced the supply of rental housing by about 15%. In the sec-
ond treatment, the price treatment, participants are informed that this policy “likely
drove up market rents in the long-run”. Both treatments thus provide information
about the economic effects of rent control on housing supply and rents. The third
treatment, the expert treatment, informs participants about the consensus among
economists against rent control, exploiting a poll among leading economists.
In our survey, we elicit beliefs about quantity and price effects of rent control
before and after treatment. This approach not only allows us to measure individual
belief updating, but also puts us in a position to estimate the causal effect of beliefs on
preferences. In addition, we elicit trust in the information provided to them and we
ask respondents about the perceived fairness of rent control and whether they would
profit financially from them. Our data thus allow us to examine the importance
of trust and to disentangle the effects of (potentially mis-calibrated) beliefs from
fairness concerns and selfish profit motives as drivers of support.
The main message of our paper is that people hold systematically mis-calibrated
beliefs about the consequences of rent control and that these beliefs causally affect
support for this policy. The same holds true when providing participants with expert
recommendations against rent control. In more detail, the experiment delivers the
following insights. First, we find that people hold too optimistic views about the
consequences of rent control. The quantity treatment leads participants to expect
larger reductions in supply and the price treatment causes participants to expect
higher rents as compared to the control group. Second, both treatments lower sup-
port for rent control policies. This conclusion is not only evident in stated support
but also in a revealed preference measure (an actual donation decision between two
lobby groups). Third, respondents in the expert treatment lower their support for
3

rent control, too. The effect size is about twice as large as that of the first two
treatments. Fourth, important determinants of support for rent control are fairness
concerns and financial motives. Fifth, left-wingers are initially more optimistic about
the effects of this policy and consequently update beliefs about supply-side reactions
more strongly. As a result, the treatment cuts the left-right gap in support for rent
control by about one quarter. Sixth, our data highlight the crucial role that trust
in expert advice plays. Throughout, we consistently find that treatment effects are
stronger for those who put more trust in the information provided to them.
We conduct several robustness checks that confirm the results of the paper. One
concern one might have about survey experiments in general, is that participants
answer the questions in a way they think is desired by the experimenter. We believe
that this concern is less relevant in our case for several reasons. First, we include
a block of unrelated questions between the information treatment and the outcome
variables in order to veil the connection between both. In addition, and as highlighted
by Haaland, Roth, and Wohlfart (2021), we use a neutral framing of the survey and
the information treatments and employ a between-subject design in which demand
effects are less likely. Second, we not only use a standard survey measure of prefer-
ences for rent control, but also a revealed measure (an actual donation decision) and
find virtually the same result for both outcomes. Third, De Quidt, Haushofer, and
Roth (2018) and Mummolo and Peterson (2019) show convincing evidence that ex-
perimenter demand is less of a concern in a variety of economic games and in survey
experiments. Finally, we conduct an additional survey in which different treatments,
in the style of de Quidt et al. (2018), try to “push” participants’ beliefs in different
directions. Results from this survey show no evidence for the existence of experi-
menter demand effects in our survey. Another concern might be that the quantity
information treatment, which provides a specific number to participants, leads to
potential numerical anchoring effects (Tversky and Kahneman, 1974), that is, the
quantity treatment might not actually update participants’ beliefs, but instead be
the result of anchoring. We rule out such concerns in an additional survey in which
4

we provide different participants with a number and compare their beliefs to those
of a control group that was not provided any number.
Our paper relates to several strands of literature. First, several papers have docu-
mented that voters suffer from systematic biases in decision-making, leading to poor
policy choices. For instance, Kallbekken, Kroll, and Cherry (2011) find evidence
for an aversion to implementing Pigouvian taxes in a laboratory experiment, even
though this tax increases individual and social welfare. Sausgruber and Tyran (2005)
investigate fiscal illusion of voters. In their experiment voters prefer higher indirect-
over lower direct taxes although this decreases their profit. Moreover, Sausgruber
and Tyran (2011) experimentally show that people prefer taxing others over tax-
ing themselves, resulting in an income loss of up to 20%. Finally, Dal Bo, Dal Bo,
and Eyster (2018) show that people might not anticipate equilibrium effects of new
policies, leading to a demand for inefficient policies. An under-appreciation of equi-
librium effects could also lead to a demand for rent control since people might not
fully factor in the supply-side reactions (i.e. lower supply of housing). Second, we
also relate to work that studies how beliefs of economists and the general public
differ. For instance, Caplan (2002) finds that economists and the general public
systematically disagree and hold different beliefs about economics issues. Further
empirical evidence comes from Haferkamp et al. (2009) and Sapienza and Zingales
(2013). Finally, our work relates to research that aims to understand how people
reason about economic policies and taxes. For instance, Stantcheva (2021) provides
comprehensive evidence in the areas of income and estate taxation. Related to the
case of rent control is Brandts et al. (2022), who use a “refutation text” to influence
support for rent control. They find that the text successfully shifts beliefs of under-
graduate students about the usefulness of rent control in the direction of the beliefs
of economic experts.3
The rest of the paper proceeds as follows. Section 2 explains the experimental
3An important difference to our study is the fact that the refutation text does not provide
factual information about rent control. Instead, the text is designed to encourage critical thinking
in students. The authors also do not measure beliefs about the effects of rent control.
5

design of the main survey in more detail. Next, Section 3 presents our results con-
cerning the beliefs about rent control. Section 4 then illustrates our main results
about the support for rent control. Section 5 discusses potential mechanisms that
drive the main result and also presents the robustness towards experimenter demand
and anchoring effects. Finally, Section 6 concludes.
2 Experimental Design and Data
Overview and Sample. The survey experiment is administered in a sample of
the German population exploiting the infrastructure provided by a professional sur-
vey company. By construction, the sample is representative along age, income and
gender.4 The main study was conducted in May 2021. In total, 4,034 respondents
participated in the main survey (we pre-registered 4,000).5 The main survey includes
two attention checks (Haaland, Roth, and Wohlfart, 2021).6 As pre-registered, we
drop those participants who do not pass the attention checks.
Prior beliefs. After a short introduction, we elicit participants’ baseline priors
about the effects of rent control policies on supplied housing quantities and rents. In
two steps we ask all participants if they think rent control affects the supply of rental
housing. In the first step, participants are asked whether they believe in an increase,
4Table 8 in the Appendix displays summary statistics separately for each treatment for those
three variables plus education, trust in the study, as well as price- and quantity priors. A series of
ranksum tests displays no significant differences in means between the treatments and the controls
for each of those variables.5We pre-registered the experimental survey, sample size and our empirical approach at AsPre-
dicted.org (No. 64761). Figure 8 in the Appendix summarizes the survey design. Description of
the variables and coding of responses is summarized in Section 7.3. Translated instructions and
screenshots of all surveys are provided in a Supplementary File.6The first one, immediately after the introduction, asks the participant in an open-ended question
to indicate “brown” in response to the question about her favorite color. The second one is located
after the information intervention and asks the participant about the topic of the information
intervention in a multiple choice question.
6

decrease or no change in the supply of rental housing, as compared to a situation
without rent control. Participants who indicate a decrease or an increase in the
supplied quantity have the opportunity to further specify their answer with the help
of a slider (in percentage changes). We choose this design to ensure that respondents
do not confound positive and negative percentage changes. We elicit beliefs about
the impact of rent control on the level of rents on a seven-point scale ranging from
“much higher” to “much lower” rent prices. We opt for this qualitative scale because
the study by Diamond et al. (2019) does not provide numerical estimates of price
effects.
Information treatments. Participants are then randomized into three different
information treatments and one control group. The first treatment group (quantity)
receives information from the study by Diamond, McQuade, and Qian (2019), which
shows that “the supply of rental housing decreased by 15 percent” in San Francisco
due to the introduction of rent control. The second treatment group (price) receives
information about the finding from the same study, namely that rent control “likely
drove up market rents in the long run”. The third treatment group (expert) receives
information about the consensus among economists against rent control. Specifi-
cally, we report poll results from the IGM Economic Expert Panel indicating that
“more than 80% of participating economists oppose rent control due to predomi-
nantly negative effects on the housing market, which harms tenants and landlords in
the long run”. Finally, participants in the control group receive information about
an unrelated economic study concerning the economic consequences of Brexit. We
opted for an “active” control group to keep the length of the survey constant for all
respondents. The information presented to all four groups was intentionally kept as
concise as possible.
Socio-demographics. Next, we include questions on participants’ socioeconomic
background such as age, gender, income, education, household size, employment
status and place of residence and we also assess participants’ housing situation. These
questions also create a break between the information treatment and elicitation of
7
the posterior beliefs.
Posterior beliefs. In this block, we again elicit price and quantity beliefs using the
same type of questions as before.
Support for rent control. Next, we ask all respondents for their attitudes towards
rent control on a 10-point scale from (1) “very strongly oppose” to (10) “very strongly
support”. Our secondary measure of support is the decision to donate 100 euros to
either a pro- or an anti-rent control lobby group (note that this question was asked
at the very end of the survey). Participants could donate only the full amount. Not
donating was not an option. We then (truthfully) told participants that we will
randomly select one respondent and donate the amount of 100 euros according to
the decision made by that participant.
Other attitudes. We measure several other attitudes including support for price
controls in general, left-right economic ideology and support for free markets. More-
over, we assess fairness perceptions (of rent control) and respondents’ profit motives
(whether they would financially profit from rent control). We also elicit efficiency
concerns (whether they think people stay in their apartments longer and whether
they think there is inefficient matching in the rental housing market due to rent
control) and concerns about rent prices (whether they think that rent prices are a
problem). Finally, we assess trust in the economic study provided in the information
treatment on a 5-point scale, ranging from low to high trust.
3 Beliefs About Rent Control
A first important question to ask about our data is what beliefs people hold about
the quantity and price effects of rent control and whether participants update these
beliefs in response to the treatments. To answer these questions, Figure 1 displays
priors and posteriors about supply (left-hand panel) and price reactions (right-hand
panel) for each treatment. The first thing to notice is that, on average, prior beliefs
about the quantity reactions are negative and around -8.5 percentage points and
8

that priors about price reactions are close to the expectation that rent control does
not change rents. Next, we find evidence that participants in the quantity treatment
downward-adjust their posterior beliefs about supply reactions and participants in
the price treatment upward-adjust their posteriors about price reactions, suggesting
that in this experiment both treatments induced more pessimism about the workings
of this policy.
Figure 1: Belief updating about supply- (left panel) and price reactions (right panel) by
treatment. Supply change is measured in percent (negative values imply a decrease in
supply) and price change on a scale from 1-7 where 7 means “much higher rents ”, 1 means
“much lower rents” and 4 means “no change”.
Table 1 reports results from linear regressions, in which belief updating – the indi-
vidual difference between the posterior and the prior – is regressed on the treatment
dummies and controls.7 Columns (1) to (6) use updating with regard to quantity
7The set of controls is the same throughout the paper and consists of a dummy that indicates
9
effects and columns (7) and (8) use updating with regard to price effects of rent con-
trol as dependent variable. The results confirm that the aforementioned findings are
statistically significant. That is, participants in the quantity treatment downward-
adjust their posteriors by about 3.5 percentage points and participants in the price
treatment upward-adjust their posteriors by about 0.4 points on a 1-7 scale relative
to the control group. Next, it is insightful to run the quantity-belief updating re-
gressions separately only for those who hold priors above – columns (3) and (4) –
and below – columns (5) and (6) – minus 15%. It turns out that only the former
group engages in negative updating (−6.4 and −8.7, respectively), the latter group
conducts positive updating (around 2-3 percentage points, but not significantly so in
column 5). This finding indicates that the average treatment effects mask important
individual-level heterogeneity in the sense that the treatment leads some people to
upward-adjust their (previously very negative) priors, partly counteracting the effect
of the treatment on the average updating.8 Table 1 also shows that updating is
stronger for participants who put high trust in the study (compare column (3) with
(4) and column (5) with (6)). Again, this finding highlights the importance of trust
in the context of expert communication.
It is also noteworthy that there is some updating about quantity reactions in
the price- and the expert treatment, relative to the control treatment. Although
this effect is not always statistically significant and is weaker than the effect of the
quantity treatment, it does suggest a form of cross-learning: participants seem to
use the information provided in those two treatments to re-consider their beliefs
about supply-side reactions. In particular, it seems reasonable that participants in
the expert treatment wonder why experts are against rent control and then conclude
that the effects on housing supply are more negative than they previously thought.
Finally, Table 5 in the Appendix displays results from regressions, in which the
German nationality, a gender dummy, a dummy that is equal to 1 if the respondent works in a full
time job, the income, the highest educational level attained, and state-fixed effects. “High trust”
is defined here as 4 or 5 on a 1-5 scale when asked whether they would trust the study.8Figure 5 in the Appendix highlights this point visually.
10

confidence in both the quantity and the price posterior are regressed on the treatment
dummies (and controls). It turns out that participants in the quantity treatment
indicate higher confidence in their posterior beliefs than do those in the control
group. This finding does not hold for the price treatment.
11

Belief Quantity Price
Updating (1) (2) (3) (4) (5) (6) (7) (8)
Quantity -3.478∗∗∗ -3.047∗∗∗ -6.362∗∗∗ -8.699∗∗∗ 2.252 3.399∗∗ 0.044 0.064
(0.93) (1.12) (1.05) (1.43) (1.65) (1.65) (0.05) (0.05)
Price -1.578∗ -1.091 -2.038∗∗ -2.353∗ -0.333 0.566 0.367∗∗∗ 0.465∗∗∗
(0.84) (1.00) (0.96) (1.28) (1.52) (1.64) (0.05) (0.06)
Expert -2.670∗∗∗ -2.737∗∗∗ -2.427∗∗ -3.329∗∗∗ -2.532 -2.449 0.071 0.100∗∗
(0.87) (1.00) (0.98) (1.28) (1.63) (1.66) (0.04) (0.05)
Constant -0.074 -0.629 -5.263∗∗ -6.108∗ 4.444 5.599 0.028 -0.053
(2.14) (2.89) (2.43) (3.30) (3.66) (4.62) (0.13) (0.15)
High trust only No Yes No Yes No Yes No Yes
Restrictions prior No No > −15 > −15 < −15 < −15 No No
Controls Yes Yes Yes Yes Yes Yes Yes Yes
Observations 3,031 1,768 1,938 1,043 1,033 686 3,031 1,768
R2 0.008 0.014 0.030 0.052 0.022 0.040 0.025 0.041
Table 1: OLS regressions with posterior minus prior as dependent variable.
Heteroscedasticity-robust standard errors in brackets below. *, **, *** indicate signifi-
cance at the 10%, 5% and 1% level, respectively. Quantity, Price and Expert are treatment
indicators. Includes only participants that passed the attention checks. Controls are dum-
mies indicating German nationality, gender, full time workers as well as income, education
and state-fixed effects. High trust indicates self-reported high trust in the information
treatments.
12

4 Support for Rent Control
4.1 Main Results
We now turn to the main research question of this paper: what determines support
for rent control? Our data puts us in a position to study the correlation between
beliefs and support (via the priors) as well as the causal effect (via the information
treatments). First, Figure 2 delivers three insights: (i) overall support for rent control
is large (7 on a 1-10 scale in the control group); (ii) all three treatments significantly
reduce support relative to the control group (both stated and revealed support); and
(iii) the expert treatment displays the largest effect size.
Figure 2: Support rent control (left-hand panel, 1-10 scale) and frequency of donation
to pro-rent control initiative (right-hand panel) by treatment. Whiskers indicate 95%
confidence intervals.
Table 2 displays results from regressions, in which stated – columns (1) and
(2) – and revealed – columns (3) and (4) – support serve as dependent variables.
The treatment dummies, fairness concerns, profit expectations, political ideology, a
13

Support Rent Control Donation
(1) (2) (3) (4)
Quantity -0.201∗∗ -0.341∗∗∗ 0.004 -0.041∗
(0.09) (0.11) (0.02) (0.02)
Price -0.256∗∗∗ -0.373∗∗∗ -0.015 -0.045∗
(0.09) (0.12) (0.02) (0.03)
Expert -0.556∗∗∗ -0.804∗∗∗ -0.035∗ -0.093∗∗∗
(0.09) (0.11) (0.02) (0.03)
Fairness 1.278∗∗∗ 1.378∗∗∗ 0.132∗∗∗ 0.140∗∗∗
(0.05) (0.07) (0.01) (0.01)
Profit 0.231∗∗∗ 0.229∗∗∗ 0.013∗∗∗ 0.014∗∗
(0.02) (0.03) (0.00) (0.01)
Landlord -0.662∗∗∗ -0.597∗∗∗ -0.096∗∗∗ -0.095∗∗∗
(0.12) (0.14) (0.03) (0.04)
Ideology -0.132∗∗∗ -0.117∗∗∗ -0.033∗∗∗ -0.035∗∗∗
(0.02) (0.03) (0.00) (0.01)
Rents are problem 0.252∗∗∗ 0.237∗∗∗ 0.035∗∗∗ 0.041∗∗∗
(0.02) (0.03) (0.00) (0.01)
Constant 1.146∗∗∗ 0.971∗ 0.382∗∗∗ 0.315∗∗∗
(0.37) (0.51) (0.07) (0.10)
Trust only No Yes No Yes
Controls Yes Yes Yes Yes
Observations 3,030 1,767 3,030 1,767
R2 0.536 0.582 0.268 0.307
Table 2: OLS regression with support for rent control as dependent variable. Heteroscedasticity-robust standard
errors in brackets below. *, **, *** indicate significance at the 10%, 5% and 1% level, respectively. Quantity, Price
and Expert are treatment indicators. Controls include nationality, gender, employment, income, education and a set
of state-fixed effects. High trust indicates self-reported high trust in the information treatments.
14

dummy indicating whether a participant rents out, the perceptions of rents as well
as our standard set of controls constitute the independent variables. The table again
confirms the main conclusions from above: all three treatments decrease support for
rent control. Thus, beliefs play a causal role in determining policy preferences. The
effect size is thereby largest in the expert treatment, and roughly equal in the price
and the quantity treatment. Again, the effects are larger for those individuals who
report higher trust in the information provided to them, see columns (2) and (4).
This finding highlights the key role that trust in expert knowledge plays in spreading
knowledge.9
Other lessons from this empirical exercise are that (i) profit motives, (ii) fairness
concerns and (iii) political ideology play an important role, independently of beliefs.
That is, participants who expect to profit from rent control are more supportive of
rent control (being a landlord likely captures a similar motive), people who believe
that rent control is “fair” and people who lean more to the left are more supportive
of rent control. Finally, participants who think the current level of rents in Germany
is a problem are also more supportive of rent control.10
In order to better compare the relative predictive power of each regressor, we
also conduct a (non-preregistered) dominance analysis (Azen and Budescu, 2003).11
From the regression model in column (2) of Table 2, we find that fairness contributes
around 55% of the total predictive power of the empirical model, problem perception
around 15% and profit around 13%. The relative contribution of each treatment
dummy, of political ideology and the landlord dummy lies below 10% in each case.
9Table 7 in the Appendix displays the results of a correlational exploration in which the prior
beliefs, and not the treatment dummies, are included in the regressions. We find that priors correlate
with preferences for rent control in the expected way, except that the price prior is not statistically
significant in the “donation regression”.10Regarding the control variables, which are included in the regressions but not displayed in the
table, we find that being male, holding a higher educational degree and earning a higher income
are robustly associated with less support for rent control.11This analysis uses the average difference in the R2 between all subsets of models with and all
subsets of models without xi to calculate the relative predictive power of xi.
15

4.2 Heterogeneous Treatment Effects: Political Ideology and
Education
We put forward two additional (pre-registered) hypotheses. The first hypothesis is
that left-wingers hold less well-calibrated (too optimistic) beliefs about the effects
of rent control and consequently update their priors more strongly than do right-
wingers. Previous literature suggests that ideology can play a role in explaining
public policy preferences (Stantcheva, 2021, e.g.). The second hypothesis is that more
educated participants hold better calibrated beliefs and update more strongly than do
less educated participants.12 This is in line with other literature which indicates that
education has a positive impact on people’s support for efficient economic policies
(Baranzini and Carattini, 2017, e.g.). In a nutshell, the first hypothesis is supported
by the data, the second is not.
The top panels of Figure 3 show that left-wingers hold higher (less negative)
quantity-priors, but also that they update more strongly (downwards). This asym-
metric updating significantly closes the ideological gap in beliefs (left-hand panel).
There is no such closing of the gap when it comes to price beliefs (right-hand panel).
Instead, both right- and left-wingers equally engage in updating, which leads to par-
allel lines in Figure 3. As expected, both groups conduct virtually no updating in the
control group. The main difference is that right-wingers start from a higher level of
price beliefs, such that posteriors of right-wingers in the control group are virtually
on the same level as posteriors of left-wingers in the treated group.
Interestingly, this asymmetric belief updating leads to a reduction in the left-right
gap in support for rent control: while left-wingers reduce their support, the support
of right-wingers is almost unaffected by the treatments (see Figure 4). Consequently,
the gap is reduced by about one quarter relative to the control.13
12We define “high education” as having at least a high school diploma (at least a 4 on the 5
point education scale) and “right-wing” as indicating at least a 6 on the 1-11 ideology scale. Both
definitions are basically median splits of the answers to the two underlying variables.13The unconditional gap in support between left- and right-wingers is 1.4 in the control group.
16
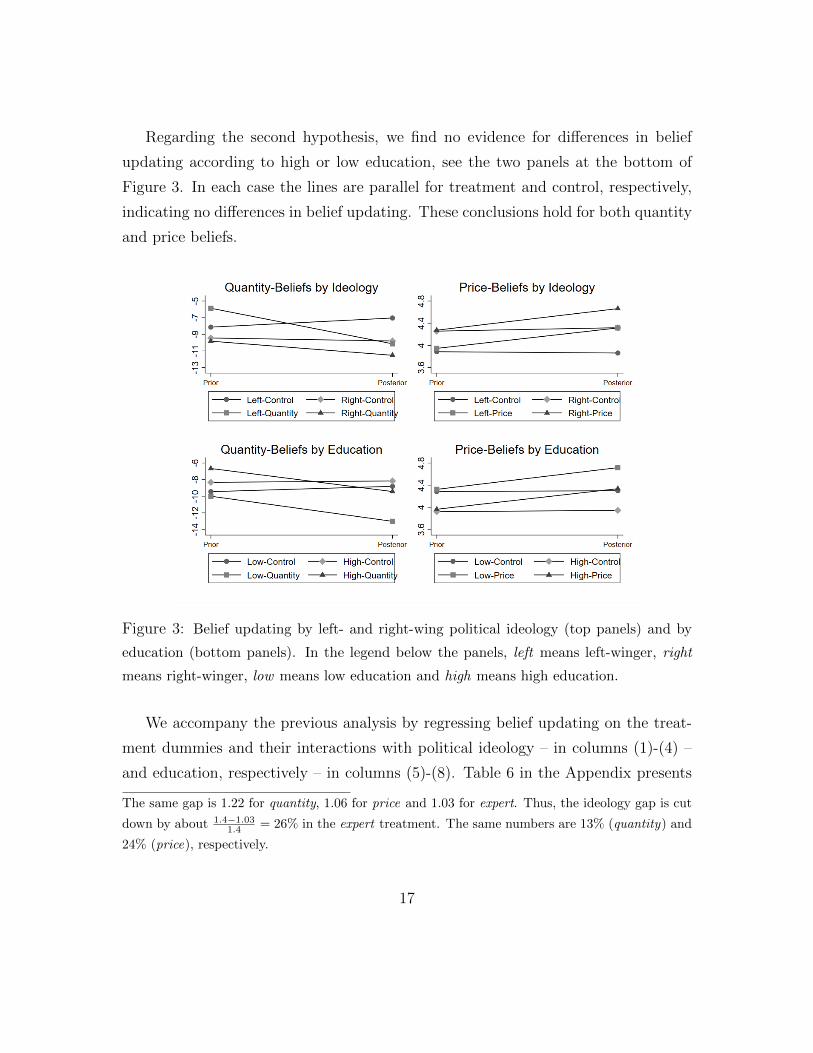
Regarding the second hypothesis, we find no evidence for differences in belief
updating according to high or low education, see the two panels at the bottom of
Figure 3. In each case the lines are parallel for treatment and control, respectively,
indicating no differences in belief updating. These conclusions hold for both quantity
and price beliefs.
Figure 3: Belief updating by left- and right-wing political ideology (top panels) and by
education (bottom panels). In the legend below the panels, left means left-winger, right
means right-winger, low means low education and high means high education.
We accompany the previous analysis by regressing belief updating on the treat-
ment dummies and their interactions with political ideology – in columns (1)-(4) –
and education, respectively – in columns (5)-(8). Table 6 in the Appendix presents
The same gap is 1.22 for quantity, 1.06 for price and 1.03 for expert. Thus, the ideology gap is cut
down by about 1.4−1.031.4 = 26% in the expert treatment. The same numbers are 13% (quantity) and
24% (price), respectively.
17

Figure 4: Support for rent control by left- and right-wing political ideology, separately
for each treatment. Darker color indicates left-wingers, brighter color right-wingers.
Whiskers indicate 95% confidence intervals.
the results (again, odd-numbered columns use all available data whereas even-numbered
columns only use data from individuals who find the information presented to them
trustworthy).
The coefficient on the interaction of quantity and the right-wing dummy (Quan-
tity × One) in columns (1)-(2) is smaller in absolute terms than the interaction of
quantity and the left-wing dummy (Quantity × Zero), confirming that left-wingers
update their beliefs more strongly. A Wald test shows that the coefficients are sta-
tistically significantly different at the 10%-level in column (1), but not in column
(2). Regarding the interaction of political ideology and price beliefs, a Wald test
shows, as expected, no statistically significant differences between belief updating
of left- and right wingers in the price treatment. There is, however, evidence for
18

statistically significant differences in updating in the expert treatment: right-wingers
react more strongly to expert advice than left-wingers do.
Finally, the results presented in columns (5)-(8) of Table 6 confirm again that
quantity-belief updating is significant in the quantity treatment, but also taking place
to a smaller degree in the expert treatment. Only participants in the price treatment
engage in price-belief updating. Additional Wald tests for differences between the
estimated coefficients reveal that in no case, there is evidence that highly-educated
participants update their beliefs more strongly or hold more well-calibrated beliefs
than lower educated subjects.
5 Mechanisms and Robustness
5.1 Mechanisms
In this section, we shed more light on the potential (not pre-registered) mechanisms
that drive support for rent control. First, while the analysis in the previous section
has carved out the important role that fairness concerns play, so far, it is unclear
what notion of fairness people have in fact in mind when they consider rent control.
If these fairness views depend on beliefs about the effects of the policy, we would
expect that the treatments also shift the perceived fairness of rent control.
To examine this hypothesis, columns (1) and (2) of Table 3 present results from
regressions in which fairness perceptions are regressed on the treatment dummies and
the control variables. Again, column (2) uses data only from individuals who find
the information trustworthy. All in all, we find little support for the idea that the
treatments shift fairness views, except in case of the expert treatment, in which case
the coefficients are statistically significantly negative, indicating that this treatment
renders fairness perceptions of rent control less favorable.14 Reasons for this result
14We note that if the treatments shift one of the variables that we use as control in the main
section, this would potentially render the coefficient estimates in Table 2 inconsistent. However,
first of all, we find little evidence that the treatments shift these variables. Second, when we regress
19

might be that the expert treatment induces people to think about why economists
reject rent control and conclude that this rejection might partly be due to fairness
reasons.
The effect on support for rent control might also operate via their on influence
personal profit expectations. For example, pessimistic news about the effect of rent
control on the quantity supplied might lead people to adjust their profit expectations.
To test this hypothesis, we regress profit expectations regarding rent control policies
on the treatment dummies (and, as usual, controls). Columns (3) and (4) of Table
3 show no evidence for such a hypothesis since all coefficients are not statistically
significant at conventional levels and are small in magnitude. Thus, our data do not
support the idea that the treatments shift perceptions of the pecuniary effects of rent
control.
Next, we examine whether the treatments lead people to lower their expectations
about the economic efficiency of rent control. We do so in two ways. First, we
examine a particular sort of inefficiency: we ask whether survey respondents expect
that tenants rent their apartments longer than they would without rent control (see
columns (5) and (6) in Table 3). Second, we ask participants whether they consider
it a problem that due to rent control it might not always be the person who values
the apartment the most, might get it (see columns (7) and (8) in Table 3). Both
questions point at concerns that economists typically worry about in their opposition
toward rent control, see Diamond, McQuade, and Qian (2019). As the table shows,
there is no evidence that the treatment affect the awareness of the problem that rents
might stay longer in their apartments than in the case without rent control. In case
of the full sample in column (7), there is also no evidence that the treatments change
the expectation of inefficient allocations in the rental housing market. However, when
we focus the attention on high-trusting individuals, see column (8), we find evidence
that the treatments render beliefs about efficiency more pessimistic. To sum up, we
support for rent control on these variables using only data from the control group, we find that the
conclusions remain virtually identical.
20

find mixed evidence that efficiency concerns are shifted through the treatments, if
anything, this is only holds true for those who trust the information provided.
Mechanisms
Fairness Profit Rent longer Efficiency
(1) (2) (3) (4) (5) (6) (7) (8)
Quantity -0.090∗ -0.099 0.021 0.000 -0.041 0.051 -0.099∗∗ -0.172∗∗∗
(0.05) (0.06) (0.08) (0.11) (0.05) (0.06) (0.05) (0.06)
Price -0.056 -0.114∗ 0.029 -0.025 -0.074 -0.034 -0.058 -0.211∗∗∗
(0.05) (0.07) (0.08) (0.11) (0.05) (0.07) (0.05) (0.07)
Expert -0.094∗∗ -0.219∗∗∗ -0.026 -0.159 -0.073 -0.042 -0.094∗ -0.246∗∗∗
(0.05) (0.06) (0.08) (0.10) (0.05) (0.06) (0.05) (0.07)
Constant 3.650∗∗∗ 4.000∗∗∗ 5.715∗∗∗ 5.878∗∗∗ 3.738∗∗∗ 3.862∗∗∗ 2.233∗∗∗ 2.279∗∗∗
(0.13) (0.18) (0.21) (0.29) (0.12) (0.17) (0.13) (0.17)
Trust only No Yes No Yes No Yes No Yes
Controls Yes Yes Yes Yes Yes Yes Yes Yes
Observations 3,030 1,767 3,030 1,767 3,031 1,768 3,031 1,768
R2 0.040 0.060 0.032 0.031 0.009 0.017 0.022 0.026
Table 3: OLS regression with different outcome variables as dependent variable.
Heteroscedasticity-robust standard errors in brackets below. *, **, *** indicate significance at
the 10%, 5% and 1% level, respectively. Quantity, Price and Expert are treatment indicators.
Includes only participants that passed the attention checks. Controls include nationality, gender,
employment, income, education and a set of state-fixed effects. High trust indicates self-reported
high trust in the information treatments. Fairness is coded on a 5-point Likert scale where 1 means
“unfair” and 5 means “fair”. Profit is coded on a 1-10 scale where 1 means “financially harmed”
and 10 means “financially profit”. Rent-longer is coded on a 5-point Likert scale where 1 means
“no, not longer” and 5 means “yes, longer”. Efficiency is coded on a 5-point Likert scale where 1
means “no problem” and 5 means “severe problem”.
21
Finally, we study whether the information provided to the subjects in the three
different treatments leads to spillover effects to related policy areas and to changes
in political attitudes. One hypothesis, for example, is that such spillovers are present
because people generalize their newly acquired knowledge about rent control to price
controls in general and consequently also adjust their political attitudes, since they
realize that more right-leaning attitudes are more in line with such a policy pref-
erence. Consequently, we examine whether the treatments groups exhibit different
attitudes towards (i) support for “price controls in general”; (ii) political ideology;
and (iii) support for “free markets” compared to the control group.
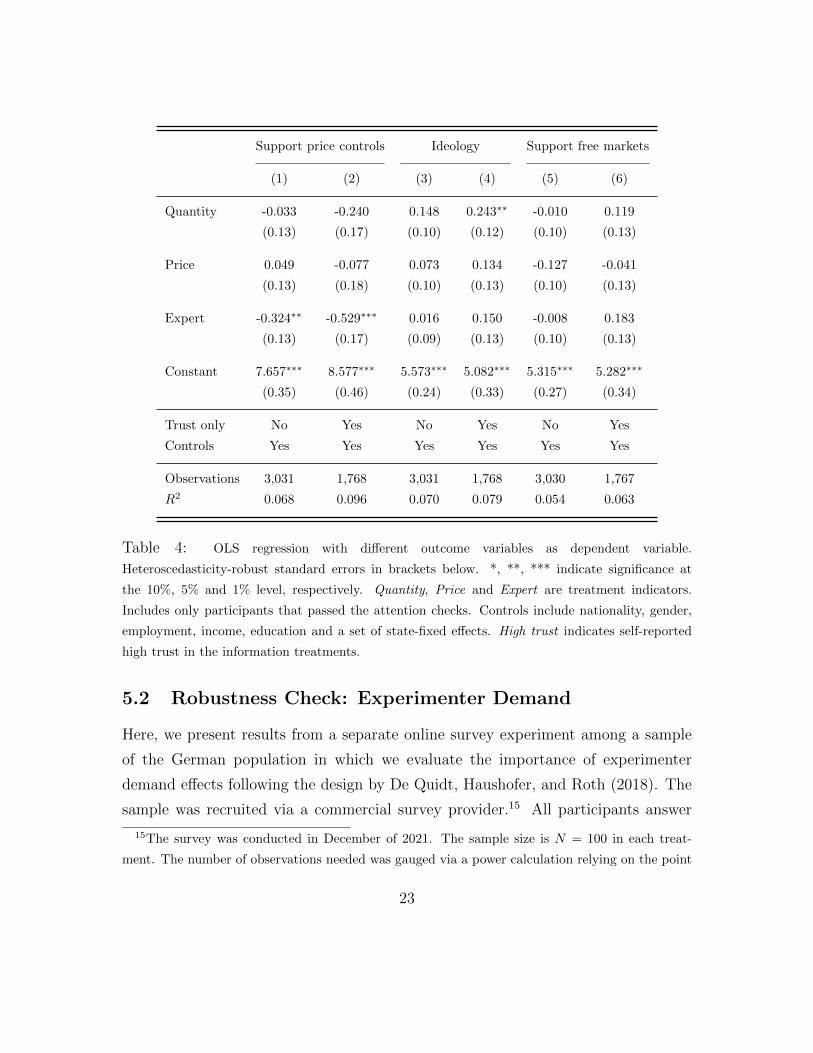
Table 4 displays the results. Columns (1)-(2) thereby use “support for price con-
trols” as a dependent variable (coded on a 1-10 scale where higher values mean more
support). The statistically significant negative coefficient on the expert dummy in-
dicates that people in this treatment (but not in the other treatments) are less in
favor of price controls than participants in the control group. Since our data has
also provided evidence that participants in the expert treatment update their quan-
tity beliefs and their fairness perceptions, this finding again supports the hypothesis
that this treatment induces broader learning than the other two treatments. Next,
columns (3)-(4) provide weak evidence that the quantity treatment renders partic-
ipants more economically right-wing (ideology is defined on a 1-11 scale whereas 1
means “left-wing” and 11 means “right-wing”), but only significantly so for high-
trusting participants. In general, however, none of the treatments shifts political
ideology. Finally, columns (5)-(6) show no evidence of informational spill-overs to
support for free markets (“support for free markets” is defined on a 1-10 scale where
10 means “full support”): all three treatments dummies are not statistically signifi-
cant different from zero.
22
Support price controls Ideology Support free markets
(1) (2) (3) (4) (5) (6)
Quantity -0.033 -0.240 0.148 0.243∗∗ -0.010 0.119
(0.13) (0.17) (0.10) (0.12) (0.10) (0.13)
Price 0.049 -0.077 0.073 0.134 -0.127 -0.041
(0.13) (0.18) (0.10) (0.13) (0.10) (0.13)
Expert -0.324∗∗ -0.529∗∗∗ 0.016 0.150 -0.008 0.183
(0.13) (0.17) (0.09) (0.13) (0.10) (0.13)
Constant 7.657∗∗∗ 8.577∗∗∗ 5.573∗∗∗ 5.082∗∗∗ 5.315∗∗∗ 5.282∗∗∗
(0.35) (0.46) (0.24) (0.33) (0.27) (0.34)
Trust only No Yes No Yes No Yes
Controls Yes Yes Yes Yes Yes Yes
Observations 3,031 1,768 3,031 1,768 3,030 1,767
R2 0.068 0.096 0.070 0.079 0.054 0.063
Table 4: OLS regression with different outcome variables as dependent variable.
Heteroscedasticity-robust standard errors in brackets below. *, **, *** indicate significance at
the 10%, 5% and 1% level, respectively. Quantity, Price and Expert are treatment indicators.
Includes only participants that passed the attention checks. Controls include nationality, gender,
employment, income, education and a set of state-fixed effects. High trust indicates self-reported
high trust in the information treatments.
5.2 Robustness Check: Experimenter Demand
Here, we present results from a separate online survey experiment among a sample
of the German population in which we evaluate the importance of experimenter
demand effects following the design by De Quidt, Haushofer, and Roth (2018). The
sample was recruited via a commercial survey provider.15 All participants answer
15The survey was conducted in December of 2021. The sample size is N = 100 in each treat-
ment. The number of observations needed was gauged via a power calculation relying on the point
23

exactly the same belief questions (both, quantity and price beliefs) as in the main
survey. The difference to the main survey is that respondents are randomly assigned
to two different treatments before each of the two belief elicitations. Specifically,
in the up treatment, we explicitly tell respondents that “we expect participants
who receive these instructions to indicate that rent control increases supply [prices]
more than they normally would”. In the down treatment, we tell respondents that
“we expect participants who receive these instructions to indicate that rent control
decreases supply [prices] more than they normally would”. Both treatments thus
experimentally induce experimenter demand in different directions which allows us to
gauge the strength of this effect in our survey.16 Respondents were first randomized to
the up or down regarding the quantity-belief elicitation. Then they were randomized
(independently) to the up or down price-belief elicitation.17
All in all, we find very little evidence for the presence of experimenter demand
effects. It turns out that the economic differences between the treatment groups
are small and not statistically significantly different: a Wilcoxon rank-sum test of
the hypothesis of no difference between the up and the down treatment displays a
p-value of 0.45 in the quantity treatment and a p-value of 0.15 in the price treatment.
Figure 6 in the Appendix displays quantity- and price-beliefs for the quantity-demand
treatment and price-demand treatment. There, it can also be seen that the average
beliefs are in each case more or less in line with the average priors from the main
survey.
estimates and standard deviations from the main survey. Roughly, our sample size allows us to
identify differences of 5 percentage points in the quantity treatment and 0.4 in price beliefs with a
power of 0.8. We consider both differences to be ‘small’.16These are the weak demand treatments from De Quidt, Haushofer, and Roth (2018).17Similar to the main survey, we also included a short block of socio-demographic questions as
well as the support for rent control question in the survey. The exact instructions can be found in
the Supplementary File.
24

5.3 Robustness Check: Anchoring
In this section, we present results that highlight the robustness of our study towards
potential numerical anchoring effects. Specifically, one might be worried that the
quantity treatment, which mentions the number −15%, might lead participants to
adjust their posterior beliefs towards this number, without in fact affecting their
truly held beliefs. To test for the importance of this concern, we run another online
survey using a sample of the German population (again, recruited via a commercial
survey provider). We provide a subset of the respondents with an irrelevant anchor
of −15% before eliciting their beliefs. Participants in the control condition are not
provided with any such numerical information (but they read the same text as the
treatment group does).18
The data provide no evidence for anchoring effects. A Wilcoxon ranksum test is
unable to detect differences between the anchoring treatment and the control group
(with a p-value of 0.82). In addition, Figure 7 in the Appendix displays quantity
beliefs in the anchoring treatment and the control group (as well as the price-beliefs
for the sake of completeness).
6 Concluding Remarks
Few endeavors seem more timely than understanding the disconnect between the
opinions held by the general public and by experts. We aim to contribute to this
question in the realm of economic policy. Indeed, the answer to this question is
important to understand why people select policies that are overwhelmingly rejected
by experts. The evidence presented in the current paper shows that there is a role
for mis-calibrated beliefs. In particular, we find that people update their beliefs
about the consequences of rent control in response to our treatments. However, it
turns out that fairness considerations and selfish profit motives are more important
18This survey was conducted in January 2022. Instructions for the anchoring survey can be found
in the Supplementary File.
25
than beliefs about the efficacy of the policy. Policy advice should thus not stop at
providing information about scientific evidence and expert advice, but should also
aim to understand more clearly people’s notions of fairness and their expectations of
profitability in the domain of economic policies. Moreover, our survey highlights the
importance of trust in expert opinions since the treatment effects are consistently
stronger for those who indicate trust in the information they were given. Our survey
experiment thus suggests that it is important to understand what factors determine
trust in expert advice and how to increase it.
An important question that the current paper cannot answer is why exactly peo-
ple believe that rent control is fair (or not) – although we do find some evidence that
they adjust their fairness evaluations in response to the treatments, which suggests
that beliefs about the workings of the policy also might impact fairness percep-
tions. Moreover, we cannot really answer the question whether such people hold
well-calibrated beliefs with respect to the financial gains and losses they themselves
experience from this policy. Again, the fact that participants do not adjust their
profit expectations in response to the treatments suggests, on average, that they
might misjudge the profitability of rent control and that correcting these beliefs
could alter support for rent control.
References
Azen, R., and D. V. Budescu (2003): “The dominance analysis approach for
comparing predictors in multiple regression,” Psychological Methods, 8(2), 129–
148.
Baranzini, A., and S. Carattini (2017): “Effectiveness, earmarking and label-
ing: testing the acceptability of carbon taxes with survey data,” Environmental
Economics and Policy Studies, 19(1), 197–227.
26

Brandts, J., I. Busom, C. Lopez-Mayan, and J. Panades (2022): “Dispelling
misconceptions about economics,” Journal of Economic Psychology, 88, 102461.
Caplan, B. (2002): “Systematically biased beliefs about economics: robust evi-
dence of judgemental anomalies from the survey of Americans and economists on
the economy,” The Economic Journal, 112(479), 433–458.
Dal Bo, E., P. Dal Bo, and E. Eyster (2018): “The demand for bad pol-
icy when voters underappreciate equilibrium effects,” The Review of Economic
Studies, 85(2), 964–998.
Davis, L. W., and L. Kilian (2011): “The allocative cost of price ceilings in
the US residential market for natural gas,” Journal of Political Economy, 119(2),
212–241.
De Quidt, J., J. Haushofer, and C. Roth (2018): “Measuring and bounding
experimenter demand,” American Economic Review, 108(11), 3266–3302.
Diamond, R., T. McQuade, and F. Qian (2019): “The effects of rent control
expansion on tenants, landlords, and inequality: Evidence from San Francisco,”
American Economic Review, 109(9), 3365–94.
Friedman, M., and G. J. Stigler (1946): Roofs or Ceilings?: The Current
Housing Problem. Foundation for Economic Education.
Glaeser, E. L., and E. F. Luttmer (2003): “The misallocation of housing under
rent control,” American Economic Review, 93(4), 1027–1046.
Haaland, I., C. Roth, and J. Wohlfart (2021): “Designing information pro-
vision experiments,” Journal of Economic Literature.
Haferkamp, A., D. Fetchenhauer, F. Belschak, and D. Enste (2009):
“Efficiency versus fairness: The evaluation of labor market policies by economists
and laypeople,” Journal of Economic Psychology, 30(4), 527–539.
27
Jacob, R., F. Christandl, and D. Fetchenhauer (2011): “Economic experts
or laypeople? How teachers and journalists judge trade and immigration policies,”
Journal of Economic Psychology, 32(5), 662–671.
Kallbekken, S., S. Kroll, and T. L. Cherry (2011): “Do you not like Pigou,
or do you not understand him? Tax aversion and revenue recycling in the lab,”
Journal of Environmental Economics and Management, 62(1), 53–64.
Mummolo, J., and E. Peterson (2019): “Demand effects in survey experiments:
An empirical assessment,” American Political Science Review, 113(2), 517–529.
Sapienza, P., and L. Zingales (2013): “Economic experts versus average Amer-
icans,” American Economic Review: Papers and Proceedings, 103(3), 636–42.
Sausgruber, R., and J.-R. Tyran (2005): “Testing the Mill hypothesis of fiscal
illusion,” Public choice, 122(1-2), 39–68.
(2011): “Are we taxing ourselves?: How deliberation and experience shape
voting on taxes,” Journal of Public Economics, 95(1-2), 164–176.
Stantcheva, S. (2021): “Understanding tax policy: How do people reason?,”
Quarterly Journal of Economics.
Tversky, A., and D. Kahneman (1974): “Judgment under uncertainty: Heuris-
tics and biases,” science, 185(4157), 1124–1131.
28

7 Appendix
The Appendix proceeds as follows. Section 7.1 displays additional results from the
main survey. Section 7.2 shows results from the two additional surveys, that were
used as robustness checks. Finally, Section 7.3 provides more information on design
and the variables of the main survey.
7.1 Additional Results
Figure 5: Belief updating: (i) supply reactions by (quantity) prior quantile separately
for the quantity treatment and the control group (left-hand panel); (ii) about price
reactions by (price) prior quantile separately for the price treatment and control
group (right-hand panel).
29

Confidence Posterior Quantity Posterior Price
(1) (2) (3) (4)
Quantity 0.244∗∗∗ 0.300∗∗∗ 0.007 0.003
(0.05) (0.06) (0.05) (0.06)
Price -0.059 0.011 -0.086 -0.019
(0.05) (0.07) (0.05) (0.07)
Expert -0.001 0.030 -0.056 -0.092
(0.05) (0.07) (0.05) (0.07)
Constant 2.652∗∗∗ 2.676∗∗∗ 2.711∗∗∗ 2.860∗∗∗
(0.13) (0.18) (0.13) (0.18)
High trust only No Yes No Yes
Controls Yes Yes Yes Yes
Observations 3,031 1,768 3,031 1,768
R2 0.081 0.091 0.047 0.046
Table 5: OLS regressions with heteroscedasticity-robust standard errors in brackets below.
*, **, *** indicate significance at the 10%, 5% and 1% level, respectively. The dependent
variable is the response to the question “How sure are you about your answer to the
previous question?” following the posterior elicitation. Quantity, Price and Expert are
treatment indicators. Columns (1) and (2) are quantity posteriors, columns (3) and (4)
posteriors about the price reaction. Controls include nationality, gender, employment,
income, education and a set of state-fixed effects. High trust indicates self-reported high
trust in the information treatments.
30

Belief Ideology Education
Updating Quantity Price Quantity Price
(1) (2) (3) (4) (5) (6) (7) (8)
Control × One 0.349 -0.816 0.111∗ 0.135∗ -1.708 -1.557 -0.100 -0.007
(1.19) (1.28) (0.06) (0.07) (1.83) (1.98) (0.09) (0.12)
Quantity × Zero -4.658∗∗∗ -3.903∗∗∗ 0.088 0.130∗ -3.892∗∗ -3.537∗ 0.084 0.124
(1.20) (1.50) (0.06) (0.08) (1.67) (1.95) (0.09) (0.11)
Quantity × One -2.165∗ -3.057∗ 0.107∗ 0.129∗ -4.935∗∗ -4.380∗∗ -0.085 0.022
(1.30) (1.59) (0.06) (0.07) (1.96) (2.17) (0.09) (0.12)
Price × Zero -1.369 -0.346 0.410∗∗∗ 0.544∗∗∗ -2.631∗ -1.756 0.372∗∗∗ 0.447∗∗∗
(1.06) (1.38) (0.07) (0.09) (1.55) (1.72) (0.09) (0.11)
Price × One -1.424 -2.485∗ 0.434∗∗∗ 0.518∗∗∗ -2.594 -2.313 0.261∗∗ 0.470∗∗∗
(1.20) (1.44) (0.07) (0.08) (1.88) (2.08) (0.10) (0.14)
Expert × Zero -3.173∗∗∗ -3.235∗∗ 0.032 0.045 -3.757∗∗ -3.587∗∗ 0.096 0.058
(1.20) (1.48) (0.06) (0.07) (1.51) (1.68) (0.08) (0.10)
Experts × One -1.838 -3.052∗∗ 0.215∗∗∗ 0.271∗∗∗ -3.657∗ -3.856∗ -0.050 0.120
(1.14) (1.32) (0.05) (0.07) (1.95) (2.16) (0.09) (0.12)
Constant -0.335 -0.058 -0.036 -0.113 -0.089 -0.957 -0.131 -0.065
(2.18) (2.96) (0.13) (0.15) (2.67) (3.61) (0.16) (0.19)
High trust only No Yes No Yes No Yes No Yes
Controls Yes Yes Yes Yes Yes Yes Yes Yes
Observations 3,031 1,768 3,031 1,768 3,031 1,768 3,031 1,768
R2 0.010 0.015 0.028 0.046 0.009 0.015 0.026 0.042
Table 6: OLS regressions with posterior minus prior as dependent variable. Heteroscedasticity-
robust standard errors in brackets below. *, **, *** indicate significance at the 10%, 5% and 1%
level, respectively. Quantity, Price and Expert are treatment indicators. The reference group are
left-wingers (low-educated) in the control treatment. Right-wingers are defined as 6 or higher on
a 1 to 11 ideological scale. Highly-educated are defined as holding at least a high school degree
(at least 4 out of 5 on the education variable). “One” means that either right dummy is equal to
1 (columns (1)-(4)) or that high education dummy is equal to 1 (columns (5)-(8)). “Zero” means
dummies are zero. Controls include nationality, gender, employment, income, education and a set
of state-fixed effects.
31

Support Rent Control Donation
(1) (2) (3) (4)
Prior Quantity 0.011∗∗∗ 0.013∗∗∗ 0.001∗∗∗ 0.002∗∗∗
(0.00) (0.00) (0.00) (0.00)
Prior Price -0.080∗∗∗ -0.062∗∗ -0.003 0.003
(0.02) (0.03) (0.00) (0.01)
Fairness 1.222∗∗∗ 1.324∗∗∗ 0.126∗∗∗ 0.135∗∗∗
(0.05) (0.07) (0.01) (0.01)
Profit 0.210∗∗∗ 0.206∗∗∗ 0.011∗∗ 0.012∗∗
(0.02) (0.03) (0.00) (0.01)
Landlord -0.649∗∗∗ -0.562∗∗∗ -0.095∗∗∗ -0.089∗∗
(0.12) (0.14) (0.03) (0.04)
Ideology -0.118∗∗∗ -0.115∗∗∗ -0.032∗∗∗ -0.035∗∗∗
(0.02) (0.03) (0.00) (0.01)
Rents are problem 0.266∗∗∗ 0.251∗∗∗ 0.036∗∗∗ 0.042∗∗∗
(0.02) (0.03) (0.00) (0.01)
Constant 1.481∗∗∗ 1.062∗∗ 0.407∗∗∗ 0.341∗∗∗
(0.39) (0.53) (0.08) (0.10)
Trust only No Yes No Yes
Controls Yes Yes Yes Yes
Observations 3,030 1,767 3,030 1,767
R2 0.541 0.582 0.272 0.309
Table 7: OLS regression with support for rent control on a 1-10 scale, where 10 means
“full support” as dependent variable. Heteroscedasticity-robust standard errors in brackets
below. *, **, *** indicate significance at the 10%, 5% and 1% level, respectively. Quantity,
Price and Expert are treatment indicators. Includes only participants that passed the
attention checks. Controls include nationality, gender, employment, income, education and
a set of state-fixed effects. High trust indicates self-reported high trust in the information
treatments.
32
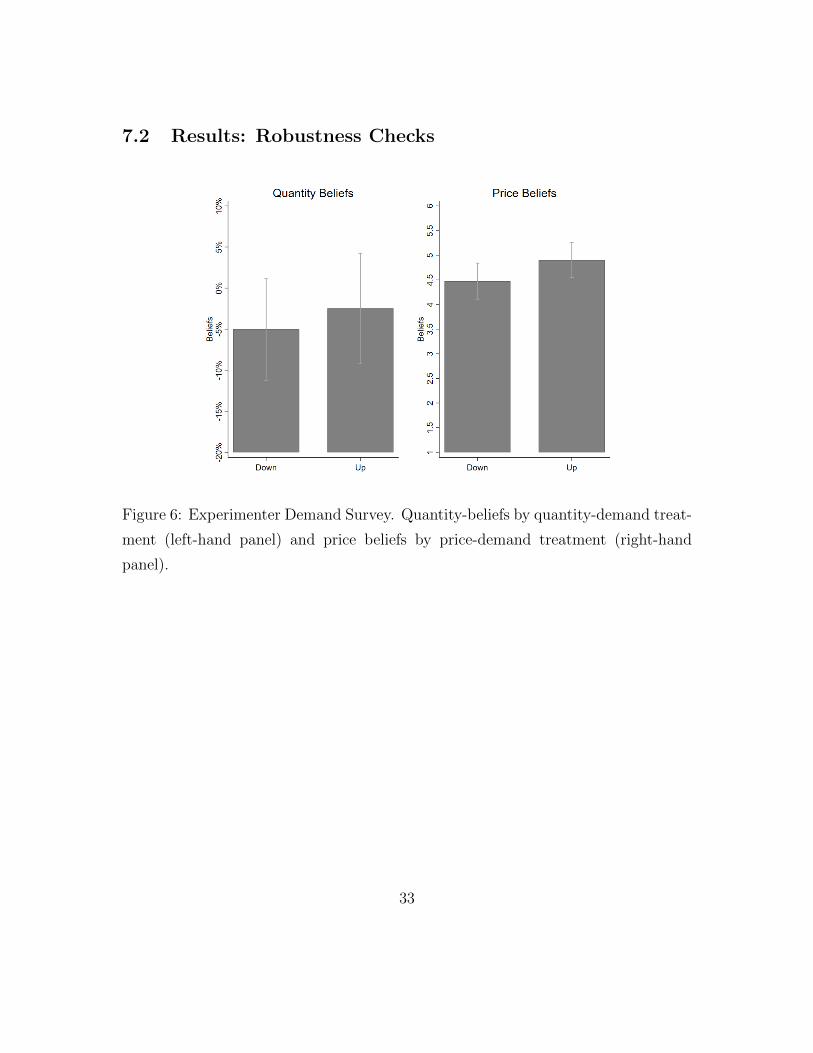
7.2 Results: Robustness Checks
Figure 6: Experimenter Demand Survey. Quantity-beliefs by quantity-demand treat-
ment (left-hand panel) and price beliefs by price-demand treatment (right-hand
panel).
33

Figure 7: Anchoring treatment. Quantity- (left-hand panel) and price beliefs (right-
hand panel). Anchoring treatment versus control.
7.3 Overview and Variables of the Main Survey
34

Summary Statistics Control Quantity Price Expert
Age44.46
(15.71)
44.99
(15.57)
44.93
(15.45)
45.00
(15.49)
Income1.99
(1.36)
2.03
(1.38)
2.11
(1.47)
2.10
(1.44)
Education3.78
(0.99)
3.80
(0.99)
3.82
(0.99)
3.80
(0.98)
Male0.45
(0.49)
0.49
(0.50)
0.48
(0.50)
0.49
(0.50)
Trust3.27
(0.89)
3.30
(0.89)
3.30
(0.81)
3.29
(0.85)
Prior Quantity-8.79
(24.72)
-8.02
(24.34)
-8.41
(22.95)
-8.43
(22.41)
Prior Price4.07
(1.52)
4.15
(1.48)
4.11
(1.43)
4.14
(1.49)
Table 8: Summary statistics by treatment for all participants who passed the atten-
tion checks. Mean of each variable (standard deviation in brackets below). Income is
in 1000 euros. Ranksum tests between the means of each variable in each treatment
and the control never shows statistically significant differences.
35

Figure 8: Overview of the main survey.
36

Main Variables Question No. Coding
Beliefs
Belief supply 1 slider: 0%-100%
Belief price 3 1 (much lower) - 7 (much higher)
Support rent control
Stated support 29 1 (strongly oppose) - 10 (strongly support)
Donation 41 1=pro-rent control; 0=otherwise
Trust in Information
Trust Study 101 (low trust) - 5 (high trust),
high trust=1 if trust >3, 0=otherwise
Additional Variables
Support price control 30 1 (strongly oppose) - 10 (strongly support)
Ideology 31 1 (far left) - 11 (far right)
Fairness rent control 32 1 (unfair) - 5 (fair)
Support free markets 38 1 (strongly disagree) - 10 (strongly agree)
Profit 34 1 (hurt very much) - 10 (benefit very much)
Rent longer 27 1 (no effect) - 10 (very strong effect)
Problem efficiency 28 1 (no problem) - 5 (very severe)
Rents are problem 32 1 (no problem) - 10 (very severe)
Socio-Demographics
German nationality 11 1=yes, 0=otherwise
Gender 12 1=male, 0=otherwise
Age 13 in years
Education 15 1 (no formal education) - 5 (university degree)
Income 14 12 income brackets for net income, variable divided by 1000
Employment 18 1=full time, 0=otherwise
Renting status 20 1=renting, 0=otherwise
Landlord 22 1=landlord, 0=otherwise
37

University of Innsbruck - Working Papers in Economics and StatisticsRecent Papers can be accessed on the following webpage:
https://www.uibk.ac.at/eeecon/wopec/
2021-20 Daniel Müller, Elisabeth Gsottbauer:Why Do People Demand Rent Control?
2021-19 Alexandra Baier, Loukas Balafoutas, Tarek Jaber-Lopez:Ostracism and Theft in He-terogeneous Groups
2021-18 Zvonimir Bašić, Parampreet C. Bindra, Daniela Glätzle-Rützler, Angelo Romano,Matthias Sutter, Claudia Zoller: The roots of cooperation
2021-17 Silvia Angerer, Jana Bolvashenkova, Daniela Glätzle-Rützler, Philipp Lergetporer,Matthias Sutter: Children’s patience and school-track choices several years later:Linking experimental and field data
2021-16 Daniel Gründler, Eric Mayer, Johann Scharler: Monetary Policy Announcements,Information Schocks, and Exchange Rate Dynamics
2021-15 Sebastian Bachler, Felix Holzmeister, Michael Razen, Matthias Stefan: The Impactof Presentation Format and Choice Architecture on Portfolio Allocations: Experi-mental Evidence
2021-14 Jeppe Christoffersen, Felix Holzmeister, Thomas Plenborg:What is Risk to Mana-gers?
2021-13 Silvia Angerer, Daniela Glätzle-Rützler, Christian Waibel: Trust in health care cre-dence goods: Experimental evidence on framing andsubject pool effects
2021-12 Rene Schwaiger, Laura Hueber: Do MTurkers Exhibit Myopic Loss Aversion?
2021-11 Felix Holzmeister, ChristophHuber, Stefan Palan:ACritical Perspective on the Con-ceptualization of Risk in Behavioral and Experimental Finance
2021-10 Michael Razen, Alexander Kupfer: Can increased tax transparency curb corporatetax avoidance?
2021-09 Changxia Ke, FlorianMorath, Anthony Newell, Lionel Page: Too big to prevail: Theparadox of power in coalition formation
2021-08 Marco Haan, Pim Heijnen, Martin Obradovits: Competition with List Prices
2021-07 Martin Dufwenberg, Olof Johansson-Stenman, Michael Kirchler, Florian Lindner,Rene Schwaiger:Mean Markets or Kind Commerce?

2021-06 Christoph Huber, Jürgen Huber, andMichael Kirchler: Volatility Shocks and Invest-ment Behavior
2021-05 Max Breitenlechner, Georgios Georgiadis, Ben Schumann:What goes around co-mes around: How large are spillbacks from US monetary policy?
2021-04 Utz Weitzel, Michael Kirchler: The Banker’s Oath And Financial Advice
2021-03 Martin Holmen, Felix Holzmeister, Michael Kirchler, Matthias Stefan, ErikWengs-tröm: Economic Preferences and Personality Traits Among Finance Professionalsand the General Population
2021-02 Christian König-Kersting: On the Robustness of Social Norm Elicitation
2021-01 Laura Hueber, Rene Schwaiger: Debiasing Through Experience Sampling: The Caseof Myopic Loss Aversion.
2020-34 Kai A. Konrad, Florian Morath: The Volunteer’s Dilemma in Finite Populations
2020-33 KatharinaMomsen, Markus Ohndorf: Expressive Voting vs. Self-Serving Ignorance
2020-32 Silvia Angerer, Daniela Glätzle-Rützler, Christian Waibel: Monitoring institutionsin health care markets: Experimental evidence
2020-31 Jana Friedrichsen, Katharina Momsen, Stefano Piasenti: Ignorance, Intention andStochastic Outcomes
2020-30 Esther Blanco, Alexandra Baier, Felix Holzmeister, Tarek Jaber-Lopez, Natalie Stru-we: Substitution of social concerns under the Covid-19 pandemic
2020-29 Andreas Hackethal,Michael Kirchler, Christine Laudenbach,Michael Razen, Anni-kaWeber:On the (ir)relevance of monetary incentives in risk preference elicitationexperiments
2020-28 Andrej Gill,Matthias Heinz, Heiner Schumacher,Matthias Sutter: Trustworthinessin the Financial Industry
2020-27 Matthias Sutter,MichaelWeyland, AnnaUntertrifaller,Manuel Froitzheim: Finan-cial literacy, risk and time preferences - Results from a randomized educational in-tervention
2020-26 Rene Schwaiger, Jürgen Huber, Michael Kirchler, Daniel Kleinlercher, Utz Weitzel:Unequal Opportunities, Social Groups, and Redistribution
2020-25 Roman Inderst, Martin Obradovits: Competitive Strategies when Consumers areRelative Thinkers: Implications for Pricing, Promotions, and Product Choice
2020-24 Martin Obradovits, Philipp Plaickner: Price-Directed Search and Collusion
2020-23 Helena Fornwagner, Oliver P. Hauser: Climate action for (my) children

2020-22 Esther Blanco, Natalie Struwe, James M. Walker: Incentivizing public good provi-sion through outsider transfers: experimental evidence on sharing rules and addi-tionality requirements
2020-21 LoukasBalafoutas, Helena Fornwagner, Rudolf Kerschbamer,Matthias Sutter,Mary-na Tverdostup: Diagnostic Uncertainty and Insurance Coverage in Credence GoodsMarkets
2020-20 AnnaUlrichshofer,MarkusWalzl: Customer Disputes,Misconduct, and ReputationBuilding in the Market for Financial Advice
2020-19 Anna Ulrichshofer, MarkusWalzl: Social Comparison and Optimal Contracts in theCompetition for Managerial Talent
2020-18 Martin Obradovits, Philipp Plaickner: Searching for Treatment
2020-17 Jun Honda: The Gender-Punishment Gap revisited
2020-16 Jun Honda: The Relation between Rankings and Risk-Taking in the LaborMarket forFinancial Advice
2020-15 Christina Bannier, Eberhard Feess,Natalie Packham,MarkusWalzl:Differentiationand Risk-Aversion in Imperfectly Competitive Labor Markets
2020-14 Felix Holzmeister, Rudolf Kerschbamer: oTree: The Equality Equivalence Test
2020-13 Parampreet Christopher Bindra, Graeme Pearce: The effect of priming on fraud:Evidence from a natural field experiment
2020-12 Alessandro De Chiara,Marco A. Schwarz:ADynamic Theory of Regulatory Capture
2020-11 ChristophHuber, JürgenHuber,Michael Kirchler:Market shocks andprofessionals’investment behavior - Evidence from the COVID-19 crash
2020-10 Elisabeth Gsottbauer, Daniel Müller, Samuel Müller, Stefan T. Trautmann, GalinaZudenkova: Social class and (un)ethical behavior: Causal versus correlational evi-dence
2020-09 Parampreet Christopher Bindra, Rudolf Kerschbamer, Daniel Neururer, MatthiasSutter: Reveal it or conceal it: On the value of second opinions in a low-entry-barriers credence goods market
2020-08 Robert Steiger, Eva Posch, Gottfried Tappeiner, Janette Walde: Effects of climatechange on tourism demand considering individual seasonal preferences
2020-07 Fang Liu, Alexander Rasch, Marco A. Schwarz, Christian Waibel: The role of diag-nostic ability in markets for expert services
2020-06 Matthias Stefan, Jürgen Huber, Michael Kirchler, Matthias Sutter, Markus Walzl:Monetary and Social Incentives in Multi-Tasking: The Ranking Substitution Effect

2020-05 Michael Razen, Jürgen Huber, Laura Hueber, Michael Kirchler, Matthias Stefan:Financial Literacy, Economic Preferences, and Adolescents’ Field Behavior
2020-04 Christian König-Kersting, Johannes Lohse, Anna LouisaMerkel: Active and PassiveRisk-Taking
2020-03 ChristophHuber, JürgenHuber:Badbankers nomore? Truth-telling and (dis)honestyin the finance industry
2020-02 Dietmar Fehr, DanielMüller,Marcel Preuss: SocialMobility Perceptions and Inequa-lity Acceptance
2020-01 Loukas Balafoutas, Rudolf Kerschbamer: Credence goods in the literature: Whatthe past fifteen years have taught us about fraud, incentives, and the role of insti-tutions

University of Innsbruck
Working Papers in Economics and Statistics
2021-20
Daniel Müller, Elisabeth Gsottbauer
Why Do People Demand Rent Control?
AbstractWe conduct a representative survey experiment in Germany to understand why peoplesupport inefficient policies. In particular, we measure beliefs about and preferences forrent control – a policy that is widely regarded as harmful by experts. To tease out cau-sal mechanisms, we provide randomly selected sub-sets of participants with empiricalestimates about the effects of rent control on rent prices and housing supply and withinformation about the consensus among economists against rent control. We find thatpeople update their beliefs and that this leads to lower demand for rent control. Left-wingers update their beliefs more strongly, which reduces the ideological gap in supportfor rent control by about one quarter. Providing information about economists’ rejec-tion of this policy leads to the largest reduction in support. However, the main driversof support for rent control are fairness considerations and profit motives. Our study alsohighlights the importance of trust since treatment effects are consistently larger amongthose who indicate trust in the scientific information provided to them.
ISSN 1993-4378 (Print)ISSN 1993-6885 (Online)