why does location analytics give you a competitive advantage? · white paper 3 why does location...
TRANSCRIPT
Why does Location Analytics give you a competitive advantage?
WHITE PAPER
2
Table of contents
Executive Summary Page 3
The Power of the Map Page 3
Meshing Geographical Data Sources Page 4
Ensuring a High Return on Investment Page 4
Introduction Page 6
Business Scenario Page 6
The Start of Something New Page 7
Conclusion Page 11
Additional References Page 12
WHITE PAPER
3
Why does Location Analytics give you a competitive advantage?
Executive summary
Location analytics extends your data past customer profiles and
preferences to understanding trends and patterns on a global scale. Its
ability to fill in an organization’s analytical blind spot is making it a hot
topic in big data.
This white paper contains statistics on the usage of location analytics
and its advantages. Strong contenders in the location analytics space
are highlighted, including Esri®, MicroStrategy, and GREBIT Solutions. A
customer use case is presented at the end to highlight the strengths of
location services and associated technologies and services within the
insurance industry.
In a recent surveyi of executives familiar with location services, over 50%
of respondents have or are planning to implement a solution in their
business analytics platform. This is in line with IT’s beliefs – 80% believe
that adding a “Geographic Representation” to business intelligence (BI)
deployments will result in higher adoption rates among business users
of BI tools.
The Power of the Map
Location analytics isn’t limited to a specific industry or business function.
Executives and management immediately realize its value – better
business insight and faster decision-making. For IT, location analytics is the
missing link between data stored in different locations. Location analytics
can provide a truly 360° view of business.
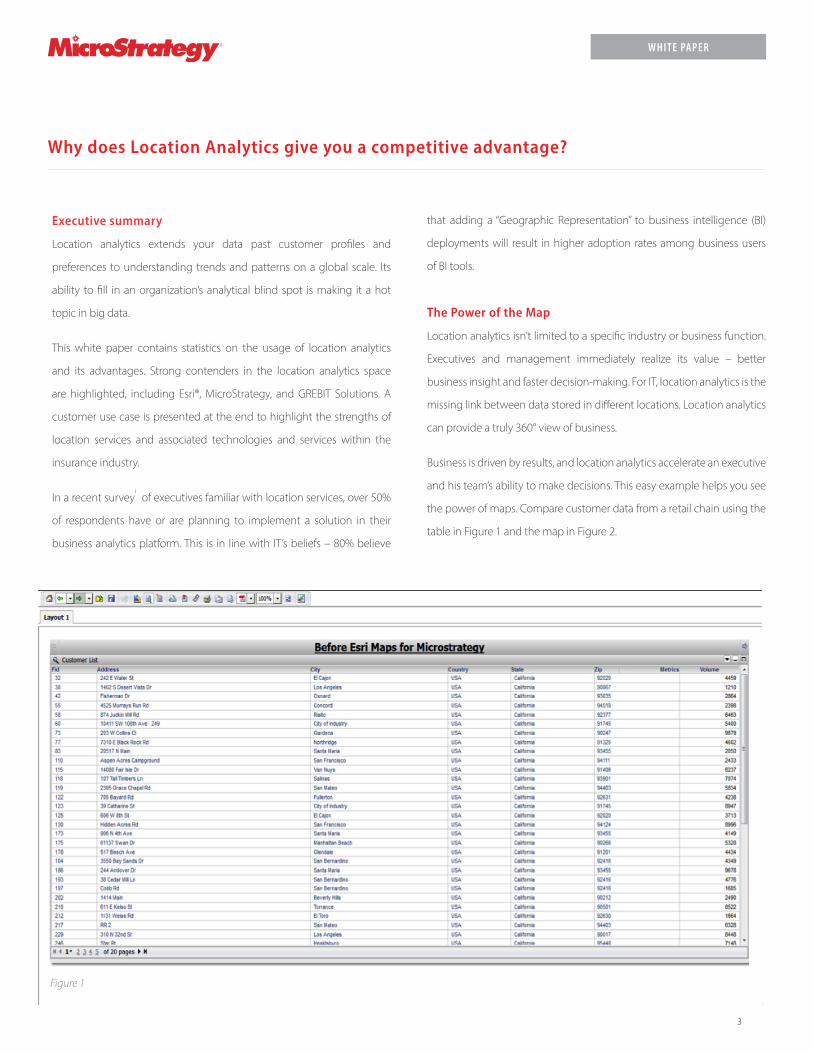
Business is driven by results, and location analytics accelerate an executive
and his team’s ability to make decisions. This easy example helps you see
the power of maps. Compare customer data from a retail chain using the
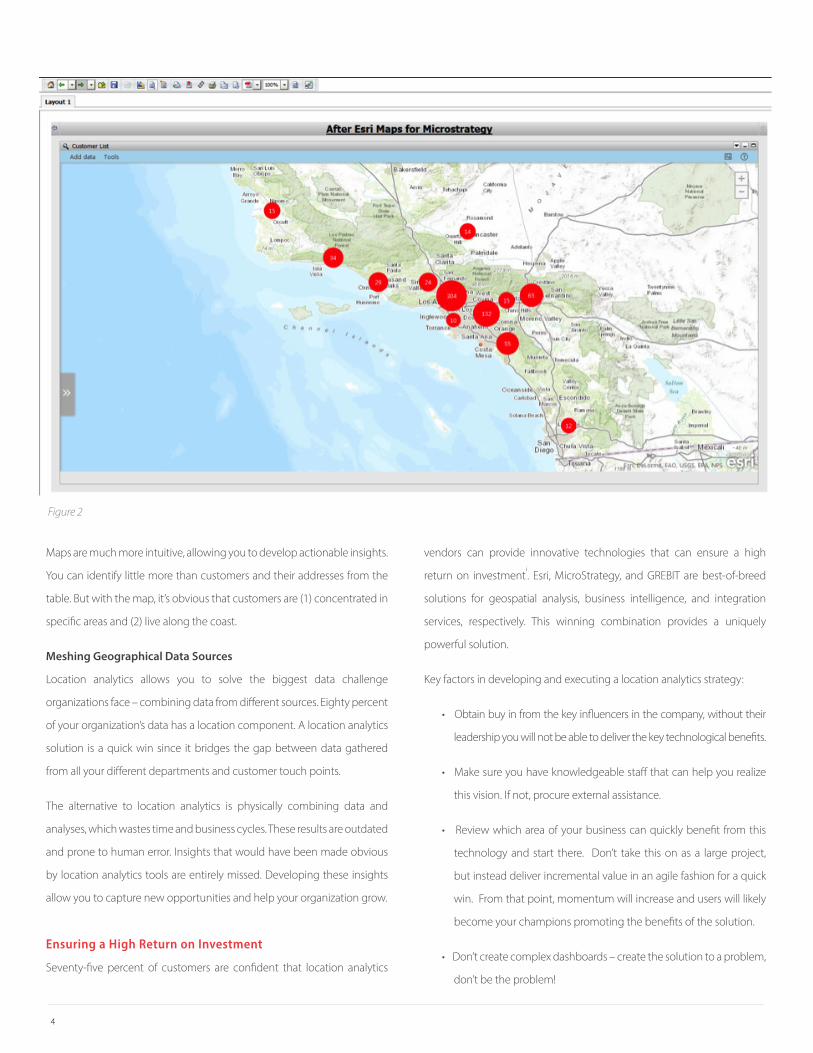
table in Figure 1 and the map in Figure 2.
Figure 1
4
Maps are much more intuitive, allowing you to develop actionable insights.
You can identify little more than customers and their addresses from the
table. But with the map, it’s obvious that customers are (1) concentrated in
specific areas and (2) live along the coast.
Meshing Geographical Data Sources
Location analytics allows you to solve the biggest data challenge
organizations face – combining data from different sources. Eighty percent
of your organization’s data has a location component. A location analytics
solution is a quick win since it bridges the gap between data gathered
from all your different departments and customer touch points.
The alternative to location analytics is physically combining data and
analyses, which wastes time and business cycles. These results are outdated
and prone to human error. Insights that would have been made obvious
by location analytics tools are entirely missed. Developing these insights
allow you to capture new opportunities and help your organization grow.
Ensuring a High Return on Investment
Seventy-five percent of customers are confident that location analytics
vendors can provide innovative technologies that can ensure a high
return on investmenti. Esri, MicroStrategy, and GREBIT are best-of-breed
solutions for geospatial analysis, business intelligence, and integration
services, respectively. This winning combination provides a uniquely
powerful solution.
Key factors in developing and executing a location analytics strategy:
• Obtain buy in from the key influencers in the company, without their
leadership you will not be able to deliver the key technological benefits.
• Make sure you have knowledgeable staff that can help you realize
this vision. If not, procure external assistance.
• Review which area of your business can quickly benefit from this
technology and start there. Don’t take this on as a large project,
but instead deliver incremental value in an agile fashion for a quick
win. From that point, momentum will increase and users will likely
become your champions promoting the benefits of the solution.
• Don’t create complex dashboards – create the solution to a problem,
don’t be the problem!
Figure 2
WHITE PAPER
5
If you build it, they will use it!
MicroStrategy and Esri have come together to push the boundaries
of location analytics. Esri® Maps for MicroStrategy is intuitive and
sophisticated. When a tool is easy to implement and use, it results in a
higher adoption rate.
With Esri Maps for MicroStrategy, you can be up and running in less
than an hour. Existing dashboards can be map-enabled, allowing you to
perform rich geo-analysis to solve any challenge.
Esri Maps for MicroStrategy allows you to combine all your data to
discover correlations based on comprehensive information. Statistics
show that more than a third of companies that use location analytics
have been able to combine all customer data. Of this, 74% of the data
is unstructuredi. Unstructured data is irregular and ambiguous, making
it the most difficult type of data for traditional analytics tools to handle.
Unstructured data comes from a wide range of sources and can include
anything from demographic data to weather patterns. Esri Maps for
MicroStrategy provides a holistic view of your business by allowing you to
combine data stored anywhere.
Esri Maps for MicroStrategy can help you draw different correlations and
come to new conclusions. In business-to-consumer scenarios, this could
mean identifying buying patterns by drawing correlations between an
areas average income per family, number of children per household,
highest education attained, or crime rates. This type of analysis helps you
develop a deeper understanding of current and potential customers, so
you are better able to tailor your products and offerings.
Taking Esri Maps for MicroStrategy to the Next Level
Esri Maps’ ArcGIS® platform provides tools for creating and sharing maps
with the rest of your organization. Your investment in location analytics
can extend to your partners and customers with the addition of ArcGISSM
Online. Using ArcGIS Online in conjunction with MicroStrategy lets you
create interactive maps containing rich analytics and share them with
internal or external users for consumption or collaboration. For the first
time, location analytics are available at a low cost to users of all levels.
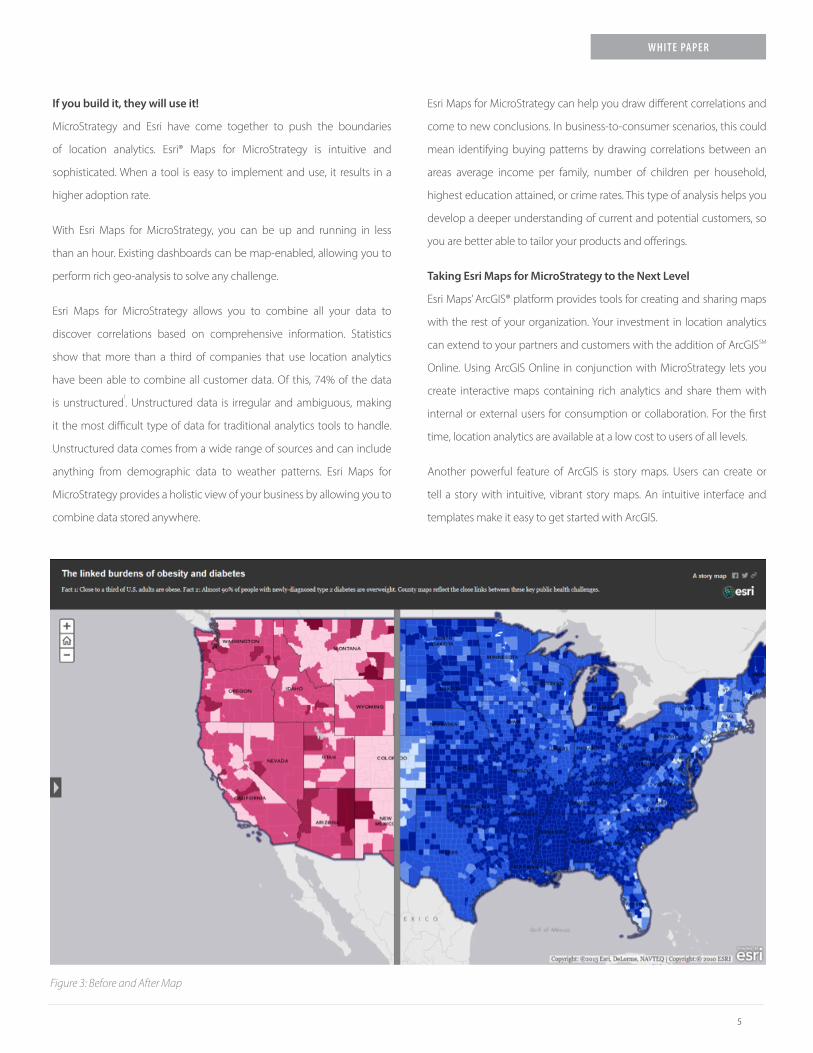
Another powerful feature of ArcGIS is story maps. Users can create or
tell a story with intuitive, vibrant story maps. An intuitive interface and
templates make it easy to get started with ArcGIS.
Figure 3: Before and After Map
6
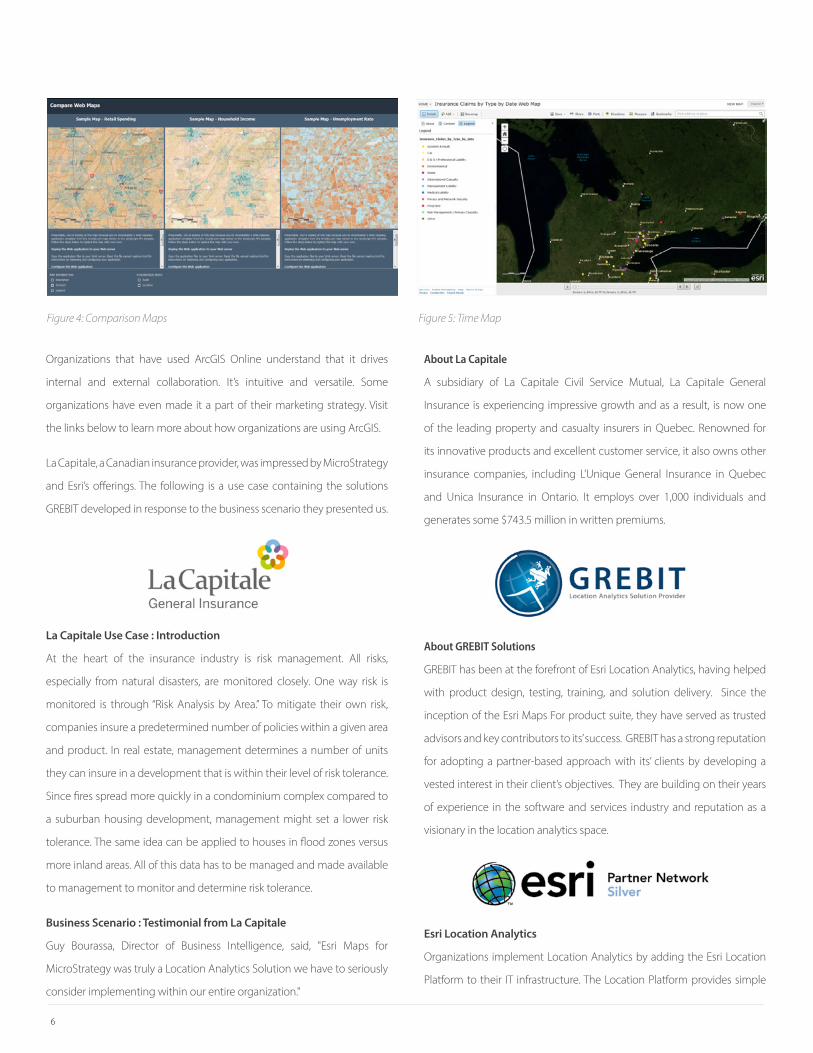
Organizations that have used ArcGIS Online understand that it drives
internal and external collaboration. It’s intuitive and versatile. Some
organizations have even made it a part of their marketing strategy. Visit
the links below to learn more about how organizations are using ArcGIS.
La Capitale, a Canadian insurance provider, was impressed by MicroStrategy
and Esri’s offerings. The following is a use case containing the solutions
GREBIT developed in response to the business scenario they presented us.
La Capitale Use Case : Introduction
At the heart of the insurance industry is risk management. All risks,
especially from natural disasters, are monitored closely. One way risk is
monitored is through “Risk Analysis by Area.” To mitigate their own risk,
companies insure a predetermined number of policies within a given area
and product. In real estate, management determines a number of units
they can insure in a development that is within their level of risk tolerance.
Since fires spread more quickly in a condominium complex compared to
a suburban housing development, management might set a lower risk
tolerance. The same idea can be applied to houses in flood zones versus
more inland areas. All of this data has to be managed and made available
to management to monitor and determine risk tolerance.
Business Scenario : Testimonial from La Capitale
Guy Bourassa, Director of Business Intelligence, said, "Esri Maps for
MicroStrategy was truly a Location Analytics Solution we have to seriously
consider implementing within our entire organization."
About La Capitale
A subsidiary of La Capitale Civil Service Mutual, La Capitale General
Insurance is experiencing impressive growth and as a result, is now one
of the leading property and casualty insurers in Quebec. Renowned for
its innovative products and excellent customer service, it also owns other
insurance companies, including L’Unique General Insurance in Quebec
and Unica Insurance in Ontario. It employs over 1,000 individuals and
generates some $743.5 million in written premiums.
About GREBIT Solutions
GREBIT has been at the forefront of Esri Location Analytics, having helped
with product design, testing, training, and solution delivery. Since the
inception of the Esri Maps For product suite, they have served as trusted
advisors and key contributors to its’ success. GREBIT has a strong reputation
for adopting a partner-based approach with its’ clients by developing a
vested interest in their client’s objectives. They are building on their years
of experience in the software and services industry and reputation as a
visionary in the location analytics space.
Esri Location Analytics
Organizations implement Location Analytics by adding the Esri Location
Platform to their IT infrastructure. The Location Platform provides simple
Figure 4: Comparison Maps Figure 5: Time Map
WHITE PAPER
7
to use, dynamic mapping capabilities to any business system, including
business intelligence (BI), customer relationship management (CRM),
enterprise resource planning (ERP), and everyday productivity tools, such
as Microsoft Office. With Esri Location Analytics, organizations can analyze
all their location data to gain greater insight, make better decisions, and,
ultimately improve business outcomes.
The Start of Something New
La Capitale needed a “Risk Analysis by Area” dashboard accessible by
everyone from executives at the office to brokers in field. The key criteria
consisted of the ability to:
• Filter and select based on a map prompt.
• Analyze risk based on localization areas, pre-defined and ad-hoc.
• Click on an address and zoom in to a street view of the policy to
confirm actual location.
As you will see in the following solutions, GREBIT combines advanced
MicroStrategy and Esri offerings to deliver La Capitale’s key criteria. GREBIT
went beyond personal computing to showing La Capitale the possibilities,
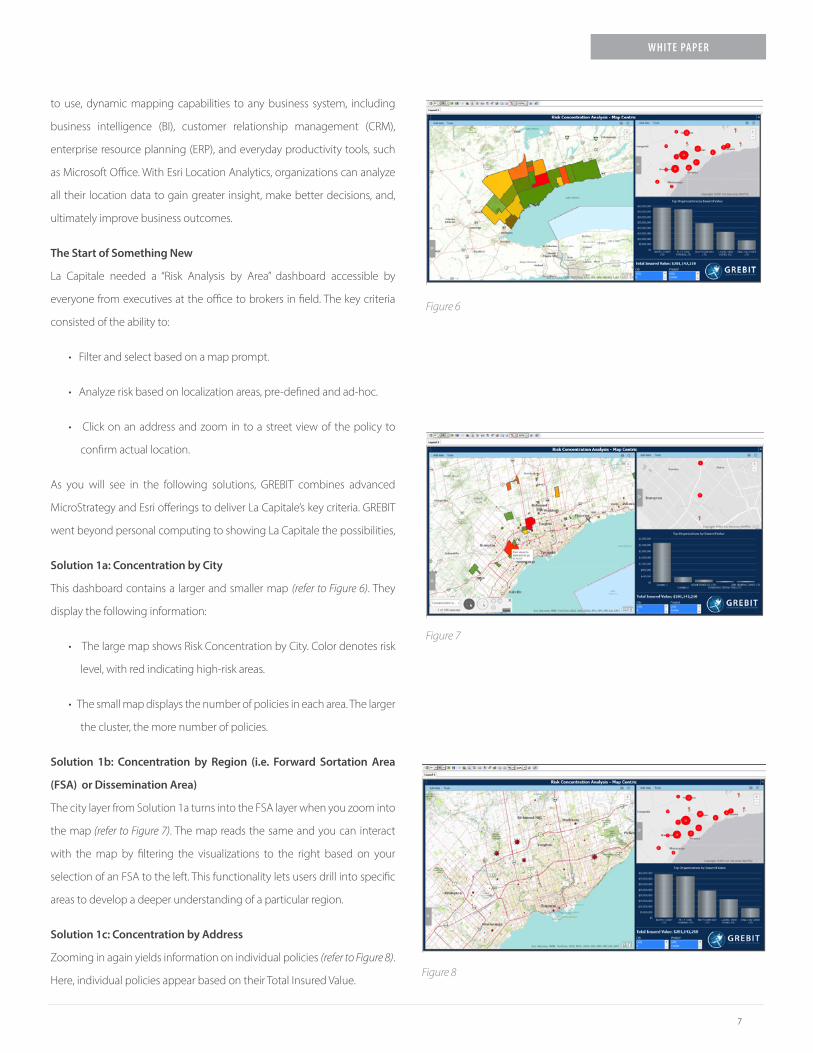
Solution 1a: Concentration by City
This dashboard contains a larger and smaller map (refer to Figure 6). They
display the following information:
• The large map shows Risk Concentration by City. Color denotes risk
level, with red indicating high-risk areas.
• The small map displays the number of policies in each area. The larger
the cluster, the more number of policies.
Solution 1b: Concentration by Region (i.e. Forward Sortation Area
(FSA) or Dissemination Area)
The city layer from Solution 1a turns into the FSA layer when you zoom into
the map (refer to Figure 7). The map reads the same and you can interact
with the map by filtering the visualizations to the right based on your
selection of an FSA to the left. This functionality lets users drill into specific
areas to develop a deeper understanding of a particular region.
Solution 1c: Concentration by Address
Zooming in again yields information on individual policies (refer to Figure 8).
Here, individual policies appear based on their Total Insured Value.
Figure 6
Figure 7
Figure 8
8
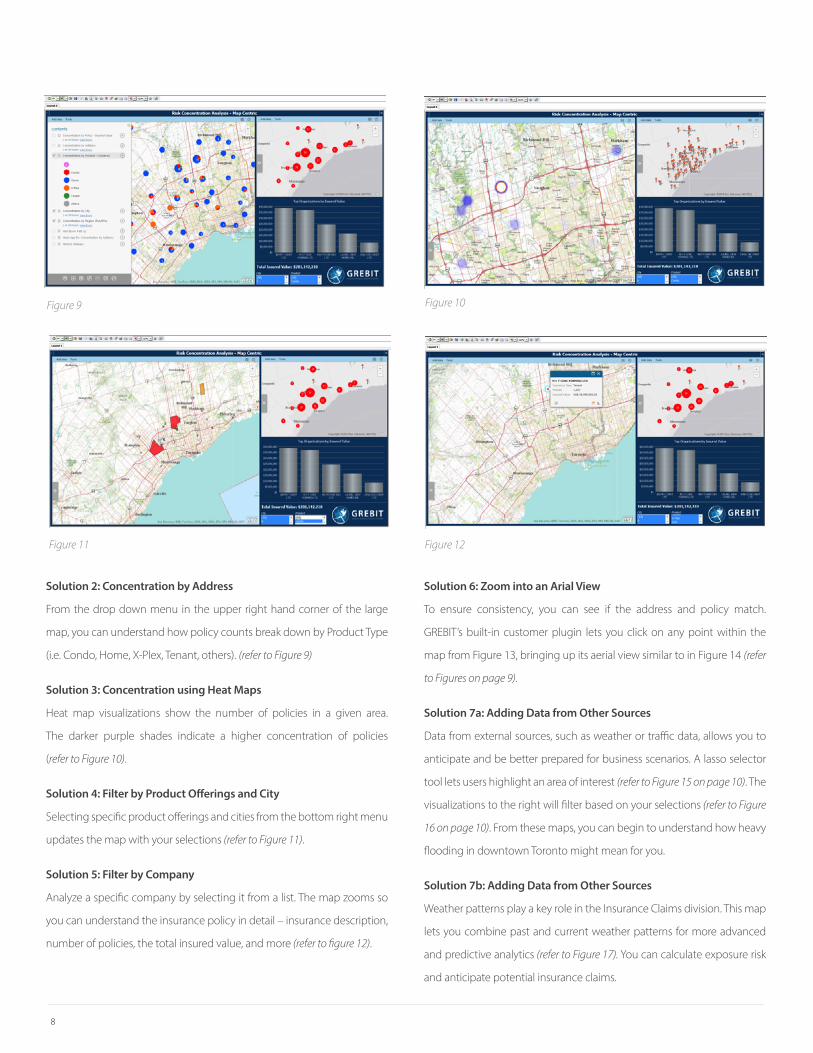
Solution 2: Concentration by Address
From the drop down menu in the upper right hand corner of the large
map, you can understand how policy counts break down by Product Type
(i.e. Condo, Home, X-Plex, Tenant, others). (refer to Figure 9)
Solution 3: Concentration using Heat Maps
Heat map visualizations show the number of policies in a given area.
The darker purple shades indicate a higher concentration of policies
(refer to Figure 10).
Solution 4: Filter by Product Offerings and City
Selecting specific product offerings and cities from the bottom right menu
updates the map with your selections (refer to Figure 11).
Solution 5: Filter by Company
Analyze a specific company by selecting it from a list. The map zooms so
you can understand the insurance policy in detail – insurance description,
number of policies, the total insured value, and more (refer to figure 12).
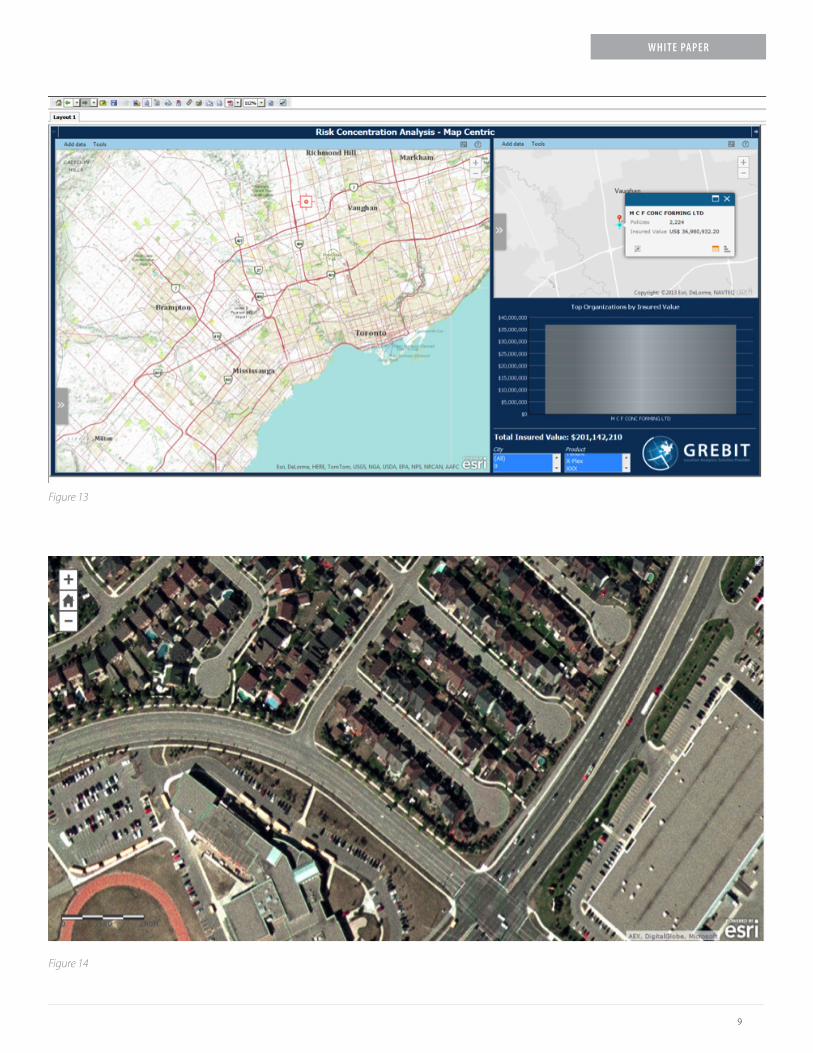
Solution 6: Zoom into an Arial View
To ensure consistency, you can see if the address and policy match.
GREBIT’s built-in customer plugin lets you click on any point within the
map from Figure 13, bringing up its aerial view similar to in Figure 14 (refer
to Figures on page 9).
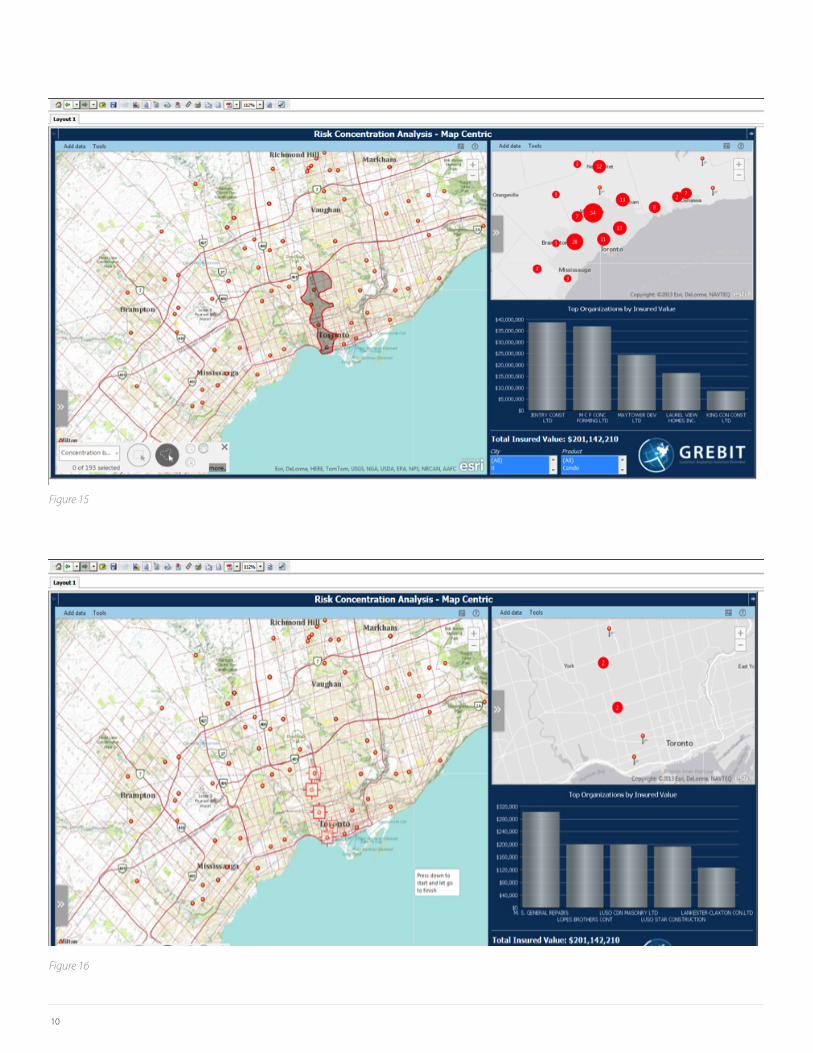
Solution 7a: Adding Data from Other Sources
Data from external sources, such as weather or traffic data, allows you to
anticipate and be better prepared for business scenarios. A lasso selector
tool lets users highlight an area of interest (refer to Figure 15 on page 10). The
visualizations to the right will filter based on your selections (refer to Figure
16 on page 10). From these maps, you can begin to understand how heavy
flooding in downtown Toronto might mean for you.
Solution 7b: Adding Data from Other Sources
Weather patterns play a key role in the Insurance Claims division. This map
lets you combine past and current weather patterns for more advanced
and predictive analytics (refer to Figure 17). You can calculate exposure risk
and anticipate potential insurance claims.
Figure 9 Figure 10
Figure 11 Figure 12
WHITE PAPER
9
Figure 13
Figure 14
10
Figure 15
Figure 16
WHITE PAPER
11
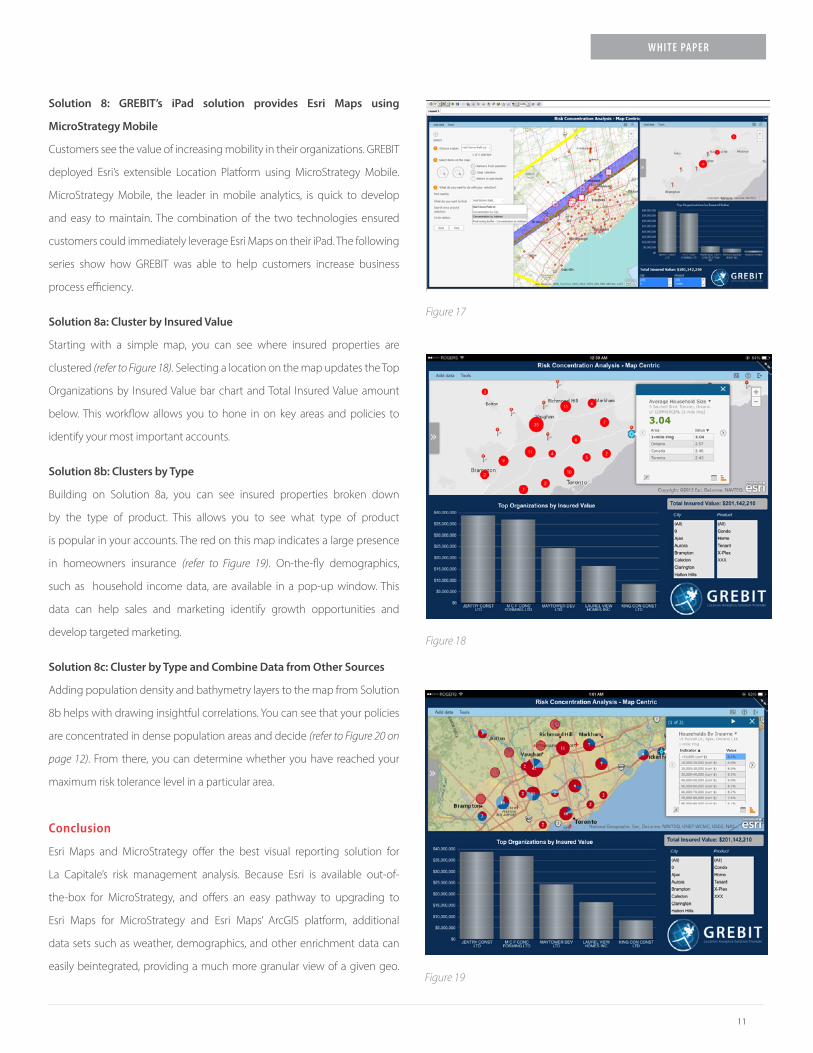
Solution 8: GREBIT’s iPad solution provides Esri Maps using
MicroStrategy Mobile
Customers see the value of increasing mobility in their organizations. GREBIT
deployed Esri’s extensible Location Platform using MicroStrategy Mobile.
MicroStrategy Mobile, the leader in mobile analytics, is quick to develop
and easy to maintain. The combination of the two technologies ensured
customers could immediately leverage Esri Maps on their iPad. The following
series show how GREBIT was able to help customers increase business
process efficiency.
Solution 8a: Cluster by Insured Value
Starting with a simple map, you can see where insured properties are
clustered (refer to Figure 18). Selecting a location on the map updates the Top
Organizations by Insured Value bar chart and Total Insured Value amount
below. This workflow allows you to hone in on key areas and policies to
identify your most important accounts.
Solution 8b: Clusters by Type
Building on Solution 8a, you can see insured properties broken down
by the type of product. This allows you to see what type of product
is popular in your accounts. The red on this map indicates a large presence
in homeowners insurance (refer to Figure 19). On-the-fly demographics,
such as household income data, are available in a pop-up window. This
data can help sales and marketing identify growth opportunities and
develop targeted marketing.
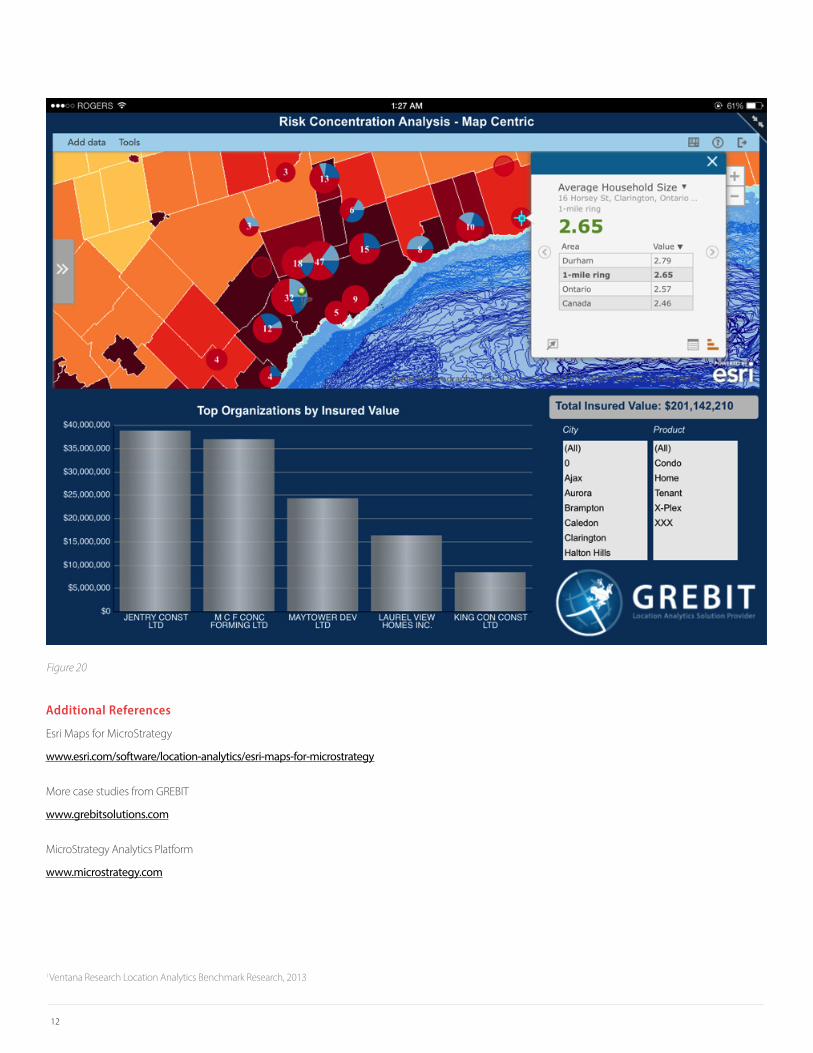
Solution 8c: Cluster by Type and Combine Data from Other Sources
Adding population density and bathymetry layers to the map from Solution
8b helps with drawing insightful correlations. You can see that your policies
are concentrated in dense population areas and decide (refer to Figure 20 on
page 12). From there, you can determine whether you have reached your
maximum risk tolerance level in a particular area.
Conclusion
Esri Maps and MicroStrategy offer the best visual reporting solution for
La Capitale’s risk management analysis. Because Esri is available out-of-
the-box for MicroStrategy, and offers an easy pathway to upgrading to
Esri Maps for MicroStrategy and Esri Maps’ ArcGIS platform, additional
data sets such as weather, demographics, and other enrichment data can
easily beintegrated, providing a much more granular view of a given geo.
Figure 17
Figure 18
Figure 19
12
Additional References
Esri Maps for MicroStrategy
www.esri.com/software/location-analytics/esri-maps-for-microstrategy
More case studies from GREBIT
www.grebitsolutions.com
MicroStrategy Analytics Platform
www.microstrategy.com
i Ventana Research Location Analytics Benchmark Research, 2013
Figure 20

Copyright InformationAll Contents Copyright © 2014 MicroStrategy Incorporated. All Rights Reserved.
Trademark InformationThe following are either trademarks or registered trademarks of MicroStrategy Incorporated in the United States and certain other countries: MicroStrategy, MicroStrategy 6, MicroStrategy 7, MicroStrategy 7i, MicroStrategy 7i Evaluation Edition, MicroStrategy 7i Olap Services, MicroStrategy 8, MicroStrategy 9, MicroStrategy Distribution Services, MicroStrategy MultiSource Option, MicroStrategy Command Manager, MicroStrategy Enterprise Manager, MicroStrategy Object Manager, MicroStrategy Reporting Suite, MicroStrategy Power User, MicroStrategy Analyst, MicroStrategy Consumer, MicroStrategy Email Delivery, MicroStrategy BI Author, MicroStrategy BI Modeler, MicroStrategy Evaluation Edition, MicroStrategy Administrator, MicroStrategy Agent, MicroStrategy Architect, MicroStrategy BI Developer Kit, MicroStrategy Broadcast Server, MicroStrategy Broadcaster, MicroStrategy Broadcaster Server, MicroStrategy Business Intelligence Platform, MicroStrategy Consulting, MicroStrategy CRM Applications, MicroStrategy Customer Analyzer, MicroStrategy Desktop, MicroStrategy Desktop Analyst, MicroStrategy Desktop Designer, MicroStrategy eCRM 7, MicroStrategy Education, MicroStrategy eTrainer, MicroStrategy Executive, MicroStrategy Infocenter, MicroStrategy Intelligence Server, MicroStrategy Intelligence Server Universal Edition, MicroStrategy MDX Adapter, MicroStrategy Narrowcast Server, MicroStrategy Objects, MicroStrategy OLAP Provider, MicroStrategy SDK, MicroStrategy Support, MicroStrategy Telecaster, MicroStrategy Transactor, MicroStrategy Web, MicroStrategy Web Business Analyzer, MicroStrategy World, Application Development and Sophisticated Analysis, Best In Business Intelligence, Centralized Application Management, Information Like Water, Intelligence Through Every Phone, Intelligence To Every Decision Maker, Intelligent E-Business, Personalized Intelligence Portal, Query Tone, Rapid Application Development, MicroStrategy Intelligent Cubes, The Foundation For Intelligent E-Business, The Integrated Business Intelligence Platform Built For The Enterprise, The Platform For Intelligent E-Business, The Scalable Business Intelligence Platform Built For The Internet, Office Intelligence, MicroStrategy Office, MicroStrategy Report Services, MicroStrategy Web MMT, MicroStrategy Web Services, Pixel Perfect, Pixel-Perfect, MicroStrategy Mobile, MicroStrategy Integrity Manager and MicroStrategy Data Mining Services are all registered trademarks or trademarks of MicroStrategy Incorporated.
All other company and product names may be trademarks of the respective companies with which they are associated. Specifications subject to change without notice. MicroStrategy is not responsible for errors or omissions. MicroStrategy makes no warranties or commitments concerning the availability of future products or versions that may be planned or under development.
Patent InformationThis product is patented. One or more of the following patents may apply to the product sold herein: U.S. Patent Nos. 6,154,766, 6,173,310, 6,260,050, 6,263,051, 6,269,393, 6,279,033, 6,400,265, 6,567,796, 6,587,547, 6,606,596, 6,658,093, 6,658,432, 6,661,340, 6,662,195, 6,671,715, 6,691,100, 6,694,316, 6,697,808, 6,704,723, 6,741,980, 6,765,997, 6,768,788, 6,772,137, 6,788,768, 6,798,867, 6,801,910, 6,820,073, 6,829,334, 6,836,537, 6,850,603, 6,859,798, 6,873,693, 6,885,734, 6,940,953, 6,964,012, 6,977,992, 6,996,568, 6,996,569, 7,003,512, 7,010,518, 7,016,480, 7,020,251, 7,039,165, 7,082,422, 7,113,993, 7,127,403, 7,174,349, 7,181,417, 7,194,457, 7,197,461, 7,228,303, 7,260,577, 7,266,181, 7,272,212, 7,302,639, 7,324,942, 7,330,847, 7,340,040, 7,356,758, 7,356,840, 7,415,438, 7,428,302, 7,430,562, 7,440,898, 7,486,780, 7,509,671, 7,516,181, 7,559,048, 7,574,376, 7,617,201, 7,725,811, 7,801,967, 7,836,178, 7,861,161, 7,861,253, 7,881,443, 7,925,616, 7,945,584, 7,970,782, 8,005,870, 8,051,168, 8,051,369, 8,094,788, 8,130,918, 8,296,287, 8,321,411, 8,452,755, 8,521,733, and 8,522,192. Other patent applications are pending.