why early prevention of childhood obesity is more than a ... · why early prevention of childhood...
TRANSCRIPT

Why early prevention of childhood obesity is more than a medical concern- A health economic approach
Diana Sonntag
Mannheim Institute for Public Health (MIPH), Medical Faculty Mannheim of Heidelberg University
Munich, 14 October 2016

Diana Sonntag I MIPH I Slide 2 von 24 14 October 2016
Is childhood obesity a concern?

Diana Sonntag I MIPH I Slide 3 von 24 14 October 2016
Future health and economic outcomes
Prevalence of childhood
obesity
Prevalence of adult obesity
Youth outcomes:
- Morbidity
- Social and mental health
- Educational attainment
Adult outcomes:
- Morbidity and mortality
- Social and mental health
- Economic (job)

Diana Sonntag I MIPH I Slide 4 von 24 14 October 2016
1. The economic burden of childhood overweight and obesity
2. Cost savings of interventions in early childhood
3. Cost-effectiveness of early prevention and best-practise guidance
4. Conclusions
Overview

Diana Sonntag I MIPH I Slide 5 von 24 14 October 2016
Direct and indirect costs due to …
1) Increased direct costs = medical costs • out- and in-patient costs etc.
2) Increased indirect costs • parental absence at work due to sick children • psychosocial problems • school absence related with - lower skill attainment, - lower overall educational performance (quantity
and quality of schooling) substantial later (work-related) productivity losses

Diana Sonntag I MIPH I Slide 6 von 24 14 October 2016
Existing Cost-of-illness (COI-) Studies
1. Overweight/obesity in adulthood Prevalence-based n=a lot, some from Germany: Wolfenstetter (2012)
von Lengerke & Krauth (2011) Konnopka et al. (2011)
Incidence-based n=some, none from Germany: Yang & Hall (2008) Tucker et al. (2006)
2. Taking childhood obesity into account Incidence-based only one from USA/Germany: Fernandes (2010) Sonntag et al. (2015a, 2016)

Diana Sonntag I MIPH I Slide 7 von 24 14 October 2016
CHILDREN (Age: 3-17)
ADULTS (Age: 18-75)
Model I (epidemiology)
Model IIa including normal weight children
Model IIb including overweight and obese children
Modelling lifetime costs of childhood overweight and obesity

Diana Sonntag I MIPH I Slide 8 von 24 14 October 2016
CHILDREN (Age: 3-17)
ADULTS (Age: 18-75)
Model I (epidemiology)
Model IIa including normal weight children
Model IIb including overweight and obese children
Modelling lifetime costs of childhood overweight and obesity

Diana Sonntag I MIPH I Slide 9 von 24 14 October 2016
Modelling lifetime costs of childhood overweight and obesity
Normalweight
Overweight
Obese
Normalweight (after overweight)
Overweight (after obese)
DEATH
LEGEND: tp_no: transition probability in normal weight to overweight tp_on: transition probability overweight to normalweight tp_oa: transition probability overweight to obese tp_Death_: mortaility rate rr_: relative mortality risk due to overweight and obesity
tp_Death * (rr)
tp_Death *(rr)
tp_oa
tp_no tp_on
Source: Sonntag et al. 2015a, 2016
Diana Sonntag I MIPH I Slide 10 von 24 14 October 2016
0%
10%
20%
30%
40%
50%
60%
70%
80%
90%
100%
3 8 13
18
23
28
33
38
43
48
53
58
63
68
73
78
83
88
93
98
Prop
ortio
n of
the
coho
rt
Age
Female
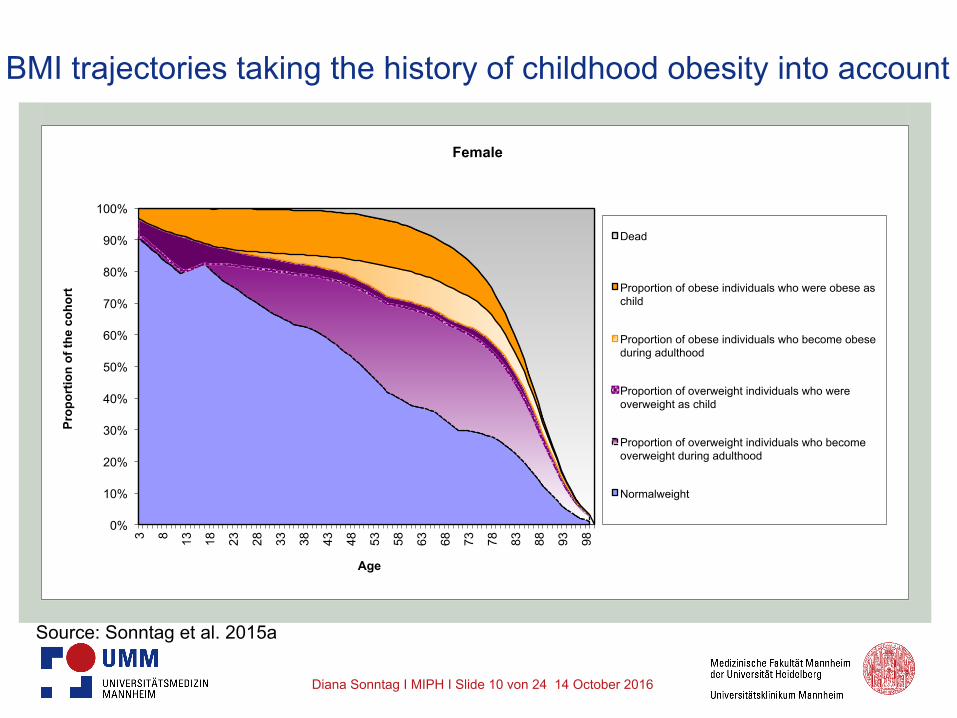
Dead
Proportion of obese individuals who were obese as child
Proportion of obese individuals who become obese during adulthood
Proportion of overweight individuals who were overweight as child
Proportion of overweight individuals who become overweight during adulthood
Normalweight
BMI trajectories taking the history of childhood obesity into account
Source: Sonntag et al. 2015a

Diana Sonntag I MIPH I Slide 11 von 24 14 October 2016
Direct excess lifetime costs of childhood overweight and obesity
Costs (€ 2010, without discounting) Male Female
Overweight/obese as child 21,804 27,673
Normal weight as child 7,281 8,194
Excess lifetime costs 14,524 19,479
Cost increased by a factor of ... 3 3 Proportion of cost occur after the age of 60 0.67 0.60 Source: Sonntag et al. 2015a

Diana Sonntag I MIPH I Slide 12 von 24 14 October 2016
Costs (€ 2010, discounted by 3%) Male Female
Overweight/obese as child 5,824 8,654
Normal weight as child 1,562 1,626
Excess lifetime costs 4,262 7,028
Cost increased by a factor of ... 4 5 Proportion of cost occur after the age of 60 0.44 0.32
Discount rate 3% p.a.
Direct excess lifetime costs of childhood overweight and obesity
Source: Sonntag et al. 2015a

Diana Sonntag I MIPH I Slide 13 von 24 14 October 2016
Costs (€ 2010, discounted by 3%) Male Female
Overweight/obese as child 5,824 8,654
Normal weight as child 1,562 1,626
Excess lifetime costs 4,262 7,028
Cost increased by a factor of ... 4 5 Proportion of cost occur after the age of 60 0.44 0.32
Direct excess lifetime costs of childhood overweight and obesity
Source: Sonntag et al. 2015a

Diana Sonntag I MIPH I Slide 14 von 24 14 October 2016
Costs (€ 2010, discounted by 3%) Male Female
Overweight/obese as child 6,164 3,140
Normalgewichtig als Kind 1,955 695
Excess lifetime costs 4,209 2,445
Cost increased by a factor of ... 3 4 Proportion of cost occur before the age of 60 0.81 0.79 Source: Sonntag et al. 2016
Indirect excess lifetime costs of childhood overweight and obesity

Diana Sonntag I MIPH I Slide 15 von 24 14 October 2016
0.00
500.00
1,000.00
1,500.00
2,000.00
2,500.00
3,000.00
child
hood
adul
thoo
d
child
hood
adul
thoo
d
child
hood
adul
thoo
d
child
hood
adul
thoo
d
child
hood
adul
thoo
d
child
hood
adul
thoo
d
child
hood
adul
thoo
d
11 - 20 21 - 30 31 - 40 41 - 50 51 - 60 61 - 70 71 - 80
Indi
rect
cos
ts in
€
Decade
Indirect costs due to childhood overweight Indirect costs due to childhood obesity
Indirect costs due to adulthood overweight Indirect costs due to adulthood obesity
Indirect excess lifetime costs of childhood overweight and obesity

Diana Sonntag I MIPH I Slide 16 von 24 14 October 2016
Economic burden of childhood overweight and obesity
Ø Excess lifetime costs of childhood overweight and obesity:
Ø Male: €8,471 Ø Female: €9,473
Ø Total cost for the current prevalent population in Germany: €1.8 billion.
Source: Sonntag et al. 2015a, 2016

Diana Sonntag I MIPH I Slide 17 von 24 14 October 2016
1. The economic burden of childhood overweight and obesity
2. Cost savings of interventions in early childhood
3. Cost-effectiveness of early prevention and best-practise guidance
4. Conclusions
Overview

Diana Sonntag I MIPH I Slide 18 von 24 14 October 2016
1. Preventive Programmes:
Ø Effects of most preventive programmes are small; short run treatment effects (Yavuz 2015, Fröschl et al. 2009, Galani and Schneider 2006)
Ø Prevalence reduction by 1% è €4.1 million cost savings for the current prevalent
population in Germany
Source: Sonntag et al. 2016
Cost savings of interventions in early childhood

Diana Sonntag I MIPH I Slide 19 von 24 14 October 2016
2. EvAKuj-Study: Prevalence reduction of 14% is potentially achievable
è indirect lifetime cost will be reduced by 4% (male) and 2% (female)
è €27 million cost savings for the current prevalent population in Germany (only indirect cost)
Cost savings of interventions in early childhood
Source: Sonntag et al. 2016

Diana Sonntag I MIPH I Slide 20 von 24 14 October 2016
3. Extreme Scenario: prevalence reduction of overweight and obesity to the
level of the 1990s
è €68 million cost savings for the current prevalent population in Germany (only indirect cost)
Cost savings of interventions in early childhood
Source: Sonntag et al. 2016

Diana Sonntag I MIPH I Slide 21 von 24 14 October 2016
1. The economic burden of childhood overweight and obesity
2. Cost savings of interventions in early childhood
3. Cost-effectiveness of early prevention and best-practise guidance
4. Conclusions
Overview
Diana Sonntag I MIPH I Slide 22 von 24 14 October 2016
Ø Growing body of literature about effectiveness of early childhood intervention:
Ø Blake-Lomb et al. (2016): Interventions for Childhood Obesity in the First 1,000 Days: A Systematic Review.
Ø Seburg et al. (2015): A review of primary care-based childhood obesity prevention and treatment intervention.
Ø Yavuz et al. (2015): Interventions aimed at reducing obesity in early childhood: a meta-analysis of programs that involve parents.
Ø Wang et al. (2015): What childhood obesity prevention programmes work? A systematic review and meta-analysis.
(Cost-)Effectiveness of early prevention

Diana Sonntag I MIPH I Slide 23 von 24 14 October 2016
But what about cost-effectiveness
of early prevention???
Cost-effectiveness of early prevention
Diana Sonntag I MIPH I Slide 24 von 24 14 October 2016
Ø Only few health economic evaluations of interventions during childhood.
Ø Most studies assess the cost-effectiveness of school programmes (6-13 years) (Yavuz et al 2015).
Ø The majority of school programmes is cost-effective è good value for money if cost of intervention are lower than 400$ and prevalence of obesity (overweight) has been reduced (increased) by 1% (Trasande 2010).
Cost-effectiveness of early prevention

Diana Sonntag I MIPH I Slide 25 von 24 14 October 2016
Source: Heckman 2006
Cost-effectiveness of early prevention

Diana Sonntag I MIPH I Slide 26 von 24 14 October 2016
Ø However: Only six international economic evaluations of early
prevention programmes targeting preschool children and/or their parents were conducted!
Ø 3 main characteristics (Doering et al. 2016): Ø Most programmes were cost-effective or even-cost saving
despite insignificant effect sizes, Ø Incremental-Cost-Effectiveness-Relations (ICER) differed
substantially, Ø Lifetime-perspective was chosen.
Cost-effectiveness of early prevention

Diana Sonntag I MIPH I Slide 27 von 24 14 October 2016
Ø Few studies have assessed the cost-effectiveness of early prevention (<3 years), majority of studies focussed on USA (Yavuz et al. 2015, Batrick and Reinhold 2010)
Ø Economic evaluation is only based on cost while effects are not included è partial economic evaluation.
Ø Compared to formula, significant cost savings of breastfeeding (€12,6 billion per year if 90% of U.S. women breastfeed) (Batrick and Reinhold 2010)
Need for future studies to assess the cost-effectiveness
of early prevention!
Cost-effectiveness of early prevention

Diana Sonntag I MIPH I Slide 28 von 24 14 October 2016
3 major reasons ... Ø Insignificant effect sizes, particularly when looking
at long-term effectiveness. Ø Conventional approaches to evaluate cost-
effectiveness are of limited use given the complexity of childhood obesity and obesogenic environments.
Ø Today´s common practise: Ø Focus on implemention of programs while economic
evaluations are often conducted after programs have been finished => retrospective economic evaluations tend to be imprecise.
Why the lack of economic evaluations?

Diana Sonntag I MIPH I Slide 29 von 24 14 October 2016
Urgent need for best-practise toolbox for efficient data acquisition:
1. Involve health economists in design phase of an intervention:
Since lifetime simulations require the measurement of longer run effects, the conduction of long-run interventions is needed.
Best-practise Guidance

Diana Sonntag I MIPH I Slide 30 von 24 14 October 2016
2. Involve health economists to collect and administer data alongside the trial e.g. design of standardised questionnaires to collect primary data Ø Standardised measurement of clinical outcomes
Ø However, good economic evaluations require other outcomes like well-being (children?)
Ø Measurement of cost is still a major concern Ø Development of a cost tool is need
(standardised measurement of direct and indirect cost before, during and after intervention)
Best-practise Guidance

Diana Sonntag I MIPH I Slide 31 von 24 14 October 2016
3. Conduction of pilot program; adaption of questionaires if necessary
4. Health economic monitoring and assessment of intervention
Ø Selection of parameter that measure effects? Ø Interpretation of health-economic results? Ø Validity (internal/external) of results? Ø Policy recommendations?
Best-practise Guidance
Diana Sonntag I MIPH I Slide 32 von 24 14 October 2016
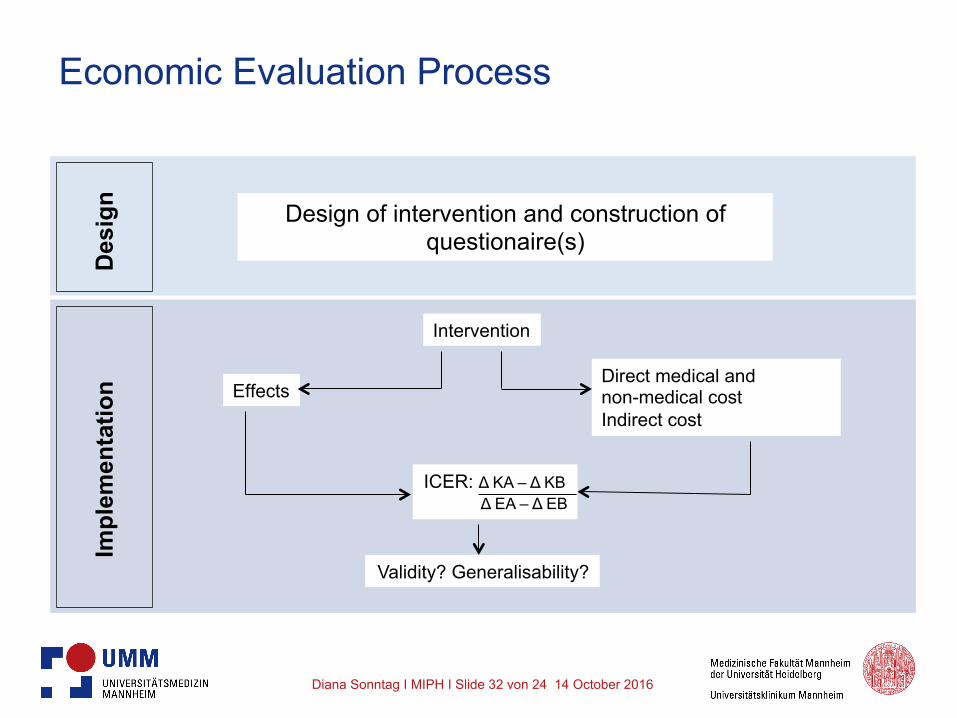
Economic Evaluation Process D
esig
n Im
plem
enta
tion
Design of intervention and construction of questionaire(s)
Intervention
Direct medical and non-medical cost Indirect cost
Effects
Validity? Generalisability?
ICER: Δ KA – Δ KB Δ EA – Δ EB

Diana Sonntag I MIPH I Slide 33 von 24 14 October 2016
1. The economic burden of childhood overweight and obesity
2. Cost savings of interventions in early childhood
3. Cost-effectiveness of early prevention and best-practise guidance
4. Conclusions
Overview

Diana Sonntag I MIPH I Slide 34 von 24 14 October 2016
Conclusions
Ø Transitions between overweight and obesity are particularly high in early childhood è early childhood seems crucial for preventive programs.
Ø Coordinate efforts between intervention developers, health care specialists and health economists in an effective fashion.
Ø Common use of best-practise toolbox for efficient data acquisition.

Diana Sonntag I MIPH I Slide 35 von 24 14 October 2016
• Bartick M., Reinhold A. The burden of suboptimal breastfeeding in the United States: a pediatric cost analysis, Pediatrics 2010; 125: e1048-56. • Doering N., Mayer S., Rasmussen F., Sonntag D. Economic evaluation of obesity prevention in early childhood: methods, limitations and recommendations, 2016, forthcoming International Journal of Environmental Research and Public Health, special issue Economics of Prevention and Treatment of Obesity. • Fröschl B, Wirl C, Haas S. Overweight prevention in adolescents and children (behavioural and environmental prevention). GMS Health Technol Assess 2009; 5: Doc05. • Galani C, Schneider H: Effectiveness of preventive and therapeutic interventions in overweight and obesity - A health technology assessment. In: Gesundheit Bf, (ed.). Basel: Health Econ AG 2006. • Heckman J. Skill formation and the economics of investing in disadvantaged children. Science 2006; 312: 1900-1902. • Konnopka A, Bodemann M, Koenig HH. Health burden and costs of obesity and overweight in Germany. Eur J Health Econ 2011; 12: 345-52. • Robert Koch Institute (RKI). The German Health Survey for Children and Adolescents 2003-2006. Public Use File 4. Version. http://dx.doi.org/10.7797/9-200306-1-1-4, 2013. • Singh AS, Mulder C, Twisk JW, van Mechelen W, Chinapaw MJ. Tracking of childhood overweight into adulthood. A systematic review of the literature. Obes Rev 2008; 9: 474-488.
Literature (I)

Diana Sonntag I MIPH I Slide 36 von 24 14 October 2016
• Sonntag D, Ali S, Lehnert T, Konnopka A, Riedel-Heller S, Koenig HH. Modeling the lifetime cost of child obesity in Germany, Pediatric Obesity 2015. • Sonntag D, Ali S, deBock F. Lifetime indirect cost of childhood overweight and obesity: a decision analytic model, forthcoming Obesity 2016. • Trasande L. How much should we invest in preventing childhood obesity? Health Affairs 2010, 372-378. • von Lengerke T, John J, Mielck A, et al. Excess direct medical costs of severe obesity by socioeconomic status in German adults. Psycho-social medicine 2010;7. • von Lengerke T, Krauth C. Economic costs of adult obesity: a review of recent European studies with a focus on subgroup-specific costs. Maturitas 2011, 69: 220-229. • Wolfenstetter SB. Future direct and indirect costs of obesity and the influence of gaining weight: results from the MONICA/KORA cohort studies, 1995-2005. Econ Hum Biol 2012;10: 127-138. • Yang Z, Hall AG. The financial burden of overweight and obesity among elderly Americans: The dynamics of weight, longevity, and health care cost. Health Serv Res Suppl 2008; 43: 849-868. • Yavuz H, Ijzendoorn M, Mesman J, van der Veek S. Interventions aimed at reducing obesity in early childhood: a meta-analysis of programs that envolve parents. Journal of Child Psychology and Psychiatry, 2015, 677-692.
Literature (II)

Diana Sonntag I MIPH I Slide 37 von 24 14 October 2016
Thanks a lot for your attention!

Diana Sonntag I MIPH I Slide 38 von 24 14 October 2016
Additional Slides

Diana Sonntag I MIPH I Slide 39 von 24 14 October 2016
Is childhood overweight and obesity a concern?
Ø Prevalence of overweight and obesity has nearly doubled in the last 20 years.
Ø In Europe: substantial increase over the last decade Ø In Germany (based on KiGGS; children aged 3-16 years):
6.2% overweight 2.9% obese
Ø Probability to have excess weight…
(Singh et al., Obesity Review 2008):
is the higher, the higher the weight during childhood. Relative risk of children: appr. 2-10
Ø 30% of obese adults were obese as child

Diana Sonntag I MIPH I Slide 40 von 24 14 October 2016
1. Obesity tracking from child- to adulthood
• Cohort is starting in age of 3 towards 17
• Markov cycle: 1 year
• Mortality rates are used from Federal Statistical Office
• Model additionally considers whether a child was normal weight or overweight before tracking into the next stage
Modelling lifetime costs of childhood overweight and obesity
Diana Sonntag I MIPH I Slide 41 von 24 14 October 2016
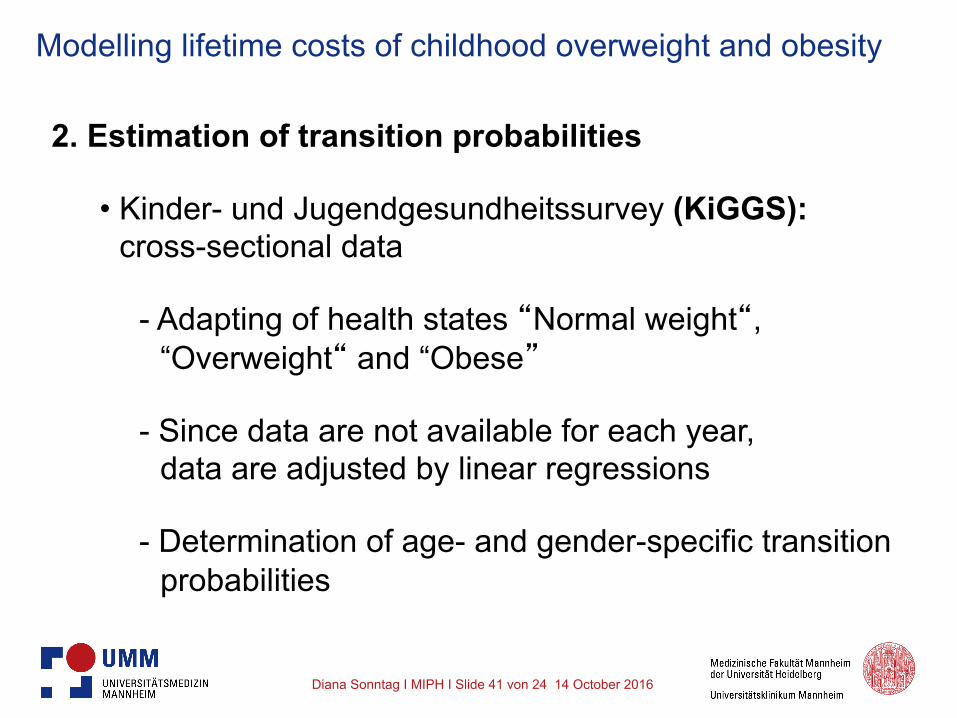
2. Estimation of transition probabilities
• Kinder- und Jugendgesundheitssurvey (KiGGS): cross-sectional data
- Adapting of health states “Normal weight“, “Overweight“ and “Obese”
- Since data are not available for each year, data are adjusted by linear regressions
- Determination of age- and gender-specific transition probabilities
Modelling lifetime costs of childhood overweight and obesity
Diana Sonntag I MIPH I Slide 42 von 24 14 October 2016
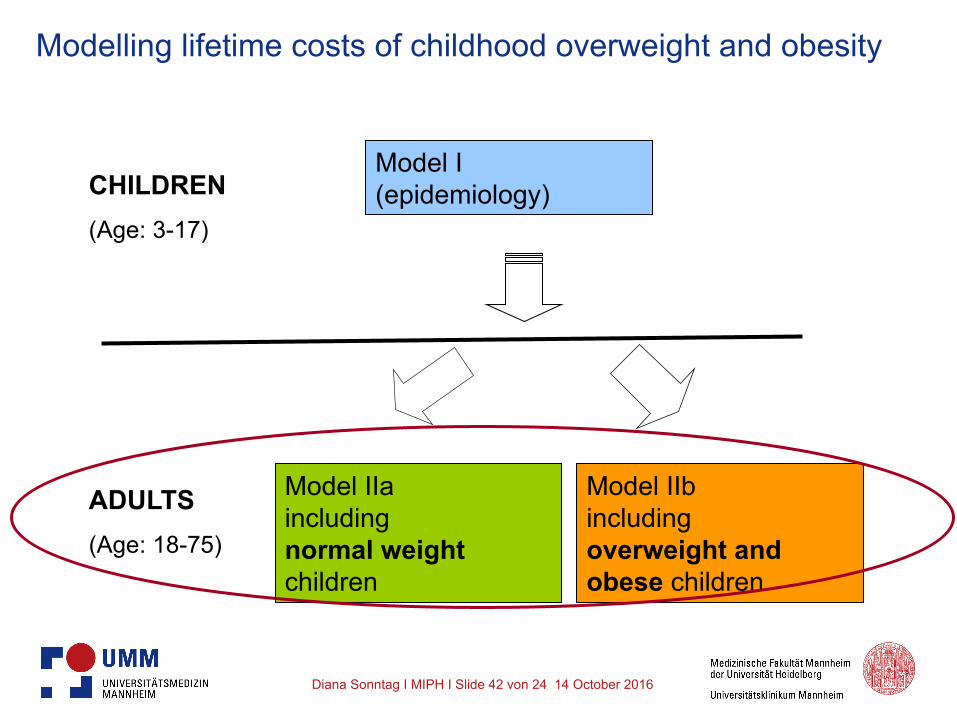
CHILDREN (Age: 3-17)
ADULTS (Age: 18-75)
Model I (epidemiology)
Model IIa including normal weight children
Model IIb including overweight and obese children
Modelling lifetime costs of childhood overweight and obesity

Diana Sonntag I MIPH I Slide 43 von 24 14 October 2016
NORMAL_post overweight/obese
DEATH
OVERWEIGHT_post overweight/obese
OBESE_post obese
tpDeath_ * rr-adult_o * rr_child_a
tpDeath_ * rr_adult_a * rr_child_a
tp_adult__no
tp_adult_oa tp_adult_ao
tp_adult__on
Modelling lifetime costs of childhood overweight and obesity

Diana Sonntag I MIPH I Slide 44 von 24 14 October 2016
Calculation of transition probabilities
where represents the prevalence of BMI category i at the age t+1, represents the prevalence of BMI category i at age t and represents the prevalence of BMI category j at age t.
( ), 1i tP BMI +
( ),i tP BMI
( ),j tP BMI
, 1 ,
,
( ) ( ) with ,
( )i t i t
jij t
P BMI P BMIj i
P BMIα + −
= ≠ (1)

Diana Sonntag I MIPH I Slide 45 von 24 14 October 2016
Calculation of transition probabilities
where represents the prevalence of BMI category i at the age t+1, denotes the prevalence of BMI category i at age t.
, , 1
,
( ) ( ),
( )i t i t
ii t
P BMI P BMIP BMI
α +−=
( ), 1i tP BMI +
( ),i tP BMI
(2)

Diana Sonntag I MIPH I Slide 46 von 24 14 October 2016
Pubmed752 EconLit
147 Googlescholar10,042 Cochrane
12 Interna>onal J. of Obesity
33 Obesity184 NHSEED
16 Public Health30
632 poten>al papers included into abstract review
10,584 papers excluded by >tle review
406 papers excluded by abstract review
226 poten>al papers included into full considera>on
58 German papers included into full-‐text review
-‐ 125 papers excluded due to non-‐German studies-‐ 43 papers excluded due to duplicates
6 papers included
52 papers excluded due to:-‐ 4 papers were systema>c review without providing cost informa>on-‐ 2 papers were focus on direct cost analysis-‐ 6 papers provided no economical data or indirect cost data-‐ 40 papers excluded due to irrelevant study informa>on

Diana Sonntag I MIPH I Slide 47 von 24 14 October 2016
Reference Site/Population size/Age Method Key Findings
Wolfenstetter et al. (2012)
Augsburg, 2581, 25-65y Two-part regression model
The average total indirect cost per person for those who stayed at the same BMIclass were €2,136 (Normalweight: 18.5<BMI<25), €2,909 (Overweight: 25<BMI<30)and €2,614 (Obese:BMI>30). An overweight person who becomes obese incuredcosts of €3,381 whereas an normalweight person who becomes overweight incuredcosts of €2,473.
Breitfelder et al. (2011)
Munich, Wesel, Bad Honnef and Leipzig, 3,508, 9-<12y
Two-part regression model
Mean annual indirect costs were €100 (Normalweight: P10-P90), €85 (Overweight:>P90 to P97) and €118 ( Obese>P97).
Konnopka et al. (2011) Germany, 15->90y
Population-Attributable Fraction
(PAF)
Obesity causes €5,019 million in indirect costs, of which €646 million were due tosick absence, €992 million were due to earliy retirement and €3,381 million weredue to morality.
Sander and Bergemann
(2003)Germany, ≥ 25y
Attributable Proportion in the
population (APpop)
Obesity causes €328 million in indirect costs, of which €150 million were due towork loss, €112 million were due to disability and €67 million were due to mortality.
Bödemann (2010) Germany, 15-90yPopulation-
Attributable Fraction (PAF)
Obesity causes €3,981 million in indirect costs, of which €504 million were due tosick absence, €605 million were due to early retirement, €2,710 million were due tomorality and €160 million were due to rehabilitation.
Knoll and Hauner (2008) Germany, 15-65y
Population-Attributable Fraction
(PAF)
Obesity cause €1,655 million direct cost, of which €582 million were due to disability, €760 million were due to inability to work and €313 million were due to mortality.

Diana Sonntag I MIPH I Slide 48 von 24 14 October 2016
3. Further data
• Prevalence data are used from the Microcensus 2009
• Mortality rates are used from Federal Statistical Office
• In order to determine relative risks (RRs) two literature reviews have been conducted: - Age-specific mortality RR associated with obesity or
overweight are used from the European Prospective Investigation into Cancer and Nutrition (EPIC-Study) - Adult mortality RR associated with obesity or overweight
in childhood used from Adami (2008)
Modelling lifetime costs of childhood overweight and obesity

Diana Sonntag I MIPH I Slide 49 von 24 14 October 2016
2. Costs
• systematic literature search (four electronic data bases, i.e., Medline, EconLit, National Health Service’s Economic Evaluation database (NHS EED), and the Cochrane Library).
• key terms “presenteeism”, “absenteeism”, “indirect costs” with “overweight”, “obesity” and “Germany”.
Modelling lifetime costs of childhood overweight and obesity

Diana Sonntag I MIPH I Slide 50 von 24 14 October 2016
Lifetime costs of overweight and obesity
0
1,000
2,000
3,000
4,000
5,000
6,000
18 20 22 24 26 28 30 32 34 36 38 40 42 44 46 48 50 52 54 56 58 60 62 64 66 68 70 72 74 76 78 80
Cumulative excess costs (million €)
Age
high SES (obesity) high SES (overweight) middle SES (obesity)
middle SES (overweight) low SES (obesity) low SES (overweight)

Diana Sonntag I MIPH I Slide 51 von 24 14 October 2016
Comparison with other COI-studies Sonntag et al. 2015a, 2016
Fernandes 2009
Brunello 2009 lifetime cost until age 55
Germany USA Europe
Proxy for incidence
Proxy incidence Incidence-based (long. Data SHARE)
Markov Model Monte-Carlo Sim., lifetable
Micro-simulation
Direct cost m 2.99 4.9 1.37
f 3.37 3.5
Indirect cost m 2.94 -----
f 3.85 -----
Excess direct lifetime cost (discount 3%)
€4,262-7,028
$18.999-$26.775
13,840 for obese versus non-obese in adulthood
Excess indirect lifetime cost (discount 3%)
€2,445 – 4,209

Diana Sonntag I MIPH I Slide 52 von 24 14 October 2016
Comparison with other COI-studies Sonntag et al. 2015a, 2016
Fernandes 2010
Brunello 2009 lifetime cost until age 55
Germany USA Europe
Proxy for incidence
Proxy incidence Incidence-based (long. Data SHARE)
Markov Model Monte-Carlo Sim., lifetable
Micro-simulation
Direct cost m 2.99 4.9 1.37
f 3.37 3.5
Indirect cost m 2.94 -----
f 3.85 -----
Excess direct lifetime cost (discount 3%)
€4,262-7,028
$18,999-$26,775
13,840 for obese versus non-obese in adulthood
Excess indirect lifetime cost (discount 3%)
€2,445 – 4,209

Diana Sonntag I MIPH I Slide 53 von 24 14 October 2016
Comparison with other COI-studies Sonntag et al. 2015a, 2016
Fernandes 2010
Brunello 2009 lifetime cost until age 55
Germany USA Europe
Proxy for incidence
Proxy incidence Incidence-based (long. Data SHARE)
Markov Model Monte-Carlo Sim., lifetable
Micro-simulation
Direct cost m 2.99 4.9 1.37
f 3.37 3.5
Indirect cost m 2.94 -----
f 3.85 -----
Excess direct lifetime cost (discount 3%)
€4,262-7,028
$18,999-$26,775
13,840 for obese versus non-obese in adulthood
Excess indirect lifetime cost (discount 3%)
€2,445 – 4,209

Diana Sonntag I MIPH I Slide 54 von 24 14 October 2016
Ø Today´s common practise: Ø Focus on implemention of programs while economic
evaluations are often conducted after programs have been finished => retrospective economic evaluations tend to be imprecise.
Ø Conduction of full economic evaluations of early prevention is patchy (most economic evaluations focus on costs while long-run effects are not measured).
Ø How can we interpret results of economic evaluations? Are the results valid?
Why the lack of economic evaluations?