why green roofs? connecting architecture and urban ecology
TRANSCRIPT
The Pennsylvania State University
The Graduate School
College of Arts and Architecture
WHY GREEN ROOFS? CONNECTING ARCHITECTURE AND URBAN
ECOLOGY, BALTIMORE, MD
A Thesis in
Landscape Architecture
by
Joseph V. Kurtz
© 2010 Joseph V. Kurtz
Submitted in Partial Fulfillment
of the Requirements
for the Degree of
Master of Landscape Architecture
May 2010
The thesis of Joseph Kurtz was reviewed and approved* by the following:
Larry Gorenflo
Associate Professor of Landscape Architecture
Thesis Adviser
Robert Berghage
Associate Professor of Horticulture
Bonj Szczygiel
Associate Professor of Landscape Architecture
Kelleann Foster
Associate Professor of Landscape Architecture
Head of the Department of Landscape Architecture
*Signatures are on file in the Graduate School
Why green roofs? Connecting architecture and urban ecology, Baltimore, MD.
Abstract:
The residential sector is typically viewed as being outside the green roof's
practical range. Cost, complexity, and the lack of a clear link between potential green
roof patches and green infrastructure all represent obstacles to living roof implementation
in this sector. This research addresses how building practices can connect with green
infrastructure and their potential to affect an urban ecosystem more broadly and how the
stormwater and habitat aspects of green roofs could motivate design. Green roof options
were modeled using geographical information system (GIS) technology across various
scales in order to highlight the environmental impacts such implementation might
produce in relation to stormwater runoff and habitat creation. By extrapolating research
into the effects of green roofs on stormwater, it is predicted that with 100% adoption a
residential greening program could reduce runoff from a 2-year design storm by 4.7%
citywide and 8% in the more densely developed inner-city neighborhoods. Further, 100%
adoption would reduce annual runoff by 4.5% citywide and 21% in neighborhoods such
as Upper Fell’s Point. In terms of the urban ecosystem, an analysis of landscape metrics
determined that a 52% adoption rate might begin to meet habitat requirements for one
species of butterfly, Hesperia, once endemic to the area. Roof design and implementation
options that might satisfy these regional stormwater and habitat requirements are
illustrated. With their highly impacted ecosystems and little available open space, urban
regions are particularly suitable for the application of such non-traditional building
practices. Underscoring the potential role that green roofs can play in environmental
remediation may help in improving green roof adoption rates in this sector.
TABLE OF CONTENTS
List of Tables v
List of Figures vi
Chapter 1 Introduction 1
Chapter 2 Baltimore 6
Chapter 3 The Rowhouse 9
Chapter 4 Green Roof Benefits 17
Chapter 5 Adoption Issues 22
Chapter 6 Stormwater Assessment 27
Chapter 7 Landscape Ecology 50
Chapter 8 Green Roof as Habitat 55
Chapter 9 Green Roof Design 84
Chapter 10 Concluding remarks 99
Works Cited 100
List of Tables
Table 6.1 Comparison of recent green roof stormwater studies 36
Table 6.2: Effect of various levels of green roofs on runoff 40
Table 6.3: Effect on runoff from a typical Rowhouse 41
Table 6.4: Comparison of predicted Annual Runoff Reductions 44
Table 9.1: Hesperia Habitat requirements 98
v

List of Figures
Figure 1.1 Baltimore residential densities 2
Figure 6.1 TR-55 Procedural Flowchart 37
Figure 6.2: TR-55 Formula for runoff (USDA 1986, 2-1) 38
Figure 6.3: Determining Curve Numbers (CN) (USDA 1986, 2-4) 39
Figure 6.4: TR-55 Time of Concentration (TOC) (USDA 1986, 2-4) 42
Figure 8.1: Hesperia comma and Hesperia leonardus 59
Figure 8.2: Baltimore city low/ medium density residential 64
Figure 8.3: Grid size comparison 67
Figure 8.4: Baltimore City and Upper Fell’s Point 68
Figure 8.5: Mean Nearest Neighbor (MNN) 70
Figure 8.6: Patch Size/ Patch Numbers/ Baltimore City 71
Figure 8.7: Number of Patches/ Patch Size/ Upper Fell’s Point 72
Figure 8.8: Green roofs corridor between Patterson Park and Fell’s Point 75
Figure 9.1: Green Roof Section 96
vi

1
Chapter 1: Introduction
“Progress in restoring the Chesapeake Bay will depend on the support of state and
local governments, the enterprise of the private sector, and the stewardship provided to
the Chesapeake Bay by all the people who make this region their home.” – President
Obama (Obama 2009)
Why install a green roof? As this latest incarnation of an ancient building practice
becomes increasingly more visible in the United States, many people are now asking this
question. An industry group recently ranked Baltimore as one of the top ten cities in the
U.S. for green roof implementation, behind Chicago and Washington (Lowitt 2009).
These surveys, however, often do not include the residential sector where finding
accurate statistics can be elusive, though firsthand accounting suggests there are few.
Despite evidence of the potential for green roofs to play a beneficial role in lessening the
impact of our built environment, residential implementation rates in this country remain
low.
Several issues can prevent green roofs from gaining broader acceptance in this
context. Higher initial costs and the perceived complexity of the installation and
maintenance techniques impede adoption, though recent improvements in design and
construction standards have begun to address these issues (Straus et al. 2006; Peck 2007;
Coffman 2009). In addition, on a regional scale, there is no established link between the
patches a residential green roof might create and a regional green infrastructure. Such a

2
link might motivate some otherwise reticent early adopters. Research and demonstration
programs will help make the future role of green roofs in the urban ecosystem clearer by
addressing issues currently preventing green roof adoption, particularly in the residential
sector which is currently seen as being outside their practical range.
Baltimore is the largest city in the Chesapeake Bay watershed. As in many other
post-industrial cities in the
U.S., the Baltimore region’s
population is growing, even as
the city’s census numbers
continue to decline. The
outmigration that has caused
this decline has influenced
Baltimore’s neighborhoods,
and their iconic rowhouses, in
different ways. Some
neighborhoods have emptied
out as residents flee crime,
poor schools and an aging
housing stock and head for the
suburbs. Other neighborhoods, particularly those surrounding the central core, have
experienced renewal, as the ‘creative classes’ (Florida 2004) return to the city. In some
parts of Baltimore’s these changes have resulted in vacancies and empty lots while in
Figure 1.1: Baltimore residential densities
3
others there have been waves of rehabilitation and reconstruction. Nevertheless, human
impact has been central to the changing nature and ecology of the city; both of these are
aspects where the rowhouse also has proved itself remarkably adaptable and particularly
suited to being repurposed. As the predominate architectural form in Baltimore and other
east coast cities, the rowhouse might also be used to service the new environmental
imperative (Pickett et al. 2008, 8).
These environmental concerns are being addressed at many levels. President
Obama’s recent update to the Clean Water Act (CWA) is evidence of the federal
government’s renewed commitment to the Chesapeake Bay. Originally enacted in 1948
and revised several times since, the CWA is a legislative mandate meant to address point
and non-point sources of pollution into our nation’s waters, though it has been unable to
increase the water quality of the Chesapeake Bay appreciably. The CWA, and its
renewed potential to help improve the Chesapeake Bay, is also an important component
of achieving the Baltimore City’s goal of having a fishable and swimmable Chesapeake
by 2020 (BC 2009).
Baltimore is dealing with many of the same issues faced by other Eastern U.S.
cities: an aging housing stock, an uncertain economic future and fundamental
environmental problems. Though all of these problems are often viewed as intractable,
they also present an opportunity to reconnect residents, their architecture and the
environment in a new ways. To that end, there has been considerable research into the
connections between poverty and health; the study of the links between the ecosystem
and health, however, have taken place only recently, though there are many indications

4
suggesting the two are deeply connected and that highlighting this link could play a key
role in improving city dwellers quality of life (Tzoulas et al. 2007). Bringing nature into
the city has traditional meant tree planting (Liu et al. 2003) though living roofs, and other
alternative technologies, are beginning to gain acceptance as a component of many urban
greening programs.
Significance
As Kate Orff writes, "If ‘sustainable development’ exists, it has a plan and
section, a plot and maintenance schedule, and we can refine it through trial and error"
(Orff 2005, 59). Green roofs are already a part of the discussion revolving around our
urban ecosystems and their long-term viability. This research explores ways to address
this connection, between green buildings and green infrastructure and to help further
integrate building, site and landscape. Green roofs are already tied to modern design in
some ways, most visibly in their mutual appreciation for flat roofs and Baltimore has no
shortage of these; they are the standard across the city. As a potential part of the city’s
infrastructure, green roofs might help in recreating districts and neighborhoods as
‘sustainable developments’ while they also contributing our cities overall green space as
a re-imagining of the hanging garden. Either way, green roofs and landscape architecture
will be part of any conversation concerning the environment, ecology and urban design
(Pickett et al. 2008).
Though comparatively young as a defined profession, landscape architecture has
from its beginnings in the 19th century been concerned with finding ways to connect sites

5
in a way that recognizes their importance in the regional context. Frederick Law
Olmsted’s “Emerald Necklace” is a good example; connecting parcels into a larger
network that contributes to the environmental health of Boston. At a larger scale, other
examples include our National Park system and the more recently established networks of
inter-city trails and greenways. To this end, one green roof and one rowhouse are going
to have little impact on the larger environment; however, if the positive effects of a wider
neighborhood greening program could be demonstrated it might provide further impetus
to all those involved to consider green roofs as a part of the community design process.
For property owners, promoting adoption might mean illustrating ways of
overcoming the perceived high cost, the perception of complexity and a lack of
connection to the environment. For policy makers, this might mean creation of
demonstration projects highlighting the potential benefits that might accrue from
incentive programs. For those in government interested in urban renewal efforts green
programs can be promoted as a source of employment as well as a way of increasing
quality of life. For members of the interested design professions, planners, architects,
landscape architects, and others, it could mean motivating outreach and education
programs, acting as a facilitator, coordinating actions between property owners and the
relevant government bodies and implementing best practices in design. Success in any of
these areas could place Baltimore alongside other cities, such as Portland and Chicago,
currently establishing precedents for environmentally sound urban design.

6
Chapter 2: Baltimore
Studying the relationship between politics and ecology proves worthwhile in
examining background of Baltimore, its cultural landscape, and its relationship to the
Bay. Baltimore is the largest city in Maryland, with an estimated population of 636,919
(USCB 2010). Though it has declined substantially from its post-war high, city planners
estimate the city population will remain fairly stable for the next four decades (DPW
2006, ii-4). Baltimore is the metropolitan core of a region that includes Anne Arundel,
Baltimore, Carroll, Harford, and Howard counties that together has 2,512,500 residents
(DPW 2006, ii). The city covers 92 square miles, 11 square miles of which are water.
Baltimore has a temperate climate with warm, humid summers when average high
temperatures near 90 degrees. January is the coldest month, with average temperatures in
the low 30’s. Average annual rainfall, which is fairly well distributed throughout the year,
is 41 inches. May is the wettest month, with an average of 3.7 inches (CityRating.com
2010). Like most other large cities on the east coast, Baltimore straddles a fall line, the
division between the Piedmont Plateau and the Atlantic coastal plain (DPW 2006, ii).
“Like the hundred or more earlier fiat towns of provincial Maryland, Baltimore
Town was designed essentially as a market place and entrepot (port city), where local
traffic could be carried on, imports be entered, exports be cleared and public dues and
taxes paid. It was endowed with no exception political or civil privileges, and had
virtually no organic life of its own” (Hollander 1899, 4). Baltimore was a planned city,
founded in 1729 by a contingent of successful farmers as a port for exporting the farm
produce and importing finished goods from England (Chapelle 2000, 4). Thus established
7
as a market for the produce of the larger country surrounding it, the town itself began to
grow slowly, but at the time of its founding, the parcel that would become Baltimore City
had only one resident, John Fleming, whose house was located where the Charles and
Lombard intersect today (Chapelle 2000, 4). In 1752, thirty years after its founding,
Baltimore had two hundred residents (Hollander 1899, 6).
Tidal marshes and oak forests once covered the site for this new city, on the north
side of the Patapsco River. Before colonization, its location on the bay made Baltimore a
crossroads of sorts for native peoples. One of these tribes was the Susquehannocks, after
whom the largest tributary of the Chesapeake Bay was named (Dill 2007).. They spoke
an Iroquoian language and were related to the tribes of the five nations of New York and
the Great Lakes. These and other tribes of the Chesapeake readily signed treaties with the
European colonists when they thought they could provide protection from their enemies.
Thus the country of the middle of Chesapeake Bay was a hotly contested border for the
native people, as it would be for European settlers into the nineteenth century (Dill 2007).
The Chesapeake is also the largest estuary in the United States, stretching 200
miles from the Bay Bridge to the Susquehanna River. The Bay’s 11,000 miles of
shoreline is longer than the entire West Coast. Half of the water in the estuary comes
from tidal flows from the Atlantic Ocean; the rest comes as runoff from its 64,000 square
mile watershed spreading across six states. The Bay watershed is home to over 17 million
people, the vast majority of whom live within minutes of a stream of river that feeds into
the Chesapeake. This growing population has impacted the watershed’s land cover in
8
numerous ways; forested areas have been reduced from 95% of the land area to 58%
today (CBP 2008).
Baltimore reached its peak in both industrial output and a population (949,708)
during the1950’s. Reflecting decades of suburbanization, Baltimore County, which had a
population of 270,273 in 1950, today is estimated to be home to 785,618 people (USCB
2009), surpassing that of the city it surrounds. Though it has been substantially reduced,
Baltimore’s position as the largest city in the Chesapeake Bay watershed has not
changed. The environmental effects of post colonization development are evident in
reduced capacity of the Bay to provide habitat. Capt. John Smith, one of the first
European explorers of this region, reported dense concentrations of fish. Early records
from fisheries listed enormous harvests, where “as many as 600 sturgeon could be caught
in a single haul” (Cronin 1987, 44). That fish is so rare now that catching one now lands
you on the front page. The legendary spring shad run, which once extended up the
Susquehanna river into lower New York, supporting fisheries the length of the river, is all
but gone (Cronin 1987, 44). The current state of the Chesapeake is a reflection of the
entire watershed, including Baltimore. Like other areas, the environmental trends here
have not been positive and as these urban regions continue to grow it becomes only more
imperative that we address ways to improve function and livability (Jabareen 2006, 38).
9
Chapter 3: The Rowhouse
This research focuses on residential buildings as a component of urban ecology,
and residential in Baltimore has historically meant rowhouses. The adoption of the
rowhouse form began before the industrial revolution, but it has proven itself adaptable
and it continues to demonstrate its utility in cities such as Baltimore that have embraced
the form (Hayward 2008). As a component of the urban ecology, rowhouse development
was tangentially responsible for most of the parks in Baltimore’s core. The rowhouse was
demonstrating the functionality of its form, across race and class divides, long before the
New Urbanists of recent years adopted it as their own (Hayward et al. 1999, 187).
Compact, built in dense, walkable neighborhoods, the rowhouse is capable of
accommodating a wide mix of uses. In addition to its role in the residential sector,
rowhouses also provide space for commercial and light manufacturing enterprises. The
global climate and energy crises are making green building alternatives a more important
part of our built environment. The rowhouse, as an integral component of the fabric of
this environment, needs to be a part of any debate about urban design.
History
The rowhouse form, so closely associated with Baltimore, Philadelphia and
Washington DC, was developed in England. The first rowhouses of London were built
for the wealthy residents of that rapidly expanding city beginning in the eighteenth
century and adapted for the growing number of workers migrating there during the start

10
of the industrial revolution. As the cities in the American colonies grew, the rowhouse
was used primarily in states with strong ties to Britain, such as Pennsylvania and
Maryland (Hayward et al. 1999, 13). And so it was in Baltimore, where housing evolved
in a manner similar to its development in London, being built first as housing for wealthy
city merchants and politicians and then filtering down through all levels of society as
working-class residents emulated their wealthier neighbors and adopted the rowhouse in
a scaled down fashion (Hunter et al. 1957; Hayward et al. 1999, 17-20).
The adaptability of the rowhouse form would be further demonstrated by its
ability to adopt changing architectural tastes. Federal, Greek Revival, Italianate, Queen
Anne, Gothic, and Neo-Colonial fashions all enjoyed periods of favor and were
sequentially imposed on the rowhouse beginning in the late 1700’s (Hayward et al.
1999). These various styles were expressed on the façade of each home by the addition of
bay windows, cornices, roof treatments, carvings and the differing building materials
applied by builders in anticipation of their buyers taste (Hayward et al. 1999, 3). This
ability of the rowhouse to adapt, to bend its form to the need at hand, has been confirmed
repeated since its debut in Baltimore.
Rowhouses and parks
The original founders of Baltimore made no provisions for public space; the idea
municipal park was still far off. It was not until 1839 that civic leaders realized the need
to preserve open space and Baltimore created its first public park, Green Mount Cemetery

11
on North Avenue, then the northern edge of the city (Hayward et al. 1999, 59). Patterned
after Mt Auburn in Boston, these 40 acres offered some relief for the nearby residents
since walking was the primary means of transportation during this period. The builders of
rowhouses recognized early on the important role open space could play in their business
and had begun setting aside green squares. Like the rowhouse itself, this practice was
adopted from the British (Mumford 1961; Stanton 1997, 33). Developers would
eventually cede ownership of these squares to the city. Houses on these public squares
sold for more than those on side streets and helped to establish a pattern that would be
repeated by builders throughout the city. Larger parks, such as Patterson Park and Druid
Hill, were established after portions of estates were set aside as open space by developers.
These parks would then be bought by the city and expanded. With the exception of
Federal Hill and Fort McHenry, both historical sites conveyed to the city by the federal
government, most the green space in Baltimore’s core area owes its existence to the
rowhouse developers (Hayward et al. 1999; CUERE 2003).
Rowhouses in the Public Sector
“Spatial structure partly reflects and partly determines the social structure. The
sheer permanence of the built environment means that the distribution of economic
rewards which creates a social structure at one period of time becomes fossilized in, say,
the housing situation, at a later period of time when the values and structure of the
distribution of the economic rewards in the society have changed” (Pahl 1975, 147).

12
Established in 1937, The Housing Authority of Baltimore, the predecessor of
today’s Department of Housing and Community Development (HCD), completed five
“projects” in the late thirties early forties, the first of which was the Poe Homes
(Hayward 2008, 249). These were all of a similar architecture, low-rises of two or three
floors very similar in scale and appearance to the standard rowhouses of the time. Built
with small front yards, these houses were laid out according to the grid pattern of
Baltimore, and blended well with its fabric. These projects replaced the slums they were
meant to replace, which often had poor access to transportation and limited green space.
Several of these early developments are still serving their original purpose today
(Gottlieb 1975) including the Poe Homes, which has outlived many of the more modern
attempts at improving the living conditions of the poor (Hayward 2008, 263).
Over the years the original citing decisions have continued to dictate where public
housing developments are built; as old projects become obsolete, they are demolished
and replaced with the newest architecture. The first projects built in the 1930’s mimicked
the rowhouse form; after the World War II, public housing adopted the modern high rise.
Today, public housing has gone full circle architecturally, adopting New Urbanist’s ideas
that include planned communities based around the townhouse, similar to the ideas that
have been institutionalized in the U.S. Housing and Urban Development’s (HUD) Hope
VI program. Henry Cisneros, HUD Secretary under President Clinton, was an outspoken
advocate for reshaping inner-city neighborhoods and was a strong proponent of the Hope
VI program. This program originally had five main objectives: (1) change the physical

13
shape of public housing; (2) reduce concentration of poverty; (3) provide support
services; (4) maintain high standards of personal responsibility; and (5) form
partnerships. All these objectives were designed to meet the overall goal of the program,
which is to create mixed-income communities for lower income groups (Gilderbloom
2008, 115). These goals are reminiscent of many previous federal programs that had
objectives beyond building good quality housing. Most of the HOPE VI developments in
Baltimore are built on the land formerly occupied by the notorious high-rises of the
1960’s and 70’s in order to satisfy one of the Hope VI programs funding requirements,
which require municipalities use these federal funds to replace existing substandard
housing units. Unfortunately, this means that these innovative housing units, new
rowhouses for the poor, are situated in historically underperforming landscapes. Even
though most HOPE VI projects are relatively new, it is not surprising that some early
reports are mixed, considering their marginal sites and the lack of attention to issues
beyond architecture. It remains to be seen if the rowhouses built as part of the HOPE VI
program will provide an improved environment for their residents. New Urbanism is,
however, a recognition of the suitability of traditional housing forms and patterns, such as
the Baltimore Rowhouse, to meet many of the goals sought after in the push for
sustainability (Jabareen 2006, 43).
While this new take on public housing is definitely viewed as an improvement on
the one provided by the modern high-rise tower, there will be continued debate about the
ability of architecture to provide a quick solution to societal problems decades in the
making. By disturbing established neighborhoods, “it is possible that HOPE VI leaves the
14
most vulnerable and poorest families in a worse condition than when they were living in
the public housing ghettos” (Gilderbloom 2008, 118).
Rowhouses and Sustainability
The meaning of sustainability is beginning to be addressed across various scales.
A 2006 study identifies seven categories which can be used across many levels of
landscape to identify the forms and patterns that most contribute to sustainability:
compactness, sustainable transport, density, mixed land uses, diversity, passive solar
design, and greening (Jabareen 2006, 38). The rowhouse complies with the first four
categories by design; built to make efficient use of land in an era when walking and the
streetcar were the primary modes of transport, this form also proved adaptable to a
mixing of uses, classes and even races as developers built a range of houses from the
main streets to the back alleys to create options for a wide range of inhabitants (Hayward
2008, 9). As for the remaining two, passive solar design and greening, the rowhouse has
shown itself to be readily adaptable (Gabrielle et al. 2001).
The rowhouse form might be employed to achieve many of the goals of
sustainability including energy efficiency, reducing dependency on the automobile, and
the reduction of sprawl by contributing to “livable and community oriented” communities
(Jabareen 2006, 48). Without substantial structural change, the rowhouse might easily be
adapted as an environmentally sensitive form as well. Flat roofs are more easily adapted
to reduce runoff than sloped roofs (Getter et al. 2007). As the advantages of traditional
15
neighborhood design becomes clearer, ecologists too are beginning to appreciate the role
they can play in aiding recovering ecosystems (Pickett et al. 2008, 9).
There are several reasons why more programs are not focused on smaller
residential projects, such as rowhouse. First, buildings are typically selected for green
roofing based on a ratio of building footprint to the surrounding of pervious surface. Big
box stores and other large commercial buildings are viewed as ideal for green roof
implementation, as they provide economies of scale and the necessary area to achieve a
substantial reduction in runoff. Runoff is not going to be effected appreciable by one
green roofed rowhouse in a watershed; however, a greening program on the
neighborhood scale might begin to have an impact. Additionally for a city with combined
sewer overflow (CSO) problems, residential green roofs offer a good potential
environmental return in that most of their site’s impervious surface area is comprised of
roof area. Reinvesting in urban infrastructure and forms such as the rowhouse through
greening programs will not only strengthen traditional communities, but might also help
prevent sprawl by making development in these areas more attractive. These sorts of
improvements should also encourage urban in-fill and ultimately contribute positively to
the ecology of the city and to the creation of a more “sustainable urban form” (Jabareen
2006, 43).
The rowhouse, at one time, was the preferred form for residential housing in most
cities of the east coast of the U.S., and it continues to prove itself particularly adaptable.
Some of the more successful public housing units in Baltimore were patterned after
rowhouses. Its simple construction lends it to a variety of architectural styles and

16
renovation techniques (Hayward et al. 1999, 181). Rowhouse builders understood this
and how important proximity to green space was to their financial success, leaving a
legacy of urban squares and small parks in Baltimore. The rowhouse form is by its very
nature one of the more sustainable architectural models available for single family
housing, one that has proven itself receptive to new ideas and green building techniques
(Gabrielle et al. 2001). Finally, where new buildings typically must justify their high
construction costs, older buildings like rowhouse are more flexible and open themselves
up to a wider variety of uses. “Old ideas can sometimes use new buildings. New ideas
must use old buildings” (Jacobs 1961).

17
Chapter 4: Benefits of Green Roofs
Sustainable roofing is not a new concept; in fact, all roofs installed before the
discovery of oil might be considered sustainable by today’s standards. Constructed of
locally available materials, such as thatch, clay tiles and slate, they were either long
lasting or easily recycled and could be replaced without harm to the environment. These
roofs were also part of a more holistic way of life where generations lived and worked in
the same structures, further lessening their impact. For a variety of economic and social
reasons, the majority of families in the U.S. now buy a new house at least once every five
years on average and 40 million Americans move every year. This transience has
changed the meaning of home for most Americans, the new definition of which focuses
largely on its value as a commodity. Calling attention to the potential environmental
benefits of one’s home might begin to change the way Americans view their houses.
Roof gardens, in different forms, have existed since ancient times. The green
roofs of ancient Rome and beyond have since evolved into a range of forms including
some that require considerable structural and design work to function properly. These are
often sited to create green space over parking garages and for the creation of elaborate
rooftop gardens. At the other end of the spectrum is the extensive green roof whose
modern incarnation originated in Europe. In parts of Germany, where green roof
construction subsidies are provided, as many as 10% of the buildings are greened
(Stender 2002, 10). Stuttgart requires living roofs on all new flat buildings and, with 22%
coverage, is considered the most heavily greened roofed city in the world (Velazquez
2003). These more affordable and ecologically oriented systems are the descendants of

18
the sod and turf roofs of Europe rather than the hanging gardens of Babylon. As a
distillation of the more elaborate forms, with thinner soil profiles, these retain most of the
environmental and economic benefits without the structural upgrades associated with
more elaborate systems which require considerably more planning in order to achieve the
desired effect (Oberndorfer et al. 2007; Weiler et al. 2009). Ultimately, the design of any
green roof will depend primarily on the function it is intended to provide. These potential
functions fall into three basic categories: environmental, economic, and social (Dunnett et
al. 2004; Weiler et al. 2009, 63).
Economic
Economic benefits can be realized through improved energy efficiency, reduced
waste material and increased roof membrane life (Dunnett et al. 2004, 68; Kosareo et al.
2006). The life span of a traditional roof membrane is reduced through exposure to the
elements, primarily by the effects of ultraviolet radiation (UV) and periodic fluctuations
in temperature. Buffering the roofing material from the effects of these elements can
double or triple the life of the membrane, though life cycle costs need to be calculated
over this extended period to recognize their advantage over traditional roofing
techniques.
Depending on the region, shading a building with a green roof can reduce heat
gain and summer energy consumption, though yearly averages depend on climate and do
not necessarily result in a net savings (Liu et al. 2003; Getter et al. 2006; Berghage 2010).

19
Since buildings consume the majority of electricity in this country, reducing consumption
during the peak summer months could result in a substantial overall reduction in usage
and reduce the need for additional electrical capacity (Liu et al. 2003; Getter et al. 2006,
1279; Berghage 2010).
Green roofs can contribute to meeting Leadership in Energy and Environmental
Design (LEED) standards and achieving accreditation. LEED certified office space could
often command a higher lease rate. For some tenants, such as the federal government for
instance, it is required. The General Services Administration (GSA) now requires all new
federal buildings be LEED certified silver or higher and this includes space leased on the
open market (GSA 2010). Green roofs can be a key component in achieving credits,
potentially contributing points in at least 17 categories. Additionally, the Sustainable
Sites Initiative (Sites), promoted by the American Society of Landscape Architects
(ASLA,) mentions green roofs specifically as fulfilling requirements in at least several
categories (Getter et al. 2006; ASLA et al. 2008; Carter et al. 2008; Kavanaugh 2009).
Though there are differing opinions on the effectiveness of institutional measures in
promoting sustainability, they are beginning to increase awareness of environmental
issues in the building and land development professions. LEED and the SITES initiatives
are also helping this country develop stronger green industries, creating jobs as they raise
environmental standards (Jacobs 1996, 245; Carter et al. 2006).
Currently, the regulatory environment is the main driver of green roof
construction, with the federal LEED requirements and local incentives and tax initiatives
giving the most impetus to new projects, but if energy prices continue to increase and as
20
construction techniques improve, decreasing the cost differential between traditional and
green roof options, the life cycle costs of green roofs should continue to decline over
time. Additionally, as the emphasis on reducing CSO’s gains momentum and stormwater
assessments, such as the one recently instituted in Philadelphia, become more prevalent
the ability of green roofs to affect runoff will gain real value.
Cultural
Though harder to quantify, the cultural benefits of green roofing at different
intensities has the potential to improve quality of life in urban areas. This is already
becoming evident in larger cities like New York, where a structural lack of open space
has lead to surge in roof greening projects (Tarquinio 2009). The social benefits that
accrue from living roofs are similar to those provided by any park or garden: creation of
additional green space and providing visual amenity. Though the green industry is
perhaps too young in this country to allow similar studies, research has shown that
traditional green space and parks raise the value of adjacent real estate prices (Crompton
2001). It is reasonable to assume that the presence of a green roof could have a similar
effect, creating a valuable amenity for not only the homeowner, but also for others in the
neighborhood. There is also mounting evidence that contact with nature is beneficial and
that even a view of such a scene can have a significant positive impact on human health
(Getter et al. 2006, 1279). Living in a noisy environment has many negative effects that
range from sleep loss to less obvious issues that result from increased stress (Getter et al.
21
2006, 1280). Planted surfaces absorb more noise than a traditional roof, reducing sound
pollution both those inside and out. Finally, making large cities more livable and inviting
will help slow sprawl and improve quality of life beyond the city line.
Environmental
This research focuses on the potential environmental effects a greening program
might have on stormwater and habitat creation. Other environmental benefits include
noise reduction and improved water and air quality. In certain climates, a substantial
greening program could contribute to the reduction of local temperature spikes, a
phenomenon known as the urban heat island (UHI) effect, caused by dark, impervious
surfaces (Dunnett et al. 2004, 43; Carter et al. 2008; Weiler et al. 2009). Though sloped
roofs are also subject to heat gained when exposed to sun, a flat roof will experience a
more dramatic increase due to constant exposure and increased conductivity due to
proximity to inhabited space (Weiler et al. 2009, 4). The rediscovery of green roofs as
means to mitigate the negative effects of our built structure began in Europe, where
political mandates foster implementation (Weiler et al. 2009, 1) In this country, where
building codes and ordinances regarding stormwater vary from state to state and from
municipality to municipality, implementation has relied on economic incentives or the
perseverance of architects and other practitioners (Weiler et al. 2009, 1). Of course, many
of the economic, cultural and economic aspects of any specific project will necessarily
overlap in proportions unique to each project’s intended function.

22
Chapter 5: Issues affecting Adoption
Although green roofs are beginning to gain widespread use in Europe, their
adoption the U.S. has been slower. A 2006 survey of midwestern architects and builders
concluded that while most understood the technical requirements, many misunderstood
the economic and performance aspects. Though many of the same issues that face
commercial builders impede adoption in the private sector, they do not necessarily
present universal obstacles to individual homeowners. The following were frequently
cited as the main obstacles to adoption among design professions:
Cost
Cost is seen as a primary reason green roofs have not gained wider acceptance in
this country (Cox et al. 2008, 1). Though there are many different claims about the ability
of green roofs to reduce utility bills, this is not universally true (Berghage 2010). As
installation costs decrease and with a continued escalation in energy prices, this situation
might one day change. The addition of stormwater fees, a program that is under review in
Baltimore City, might help further balance the cost equation (Wark 2004; Straus et al.
2006). Traditional greening programs, such as street trees, have demonstrated a positive
effect on property values, and tangential economic benefits such as these might be
expected from the addition of a green roof (Chamberlain 2005).
Other cost issues on the residential scale are of less concern and different than
those faced by planners of commercial or public projects. Insurance is simplified because

23
there is no public liability exposure. One potential insurance issue that is of concern
involves the builder/ installer and his or her ability to provide some guarantee over the
life of the roof. Financing on the residential scale is also simplified; whereas a
commercial project or one receiving public financing may need to explain or justify the
additional cost to tax payers or shareholders, the decision an individual makes about
taking on the additional cost of a green upgrades will be his/ hers alone and will involve
the spectrum of influences that could go into a decision of this nature (Weiler et al. 2009).
Complexity
Innovation can be defined as “an idea, practice or object perceived as new by an
individual or another unit of adoption” (Rogers 2003). Any new technology faces similar
obstacles to gaining wider acceptance. Three factors affecting adoption of innovation are
cited that relate to perceived complexity and these can become issues that prevent “early
adopters” from picking up on a new technology.
•Trialability – The ease with which potential adopters can try new technology without
complete commitment is an important factor in their decision process. The
installation of a green roof represents a significant undertaking and a long-term
commitment on behalf of a homeowner with little chance for recourse. The ability
to test applications of green roofs is currently limited and is closely related to the
following point.

24
•Observability – Opportunities for potential users to observe a new technology first hand
are important to potential adopters, allowing them to familiarize themselves with
it prior to buying in. The limited numbers of green roofs in the private sector are
generally inaccessible, so opportunities for consumers to experience living roofs
in-person are limited. Exposure is increasing through print media and the Internet,
but first-hand experience by the public is still limited. However, outreach and
demonstration projects, such as the ASLA green roof in Washington DC, that
allow consumers to view greening techniques first hand are beginning to gain
ground in some areas (Weinstein 2010). The ASLA
•Perceived Complexity – This category is self explanatory; any new technology that is
unfamiliar to potential users comes with a perception of complexity, which can
serve as an obstacle to further acceptance. Perceived structural issues, such as
increased load and membrane integrity, are often cited as barriers that prevent
green roofs from being further investigated. Many professionals accustomed to
traditional building techniques are wary of the additional load associated with
living roofs (Gedge et al. 2004, 28). Although certainly a real concern, it is one
reasonably addressed in new construction or through proper building surveys.
Maintenance requirements of green roofs are often misunderstood and are often
cited as an impediment; one British survey found that many potential respondents
viewed the maintenance requirements of a green roof as being similar in scope to
a “manicured park” (Gedge et al. 2004, 129). Through further exposure and
outreach efforts the unfamiliarity with this technology can be overcome and green

25
roofs have potential to become a do-it-yourself project for some homeowners
(Straus et al. 2006).
Ecological Connection
The environmental benefits of green roofs are becoming better known, but they
are not well understood. The connection that a green roof might make with surrounding
ecosystems is beginning to be made and the mitigation of stormwater runoff is
recognized where living roofs might have their greatest impact in this area (Berghage et
al. 2009). A single green roof, particularly on the residential scale, is going to have
negligible effect on even a small watershed; the idea becomes effective where many roofs
can begin to work together (Weiler et al. 2009, 63). A 2008 study proposes a strategy
based on policy initiatives that might be useful for achieving this goal. The first step
recommends identifying and demarcating areas that are best suited to the implementation
of a green roof program, whether it involves a demonstration program or some sort of
regulatory or subsidy program. After selecting a potential area, the authors recommend
developing and modeling a specific design solution appropriate to that selected areas
(Carter et al. 2008, 151).
Where ability of green roofs to mitigate stormwater are well recognized, their
capacity to serve as natural habitat is just beginning to be studied and even in Europe,
where adoption rates are much greater, this aspect is not well documented. However,
there is certainly at least a small role for green roofs to play in habitat creation. A small

26
connection in this area might contribute to adoption rates among some potential adopters
of this technology, as it falls into a quality of life category that is typically outside the
purview of any cost/ benefit equation. As environmental gains, such as those realized
through stormwater mitigation and habitat creation, become better understood, green
roofs will begin to gain a better standing among current building practices.

27
CHAPTER 6: Storm Water Assessment
The Stormwater Problem
According to Weiler, the “ greatest potential environmental and economic benefit
of green roofs lies in mitigating the impact of stormwater runoff from impervious
surfaces” (Weiler et al. 2009, 303). Stormwater is precipitation that moves along the
ground or across an impervious surface until it reaches a reservoir or other body of water.
Under natural conditions, precipitation from most storms would filter through soil held in
place by plant roots and enter the water table or runoff into streams relatively cool and
clear. With population growth, development, and suburbanization, these natural areas and
the important filtering function they once performed are being replaced by impervious
surfaces or disturbed soils. These human-impacted environments have greatly reduced
capacity for infiltration, resulting in heavy runoff during what might considered a normal
rainfall in the Baltimore region. This increased runoff creates special problems in
urbanized areas, where both development and in-fill have greatly increased the proportion
impervious surface area, further disrupting the natural hydrological cycle (Arnold et al.
2006, 243).
Storm water is also a concern in urban areas because it quickly washes a variety
of pollutants off impervious surfaces into nearby waterways. These pollutants include
hydrocarbons and other chemicals leaked from automobiles, road salts, and other solids
deposited on hard surfaces, solids that can contribute to sedimentation in the Chesapeake
28
Bay. Impervious surfaces, and the added runoff they create, can have an severe impact on
streams at relatively low percentages; streams whose watersheds are 10% impervious are
considered impacted and at 30% are considered degraded (Arnold et al. 2006, 246). 60%
of the land area of Baltimore City is considered either impervious or highly disturbed
(Pouyat et al. 2010). The Upper Fells Point neighborhood located to the east of
downtown is 95% impervious and roofs account for 41% of this total.
Stream burial is another issue in highly developed areas. A 2008 study concluded
that 70% of all headwater streams (defined as those with catchments less than 260 ha) in
Baltimore City were buried, reducing or eliminating their ability to remediate stormwater
runoff (Elmore et al. 2008). As a point of reference, the native brook trout begins to
suffer in streams whose watershed exceeds 2% impervious surface (NCI 2007, 2). The
remaining streams left exposed are subjected to erosive flows due to increased peak
runoff volumes during storm events. These increased flows alter the natural stream
channel geometry and degrade its ability to function as habitat (MDE 2000, 1.9). The
inability of rainwater to infiltrate soil also affects groundwater levels, which depend on
rainwater for replenishment. Healthy aquifers not only supply portions of the state’s
drinking water, but also provide a steady flow of clean water to the state’s streams and
rivers, a flow that is particularly important to the Chesapeake Bay in times of drought
(MDE 2000, 1.7).
In recent years, attitudes toward runoff in the urban settings have changed and
new techniques, including green roofs, are being tested to capture rain as close as
possible to where it falls in order to slow its progress into nearby waterways (Weiler et al.
29
2009, 32). The federal government and many states now outline requirements for runoff
quality and quantity for redevelopment sites and new construction and outline best
management practices (BMPs) for remediation of storm water on those sites (EPA 1999;
MDE 2000, 1.3; DEP 2006). These BMPs are often categorized as structural or non-
structural.
Examples of non-structural BMPs include ideas such as: changing commercial,
industrial and retail management practices to improve runoff quality; modifying the use
of fertilizers; pesticides and herbicides; increasing detection of illegal discharges;
instituting educational and outreach programs; and creating legislation to protect
environmentally sensitive areas from development. Structural BMPs include more
permanent features including: infiltration systems such as basins and porous pavement;
detention systems such as underground vaults; retention systems such as wet ponds and
green roofs; reconstructing wetland systems; and grass filter strips and vegetated swales
(EPA 1999, 2-2; MDE 2000).
These various approaches to runoff can positively effect the urban environment
in many ways, including diminishing the effects of runoff (Carter et al. 2006; Weiler et
al. 2009, 68). Since built structure and impervious surfaces cover a larger proportion of
urban areas than they might elsewhere, green roofs have a greater potential for impact in
such settings (Oberndorfer et al. 2007, 823). In the Baltimore area, like much of the
northeastern U.S., 85-90% of the annual rainfall comes in storms of one inch or less and
addressing these more frequent, but less intense events, has become an important strategy
for policymakers dealing with runoff issues in the urban context. By using roofs as part of
30
an array of BMP’s aimed at capturing that first one-inch of rainfall, referred to as the
90% rule, government and design professionals gain another tool for mitigating the
harmful effects of excessive storm water runoff (Carter et al. 2006; Weiler et al. 2009,
32).
Along with many other jurisdictions, Baltimore recognizes green roofs as a
component of the on-site rainwater treatment tools that also includes rain barrels and
gardens, cisterns, filter strips and tree planting (PPF 2004, v; Kloss et al. 2006). As a
recommended BMP for stormwater control, green roofs and other on-site treatments, are
effected by policies and regulations, both directly and indirectly, at the federal, state, and
local levels. A combination of these, including incentives for the funding of
demonstration or research projects, will play a necessary role in furthering development
the green roof industry until it becomes more widely accepted by and economically
competitive with traditional building practices (Carter et al. 2008, 151).
Federal Regulations
Recognizing the vital importance of the Chesapeake Bay, President Obama
recently issued an executive order authorizing the U.S. Environmental Protection Agency
(EPA) to seek new ways of using the power of the CWA to help improve water quality
and habitat in the Bay (Obama 2009). This latest update of the CWA is just one of many
amendments to this legislation since its inception in 1948. The CWA works in two ways;
one, it provides federal assistance to state and municipal bodies to assist in upgrading

31
sewage treatment plants and two, it defines the discharge requirements for those same
point source polluters. To that end, the CWA declares as illegal all discharges into public
waterways unless authorized by a permit. By continually tightening the permitting
process, the CWA has been the primary regulatory instrument addressing the complex
inventory of point source pollutants effecting this nation’s waterways, including the
Chesapeake Bay (Copeland 1999, 2). As traditional point source polluters are brought
into stricter compliance, the regulatory focus has shifted. Since the 1990’s non-point
source pollution - runoff from developed lands and agriculture - has been recognized as
having a greater negative effect on water quality in terms of nitrogen, phosphorus and
sediment contributions then traditional point source pollution (Kloss et al. 2006, 1; CBP
2008).
Obama’s recent executive order also gives new impetus to an organization known
as the Chesapeake Bay Program (CBP) to collaborate with state partners to help
implement strategies to restore and protect wetlands and streams critical to the Bay’s
function (Obama 2009, 3). The CBP, a regional watershed partnership, is renewing its
efforts to improve water quality in the Bay which despite years of effort, has shown little
if any improvement (CBP 2008, 2). The CBP functions by targeting various state
agencies within the Chesapeake watershed for priority funding based on need. In
Maryland, the CBP program has helped finance programs to address non-point source
pollution generated by agriculture and also to study BMP’s for urban areas (CBP 2008,
34).

32
Maryland Regulations
Several initiatives have been implemented at the state level to address the problem
of storm water runoff and non-point sources of pollution. The Maryland Stormwater
Design Manual was developed to help reduce the impact of urban runoff on the
Chesapeake by providing guidance on storm water BMPs, focusing on their
implementation and quality. The manual codifies formulas for calculating storm water
runoff, based on the EPA’s TR-55. This manual, identified in the Code of Maryland
Regulations as the primary reference for stormwater related issues in the state, stipulates
that any proposed improvements of sites maintain runoff characteristics that match, as
closely as possible, those existing pre-development (DPE 2010, COMAR 26.17.02).
In addition to new regulations regarding runoff from redevelopment sites, the
statewide planning initiative known as “Smart Growth” directs future development into
areas of existing infrastructure and away from environmental sensitive or agriculturally
important areas (MDP 2007, 2). The principles outlined in smart growth, along with
stricter regulations covering storm water, provide added incentives for Maryland
developers to look closer at innovative stormwater BMP’s in order to reduce runoff
(MDE 2000; MDP 2007). Another statewide program with potential to effect green
adoption in the future is BayStat. Created in 2007 by order of the Governor, BayStat is a
state wide initiative designed to bring together research and data collected by the
Departments of Agriculture, Environment, Natural Resources and Planning to evaluate
restoration programs and adopt milestones to help gauge progress in Bay clean up efforts
(O'Malley et al. 2007; O'Malley 2009). Though this program now primarily focuses on

33
natural areas and agricultural practices, it does include targets for reducing effluent from
14 of the state’s wastewater treatment plants by upgrading their capacity for removing
nutrients. The BayStat program also addresses storm water, seeking to increase
implementation of systems to mitigate the effects of non-point source pollutions through
both structural and non-structural practices (O'Malley 2009, 6).
Baltimore Regulations
Just as it was with transportation, electricity and residential parks, the city’s
founders relied on the public sector to provide sanitary services. Some wealthy
homeowners were able to afford underground conveyance to move their waste downhill,
but most relied on cesspits, emptied by local workers tasked with removing the nightsoil.
Concern for the reputation of the Bay oysters, which at the end of the nineteenth century
supported an industry that employed 24,000 oystermen and canners, ultimately led to
plans for building filtration plants rather than continuing to dump wastewater in the
Chesapeake. Baltimore was one of the last cities on the east coast to build a
comprehensive sewer system; planning for the sewers began in 1905 and the first section
was completed in the 1910’s (Boone 2003, 151-164). At that time it was impossible for
its designer to predict the growth of the city and the surrounding region and current
managers are tasked with upgrading a system whose major components are close to 100
years old. The Baltimore Central System, as it is known, delivers 241 million gallons of
filtered water per day to 1.6 million customers in a region covering 291 square miles and

34
expects to be able to keep pace with demand through 2025 (DPW 2006, III-1). The City
operates two filtration facilities, the Back River and the Patapsco Wastewater Treatment
Plants. Together, these plants treat up to 250 million gallons of wastewater per day.
Including some of the lines laid down in the early nineteenth century, the Bureau of
Water and Wastewater maintains 3,100 miles of sanitary mains, with 8 major and 6 minor
pumping stations (DPW 2006, IV-10; BWW 2010).
Due to an increased understanding of the hydrologic cycle and with the
imposition of several legislative mandates due to combined sewer overflows, the city
government has begun to address its aging storm water system in its planning process
(Isaacs 2002, 1). The most recent comprehensive water and sewer plan (DPW 2006),
includes support for smart growth. Baltimore manages the region’s primary reservoirs,
Prettyboy, Loch Raven, and Liberty, and also provides water and sanitary services to the
metropolitan area which gives the city a vested interest in smart growth (DPW 2006, III-
2). Improving existing systems and protecting water quality are mentioned as core
principles in Baltimore’s water and sewer plan. To accomplish this, the city has begun
studying the possibility of creating a stormwater utility, with power to assess fees related
to stormwater runoff, and has included reduction of impervious surface area as part of its
recent sustainability plan (Stosur et al. 2009, 46).
35
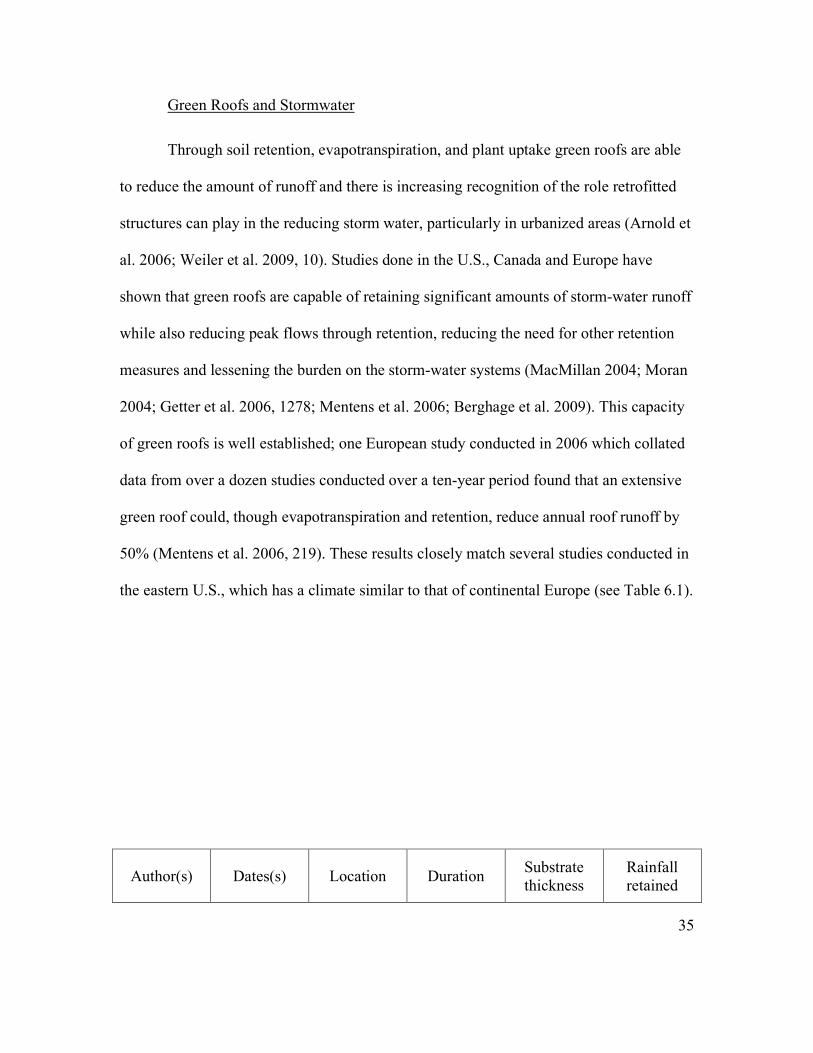
Green Roofs and Stormwater
Through soil retention, evapotranspiration, and plant uptake green roofs are able
to reduce the amount of runoff and there is increasing recognition of the role retrofitted
structures can play in the reducing storm water, particularly in urbanized areas (Arnold et
al. 2006; Weiler et al. 2009, 10). Studies done in the U.S., Canada and Europe have
shown that green roofs are capable of retaining significant amounts of storm-water runoff
while also reducing peak flows through retention, reducing the need for other retention
measures and lessening the burden on the storm-water systems (MacMillan 2004; Moran
2004; Getter et al. 2006, 1278; Mentens et al. 2006; Berghage et al. 2009). This capacity
of green roofs is well established; one European study conducted in 2006 which collated
data from over a dozen studies conducted over a ten-year period found that an extensive
green roof could, though evapotranspiration and retention, reduce annual roof runoff by
50% (Mentens et al. 2006, 219). These results closely match several studies conducted in
the eastern U.S., which has a climate similar to that of continental Europe (see Table 6.1).
Author(s) Dates(s) Location Duration Substrate thickness
Rainfall retained
36
Berghage et al 2009
Jan-Nov 2005
Centre County 11 months 3.5 - 4" 50%
Moran et al 2005 Goldsboro, NC 18 months 3" 63%
Moran et al July/Sept 2004
Goldsboro, NC 3 months 4" 55%
Carter 2006 11/2003-11/2004 UGA 12 months 3" 78%
DeNardo et al 2005
Oct/Nov 2002
Centre County 2 months 3.5" 45%
MacMillian 2004
May-Nov 2003 Toronto 6 months 5.5" 55%
Mentens 2004 Various Brussels,
Belgium 10 years 3-4 " avg 54%
Lui 2003 April -Sept 2002 Ottawa 6 months 6" 54%
Table 6.1 Comparison of recent green roof stormwater studies.
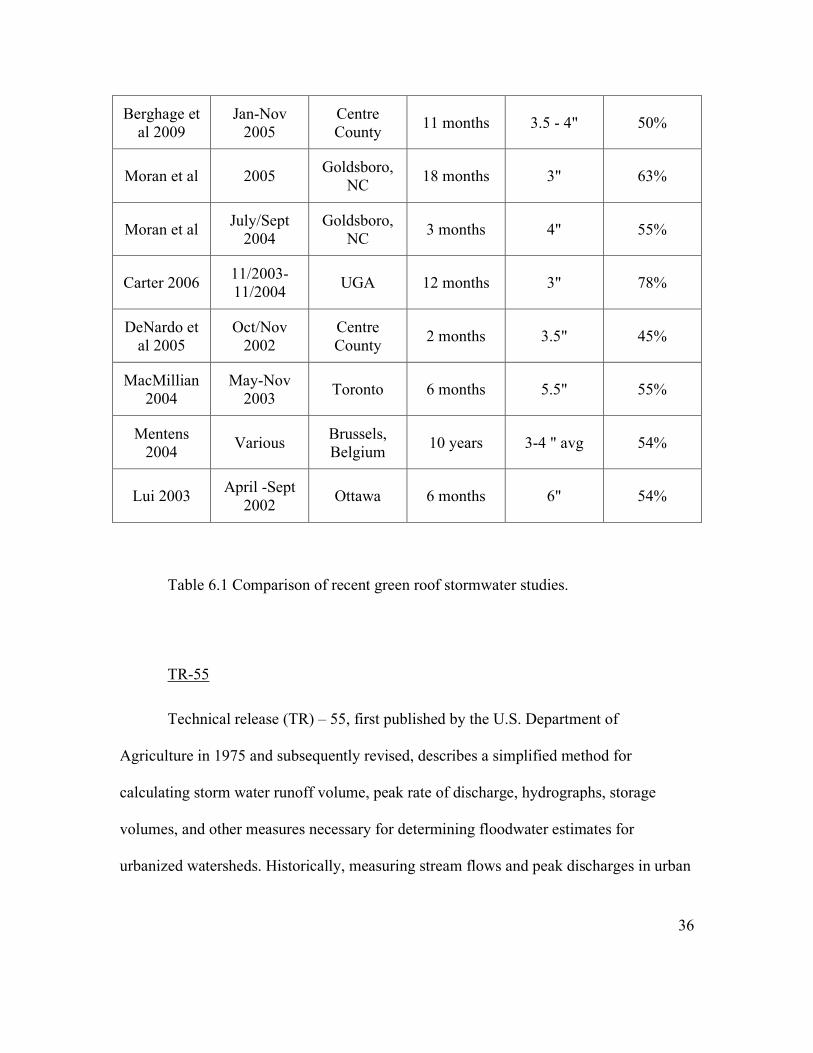
TR-55
Technical release (TR) – 55, first published by the U.S. Department of
Agriculture in 1975 and subsequently revised, describes a simplified method for
calculating storm water runoff volume, peak rate of discharge, hydrographs, storage
volumes, and other measures necessary for determining floodwater estimates for
urbanized watersheds. Historically, measuring stream flows and peak discharges in urban
37
areas has been difficult due to the lack of data on urban streams and constantly changing
land uses (Cronshey et al. 1986). TR-55 simplifies estimation of storm water in urbanized
areas by using a hydrological model based on knowledge of land cover types and rainfall
amounts. TR-55 contains several procedures for estimating storm water based on the site
and required output (see figure 6.1).
Figure 6.1 TR-55 Procedural Flowchart (USDA 1986)
Because of this ability to describe storm water discharges for a given watershed
within an acceptable margin of error, the TR-55 model is widely used in municipal storm
water manuals, includes Maryland’s (MDE 2000, 2-4). For these reasons, TR-55 was
used in this research to estimate the effects a green roof program might have on
components of runoff and time of concentration on the Inner Harbor watershed for a 2-
year/ 24 hour design, which for Baltimore City measures 3.2 inches as well as 100-yr/ 24
hr rainfall of 7.1 inches (MDE 2000, 2-11).
38
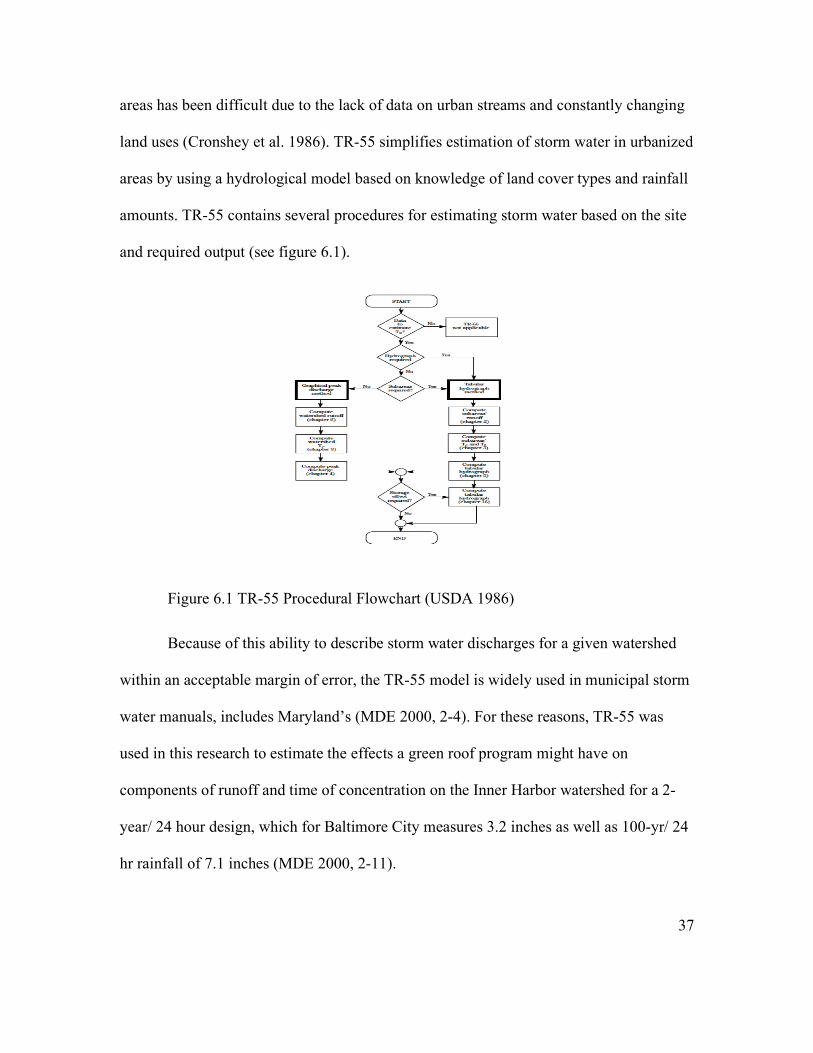
TR-55: Estimating Runoff
!
Q =(P " Ia)
2
P " Ia( ) + S where
!
S =1000
CN"10
Q = Runoff (in)
P = Rainfall (in)
S = Potential maximum retention after runoff begins
CN (per TR-55 categories)
Ia = Initial abstraction (0.2S)
(Figure 6.2: TR-55 Formula for runoff (USDA 1986, 2-1).
Runoff is determined using a formula based on rainfall totals and runoff curve
numbers (CN.) The CN represents the hydrologic function of the soil and soil cover; the
overall curve number for a given area is determined by calculating a weighted average of
all the constituent parts of that area. TR-55 provides a flowchart for determining the
appropriate method for calculating CN for a given area (see figure 6.3).

39
Figure 6.3: Determining Curve Numbers (CN) (USDA 1986, 2-4)
The curve numbers for Baltimore were based on a weighted average of estimated
soil profiles and cover types using TR-55 and a report prepared for the Baltimore
Ecosystem study (Pouyat et al. 2010). A weighted curve number was estimated for
Baltimore City using just two land cover classifications:

40
1) Urban District soil group B (CN 92) for impervious areas and roads
2) Open space soil group B (CN 79) for the remaining parks and vegetated areas
Comparative curve numbers predicted by Jarrett et al using a 3-inch extensive
roof were used to estimate the impact of green options, projecting that an extensive green
roof could replicate the pre-existing land cover conditions modeled using CN=79 (Jarrett
et al. 2006, 9). Runoff was calculated for various levels of green adoption at both the city
scale, for the Inner Harbor Watershed, and for an average roof in the study area.
At 100% adoption, green roofs were able to capture up to 4.72% additional runoff
from a 2-year storm across the city while in the more densely developed Inner Harbor
Watershed that number rose to 8.02% (see table 6.2).
Study Area Design Storm Green Roof Rate Reduction Rate
0% 0.00% 5% 0.24% 20% 0.96% 50% 2.38% 100% 4.72%
Balt. City 2yr/ 24 hour
Predevelopment 98.44% 0% 0.00% 5% 0.41% 20% 1.64% 50% 4.07% 100% 8.02%
Inner Harbor 2yr/ 24 hour
Predevelopment 98.62%
Table 6.2: Effect of various levels of green roofs on runoff
41
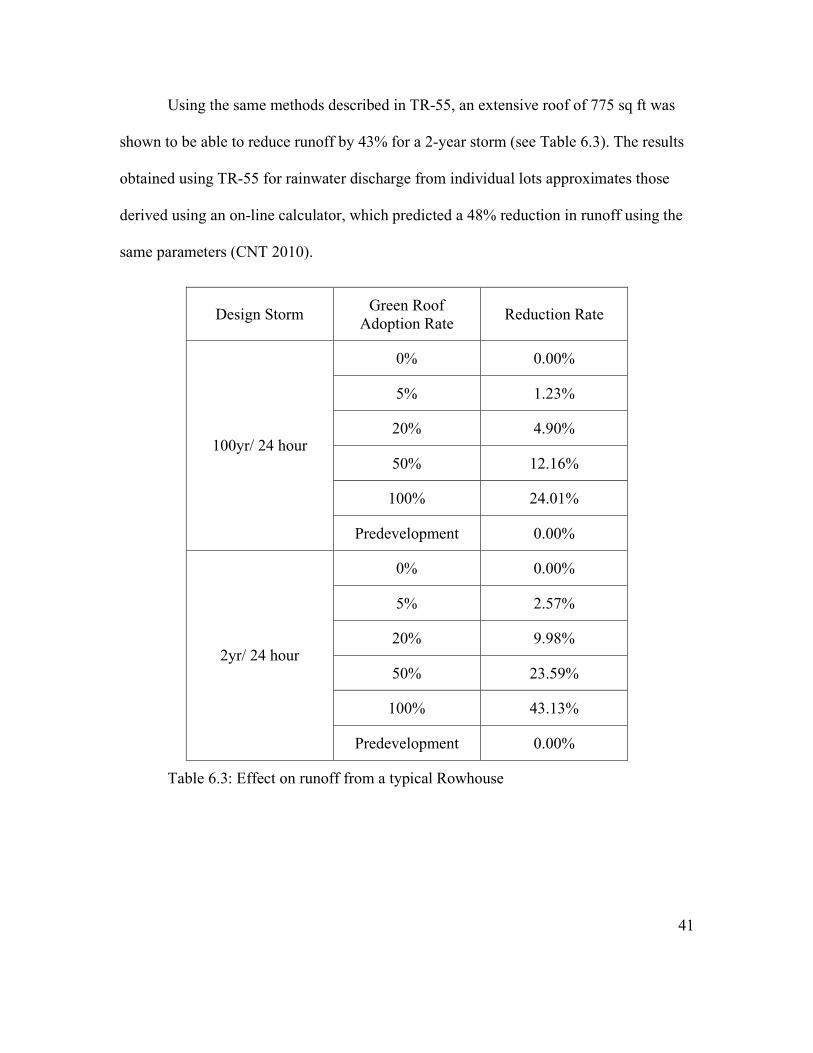
Using the same methods described in TR-55, an extensive roof of 775 sq ft was
shown to be able to reduce runoff by 43% for a 2-year storm (see Table 6.3). The results
obtained using TR-55 for rainwater discharge from individual lots approximates those
derived using an on-line calculator, which predicted a 48% reduction in runoff using the
same parameters (CNT 2010).
Design Storm Green Roof Adoption Rate Reduction Rate
0% 0.00%
5% 1.23%
20% 4.90%
50% 12.16%
100% 24.01%
100yr/ 24 hour
Predevelopment 0.00%
0% 0.00%
5% 2.57%
20% 9.98%
50% 23.59%
100% 43.13%
2yr/ 24 hour
Predevelopment 0.00%
Table 6.3: Effect on runoff from a typical Rowhouse

42
TR-55: Time of Concentration
!
Tc = Tt1
+ Tt1
+ ...Ttm
where
!
Tt =L
3600V
Tc = Time of Concentration
L = Flow Length
V = Average Velocity (ft/sec)
Figure 6.4: TR-55 Time of Concentration (USDA 1986, 3.1)
Time of concentration (TOC) is a measure of the time it takes stormwater to travel
from one point in a watershed to another. The path the water takes is referred to as the
flow length. TOC is a sum of all the different flow lengths categories that contribute to
the overall length of the flow being measured. Components of the flow length are
categorized as sheet flow, shallow concentrated, or open channel flow. Sheet flow
describes that portion of the flow length usually nearest the source and is characterized by
a coefficient of roughness that corresponds with the surface type and helps refine the time
of concentration estimates for small areas. After 300 feet, sheet flows become either
shallow concentrated flows or open channel flow depending on the topography. Shallow
concentrated flow is defined as one that enters an irregular drainage way. Open channel
indicates a known stream or other permanent water conduit (MDE 2000, 3-1; Miller
2005).
Time of concentration was calculated to determine the effect a green roof would
have on a typical sewershed in the Upper Fell’s Point neighborhood, with 320 feet used
as the typical flow length (the distance from the roof to the sewer inlet.) This average is
43
an approximation based on the number of sewer inlets in Baltimore, 33,000, and the total
land area (DPW 2007). Considering the entire flow length as a shallow concentrated
system, the time of concentration for this flow length with a traditional roof system
would be 6 minutes. (0.1 hour, 6 minutes, is the minimum unit of time used in the TR-55
manual; the actual estimated time of concentration using these methods was 3.6 minutes.)
With the addition of 50 feet sheet flow in the form of a green roof, the time of
concentration for this example increased to 17.5 minutes. For larger storms, this would
have little to no impact on time of concentration in most sewersheds, as the roof is a
small component of the total calculations. This is within the retention capacity predicted
by one study conducted in Europe in 2007, which concluded that green roofs could delay
runoff for as long as 30 minutes (Teemusk et al. 2007).
Potential for annual rainfall reduction
The effect a green roof program would have on Baltimore City at differing scales
was determined using predictive factors developed by researchers focused on green roof
technology (See Table 6.4).

44
Study Author
Annual Runoff
Reduction predicted
% Green Roofed
%Change in Annual Runoff
Predicted
67% 20% 2.26% 67% 50% 5.65% Moran
67% 100% 11.31% 50% 0% 0.00% 50% 5% 0.42% 50% 20% 1.69% 50% 50% 4.22%
Inner Harbor
Watershed
Berghage et al 2009
50% 100% 8.44% Berghage et al 2009 50% 100% 4.46%
Moran et al 2005 67% 100% 5.98% DeNardo et al 2005 45% 100% 4.01% Macmillian 2004 55% 100% 4.91%
Mentens 2004 54% 100% 4.82%
Baltimore City
Carter 2000 78% 100% 6.96% 50% 5% 1.04% 50% 20% 4.18% 50% 50% 10.45%
Upper Fells Point Berghage et al
50% 100% 20.89%
Table 6.4: Comparison of predicted Annual Runoff Reductions
The methods used in these studies vary, but generally involved monitoring the
runoff from test roofs over a given period to determine the effects of retention and
45
evapotranspiration on total runoff in a given area; the average annual reduction predicted
by these six studies was 58%.
Using these predictions, the effects a green roof program might have on annual
runoff was calculated. With 100% adoption by the residential sector, green roofs could
reduce annual runoff by 4.46% at the city level and 8.5% in the Inner Harbor Watershed,
which has a heavier concentration of housing. Further, the Upper Fell’s Point
neighborhood could achieve reductions in annual runoff of between 1% and 21%
depending on the percentage of houses greened. Again, as a comparison, an simplified
on-line calculator predicted a 35% reduction in annual runoff using the same parameters
for this neighborhood (CNT 2010).
Summary
Using the methods described in TR-55, a residential green roof program was
modeled at different levels to determine the effect that the scale of such a program might
have on the quantity of runoff in Baltimore City. Runoff was estimated in three
categories: runoff for a design storm, time of concentration for the same storm, and
average annual reduction of run-off. Calculating the runoff from a 2-year design storm
using estimated curve number values for vegetated roofs, it is predicted that with 100%
adoption a residential greening program could reduce runoff by 4.7% city wide and by
over 8% in the more developed neighborhoods surrounding the Inner Harbor. Time of
concentration is much more difficult to predict accurately over large and complex areas
46
such as Baltimore, but in a typical sewersheds where the roof to inlet distance is 320 feet,
time of concentration for a single roofs contribution to runoff went from 6 minutes to
17.5 minutes. By averaging several prominent studies it is predicted that a single green
roof could reduce annual runoff by an average of 58%; with 100% adoption this could
result in a reduction of 4.46% citywide and 8.5% in the Inner Harbor; densely developed
neighborhoods such as Upper Fell’s Point could reduce annual runoff by as much as
21%.
Limitations
The ability of a planted roof to retain storm-water depends on variables such as
storm intensity, seasonal variation, rainfall rates, and the soil moisture content of the roof
media, evapotranspiration and a host of other factors (Moran 2004, 30). TR-55 simplifies
the procedures for determining runoff in areas where the application of more detailed
measures is not possible or where the margin of error might be deemed acceptable. In
areas where more precise measurements are necessary, hydrological studies can be
preformed to determine base stream flows and peak discharge amounts. This research,
which is only meant to suggest the possible impact a residential greening program might
have in Baltimore City, recognizes that a certain margin of error is probable using these
methods. Each aspect of runoff analyzed for this study has it own limitations, which are
recognized by the various authors of the TR-55 (USDA 1986, 1-4).

47
TR-55’s ability to determine runoff in this study is limited by the simplified
nature of the parameters used in the calculations. The curve number (CN) is derived from
average conditions over a wide area, and tends to become less accurate when historical
storms are considered. As an average measure of a land cover type’s performance, the
curve value does not account for variation in storm intensity or duration over the course
of the rainfall event, typically measured in 24-hour periods. The curve number used for
Baltimore in this research was ascertained by making broad generalization about land
cover in the city and could be greatly refined through a more detailed analysis of the
study area. Times of concentration calculations were only calculated for the roof
component of this measure; time of concentration for a specific sewershed would require
calculating time of concentration for all its component surfaces. The diversity of land
covers in each sewershed made creating an average type beyond the scope of this study.
Access to a recent sewer map of the city would allow for a more complete interpretation
of time of concentration for Baltimore, incorporating the sewer lines themselves as
channel components to create flow lengths that reached nearby streams or other bodies of
water.
Conclusion
“The pervious nature of the living green roof soil and vegetation cover with a
water retention capacity comparable to meadows is the single most pervasive argument
for incorporating green roof systems as an important element into the civic structure for
48
stormwater management, especially in densely populated urban areas” (Weiler et al.
2009, 34). For most practical purposes, numbers derived from TR-55 stormwater
calculations can be used to help determine the storage volume necessary for detention
basins etc (USDA 1986, ch6). That is not the aim of this research. The purpose of this
research is to suggest the range benefits that might be obtained from a residential green
roof program and the potential for such a program to assist in achieving the overall goals
of various programs attempting to improving the ecosystem of the Chesapeake Bay
region. To that end, reducing stormwater quantities is just one of several benefits that
might accrue with broader implementation of green building techniques. For smaller
storms, runoff that does occur from green roofs happens more slowly. As the substrate
becomes saturated, the resultant runoff is released over longer period of time when
compared to a traditional roof (Getter et al. 2006, 1278). By lessening the quantity and
force of runoff, green roofs can reduce the need to upgrade or repair storm water systems
as well as reduce the impact of runoff on local hydrology (Weiler et al. 2009, 11).
Rainfall can also carry unwanted nutrients and pollution into nearby bodies of
water. This situation can be particularly intense in largely impervious urban areas where
green roofs can play a role in improving runoff quality (Berndtsson et al. 2005). And
though a soil-substrate combination has the same ability to retain storm-water whether it
is planted to not, these filtering aspects of a vegetated roof are important (Getter et al.
2006, 1282).
Baltimore City, with its high percentage of disturbed soils, impervious surface
area and lack of open space, is a difficult area to address the stormwater problems. Green
49
roofs are particularly well suited to these situations as they can be implemented on
existing, underutilized space where they can intercept precipitation where it falls, as close
as possible to the source (Wong 2006, 31). Green roofs can begin to help urban areas
move in the direction of replicating the natural hydrological functions that existed pre-
development in areas that are viewed as an intractable problem. Notwithstanding, a more
naturally functioning watershed is critical to health of the Chesapeake Bay and green
roofs will have some role in positively impacting runoff in this respect.

50
Chapter 7: Landscape Ecology
Landscape ecology “combines the spatial approach of geographers, which
emphasizes spatial analysis, with the functional approach of ecologists, which focuses on
the functioning of ecosystems” and includes input from a wide range of disciplines that
vary from study to study (Ndubisi 2002, 167). Landscape ecology emphasizes human
impact on the environment, particularly as it effects spatial relationships and processes
(Ndubisi 2002, 166). To that end, landscape ecology provides useful tools for solving a
range of land use problems from an ecological perspective. Landscape ecology also
provides a language for analyzing land-use issues and planning for future development
(Forman 1995).
History
The ecological roots of landscape architecture in this country can be traced to
Frederick Law Olmsted (Ndubisi 2002, 10), though the formal definition of landscape
ecology in this country is often dated to the 1950’s (Dramstad 1996, 12; Ndubisi 2002).
Landscape ecology also owes much, of course, to the work of earlier scientists,
particularly to that of the German geographer, Carl Troll (Forman 1995, 33), who was
already advocating a regional vision of environmentalism prior to WWII (Troll et al.
1949, 106) and is credited with coining the term landscape ecology (Ndubisi 2002, 168).
Though the precursor of landscape ecology may be dated to the 1930’s, it only became a
common component in the theory and practice of landscape architecture in the last few
51
decades. Initially catalyzed by Rachel Carson’s seminal work Silent Spring, the
environmental awakening that occurred in the United Sates during the 1960’s also
enveloped the design professions. The publication of another seminal book, Design with
Nature (McHarg 1969), is widely marked as the beginning of environmentalism in
landscape design. In Design with Nature, McHarg lays out an environmentally based
approach to landscape analysis, an approach that advocates for the ecosystem as a critical
element of landscape design at every scale. According to this approach a thorough
understanding and knowledge of climate, topography, soil, and hydrology must be
developed and integrated into the planning process in order to achieve design solutions
that will do the least harm possible.
Design with Nature had a big impact outside the profession also, influencing the
development of landscape ecology as a formal discipline (Steiner 2006, xiii). Landscape
architecture joined to help direct this ‘new ecology’ along with a wide range of other
disciplines (Dramstad 1996, 13) in the 1980’s (Ndubisi 2002, 168). The interdisciplinary
approach that developed during this period is synthesized in Forman’s book Landscape
Ecology (Forman 1986), which seeks to connect landscape structure, function, and
processes with the planning and design professions. Forman’s landscape ecology
approach to planning continues to be refined, most notably by Ndubisi (Ndubisi 2002)
and Steiner (Steiner 2008).
The Environmental Movement has involved rapidly from its beginnings and the
role ecology will play within the practice of landscape architecture is still developing.
52
Prior to the 1960s, landscape architecture employed what some feel was a more holistic
approach to site design and the subsequent predominance of a particular aspect, such as
ecology, can be seen from this perspective as a constriction that limits the scope of the
profession rather than widening it (Baird et al. 2006). However, some practitioners, such
as Michael Van Valkenburgh, George Hargreaves, and Ken Smith, have shown that it is
possible to create environmentally sensitive landscapes that also fit into landscape
architecture’s traditional place-making definition and in so doing heal the divide between
ecology and design (Meyer 2000).
Landscape Structure
Landscape ecology is a relatively new field. As a developing discipline, it is still
evolving the principles and nomenclature used to express its theory and their application,
but generally the physical components of landscape ecology are divided into the
following categories (Forman 1995, 133; Dramstad 1996).
Patches
Patches are defined as discrete areas with conditions approaching “near natural”
(Forman 1995, 136). Patches can occur in any size or shape, factors that will directly
affect their function, and they can serve a variety of purposes. Patches can act as reservoirs
for species otherwise displaced and serve as “stepping stones” between patches or other
larger ecosystems. Patches are generally divided into the following subcategories
(Dramstad 1996, 19):
53
1. Remnants. Remnants are remains of larger environments that have been
reduced, typically through human agency. Examples could include areas
passed over by, or unsuitable for, development or set aside specifically as
habitat.
2. Introduced. Introduced patches are the result of activities that create holes of
some kind in the larger landscape, such as a logged area might in a large
forest.
3. Disturbed. Disturbed patches are the result of human or natural disturbance,
such as storms and fire, which can have the effect of creating negative patches
across a landscape.
4. Environmental Resource. Naturally occurring patches, such as dunes and
ridges, that can provide habitat for certain niche species
Edges/ Boundaries
Edge (or boundary) refers to the transitional area on the outer boundary of a
patch. This change in condition can be physically represented (by a stream or
mountain range) or it can be political or cultural.
Corridors
Corridors can be classified in the same way as patches (as remnants,
introduced, disturbance, or as an environmental resource.) They serve as
contiguous connections between patches or other natural areas that might
otherwise be isolated. Examples could include waterways, ridgelines, or
54
marginal areas adjoining fields. Corridors, edges, and patches all rarely serve
the same function across species; what serves as a corridor to one species may
represent a significant barrier to another.
Matrix
Matrix refers to the distribution of patches, edges, and corridors and their
relationship to one another. A matrix is the major background structure of the
landscape or processes being studied, how they are connected, what are their
primary land use or land cover types, and the related dynamic processes.
Mosaics
The term mosaic refers to the way in which the patches, edges, and corridors
combine at the landscape or regional scales, depending on the application or
element being considered.
Part of the success of landscape ecology’s spatial language is that it is concise and
easily understood, yet capable of effectively describing a variety landscapes and
processes at many scales and across a range of disciplines (Forman 2008). With its
simple vocabulary, landscape ecology is particularly effective at describing disturbed
environments and helping to plan future directions while also recognizing humans as a
part of nature. “Landscape ecology is at exactly the right spatial scale for effective
planning. It explicitly integrates nature and people. Its principles work in any landscape,
from urban to forest and cropland to desert” (Forman 2008, 17).
55
Chapter 8: Green Roofs as Habitat
The purpose of this section is to determine the potential for a residential green
roofing program to function as habitat and implications for creating green infrastructure
in Baltimore. Using a landscape metrics modeling program, Patch Analyst (Rempel
2008), differing green roofing scenarios were tested to determine their possible effect on
the existing land use configurations and how these might, in turn, effect a hypothetical
population of butterflies, Hesperia comma. This analysis was then used to design a
demonstration corridor in the city, designating areas in existing parks as breeding habitat
and using green roofs as ‘stepping-stones’ to connect the two.
Background
There is a potential for green roofs to function as habitat within any given
environment (Oberndorfer et al. 2007, 829). With enough time, money, and technical
expertise, any natural environment could potentially be recreated (Grant et al. 2003, 5);
the popular Amazon rainforest exhibit at the Baltimore Aquarium is, in essence, a
massive green roof. Most extensive roofs, on the other hand, present substantially less
opportunity for potential inhabitants (Grant et al. 2003, 24), but if local fauna is
considered during the design phase of the roof considerable improvement in habitat is
possible (Brenneisen 2006, 30). The majority of extensive green roofs built in this

56
country during the last decade, constructed as they are of a lightweight substrate and a
sedum mat, do not represent an ideal environment for most native species with some
exceptions (Getter et al. 2006, 1279). For instance, studies have shown that while
generally a city’s bird population may be dominated by a few species, there is more
diversity in green spaces such as parks and green roofs (Ortega-Álvareza et al. 2008).
Also, certain invertebrates (particularly spiders, beetles, ants, wasps, and bees) are known
to colonize extensive green roofs readily and several rare species have been noted (Jones
2002; Coffman et al. 2005; Kadas 2006, 69). The potential for extensive green roofs to
provide habitat for these invertebrates is well documented and increasingly green roof
researchers, especially in Switzerland and the U.K., are looking with interest at the role of
green roofs might play as a habitat for other species.
Urbanization has reduced diversity among bird communities though conversely it
has increased the abundance of certain species (Ortega-Álvareza et al. 2008, 193). For
reasons of mobility (Baumann 2006, 37), bird populations have recently been selected for
study, particularly for their potential to utilize green roofs to feed and colonize. A study
in Switzerland found that certain endemic, though locally threatened, species of ground
nesting birds, including the little ringed plover (Charadrius dubius) and northern lapwing
(Vanellus vanellus,) were common visitors to extensive type roofs, though none were
reported to have bred there successfully (Baumann 2006, 42). The black Redstart
(Phoenicurus ochruros,) a ground nesting bird that prefers abandoned lots and
brownfields, is a threatened species in the U.K. and has became the target of a plan (Frith
et al. 2005, 5) initiated in London that is attempting to use green roofs to recreate habitat

57
attractive to this species (Gedge et al. 2005, 163). Both of these studies are ongoing and
to date neither has described breeding populations on the green roofs examined, but both
the Swiss study and the one conducted in London drew some common conclusions. The
authors noted two factors suspected of affecting species diversity related to the make up
of a living roof. The first was the design of the roof itself, particularly the choice of
substrate and plant material, which was considered the most important factor in limiting
diversity (Baumann 2006, 42); second was the proximity of the constructed roof habitat
and natural areas, which was seen as a critical element of any future species assemblage
(Gedge et al. 2005, 167).
Though only begun within the past decade, research has demonstrated that green
roofs have the ability to function as habitat, when properly designed, and additionally
have some potential to play a part in improving biodiversity (Kadas 2006, 71). Studies
have also demonstrated that improving the mix of plant species used on a roof will
increase the biodiversity (Brenneisen 2006; Clark et al. 2007), but the ability of a green
roof network to act as a component of its regional green infrastructure will only be fully
realized after they have been more fully implemented (Grant et al. 2003, 40). That is, as a
potential part of the mosaic that makes up any urban habitat, a green roof’s function will
depend on the complexity of its design, its relationship to other built green areas, and its
connection to the larger regional ecosystem (Godefroid et al. 2007, 1237).
58
Target species: Hesperia comma
In terms of landscape metrics, each species and every process is different; as
noted above, what acts as a corridor for one species can represent an obstacle to another.
Determining the effect that different patch, edge or matrix scenarios may have requires
not only a thorough knowledge of the existing physical conditions, but also a working
knowledge of the optimal habitat requirements of the study species for which one is
attempting to create habitat. Given that, one of the critical aspects for analyzing green
roofs as potential habitat from a landscape ecology perspective is the selection of a
species on which to base the study. This presents an obstacle because there have been no
substantive study on green roofs as an element of broader regional ecological processes
or as a component of a particular species’ habitat in the Baltimore region where an
understanding of the potential environmental benefits of green roofs has only developed
in the last decade. Comparatively, some European countries have been experimenting
with the modern version of a green roof since the 1960’s and have had a longer time to
develop an understanding of their habitat potential (Peck 2007, 1). Thus, as a recent
innovation here, there has simply not been enough time to develop a body of research on
the few green roofs that do exist and the species that might inhabit them. The lack of such
background research involving green roof adapted species may also explain why there are
no existing studies of green roofs from a landscape ecology perspective, studies that
might tell us, for instance, how a patch located on a surface separated from the ground
might function as habitat. It is not a problem limited to green roofs, as there are many
situations where the language of landscape ecology might be applied, but as of yet there
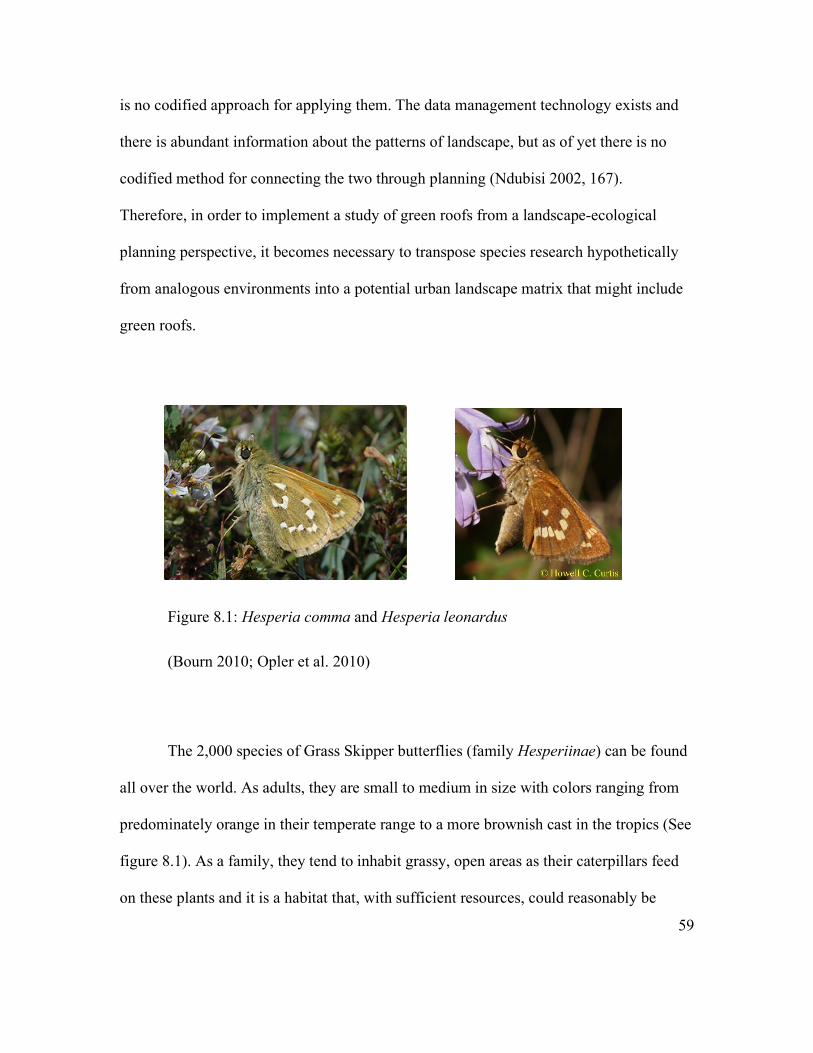
59
is no codified approach for applying them. The data management technology exists and
there is abundant information about the patterns of landscape, but as of yet there is no
codified method for connecting the two through planning (Ndubisi 2002, 167).
Therefore, in order to implement a study of green roofs from a landscape-ecological
planning perspective, it becomes necessary to transpose species research hypothetically
from analogous environments into a potential urban landscape matrix that might include
green roofs.
Figure 8.1: Hesperia comma and Hesperia leonardus
(Bourn 2010; Opler et al. 2010)
The 2,000 species of Grass Skipper butterflies (family Hesperiinae) can be found
all over the world. As adults, they are small to medium in size with colors ranging from
predominately orange in their temperate range to a more brownish cast in the tropics (See
figure 8.1). As a family, they tend to inhabit grassy, open areas as their caterpillars feed
on these plants and it is a habitat that, with sufficient resources, could reasonably be

60
recreated on a green roof (Opler et al. 2010). Of interest to this research is the butterfly
Hesperia comma (called the silver-spotted skipper in England), dispersed across the
higher latitudes of North America and Asia. Though not common over most of its range it
was, due to the loss of its preferred grassland habitat, so rare in England up into the late
1990’s that it had been named a priority species under the UK Biodiversity Action Plan
(UK BAP). At the time of this writing, however, it has been de-listed due primarily to
habitat recovery (Bourn 2010).
It was during the period of its decline in England that Hesperia comma became
the subject of a study on the effects of patch size and distance on its dispersal (Hill et al.
1996). This study is of interest here for several reasons. First, the habitat occupied by
silver-spotted skipper in England could be considered analogous to what one might be
able to recreate in a patchy landscape comprised of properly designed green roofs; ones
suited to the Hesperia requirement for short, open grassland in which to breed (Hill et al.
1996, 726; Bourn 2010) and for certain flowering plants to feed (Opler et al. 2010).
Additionally, there are several species related to Hesperia comma in the region
surrounding Baltimore including Hesperia leonardus, Hesperia metea, and Hesperia
sassacus. Though none of these species is represented in the city itself, it is presumed that
they existed there historically. These three species are highly analogous to Hesperia
comma in their habitats requirements, preferring short meadows and barrens (Opler et al.
2010) and can hypothetically be expected to have the same requirements as their
European cousins as described by Hill and colleagues (Hill et al. 1996). Other species,
such as rock pigeons and certain rodents, thrive in our cities because we have
61
inadvertently recreated habitats to which they are particularly adapted (Lundholm 2005,
4); so it is not unreasonable to assume that the knowledge gained regarding landscape
metrics from the study of the Hesperia comma population in North Downs, Surrey, might
be transferable to a similarly species in the Baltimore region.
Conducted between 1982 and 1991, Hill’s study, “Effects of habitat patch size
and isolation on dispersal by Hesperia comma butterflies: implications for
metapopulation structure,” drew some conclusions about the effect of patch, patch size
and distance on the butterfly populations there that are useful, and necessary, for a
hypothetical study of like species in Baltimore. Using mark-release-recapture techniques
to track the movement of individuals, the authors of this study determined that 67% of
between patch movements occurred where the distance between patches was less than
50m (the longest recorded movement between patches was 1,070 m.) Additionally, small
patches (defined by the authors as less than 0.07 hectare or about 7,500 ft2) had the
highest amounts of both immigration and emigration, but also the smallest number of
permanent residents (Hill et al. 1996, 729).These are both critical statistics from a
landscape ecology perspective in that they help determine the grain, or the degree of
resolution, necessary in order to study this and related species. Grain can refer to the
overall quality of the landscape, how large or small the patches are, or, as implied here, it
can refer to the smallest individual unit of observation used at a particular scale (Forman
1995, 10). For this study, a 100’ grid was determined to be appropriate, as it is small
enough to discern landscape elements at a scale appropriate to the life cycle requirements
62
of potential Hesperia colonizers, both the patch size and distance between patches and
large enough to incorporate a typical roof plan in the study area, which is 775 ft2.
Landscape Metrics: The effect of green roof scenarios on habitat
The ability for a green roof matrix to function as a component of a particular
species habitat is an aspect of green building technology that is gaining interest in
Europe, where implementation of green roofs is greater than here in the US and thus the
opportunities to study animal communities is greater. This study uses existing geographic
information dataset (GIS) datasets, FragSTATs and a simplified spectrum of habitats to
measure basic landscape metrics such as mean distance between patches, average patch
size and number. These metrics are then compared to known habitat requirements for a
comparable species of butterfly, studied in a similarly patchy ecosystem on the southeast
coast of Great Britain. The life cycle of the grass skipper, along with the size of the
average roof, is also used to determine grain size. Patch metrics will be measured at two
ranges, the city scale and at the neighborhood level. Political boundaries were chosen
because most programs and regulations with potential to effect green adoption occur at
this level and because these boundaries incorporate the area’s rowhouses, the
architectural framework of this study.
63
Fragstats/ Patch Analyst
Computer-based GIS systems developed in the 1980’s are used extensively in
ecological planning and have proven to be an invaluable tool for developing analysis of
complex environmental problems (Gorenflo et al. 2005). Fragstats was originally
developed in 1994 by Kevin McGarigal and Barbara Marks, both of Oregon State
University, Corvallis. This program interprets raster or vector computer images to
determine a variety of landscape metrics useful to ecological planners. McGarigal and
Marks recognized that although habitat fragmentation was increasingly being understood
as a major cause of species decline, prior to the development of spatial analytical tools,
such as GIS and particularly Fragstats, there did not exist a practical empirical method for
measuring the concepts being described by the landscape ecologist at the time; there was
no reasonable way of determining values associated with the complex, shifting elements
of the landscape mosaic being described in the field (McGarigal et al. 1994, 1). Fragstats
fulfilled this need by being able to quantify more easily the increasing amount of data
being made available by remote sensing technology and connect it with new mapping
software and landscape structure in a timely manner.
Patch Analyst, first developed in 1999, is an extension designed for ESRI’s
ArcViewer and ArcMap GIS programs. These programs use mapping software to
coordinate different categories of information (aerial photos, geographic information,
remote sensing, census data, etc) based on location and thus enable the user to perform
complex spatial analyses, which by previous methods would have been so time
consuming as to prove impractical.
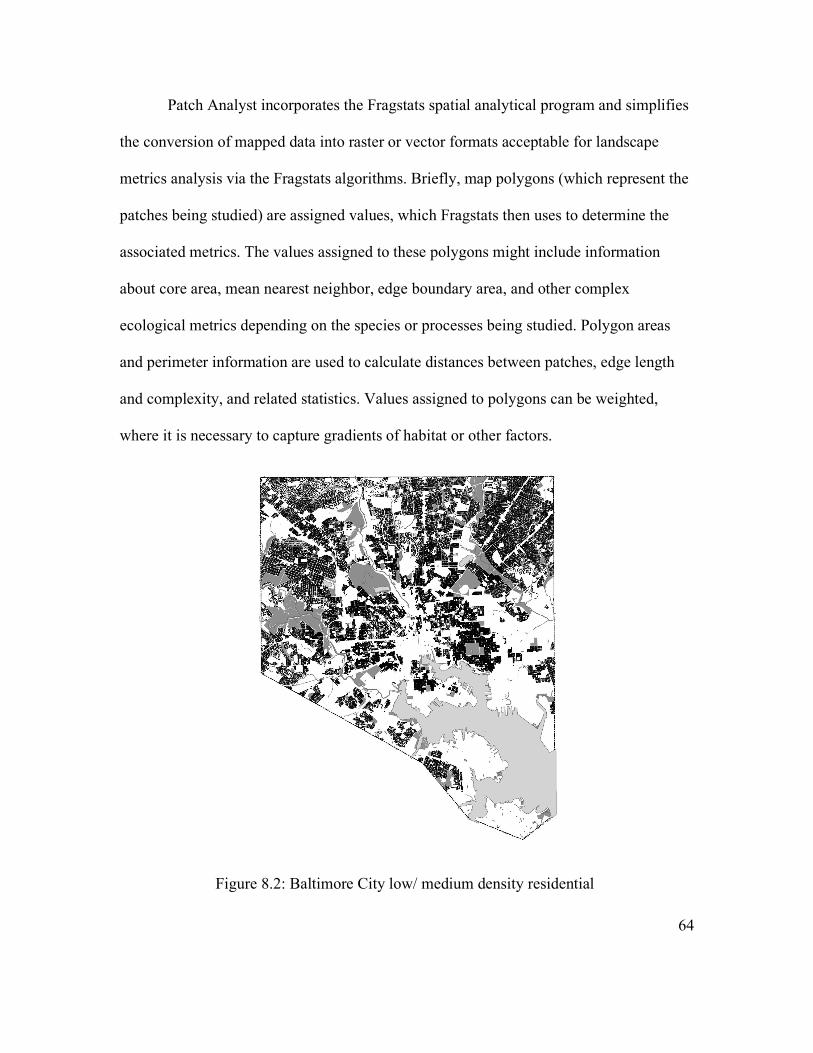
64
Patch Analyst incorporates the Fragstats spatial analytical program and simplifies
the conversion of mapped data into raster or vector formats acceptable for landscape
metrics analysis via the Fragstats algorithms. Briefly, map polygons (which represent the
patches being studied) are assigned values, which Fragstats then uses to determine the
associated metrics. The values assigned to these polygons might include information
about core area, mean nearest neighbor, edge boundary area, and other complex
ecological metrics depending on the species or processes being studied. Polygon areas
and perimeter information are used to calculate distances between patches, edge length
and complexity, and related statistics. Values assigned to polygons can be weighted,
where it is necessary to capture gradients of habitat or other factors.
Figure 8.2: Baltimore City low/ medium density residential
65
Landscape Metrics Study
Following is a study of a residential green roof program and the effect different
adoption rates and differing scales might have on butterfly habitat in Baltimore City. A
hypothetical green roofing program is considered with implementation rates of 0, 5, 20,
50, and 100%. These percentages were used to determine what potential such a program
might have for creating habitat for the butterflies of the Hesperia species. I used a 1996
study by Hill and colleagues (Hill et al. 1996) to determine the Hesperia’s habitat
requirements. The city and neighborhood are used to determine the effect scale might
have on the results. Existing park and vegetated space was included as part of the patch
analysis and it is assumed that parts or whole sections of these existing green spaces
could be converted into Hesperia habitat.
Roof footprints were selected at random from within the city in areas zoned
medium- and low-density residential. This zone class encompasses almost all of the cities
predominately flat-roofed rowhouses, the target of this study. However, because the
houses were selected using zoning maps, a substantial number of single-family detached
and pitched roof rowhouses are also included in the study sample. Though green roof
implementation on these structures is more complicated, it is not viewed as
insurmountable obstacles. From this pool of residential roofs, random selections were
made at the 0, 5, 20, 50 and 100% levels. These breaks were at levels estimated to be
where significant changes in the landscape metrics might occur and could be further
refined as necessary.
66
Grid Size
Grids are used in Patch Analyst as a means of categorizing landscapes. Each cell
in the grid is assigned a value by the user. This value can represent habitat quality of the
landscape area represented by the cell, as in this study, or it can represent other user-
determined measures that can be graded according to their appropriateness. For the
purpose of this study a uniform value is assigned to all patches in the study area. It is
assumed that all green roofs to be created as part of a Hesperia rehabilitation program
will recreate its habitat equally and that parks and green space within the city limits will
be similarly restored. In reality, a more nuanced approach could be developed by an
extended assessment of existing conditions; however, an examination of the effect of
habitat gradients on the matrix quality is beyond the scope of this research.
Grid size in Patch Analyst refers the dimension of each square in a grid to be
overlaid on the study area. A 500’ grid refers to a grid with cells 500 x 500’ in dimension,
replicated across a study area. Grid size is based on the species or process being studied
and the scale at which they are being viewed. Viewing the same data with a different grid
(or grain) size can produce substantially different results (see figure 8.3). Two critical
statistics from the Hill et al 1996 Hesperia study were used to determine the grid size
used in Patch Analyst. One, Hill’s study determined that 67% of all movement between
patches occurred when those patches were 50m (164’) or less apart. Two, Hill classed
patches into three categories: Large (>5.66 ha,) medium (0.33ha – 0.78ha,) and small
(<0.07 ha.) The smallest patch category Hill and colleagues considered, under 0.07ha is
equal to an area of less than 100 ft2. These two statistics represent the finest scales of

67
movement and patch considered by Hill’s study, and it was determined that a 100’ grid
would be adequately small to capture species requirements when modeling Baltimore as
potential Hesperia habitat. Additionally, a 100’ grid is large enough to capture the
average sized roof area (775 ft2.)
25’ Grid 50’ Grid
100’ grid 500’
Figure 8.3: Grid size comparison

68
Study Areas: Baltimore City/ Upper Fell’s Point
Figure 8.4: Baltimore City and Upper Fell’s Point
I generated spatial statistics across two scales: the city scale and at the
neighborhood level. These multiple perspectives provide an opportunity to evaluate the
effect scale might have on landscape metrics and their ability to inform future decision-
making processes. Size is not the sole determiner of landscape. It is the relationship of
elements within the landscape and how they interact that planners should use to
69
determine the necessary scale (McGarigal et al. 1994, 4), though the scale of any research
in landscape metrics will necessarily impact the outcome. A comparison of a green
roofing program as Hesperia habitat at two scales, city-wide and neighborhood, will help
determine the effect scale might have on such a program.
Results of Patch Analyst
The distance between patches and patch size were evaluated at the city and the
neighborhood level, specifically as they relate to the Grass Skippers, its potential to move
between patches and its minimum area requirements for colonizing. As mentioned, Hill
found that 67% of movement between patches for this species occurred at distances of
less than 50m (164’) additionally that 0.007 ha (7,500 ft2) was the minimum area needed
for colonization; no patch under this size maintained a breeding population over the
course of his study (Hill et al. 1996, 733). Given these as reference measures, an analysis
was undertaken to determine if a green roof program in Baltimore City could be tailored
to this species and what level of adoption rate would be necessary to achieve some
measure of success. Following are the landscape metrics derived from Patch Analyst
determined to be important to this species in the context of this research.
Distance between Patches
The mean nearest neighbor statistic measures the average distance between
neighboring patches of the same type based on the shortest path between edges. It can be
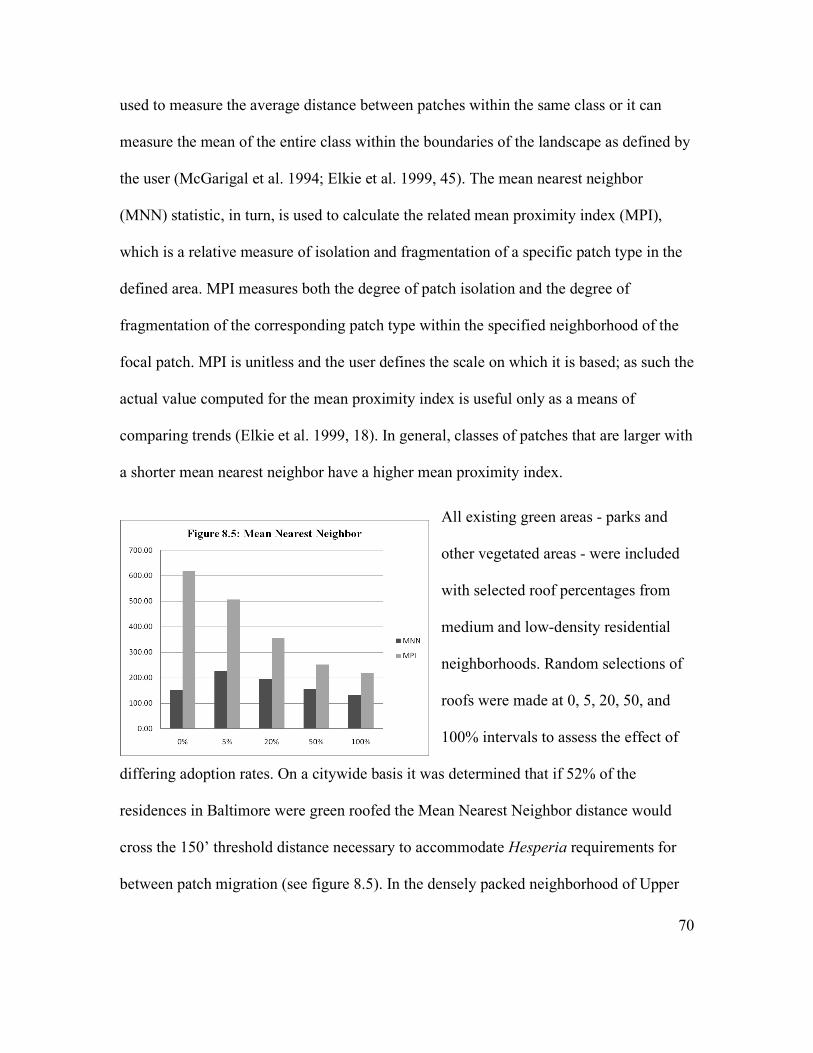
70
used to measure the average distance between patches within the same class or it can
measure the mean of the entire class within the boundaries of the landscape as defined by
the user (McGarigal et al. 1994; Elkie et al. 1999, 45). The mean nearest neighbor
(MNN) statistic, in turn, is used to calculate the related mean proximity index (MPI),
which is a relative measure of isolation and fragmentation of a specific patch type in the
defined area. MPI measures both the degree of patch isolation and the degree of
fragmentation of the corresponding patch type within the specified neighborhood of the
focal patch. MPI is unitless and the user defines the scale on which it is based; as such the
actual value computed for the mean proximity index is useful only as a means of
comparing trends (Elkie et al. 1999, 18). In general, classes of patches that are larger with
a shorter mean nearest neighbor have a higher mean proximity index.
All existing green areas - parks and
other vegetated areas - were included
with selected roof percentages from
medium and low-density residential
neighborhoods. Random selections of
roofs were made at 0, 5, 20, 50, and
100% intervals to assess the effect of
differing adoption rates. On a citywide basis it was determined that if 52% of the
residences in Baltimore were green roofed the Mean Nearest Neighbor distance would
cross the 150’ threshold distance necessary to accommodate Hesperia requirements for
between patch migration (see figure 8.5). In the densely packed neighborhood of Upper
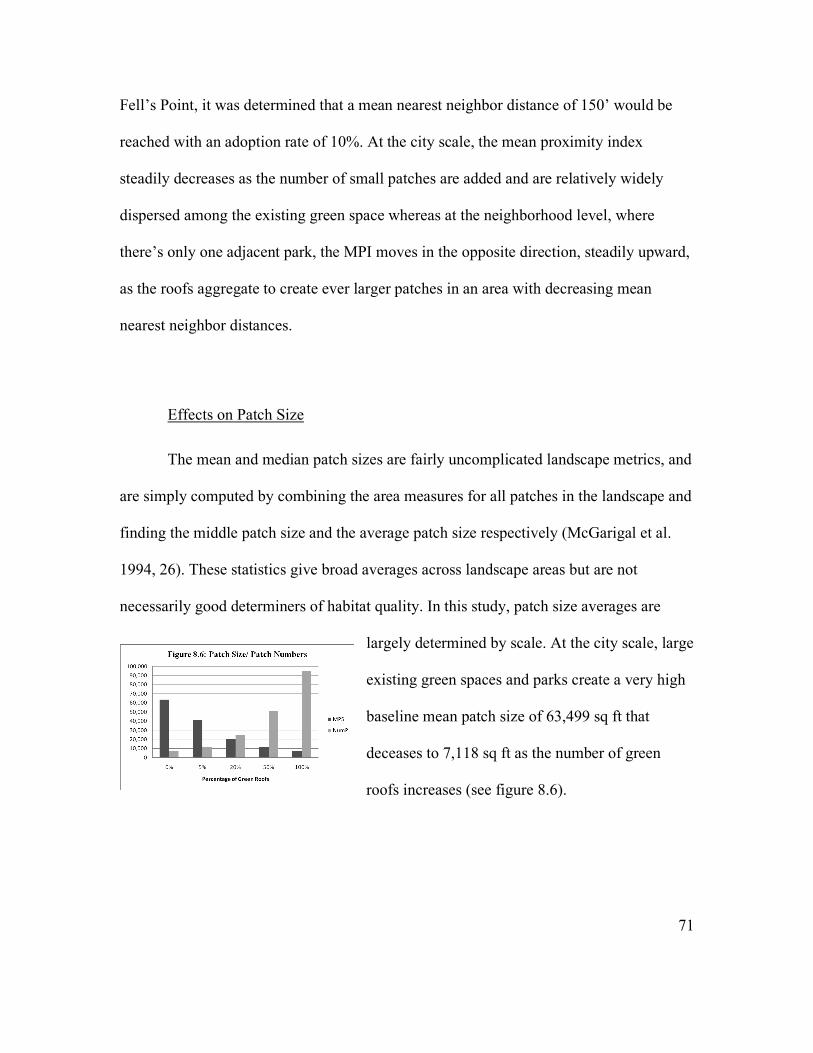
71
Fell’s Point, it was determined that a mean nearest neighbor distance of 150’ would be
reached with an adoption rate of 10%. At the city scale, the mean proximity index
steadily decreases as the number of small patches are added and are relatively widely
dispersed among the existing green space whereas at the neighborhood level, where
there’s only one adjacent park, the MPI moves in the opposite direction, steadily upward,
as the roofs aggregate to create ever larger patches in an area with decreasing mean
nearest neighbor distances.
Effects on Patch Size
The mean and median patch sizes are fairly uncomplicated landscape metrics, and
are simply computed by combining the area measures for all patches in the landscape and
finding the middle patch size and the average patch size respectively (McGarigal et al.
1994, 26). These statistics give broad averages across landscape areas but are not
necessarily good determiners of habitat quality. In this study, patch size averages are
largely determined by scale. At the city scale, large
existing green spaces and parks create a very high
baseline mean patch size of 63,499 sq ft that
deceases to 7,118 sq ft as the number of green
roofs increases (see figure 8.6).
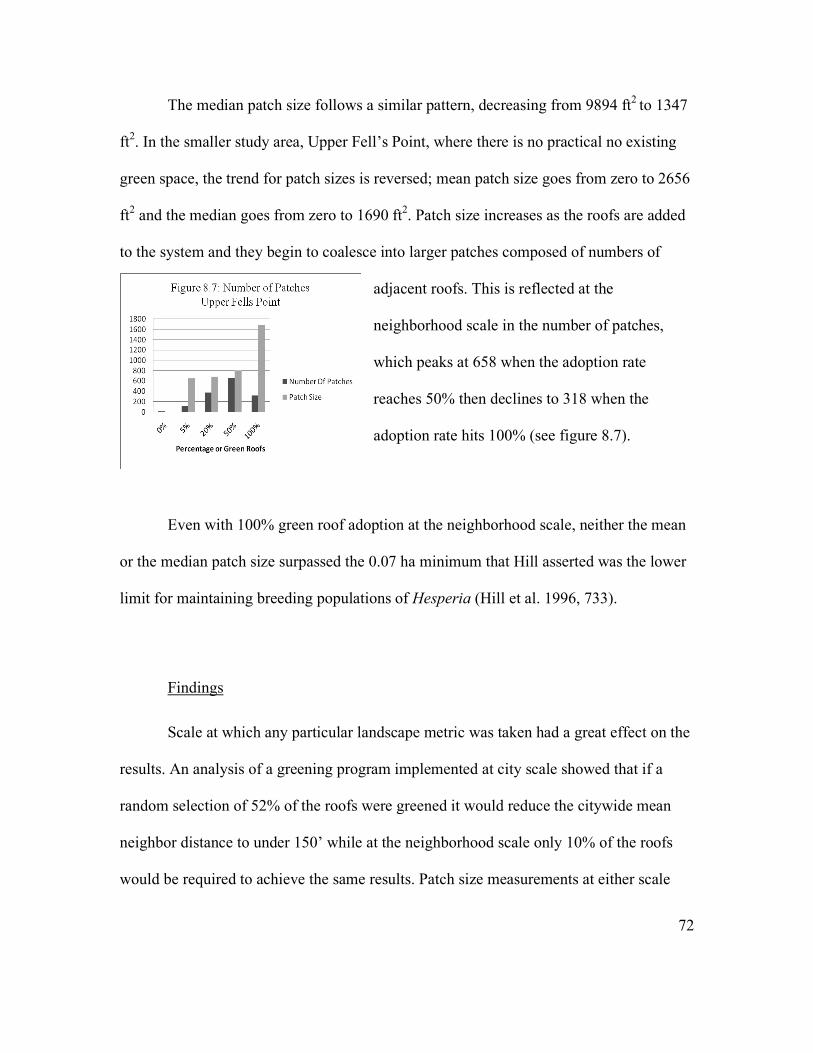
72
The median patch size follows a similar pattern, decreasing from 9894 ft2 to 1347
ft2. In the smaller study area, Upper Fell’s Point, where there is no practical no existing
green space, the trend for patch sizes is reversed; mean patch size goes from zero to 2656
ft2 and the median goes from zero to 1690 ft2. Patch size increases as the roofs are added
to the system and they begin to coalesce into larger patches composed of numbers of
adjacent roofs. This is reflected at the
neighborhood scale in the number of patches,
which peaks at 658 when the adoption rate
reaches 50% then declines to 318 when the
adoption rate hits 100% (see figure 8.7).
Even with 100% green roof adoption at the neighborhood scale, neither the mean
or the median patch size surpassed the 0.07 ha minimum that Hill asserted was the lower
limit for maintaining breeding populations of Hesperia (Hill et al. 1996, 733).
Findings
Scale at which any particular landscape metric was taken had a great effect on the
results. An analysis of a greening program implemented at city scale showed that if a
random selection of 52% of the roofs were greened it would reduce the citywide mean
neighbor distance to under 150’ while at the neighborhood scale only 10% of the roofs
would be required to achieve the same results. Patch size measurements at either scale

73
moved in opposing directions, with a citywide mean patch size going from 63,499 ft2 to
7,118 ft2, as the number of green roofs increases, while it went from zero to 2656 ft2 at
the neighborhood level and median patch sizes follow a similar pattern. The city-wide
statistics were skewed by the several large, widely scattered city parks that represent a
baseline for patch size and distance metrics at this scale. In Upper Fell’s Point, there are
no parks and thus no baseline statistic for patch metrics.
The city and neighborhood patch size metrics begin to approach each other,
though nowhere here did the patches reach an average or median size large enough to
support breeding populations according to Hill et al 1996. Though an average rowhouse
roof is too small to serve as habitat, as the percentage of green roofs grows they begin to
aggregate and larger patches are formed from adjacent houses and a certain percentage of
these do get larger than the 7,500 ft2 minimum required for colonization. Also, though
neither the mean nor the median patch size reach a number large enough to support a
hypothetical population of Hesperia, there are a substantial number of patches at both
scales that do and these could be explored for habitat potential, while the smaller roofs
could serve as stepping stones connecting larger patches. Along with scale, adoption rate
had a big impact on potential habitat creation. Adding a small number of roofs on the city
scale, less than 5%, had little potential to benefit the Hesperia species considered here.
The sorts of landscapes favored by the skippers - grassy barrens and native
meadows - are under pressure in the Baltimore area and have been considerably reduced
as the region has grown. By furthering our understanding of the landscape requirements
of this species, it is possible to imagine the restructuring of an urban environment that

74
might serve their habitat needs (see figure 8.8). An individual rowhouse could support
flowers and grasses enough to provide shelter and feeding opportunities, but most
residential roofs in Baltimore do not present area enough to support butterfly-breeding
colonies. This corridor envisions restoring large areas in two parks, Patterson Park and
Thames Street Park, sufficient in size to serve as breeding habitats and using the living
roofs in-between as stepping-stones, to allow for possible migration between the two.
Spacing the specially designed roofs at or near the 150’ range described by Hill allows
for corridor creation using a minimal number of roofs; in this case approximately 55
rowhouses were converted into habitat and combined with several larger commercial
buildings to create the necessary matrix.
As with any living system, the complicating factors are multitude and the
potential for localized extinctions are real, but the creation of a functional corridor
network might provide an opportunity for repopulation. In addition, the various local
representative grass-skipper species are only a single target; presumably, birds and other
invertebrates with similar habitat requirements might find such a network attractive.
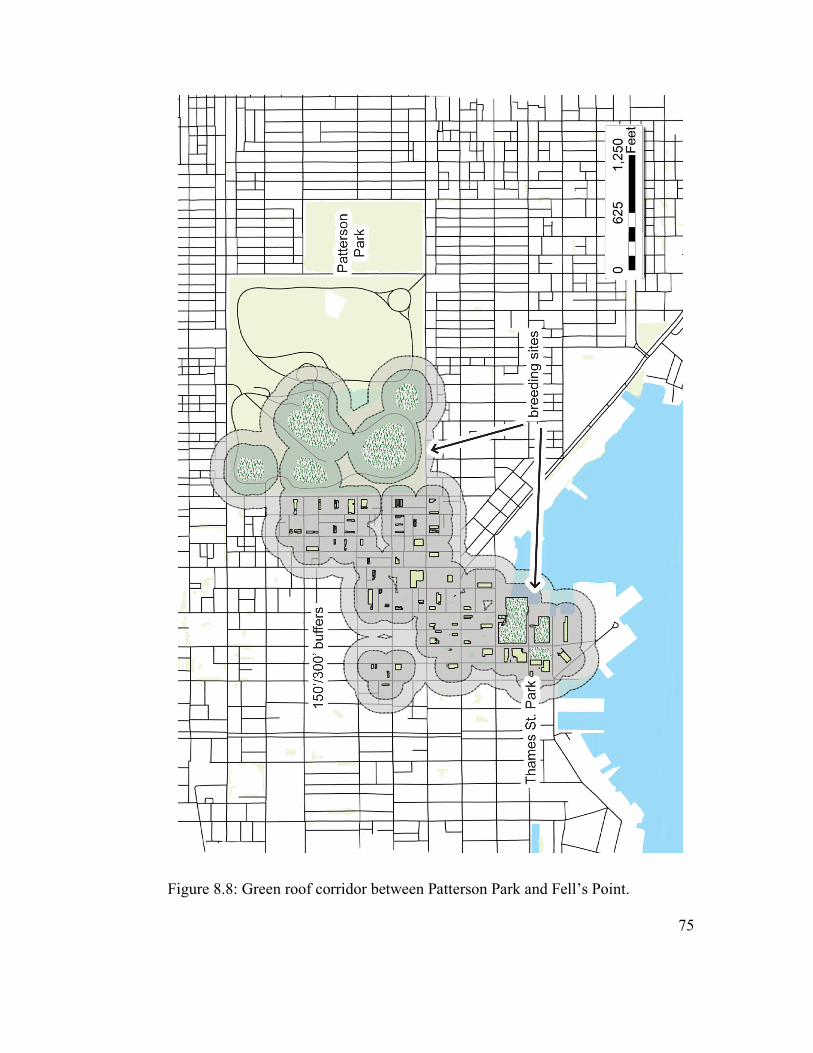
75
Figure 8.8: Green roof corridor between Patterson Park and Fell’s Point.

76
Limitations of Patch Analyst Approach
Patch Analyst is an extremely powerful program, capable of producing a dizzying
array of statistics running the gamut of landscape metrics. The authors of the original
program, Fragstats, on which Patch Analyst is based, went to great lengths to stress this
point and the fact that, as a tool, “Fragstats is only as good as the user” (McGarigal et al.
1994, ii). Definitions of the processes or the requirements of the species being studied,
the scale at which they are being viewed, the assignment of value and the sizing of
patches are all critical inputs that will affect the quality of the analysis that Patch Analyst
is capable of producing. When providing data to the Fragstats (or Patch Analyst)
interface, the importance of these key concepts is stressed: landscape, patch, matrix,
scale, landscape context, and landscape structure (McGarigal et al. 1994, 3). Knowing
how and why the user defines any one of these concepts in any application of landscape
metrics is a critically important aspect of understanding the results and conclusions
drawn. The following is an analysis of these six key concepts, their relation to this
research, and areas worthy of further discussion.
Landscape
The definition of landscape can be ambiguous. For this study, the political
boundary of Baltimore City was used because it contained an interesting architectural
feature that is normally outside any discussion of ecology. Rowhouses receive little
attention from planners in terms of green incentives etc because individually the footprint

77
of each roof is too small and the relative costs too high to be deemed worthy. Considered
as a whole, however, their contribution to the green infrastructure could be significant.
This definition of landscape could be expanded in future research to include a better
understanding of native species and their habitat than the one provided here. The Indian
Skipper (Hesperia sassacus) is a Maryland native which inhabits three counties adjacent
to Baltimore City: Baltimore, Carrol, and Harford (Opler et al. 2010). With the goal of
providing habitat for this species in Baltimore City, a more detailed understanding of
where in these adjacent counties the Indian Skipper resides, how these existing
populations could be connected in a matrix to the city, and how the butterfly’s preferred
habitat could refine the definition of landscape for an urban greening program to include
parts of this butterfly’s native range could provide important insights to the landscape
concept in this context.
Patch
In landscape ecology, landscapes are made up of patches and the area between
them. Patches are not readily visible in the landscape, but must be defined in terms of the
species or processes being studied (McGarigal et al. 1994, 5). Given that there are no
available studies examining butterflies and green roofs as habitat in this country, it is
necessary to make assumptions regarding patch and patch size to proceed. An
architectural form, the Baltimore rowhouse, was used to define patches in this study with
their standard dimensions being used to determine patch size. Interpretation of the

78
suitability of the created matrix was analyzed according to the target species
requirements. These roof top patches were considered as equal to similar ones that might
occur at ground level and the effect of the height differential on the butterfly’s ability to
move between patches is not known. Assumptions were also made about the ability to
create suitable habitat for certain Hesperia species in these patches, though this is
certainly possible given enough resources.
Matrix
A matrix is the background land use that dominates a particular environment
(Leitao et al. 2006, 214). Though urban ecologists are beginning to address cities as
components of their region’s ecosystem, existing green space is highly fragmented,
heavily managed and homogeneous and classifying elements of this landscape in terms of
their suitability as habitat is a task outside the scope of this research. For this reason
existing green space was classified as having the same potential for being converted to
habitat as any roof might. Additionally, as there have been no recorded sightings of
Hesperia in either location, green roofs and existing green space could be considered
equals in their potential for as future habitat.
Scale
The scale of any study area, and the grain at which that area is viewed, is a
determining factor in any patterns that will be detected. In Patch Analyst, the population

79
the user wishes to study determines scale. This research, interested in the potential the
Baltimore rowhouses might have as a component of a future green infrastructure
program, choose the boundaries of Baltimore City to determine scale in that they wholly
enclosed the expanse of the rowhouses. Indeed, political boundaries can be viewed as
edges themselves (Dramstad et al. 1996, 28). It was a form of political ecology that
prevented the rowhouse from expanding into the surrounding counties; suburbanites
associated the form with the problems of the city and instituted zoning laws to prevent its
spread outward (Hayward et al. 1999, 151). Since green incentive programs in this
country are often based on administrative boundaries, it seemed appropriate to view the
living roofs from this perspective. The effects of scale are noticeable when comparing the
citywide landscape metrics with those of a specific neighborhood. The selected
neighborhood, the one with most roof surface per area in the city, is not an average
neighborhood in this respect. It was select because it presented the best opportunity to
demonstrate green roofs as habitat in an area with little other opportunity to create green
space. Future research could identify smaller scale areas to study based on their proximity
to existing habitat, their ability to represent average housing conditions, or a variety of
other limits to compare the effects scale and site selection have on the landscape metrics
in question.

80
Context
“Landscapes do not exist in isolation” (McGarigal et al. 1994, 8). Landscape
context refers to the relationship between a given study area and the broader region of
which it is a component. Understanding the context of a landscape and how that context
might inform any metrics derived from it is an important aspect of interpreting the
resulting data. This research is concerned with a study area strictly defined by the city
boundaries; thus, it does not consider how it might be impacted by flows of species or
resources from the area surrounding it. Future research could consider the relationship
between an urban greening program and the regional ecosystem.
Landscape Structure
Landscape structure refers to the composition and configuration of the elements
within that landscape (McGarigal et al. 1994, 9). The composition of a landscape, and the
range and number of patch types within it, is an important measure of the ultimate
function of that landscape, as the patch composition determines the species or processes
they can support. This research, as a study of the potential ability of green roofs to
function as habitat for one species, considers a landscape structure composed completely
of one uniform patch type extrapolated across the entire landscape, in effect eliminating
patch composition from consideration. This level of homogeneity does not exist in nature,
though extensive green roofs can become uniform and monoculture in their composition
such that as a group they are sometimes referred to as ‘sedum roofs.’ Green roof
81
composition is used here as a constant so that other patch metrics, such as proximity,
distance and size, all elements of landscape structure, can be more clearly measured.
Creating a city wide network of green roofs composed of habitat suitable for Indian
Skippers might be prohibitively expensive, but as the technology advances and better
information about species and green roofs as habitat becomes available, a more nuanced
landscape composition based on a higher complexity of patch types, designed and tested
for their suitability as habitat, might be possible. As demonstrated, a network might be
created that employed certain patches, or roofs, as feeding habitat and others areas on the
ground for breeding.
The potential for a network of green roofs to serve as habitat is essentially one of
landscape configuration, which refers to “the physical distribution or spatial character of
patches within the landscape” (McGarigal et al. 1994, 10). The spatial configuration of
patches, the location and dimension of the corridors and how they are configured to form
mosaics is one of the most basic elements of landscape ecology. All introductions to
landscape ecology begin with diagrams of patches that are used to convey broad
characterizations about how patch dispersal, size, and shape generally effect habitat
(Dramstad et al. 1996). The metrics derived for this study, such nearest neighbor, average
patch size, and proximity, all relate to how a specific landscape configuration, one
precisely predefined by the roofs of Baltimore’s rowhouses, and the analysis of that
configuration in terms of how it might effect a particular species of butterfly, Hesperia.
With further investigation, the measurements derived from this study might be interpreted
through a wider lens. Because many species have overlapping habitat requirements, some

82
generalizations could be made using other insects and invertebrates as the building blocks
of broader ecological communities.
Summary
At the city scale, this study found that a green roof adoption rate of 52% would be
require to lower the mean of the nearest neighbor distance to within 150’, the distance at
which a majority of Hesperia inter-patch migration occurs. In the more densely packed
neighborhood of Upper Fell’s Point, a 10% adoption rate in the residential sector would
achieve the same results. In neither case would the average patch size reach the necessary
minimum area to support breeding colonies, but some patches in both cases would and
the smaller patches could serve them as feeding habitat and stepping stones. Creating
habitat at the minimum adoption rates would require, at both scales, aggregating patches
to create patches of a size large enough to serve as breeding habitat.
Recognizing the theoretical nature of this evaluation, and the fact that this
research is merely intended as a reasonable demonstration of the potential for green roofs
to play a role in habitat restoration, every attempt was made to avoid abusing the
statistical output that Patch Analyst is capable of producing. That said, the primary goal
of this research was to measure landscape metrics as they might relate to one butterfly
species, Hesperia, and its ability to travel between patches as reported by Hill and
colleagues (Hill et al. 1996). In fact, any of the metrics produced by this study could be

83
debated, as well as the role of technologies, such as GIS, and how they are employed in
the service of the environment.
Considered at the landscape scale, green roofs, like most things green in the city,
represent small area patches, but they can be species-rich (Breuste et al. 2008, 1140). In
fact, because of the variety of human development types, urban ecosystems can often be
more varied than natural ones (Breuste et al. 2008, 1141). They also have the potential to
work in combination to provide greater ecosystem service potential. The only landscape
metrics being considered here, those pertaining to landscape configuration, ‘patchiness,’
patch size and certain measures relating to the distance between patches, were employed
with the recognition that even the statistics generated for these metrics merely represent
the beginning of the discussion of green roofs and habitat. A better understanding of
habitat requirements and how they might be extrapolated across an urban region might
give urban planners and landscape architects another tool for restoring flora and fauna to
an inner city that has not necessarily been thought of as habitat and green roofs could
potentially play a role in creating this habitat. This aspect of the research is ultimately
meant only as an interesting suggestion of one way in which ecology and planning might
intersect to improve our mutual environments.
84
Chapter 9: Green Roof Design
The composition of any green roof depends primarily on its ultimate functional;
whether that is primarily environmental, economic, or social and specific aspects or
systems will be tailored to meet these needs. The following is meant to provide a brief
overview of the functional components of green and some the issues involved in their
design, including the major component layers of a green roof and their maintenance. For
a more in depth discussion from a landscape architecture perspective, see “Green Roof
Systems” by Susan Weiler and also “Green Roof Plants” by Edmund Snodgrass.
Roof Components
As previously stated, with enough time and money virtually any environment can
be recreated over structure. In reality, budget and functional constraints limit the extent of
each green roof project. Green roofs are defined by soil depth and generally fall into three
categories. Intensive green roofs are defined as those with a soil depth greater than 12”.
Because of the deeper soil, this roof type can include a larger variety of plant species and
which can include trees and shrubs and this wide spectrum of plants requires more
intensive irrigation, fertilization, weeding, and pruning regimens. Semi intensive roofs
are those with soil between 6 and 12”, and extensive roofs are those with soil 6” or less in
depth. Because of these maintenance requirements, intensive green roofs are considered
only where programming and accessibility allows their aesthetic qualities to be
85
appreciated. For sustainability and ecological function, extensive green roof can often
accomplish as much and while generally costing substantial less (Getter et al. 2006).
This paper focuses on extensive green roofs, those with a soil depth of 3 to 6”,
and their potential to provide habitat for a particular species of butterfly. Extensive green
roofs are generally composed of shallow rooting, drought-tolerant plants such as sedums,
forbs, and grasses, which require little to no irrigation after the establishment period and
generally have less maintenance requirements overall (Getter et al. 2006, 1277).
Extensive green roofs can be designed using many combinations of layers, some of which
can be excluded entirely, depending the location, function and budget of the individual
project. An extreme example of an extensive roof would be a ‘single-course’ green roof,
one in which the substrate is laid directly over the membrane. Single course roofs are
practical in certain situations, such as utility buildings or unheated structures, where
insulation and drainage are not priorities. In most cases, however, a multi-course design
is required and includes some or all of the following elements:
Structure
The first consideration is the roof itself, its structural components and its
suitability as a platform for living material. The load bearing capacity for the project is a
sum of the live and dead loads associated with the design. Live loads consist of the
transient, or temporary, loads associated with occupancy, snow, wind, and short-term
storage requirements necessary during construction. Dead loads includes the weight of

86
the structure, hardscaping and any green roof layers added to it (Weiler et al. 2009, 97).
On existing structures, the load bearing capacity will present a limiting factor on the roof
design; new construction affords more flexibility and is more dependent on functional
requirements and budget. A green roof of 2 to 6” of soil will usually add an additional 14
to 42 pounds per square foot, depending on its construction (Weiler et al. 2009, 88). The
American Society for Testing and Materials (ASTM) offers guidelines for the load
bearing capacity of green roofs (ASTM 2005), but in all cases, consultation with a
structural engineer is necessary to determine the capacity of the roof to handle additional
live and dead loads (Peck 2007, 22).
Membrane
Waterproofing membranes falls into three categories: built up roofs (BUR),
single-ply membranes, and liquid membranes (Weiler et al. 2009, 135). Built-up
membranes commonly have a life span of 15-20 years (Weiler et al. 2009, 141). Built up
roofs typical consist of tarpaper covered with asphalt, or bitumen. The seams in this type
of roof are susceptible to root penetration and certain organic products used in their
construction can be attractive to plants; therefore a root barrier is usually recommended
(Weiler et al. 2009, 141).
Single-ply membranes are, as the name implies, constructed of single layer
membrane that provides all the waterproofing necessary. These are manufactured from a
variety of plastic and rubber materials, such as ethylene propylene diene Monomer

87
(EPDM) and polyvinyl chlorides (PVC.) EPDM membranes are considered the most
sustainable roofing material in terms of toxicity and recycling ability (Weiler et al. 2009,
137). Naturally root resistant, these types of membrane require no additional root barrier
and because they are available in sizes up to 50’ wide they can be applied to smaller roofs
(such as those typically found on a rowhouse) with few if any seams (Weiler et al. 2009,
141). Liquid membranes are produced from various compounds and applied in a single
application. These have the benefit of being seamless and are often used when the project
includes irregularly shaped structures, though they too may require a root barrier
depending on the material used.
Leak detection
Since the primary function of any roof is to prevent water from entering the
building, preventing leaks before the roof is fully planted is critical. Flood testing a roof
or use of a leak detection system is often a requirement for commercial installations that
may not be practical for residential projects. Flood testing involves blocking the drainage
points and covering the roof area with a certain depth of water for a specific amount of
time (usually 24 to 48 hours) and performing a visual inspection for leaks. Infrared
thermal imaging measures the different rates of heat gain between wet and dry areas.
Another technique involves the installation of moisture sensors under the membrane,
though the number of sensors installed limits the accuracy of this method. One of the
newer leak detection systems is called electric field vector mapping (EFVM), which

88
involves application of an electric field to the roof membrane. Considered to be the most
accurate and effective method for determining the soundness of the membrane, this
system can detect pin hole sized leaks and can be used before or after the roof is installed
(Miller et al. 2003; ILD 2010).
Insulation
Because of their location, green roofs can play a significant role in reducing
energy loss, though typically most of these savings occur in the summer (Liu et al. 2003;
Clark et al. 2008; Weiler et al. 2009, 150; Berghage 2010). Insulation added as part of the
green roof design is a component of these energy saving practices. Placing the insulation
outside the building envelope, on top of the waterproof membrane, is known as an
inverted roof membrane assembly (IRMA). This method of applying insulation reduces
condensation within the building while also providing another layer of protection to the
membrane itself. (Weiler et al. 2009, 154) Because of this protective property, insulation
can also be used anywhere the membrane extends to vertical surfaces, such as walls or
inside planters (Weiler et al. 2009, 156). The insulation also helps the plants by
separating them from the building, which might otherwise subject them to a greater
number of damaging freeze thaw cycles. (Weiler et al. 2009, 156) The soil and plants
themselves have no consistent r-value, whatever contribution they make to the overall
insulation of the building is can be considered negligible and subject to change based on
their moisture content and seasonal evapotranspiration rates (Weiler et al. 2009, 155).
89
Factors affecting the selection of insulation material include the function of green
roof and desired compressive strength, water absorption rates, depth restrictions, location
of insulation (in relation to other elements), other system components (Weiler et al. 2009,
151). Extruded polystyrene is one of the most commonly used insulation because it has a
high r-value and is lightweight. It is also available in a range compressive strengths
depending on the load bearing requirements, though it must be kept vented to retain its r-
value (DOW 2010). Other insulation materials include expanded polystyrene (EPS),
which is more resistant to moisture but typically has a lower compressive strength. EPS
and polyisocyanurate foams are also available in a range of thickness which can be
sculpted and shaped to achieve special design effects (Dyplast 2010). Because of the
possibility of pooling or the trapping of moisture under the insulation layer, a drainage
layer or mat is recommended to help facilitate water movement toward the drain (Weiler
et al. 2009, 156).
Drainage
A drainage layer is typically used under the soil layer to aid in removal of excess
water and to keep the soil aerated. On larger roofs, this layer would work in conjunction
with an integrated drainage system to convey excess precipitation off the roof. Proper
drainage is especially important on low-sloped roofs where standing water can create
load problems or damage plants (Weiler et al. 2009, 156). Several drainage layers can be
employed at different positions and using different materials. Stone aggregates, including
90
traditional material such as pea gravel, river rock, and crush stone, often can be locally or
regionally sourced. These should be washed to prevent to accumulation of fine particles
that could potentially clog the drainage layer. Expanded lightweight aggregates, such as
clay, slate or shale products, can be more expensive, but have the advantage of
contributing less to the overall dead load, always an important consideration in roof
design.
There are also many different products manufactured to provide drainage, some
designed especially with green roofs in mind and others adapted from other fields.
Drainage mats are synthetic rolls or panels designed to facilitate the movement of water,
and as such, they provide no excess water storage capacity. Designed specifically for
green roofs, drainage panels often incorporate a system of cups capable of retaining and
storing water, thus improving the overall ability of the roof itself to absorb rainfall
(Weiler et al. 2009, 163).
Root Barrier/ Other
Where the water proofing membrane is constructed from organic asphalt material
attractive to plants or with seams that might allow potential root penetration, a root
barrier is required to prevent penetration of the membrane. Synthetic materials (EPDM,
PVC, etc) are typically root resistant and may preclude installation of a root barrier. The
root barrier can be placed in various positions, depending on the membrane, the
insulation, and the drainage material used; however, if improperly placed the root barrier
91
can trap moisture and cause deterioration in the insulation (Weiler et al. 2009, 147).
Other layers that are used in green roof construction can include a permanent protection
layer to prevent damage to the waterproof membrane; several commercial products are
available for this purpose. Moisture retention mats can also be used and are particularly
effective in conjunction with irrigation systems as most living roof soils do not wick
moisture well themselves.
Substrate
Since it is the most massive element and must support plant growth, substrate
composition is one of the most critical aspects of roof design. A typical living green roof
with a depth of 2 to 6 inches can weigh anywhere from 14 to 42 pounds per square inch
depending largely on the substrate used (Weiler et al. 2009, 88). Any material in the soil
spectrum could be used, but because of the application, green roof soils require special
consideration (Weiler et al. 2009, 166). Naturally occurring soils are generally not used
for many reasons; they are heavy, particularly when wet, but also they tend to compact
easily and the fine particulates in most soil profiles can impend drainage (Weiler et al.
2009, 166). Occasionally, naturally occurring soils are mixed with additives to create a
more desirable profile, but most roof substrates are manufactured. To maximize benefits
while also reducing costs, green roof design has evolved to require the lightest possible
substrate, which translates into a thin and quick draining soil. While this reduces the need
92
for structural changes, it also creates a severe limiting factor in an already harsh
environment, which often includes exposure to high winds and long periods of direct sun.
These substrates are more analogous to the media used for container plants,
having the advantage of being lightweight, resistant to compacting, and freely draining.
And because of the design requirements of extensive green roofs and the need to reduce
roof loads, lightweight, mineral-based materials make up a large percentage of the
volume of these manufactured substrates (Oberndorfer et al. 2007, 826). Though they
vary regionally and from project to project, the base material of these can include
expanded clay or shale, lava rock, and crushed brick. A typical substrate will be 80-85%
lightweight aggregate; the rest is composed of organic matter. Ideally, this mix will be
specified weed free to reduce future maintenance. The composition of the substrate will
determine its bulk density, water-holding capacity, and nutrient balance, which, in turn,
will be informed by the roof’s function and the plants it must support (Berghage, 01/29).
Plants
Plant selection will be determined by a number of factors related to the roof
design itself. Substrate depth will be a limiting factor in determining the plant palette on
any given installation. Intensive roofs tend to emphasize aesthetic qualities more than
extensive installations, which may not be accessible to the public. A wider variety of
plant material is also available for intensive roofs with their deeper substrate depths and
the probable inclusion of supplemental irrigation, whereas the plants used on extensive
93
roofs must be adapted to extreme conditions including periodic droughts. Plant selection
is also dependent regional weather and micro-climate, such as sun exposure, rainfall, and
temperatures fluctuations, which may further narrow the range of species available for
consideration (Getter et al. 2006, 1280). Depending on the design intent, other criteria to
consider will include establishment period, longevity, and disease and pest resistance as
well as the substrate composition and depth.
In selecting plants for extensive roofs, with their thin substrate profiles (3-6”) and
the desire to limit irrigation, drought tolerance is a key trait. In light of the conditions
present, there is still a range of suitable plants, with grasses and other, taller herbaceous
perennials thriving in the thicker soils and sedums and other lowing-growing plants more
adapted to the minimum (Oberndorfer et al. 2007, 825). The plant palette might also
include drought tolerant Sempervivums and Delosperma; however the genus Sedum is
particularly well adapted to roof top conditions and is well represented in any discussion
of green roofs plants. They provide the necessary function without the irrigation
requirements and contribute little added weight. They are drought and sun tolerant,
persistent, and structured for storing excess water. Though they are the preeminent green
roof plant today, over-reliance on sedums has lead to an interest in diversifying the plant
palette to include other species adapted to dry conditions. Other plants to consider would
be any grasses, perennials, or bulbs naturally adaptable to extreme condition that might
be experienced on a roof.
Installation methods include direct planting (using seeds, plugs, or container
plants) and modular plantings, where containers, trays, or blankets are started off site
94
before installation. Another option is natural colonization, wherein the soil and substrate
are installed and plants establish themselves through natural vectors such as wind and
bird droppings (Getter et al. 2006, 1282). As with most plants, spring is the best time to
plant. Cooler temperatures and increased rainfall allow the plant to establish before the
advent of hot weather.
As the green roof industry in this country matures, more plants will continue to
become available. How these plants are deployed is suggested by the combination of
factors considered in the construction of the roof itself, its climate, function and form
(Weiler et al. 2009, 169; Berghage 2010).
Maintenance
Specific maintenance requirements must be determined on a roof-by-roof basis,
but there are a few common considerations. At a minimum, most green roofs require
some irrigation during the first two growing seasons or until the plants become well
established. Deeper substrates, with less drought tolerant communities, may require
regular watering and the installation of a permanent irrigation system operated on a fixed
schedule. Most roof-adapted plants, however, are very drought tolerant and excessive
watering is unnecessary and may encourage weeds. After the establishment period,
maintenance (weeding, replanting, fertilizing) and water needs can be determined through
an annual inspections regime (Getter et al. 2006, 1282; Berghage 2010).
95
Soil testing, of some kind, should be scheduled on yearly intervals. These soils
exist in an unnatural environment, exposed to extreme conditions that do not allow them
to achieve a balance as naturally occurring soils might. Soil tests are available through
agricultural extensions such as Penn State’s Ag Analytical Services (aasl.psu.edu) that
can help ensure proper ph and nutrient levels are maintained over the life of the roof. As
one of the primary functions of a green roof is to reduce the negative effects of storm
water, careful management of the nutrient levels is critical to reduce runoff of excess
nitrogen, phosphorus, and other compounds. Most green roof plants thrive in low fertility
soils and annual testing can help maintain a proper balance in the nutrient levels, thereby
reducing contamination in the effluent and discouraging weed growth. In addition,
reducing nutrients, while it might result in slower growth, also can increase survival rates
in certain species, as they produce less tender top growth. In consideration of water
quality issues, application of fertilizer and pesticides should done judiciously (Getter et
al. 2006; Berghage 2010).
Because they demand less service, weigh less (and therefore require fewer
structural upgrades) and cost less in both the traditional sense and in terms of the
environment, extensive roof are considered a sustainable alternative to traditional roofing
practices and as green roofs gain wider use and research continues, the palette of plants
available will also expand.

96
Green roofs as habitat
Figure 9.1: Sample Green Roof Section
Species ‘Cultivar’ Ht
Panicum virgatum 'Prairie Fire' 3-6’
Agrostis hyemalis – Winter Bent Grass (see USDA) 1-2’
Festuca rubra
Symphyotrichum oblongifolium ‘October Skies’ (aromatic aster) 30”
(Snodgrass et al. 2006; USDA et al. 2010)
97
In order to create habitat to for a population of Hesperia, plant communities
would need to be established beyond that minimum employed in a standard sedum roof.
As they have many overlaps in the plant associations they inhabit (see table 9.1), these
roofs could recreate food and shelter opportunities for a variety of grass skippers
simultaneously. Though they are reported to be somewhat selective in the caterpillar
stage (host plants include Panicum, Andropogon, and Agrostis) as adults they will take
nectar from wide range of flowering plants, varieties of many suitable for rooftop
conditions. Green roofs could be modified to include some areas where the substrate
could be mounded to provide support for the larger grasses this species requires during its
caterpillar stage and also for feeding (see figure 9.1).
The additional moisture requirements of these grasses would require supplemental
irrigation either through a permanent system or via periodic watering, which might be
maximized with the addition of a moisture retention mat. Periodic maintenance, such
pruning or cutting back, would have to take into consideration the life cycle requirement
of Hesperia and their need to over winter on a specific grassy plant. Plantings established
plugs would be preferred over seeding as this would necessitate excessive weeding
(Snetsinger 2010, 02/22). The natural habitat of the grass skippers observed in the
Baltimore region, as well as those of the British population tracked in the 1996 study,
approaches that seen on some green roofs planted with grassy meadow communities,
with further research and trial programs, a more roof adapted combination of plant
material might be developed that might better serves the necessary habitat requirements
while also minimizing additional weight and maintenance requirements.

98
Table 9.1: Hesperia Habitat requirements
Scientific /Common Status/ Range Adult Food Caterpillar food plants Habitat/ Plant
Communities
Hesperia leonardus/ Leonardus Skipper or
Pawnee Skipper
Threatened. Uncommon and
locally rare/ Nova Scotia to Minn./
SC to Ark. Reported in Balt Co, Howard and
south
Flower nectar, especially from
blazing star (Liatris punctata), but also
thistles, asters, teasel, and others.2
Andropogon, Verbena, Spotted
Knapweed, Joe-pye-weed1
Various grasses: Panicum virgatum, Eragrotis alba,
Danthonia spicata, Agrostis, Andropogon.1
Blue grama (Bouteloua gracilis) 3
Reliant on old fields,
meadows, and open grassy
areas including native prairies, fields, barrens, and meadows.3
Hesperia metea/
Cobweb skipper
Locally common, particularly along
the Atlantic Coastal Plain/ ME to Wisc south to GA, MS, TX1
Reported in Balt Co, Howard and
south…3
Nectar from flowers of low-growing plants such as
Labrador tea, wild strawberry,
blackberry, bird's-foot violet, winter
cress, and red clover; also lilac, vervain, Carolina larkspur,
and wild hyacinth.3
Andropogon scoparius/ other Andropogons2 Larvae
develop in grass clumps,
Eragrostis (African Lovegrass) 1 Beard grasses including little bluestem (Andropogon scoparius
and A. s. var. glomeratus) and big bluestem (A.
gerardi). 3
Prefers sparsely vegetated areas
and sandy environs1 Dry,
grassy openings in woods, pine barrens, oak
savannah, open sandy scrub, burned areas, old pastures.3
Hesperia sassacus/
Indian Skipper
Rare in its southern range/
ME, MN south to NJ and IN/
Reported in Balt Co and the
northern tier in MD
Nectar from flowers including blackberry, henbit, lithospermum,
phlox, and viper's bugloss.3
Grasses, Panicum, Poa annua, Festuca rubra,
Andropogon1 Panicum is the preferred native food, feeds also on Crabgrass (Digitaria sanguinalis) 2
Scrubby fields, short grasslands,
and dry hillsides1 Old brushy fields,
pastures, clearings,
headlands.3
1. (Gochfeld et al. 1997, 236-9)
2. (Howe 1975, 471, 474, 478)
3. (Opler et al. 2010)
99
Chapter 10: Concluding remarks
“It may well be doubted whether human ingenuity can construct an enigma...
which human ingenuity may not, by proper application, resolve.”
- E. A. Poe
Urban regions are often viewed as ecologically dysfunctional. Changing the
environmental performance of our cities requires a multi-faceted, interdisciplinary
approach, one that will help to inform the design and planning professions as they shape
the future direction of our cities. Addressing the issues of our metropolitan areas will also
help to alleviate pressure on rural lands; making cities more sustainable reduce resource
demands furthering slow development pressures further afield. Green roofs might play a
small part by providing welcomed green space or they may have larger ecological role in
future urban landscapes. To this end, the ability of green roofs to function as a component
in urban stormwater mitigation efforts is widely recognized, while their habitat potential,
though still untested, holds some promise as another way of motivating adoption of this
new technology. Education and outreach efforts will provide consumers with a clearer
understanding of the value of this technology and help stakeholders and potential
adopters make more informed decisions (Straus et al. 2006; Tzoulas et al. 2007; Forman
2008). We have always adapted in one way or another to challenges of our own making.
Regional environmental issues, such as unabated runoff and continued habitat loss,
require new approaches to create a stronger green infrastructure, a healthier environment
and more unique places for urban residents. Green roofs will contribute something
toward restoring our urban environments, how much they contribute remains to be seen.
100
Works Cited
Arnold, C. A. and C. J. Gibbons (2006). "Impervious Surface Coverage: the Emergence of a Key Environmental Indicator." Journal of the American Planning Association 62(2).
ASLA and SSI (2008). The Sustainable Sites Initiative: Guidelines and Performance Benchmarks.
ASTM (2005). 2397-05 - Standard practice for determination of dead loads and live loads associated with green roof systems. West Conshohocken, Pa., ASTM International.
Baird, C. T. and B. Szczygiel (2006). "Sociology of Professions: The Evolution of Landscape Architecture in the United States." Landscape Review 12(1): 3 - 25.
Baumann, N. (2006). "Ground-Nesting Birds on Green Roofs in Switzerland: Preliminary Observations." URBAN HABITATS 4(1): 37-50.
BC (2009). The Baltimore Sustainability Plan/ Baltimore Commission on Sustainability. Balt., MD, Baltimore City Planning Commission.
Berghage, R. (2010). Hort 497a: Green Roofs and Living Walls. University Park, PA, PSU.
Berghage, R. D., D. Beattie, et al. (2009). Green Roofs for Stormwater Runoff Control. Cincinnati, OH, EPA Urban Watershed Management Branch, Office of Research and Development: 81.
Berndtsson, J. C., T. Emilssonb, et al. (2005). "The influence of extensive vegetated roofs on runoff water quality." Science of the Total Environment 355: 48-63.
Boone, C. G. (2003). "Obstacles to Infrastructure Provision: The Struggle to Build Comprehensive Sewer Works in Baltimore." Historical Geography 31: 151-168.
Bourn, N. (2010). "Silver-spotted Skipper." A-Z of Butterflies Retrieved 01/25/2010, from http://www.butterfly-conservation.org/Butterfly/32/Butterfly.html?ButterflyId=46.
Bourn, N. (2010). "Silver-spotted Skipper." A to Z of Bauuterflies, 01/25/2010, from http://www.butterfly-conservation.org/Butterfly/32/Butterfly.html?ButterflyId=46.
Brenneisen, S. (2006). "Space for Urban Wildlife: Designing Green Roofs as Habitats in Switzerland." URBAN HABITATS 4(1): 27-36.
Breuste, J., J. Niemela, et al. (2008). "Applying landscape ecological principles in urban environments." Landscape Ecology 23: 1139-1142.
101
BWW. (2010). "Bureau of Water & Wastewater." Retrieved 02/18/2010, from http://www.baltimorecity.gov/Government/AgenciesDepartments/PublicWorks/DepartmentBureaus/BureauofWaterWastewater.aspx.
Carter, T. and C. Butler (2008). "Ecological impacts of replacing traditional roofs with green roofs in two urban areas." Cities and the Environment 1(2): 17.
Carter, T. and L. Fowler (2008). "Establishing Green Roof Infrastructure Through Environmental Policy Instruments." Environmental Management 42: 151-164.
Carter, T. and C. R. Jackson (2006). "Vegetated roofs for stormwater management at multiple spatial scales." Landscape and Urban Planning 80 (2007) 84–94.
Carter, T. and A. Keeler (2006). "Life-cycle cost–benefit analysis of extensive vegetated roof systems." Journal of Environmental Management 87: 350-363.
CBP (2008). A Health and Restoration Assessment of the Chesapeake Bay and Watershed in 2008. C. B. Program. Annapolis MD.
Chamberlain, L. (2005). Assets; It Pays to Plant a Street Tree. New York Times. NY.
Chapelle, S. (2000). Baltimore: an Illustrated History, American Historical Press, SunValley, CA.
CityRating.com. (2010). "Baltimore Weather History." Weather History Retrieved 01/31/2010, from http://www.cityrating.com/cityweather.asp?city=Baltimore.
Clark, C., P. Adriaen, et al. (2008). "Green Roof Valuation: A Probabilistic Economic Analysis of Environmental Benefits." Environmetal Science and Technology 42(6): 2155-2125.
Clark, M. and S. MacArthur (2007). Green Roof Soil Arthropod Functional Diversity, Does it Exist? Greening Rooftops for sustainable communities. Minneapolis, MN.
CNT. (2010). "Green Values Stormwater Calculator." Retrieved 01/12/2010, from http://logan.cnt.org//calculator/calculator.
Coffman, R. (2009). "Elevating habitat: a quasi-traditional green roof design can increase biodiversity in cities." Landscape architecture 99(1): 77.
Coffman, R. R. and G. Davis (2005). INSECT AND AVIAN FAUNA PRESENCE ON THE FORD ASSEMBLY PLANT ECOROOF. Greening Rooftops for Sustainable Communities. Washington, DC, GRHC.
Copeland, C. (1999). Clean Water Act: A Summary of the Law. CRS Report RL30022. C. R. S. (CRS). Washington DC, Environment and Natural Resources Policy Division.
Cox, M., J. Shyer, et al. (2008). Harlem Green Roof Suitability Assessment: Final Report. New York, Education Center for Sustainable Engineering/GRIC/Columbia University.
102
Crompton, J. L. (2001). "The Impact of Parks on Property Values: A review of the Empirical Evidence." Journal of Leisure Research v.33(no.1): pp.1-33.
Cronin, E. L. (1987). The Bounty of the Bay. Maryland, our Maryland. V. Geiger. Lanham, MD, University Press.
Cronshey, R., R. H. McCuen, et al. (1986). TR-55: Urban Hydrology for Small Watersheds. USDA. Washington, DC.
CUERE (2003). Creating an urban ecosytem of green and blue spaces in Baltimore. Baltimore, MD, Center for Urban Environmental Research and Education, UMBC.
DEP (2006). Pennsylvania Stormwater Best Management Practices Manual. BWM. Harrisburg, PA, DEPARTMENT OF ENVIRONMENTAL PROTECTION.
Dill, J. (2007). "Susquehannock History." First Nations: Issues of Consequence Retrieved Dec. 12, 2009, from http://www.dickshovel.com/susque.html.
DOW (2010). Green Roof PMR – A Design Primer. Midland, MI, Dow Chemical.
DPE (2010). COMAR 26.17.02: Stormwater Management. D. o. t. Environment. Baltimore, MD, DPE.
DPW (2006). CITY OF BALTIMORE COMPREHENSIVE WATER AND WASTEWATER PLAN. B. O. &WASTEWATER. Baltimore City, MD, DEPARTMENT OF PUBLIC WORKS.
DPW. (2007). "Bureau of Water & Wastewater Fact Sheet." Retrieved 02/08/2010, from http://www.baltimorecity.gov/Government/AgenciesDepartments/PublicWorks/DepartmentBureaus/BureauofWaterWastewater.aspx.
Dramstad, W. E. (1996). Landscape ecology principles in landscape architecture and land-use planning Cambridge, Mass, Harvard University GSD.
Dramstad, W. E., J. D. Olsen, et al. (1996). Lanscape Ecology Principles in Landscape Architecture and Land-Use Planning. Washingon, DC, GSD, ASLA, and Island Press.
Dunnett, N. and N. Kingsbury (2004). Planting Green Roofs and Living Walls. Portland, Timber Press.
Dyplast. (2010). "EPS Insulation." Retrieved 02/02/2010, from http://www.dyplastproducts.com/products_EPS.htm.
Elkie, P. C., R. S. Rempel, et al. (1999). Patch Analyst User’s Manual: A Tool for Quantifying Landscape Structure. Ontario, Canada, Ontario Ministry of Natural Resources, Northwest Science & Technology.
Elmore, A. J. and S. S. Kaushal (2008). "Disappearing headwaters: patterns of stream burial due to urbanization." Frontiers in Ecology 6.
103
EPA (1999). Preliminary Data Summary of Urban Storm Water Best Management Practices. Washington, DC, Environmental Protection Agency.
Florida, R. (2004). The Rise of the Creative Class : and how it's transforming work, leisure, community and everyday life. New York, NY, Basic Books.
Forman, R. T. T. (1986). Landscape Ecology. New York, NY, Wiley.
Forman, R. T. T. (1995). Land Mosaics. Cambridge, University Press.
Forman, R. T. T. (1995). "Some General Principles of Landscape and Regional Ecology." Landscape Ecology 10(3): 133-142.
Forman, R. T. T. (2008). Urban Ecology: Ecology and Planning Beyond the City. Cambridge, Cambridge University Press.
Frith, M. and D. Gedge (2005). AN EYE FOR THE GREEN TOP: AN INDEPENDENT VOICE FOR GREEN ROOFS IN THE UK. Greening Rooftops for sustainable communities. Washington,DC, GRHC.
Gabrielle, J. E. and K. Schaefer (2001). Green Building Template: A Guide to Sustainable Design Renovating for Baltimore Rowhouses, The Maryland Department of Natural Resources.
Gedge, D. and M. Frith (2004). GREEN ROOFS: Benefits and cost implications. London, Sustainable Eastside.
Gedge, D. and G. Kadas (2005). "Green roofs and biodiversity." Biologist 52(3): 161-169.
Getter, K. L. and D. B. Rowe (2006). "The Role of Extensive Green Roofs in Sustainable Development." HORTSCIENCE : 41(5): 1276–1285.
Getter, K. L., D. B. Rowe, et al. (2007). "Quantifying the effect of slope on extensive green roof stormwater retention." Ecological Engineering 31: 225-231.
Gilderbloom, J. (2008). The Invisible City: Poverty, Housing, and New Urbanism. Austin, TX, University of Texas Press.
Gochfeld, M. and J. Burger (1997). Butterflies of New Jersey: A guide to their status, distribution, conservation, and appreciation. New Brunswick, NJ, Rutgers University Press.
Godefroid, S. and N. Koedam (2007). "Urban plant species patterns are highly driven by density and function of built-up areas " Landscape Ecology 22: 1227-1239.
Gorenflo, L. G. and K. Brandon (2005). "Key Human Dimensions of Gaps in Global Biodiversity Conservation." Bioscience 56(9).
Gottlieb, C. W. (1975). Site Selection Policies and Practices on the Success and Failure of the Federal Public Housing Program: The Case of Baltimore Center for Metropolitan Planning and Research. Baltimore, MD, Johns Hopkins University.
104
Grant, G., L. Engleback, et al. (2003). Green Roofs: their existing status and potential for conserving biodiversity in urban areas. English Nature Research Report No.498. Peterborough, U.K, English Nature
GSA. (2010). "Sustainable Design Program." Retrieved 02/29/2010, from http://www.gsa.gov/Portal/gsa/ep/contentView.do?contentType=GSA_OVERVIEW&contentId=8154.
Hayward, M. E. (2008). Baltimore's alley houses: homes for working people since the 1780's. Baltimore, JHU Press.
Hayward, M. E. and C. Belfoure (1999). The Baltimore Rowhouse. New York, NY, Princeton Architectural Press.
Hill, J. K., C. D. Thomas, et al. (1996). "Effects of Habitat Patch Size and Isolation on Dispersal by Hesperia comma Butterflies: Implications for Metapopulation Structure." Journal of Animal Ecology 65(6): 725-735.
Hollander, J. H. (1899). The Financial History of Baltimore, John Hopkins Press, Balt.
Howe, W. H. (1975). The Butterflies of North America. Garden City, NY, Doubleday & Co.
Hunter, W. H. and C. Elam (1957). Century of Baltimore Architecture. Baltimore, MD, The Peale Museum.
ILD. (2010). "International Leak Detection (ILD)." Retrieved 02/22/2010, from http://www.leak-detection.com/.
Isaacs, L. (2002). Baltimore agrees to big ticket fine, sewer upgrades. Amercian City and County, Communication Channels, Inc.
Jabareen, Y. R. (2006). "Sustainable Urban Forms: Their Typologies, Models, and Concepts." Journal of Planning Education and Research 26: 38 - 52.
Jacobs, J. (1961). The Death and Life of Great American Cities. New York, NY, Random House.
Jacobs, M. (1996). Green Jobs? The Employment Implications of Environemental Policy: Sustainable Development and the 'Double Dividend.'. A Reader: Business and the Environment. R. Welford and R. Starkey. Washington, DC, Taylor & Francis.
Jarrett, A. R., W. F. Hunt, et al. (2006). Annual and Individual-Storm Green Roof Stormwater Response Models. ASABE Annual International Meeting. Portland, Oregon, ASABE.
Jones, R. (2002). TECTICOLOUS INVERTEBRATES: A preliminary investigation of the invertebrate fauna on green roofs in urban London. English Nature Research Report. Peterborough, U.K, English Nature.
Kadas, G. (2006). "Rare Invertebrates Colonizing Green Roofs in London." URBAN HABITATS 4(1): 66-86.

105
Kavanaugh, K. B. (2009). "It's Not Easy Being Green." Retrieved 03/06/09, from http://www.metromodemedia.com/features/greenbuildingstandardsmichigan0106.aspx.
Kloss, C. and C. Calarusse (2006). ROOFTOPS TO RIVERS: Green Strategies for Controlling Stormwater and Combined Sewer Overflows. N. Stoner. New York, NY, Natural Resources Defense Council.
Kosareo, L. and R. Ries (2006). "Comparative environmental life cycle assessment of green roofs." Building and Environment 42: 2606-2613.
Leitao, A. B., J. Miller, et al. (2006). Measuring Landscapes: a planners handbook. Washington, DC, Island Press.
Liu, K. and B. Baskaran (2003). Thermal performance of green roofs through field evaluation. Ottawa, National Research Council, Institute for Research in Construction.
Lowitt, P. C. (2009). "Green Roofs for Healthy Cities North America." from http://www.greenroofs.org/.
Lundholm, J. (2005). A HABITAT TEMPLATE APPROACH TO GREEN BUILDING SURFACES. Greening rooftops for sustainable communities. Washington, DC, GRHC.
MacMillan, G. (2004). YORK UNIVERSITY ROOFTOP GARDEN STORMWATER QUANTITY AND QUALITY PERFORMANCE MONITORING REPORT. Greening Rooftops for Sustainable Communities. Portland, OR.
McGarigal, K. and B. Marks (1994). FRAGSTATS: SPATIAL PATTERN ANALYSIS PROGRAM FOR QUANTIFYING LANDSCAPE STRUCTURE. Covallis, OR, Forest Science Department, Oregon State University.
McHarg, I. (1969). Design with Nature. Garden City, N.Y, Natural History Press.
MDE (2000). MARYLAND STORMWATER DESIGN MANUAL. Ellicott City, MD, Center for Watershed Protection, MD Dept of Environment.
MDP (2007). Maryland, Growing Smarter. Baltimore, MD, Maryland Department of Planning. Publication No. 2007-002.
Mentens, J., D. Raes, et al. (2006). "Green roofs as a tool for solving the rainwater runoff problem in the urbanized 21st century?" Landscape and Urban Planning 77(3): 217-226.
Meyer, E. K. (2000). Post-Earth Day Conundrum: Translating Environmental Values into Landscape Design. Environmentalism in Landscape Architecture. M. Conan. Washington, DC, Dumbarton Oaks Research Library and Collection.
Miller, B. (2005). HYDRAULIC MANUAL. Salem, OR, OREGON DEPARTMENT OF TRANSPORTATION
106
Miller, C. and C. Eichhorn (2003). EFVM: A New Leak Detection Technique. Phila., PA.
Moran, A. C. (2004). A North Carolina Field Study to Evaluate Greenroof Runoff Quantity, Runoff Quality, and Plant Growth. Biological and Agricultural Engineering, NCSU. MS: 282.
Mumford, L. (1961). The City in History: Its origin, its transformation and its prospects. New York, Harcourt, Brace & World.
NCI. (2007). "CZMP and Native Brook Trout in Baltimore County." NORTH COUNTRY PRESERVATION OCCASIONAL RESEARCH REPORT, from http://www.northcountypreservation.org/news_nativebrook.htm.
Ndubisi, F. (2002). Ecological Planning: a historical and comparative synthesis. Baltimore, MD, Johns Hopkins University Press.
Ndubisi, F. (2002). Ecological Planning: a historical and comparative synthesis. Baltimore, MD, Johns Hopkins University Press.
O'Malley, M. (2009). Governor O’Malley’s Chesapeake Bay Restoration Plan: BaySTAT. Annapolis, MD, Dept of Agriculture, DNR, MD Dept of Planning.
O'Malley, M. and MD (2007). EXECUTIVE ORDER 01.01.2007.02: BayStat. Anapolis, MD, State of MD.
Obama, B. (2009). "Executive Order: Chesepeake Bay Protection and Restoration." Retrieved Nov. 11, 2009, from http://www.whitehouse.gov/the_press_office/Executive-Order-Chesapeake-Bay-Protection-and-Restoration/.
Oberndorfer, E., J. Lundholm, et al. (2007). "Green Roofs as Urban Ecosystems: Ecological Structures, Functions, and Services." Bioscience Vol. 57(No. 10): 823-833.
Opler, P. A., K. Lotts, et al. (2010). "Butterflies and Moths of North America." Retrieved 01/25/210, 2010, from http://www.butterfliesandmoths.org/.
Opler, P. A., K. Lotts, et al. (2010). "Family: Skippers (Hesperiidae)." Butterflies and Moths of North America Retrieved 01/27/2010, from http://www.butterfliesandmoths.org/taxonomy?f=19&sci=Hesperiidae&com=Skippers.
Orff, K. (2005). "Beyond landscape." Volume (Amsterdam, Netherlands) n.1: p.58-59.
Ortega-Álvareza, R. and I. MacGregor-Forsb (2008). "Living in the big city: Effects of urban land-use on bird community structure, diversity, and composition." Landscape and Urban Planning 90: 189-195.
Pahl, R. E. (1975). Whose City? And further essays on Urban Society. Baltimore, MD, Penguin.

107
Peck, S. (2007). Green Roof Infrastructure. Landscape Architecture Technical Information Series (LATIS). A. S. o. L. Architects. Wash., DC, ASLA.
Pickett, S. and M. Cadenasso (2008). "Future Directions No. 1: Linking ecological and built components of urban mosaics: an open cycle of ecological design." Journal of Ecology 96: 8-12.
Pouyat, R., I. Yesilonis, et al. (2010). "Soil Research Projects: Classification and Mapping of Urban soils " Retrieved 01/27/2010, from http://www.beslter.org/frame4-page_3a_06.html.
PPF (2004). VISUAL GLOSSARY: Stormwater Management Practices. P. P. Foundation. Baltimore, MD, Dept Public Works.
Rempel, R. (2008). Patch Analyst for ArcGIS. Thunder Bay, Ontario, Centre for Northern Forest Ecosystem Research (Ontario Ministry of Natural Resources).
Rogers, E. M. (2003). Diffusion of innovations. New York, Free Press.
Snetsinger, R. (2010). Personal Communication. Author. State College, PA, Dept of Entomology.
Snodgrass, E. C. and L. L. Snodgrass (2006). Green Roof Plants. Portland, OR, Timber Press.
Stanton, P. (1997). Baltimore in the Twentieth Century. A Guide to Baltimore Architecture. J. Dorsey and J. H. Dilts. Centreville, MD, Tidewater Publishing: 31 - 56.
Steiner, F. (2006). Preface. The essential Ian McHarg: writings on design and nature. F. Steiner. Washington, DC, Island Press.
Steiner, F. (2008). The Living Landscape. Washington DC, Island Press.
Stender, I. (2002). "Policy Incentives for Green Roofs in Germany." The Green Roof Infrastructure Monitor 4(1): 10-11.
Stosur, T. and C. Casciani (2009). The Baltimore Sustainability Plan. B. C. o. Sustainability. Baltimore, MD, Baltimore City Planning Commission.
Straus, J. and M. Caulkins (2006). "The Adoption of an Innovation: Barriers to the use of Green Roofs experienced by Midwest architects and building owners." Journal of Green Building vol.1(no.3): pp148-168.
Tarquinio, J. A. (2009). A Green Amenity, Above It All. New York Times. NYC. Sept. 30, 2009.
Teemusk, A. and U. l. Mander (2007). "Rainwater runoff quantity and quality performance from a greenroof: The effects of short-term events." Ecological engineering 30(3): 271-277.

108
Troll, C. and E. Fischer (1949). "Geographic Science in Germany during the Period 1933-1945: A Critique and Justification " Annals of the Association of American Geographers 39(2): 99-137.
Tzoulas, K., K. Korpela, et al. (2007). "Promoting ecosystem and human health in urban areas using Green Infrastructure: A literature review." Landscape and Urban Planning 81: 167-178.
USCB. (2010). "U.S. Census." U.S. Census Bureau: State and County QuickFacts Retrieved 01/30/2010, from http://quickfacts.census.gov/qfd/states/24/24510.html.
USDA (1986). TR-55: Urban Hydrology for Small Watersheds, Dept of Agriculture, Washington, DC.
USDA and NRCS. (2010). "The PLANTS Database, Natl Plant Data Center." Retrieved 02/02/2010, from http://plants.usda.gov.
Velazquez, L. S. (2003). "Sky Gardens: Travels in Landscape Architecture." Retrieved 02/19/2010, from http://www.greenroofs.com/archives/sg_oct03.htm.
Wark, W. W. (2004). "Growing Green Roofs in the United States." Retrieved 01/20/2010, from http://www.greenroofs.com/archives/gf_aug04.html.
Weiler, S. K. and K. Scholz-Barth (2009). Green Roof Systems: A guide to the planning, design, and construction of Landscape Systems over Structure. Hoboken, NJ, John Wiley and Sons.
Weinstein, N. (2010). "The Low Impact Development Center: Green Roof Demonstration Project." 02/22/2010, from http://www.lowimpactdevelopment.org/green_infrastructure.htm.
Wong, T. H. F. (2006). Integrated Approach to Urban Stromwater Management. BMP Technology in Urban Watersheds. R. Field and S. Struck. Reston, VA, Amer. Society of Civil Engineers: 24-35.