why proteomics? - biostatistics - departments - johns...
TRANSCRIPT

1
Applications of Mass Spectrometry to Proteomics
Raghothama Chaerkady, Ph.D.
McKusick-Nathans Institute of Genetic Medicine and the Department of Biological Chemistry
Why Proteomics?
One Gene, Many Proteins
Gene mRNA Protein
Gene
mRNA1mRNA2mRNA3mRNA4mRNA5
Alternativesplicing
Protein1Protein2Protein3Protein4Protein5Protein6....
Proteini
Co/post-translational processing

2
Why Mass Spectrometry?
http://nobelprize.org
Protein Characterization by Mass Spectrometry
• Very sensitive: Less than 1 pmol of protein is required for identification (50 ng of a 50 kDa protein)
• Mixtures of proteins (hundreds to thousands of proteins) can be analyzed
• Proteins with a blocked N terminus can be identified• Post-translational modifications such as phosphorylation
can be identified and localized• Quantitative mass spectrometry has numerous
applications

3
Electrospray Tandem Mass Spectrometry (MS/MS)
• MS1 Scan - Detection of all the peptides in a mixture
• MS/MS - When one of the peptides is isolated and subjected to collision induced dissociation for sequencing
• Tandem mass spectrometry provides the actual sequence of the peptide
Peptide Sequencing by MS/MS
Select one peptide
Fragments containing Carboxyl-terminus
Y7
Collision
Y6
Y5
Y4
Y3
Rel
ativ
e In
tens
ity (%
)
m/z
MS/MS Spectrum

4
Biological changes(morphogenesis)
Profiling of proteins
Proteome ‘n’Proteome 1
Proteome 1 Proteome 2 Proteome ‘n’Proteome 3Proteome 4
Genomics and Proteomics
mRNA and Protein Correlation
insightNature 422, 198-207
Generic mass spectrometry (MS)-based proteomics experiment.

5
Mass spectrometers used in proteome research.
In reflector time-of-flight (TOF) instruments, the ions are accelerated to high kinetic energy and are separated along a flight tube as a result of their different velocities. The ions are turned around in a reflector, which compensates for slight differences in kinetic energy, and then impinge on a detector that amplifies and counts arriving ions.
6
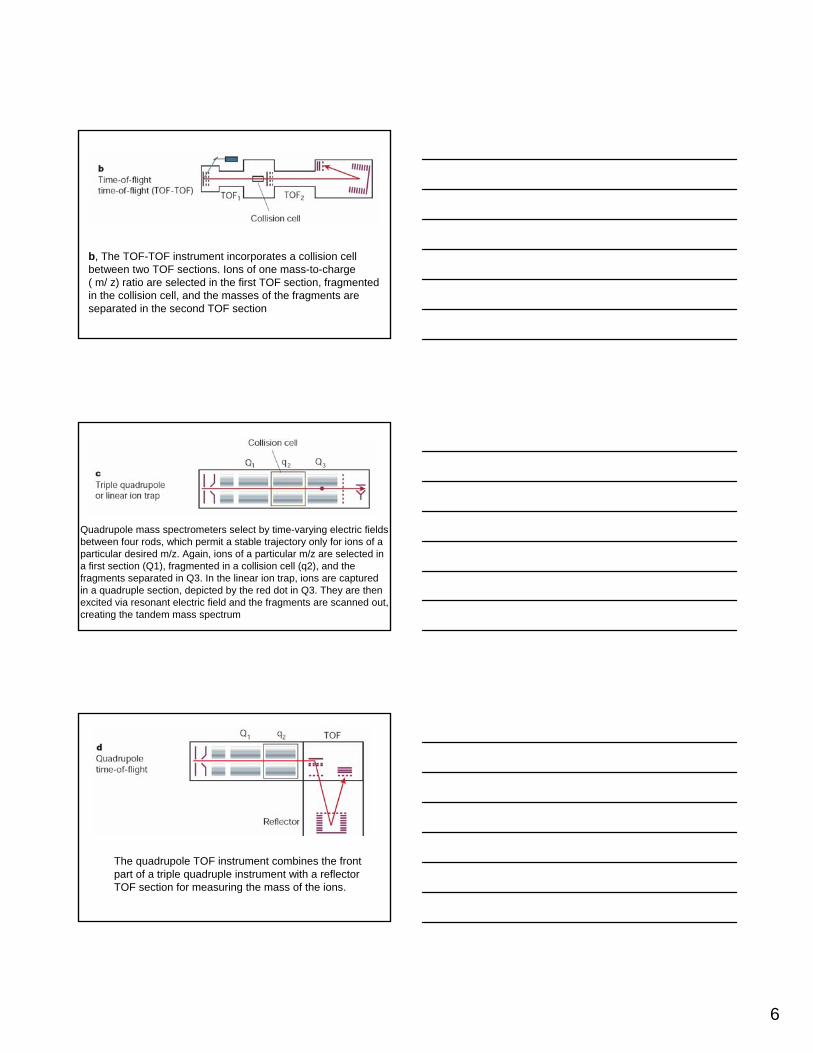
b, The TOF-TOF instrument incorporates a collision cell between two TOF sections. Ions of one mass-to-charge ( m/ z) ratio are selected in the first TOF section, fragmented in the collision cell, and the masses of the fragments are separated in the second TOF section
Quadrupole mass spectrometers select by time-varying electric fields between four rods, which permit a stable trajectory only for ions of a particular desired m/z. Again, ions of a particular m/z are selected in a first section (Q1), fragmented in a collision cell (q2), and the fragments separated in Q3. In the linear ion trap, ions are captured in a quadruple section, depicted by the red dot in Q3. They are then excited via resonant electric field and the fragments are scanned out, creating the tandem mass spectrum
The quadrupole TOF instrument combines the front part of a triple quadruple instrument with a reflector TOF section for measuring the mass of the ions.

7
The (three-dimensional) ion trap captures the ions as in the case of the linear ion trap, fragments ions of a particular m/ z, and then scans out the fragments to generate the tandem mass spectrum.
The FT-MS instrument also traps the ions, but does so with the help of strong magnetic fields. The figure shows the combination of FT-MS with the linear ion trap for efficient isolation, fragmentation and fragment detection in the FT-MS section.
During ion detection, both the central electrode and deflector are maintained at very stable voltages so that no mass drift can take place. The outer electrode is split in half at z=0, allowing the ion image current in the axial direction to be collected. The image current on each of half of the outer electrode is differentially amplified and then undergoes analog-to-digital conversion before processing using the fast Fourier transform algorithm.
8
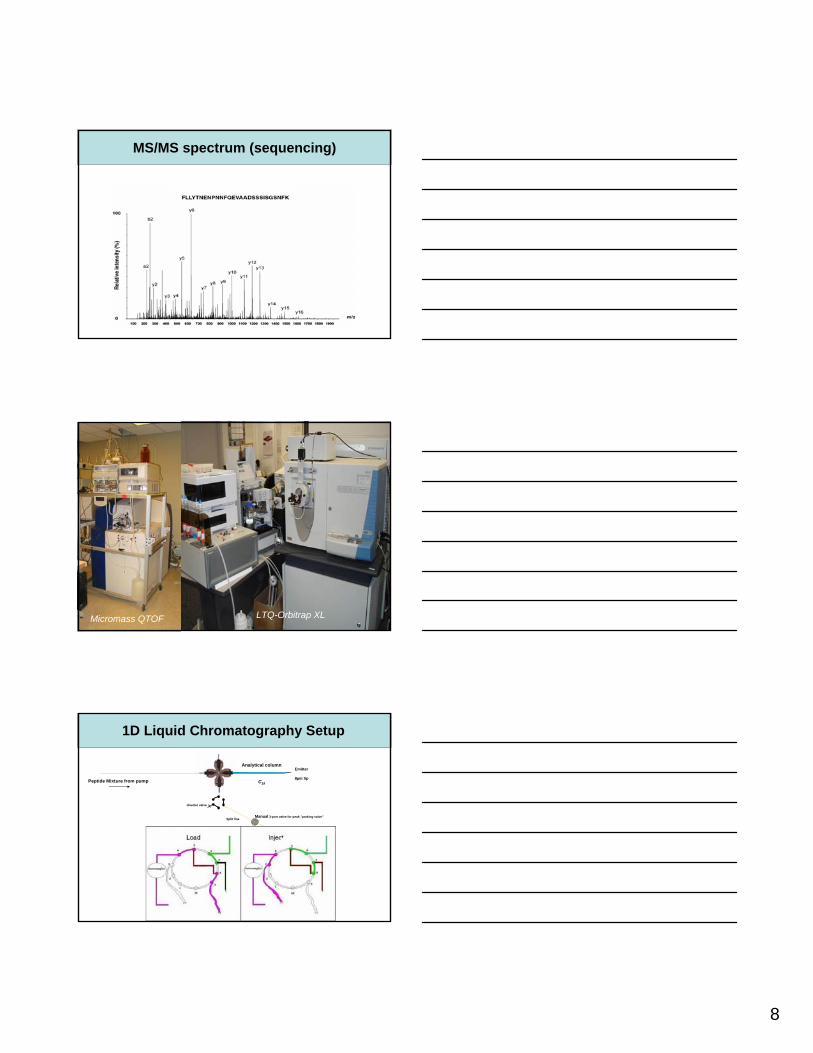
MS/MS spectrum (sequencing)
Micromass QTOF Finnigan LCQ DecaLTQ-Orbitrap XL
1D Liquid Chromatography Setup
Manual 3-port valve for peak ”parking valve”
Peptide Mixture from pump
diverter valve
Analytical column
C18
Split line
Emitter
8µm tip
80nL/min with valve open
9
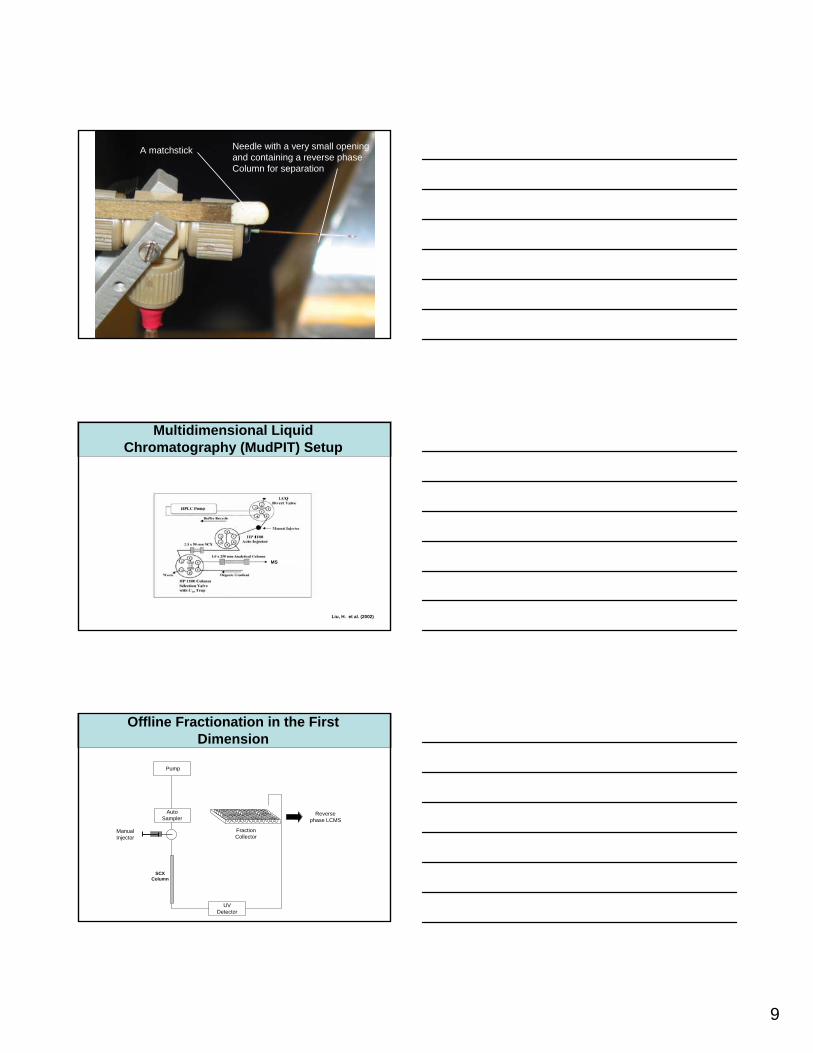
A matchstick Needle with a very small opening and containing a reverse phase Column for separation
Multidimensional Liquid Chromatography (MudPIT) Setup
Liu, H. et al. (2002)
MS
Offline Fractionation in the First Dimension
Pump
Auto Sampler
Manual Injector
UV Detector
Reverse phase LCMS
Fraction Collector
SCX Column

10
Automated nanoLC-MS/MS
• Purification of sample• Very complex samples
can be analyzed• Identical peptides will
elute in one peak (enhanced signal)
• Automated• Many proteins can be
identified in one run (100-2,000 proteins)
200 400 600 800 1000 1200 1400 1600 18000
100
50
867.50y9
422.26y
4
351.22y3
709.42y7
622.38y6
535.35y 5
810.47y
8
1388.75y 13
980.58y 10
1287.70y12
1127.66y11
1551.85y14
1800.021698.94y16y15
y2
294.20
m/z
A N T F Y T C F L G T S S L A G F K
100 200 300 400 500 600 700 800 900 1000 1100 1200m/z
0
100
50
V G C S M W Y W K333.21
y 2
1117.52y8
496.29y3
900.46y6
682.38y4
813.41y5
1060.48y7
30 40 50 60 70 80 90 100 110 120Time (minutes)
0
100
50
TIC: Total ion chromatogram
MS/MS spectrum MS/MS spectrum
Coupling Liquid Chromatography to Tandem MS
Quantitative Proteomics
• Based on difference in intensity
• By relative quantitation using MS

11
Quantitative Proteomics
• Based on difference in intensity– 1D gels– 2D gels– Use of fluorescence-based methods
1D Gel-based Comparison
200
110
73
47
28
IP : anti-pTyr
EGF :
2D Gel-based Comparison
Normal Cancer

12
2D Gels - Limitations
• Sample preparation - lot of optimization required
• Loading capacity limited• Do not resolve very small (<10 kD) or
large (>100 kD) proteins• Do not resolve hydrophobic (e.g.
membrane) proteins• Issues with reproducibility
Quantitative Proteomics
• Fluorescence-based quantitation– DIGE (Difference in-gel electrophoresis)
DIGE
• Samples to be labeled are labeled with Cy3 (green) and Cy5 (red)
• Samples are ‘mixed’ and resolved by 2D gels
• Fluorescence measured and quantitated

13
2D-DIGE of Pancreatic Juice
Cancer
Normal
Cy5
Cy3
Cy3-Cy5
Quantitative Proteomics
• By relative quantitation using MS– in vitro labeling
• 18O-labeling• Peptide mass tagging (ICAT)
– in vivo labeling• Labeling with stable isotope containing amino
acids (SILAC)
18O-labelingnormal cancer
Excise gel band Excise gel band
In-gel digestion with H2
16O waterIn-gel digestion with H2
18O water
Mix 1:1
MS-analysis
N C
14
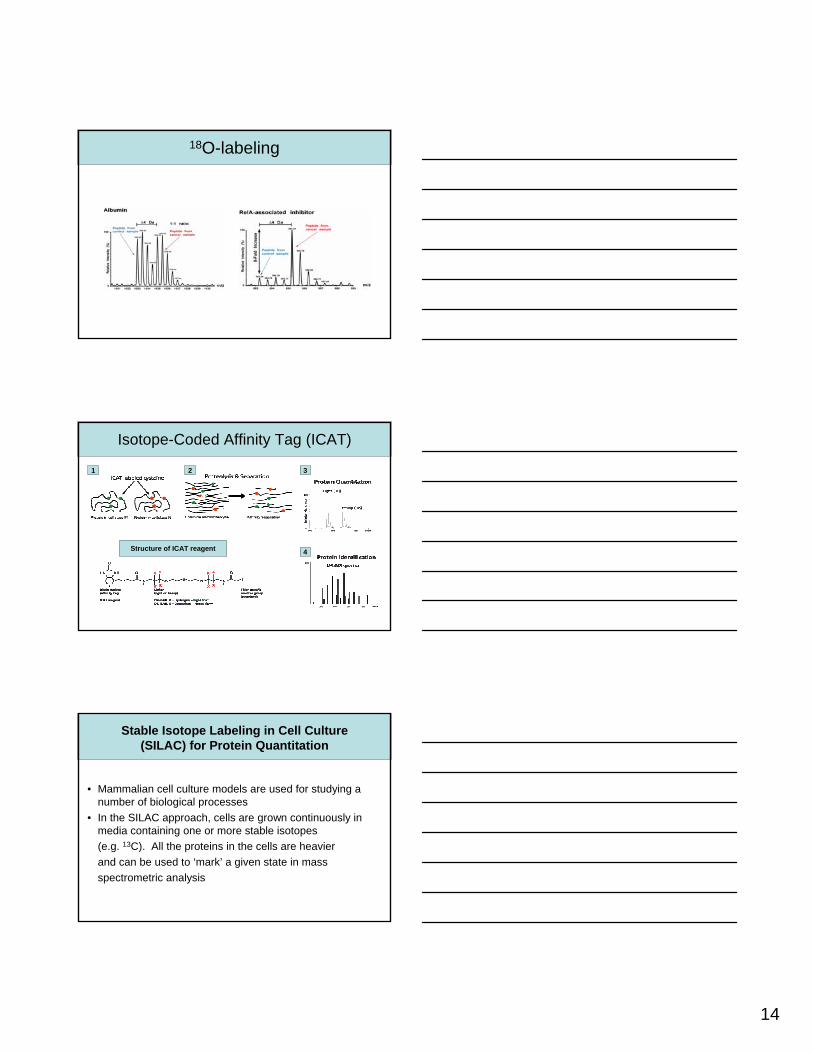
18O-labeling
Isotope-Coded Affinity Tag (ICAT)
1 2 3
4Structure of ICAT reagent
Stable Isotope Labeling in Cell Culture (SILAC) for Protein Quantitation
• Mammalian cell culture models are used for studying a number of biological processes
• In the SILAC approach, cells are grown continuously in media containing one or more stable isotopes (e.g. 13C). All the proteins in the cells are heavier and can be used to ‘mark’ a given state in mass spectrometric analysis
15
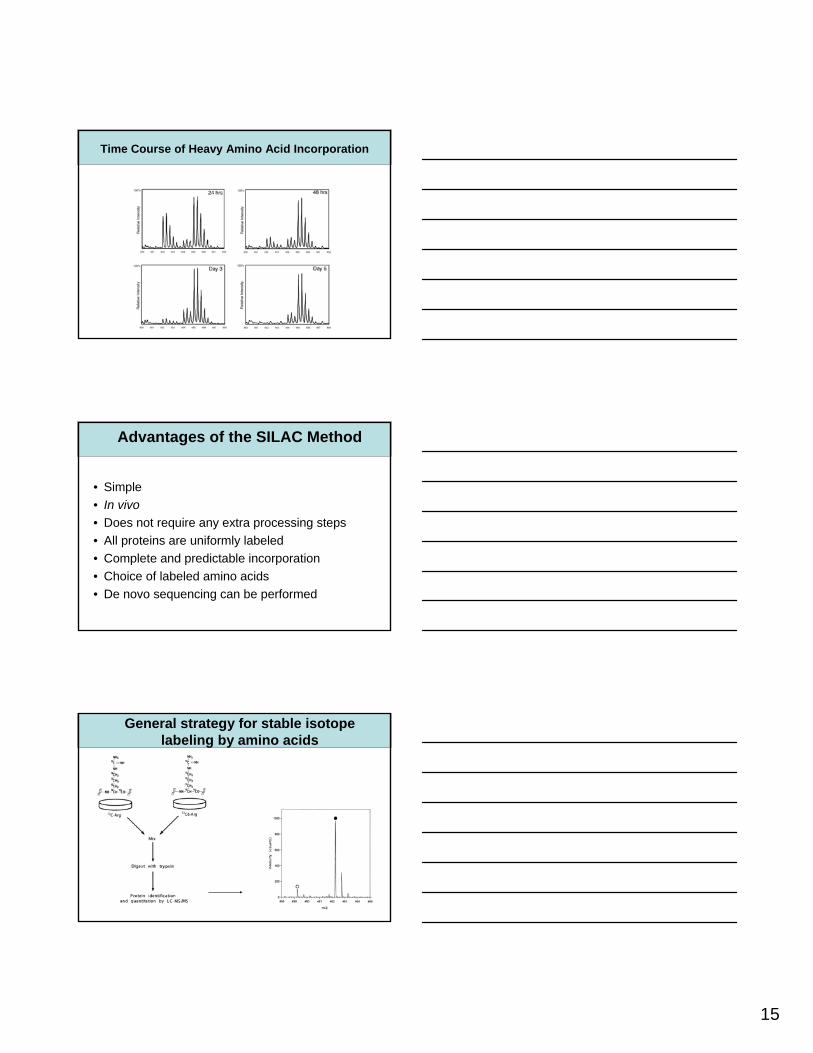
Time Course of Heavy Amino Acid Incorporation
Advantages of the SILAC Method
• Simple• In vivo• Does not require any extra processing steps• All proteins are uniformly labeled• Complete and predictable incorporation• Choice of labeled amino acids• De novo sequencing can be performed
General strategy for stable isotope labeling by amino acids

16
12C6 Labeled Lysine
Mix and run on SDS-PAGE
Elute, Digest with Trypsin and Analyze by MS
SILAC for Quantitation of Secreted Proteins
m/z
Rel
ativ
e In
tens
ity
13C6 Labeled Lysine
Day 1
Day 4
Day 1
Day 9
Day 1
Day 7
MixDays 1+4
MixDays 1+9
MixDays 1+7
Profile of Proteins Secreted by Adipocytes
m/z770 772 774 776 778
0
100772.40
772.90
775.42
773.41
773.91
775.90
776.41
50
Ratio 1:0.5Ratio 1:0.4
m/z770 772 774 776 778
0
100772.39
772.88
775.39773.39
773.88
775.89
776.40
50
Ratio 1:0.24
m/z770 772 774 776 778
0
100 772.40
772.91
773.40775.40
775.91776.41
50
m/z800 802 804 806 808
0
100 805.44
802.43802.94
803.43
805.94
806.45
50
Ratio 1:2.4
m/z800 802 804 806 808
0
100 805.42
802.40802.92
803.40
805.91
806.42
50
Ratio 1:2.7
m/z800 802 804 806 8080
100 805.44
802.43
802.92803.43
805.95
806.4650
Ratio 1:1.6
Fibronectin expression is downregulated
Collagen alpha 3 expression is upregulated
17
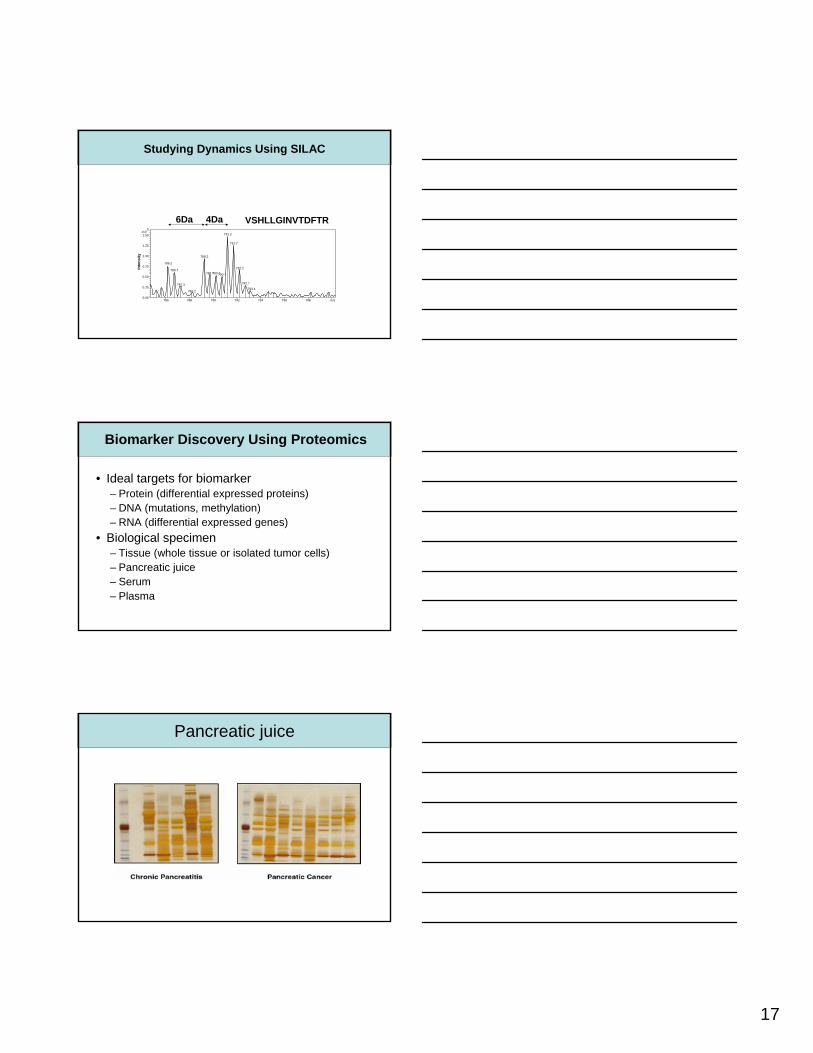
Studying Dynamics Using SILAC
786.2
786.7
787.3
788.2
789.2
789.7790.2790.7
791.2
791.7
792.2
792.7
793.1
0.00
0.25
0.50
0.75
1.00
1.25
1.50
5x10
786 788 790 792 794 796 798 m/z
VSHLLGINVTDFTR6Da 4Da
Inte
nsity
Biomarker Discovery Using Proteomics
• Ideal targets for biomarker– Protein (differential expressed proteins)– DNA (mutations, methylation)– RNA (differential expressed genes)
• Biological specimen– Tissue (whole tissue or isolated tumor cells)– Pancreatic juice– Serum– Plasma
Pancreatic juice
18
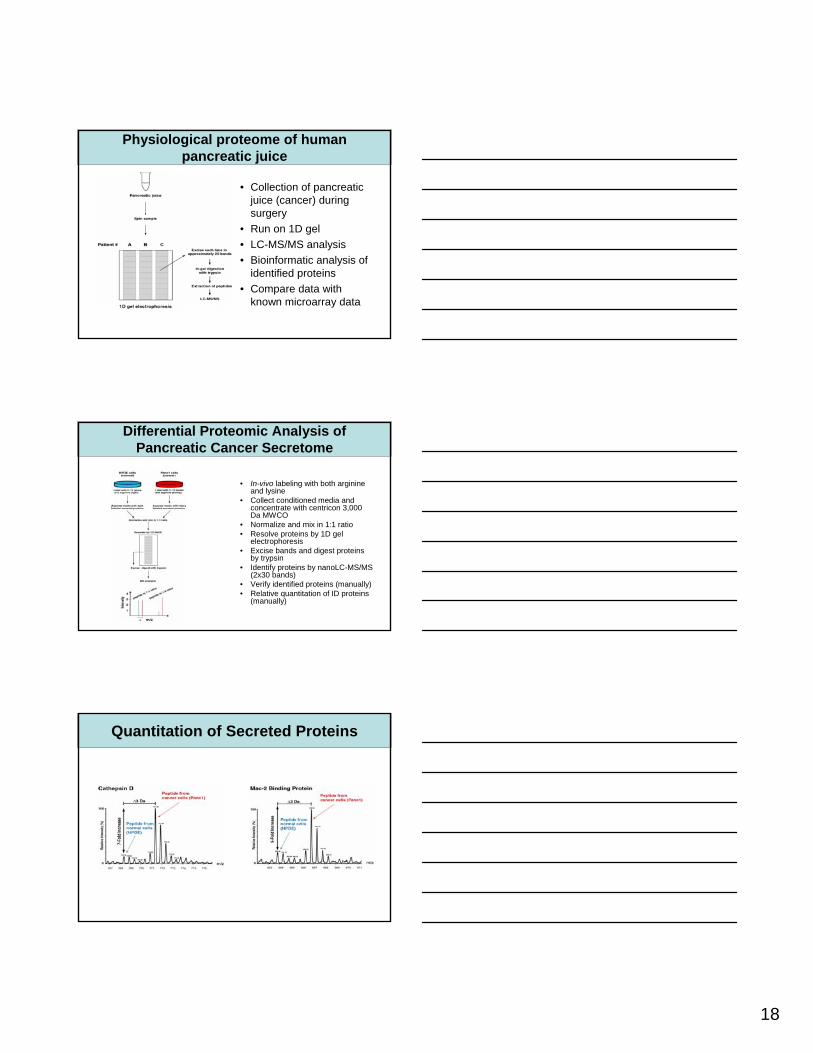
Physiological proteome of human pancreatic juice
• Collection of pancreatic juice (cancer) during surgery
• Run on 1D gel• LC-MS/MS analysis• Bioinformatic analysis of
identified proteins• Compare data with
known microarray data
Differential Proteomic Analysis of Pancreatic Cancer Secretome
• In-vivo labeling with both arginine and lysine
• Collect conditioned media and concentrate with centricon 3,000 Da MWCO
• Normalize and mix in 1:1 ratio• Resolve proteins by 1D gel
electrophoresis• Excise bands and digest proteins
by trypsin• Identify proteins by nanoLC-MS/MS
(2x30 bands)• Verify identified proteins (manually)• Relative quantitation of ID proteins
(manually)
Quantitation of Secreted Proteins
19
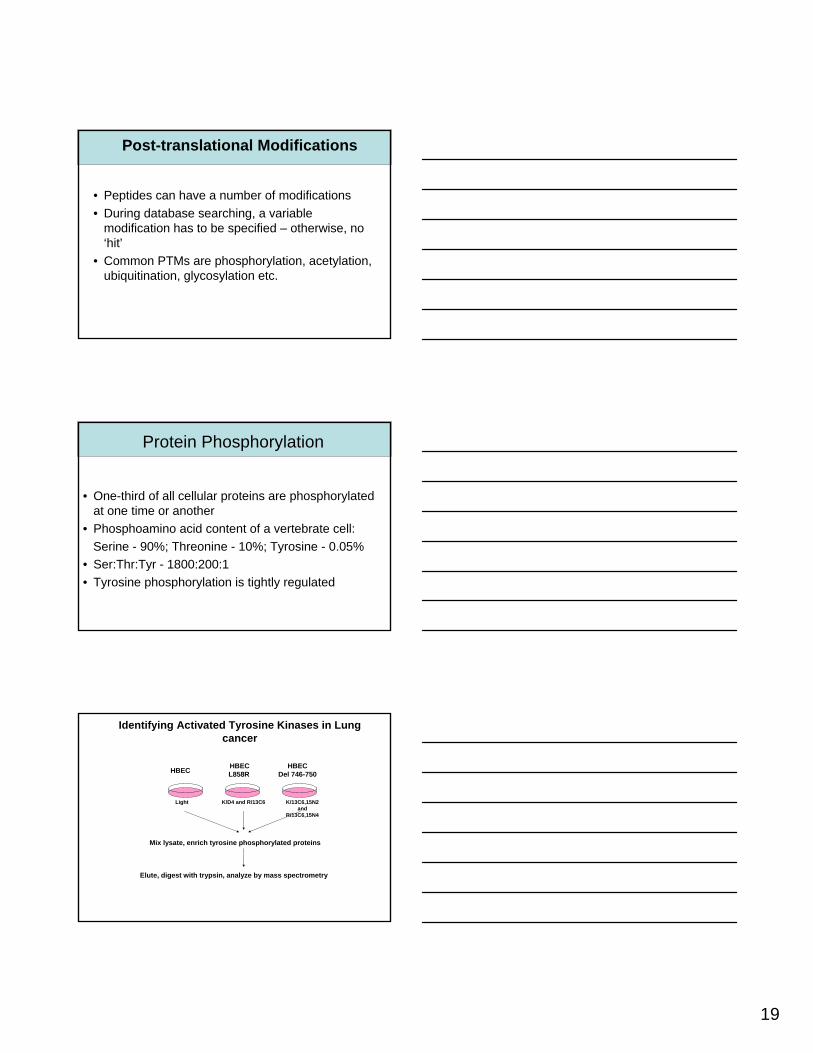
Post-translational Modifications
• Peptides can have a number of modifications• During database searching, a variable
modification has to be specified – otherwise, no ‘hit’
• Common PTMs are phosphorylation, acetylation, ubiquitination, glycosylation etc.
Protein Phosphorylation
• One-third of all cellular proteins are phosphorylated at one time or another
• Phosphoamino acid content of a vertebrate cell:Serine - 90%; Threonine - 10%; Tyrosine - 0.05%
• Ser:Thr:Tyr - 1800:200:1• Tyrosine phosphorylation is tightly regulated
HBEC HBECL858R
HBECDel 746-750
Light K/D4 and R/13C6 K/13C6,15N2 and
R/13C6,15N4
Mix lysate, enrich tyrosine phosphorylated proteins
Elute, digest with trypsin, analyze by mass spectrometry
Identifying Activated Tyrosine Kinases in Lung cancer

20
Cell lysatein urea buffer
Trypsin digestion
Sep-Pak C18Reverse-phase
purification
Purified peptides
LyophilizationImmunoaffinity
Purification(Anti-acetyl lysine-Protein A agarose)
LC-MS/MS
Elution using 1% acetic acid
Clean up peptides using C-18 tip
Anti-acetyl lysine peptide IP
GSK3 beta
GSK3 beta
22
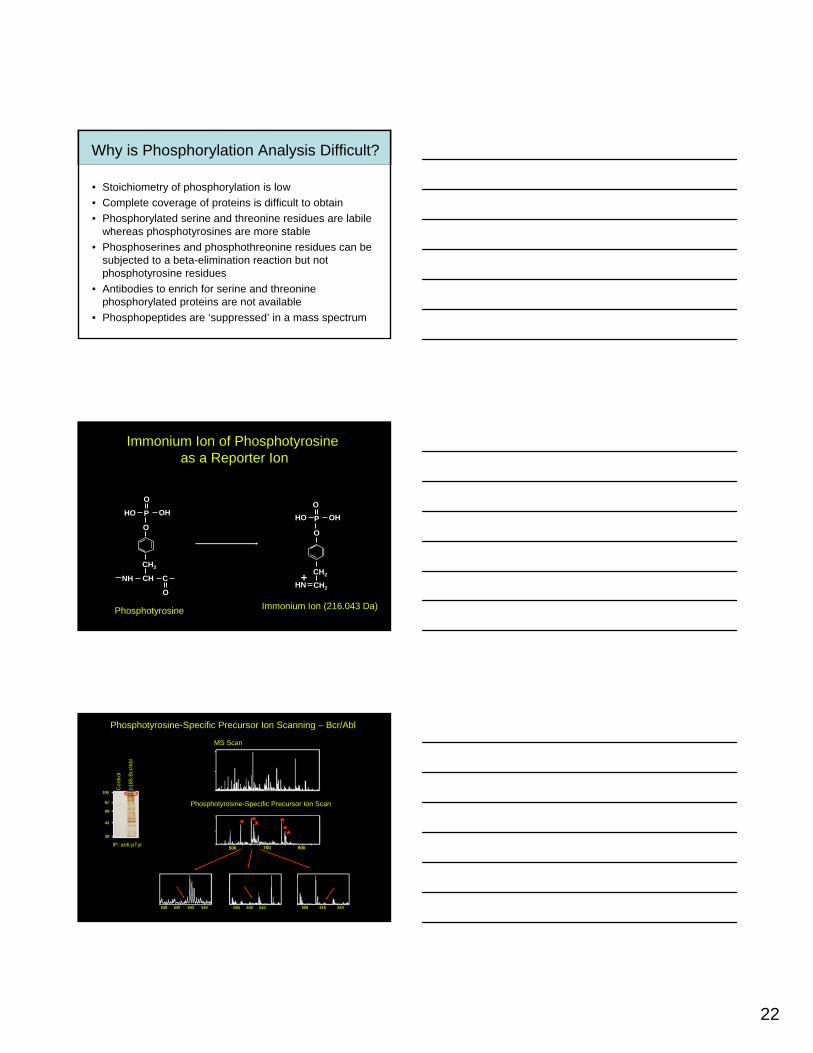
Why is Phosphorylation Analysis Difficult?
• Stoichiometry of phosphorylation is low• Complete coverage of proteins is difficult to obtain • Phosphorylated serine and threonine residues are labile
whereas phosphotyrosines are more stable • Phosphoserines and phosphothreonine residues can be
subjected to a beta-elimination reaction but not phosphotyrosine residues
• Antibodies to enrich for serine and threonine phosphorylated proteins are not available
• Phosphopeptides are ‘suppressed’ in a mass spectrum
Phosphotyrosine Immonium Ion (216.043 Da)
NH CH
CH2
O
PHO OHO
C
OHN CH2
CH2
O
PHO OHO
Immonium Ion of Phosphotyrosine as a Reporter Ion
+
Phosphotyrosine-Specific Precursor Ion Scanning – Bcr/Abl
97
200
68
43
28 ******
500 700 900
590 600 610 608 616 624
Phosphotyrosine-Specific Precursor Ion Scan
MS Scan
Con
trol
p185
Bcr
/Abl
IP: anti-pTyr
538 540 542 544

23
Large scale IP with an anti-pSer/Thr antibody
WB: Anti-pSer/Thr
Lysates
Calyculin A:
In Vivo Labeling with 32P
IP: Anti-pSer/Thr
Calyculin A: - +
10RLpSPAPQLGP19
Identification of Phosphorylated Ser/Thr residues

24
200
110
73
47
28
IP : anti-pTyr
EGF :
MS-Based Identification of a 130 kDa Protein in the EGF Receptor Signaling Pathway
Silver stained gel
36QELTKKLMPNCKBlock of proliferation 1 40TKAVSRH2A histone family, member Z 41LKKVENIKPutative homeodomain transcription factor 143KNQLVQKRBP-binding zinc finger protein, c54KGKPQVQDKVVK Hypothetical protein [gi|89059164]30GKPEVVSVVGRImmunoglobulin superfamily, member 940GLGKGGAKRHistone cluster 1, H4a
ScorePeptideProtein name
Partial list of acetylated lysine containing peptides identifiedin an IP experiment

25
>KIAA0229 (1180 residues) FRAGMENT
SWGKGREGVVSPAGLGGALPGDGKFGSPSRLGCSLGEGVQRVAALGMGKEQELLRAARTGHLPAVEKLLSGKRLSSGFGGGGGGGSGGGGGGSGGGGGGLGSSSHPLSSLLSMWRGPNVNCVDSTGYTPLHHAALNGHHRRSSSSRSQDSAEGQDGQVPEQFSGLLHGSSPVCEVGQDPFQLLCTAGQSHPDGSPQQGACHKASMQLEETGVHAPGASQPSALDQSKRVGYLTGLPTTNSRSHPETLTHTASPHPGGAEEGDRSGAR
Assignment of the initiator methionine in a cDNA ‘fragment’ based on an N-terminal peptide
>KIAA0229 (1180 residues) FRAGMENT
SWGKGREGVVSPAGLGGALPGDGKFGSPSRLGCSLGEGVQRVAALGMGKEQLLRAARTGHLPAVEKLLSGKRLSSGFGGGGGGGSGGGGGGSGGGGGGLGSSSHPLSSLLSMWRGPNVNCVDSTGYTPLHHAALNGHHRRSSSSRSQDSAEGQDGQVPEQFSGLLHGSSPVCEVGQDPFQLLCTAGQSHPDGSPQQGACHKASMQLEETGVHAPGASQPSALDQSKRVGYLTGLPTTNSRSHPETLTHTASPHPGGAEEGDRSGAR
Assignment of the initiator methionine in a cDNA ‘fragment’ based on an N-terminal peptide
RCH3 C
O
H2N Q L LG K E
Acetylated lysineTri-methylated lysine
128.095
Mono-methylated lysine
142.111
Di-methylated lysine
156.127 170.143 170.105Mass (Da)
Massgain
- 14.016 Da 28.032 Da 42.048 Da 42.010 Da
NH 2
CO CH 3
Lysine
NH 2 CH CO
CH 2
CH 2
CH 2
CH 2
NH 2
OHNH 2 CH C
OCH 2
CH 2
CH 2
CH 3
OHNH 2 CH C
OCH 2
CH 2
CH 2
CH 3
OHNH 2 CH C
OCH 2
CH 2
CH 2
CH 2
NH
OH
CH 3
NCH 3 CH 3
NH 2 CH CO
CH 2
CH 2
CH 2
CH 3
OH
N+
CH 3CH 3
CH 3
Lysine Modifications

26
Acetylation vs Tri-methylation: a numbers game…
Tri-methylation: 42.046950 Da [H(6) C(3)]Acetylation: 42.010565 Da [H(2) C(2) O]
Mass difference: 0.036385 Da
739 740 741 742 743
m/z
100740.5
742.9
743.6
739.3738.2 738.5
739.7
740.1
740.5
741.0
Zoom scan-scale is the same!
100
739.0 740.0 741.0 742.0
739.76
740.26
740.76
741.26
100
Normal ion trap Quadrupole-Time-of-Flight Orbitrap
Resolution of various mass spectrometers
<3,000 8,000-14,000 30,000-60,000Approx. resolution in ppm
538.0 539.0 540.0 541.0 542.0 543.0 544.0 545.00
4
8
12
16
20
24
28
32
36
40
44
48
52
56
60544.3357
541.6711544.6752
542.0114539.3308538.9988
542.3391
539.6641
545.0024544.8060542.7000541.3070 545.3044544.0053
543.7857
A triple state SILAC experiment: qTOF+2x4 Da + 2x4 Da (2x Lysine containing peptide)

27
molina_06dec07_Udyan_SILAC_pY-pep-ip #4485 RT: 28.81 AV: 1 NL: 7.21E6
F: FTMS + p NSI Full ms [375.00-1800.00]
538.0 538.5 539.0 539.5 540.0 540.5 541.0 541.5 542.0 542.5 543.0 543.5 544.0 544.5 545.0 545.5
m/z
0
10
20
30
40
50
60
70
80
90
100 544.34544.68
541.68539.00542.02
539.34
540.32 542.35541.65539.67
540.66
541.99
538.32 545.01
542.69538.65 541.35
544.01
540.00
544.54
542.32 545.35540.99543.96
545.03
542.78 543.32542.65544.79
540.51
540.71
538.34
541.32
539.63539.10
538.97
538.28 539.81
544.29
538.90
Rel
ativ
e A
bund
ance
A triple state SILAC experiment: Orbitrap
538.0 538.5 539.0 539.5 540.0 540.5 541.0 541.5 542.0 542.5 543.0 543.5 544.0 544.5 545.0 545.5
m/z
0
10
20
30
40
50
60
70
80
90
100
Rel
ativ
e A
bund
ance
544.34
541.68539.00
540.32 541.65
538.32
+6 Da +4 Da (Arginine containing peptide)
+2x4 Da + 2x4 Da (2x Lysine containing peptide)
A triple state SILAC experiment: Orbitrap
Identifying acetylation sites using Orbitrap
• Digest protein mixture into peptides• Capture acetylated lysine containing peptides
using anti-acetyl lysine antibodies• Analyze on Orbitrap• If the samples are labeled for quantitative
proteomics, one can also obtain data on differential regulation of acetylation at individual lysine residues in this strategy
28
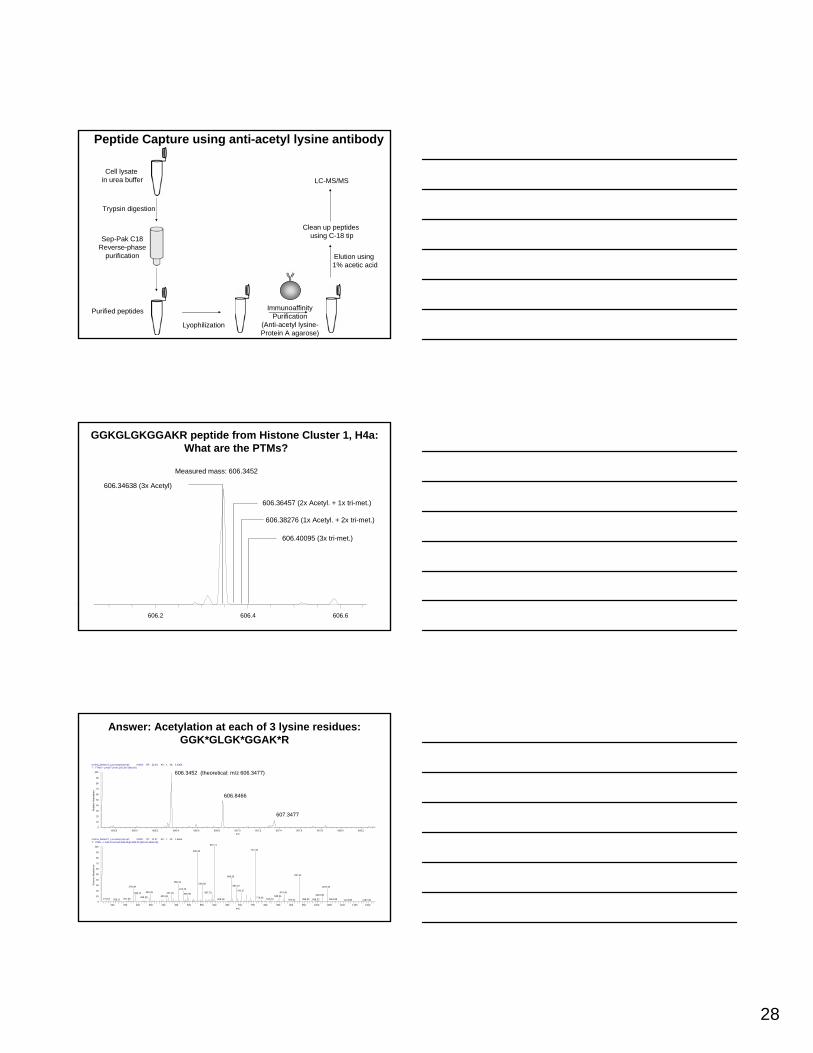
Cell lysate in urea buffer
Trypsin digestion
Sep-Pak C18Reverse-phase
purification
Purified peptides
Lyophilization
ImmunoaffinityPurification
(Anti-acetyl lysine-Protein A agarose)
LC-MS/MS
Elution using 1% acetic acid
Clean up peptides using C-18 tip
Peptide Capture using anti-acetyl lysine antibody
Measured mass: 606.3452
606.2 606.4 606.6
606.40095 (3x tri-met.)
606.38276 (1x Acetyl. + 2x tri-met.)
606.36457 (2x Acetyl. + 1x tri-met.)
606.34638 (3x Acetyl)
GGKGLGKGGAKR peptide from Histone Cluster 1, H4a:What are the PTMs?
molina_06dec07_Lys-acetyl-pep-ip2 #3001 RT: 22.47 AV: 1 NL: 1.54E4T: ITMS + c NSI d Full ms2 [email protected] [155.00-1225.00]
200 250 300 350 400 450 500 550 600 650 700 750 800 850 900 950 1000 1050 1100 1150 1200m/z
0
10
20
30
40
50
60
70
80
90
100
Rel
ativ
e Ab
unda
nce
597.11
757.33530.26
927.41664.26
455.19549.38
682.22279.09 1037.32473.26
700.37345.26 870.46587.70285.14 427.26 491.96 1019.38849.34416.34342.20 778.36175.02 267.00 816.10625.48 959.02 1064.55998.22209.11 910.41 1197.391123.85
molina_06dec07_Lys-acetyl-pep-ip2 #3003 RT: 22.48 AV: 1 NL: 5.43E6T: FTMS + p NSI Full ms [375.00-1800.00]
605.8 606.0 606.2 606.4 606.6 606.8 607.0 607.2 607.4 607.6 607.8 608.0 608.2m/z
0
10
20
30
40
50
60
70
80
90
100
Rel
ativ
e Ab
unda
nce
606.3452 (theoretical: m/z 606.3477)
606.8466
607.3477
Answer: Acetylation at each of 3 lysine residues: GGK*GLGK*GGAK*R
29
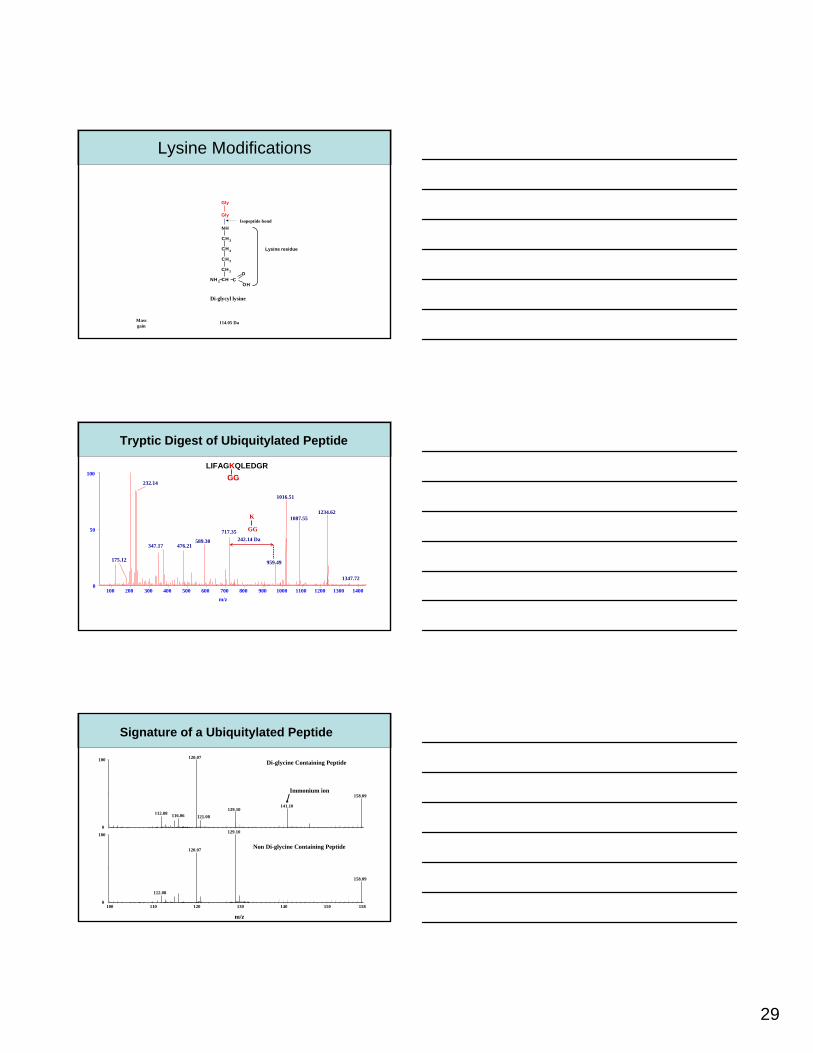
Di-glycyl lysine
NH 2 CH CO
CH 2
CH 2
CH 2
CH 2
NH
OH
Gly
Gly
Isopeptide bond
Lysine residue
Lysine Modifications
Massgain
114.05 Da
100 200 300 400 500 600 700 800 900 1000 1100 1200 1300 1400m/z
0
100
50
175.12
232.14
1016.51
717.35
589.30347.17 476.21
959.49
1234.621087.55
1347.72
Tryptic Digest of Ubiquitylated Peptide
LIFAGKQLEDGRGG
242.14 Da
GG
K
100 110 120 130 140 150 158
m/z
0
1000
100 120.07
112.08 116.06
158.09
141.10129.10
121.08
129.10
120.07
112.08
158.09
Di-glycine Containing Peptide
Non Di-glycine Containing Peptide
Signature of a Ubiquitylated Peptide
Immonium ion

30
Genome Annotation
- A case for proteomics-driven annotation of protein-coding regions
Genome Annotation by Mass Spectrometry: What Can We Gain?
• Assigning start codons• Proteins isoforms (alternative splicing, novel
exons)• Novel genes (proteins less than 100 amino
acids not predicted by programs)• cSNPs• Correction of incorrect gene predictions (~50%
of the genes in human are predicted)• Validation of gene predictions
Transcripts and Proteins in Anopheles gambiae
• Proteins ~ 700 known• Annotated genes: 15,189 (11,757 predicted)
7,840 unique to predictions by Celera1,375 unique to predictions by Ensembl5,974 common to both predictions
• Gomez et al. (Genome Biology: 6:R39, 2005) 35,000 full-length enriched cDNAs3,700 genes of which only 650 are novel
• Krisventseva et al. (Genome Research, 2005)215,634 ESTs/cDNAs7,961 clusters of which 3,100 are novel

31
Use of Ensembl Distributed Annotation System to Validate a Known Transcript
Schematic representation of the systems biology paradigm involving proteomics.