wider working paper 2015/145 · 2016-01-26 · wider working paper 2015/145 tax-benefit...
TRANSCRIPT

WIDER Working Paper 2015/145
Tax-benefit microsimulation modelling in Tanzania
A feasibility study
Vincent Leyaro, 1 Elineema Kisanga,1 Gemma Wright,2 Helen Barnes,2 and Michell Mpike2
December 2015

1University of Dar es Salaam, Tanzania; 2Southern African Social Policy Research Insights (SASPRI), Hove, UK; corresponding author: [email protected].
This study has been prepared within the UNU-WIDER project ‘The Economics and Politics of Taxation and Social Protection’.
Copyright © UNU-WIDER 2015
ISSN 1798-7237 ISBN 978-92-9256-034-8
Typescript prepared by Anna-Mari Vesterinen at UNU-WIDER.
UNU-WIDER gratefully acknowledges the financial contributions to the research programme from the governments of Denmark, Finland, Sweden, and the United Kingdom.
The World Institute for Development Economics Research (WIDER) was established by the United Nations University (UNU) as its first research and training centre and started work in Helsinki, Finland in 1985. The Institute undertakes applied research and policy analysis on structural changes affecting the developing and transitional economies, provides a forum for the advocacy of policies leading to robust, equitable and environmentally sustainable growth, and promotes capacity strengthening and training in the field of economic and social policy-making. Work is carried out by staff researchers and visiting scholars in Helsinki and through networks of collaborating scholars and institutions around the world.
UNU-WIDER, Katajanokanlaituri 6 B, 00160 Helsinki, Finland, wider.unu.edu
The views expressed in this publication are those of the author(s). Publication does not imply endorsement by the Institute or the United Nations University, nor by the programme/project sponsors, of any of the views expressed.
Abstract: This paper presents the findings from a feasibility study on the potential for developing a static tax-benefit microsimulation model for Tanzania. The paper provides an account of the current tax-benefit system in Tanzania and introduces the survey dataset which could function as the underpinning data for the model. The paper concludes with an assessment of the feasibility of producing such a model for Tanzania with reference to personal income tax, indirect taxes, and contributory and non-contributory benefits.
Keywords: tax, benefits, microsimulation, Tanzania JEL classification: E620, H240, I38
Acknowledgements: The authors gratefully acknowledge UNU-WIDER and especially Jukka Pirttilä for his support and comments. The following organizations are also gratefully acknowledged: Ministry of Finance, Tanzania Revenue Authority, Social Security Regulation Authority, Tanzania Social Action Fund, and the Planning Commission.

1
Acronyms
COICOP Classification of Individual Consumption according to Purpose CPI Consumer Price Index DAS Deposit Administration Scheme EA Enumeration Area EAC East African Community EUROMOD European Union Tax-Benefit Microsimulation Model GDP Gross Domestic Product GEPF Government Employees Provident Fund HBS Household Budget Survey ILFS Integrated Labour Force Survey LAPF Local Authority Pension Fund MoF Ministry of Finance MoFEA Ministry of Finance and Economic Affairs MoHSW Ministry of Health and Social Welfare MoLE Ministry of Labour and Employment NBS National Bureau of Statistics NHIF National Health Insurance Fund NSGRP National Strategy for Growth and Reduction of Poverty NSSF National Social Security Fund OECD Organization for Economic Cooperation and Development PAAs Project Areas Authorities PAYE Pay As You Earn PIT Personal Income Tax PMO-RALG Prime Minister’s Office Regional Administration and Local
Government PPF Parastatal Pension Fund PSPF Public Service Pension Fund PSSN Productive Social Safety Net PSU Population Sampling Unit SAMOD South African Tax-Benefit Microsimulation Model SDL Skills Development Levy SSA Sub-Saharan Africa SSR Social Security Regulation SSRA Social Security Regulatory Authority TANESCO Tanzania Electricity Supply Company VAT Value-Added Tax

2
1 Introduction
This paper presents the findings from a feasibility study on the potential for developing a static tax-benefit microsimulation model for Tanzania. The study focuses first on the details of the tax-benefit system in Tanzania and explores possible data sources, building on the information collected in the initial scoping study of all countries in the Southern African Development Community and East African Community (Wright et al. 2015). The report concludes with an assessment of the feasibility of producing a tax-benefit microsimulation model and its potential uses and sustainability into the future.
The importance of tax-benefit microsimulation model is well documented, and microsimulation models are in everyday use in developed countries when governments plan and assess new tax and benefit arrangements. They are, however, rarely used in developing countries, in particular those found in sub-Saharan Africa (SSA). However, more recently there has been a growing appreciation of the advantages of using tax-benefit microsimulation modelling as a tool for analysing a country’s tax and benefit policies, including countries in SSA (Atkinson 2009; Wilkinson 2009; Wright et al. 2014). Having access to such models would be of key importance to researchers and policy makers alike for acquiring an overall view of the current extent of transfer systems, their fiscal costs, and gaps in the protection they provide.
Although for the past two decades Tanzania has had a somewhat impressive macroeconomic performance, with its economy growing at approximately 7 per cent since 2000, poverty (and to some extent income inequality) have remained pervasive in the country. According to the Tanzania Household Budget Surveys (HBS), poverty, as measured in terms of consumption poverty rates, has fallen only marginally. Between 1991 and 2012, poverty fell only by about 10.4 percentage points, from 38.6 per cent in 1991-92 to 35.6 per cent in 2000-01, to 33.4 per cent in 2007 and then further to 28.2 per cent in 2011-12 (URT, 2002, 2008, 2014). Inequality, as measured by the Gini coefficient, has slightly declined from 0.35 in 2007 to 0.34 in 2011/12. The unemployment rate, using Tanzania’s national definition, remains high at around 11 per cent between 2006 and 2014, with unemployment of youth aged 15-24 even higher at 14.3 per cent. According to a number of estimates and projections, the informal sector is today estimated to be around 50 to 60 per cent. Osoro (2009), using Gutmann and Tanzi approaches, estimated the underground economy (informal activities—small firms, commercial and non-commercial, not recorded in the official statistics) from 1970 to 2006 and found that they are around 50 per cent of national Gross Domestic Product (GDP). Other estimates can be obtained from the percentage of economic activities in the Integrated Labour Force Surveys (ILFS) and HBS. The 2000-01 ILFS shows that 61 per cent of households in urban areas had informal activities while the 2014 ILFS shows that employment in informal sector in urban areas was around 45 per cent.
This apparent contradiction—solid per capita GDP growth, constant inequality, and yet less consumption poverty reduction than desired—has generated considerable debate on how the current impressive economic growth and macro performance could be made more inclusive and sustainable such that it contributes towards poverty reduction, equitable distributions of income, social cohesion, and political stabilities in the country. Therefore, having a tax-benefit microsimulation model in Tanzania, similar to EUROMOD (an advanced tax-benefit microsimulation model for the European countries), SAMOD (for South Africa), and NAMOD (for Namibia), which can be used to analyse tax-benefit reforms in the country, is an important step towards implementing the government’s main objective of inclusive and sustainable economic growth that will lead to poverty reduction and lower income inequality.
3
To build a tax-benefit microsimulation model in Tanzania it is necessary to have detailed information about tax, social contribution and benefit systems as well as tax relief arrangements and cash transfers. More importantly detailed data on individuals in terms of their demographic profile, incomes, expenditures, and household relationships are required.
In Tanzania, tax policies are divided between central and local government. Central government collects more than 95 per cent of tax revenue. The Ministry of Finance (MoF) through the Tanzania Revenue Authority (TRA) is the custodian of the design, oversight, administration, and implementation of the tax policies. The Ministry of Finance on behalf of the government usually propose amendments of taxes and other related financing policies to the parliament at the beginning of the financial year (1 July-30 June) through the Public Finance Bill. Upon approval of the Parliament, the Public Finance Bill becomes the law known as the Public Finance Act once signed by the president. At the local government level, there is also a Local Government Finance Act which guides local government authorities on sources of revenue and management of funds and resources. The municipal and district councils introduce the tax base through their bylaws and although the rates may differ from one local government to another, most of the taxes usually include property taxes, fees, and levies. Other fees, fines and charges are collected by other ministries, departments, and agencies of the government other than MoF, but they make an insignificant share of total revenue collections. While currently there are no tax benefits, such as the family tax relief Tanzania had in the past, the income tax is progressive (the minimum band is 12 per cent and the maximum is 30 per cent) where the minimum individual earnings are not taxed. There is no statutory indexing regime for taxes to take account of inflation in Tanzania.
Social benefits in Tanzania, as in other countries, are composed of transfers in cash or kind covering population in case of certain social shocks. These social benefits include both contributory systems (social insurance) and non-contributory systems such as the Productive Social Safety Net (PSSN) cash transfer programme, which is implemented by Tanzania Social Action Fund (TASAF) on behalf of the government. The programme aims to provide benefits for the poorest households, defined as people living under the basic needs poverty line, currently 28.2 per cent of the population in Tanzania (URT, 2014). The amount of the means-tested benefit payable depends on the number of vulnerable children (age 0-15) and elderly (age 60+) therein. The programme operation is expected to support approximately one million extremely poor households living in selected villages. The plan under PSSN is to eventually cover the entire target population across the country. The cash transfer scheme will be further complemented by a set of community and infrastructure development initiatives covering the same households.
While there is no statutory indexing regime for taxes to take account of inflation in Tanzania, there is one in terms of benefits. Indexation of benefits is an adjustment of pensions and other cash benefits to take account of price movements and protection against inflation to the beneficiaries. Indexes may include prevailing statutory minimum wages, and yearly average earnings of the contributors.
The working age in Tanzania is 18 years and above; work below that age is referred to as child labour. The Public Service Retirement Benefits Act 1999, puts voluntary retirement age in Tanzania at 55 years old and statutory retirement age at 60, where people become eligible for the state pension. As primary education is free and compulsory for all children from seven years of age, and the primary education is for seven years, the minimum school leaving age in Tanzania is 14 years. Dependent children are defined as those under 18, as at this age they are expected to have finished ordinary secondary education.
4
With regard to survey data, from 1990 to 2012, four major HBS for the years 1991-92, 2000-01, 2007, and 2011-12 have been conducted in Tanzania. These are nationally representative surveys conducted by the National Bureau of Statistics (NBS). They obtain data and information from private households on: household expenditure, consumption, and income; household members’ education, economic activities, and health status; ownership of consumer goods and assets; housing structure and materials; household access to services and facilities; and food security.
In Sections 2 and 3, the tax and benefit systems are described with the aim of providing as detailed as possible an overview of the different tax and benefit instruments in the country. The HBS 2011-12 is described in more detail in Section 4 as the possible data source to be used in this modelling. The report concludes in Section 5 with an assessment of the feasibility of producing a tax-benefit microsimulation model and its potential uses and sustainability into the future.
2 The tax system
The Tanzania tax system has witnessed significant transformation in tax structure since independence (Osoro 1995; TRA, 2011). The TRA was formed in 1995 by Act of Parliament No.11, following recommendations from the Mtei Commission Report (see Annex 1 for further details), and today the tax structure for incomes, consumption, and international trade match fairly well with internationally accepted best practices.
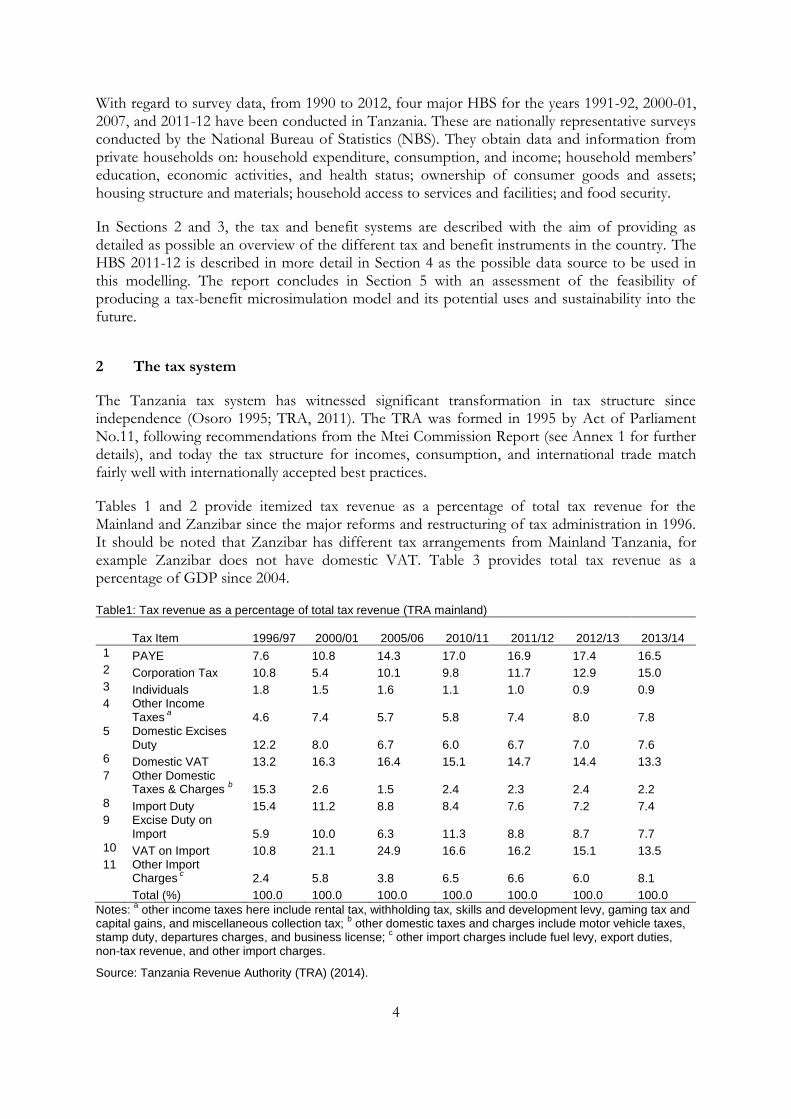
Tables 1 and 2 provide itemized tax revenue as a percentage of total tax revenue for the Mainland and Zanzibar since the major reforms and restructuring of tax administration in 1996. It should be noted that Zanzibar has different tax arrangements from Mainland Tanzania, for example Zanzibar does not have domestic VAT. Table 3 provides total tax revenue as a percentage of GDP since 2004.
Table1: Tax revenue as a percentage of total tax revenue (TRA mainland)
Tax Item
1996/97 2000/01 2005/06 2010/11 2011/12 2012/13 2013/14
1 PAYE 7.6 10.8 14.3 17.0 16.9 17.4 16.5 2 Corporation Tax 10.8 5.4 10.1 9.8 11.7 12.9 15.0 3 Individuals 1.8 1.5 1.6 1.1 1.0 0.9 0.9 4 Other Income
Taxes a
4.6 7.4 5.7 5.8 7.4 8.0 7.8 5 Domestic Excises
Duty 12.2 8.0 6.7 6.0 6.7 7.0 7.6 6 Domestic VAT 13.2 16.3 16.4 15.1 14.7 14.4 13.3 7 Other Domestic
Taxes & Charges b 15.3 2.6 1.5 2.4 2.3 2.4 2.2
8 Import Duty 15.4 11.2 8.8 8.4 7.6 7.2 7.4 9 Excise Duty on
Import 5.9 10.0 6.3 11.3 8.8 8.7 7.7 10 VAT on Import 10.8 21.1 24.9 16.6 16.2 15.1 13.5 11 Other Import
Charges c 2.4 5.8 3.8 6.5 6.6 6.0 8.1
Total (%) 100.0 100.0 100.0 100.0 100.0 100.0 100.0
Notes: a other income taxes here include rental tax, withholding tax, skills and development levy, gaming tax and
capital gains, and miscellaneous collection tax; b other domestic taxes and charges include motor vehicle taxes,
stamp duty, departures charges, and business license; c other import charges include fuel levy, export duties,
non-tax revenue, and other import charges.
Source: Tanzania Revenue Authority (TRA) (2014).

5
Table 2: Tax revenue as a percentage of total tax revenue (TRA Zanzibar)
Tax Item 1996/97 2000/01 2005/06 2010/11 2011/12 2012/13 2013/14
1 PAYE 2.0 5.6 16.4 17.4 19.2 19.4 20.0 2 Corporation Tax 2.1 3.2 11.0 6.5 7.2 8.6 6.7 3 Individuals 1.8 2.1 3.2 2.5 3.2 3.5 2.9 4 Others Taxes 0.8 1.2 4.9 9.7 6.0 7.1 6.3 5 Import Duty 45.2 44.6 26.0 27.4 24.9 24.0 24.7 6 Excise Duty on
Imports 15.2 2.8 10.7 8.0 8.7 8.0 8.0 7 VAT on Imports 27.8 37.8 23.8 24.2 27.1 25.8 28.0 8 Other 5.2 2.9 4.0 4.1 3.7 3.6 3.4 Total (%) 100.0 100.0 100.0 100.0 100.0 100.0 100.0
Source: TRA (2014).
Table 3: Tax revenue trends in Tanzania (per cent of GDP)
Category 2004/05
2005/06
2006/07
2007/08
2008/09 2009/10
2010/11
2011/12
2012/13
2013/14
Period Average
Income Tax 3.4 3.8 4.4 4.8 5.1 4.9 5.3 6.0 6.5 7.1 5.1
PAYE 1.6 1.7 2.1 2.2 2.5 2.5 2.7 2.7 2.9 2.9 2.4
B.Skills & Dev Levy 0.3 0.3 0.3 0.3 0.3 0.4 0.3 0.3 0.3 0.3 0.3
Individuals 0.2 0.2 0.2 0.2 0.2 0.2 0.2 0.2 0.1 0.2 0.2
Corporate Taxes 1.0 1.2 1.4 1.6 1.6 1.4 1.5 1.9 2.1 2.7 1.6
Withholding Taxes 0.3 0.3 0.4 0.4 0.4 0.5 0.4 0.7 0.8 0.9 0.5
Rental Tax 0.1 0.1 0.1 0.1 0.1 0.1 0.1 0.1 0.1 0.1 0.1 All Other Direct Taxes 0.0 0.0 0.0 0.0 0.0 0.0 0.1 0.1 0.1 0.0 0.0 Consumption Taxes 2.8 2.9 3.3 3.7 4.0 3.7 3.7 3.8 3.9 4.2 3.6
Excise (Domestic) 0.7 0.8 0.9 1.0 1.1 1.0 0.9 1.1 1.2 1.3 1.0 VAT Domestic Products 0.9 0.7 1.0 0.9 0.9 0.8 0.9 0.9 0.6 0.6 0.8 VAT Domestic Services 1.0 1.2 1.2 1.5 1.7 1.6 1.5 1.4 1.8 1.8 1.5 Other Domestic Taxes & Charges 0.2 0.2 0.2 0.3 0.3 0.3 0.4 0.4 0.4 0.4 0.3 International Trade Taxes 5.0 5.2 5.8 6.6 6.6 6.4 6.7 6.4 6.1 6.5 6.1
Import Duties 0.7 1.0 1.3 1.4 1.4 1.3 1.4 1.3 1.3 1.4 1.2
Excise Duties 0.9 0.7 1.6 1.9 1.8 1.8 1.8 1.4 1.4 1.4 1.5
VAT on Imports 2.9 3.0 2.4 2.4 2.4 2.5 2.6 2.6 2.5 2.4 2.6 Tax Revenue as Percent of GDP 11.2 11.9 13.5 15.2 15.7 15.1 15.6 16.2 16.6 17.7 14.9
Memorandum Items:
Direct Taxes 3.4 3.8 4.4 4.8 5.1 4.9 5.3 6.0 6.5 7.1 5.1
Indirect Taxes 7.8 8.2 9.1 10.3 10.6 10.1 10.3 10.2 10.1 10.6 9.7
Note: B.Skills & Dev. Levy stands for business skills and development levy.
Source: TRA (2014).
6
2.1 Direct taxation
Income taxes are levied on wages and salary incomes, business incomes and capital incomes. The major contributors of income tax in Tanzania are Personal Income Tax (PIT) and Corporate Income Tax (CIT). In total these account for around 82 per cent of total taxes on income (TRA 2014). There are three key categories of PIT, namely presumptive income taxes, PIT for account cases and the Pay As You Earn (PAYE). The PAYE is essentially not a tax in itself but rather a method of collecting the PIT for wage income earners. Leaving aside PAYE, both individual and corporate income taxes are believed to be prone to tax evasion by a wide range of Tanzanian population. Most individual businesses and self-employment earning individuals in Tanzania do not keep books of accounts, which makes it challenging for tax authorities to make assessment of their income for tax purposes.
According to the 2014 demographic and socio-economic profile report produced by the NBS, the total population engaged in various economic activities—the potential labour force—is about 18.2 million people. Of these 18.2 million people, approximately 66 per cent, equivalent to 12 million people, are estimated to be engaged in subsistence agriculture and so are likely to fall outside the tax net due to the informality of the sector’s activity. The remaining 6.2 million people are the potential tax payers, although of these, approximately 14 per cent or 2.5 million people are engaged in informal activities and thus are not in the tax net. Following this distribution, 3.7 million people in formal employment form the potential PAYE tax base. The current PAYE tax base is around two million employees from both the public and private sector.
PAYE is a method of collecting the PIT for salary and wage income earners. It applies a withholding tax approach on taxable incomes of employees. Under this system, an employer is required by law to deduct income tax from an employee’s taxable salary or wages (see Annex 2 for details about the withholding tax approach, and Annex 3 for details of gains or profits included and excluded in the calculation of income from employment).1 Income tax rates are different in Zanzibar from those in Tanzania mainland.2
Presumptive tax is applied to resident individuals with businesses that have an annual turnover of less than TZS 20 million. Individuals with an annual turnover above this threshold pay personal income tax for individuals who prepare audited accounts, and are taxed on their profits.3
Capital gains tax is charged from realization of interest in land or buildings (see Annex 4).
The Skills Development Levy (SDL) is collected by TRA under the Vocational Education Training Act and Income Tax Act. SDL is payable by an employer who has four or more employees, with certain exceptions. In general everything chargeable under PAYE is also taken into account when calculating SDL, and it is calculated as 5 per cent of the total emoluments paid to all employees during the month.4
1 For further details see http://www.tra.go.tz/index.php/paye.
2 For further details see URT 2006.
3 For further details see http://www.tra.go.tz/index.php/income-tax-for-individual.
4 For further details see http://www.tra.go.tz/index.php/skills-development-levy-sdl
7
2.2 Indirect taxation
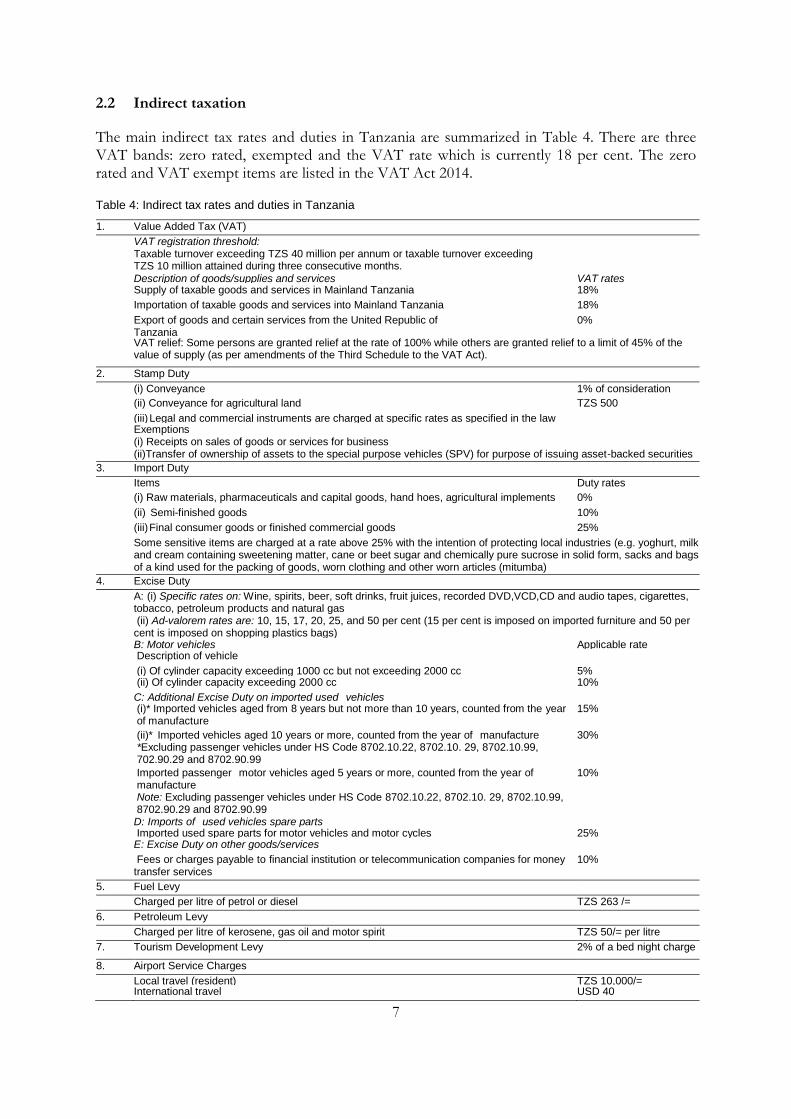
The main indirect tax rates and duties in Tanzania are summarized in Table 4. There are three VAT bands: zero rated, exempted and the VAT rate which is currently 18 per cent. The zero rated and VAT exempt items are listed in the VAT Act 2014.
Table 4: Indirect tax rates and duties in Tanzania
1. Value Added Tax (VAT)
VAT registration threshold: Taxable turnover exceeding TZS 40 million per annum or taxable turnover exceeding TZS 10 million attained during three consecutive months.
Description of goods/supplies and services VAT rates Supply of taxable goods and services in Mainland Tanzania 18%
Importation of taxable goods and services into Mainland Tanzania 18%
Export of goods and certain services from the United Republic of Tanzania
0%
VAT relief: Some persons are granted relief at the rate of 100% while others are granted relief to a limit of 45% of the value of supply (as per amendments of the Third Schedule to the VAT Act).
2. Stamp Duty
(i) Conveyance 1% of consideration
(ii) Conveyance for agricultural land TZS 500
(iii) Legal and commercial instruments are charged at specific rates as specified in the law Exemptions
(i) Receipts on sales of goods or services for business (ii)Transfer of ownership of assets to the special purpose vehicles (SPV) for purpose of issuing asset-backed securities
3. Import Duty
Items Duty rates
(i) Raw materials, pharmaceuticals and capital goods, hand hoes, agricultural implements 0%
(ii) Semi-finished goods 10%
(iii) Final consumer goods or finished commercial goods 25%
Some sensitive items are charged at a rate above 25% with the intention of protecting local industries (e.g. yoghurt, milk and cream containing sweetening matter, cane or beet sugar and chemically pure sucrose in solid form, sacks and bags of a kind used for the packing of goods, worn clothing and other worn articles (mitumba)
4. Excise Duty
A: (i) Specific rates on: Wine, spirits, beer, soft drinks, fruit juices, recorded DVD,VCD,CD and audio tapes, cigarettes, tobacco, petroleum products and natural gas (ii) Ad-valorem rates are: 10, 15, 17, 20, 25, and 50 per cent (15 per cent is imposed on imported furniture and 50 per cent is imposed on shopping plastics bags)
B: Motor vehicles Applicable rate Description of vehicle
(i) Of cylinder capacity exceeding 1000 cc but not exceeding 2000 cc 5% (ii) Of cylinder capacity exceeding 2000 cc 10%
C: Additional Excise Duty on imported used vehicles (i)* Imported vehicles aged from 8 years but not more than 10 years, counted from the year
of manufacture 15%
(ii)* Imported vehicles aged 10 years or more, counted from the year of manufacture *Excluding passenger vehicles under HS Code 8702.10.22, 8702.10. 29, 8702.10.99, 702.90.29 and 8702.90.99
30%
Imported passenger motor vehicles aged 5 years or more, counted from the year of manufacture Note: Excluding passenger vehicles under HS Code 8702.10.22, 8702.10. 29, 8702.10.99, 8702.90.29 and 8702.90.99
10%
D: Imports of used vehicles spare parts Imported used spare parts for motor vehicles and motor cycles 25% E: Excise Duty on other goods/services
Fees or charges payable to financial institution or telecommunication companies for money transfer services
10%
5. Fuel Levy
Charged per litre of petrol or diesel TZS 263 /=
6. Petroleum Levy
Charged per litre of kerosene, gas oil and motor spirit TZS 50/= per litre
7. Tourism Development Levy 2% of a bed night charge
8. Airport Service Charges
Local travel (resident) TZS 10,000/= International travel USD 40
8
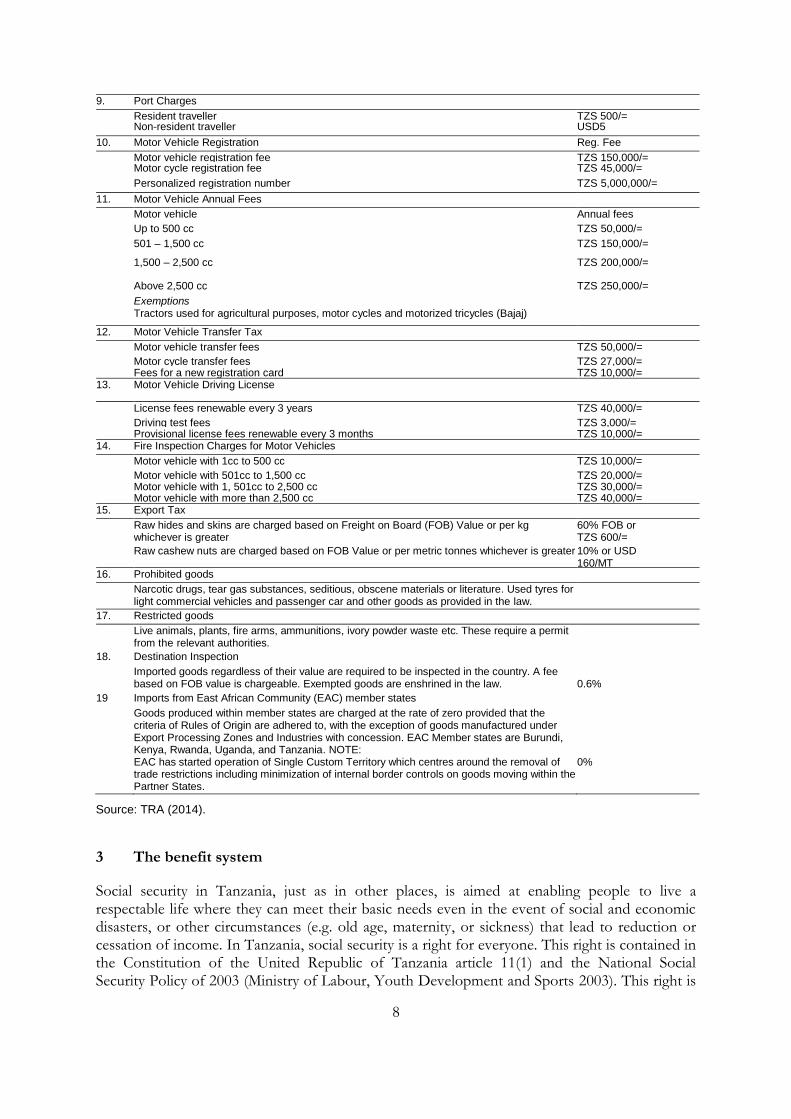
9. Port Charges
Resident traveller TZS 500/= Non-resident traveller USD5
10. Motor Vehicle Registration Reg. Fee
Motor vehicle registration fee TZS 150,000/= Motor cycle registration fee TZS 45,000/=
Personalized registration number TZS 5,000,000/=
11. Motor Vehicle Annual Fees
Motor vehicle Annual fees
Up to 500 cc TZS 50,000/=
501 – 1,500 cc TZS 150,000/=
1,500 – 2,500 cc TZS 200,000/=
Above 2,500 cc TZS 250,000/=
Exemptions Tractors used for agricultural purposes, motor cycles and motorized tricycles (Bajaj)
12. Motor Vehicle Transfer Tax
Motor vehicle transfer fees TZS 50,000/=
Motor cycle transfer fees TZS 27,000/= Fees for a new registration card TZS 10,000/= 13. Motor Vehicle Driving License
License fees renewable every 3 years TZS 40,000/=
Driving test fees TZS 3,000/= Provisional license fees renewable every 3 months TZS 10,000/= 14. Fire Inspection Charges for Motor Vehicles
Motor vehicle with 1cc to 500 cc TZS 10,000/=
Motor vehicle with 501cc to 1,500 cc TZS 20,000/= Motor vehicle with 1, 501cc to 2,500 cc TZS 30,000/= Motor vehicle with more than 2,500 cc TZS 40,000/= 15. Export Tax
Raw hides and skins are charged based on Freight on Board (FOB) Value or per kg whichever is greater
60% FOB or TZS 600/=
Raw cashew nuts are charged based on FOB Value or per metric tonnes whichever is greater 10% or USD 160/MT
16. Prohibited goods
Narcotic drugs, tear gas substances, seditious, obscene materials or literature. Used tyres for light commercial vehicles and passenger car and other goods as provided in the law.
17. Restricted goods
Live animals, plants, fire arms, ammunitions, ivory powder waste etc. These require a permit from the relevant authorities.
18. Destination Inspection
Imported goods regardless of their value are required to be inspected in the country. A fee based on FOB value is chargeable. Exempted goods are enshrined in the law.
0.6%
19 Imports from East African Community (EAC) member states
Goods produced within member states are charged at the rate of zero provided that the criteria of Rules of Origin are adhered to, with the exception of goods manufactured under Export Processing Zones and Industries with concession. EAC Member states are Burundi, Kenya, Rwanda, Uganda, and Tanzania. NOTE: EAC has started operation of Single Custom Territory which centres around the removal of trade restrictions including minimization of internal border controls on goods moving within the Partner States.
0%
Source: TRA (2014).
3 The benefit system
Social security in Tanzania, just as in other places, is aimed at enabling people to live a respectable life where they can meet their basic needs even in the event of social and economic disasters, or other circumstances (e.g. old age, maternity, or sickness) that lead to reduction or cessation of income. In Tanzania, social security is a right for everyone. This right is contained in the Constitution of the United Republic of Tanzania article 11(1) and the National Social Security Policy of 2003 (Ministry of Labour, Youth Development and Sports 2003). This right is

9
also classified in the Universal Declaration of Human Rights of 1948 and International Labour Organization charters.
3.2 Contributory benefits
In Tanzania, there are mandatory and voluntary or supplementary social insurance schemes5.
Social insurance funds in Tanzania started during the British colonial rule and have been expanded and reformed over the years. Several pieces of social insurance legislation have been enacted for workers in different sectors of the economy.6 The enacted legislation includes: the Government Employees Provident Fund (GEPF) established under the GEPF CAP 51 of
1942 (RE 2002)7; the Parastatal Pensions Fund (PPF) established under the PPS Act No.14 of
1978 as amended by Act No.25 of 2001, CAP 372 (RE 2002); the National Social Security Fund (NSSF) established under the NSSF Act No. 28 of 1997, CAP 508; t h e Public Service Pensions Fund ( P S P F ) established under the PSPF Act No.2 of 1999, CAP 371; the Local Authority Pensions Fund (LAPF) established under the LAPF Act No. 9 of 2006, CAP 4079; and the National Health Insurance Fund (NHIF) established under the NHIF Act No.8 of
1999, CAP 395. The different legislations have led to multiple schemes with similar and overlapping functions and fragmented membership. All this has been harmonized through the enactment of the Social Security Regulation (SSR) Act in 2008.
The main contributory social insurance schemes are shown in Table 5. The respective employer and employee contribution rates are given in the table.
Table 5: Summary of contributory social insurance schemes (mandatory schemes)
No. Name of Scheme
Contribution Rates (%)
EE’s ER’s Total Year of Establishment Ministry
1 Government Employees Provident Fund (Retirement Benefit)
15 10 25 1942 MoFEA
2 Local Authority Pension Fund 15 5 20 1944 PMO-RALG
3 National Provident Fund 10 10 20 1964 MoLE
4 Parastatal Pension Fund 15 5 20 1978 MoFEA
5 National Social Security Fund (Pension Fund)
10 5 15 1998 MoFEA
6 Public Service Pension Fund 15 5 20 1999 MoFEA 7 National Health Insurance Fund 3 3 6 1999 MoHSW 8 Community Health Funds (Insurance
Fund) 2001 N/A
Note: EE’s = employees; ER’s = employers.
Source: Author’s construction.
5 In Tanzania ‘social insurance’ is often referred to as ‘social security’, but for transparency we refer here to ‘social insurance’.
6 See Annex 5 for an historical overview of these social security schemes.
7 In 2013, the government converted GEPF from a Provident Fund to a Pension Fund. RE=revised version.
8 In 1998, the government transformed the National Provident Fund into the National Social Security Fund.
9 In 2006, the government converted LAPF from a Provident Fund to a Pension Fund.
10
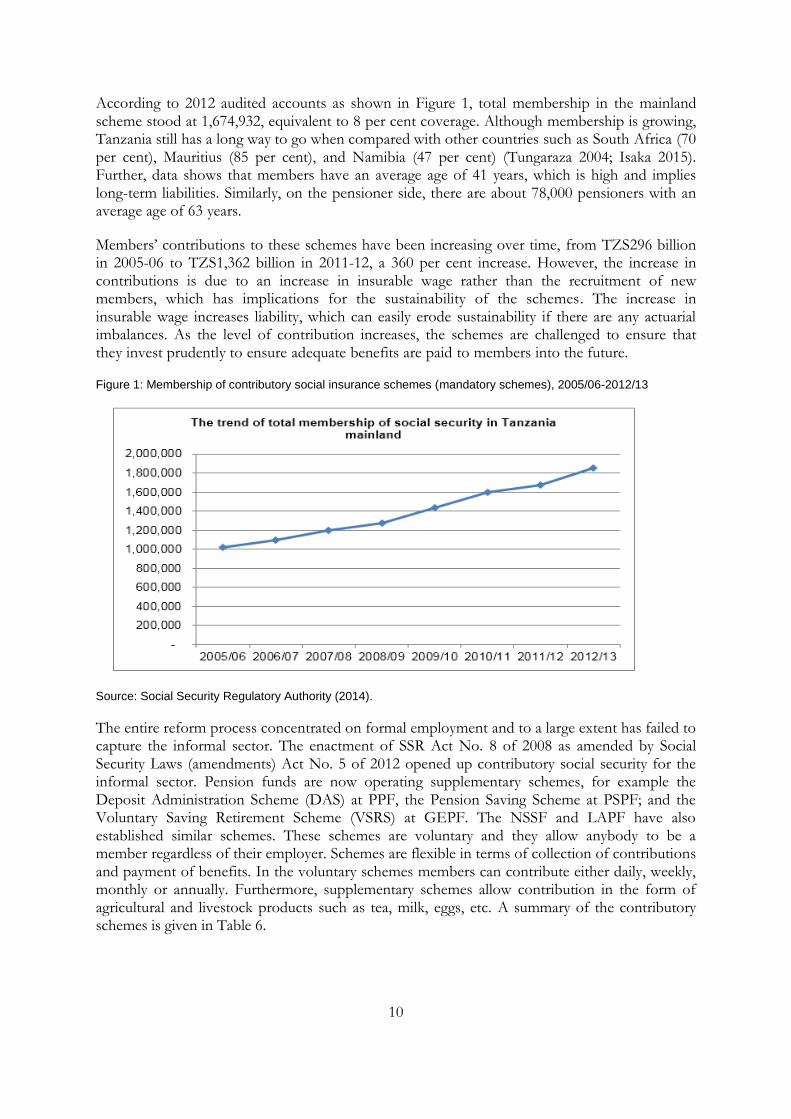
According to 2012 audited accounts as shown in Figure 1, total membership in the mainland scheme stood at 1,674,932, equivalent to 8 per cent coverage. Although membership is growing, Tanzania still has a long way to go when compared with other countries such as South Africa (70 per cent), Mauritius (85 per cent), and Namibia (47 per cent) (Tungaraza 2004; Isaka 2015). Further, data shows that members have an average age of 41 years, which is high and implies long-term liabilities. Similarly, on the pensioner side, there are about 78,000 pensioners with an average age of 63 years.
Members’ contributions to these schemes have been increasing over time, from TZS296 billion in 2005-06 to TZS1,362 billion in 2011-12, a 360 per cent increase. However, the increase in contributions is due to an increase in insurable wage rather than the recruitment of new members, which has implications for the sustainability of the schemes. The increase in insurable wage increases liability, which can easily erode sustainability if there are any actuarial imbalances. As the level of contribution increases, the schemes are challenged to ensure that they invest prudently to ensure adequate benefits are paid to members into the future.
Figure 1: Membership of contributory social insurance schemes (mandatory schemes), 2005/06-2012/13
Source: Social Security Regulatory Authority (2014).
The entire reform process concentrated on formal employment and to a large extent has failed to capture the informal sector. The enactment of SSR Act No. 8 of 2008 as amended by Social Security Laws (amendments) Act No. 5 of 2012 opened up contributory social security for the informal sector. Pension funds are now operating supplementary schemes, for example the Deposit Administration Scheme (DAS) at PPF, the Pension Saving Scheme at PSPF; and the Voluntary Saving Retirement Scheme (VSRS) at GEPF. The NSSF and LAPF have also established similar schemes. These schemes are voluntary and they allow anybody to be a member regardless of their employer. Schemes are flexible in terms of collection of contributions and payment of benefits. In the voluntary schemes members can contribute either daily, weekly, monthly or annually. Furthermore, supplementary schemes allow contribution in the form of agricultural and livestock products such as tea, milk, eggs, etc. A summary of the contributory schemes is given in Table 6.

11
Table 6: Summary of supplementary schemes
No. Supplementary scheme Mandatory scheme on which it is based
1 Deposit Administration Scheme National Social Security Fund 2 Pension Saving Scheme Public Service Pension Fund 3 Deposit Administration Scheme Parastatal Pension Fund 4 Pension Saving Scheme Local Authority Pension Fund 5 Voluntary Saving Retirement Scheme Government Employees Provident Fund
Source: Author’s construction.
There are two kinds of benefits offered by the social insurance schemes in Tanzania: short- and long-term benefits. Short-term benefits include: i) health/medical care; ii) employment injury; iii) maternity; iv) death gratuity and funeral benefit; iv) education; and v) withdrawals. Long-term benefits include: i) old age pension; ii) invalidity benefits; and iii) survivors’ benefits. Details of the benefits structures are as shown in Table 5. It is worth noting that the social security benefits structure in Tanzania is one of the best when compared to the rest of the East African countries (Isaka 2015). While other countries are providing replacement rates10 ranging between 12 and 40 per cent, in Tanzania replacement rates are between 67 and 80 per cent. The best practice requires at least 40 per cent replacement rates, and Tanzania’s replacement rates are similar to those offered by high income OECD countries (Isaka 2015). The benefits packages are prescribed in each scheme’s legislation, as detailed in Table 7.11
The SSRA, through Social Security Laws (amendments) Act No.5 of 2012 the Government Harmonized Legal and Regulatory Framework paved the way recently for SSRA to make a number of changes aimed at harmonizing pension payments in the country. The benefits and objectives of the new formula are to provide equity in the benefit structure of the different schemes, provide the legal framework for standards regarding pension benefits, improve pension’s benefits to members, and protect members’ interest.12 The new formula for calculating benefits has increased payments up to 72.5 per cent from 60-67 per cent, which was paid previously to members of NSSF, PPF, and GEPF (benefits are calculated on the highest salary in the last three years before retiring). The new formula is applicable to all members of NSSF, PPF, and GEPF. Moreover the formula does not apply to existing members of PSPF and LAPF as at 30 June 2014, although it applies to new entrants from 1 July 2014.
10 Replacement rate means the relationship between the amount payable as a pension and the amount of reference earnings which a member was enjoying during his working life.
11 In addition to the contributory schemes, there are some non-contributory pension schemes including the Political Leaders Pension Scheme and the Senior State Leaders Pension Scheme. There is also a pension scheme for the armed forces.
12 See Annex 6 for details of the harmonized qualifying conditions and benefit calculation.

12
Table 7: Characteristics of social insurance schemes in mainland Tanzania Provision NSSF PSPF PPF LAPF GEPF NHIF
Type of scheme PAYG DB; converted from a provident fund in 1998
PAYG DB; converted from anon-contributory DB scheme in 1999
PAYG DB (PPS) and funded DC (DAS)
PAYG DB; converted from a provident fund in 2005
Funded DC Health Insurance
Membership Private sector (formal and self- employed) Government employees and other not covered by any pension scheme
Central government (pensionable positions)
- Parastatals - Companies with Government ’s shares - Private sector (formal and self- employed)
- Local government - Open to others
- Government employees in non- pensionable positions - Open to others
- Government employees in non- pensionable positions - Open to others
Contributions (employee/employer)
10%: 10% 5% :15% - 5%:15% (parastatals) - 10%:10% (private sector)
- 5%:15% (local government) - 10%:10% (private sector)
10%:15% 3%:3%
Types of benefits
- Old age (retirement) - Invalidity - Survivorship - Health (insurance) - Funeral grant - Maternity - Withdrawal - Employment - Injury
- Old age (retirement) - Invalidity - Survivorship - Withdrawal - Funeral Grant - sickness
Traditional Pension Scheme (PPS): - Old age (retirement) - Invalidity - Survivorship - Withdrawal - Education Deposit Administration
- Old age (retirement) - Invalidity - Survivorship - Funeral grant - Maternity, marriage, other unemployment
Defined contribution scheme (lump sum)
Scheme (DAS): - Defined contribution scheme (lump sum)
- Withdrawal
Legislation NSSF Act, Section 26(1) Public Service Retirement Benefits Act, Part III, Sections 6-17
PPF Act, Section 21(2), Part VI LAPF Act, Section 26(1)
Retirement age 60; min 55 (0.5p.p. repl. rate reduction per year prior to age 60)
60; min 55 (with no reduction)
60; min 55 (with no reduction)
60; min 55 (with no reduction)
60; min 45 (with no reduction)
Vesting period(in years) 15 15 10 15 n/a
Annual accrual rate 2% for first 15 years plus 1.5% for each year above 15
2.22% 2.0% 2.22% n/a
Max replacement rate
67.5% No maximum 66.7% No maximum n/a
Income measure
Best 5 year average of last 10 years (not valorized)
Final salary Best 5 year average (not valorized)
Final salary n/a
Indexation Follow actuarial recommendation No indexation No indexation No indexation n/a
Minimum pension, monthly
52,000 TZS; increased to 80,000 TZS from October 2010
20,000 TZS 50,000 TZS No minimum n/a
Source: Authors’ compilation.
13
3.2 Non-contributory benefits
The Tanzania Social Action Fund (TASAF) is implementing the Productive Social Safety Net (PSSN). The PSSN programme contributes to the achievement of the overall government objective of enabling poor households to increase incomes and opportunities while improving consumption. In this context, the government’s expected outcomes from this strategy can be summarized as follows:
a) vulnerable population protected from severest consequences of poverty; b) vulnerable population better able to support itself through enhanced and diversified
livelihoods; and c) access to an enabling environment enhanced, including access to key services in targeted
communities.
The PSSN programme will achieve its objectives through the following sets of actions:
a) Establishment of a national safety net incorporating transfers linked to participation in public works and adherence to co-responsibilities.
b) Support to community driven interventions which enhance livelihoods and increase incomes (through community savings and investments as well as specific livelihood enhancing seed grants to facilitate asset building).
c) Targeted infrastructure development (education, health and water) to enable service poor communities to realize the objectives of the safety net.
d) Capacity building to ensure adequate programme implementation by community, local government authorities, regional and national levels.
PSSN activities target poor households, defined as households that cannot afford basic costs of a minimum standard of living in a particular society. It includes those who cannot afford one meal a day or those who may not have any cash/people living under the basic need poverty line, currently 28.2 per cent of the population (URT 2014). The means-test amount is TZS1,216 per day, which is much less than USD1. These households benefit from a combination of basic and conditional cash transfers, cash transfers through participation in labour-intensive public works and advice and support concerning savings and investments.
The core activity of PSSN is a community-based cash transfer programme, whose initial phase in the form of a pilot programme has already gone into effect (see below). While the pilot programme has included only three districts, the plan under PSSN is to eventually cover the entire target population across the country. The cash transfer scheme will be further complemented by a set of community and infrastructure development initiatives covering the same households. The direct beneficiaries of the programme are poor and vulnerable households living in Project Area Authorities (PAAs) and villages identified as being most affected by poverty. In addition to the direct beneficiaries, households living in the selected villages benefit from the creation of community assets under the labour-intensive public works component of the programme.
In 2010, the government of Tanzania rolled out a pilot programme in three districts (Bagamoyo, Chamwino, and Kibaha), selected in part for their poverty relative to other areas of Tanzania. The cash transfer comprizes two benefits: the first is a basic cash transfer per household which is transferred to all eligible registered households; and the second is a variable conditional cash transfer for households with children to serve as an incentive for households to invest in the human capital of their children. The variable conditional cash transfer for households with
14
children is subject to participants’ compliance with health and education conditionalities. At the beginning the aim was to see if, using a model that relied heavily on communities to target beneficiaries and deliver payments, the programme could improve outcomes for the poor the way centrally run programs have in other contexts. Benefits were provided to poor households based on the number of vulnerable children (aged 0-15) and elderly (aged 60+) therein. Payments were made every other month, or six times each year. Locally-elected community management committees monitored compliance with the conditions and penalized participating households that did not comply.
The pilot programme is now being scaled up. In 2012 PSSN III was officially launched as a ten-year programme and by 2014-15 there were 3.9 million beneficiaries.13
In addition, self-help groupings such as Money-go-round—UPATU, ‘Umoja wa Matibabu Sekta Isiyo Rasmi’—UMASIDA, and Micro Health Insurance Scheme Programme—VIBINDO have also formed in response to the slow disintegration of the family-based social support system (TASAF, 2014).
4 Data sources
4.1 Income and expenditure data
Microsimulation of the tax and benefit system in a particular country requires detailed data on individuals in terms of their demographic profile, incomes, expenditures and household relationships. A potentially suitable data source was identified in the scoping study (Wright et al. 2015): the HBS. The 2011-12 HBS was conducted by the NBS in Tanzania Mainland as part of the monitoring and evaluation of the National Strategy for Growth and Reduction of Poverty (NSGPR) Master Plan. As with the previous surveys, the 2011-12 HBS forms the basis for tracking progress on the Government’s poverty-reduction initiatives. The latest data from the HBS were collected in 2011-12. Prior to this, surveys were conducted in 1991-92, 2000-01, and 2007. The survey is updated approximately every five years, and on this basis the next round of the survey should be in 2016-17.
Throughout the following sections reference is made to two reports: the Main Report (NBS 2014a) and the Technical Report (NBS 2014b).
4.1.1 HBS 2011-12
The HBS 2011-12 is a cross-sectional survey. It was administered to a representative sample of households. The survey was based on the 2002 Population and Housing Census frame. Sampling weights were used to make estimates representative of the population. A stratified two-stage sample design was used for this survey. At the first stage, 400 enumeration areas (out of 52,375 nationally) were systematically selected as the primary sampling units (PSUs) using probability proportional to size within each stratum. The measure of size used was the total number of households identified in the sampling frame for the 2002 Census. At the second stage, households were selected from the listing for each sample Enumeration Area (EA), with a new listing of households drawn up immediately prior to data collection. The units of analysis were
13 Correspondence from TASAF.

15
the individual households and persons in these households. A systematic sample of 26 households (and a reserve of four random households) in each EA was selected.14
Of the original sample of 10,400 households, 9,788 households were interviewed, giving a response rate of 94.1 per cent. Original sample households which could not be interviewed were replaced from the reserve sample of households for each EA. There was a standard approach to replace all non-interviews (either refusal or respondent not at home).15 In total 10,186 households were successfully interviewed, comprising 46,593 individuals. The HBS 2011-12 is representative below national level, but only at domain level (Dar-es-Salaam, other urban, and rural areas).16
Households are defined as individuals who normally live and eat their meals together.17 The household head is identified by the household as the person who holds the role of decision maker and controls the welfare of the household.18 According to the Technical Report19, child-headed households should be captured, providing the child head is not less than 10 years old. Examination of the data reveals that nine of the 10,186 household heads (<0.1 per cent) are aged under 18 and the youngest is 14.
Data
The HBS 2011-12 data were obtained direct from the Tanzania NBS for this project but are also available from the NBS website.20 The survey was undertaken in Swahili and English and there is a detailed Technical Report in English. There are two data dictionaries, one supplied with the data, and a second obtained later from the NBS. The former largely contains information about the variables relating to household expenditure only (possibly those used in poverty analysis undertaken by the NBS), and unfortunately the value labels column for these variables seems to be incomplete. The latter lists the variables and codes for all the files but without any explanatory text. It can, therefore, be difficult to navigate the numerous data files, although the variables are well labelled in English (in general the variable names are the question number and the labels are the question itself).
The data files contain weights. Sampling weights were defined as the inverse of each household’s selection probability, taking into account the selection of the PSU and stratification within the PSU. The weighting process also corrected for non-response. The weights were adjusted using the 2012 Population and Housing Census so that the sum of individuals by area was equal to its population for 2012.21
14 See pages 5-18 of the Technical Report for further detail.
15 See pages 20-21 of the Technical Report.
16 See page 6 of the Main Report.
17 See Randall and Coast (2015) for an exploration of the concept of a ‘household’ and how different types are captured by survey data in Tanzania (and elsewhere), with consequences for poverty measurement.
18 See page 3 of the Main Report.
19 See page 73 of the Technical Report, which gives as an editing specification the instruction that ‘Age of head of household should be reasonable (say not less than 10 years)’.
20 See http://www.nbs.go.tz/tnada/index.php/catalog/36. (It is necessary to register first).
21 See pages 18-24 of the Technical Report and page 11 of the Main Report.

16
NBS has confirmed that imputation of missing values has not been undertaken and also that there are no derived variables.
There does not appear to be a household roster. There is, however, information on relationship to household head and biological father/mother (including id numbers) and therefore it will be possible to determine some relationships within the household. Others may need to be determined using a series of rules aimed at identifying the most likely relationships. The possible responses to the question on marital status are: monogamous married; polygamous married; living together; separated; divorced; never married; widow.
There are 43 data files in total, with names that in general relate to sections of the questionnaire (e.g. SECT1 is Section 1). The files can be merged together using the appropriate id variables.22 The information contained in the relevant23 files is described below.24
Information on households
Non-expenditure/consumption information on households can be found in a single file called SECT2 (though note that this file does not only contain information from Section 2 of the questionnaire). This file contains information on main building (material for floor/walls/roof, rooms); legal status, rent and building use; secondary buildings; utilities, water and sanitation (connection to TANESCO, main fuel for lighting/cooking, toilet facility, drinking water source, water collection).
Information on individuals
Non-income information on individuals can be found in two files called SECT1 and SECT12. The file SECT1 contains information on sex; age; relationship to head; citizenship; main activity for past 12 months; biological father and mother; marital status; residence/migration; school attendance; current grade; highest grade; travel to school; absence from school; illness or injury; medical attention sought; difficulties with sight, hearing etc; activity in last seven days; literacy; household size. The file SECT12, which is asked of household members aged five and above only, contains information on work in the last 12 months; work in the last seven days (primary and secondary job); activity to look for work; hours, weeks and months worked; employer; sector/industry; occupation.
Information on income
Information on income is collected at the individual level. Fieldwork was conducted from October 2011 to October 2012. The income questions relate to either the last month or last 12
months (the previous 12 months starting from the date before the first interview took place).25
The file SECT12 additionally contains information on pay from employment (how much was the last cash payment and what time period did it cover?), as well as the value of in kind pay. The
22 The key variables are hhid (household id) and memid (person id).
23 Other sections of the questionnaire not discussed include Section 10: investment at household level; Section 11: sales at household level; and Section 13: non-farm household businesses.
24 In addition, in each file there is usually information about the interview and location including household and/or person id numbers, and weights. These variables are not mentioned each time.
25 See page 4 of the Main Report.

17
remainder of the income information can be found in the file SECT14, which again is asked of household members aged five and above. The file contains information on the net amount of last monthly payment received and number of payments received over last 12 months for the following: earnings or food from a cash for work or food work programme; income from the rent of residential premises abroad; income from the rent of residential premises in Tanzania; income from the rent of non-agricultural business premises, garages etc abroad; income from the rent of non-agricultural business premises, garages etc in Tanzania; money from other households or persons in Tanzania (i.e. local remittances); money from other households or persons abroad (i.e. remittances from abroad); food assistance; assistance with school uniform or shoes; assistance with teaching aids, books etc.; assistance with bed nets; a loan; exemption or waiver of school fees; exemption or waiver of health expenses; cash transfer programme (government or non-governmental organization); and other sources.
Although there is information on a range of income sources, some income variables have been aggregated such that they may only allow crude simulations to be produced. The extent of this will only become clearer when starting to build a microsimulation model.
Information on expenditure/consumption
Information on expenditure is collected at the household level. Fieldwork was conducted from October 2011 to October 2012. Two households in each selected EA were interviewed each month. Expenditure is recorded for the last month, three months or 12 months (based on the assumed frequency of purchase), or as daily expenditure/consumption for 28 days (standardized to one full month).26
There are numerous files relating to expenditure/consumption. The file SECT2 contains the majority of the information on expenditure, including current expenditures on utilities, fuel, etc. for main dwelling and secondary buildings; expenditure on maintenance of main dwelling and secondary buildings; expenditure on small electrical household appliances; expenditure on domestic workers; expenditure on new and second hand vehicles; expenditure on other transport; expenditure on leisure activities; expenditure on education; expenditure on holidays and business trips; expenditure on other articles and services. Certain expenditure questions are recorded in separate files: durable goods; furniture and repairs; clothing (new and second-hand); health expenses; vehicles; communications; spare time; school registration fees (formal and informal in public and private schools); other articles and services.
Daily expenditure and consumption from the household diary are recorded in another series of files. For the files relating to non-food expenditure (SECTA1 and SECTA2) there is information on date; COICOP code; name of product; unit of measure; quantity; amount paid or estimated monetary value (for gifts); where purchased from; and destination code (i.e. own consumption, sale, to stock, feed animals). For the files relating to food consumption (SECTB1 and SECTB327) there is information on date; COICOP code; name of food products used to prepare meals
26 We have been informed by NBS that they normally adjust nominal consumption of households for temporal and spatial cost of living differences. Temporal price differences are associated with the duration of the fieldwork over the course of a full year, while spatial differences are associated with the location of households interviewed in the survey. The price indices used to adjust nominal consumption are computed entirely from the 2011-12 HBS data—no external information (e.g. from the Consumer Price Index database) is used. To deflate nominal consumption NBS uses the Fisher ideal index.
27 Files B2 and B4 contain information on number of people eating food inside and outside the home by meals (breakfast, lunch, dinner).

18
inside home/description of food consumed outside home; unit of measure (meals inside home only); quantity (meals inside home only); amount paid or estimated monetary value; and source (meals inside home only). The cover flap of file SECT2 says ‘take great care not to duplicate expenditure recorded here with that recorded in the household diary’.
The expenditure/consumption data is therefore very detailed, however, some assistance will be required in interpreting and using these files in the construction of a microsimulation model. However, from the Technical Report description of the poverty estimation methodology it is possible to infer an appropriate way to handle the data. It can be deduced that food consumption is based on the food transactions recorded in the 28 day diary, while non-food expenditure is based on information about purchases in the last month, three months or 12 months (converted to monthly expenditure). A limited set of diary expenditure was added to this information about non-food expenditure.28
Additional information: agricultural production
Sections 15-21 (and the associated data files) of the questionnaire relate to agricultural production (including sales/income and expenses). Consideration needs to be given to the inclusion of such information in any microsimulation model.
Previous analysis of the data
The HBS 2011-12 has been analysed by the NBS ( both 2014a and 2014b) with analysis focusing on poverty relevant indicators (there are sections on demographics; household dwellings, facilities and durable goods; education and health; productive activities and assets; household consumption and expenditure; poverty and inequality; business income; tourism and communication). Arndt et al. (2014) cite trends in poverty based on the Tanzania HBS of 1991-92, 2000-01, 2006-07, and 2011-12, though their analysis is based on the Tanzania Demographic and Health Surveys. Other publications which have made use of the HBS 2011-12 data are listed
on the International Household Survey Network (IHSN) website.29
Weaknesses of the data
The income data has not been previously analysed. The poverty estimates produced by the NBS are based on household consumption/expenditure rather than income. The Technical Report (page 48) gives the following explanation:
As in many other parts of SSA, consumption is considered a more reliable indicator of welfare than income. First, consumption is typically less fluctuating than income and gives a better and steadier picture of long-term welfare. Second, individuals feel more comfortable answering questions related to consumption than to income. Third, income measurement in countries with a large agricultural or informal sector is often highly inaccurate.
28 See pages 48-51 of the Technical Report for further detail.
29 See http://catalog.ihsn.org/index.php/catalog/4846/related_citations.

19
The Main Report (page 91) further states that:
In 2011-12 HBS, data for measuring poverty were collected based on households’ consumption expenditure. The reason behind was that it was easier for respondents to remember their consumption expenditure than income data. A further reason for choosing consumption expenditure data is that people tend to underreport their income. Another reason is sometimes the own production of goods and services may not be treated as an income to a person or a household as a unit of analysis. Likewise, consumption was more likely to be stable over time than income, whereby fluctuation depends on the seasonal pattern of earnings and also on unexpected economic shocks.
Although these comments relate more to a general weakness of income data than a specific criticism of the income data in the HBS 2011-12, care does need to be taken when using the income data.
4.2 Sources of data for updating and upweighting
Datasets of the type required for tax-benefit simulations are rarely produced on an annual basis, and in any case, there is usually a time-lag between data collection and release. In order to be able to model current tax and benefit rules (or any year between the year of data collection and the current year) it is usually necessary to uprate the income and expenditure data collected in surveys. The Consumer Price Index (CPI) or similar from the respective country is used to do this, and is available on the NBS website and released each month.
When analysing output from the microsimulation model, it is usually necessary to take into account demographic changes since the date the survey data were collected. There are population forecasts available up to 2025, based on the 2012 national population census.
5 Assessment of tax-benefit microsimulation feasibility
5.1 Feasibility of building a microsimulation model
The HBS 2011-12 has been identified as the best available dataset to underpin a tax-benefit microsimulation model in Tanzania. The HBS 2011-12 contains 10,186 households and 46,593 individuals. This survey was undertaken in mainland Tanzania (i.e. excluding Zanzibar) and so of necessity this would be the geographical focus of the model.
In order for the HBS 2011-12 to relate to a 2015 timepoint optimally, it is necessary to recast the survey weights using population estimates for 2015. The HBS 2011-12 income and expenditure data could be up-rated from 2010 to 2015 using the CPI.
Table 8 summarizes the feasibility of simulating each tax and benefit in Tanzania.
There are a number of additional caveats that should be signalled here. As mentioned in Section 4, the income data does not seem to have been analysed previously and the Technical Report raises concerns about its accuracy. There are a few other outstanding queries about the data, including the need to obtain clarification about whether the incomes and expenditures have been inflated/deflated to a particular timepoint. The extent to which the dataset yields plausible results has not been assessed by the team, though it is very encouraging that it has already been extensively worked on (with the exception of the income data) within and outside of

20
Government. Lastly, additional issues may only become apparent when the model is being constructed.
Table 8: Simulation feasibility of taxes and benefits in Tanzania
Tax-benefit policy Simulation feasibility Taxation
Personal income tax Yes for PAYE but not straightforward. Notes: So called ‘cash payments’ are captured in the HBS for first and second jobs, but it seems that these are net (not gross) amounts. Employees’ taxes are deducted from the salary by the employer. See Annex 2 for a list of taxable incomes and exemptions. Income tax for individual traders, small traders (presumptive tax), and medium traders cannot be simulated as the HBS does not capture annual turnover.
VAT Yes, to a certain extent Note: The HBS will not capture all VAT income sources. The VAT ACT 2014 describes items that are exempted from VAT and zero rated.
a
Excise Duty Yes, to a certain extent Note: The HBS will not capture all Excise Duty income sources. See Table 7 for the items with specific rates, and the ad-valorem rates.
Corporation Tax, Rental Tax, Stamp Duty, Withholding Tax, Skills Development Levy, Gaming tax, Capital Gains Tax, other domestic taxes, Import duty and other Import Charges, Tourism Development Levy, Airport Service Charges, Export Tax, Motor Vehicle related taxes, Fuel Levy and Petroleum Levy
No – not possible using the HBS
Social transfers Contributory benefits Mandatory schemes (see Table 8) Contributions to mandatory schemes may be able to be simulated,
though see notes in ‘Personal Income Tax’ above. However, income from such schemes cannot be simulated due to lack of data about the contribution history of the beneficiary.
Voluntary or Supplementary Schemes (see Table 9)
No – Lack of data about the contribution history of the beneficiary
Non-contributory benefits Tanzania Social Action Fund’s Productive Social Safety Net (PSSN) -Basic Cash Transfer and - variable Conditional Cash Transfer - (Public works programmes)
Only partly Note: The Basic Cash Transfer could be simulated if eligibility criteria can be implemented using HBS. However the eligibility criteria are open to interpretation and involve community targeting and so certain assumptions will need to be made in order to simulate the grant.
b
Non-contributory pension schemes e.g. Political Leaders Pension Scheme and the Senior State Leaders Pension Scheme
No – not possible to identify target groups with the HBS
Notes: a Special relief of 10 per cent was applied prior to the enactment of the VAT Act of 2014 but no longer
exists; b Correspondence from TASAF.
Source: Authors.

21
5.2 Long-term future of a microsimulation model
The long-term future of a microsimulation model in Tanzania depends upon the following things being in place:
Commitment to develop the model with in-country partners. This has been accomplished as academics at the University of Dar es Salaam are key partners.
A first draft of the model which demonstrably enables social security options to be explored by government and academia;
a transparent user guide;
an organization which issues user licences for the model, and liaises with users;
regular training events for new users;
an organization to co-ordinate updates of the policies, reweight the survey weights, inflate the income data etc each year, and add new datasets as they become available;
users having licences for STATA or another software package with which to analyse the output data.
References
Arndt, C., V. Leyaro, and K. Mahrt (2014). ‘Multi-dimensional poverty analysis for Tanzania: First order dominance approach with discrete indicators’. WIDER Working Paper 2014/146. Helsinki: UNU-WIDER.
Atkinson, A.B. (2009). ‘An enlarged role for tax-benefit models’ in O. Lelkes and H. Sutherland and (eds), Tax and Benefit Policies in the Enlarged Europe: Assessing the impact with microsimulation models. Vienna: Ashgate.
Isaka, I. (2015). ‘Social Protection in Tanzania: System, Adequacy and its Fiscal Implications’. PhD in Progress. Mimeo. University of Dar es Salaam.
Ministry of Labour, Youth Development and Sports (2003). ‘The National Social Security Policy, the United Republic of Tanzania’. Available at: http://www.tccia.com/tccia/wp-content/uploads/legal/policy/socialsecuritypolicy.pdf.
NBS (2014a). ‘Tanzania Household Budget Survey: Main Report 2011/12’. Dar es Salaam: Tanzania National Bureau of Statistics.
NBS (2014b). ‘Tanzania Household Budget Survey: Technical Report 2011/12’. Dar es Salaam: Tanzania National Bureau of Statistics.
Osoro, N.E. (1995). ‘Tax reforms in Tanzania: Motivations, directions and implications’. AERC Research Paper 38. Nairobi: African Economic Research Consortium.
Osoro, N.E. (2009). ‘Estimating taxable capacity in Tanzania’. Dar es Salaam: Eastern and Southern African Universities Research Programme (ESAURP).
Randall, S., and E. Coast (2015). ‘Poverty in African households: The limits of survey and census representations’. Journal of Development Studies, 51(2): 162-77.
Social Security Regulatory Authority (2014). ‘Annual Report 2012/2013’, Dar es Salaam: Ministry of Labour and Employment.

22
TASAF (2014). ‘Tanzania Social Action Fund Productive Social Safety Net Programme: Fourth Quarter Implementation Progress Report, April-June 2014’. Dar es Salaam: TASAF.
Tanzania Revenue Authority (TRA) (n.d.). ‘Taxation in Tanzania: The Tanzania investment and trade promotion’. Dar es Salaam: Tanzania Revenue Authority. Available at: http://www.sanec.org/themes/sanec/uploads/files/TANZANIA%20INVESTMENT%20AND%20TRADE%20PROMOTION%20final%20version.pdf.
Tanzania Revenue Authority (TRA) (2014). ‘Taxes and Duties at Glance – 2014/2015’. Dar es Salaam: Ministry of Finance.
Tungaraza, F. (2004). ‘Social Protection in SADC: Developing an integrated and inclusive framework – the case of Tanzania’. In M. Olivier and E. Kalula (eds)’, Social Protection in SADC: Developing and Integrated and Inclusive Framework. Johannesburg and Cape Town: CICLASS, RAU and IDLL, UCT.
United Republic of Tanzania (URT) (2002). ‘Tanzania Household Budget Survey 2001/02’. Dar es Salaam: National Bureau of Statistics (NBS).
United Republic of Tanzania (URT) (2006). ‘The Income Tax Act’. Dar es Salaam: Ministry of Finance.
United Republic of Tanzania (URT) (2008). ‘Tanzania Household Budget Survey 2007’. Dar es Salaam: National Bureau of Statistics (NBS).
United Republic of Tanzania (URT) (2014). ‘Tanzania Household Budget Survey 2011/12’. Dar es Salaam: National Bureau of Statistics (NBS).
Wilkinson, K. (2009). ‘Adapting EUROMOD for Use in a Developing Country - the Case of South Africa and SAMOD’. EUROMOD Working Paper EM5/09. Essex: Institute for Social and Economic Research, University of Essex.
Wright, G., H. Barnes, M. Mpike, and M. Noble (2015). ‘Tax-benefit microsimulation modelling in the Southern African Development Community and the East African Community: A brief scoping study’. Draft Report. Helsinki and Hove: UNU-WIDER and SASPRI.
Wright, G., M. Noble, and H. Barnes (2014). ‘NAMOD: a Namibian tax-benefit microsimulation model’. EUROMOD Working Paper EM7/14. Essex: Institute for Social and Economic Research, University of Essex.
23
Annex 1: The Tanzania Revenue Authority
The Tanzania Revenue Authority (TRA) was established in 1995 by Act of Parliament No.11. It was formed in order to bring the function of government revenue collection under one umbrella, imparting some degree of autonomy to the function with the expectation of increasing revenue collections, improving voluntary compliance, minimizing collection costs, widening the tax base and controlling evasion and fraud. Prior to the establishment of TRA, administration of tax revenue was highly compartmentalized. Actors in the revenue administration for customs and excise, income tax and sales tax were uncoordinated, each working independently and disjointedly. The first responsibility of the newly formed TRA was to institute a corporate culture, and establish co-ordination between revenue departments, which was lacking under the former set-up. Setting the relevant systems in place then followed. Thus, among others, the establishment of Tanzania Revenue Authority and the introduction of the VAT are the brainchildren of the Commission, under the auspices of the IMF and the World Bank proposed reforms.
On the basis of these reforms, TRA is now operationally organized in four revenue departments and seven support departments under the overall overseeing of the Commissioner General, assisted by Deputy Commissioner General. These are the Customs and Excise, Domestic Revenue, Large Taxpayers and Tax Investigations departments. The support departments are the Internal Audit, Taxpayer Services and Education, Research and Policy, Board Secretariat and Legal Services, Human Resources and Administration, Finance, and Information and Communication Technology. In addition to this there are two independent units under the Commissioner General’s Office, namely Planning and Modernization Projects Unit and the Internal Affairs Unit. Formulation of policy in the Authority is the remit of the TRA Board of Directors. As a result, revenue collection performance during the fifteen years of TRA’s existence has improved consistently. The performance trend manifests a consistent revenue growth, exponentially, from 1996/97 to 2010/11, as actual collection increased from Shs. 506,630 million in 1996/97 to Sh. 5,315.148 million in 2010/11. What is more, TRA has managed to surpass all odds after realizing a record level of revenue collection of Shs.604 billion in September 2011. At the same time, tax collection as a percentage of GDP by TRA during the fifteen years manifested an increasing trend, from around 8 per cent in 2000/01 to nearly 16 per cent in 2010/11.
Annex 2: Withholding Tax
Withholding tax is the amount of tax retained by one person when making payments to another person in respect of goods supplied or services rendered by the payee. A person receiving or entitled to receive a payment from which income tax is required to be withheld is a withholdee while a person required to withhold income tax from a payment made to a withholdee is referred to as the withholding agent.
Withholding tax applies to specific payments including those to be included in calculating the chargeable income of an employee from employment, payment of investment return including dividend, interest, natural resource payment, rent or royalty, service fee and contract payments and payment in respect of supply of goods to the government and its institutions.
The law has divided withholding taxes in to two major categories, namely (i) final withholding taxes, and (ii) non final withholding taxes. The difference between the two is that with a final withholding tax, the withholdee cannot claim any tax credit when calculating the income tax payable for a year of income. Tax credits for non-final withholding taxes are an amount equal to

24
the tax treated as paid for the year of income in which the amount is derived. Witholding tax rates are shown in Table A2.1.
Table A2.1: Withholding tax rates
Description of payment Rate for resident (%)
Rate for non- resident (%)
(i) Dividends from the Dar es Salaam Stock Exchange listed corporations (ii) Dividends from resident corporation to another resident corporation where the corporation receiving the dividend holds 25% or more of the shares in the corporation
5 5
5 NA
Dividends from other corporations 10 10
Interest 10 10
Royalties 15 15
Other withholding payments from investment returns. 15 15
Rental income 10 15
Technical services fees (mining) 5 15
Transport (non-resident operator/ charterer without permanent establishment)
N/A 5
Insurance premium 0 5
Natural resources payment 15 15
Service fees 5 15
Directors fee (non-full time directors) 15 15
Commission to agents by service providers on money transfer through mobile phones
10 10
Payments for goods supplied to Government and its institutions by any person.
2% of gross payment
N/A
Other withholding payments 15 15
Source: TRA (2014).
When a person is employed in more than one employment position then employment positions selected by an employee to be regarded as not the main source of income are called secondary employments. All employers are supposed to withhold income tax but secondary employers are required to withhold in a different manner from primary employers.
Responsibility of an employee with secondary employment:30 i. To select, among employment positions, which one will be a primary employment and
which a secondary employment. ii. To timely notify a primary employer and secondary employers.
Responsibility of the employer:
i. To withhold tax at the highest rate of the individual income tax rates applicable. ii. Enquire of all employees, at a minimum of six-month period intervals, whether the
employment is a secondary employment or not.
In general, High Commissions, Embassies and Diplomatic missions are not obliged to pay any tax, as covered under The Diplomatic and Consular Immunities and Privileges Act. In this regard, those bodies are not bound to operate PAYE schemes, although some opt to operate in order to keep their records properly and help their employees avoid wasting time in complying with their tax affairs so as to enable them to concentrate with their duties. If a local employee is
30 If withholding at the highest personal income tax rate will cause hardship to the employee he may apply to the Commissioner to allow a lower rate at which the secondary employer must withhold tax.
25
employed in these institutions and the institutions opt not to operate PAYE system, he is obliged to do the following:
i. Register as a taxpayer by acquiring Taxpayer Identification Number (TIN). ii. File a statement of estimated income at the beginning of the year based on monthly
income. iii. File final returns.
Some categories of employees have special treatment:
a) Non-residents: For non-resident employees (e.g. temporary employees from abroad) tax is withheld at a flat rate of 15 per cent of the gross income from employment. This is effectively a final withholding and the amount withheld satisfies the employee’s income tax liability with respect to the employment.
b) Directors other than full time service directors: Tax is withheld at a rate of 15 per cent of fees paid to directors other than full time service directors. The tax payable is non-final withholding tax.
Annex 3: Income from employment
Calculation of income from employment
The following gains or profits are included in the calculation of taxable income from employment31:
i. payments of wages or salary, payment in lieu of leave, fees, commissions, bonuses, gratuity or any subsistence, travelling, entertainment or other allowance received in respect of employment or service rendered;
ii. payments providing any discharge or reimbursement of expenditure incurred by the individual or an associate of the individual;
iii. payments for the individual's agreement to any conditions of the employment; iv. retirement contributions and retirement payments (see below); v. payment for redundancy or loss or termination of employment (see below); vi. other payment made in respect of employment including benefits in kind quantified in
accordance with the prescribed rules (see below); vii. other amounts as may be required to be included; and viii. annual director’s fees payable to a director other than a full time service director.
The following gains or profits are excluded from the calculation of income from employment:
i) exempt amounts and final withholding payments;
ii) on premises cafeteria services that are available on a non-discriminatory basis;
iii) medical services, payment for medical services, and payments for insurance for medical
services to the extent that the services or payments are –
a. available with respect to medical treatment of the individual, spouse of the
individual and up to four of their children; and
31 See http://www.mof.go.tz/mofdocs/revenue/Income%20Tax%20Act.pdf

26
b. made available by the employer (and any associate of the employer conducting a
similar or related business) on a non-discriminatory basis;
iv) any subsistence, travelling, entertainment or other allowance that represents solely the
reimbursement to the recipient of any amount expended by him wholly and exclusively
in the production of his income from his employment or services rendered;
v) benefits derived from the use of motor vehicle where the employer does not claim any
deduction or relief in relation to the ownership, maintenance or operation of the vehicle;
vi) benefit derived from the use of residential premises by an employee of the Government
or any institution whose budget is fully or substantially out of Government budget
subvention;
vii) payment providing passage of the individual, spouse of the individual and up to four of
their children to or from a place of employment which correspond to the actual
travelling cost where the individual is domiciled more than 20 miles from the place of
employment and is recruited or engaged for employment solely in the service of the
employer at the place of employment;
viii) retirement contributions and retirement payments exempted under the Public Service
Retirement Benefits Act;
ix) payment that it is unreasonable or administratively impracticable for the employer to
account for or to allocate to their recipients;
x) allowance payable to an employee who offers intramural private services to patients in a
public hospital; and
xi) housing allowance, transport allowance, responsibility allowance, extra duty allowance,
overtime allowance, hardship allowance and honoraria payable to an employee of the
Government or an institution the budget of which is fully or substantially paid out of
Government budget subvention.
Lump-sum payments and retirement fund contributions
Lump-sum payments to employees may take the form of gratuities, leave pay, compensations, bonus, commissions, etc., which may cover several months of the year or the whole of a year. Lump-sum payments other than terminal payments are included in the year of payment and are taxed on the basis of the adjusted monthly pay for the year.
Terminal lump-sum payments which include redundancy and other payments for loss or termination of office are spread over a period of six years or actual years of employment and are taxed as income for these years.
The amounts of contributions made by employee/employer to the approved retirement funds are deducted from the gross pay when calculating the PAYE. The amount of this reduction is equal to the lower of:
i) The total of the employee or employer contributions where it is included in calculating the monthly pay made to approved retirement funds; and
ii) The statutory amount of the fund.
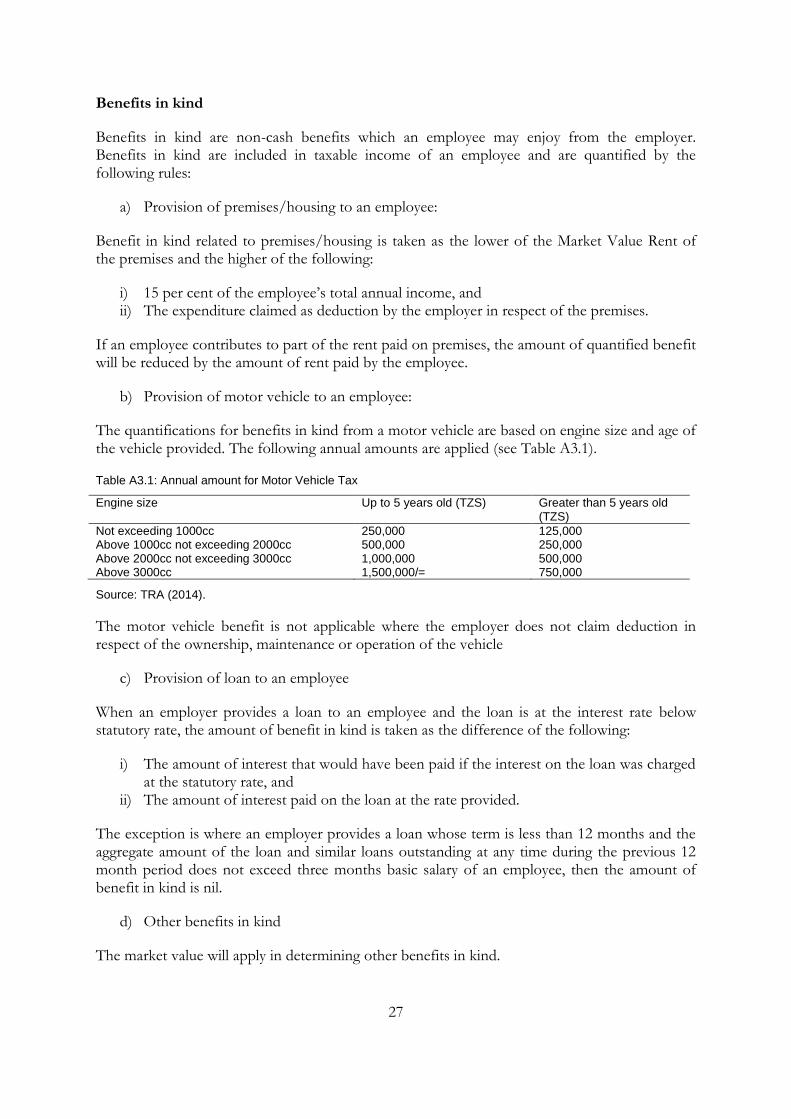
27
Benefits in kind
Benefits in kind are non-cash benefits which an employee may enjoy from the employer. Benefits in kind are included in taxable income of an employee and are quantified by the following rules:
a) Provision of premises/housing to an employee:
Benefit in kind related to premises/housing is taken as the lower of the Market Value Rent of the premises and the higher of the following:
i) 15 per cent of the employee’s total annual income, and ii) The expenditure claimed as deduction by the employer in respect of the premises.
If an employee contributes to part of the rent paid on premises, the amount of quantified benefit will be reduced by the amount of rent paid by the employee.
b) Provision of motor vehicle to an employee:
The quantifications for benefits in kind from a motor vehicle are based on engine size and age of the vehicle provided. The following annual amounts are applied (see Table A3.1).
Table A3.1: Annual amount for Motor Vehicle Tax
Engine size Up to 5 years old (TZS) Greater than 5 years old (TZS)
Not exceeding 1000cc 250,000 125,000 Above 1000cc not exceeding 2000cc 500,000 250,000 Above 2000cc not exceeding 3000cc 1,000,000 500,000 Above 3000cc 1,500,000/= 750,000
Source: TRA (2014).
The motor vehicle benefit is not applicable where the employer does not claim deduction in respect of the ownership, maintenance or operation of the vehicle
c) Provision of loan to an employee
When an employer provides a loan to an employee and the loan is at the interest rate below statutory rate, the amount of benefit in kind is taken as the difference of the following:
i) The amount of interest that would have been paid if the interest on the loan was charged at the statutory rate, and
ii) The amount of interest paid on the loan at the rate provided.
The exception is where an employer provides a loan whose term is less than 12 months and the aggregate amount of the loan and similar loans outstanding at any time during the previous 12 month period does not exceed three months basic salary of an employee, then the amount of benefit in kind is nil.
d) Other benefits in kind
The market value will apply in determining other benefits in kind.
28
Annex 4: Capital Gains Tax
The Income Tax Act requires a person who derives a gain from the realisation of interest in land or buildings situated in the United Republic of Tanzania to pay income tax by way of single instalment.32 This is the amount of tax paid before the titles are transferred from one person to another. The rates are 10 per cent of the gain for a resident person and 20 per cent for a non-resident person.
However, the Income Tax Act provides that an instalment payer shall be entitled to tax credit for a year of income of an amount equal to the income tax paid by way of single instalment for the year of income. Exemptions apply in the following cases:
i) If the residence has been owned continuously by the individual for three years or more and lived in by the individual continuously or intermittently for a total of three years or more, and the interest was realized for a gain of not more than TZS 15,000,000.
ii) An interest in land held by an individual that has market value of less than TZS 10,000,000 at the time it is realized and has been used for agricultural purposes for at least two of the three years prior to realisation.
Capital gains tax is calculated as follows:
Value of consideration received or accruing as a result of the realisation of the interest in land or buildings less cost of acquisition less expenditure incurred on any improvement to the asset less
expenditure incurred wholly and exclusively in connection with the realisation. Realization expenditure is expenditure incurred wholly and exclusively in connection with the realisation of interest in land and building, such as stamp duty, registration charges, legal fees and brokerage.
Capital gains tax on realization (sale) of securities
A security is a tradable financial asset (investment assets) of any kind. Securities are broadly categorized into:
i) Equity securities (e.g. ordinary and preference shares ) ii) Debt securities (e.g. bonds and debentures) iii) Derivative securities (e.g. forwards, futures, options and swaps).
The net gains on sale of securities are treated as investment income to be included in determining the total income of the person during the year of income as provided by the Income Tax Act, 2004.
Gains from the sale of securities are the excess of market value over the cost of the asset. The net gain from the sale of securities is the sum of all gains from the sale of securities reduced by:
i) Total of all losses from sale of investment assets; ii) Any unrelieved losses during the year; and iii) Any unrelieved losses for the previous year.
The cost of the security is the sum of expenditure incurred in acquiring the asset.
32 See http://www.tra.go.tz/index.php/capital-gains-tax.
29
Exempted securities are the shares listed on the Dar es Salaam Stock Exchange provided that the shares are owned by a resident or a non-resident person who controls less than 25 per cent of the controlling shares of the company.
Annex 5: Brief history of social security in Tanzania
Social security33 funds in Tanzania started during the British colonial rule. The Government Employees Provident Fund (GEPF) was established in 1942 followed by the Local Authority Provident Fund (LAPF) in 1944. Both of these funds were not meant to serve the general public (the local Africans), rather they were meant to cater for the needs of a few white workers in the colonial government (and therefore the coverage was very small). Three years after independence, in 1964, the government established the National Provident Fund (NPF) for its workers. The NPF plus the two inherited funds from colonial rule were provident funds. In an effort to improve workers benefits, in 1978 the Government passed the law that established the Parastatal Pension Fund (PPF). In 1986, the Government established the Specified Leaders Retirement Benefits scheme (non- contributory). In 1998, the Government took more steps by transforming the NPF into a pension fund, the National Social Security Fund (NSSF). The following year the Government established two more funds: the government employment Pension Fund (PSPF) and the National Health Insurance Fund (NHIF), and in 2001 the Community Health Funds (CHFs) were established. In 2006 the Government transformed the inherited LAPF into the Local Authority Pension Fund (LAPF). In 2013 the GEPF was also converted from a Provident Fund to a Pension Fund. All these measures were taken to improve the performance of the social security sector in the country and to protect the members’ benefits, interests and rights in these funds. Despite the existence of this framework, service delivery has not reached the majority of Tanzanians due to inadequate financing and fragmented institutional arrangements.
When most of these social security funds were formed they were not meant to serve and cater for the interests of all Tanzanians. However, following the expansion of, and need for more, social security protection in the country, the government saw the need for formulating the National Social Security Policy that aimed at bringing together the efforts of all stakeholders. Furthermore, it was deemed important to have laws, rules and principles for protecting members’ benefits, interests and rights in these funds. As a result, in 2003 Tanzania was the first country in the East Africa region to have a National Social Security Policy which aimed at expanding the coverage of social security protection to all Tanzanians including famers, livestock keepers, fisher men, bee keepers, public sector workers, private sector workers, those in informal and entrepreneurship sectors as well as the old and aged people. Today the slogan of the current policy is ‘social security protection for all’.
In the process of implementing the National Social Security Policy of 2003, it was found that the sector was facing a number of challenges ranging from: little awareness among the public of social security protection and issues; the very small percentage of Tanzanians covered by these funds; fragmentation of calculation of pension benefits; overlaps and interactions of laws, rules and principles guiding these funds; high costs of running these funds given the level of contributions; low, poor and delay payments of benefits to the members of these funds; and lack of mechanisms to transform members’ pension into collateral. As the result of all these
33 Elsewhere in this working paper these policies are referred to as social insurance schemes.
30
challenges, the future, sustainability and stability of the social security sector in the country were in jeopardy and there was a need for an institution aimed at coordinating and overseeing the social security sector in the country. Consequently, in September 2010 the government established the Social Security Regulatory Authority (SSRA).
Annex 6: Pension schemes qualifying conditions and benefit calculation
Pensionable age means fifty five years or the specific age declares by law or relevant employment authorities to be a qualification for retirement at liberty of employee or employer for voluntary retirement or mandatory retirement specifies by law. Replacement rate means the relationship between amount payable as pension and the amount of reference earnings which a member was enjoying during his working life.
Qualifying Condition—the qualifying period for a member to receive pension benefits shall be q5 years of contributing provided that the member:
i) Has met the conditions set on the enabling legislations of the respective scheme, and ii) Has attained the retirement age
Retirement Age—the age of voluntary retirement shall be fifty five years (‘Early retirement’ means retirement after reaching pensionable age and before attaining compulsory retirement age). A member who attains the age of fifty five years may at any time thereafter opt to retire but if does not so opt he shall continue to be member until he attains the age of sixty years. Members whose statutory terms of employment prescribe a shorter age of retirement contrary to the requirements of sub rule (2) shall retire in accordance with prescribes terms.
Pension Formula—Pension benefits shall be calculated as follows:
i) Commuted pension: (1/580 x Number of months contributes x Annual Pensionable Emoluments) x 12.5 x 25%. (by ‘Commutation’ we mean a process of converting part of pension amount payable in the future income stream to present value terms to be paid to a pensioner as lumpsum).
ii) Monthly pension (1/580 x Number of months contributes x Annual Pensionable Emoluments) x 75 x 1/12.
iii) Special lump sum at retirement age: means an amount equal to the sum of monthly contributions paid to the mandatory defined benefits scheme plus an interest determine y the Board of Trustee of the respective scheme.
Application of commutation—the new formula shall be applicable to:
i) Any new member whose first contribution to Mandatory Defined benefit scheme is received on or after the date of commencement of these rules.
ii) The existing members of the NSSF Fund, PPPF Pensions Fund and GEPF Retirement Benefits Fund and
iii) All retirees of the Schemes specified in sub rule 8 (1) (b) who retired on or after the 1st day of July 204.
The provisions prescribed in sub-rule 8 (1) shall not apply to the existing members of LAPF Pensions Fund and Public service Fund up to 30th June 2014. New members joining LAPF Pensions Fund and Public Service Pensions Fund on after the date of commencement of these

31
rules shall be entitled to pension benefits rights in accordance with sub rule 8 9 ) (a). Separate accounts shall be established for new members joining LAPF Pension LAPF Pensions Fund and Public Services Pensions Fund on or after the commencement date of these rules.
Benefit Factor—the social security benefits factors to be used in the formula shall be as follows:
i) The annual accrual factor shall be 2.07 per cent or 1/580 per month. ii) The commutation factor shall be 12.5. iii) The commutation rate shall be 25 per cent of the annual full amount of the pension.
Annual Pensionable Emolument—annual pensionable emoluments for purpose of calculating pension shall base on the average three years highest salaries which a member received during the last ten years preceding his retirement.
Minimum Pension—notwithstanding the provision of pension formula, the minimum monthly retirement pension payable to a member received during the last ten years preceding his retirement.
Pension Benefit Indexation—all Defined Benefit Mandatory Schemes applying the new pension benefits formula in calculating pension benefits for members may adjust benefits from time to time after conducting actuarial valuation.
Reduction Factor—a reduction factor of 0.3 per cent per month shall be applied for members who opt for early retirement.
Short-term benefits shall continue to be offered by Defined Benefits Mandatory Schemes as prescribed in the respective enabling legislation. Any new short-term benefits to be offered by any scheme shall be prescribed in accordance section 25 of the SSRA Act. The authority may impose Compliance Order in addition to monetary penalties on the scheme in accordance with the Act.