william armand mala - asb parthership for the tropical ... wa .pdfknowledge systems and adaptive...
TRANSCRIPT

Knowledge Systems and Adaptive Collaborative Management of Natural Resources in southern
Cameroon:
Decision Analysis of Agrobiodiversity for Forest-Agriculture Innovations
by
William Armand Mala
Dissertation presented for the degree of Doctor of Philosophy (Forest Science)
at
Stellenbosch University Department of Forest and Wood Sciences, Faculty of AgriSciences
Promoter: Prof. Coert Johannes Geldenhuys Co-promoter: Dr. Ravindhra Prabhu
December 2009
ii
DECLARATION By submitting this dissertation electronically, I declare that the entirety of the work contained therein is my own, original work, that I am the owner of the copyright thereof (unless to the extent explicitly otherwise stated) and that I have not previously in its entirety or in part submitted it for obtaining any qualification. Date: 24/11/2009
Copyright © 2009 Stellenbosch University
All rights reserved
iii
ACKNOWLEDGEMENTS
Many people and institutions have in some way contributed to this study and production of this thesis for which I am grateful. My first gratitude goes to my promoters, Prof. Coert Johannes Geldenhuys and Dr. Ravindra Prabhu for the lay out of the research for their professional vision and guidance. Without their patience this study would never have been possible. I am also grateful to Dr. Diaw Chimère from his comments and suggestions in my work from the beginning and within the ACM team where I got the inspiration for this work. My sincere thanks go to Dr. Nasi Robert who made the review of the earlier version and his comments were very useful. Special thanks to go to European Union via the Project Makoukou/CIFOR, French cooperation with the project FORINFO, START/The Norwegian Agency for Development (NORAD) for providing funds for the study. Special thanks also go to CIFOR via the Adaptive Collaborative Management of Tropical Forests Project in which I was involved and through which I got the inspiration and the scientific background for supporting my first trip to Stellenbosch University. Thanks to Samuel Assembe, Rene Oyono, Cyprian Jum, Joachim Nguiebouri, Anne Marie Tiani and Ebene Yvette my former colleagues of CIFOR for their encouragements and for the good that who have worked together within the ACM team. My special thanks to Dr. Robiglio Valentina and Dr. Ngobo Martine, my friends of IITA with whom I was invovlved in the ASB programme. I am indebted to my friend and brother of FORCE’farmers organization especially Jean Mbarga for his advices and encouragements. I am also indebted to my field assistants Martin Biyong, Mekoa Cyrille, Frieda Zoa, Christiane Valery Ela, who ably participated in data collection. I also owe thanks to Tabi, Fomo, Nga Ebode, Ze Adolphe of the IITA pilot research sites for the support and their contribution to field work. My deepest thanks go to my wife Agnès Carine and children Flore, Chloe, Arthur and Joyce for steady love, patience, sacrifice and my wife for her understanding, braving the lonely nights and taking care of the family while I was away for the study. I’m also greatful for the support of my parents Mrs Sara Ekosso, Olango Thomas and Olango Léocadie, and to my brothers and sisters Georgette Alima for her prayer and moral support. I owe great thanks to the Almigty God from whom wisdom and strength to do this work come. Thine be the Glory.
iv
DEDICATION To my late father Alega Gaspard Legrand. To my mother Alega Régine, she always wondered when I would ever finish being a student. To my wife Mala Agnès Carine. To those who are dealing with uncertainty every day.
v
ABSTRACT This study aimed to analyze under which conditions the structure, organization and integration of knowledge systems can provide the implementation of adaptive collaborative management of natural resources under conditions of high biodiversity in the humid forest zone of southern Cameroon. The study specifically did the following: characterized sustainable slash-and-burn agriculture innovations; examined the influences of local perceptions of nature and forest knowledge management systems on adaptive slash-and-burn agriculture practices; analyzed the influences of the social representation of land use patterns and their local indicators on agro-ecological sustainability; characterised the biophysical dimensions of local management of agricultural biodiversity knowledge systems; analyzed how local agricultural biodiversity knowledge is used to adapt and to satisfy household consumption needs, market preferences, and sustainable livelihoods; examined the influences of local perceptions of climate variability for the ability and adaptive capacity of people to use local knowledge to deal with the effect of pests-diseases on crop yield, corrective management actions, and adaptive slash-and-burn agriculture management. The study was conducted in three blocks within the humid forest zone of southern Cameroon along a gradient of natural resource use management intensification and population density. Data were collected via structured and semi-structured interviews, multi-disciplinary landscape assessment and a review of secondary information. Chi-square tests were used to show how local knowledge influences - natural resource management at the forest-agriculture interface, while binary logistic regressions were used to understand the influences of biophysical and socio-economic factors on farmers’ decisions to domesticate tree species and to cultivate several crop cultivars. Fourteen research and development (R&D) themes were identified and found to be equally distributed among blocks but unequally distributed across technical, marketing and socio-organisational types of innovation. There was a gap between social demand and innovation offer. Innovations offered covered more technical issues, such as crop variety development, indicating their agricultural focus rather than the integration of forest and agriculture issues. The local perceptions of nature and forest resources are based on social representation of the vital space into components having a specific function for the social, physical and spiritual life of people. Needs of the human world determine the role of local forest knowledge systems in the interpretation and responses of the natural environment, and guide the trajectories of natural resource management practices. The management of agro-ecological sustainability is based on the local definition of well-being, social representation of space and on a multi-criteria approach combining bio-indicators such as plants, earthworm activities, age of vegetation or forest cover, soil colour and quality but it is also positively influenced by land use history, the use value of wild plant and crop species, the knowledge of crop qualities, the knowledge of interactions between crops, and between crops and other wild plant species, the tree size of tree species used, the future use of a current land use, the estimated land use for own use and market access. There is a positive impact of slash-and-burn agriculture practices on the establishment of forest species with a potential for regeneration and
vi
forest recovery, and this affects the composition and structure of forest landscape mosaics. Strong evidence emerges from this work in terms of the determinants of sustainable traditional land use management to suggest that both the practices and land use systems have something to offer to the conventional thinking and agroforestry innovation processes in terms of high returns to labour input, biomass management, species enrichment, inter-dependence of agroforestry options and the issue of regulating community property rights, land use sustainability and biodiversity conservation. There is a need for short and medium-term studies to fully analyze what are the options for and values of collaborative forest-agriculture management.

vii
OPSOMMING Die doel van hierdie studie was om te bepaal onder watter omstandighede die struktuur, organisasie en integrasie van kennissisteme kan bydra tot die implementering van aanpasbare deelnemende bestuur van natuurlike hulpbronne onder toestande van hoë biodiversiteit in die vogtige woudsone van suidelike Kameroen. Die studie het spesifiek die volgende gedoen: volhoubare kap-en-brand landboukundige ontwikkelinge gekarakteriseer; die invloede van plaaslike persepsies van die natuur en woudkennis-gebaseerde bestuursisteme op aanpasbare kap-en-brand landboupraktyke ge-evalueer; die invloede van die sosiale verteenwoordiging van grondgebruikspatrone en hul plaaslike indikatore op agro-ekologiese volhoubaarheid ontleed; die biofisiese dimensies van die plaaslike bestuur van landboukundige biodiversiteitskennissisteme gekarakteriseer; ge-analiseer hoe die plaaslike landboukundige biodiversiteitskennis gebruik word om aan te pas by en bevrediging te verkry vir huishoudelike gebruiksbehoeftes, marksvoorkeure en volhoubare bestaansbehoeftes; die invloede en gebruik van plaaslike kennis en persepsies van klimaatsvariasie beoordeel in die vermoë en aanpassingskapasiteit van mense om die effekte van siektes-peste op gewasproduksie, regstellende aksies en aanpasbare kap-en-brand landboubestuur te hanteer. Die studie is uitgevoer in drie blokke binne die vogtige woudsone van suidelike Kameroen langs ‘n gradient van natuurlike hulpbrongebruiksbestuursintensiteit en populasiedigtheid. Data is versamel deur gestruktureerde en semi-gestruktureerde onderhoude, multi-dissiplinere landskapsevaluering en ‘n oorsig van sekondere inligting. Chi-kwadraat toetse is gebruik om te wys hoe plaaslike kennis die bestuur van die woud-landbou konneksie beinvloed asook binêre logistiese regressies om die invloede te verstaan van biofisiese en sosio-ekonomiese faktore op die boere se besluite om boomsoorte te domestikeer en om verskeie gewaskultivars te kweek. Veertien temas in navorsing en ontwikkeling (N&O) was gelyk versprei tussen die blokke en ongelyk versprei tussen tegniese, bemarking en sosio-organisatoriese tipes innovering. Daar was ‘n gaping tussen sosiale aanvraag en innoveringsaanbieding. Innoverings het meer tegniese aspekte gedek, soos ontwikkeling van ‘n verskeidenheid gewasse, wat wys op ‘n landboukundige fokus eerder as ‘n integrasie van woud en landboukundige aspekte. Die plaaslike persepsies van die natuur en woudhulpbronne was gebaseer op sosiale verteenwoordiging van lewensbelangrike ruimte in komponente met ‘n spesifieke funksie vir die sosiale, fisiese en geestelike lewe van die mense. Behoeftes van die menslike wereld bepaal die rol van plaaslike woudkennissisteme in die interpretasie van en reaksie op die natuurlike omgewing, en rig die gebruik van hulpbronbestuurspraktyke. Die bestuur van agro-ekologiese volhoubaarheid is gebaseer op die plaaslike definisie van geluk, sosiale verteenwoordiging van ruimte en op ‘n multi-kriteria benadering wat bio-indikatore kombineer soos plante, erdwurmaktiwiteite, ouderdom van plantegroei- of woudbedekking, grondkleur- en kwaliteit, maar is ook positief beinvloed deur grondgebruiksgeskiedenis, die gebruikswaarde van natuurlike en gewassoorte, die kennis van gewaskwaliteite, die kennis van die interaksie tussen gewasse en tussen gewasse en natuurlike plantsoorte, die boomgrootte van boomsoorte wat gebruik word, die toekomstige gebruik van ‘n huidige grondgebruik, die beraamde

viii
grondgebruik vir eie gebruik en vir toegang tot die markte. Daar is ‘n positiewe impak van kap-en-brand landboukundige praktyke op die vestiging van woudsoorte met ‘n potensaal vir verjonging en woudherstel, en dit beinvloed die floristiese samestelling en struktuur van mosaieke in die woudlandskap. Sterk bewyse kom na vore in hierdie studie in terme van bepalende faktore van volhoubare tradisionele grondgebruiksbestuur om aan te dui dat beide die praktyke en grondgebruiksisteme het ‘n bydrae te maak tot die konvensionele denke en agrobosbou innoveringsprosesse in terme van groot voordele op arbeidsinsette, biomassabestuur, speciesverryking, interafhanklikheid van agrobosbou opsies en die regulering van gemeenskapseiendomsregte, volhoubaarheid van grondgebruik en biodiversiteitsbewaring. Daar is ‘n behoefte aan kort- en mediumtermyn studies om volledig te analiseer wat die opsies vir en waardes van deelnemende woud-landboubestuur is.

ix
TABLE OF CONTENTS DECLARATION.............................................................................................................. II
ACKNOWLEDGEMENTS ........................................................................................... III
DEDICATION................................................................................................................. IV
ABSTRACT ...................................................................................................................... V
OPSOMMING............................................................................................................... VII
LIST OF FIGURES ..................................................................................................... XVI
LIST OF TABLES ..................................................................................................... XVII
GLOSSARY ................................................................................................................... XX
LIST OF ACRONYMS ............................................................................................ XXIII
CHAPTER ONE : GENERAL INTRODUCTION ....................................................... 1
1.1 BACKGROUND ...................................................................................................... 1 1.2 PROBLEM STATEMENT: SUSTAINABLE FOREST-AGRICULTURE MANAGEMENT INNOVATIONS .............................................................................. 3 1.3 CONCEPTUAL FRAMEWORK OF THE STUDY ................................................. 8 1.4 OBJECTIVES OF THE STUDY, RESEARCH QUESTIONS AND HYPOTHESES ............................................................................................................. 10 1.5 IMPORTANCE OF THE STUDY ....................................................................... 14 1.6 STRUCTURE OF THE THESIS ............................................................................ 15 1.6 REFERENCES ....................................................................................................... 15
CHAPTER TWO : FOREST AGRICULTURE INNOVATIONS: KNOWLEDGE BASE AND FIELD PROCESSES ................................................................................. 22
2.1 INTRODUCTION .................................................................................................. 22 2.2 METHODS ............................................................................................................. 24
2.2.1 Description of study area ................................................................................. 24 2.2.2 Sampling methods ............................................................................................ 26 2.2.3 Data collection ................................................................................................. 27 2.2.4 Data analysis .................................................................................................... 30
2.3 RESULTS ............................................................................................................... 30 2.3.1 Socio-economic characteristics of study area and household’ respondents .... 30
2.3.1.1 Distance from study area to closest and important markets ..................... 30 2.3.1.3 Socio-economic profile of household ‘respondents .................................. 31
2.3.2 R&D themes associated with forest-agriculture innovations ........................... 32 2.3.2.1 R&D themes of forest agriculture innovations within the blocks............. 32 2.3.2.2 R&D themes coverage by orientation of innovations ............................... 33
2.3.3 R&D institutions, field processes, social learning and institutions of knowledge in developing forest-agriculture innovations ............................................................ 34
2.3.3.1 Institutions and field approaches in developing forest-agriculture innovations ............................................................................................................ 34
x
2.3.3.2 Field approaches and scale of intervention in forest-agriculture innovation processes ............................................................................................................... 34
2.3.4 Assessment of adaptive collaborative management framework associated with forest-agriculture processes ...................................................................................... 34 2.3.5 Deployment of R&D innovations: introduction, abandonment and improvement ............................................................................................................. 35 2.3.6 Social demand of improvements within the humid forest blocks .................... 36
2.4 DISCUSSION ......................................................................................................... 37 2.4.1 Structure and organizations of R&D themes per block and type of innovations................................................................................................................................... 37 2.4.2 Stakeholders and field processes in forest-agriculture innovations ................. 38 2.4.3 Outcomes of field processes, forest-agriculture innovation development and collaborative management ........................................................................................ 40 2.4.4 Social demand of improvements, forest-agriculture innovations and adaptive co-management ......................................................................................................... 41
2.5 CONCLUSIONS..................................................................................................... 43 2.6 REFERENCES ........................................................................................................ 43
CHAPTER THREE : LOCAL PERCEPTIONS OF NATURE AND FOREST KNOWLEDGE MANAGEMENT ................................................................................ 50
3.1. INTRODUCTION ................................................................................................. 50 Background: Perception of nature and evolution of land tenure systems in the study area ............................................................................................................................ 51
3.2 METHODS ............................................................................................................. 52 3.2.1 Description of study area ................................................................................. 52 3.2.2 Sampling methods ............................................................................................ 53 3.2.3 Data collection ................................................................................................. 55 3.2.4 Data analysis .................................................................................................... 56
3.3 RESULTS ............................................................................................................... 56 3.3.1 Description of the vital space of the people of study area ............................... 56 3.3.2 Characterization of the relationships between the components of vital space of the people of study area ............................................................................................ 56 3.3.2 Local perceptions of forests and natural resources management..................... 57 3.3.3 Local knowledge systems of forest dynamics and associated NRM practices 59 3.3.4 Local agro-climatic and time management knowledge systems affecting NRM practices .................................................................................................................... 59
3.4 DISCUSSION ......................................................................................................... 60 3.4.1 Concept of nature based on the social representation of the vital space of the people of study area .................................................................................................. 60 3.4.2 Characterization of the relationships between the components of vital space of the study area ............................................................................................................ 61 3.4.3 Local perceptions of forests and natural resources management..................... 62 3.4.4 Local knowledge systems of forest dynamics and forest management ........... 62 3.4.5 Local agro-climatic and time management knowledge systems affecting NRM practices .................................................................................................................... 63
3.5 CONCLUDING REMARKS .................................................................................. 64 3.6 REFERENCES ........................................................................................................ 64
xi
CHAPTER FOUR : LAND USE PATTERNS AND LOCAL INDICATORS OF FOREST-AGRICULTURE SUSTAINABILITY ........................................................ 70
4.1 INTRODUCTION................................................................................................... 70 4.2 METHODS ............................................................................................................. 72
4.2.1 Description of study area ................................................................................. 72 4.2.2 Sampling methods ............................................................................................ 72 4.2.3 Data collection ................................................................................................. 74 4.2.4 Data analysis .................................................................................................... 74
4.3 RESULTS ............................................................................................................... 74 4.3.1 Land use patterns and indicators of human modified landscapes: the toponyms................................................................................................................................... 74 4.3.2 Local classification of soil and perception of its fertility ................................ 75 4.3.3 Land uses patterns and recurrence of soil fertility indicators for the selection of agroforestry land uses ............................................................................................... 76 4.3.4 Local systems of classification of soils and types of appropriate agricultural land uses .................................................................................................................... 76
4.4 DISCUSSION ......................................................................................................... 78 4.4.1 Land use patterns and indicators of human modified landscapes: the toponyms................................................................................................................................... 78 4.4.2 Local classification of soils and soil fertility indicators .................................. 78 4.4.3 Local classification of soil systems and types of appropriate agricultural land use ............................................................................................................................. 79
4.5 CONCLUSIONS..................................................................................................... 80 4.6 REFERENCES ....................................................................................................... 81
CHAPTER FIVE : BIOPHYSICAL CHARACTERIZATION OF LOCAL MANAGEMENT OF AGRICULTURAL BIODIVERSITY KNOWLEDGE ......... 86
5.1 INTRODUCTION................................................................................................... 86 Conceptual Framework: Evolution of thinking about agricultural biodiversity ....... 88
5.2 METHODS ............................................................................................................. 90 5.2.1 Description of study area ................................................................................. 90 5.2.2 Sampling methods ............................................................................................ 91 5.2.3 Data collection ................................................................................................. 92 5.2.4 Data analysis .................................................................................................... 93
5.3 RESULTS ............................................................................................................... 93 5.3.1 Biophysical characterization of agroforestry land uses ................................... 93
5.3.1.1.a Perception of distance from habitation to agroforestry fields based on time ....................................................................................................................... 93 5.3.1.1.b Relationships between perception of distance to farm and decision to keep trees .............................................................................................................. 94 5.3.1.1.c Relationship between plant size category and decision to maintain trees in a Cucumeropsis field ........................................................................................ 94 5.3.1.2 History of agroforestry land uses surveyed .............................................. 95
5.3.1.2.a Land uses immediately prior to current agroforestry land use ........... 95 5.3.1.2.b Stage of vegetation/forest on field prior to clearing for agricultural activities ............................................................................................................ 96
xii
5.3.2 Abundance of tree species found in selected land uses based on stems ≤2 m height to stems with DBH >100 cm .......................................................................... 96
5.3.2.2 Abundance of tree species in Cucumeropsis agroforests .......................... 96 5.3.2.2 Abundance of tree species in cocoa agroforests ....................................... 97 5.3.2.3 Abundance of tree species in young preforest fallows ........................... 100 5.3.2.4 Abundance of tree species in young secondary forests .......................... 102
5.3.3 Characterization of food crop varieties and associated plant species within mixed food-crop agroforest systems ....................................................................... 104
5.3.3.1 Distribution of agricultural biodiversity in mixed food-crop agroforests104 5.3.3.1.a Number of crop species and their mean number of cultivars per species ............................................................................................................. 104 5.3.4.1.b Stem density per ha of tree species associated with crops in mixed food-crop agroforest systems .......................................................................... 104
5.3.4 Comparison of stand composition between land uses ................................... 106 5.3.4 a Comparison of stand stem density between land uses ............................ 106 5.3.4.b Comparison of the number of top 10 species that are shared between two land uses .............................................................................................................. 107
5.4 DISCUSSION ....................................................................................................... 107 5.4.1 Land use patterns, their history and effects on tree species domestication ... 110 5.4.2 Relationships between species richness, tree stem density by plant size, distance to the farm, land use history, use values and characteristics of the biophysical environment ......................................................................................... 113
5.4.2.1 Species richness and total stem density in different land uses................ 113 5.4.2.2 Top 10 species and their stem density in different land uses .................. 114 5.4.2.3 Absolute and relative stem density of the top 10 species within land uses............................................................................................................................. 116 5.4.2.4 Diversity of crop species and percentage of total stems for top 10 species in mixed food agroforests ................................................................................... 118
5.4.3 Relationships between agricultural biodiversity management and patterns of land uses .................................................................................................................. 119 5.4.4 General discussion ......................................................................................... 121
5.5 CONCLUSIONS................................................................................................... 123 5.6 REFERENCES ..................................................................................................... 123
CHAPTER SIX : AGRICULTURAL BIODIVERSITY KNOWLEDGE AND ADAPTIVE CAPACITY TO SATISFY HOUSEHOLD CONSUMPTION AND INCOME GENERATION ........................................................................................... 130
6.1 INTRODUCTION................................................................................................. 130 Conceptual framework: adaptive capacity theory and socio-ecological resilience 132
6.2 METHODS ........................................................................................................... 133 6.2.1 Study area....................................................................................................... 133 6.2.2 Sampling methods .......................................................................................... 135 6.2.3 Data collection ............................................................................................... 135 6.2.4 Data analysis .................................................................................................. 136
6.3. RESULTS ............................................................................................................ 137 6.3.1 Contribution of food crops and forest products to household consumption .. 137

xiii
6.3.2 Reasons for the use of specific crop varieties in mixed food-crop agroforests................................................................................................................................. 137
6.3.2.a Preferences for household consumption and markets for the use of specific crop varieties ....................................................................................................... 137 6.3.2.b Relationships between the use of varieties/cultivars of crop species, respondents knowledge of their uses and market preferences ............................ 138
6.3.3 Trends of income generated from forest products ......................................... 139 6.3.4 Patterns in the use of domesticated natural trees on farms ............................ 139
6.3.4.1 Uses of trees found within different land uses ........................................ 139 6.3.4.2 Relationship between status of trees species domestication, respondents knowledge of their uses and market preferences ................................................ 140
6.4 DISCUSSION ....................................................................................................... 141 6.4.1 Management of consumed food crops and forest products ........................... 141 6.4.2 Use of crop cultivars/varieties based on respondents knowledge of their qualities ................................................................................................................... 143 6.4.3 Trends in income generated from forest products ........................................ 145 6.4.4 Distribution of tree uses within human-modified landscape ......................... 146 6.4.5 Maintenance of tree species based on respondents knowledge of their uses . 147 6.4.6 General discussion ......................................................................................... 149
6.5 CONCLUSIONS................................................................................................... 150 6.6 REFERENCES ..................................................................................................... 151
CHAPTER SEVEN : PERCEPTIONS OF CLIMATE VARIABILITY, INCIDENCE OF PESTS AND DISEASES ON CROPS AND ADAPTIVE MANAGEMENT PRACTICES AT THE FOREST-AGRICULTURE INTERFACE......................................................................................................................................... 158
7.1 INTRODUCTION ................................................................................................ 158 7.2. METHODS .......................................................................................................... 161
7.2.1 Study area....................................................................................................... 161 7.2.2 Sampling methods .......................................................................................... 162 7.2.3 Data collection ............................................................................................... 163 7.2.4 Data analysis .................................................................................................. 163
7.3 RESULTS ............................................................................................................. 164 7.3.1 Perception of climate variability/stress .......................................................... 164 7.3.2 Relationship between perceptions of climate variability and field management activities .................................................................................................................. 165 7.3.3 Relationship between pest-disease management strategies and perceptions and characteristics of farmers and farms ....................................................................... 166
7.3.3.1 Importance of different pest-disease management strategies used by farmers ................................................................................................................ 166 7.3.3.2 Influence of current perceptions of climatic variability .......................... 166 7.3.3.3 Influence of access to markets ................................................................ 166 7.3.3.4 Influence of farmer’s financial capitals .................................................. 166 7.3.3.5 Influence of farmer’s physical capitals ................................................... 166 7.3.3.6 Influence of former land uses ................................................................. 166
7.3.4 Perception and management of pest-disease problems on the main crop species................................................................................................................................. 167
xiv
7.3.4.1 Perception of incidence of pests-diseases on crops yield/income .......... 167 7.3.4.2 Management actions to mitigate the impacts of main crop pests-diseases on yield................................................................................................................ 168
7.4 DISCUSSION ....................................................................................................... 170 7.4.1 Perception of climate variability, uncertainty and pest-disease management strategies ................................................................................................................. 170 7.4.2 Relationship between perceptions of climate variability and field management activities .................................................................................................................. 171 7.4.3 Relationship between pest-disease management strategies and perceptions and characteristics of farmers and farms ....................................................................... 171
7.4.3.1 Importance of different pest-disease management strategies used by farmers ................................................................................................................ 171 7.4.3.2 Influence of access to markets ................................................................ 172 7.4.3.3 Influence of the financial and physical capital of farmers ...................... 172 7.4.3.4 Influence of former land uses within the cropping-fallow-forest conversion cycles................................................................................................................... 173
7.4.4 Perceptions of incidence of pests-diseases and management actions to mitigate crop pests-diseases on yield and/or income ............................................................ 174 7.4.5 General discussion ......................................................................................... 175
7.5 CONCLUSION ..................................................................................................... 178 7.6 REFERENCES ..................................................................................................... 178
CHAPTER EIGHT : KNOWLEDGE SYSTEMS INTERFACE IN DEVELOPING ADAPTIVE FOREST-AGRICULTURE INNOVATIONS: SPHERE OF CONFLICTS AND KNOWLEDGE INTEGRATION ............................................. 183
8.1 INTRODUCTION ................................................................................................ 183 8.2. DISCUSSIONS AROUND SPECIFIC OBJECTIVES ....................................... 185
8.2.1 Forest-agriculture innovations: Knowledge base and field processes ........... 185 8.2.2 Local perceptions of nature and forest knowledge management ................... 187 8.2.3 Influences of local agro-ecological indicators on sustainability of agricultural land uses .................................................................................................................. 187 8.2.4 Influences of bio-physical determinants on local agricultural biodiversity knowledge management.......................................................................................... 188 8.2.5 Influences of local agricultural knowledge on household consumption needs, market preferences and sustainable livelihood ....................................................... 190 8.2.6 Influences of local perceptions of climate variability on adaptive management strategy of crops pests-diseases .............................................................................. 191
8.3 DISCUSSIONS AROUND ALL THE DIFFERENT SUB-OBJECTIVES AND IMPLICATONS FOR CURRENT R & D PRACTICES ........................................... 192
8.3.1 Discussions in terms of achievement of the overall objective ....................... 192 8.3.2 Meaning on understanding and management of local biodiversity knowledge towards the implementation into integrated management of forest-agricultural resources and sustainable development in the humid tropics ................................. 193 8.3.3 Implications for ways to approach timber and non-timber harvesting together with agricultural cropping needs ............................................................................. 195 8.3.4 Implications for the improvement of the conceptual frameworks presented in Chapter 1 and specifically the diagrams in Figures 1.2.1 and 1.2.2 ....................... 196

xv
8.4 GENERAL CONCLUSIONS ............................................................................... 198 8.5 RECOMMENDATIONS ...................................................................................... 200 8.5 REFERENCES ..................................................................................................... 201
APPENDICES ............................................................................................................... 212
APPENDIX 1 : QUESTIONNAIRE USED FOR FIELD WORK ............................. 212 APPENDIX 2: DESCRIPTION OF LOGISTIC REGRESSION MODEL ............... 226 APPENDIX 3: LIST OF PLANT SPECIES ............................................................... 229
xvi
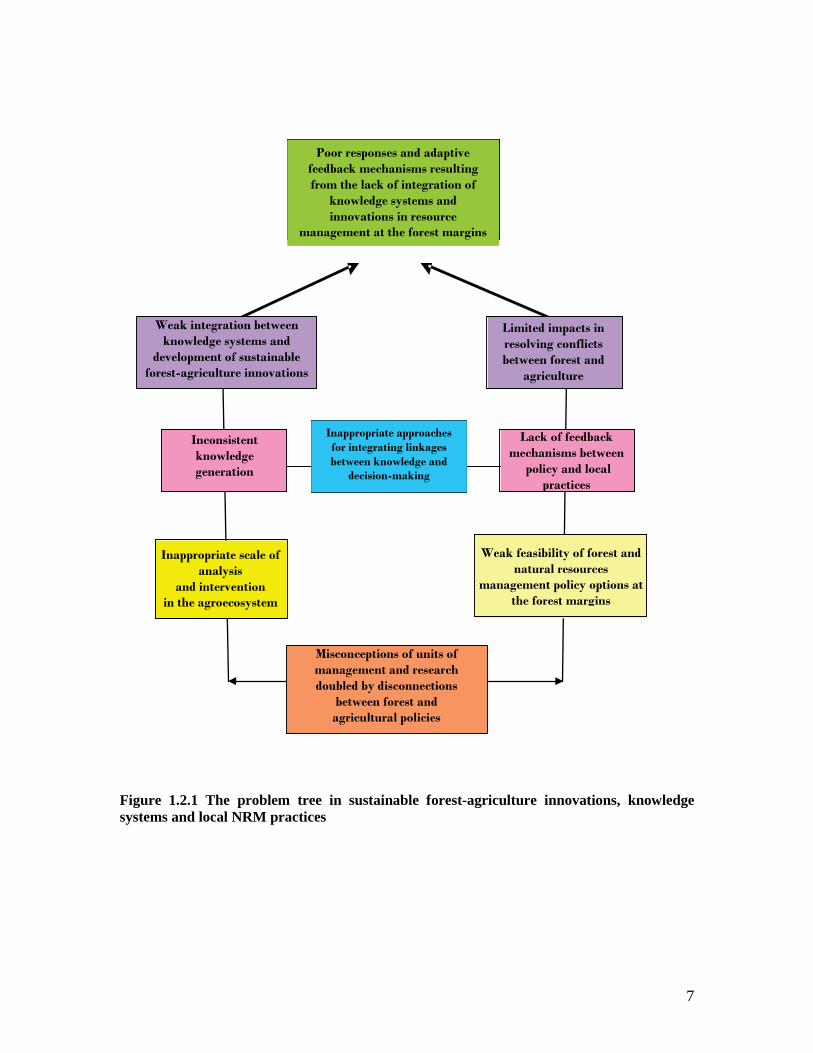
LIST OF FIGURES Figure 1.2.1 The problem tree in sustainable forest-agriculture innovations, knowledge
systems and local NRM practices ............................................................................... 7 Figure 1.2.2 The relationships between knowledge systems, agricultural biodiversity,
forest-agriculture innovations and adaptive co-management (Adapted from Boyle 2001) ......................................................................................................................... 12
Figure 2.2.1 The ASB forest margins benchmark area in southern Cameroon (Gockowski
et al. 2005). ............................................................................................................... 25 Figure 3.1.1 The Ntem-Sanaga region conception of nature. Adapted from Gonese (1999)
and Haverkort and Rist (2004) .................................................................................. 53 Figure 3.2.1 Research study sites within the benchmark of southern Cameroon ............. 54 Figure 4.3.1 Typology of local indicators in the social representation of the links between
land uses and their resources..................................................................................... 75 Figure 5.1.1 Cropping-fallow-forest conversion cycles in southern Cameroon (Adapted
from Diaw 1997) ....................................................................................................... 89

xvii
LIST OF TABLES Table 2.3.1 Distance (km) from the village to the closest and the important markets ..... 30 Table 2.3.2 Socio-economic context of R&D activities in the study area ........................ 31 Table 2.3.3 Socio-economic profile of respondents within the study area ....................... 32 Table 2.3.4 Frequency of coverage of R&D themes by humid forest zone blocks .......... 33 Table 2.3.6 Stakeholder categories and percentage of field approaches in developing
forest-agriculture innovations ................................................................................... 34 Table 2.3.7 Type of innovations and scale of local stakeholders’ involvement ............... 35 Table 2.3.8 Participatory assessment of adaptive collaborative management parameters 35 Table 2.3.9 Frequency of the deployment forest-agriculture innovations ........................ 36 Table 2.3.10 Social demand for improvements in the humid forest blocks ..................... 37 Table 3.3.1 Representation of the vital space of the people of study area ........................ 57 Table 3.3.2 Relationships between components of the vital space of the people of study
area ............................................................................................................................ 58 Table 3.3.3 Local perceptions of nature and forests resource management of the people of
study area .................................................................................................................. 58 Table 3.3.4 Local classification of forest land uses, number of ecological indicators and
spatial indicators of forest management ................................................................... 59 Table 3.3.5 Effects of the seasonality knowledge and time management on local natural
resource management activities by the people of study area .................................... 60 Table 4.3.1 Local classification of soil and perception soil fertility in southern Cameroon
................................................................................................................................... 76 Table 4.3.4 Selection of appropriate agricultural land uses for cropping in relation to local
soil classes ................................................................................................................. 77 Table 5.3.1 Frequency of perception of distance from house to land use site .................. 94 Table 5.3.2 The relationship between perception of distance from the house and decision
to maintain trees in the fields .................................................................................... 94

xviii
Table 5.3.3 Relationship between plant stem size category and status of domestication of
trees in Cucumeropsis agroforest farms .................................................................... 95 Table 5.3.4 Frequency of former agricultural land uses preceding the current land use, i.e.
when they were not practised in cleared natural vegetation ..................................... 95 Table 5.3.5 Frequency of the vegetation/forest conditions preceding the current land use
................................................................................................................................... 96 Table 5.3.6 Stem density (stems/ha) by plant size categories in Cucumeropsis agroforests
for top 10 plant species in each block ....................................................................... 98 Table 5.3.7 Stem density (stems/ha) by plant size categories in cocoa agroforests for the
top 10 plant species in each block............................................................................. 99 Table 5.3.8 Stem density (stems/ha) by plant size categories in young preforest fallows
for top 10 plant species in each block ..................................................................... 101 Table 5.3.9 Stem density (stems/ha) by plant size categories in young secondary forests
for top 10 tree species in each block ....................................................................... 103 Table 5.3.10 Crop species and cultivars per species within mixed food-crop agroforests
................................................................................................................................. 105 Table 5.3.11 Stem density (stems/ha) of the top 10 plant species associated with food
crops within mixed food-crop agroforests .............................................................. 106 Table 5.3.13 Comparison of number of species common to two land uses.................... 107 Table 5.3.12 Comparison of total stand density for all plant size categories of the top 10
tree species between the five land uses of the cropping-fallow-forest conversion cycles....................................................................................................................... 108
Table 6.3.1 Frequency (%) by which respondents indicated that specific main food/forest
products contributed to household consumption needs .......................................... 137 Table 6.3.2 Percentage of crop’ qualities for household and market preferences based on
the respondents’ knowledge .................................................................................... 138 Table 6.3.3 Logistic regression of number of crop varieties/cultivars based on
respondent’s knowledge of crop qualities and market preferences ........................ 139 Table 6.3.4 Frequency by which respondents indicated income generation from specific
forest products over the 10 past years ..................................................................... 139
xix
Table 6.3.5 Importance of trees for different uses based on respondents’ knowledge ... 140 Table 6.3.6 Logistic regression statistics of tree species domestication based on farmers’
knowledge of their uses in Cucumeropsis and cocoa agroforests ........................... 141 Table 7.3.1 Perception of indicators of climate variability ............................................. 165 Table 7.3.2 Relationship between perception of current climate variability/stress and
efficiency of field management activities ............................................................... 165 Table 7.3.3 The relationship between farmers’ pest-disease management strategies and
their perceptions of climate variability/stress, village access to markets, farmer’s financial and natural capital, and the former land use on the farm. ........................ 167
Table 7.3.4 Valuation/perception of the effects of pests-diseases on the yield of the main
agricultural crop species ......................................................................................... 168 Table 7.3.5 The importance of different modes of pest-disease management for the main
crops ........................................................................................................................ 169

xx
GLOSSARY Adaptive collaborative management refers to a management approach to complex systems based on incremental, experiential learning and decision making, supported by active monitoring of and feedback from the effects and outcomes of decisions (Diaw et al.. 1999; Ruitenbeck and Cartier 2001; Prabhu 2003). Agro-ecological sustainability is defined as the ability to maintain the fertility and productive potential of a farm in the long-term, based on agronomic indicators (adapted from Zam et al. 2004). Agricultural biodiversity or agrobiodiversity refers to the variety and variability of genetic resources (species, varieties, breeds) of animals, plants and micro-organisms that are used directly or indirectly for food, fodder, fibre, fuel, pharmaceuticals and agriculture, including crops, livestock, forestry and fisheries. It also includes the diversity of non-harvested species that support the management of the forest-agriculture interface (FAO 1999). Agricultural ecosystems (or agroecosystems) are those "ecosystems that are used for agriculture" in similar prastices, with similar components, similar interactions and functions. Agroecosystems are determined by three sets of factors: the genetic resources, the physical environment and the human management practices, which exhibit genetic, spatial and temporal variation, as well as by their interactions (FAO 1999). Decision-analysis in this study refers to a structured way of thinking about how the action taken in a current decision would lead to a result. In doing this, one distinguishes three features of the situation: the decision to be made, the chance and impact of known or unknown events that can affect the result, and the result itself (adapted from Prabhu 2003). Development refers to a process of creating, testing and maintaining opportunity in order to improve income and livelihoods. These opportunities can be either technical, market oriented or socio-organizational. Development is generally boosted by the introduction of innovative improvements (adapted from Prabhu 2003). Externality in economics is an impact on any party not directly involved in an economic decision. An externality occurs when an economic activity causes external costs or external benefits to third party stakeholders who did not directly affect the economic transaction. Another term that often replaces externality is spillover. One may see the words "spillover costs" or "spillover benefits". Although they sound less technical, the two terms are interchangeable for externality. Basically, the producers and consumers in a market either do not bear all of the costs or do not reap all of the benefits of the economic activity. For example, manufacturing that causes air pollution imposes costs on others, while planting forests (rather than other agricultural activities) would improve the water quality of those downstream (www.econlib.org/library/Enc/Externalities.html).

xxi
Farm in this study refers to a functional and distinctive unit within the agroecosystem controlled by a household (adapted from Guyer 1982). Financial capital refers to the household earnings, credit, savings and remittances (adapted from Campbell et al. 2006). Forest (as defined for Cameroon) is a continuous stand of tall trees (10 to 35 meters high), with a multi-layered structure, in which the crowns of individuals interlock and overlap (MINEF 1996). Fores agriculture refers to slash and burn agriculture or swidden agriculture but we preferred the term forest-agriculture due to the fact that it is justified to the perception of forests (adapted from Oyono et al. 2003). Forest-agriculture interface refers to the agricultural frontier where forest and agriculture meet (adapted from Oyono et al. 2003). Forest-agriculture innovations refer to a series of innovations developed and tested to address the integration of conservation and development at the forest margins (adapted from Oyono et al. 2003 and Palm et al. 2005). Human capital refers to the status of individuals, and comprises the stock of knowledge, health, skills and nutrition of individuals; their access to services that provide these, such as schools, medical services, adult training; the ways individuals and their knowledge interact with productive technologies; and the leadership quality of individuals (Pretty and Smith 2004).
Households, in this study means a unit of people, consisting of one or more persons - related or not related by blood - usually living under one roof and/or making common provision for food and other living arrangements. Included in this group are husband, wife, mother, father, children and other relatives found in the household. A head of the household is the person whom the members of the household accept as their leader. In particular, a household has at least two budgets held separately by husband and wife to prepare meals and provide other essentials for the household (adapted from Balandier 1982). Improvement refers to a change resulting from the introduction of innovations that makes something better or adds to its value (www.econlib.org/library/Enc/Externalities.html). Innovation refers to new and original ways of doing things that change the current thinking, and improves the performances of practices and/or the social and economic gains (adapted from Prabhu (2003). Local agricultural biodiversity knowledge systems refer to cognitive structure in which theories and perceptions of nature and culture are conceptualized in the management of
xxii
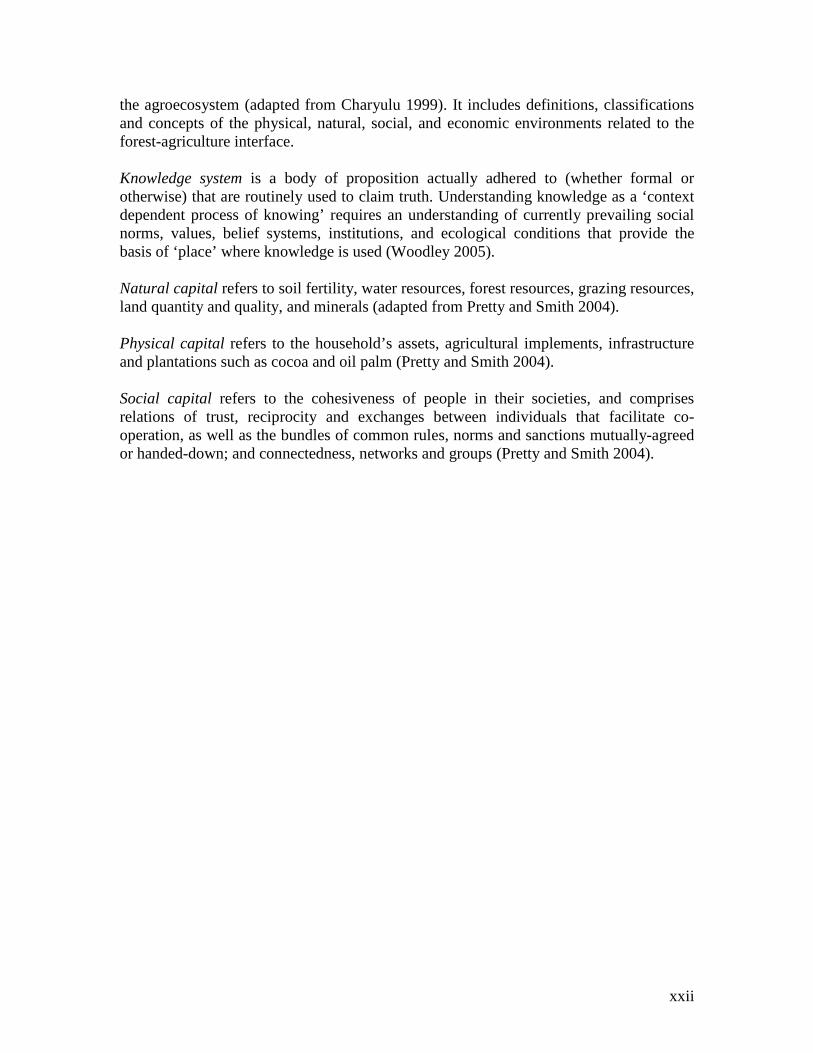
the agroecosystem (adapted from Charyulu 1999). It includes definitions, classifications and concepts of the physical, natural, social, and economic environments related to the forest-agriculture interface. Knowledge system is a body of proposition actually adhered to (whether formal or otherwise) that are routinely used to claim truth. Understanding knowledge as a ‘context dependent process of knowing’ requires an understanding of currently prevailing social norms, values, belief systems, institutions, and ecological conditions that provide the basis of ‘place’ where knowledge is used (Woodley 2005). Natural capital refers to soil fertility, water resources, forest resources, grazing resources, land quantity and quality, and minerals (adapted from Pretty and Smith 2004). Physical capital refers to the household’s assets, agricultural implements, infrastructure and plantations such as cocoa and oil palm (Pretty and Smith 2004). Social capital refers to the cohesiveness of people in their societies, and comprises relations of trust, reciprocity and exchanges between individuals that facilitate co-operation, as well as the bundles of common rules, norms and sanctions mutually-agreed or handed-down; and connectedness, networks and groups (Pretty and Smith 2004).

xxiii
LIST OF ACRONYMS ACM: Adaptive Collaborative Management ASARECA: Association for Strengthening Agricultural Research in Eastern and Central Africa ASB: Alternative to Slash-and-Burn CABI : Commonwealth Agricultural Bureau International CFA: Communauté Française d’Afrique CIFOR: Center for International Forestry Research CIP: Center for International Research on Potatoe CIRAD: Centre International de recherche agricole pour le développement EPHTA : Eco-Regional Programme for Humid Tropics in Africa FAO: Food and Agricultural Organisation of United Nations FARA: Forum for Agricultural Research in Africa GEF: Global Environmental Facility IDRC: International Development Research Centre IFAD: International Fund of Agricultural Research IITA: International Institute of Tropical Agriculture IRD: Institut de la recherche pour le développement ISNAR: International Service for National Agricultural Research MINEF : Ministry of Environment and Forest – Republic of Cameroon NRM : Natural Resources Management OCDE : Organization for Economic Cooperation and Development R&D : Research and Development

xxiv
RFF : Resource for Future UK : United Kingdom USA: United States of America
CHAPTER ONE
GENERAL INTRODUCTION 1.1 BACKGROUND The sustainable management of natural resources is one of the greatest contemporary challenges in the world. It is based on the integration of two key ‘opposite’ paradigms: conservation and development. Sustainable agriculture exemplifies this challenge as it involves the incorporation of natural processes such as nutrient cycling, nitrogen fixation, and pest-predator relationships into agricultural production processes, to ensure profitable and efficient food production (Pretty 2002, 2006). Sustainable agriculture is a very complex goal; achieving it will require innovations and flexibility. In the case of small-holder agriculture commonly found in the tropics, the challenge is to find the conditions under which the implementations of appropriate policy, and technological, methodological and scientific innovations can lead to more resilient agroecosystems and responsive management institutions (Ediquist 1997a,b; Carlsson et al. 2002; Clark 2002; Prabhu 2003; Roseboom 2004; Spielman 2005; Colfer 2006). Innovation, i.e. the process of generating and deploying new and existing technologies, is an integral part or even a precondition of the integration of conservation and development (OECD 1999; Prabhu 2003; FARA 2004; Colfer 2006; Spielman 2006). However, the current approaches to shaping sustainable forest-agricultural innovations have not yet received much attention from this perspective. The need to better understand small-scale agriculture, its technical, institutional, socio-organizational and market influences, is critically reviewed regarding the conditions that lead to sustainable forest-agriculture outcomes in the humid forests of Central Africa and southern Cameroon. The recent assessments made on the development of forest-agriculture innovations in southern Cameroon, have shown that the processes remain dominated by external agencies’ scientific choices and technical orientations (Mala et al. 2003; Oyono et al. 2003a,b; Colfer 2006). Moreover, the socio-ecological mechanisms regulating forest-agriculture productivity have not yet been analysed in relation to their resilience capacity (Diaw 1997; Oyono et al. 2003a). Another key factor that has not been critically assessed is their scale of analysis and intervention within the agroecosystem. In many of the cases, the household unit remains the only entry point while its linkages with other local NRM institutions remain weakly articulated in the analysis (Guyer 1982; Diaw 1997). As a result, the knowledge generated from the field processes is biased because it does not reflect the agroecosystem organization and functioning, its real dynamics and the ability of resource users to innovate and to adapt to changes. The consequence is that forest-agriculture innovations generated from the field processes encounter some fitness problems i.e. social feasibility. Up to this day, the ongoing approaches of sustainable forest-agriculture outcomes in Central Africa, like in southern Cameroon, have not yet succeeded in building a bridge

2
between technical agriculture-forest innovations such as improved crop varieties, improved soil fertility and introduction of new crop varieties, on one side, and the social representation of space and land uses, the social-organizations and institutions, human practices and the local forest and ecological knowledge, on the other (Dounias 1995; Diaw and Oyono 1998; Carrière 1999; FAO 1999; Oyono et al. 2003a; Mala and Oyono 2004). More specifically, the links between biodiversity and agriculture have been ignored by these technical approaches. The association of crop and non-agricultural plant species within a particular land use are changing over time because they are influenced by farmers’ livelihood goals and definition of well-being. Hence, more than ever before, conventional approaches towards research within some reductionist paradigms of biodiversity, forest management, slash-and-burn agriculture, sustainability and biodiversity conservation, have shown their inefficiency to lead to sustainable outcomes. The inability to successfully control some ecological variables, such as agricultural productivity with a few crops within the context of agricultural biodiversity, has led to less resilient ecosystems. Moreover, the introduction of new institutions put in place by technical approaches of natural resources often clashes with local management institutions. Furthermore, resource managers and users are thus faced with a new class of resource management problems for which conventional approaches to assessment and management remain ill equipped (Diaw et al. 1999; Prabhu 2003). Research carried out in a reductionist paradigm can only take us part of the way. We need a more comprehensive, inclusive paradigm for research that seeks to tackle complex social-ecological interactions (Ruitenbeck and Cartier 2001; Holling et al. 2002; Prabhu 2003; Colfer 2006). In response to this lack of conservation-development integration, new research approaches are currently being developed. The challenge is to deal with how this integration can be achieved through knowledge interfacing and sharing. One way to deal with this issue is to shift from a view of knowledge as a ‘thing’ that can be transferred, to one of a ‘process of relating’ that involves careful negotiation of meanings, objectives, outcomes and perspectives among partners (Plummer and Armitage 2006; Roux et al. 2006). Adaptive collaborative management (ACM), an approach (strategy) in complex bio-economic systems, has been proposed as an appropriate tool to address this gap. It purports to offer an approach towards (1) managing complex systems; (2) supporting incremental, experiential learning and decision-making; (3) catalyzing active monitoring; and (4) ensuring feedback from the effects or outcomes of decisions in response to conventional management systems (Holling 2001; Ruitenbeck and Cartier 2001; Prabhu 2003; Olsson et al. 2004; Berkes 2005). How can the ACM approach contribute to such a gap in outcomes and methodology? ACM, as an innovative approach, can be relevant in cases where past researches have generated a lot of useful information on ecology, economy, social systems and possible agricultural technologies, but where that information has not been successfully integrated into the ‘socio-ecological system’. Such a ‘system’ is the composite emergent framework of human actions that seek to harness the productive potential of living natural systems in relation to the ecological responses of the system to those interventions (Scheffer et al. 2002; Prabhu 2003; Berkes 2005). Sustainability, if it exists, is evident only at this composite level; not at the level of individual actions or technologies. It can be hypothesized that the failure to focus at this
3
emergent level has been the single most constraining factor for sustainability. The corollary to this is that focusing at this emergent level will give rise to new tools, technologies, institutions and, capacities (i.e. ‘innovations’) that would make the attainment of sustainability much more likely. The interactions of the social, ecological and economic components aggregate as a ‘whole that is greater than the sum of its parts’, as advocated by ACM and indeed in the research of this study. The new millennium has brought a new recognition of the need for international affairs to improve the lives of the large proportion of humanity who have been excluded from the recent growing global prosperity (MEA 2005). There is a call for meeting the millennium development goal (MDG) with agricultural biodiversity. What does it mean for agriculture-forest production systems? How can this be translated into agricultural and forest policy, concepts and innovations related to sustainable forest-agriculture? What type of science and technologies are relevant to achieve this goal, and to overcome conflicts and build complementarities between agriculture, forest and biodiversity? How do we accommodate the relationships between knowledge and power, via scale of analysis and/or intervention and location-specific institutional structures? In this regard, the concept of innovative systems is central in putting together different world views and knowledge systems by the linking of facts and fact-based theory across disciplines to create a common basis for explanation and transformation of the reality (Spielman 2005; Roux et al. 2006). These innovations should focus on the maintenance of biodiversity and productivity that sustain livelihoods and income generation, and of the ecological processes (forest dynamics and recovery) that underlie the patterns of species diversity and productivity. This study analyses how decision-making within the framework of ‘adaptive collaborative management’ can contribute to generating more appropriate innovations for managing complex forest-agricultural systems under conditions of high biodiversity in the humid forest zone of southern Cameroon. 1.2 PROBLEM STATEMENT: SUSTAINABLE FOREST-AGRICULTURE MANAGEMENT INNOVATIONS The thinking and processes on sustainable forest-agriculture have been dominated over the past years by approaches that have sought to separate forests and agriculture spatially, administratively and conceptually into two separate units for management and research (GEF 1993; ASB 1995, 2000; Garrity and Bandy 1995; Zhang and PiKun 1995; Van Noordwijk et al. 2001; Palm et al. 2005). This has not been useful in the context of small-scale agriculture particularly in the humid tropics where agriculture production systems are embedded within a cropping-fallow-forest conversion cycle (Diaw 1997; Carrière 1999; Oyono et al. 2003a; Mala and Oyono 2004; Mala et al. 2006). The results are that a high number of innovations, mainly forest-agriculture technologies, have faced practical problems and have been abandoned. These technologies were focusing mainly on addressing soil fertility issues, improved crop varieties and low consumption of vegetal-proteins (Nolte et al. 1997). Despite these efforts, the spatial conflicts between forest and agriculture remain a key unresolved challenge in many areas in the tropics.
4
The limits observed in the implementation of the segregation approach have revealed the gaps between the concepts of forest agriculture or swidden agriculture (Colfer and Dudley 1993; Diaw 1997; Fujisaka and Escobar 1999; O’brien 2002; Colfer 2006), the theories and school of thoughts in ecology and agricultural sustainability (Pretty 2004, 2006) and the forest-agriculture practices and local NRM options (Diaw and Oyono 1998; Altieri 2002; Instone 2003a). In the Central Africa region, the impacts of agricultural and NRM innovations on rural livelihood improvement, income generation and sustainable management outcomes are not yet visible, have not yet been captured or remain localized (Mala et al. 2003, 2006; Mala and Oyono 2004). The state of the art in outcomes of sustainable forest-agriculture innovations is questionable in terms of its utility for sustaining human well-being and the natural resource base on four aspects: disconnected rural and forest policies; inconsistent scientific thinking and its effects on processes and scales of doing research and management; and inappropriate agriculture-forest innovations. These four aspects are explored further below. Firstly, if sustaining human well-being in the face of the degradation of forest ecosystems is a shared global concern, unfortunately, meeting this challenge is often hampered by disconnected and weak integration between agricultural, forestry and environmental policies. According to MEA (2005), this is due in part to institutional failures that prevent existing policy-relevant scientific information from being made available to decision-makers and in part to the failure to incorporate other forms of knowledge and information (such as traditional knowledge and practitioners’ knowledge) that are often of considerable value for agroecosystem management. In Cameroon, the 1990’s were marked by rural and forestry reforms that partitioned the forestry domain between permanent (20 million hectares) and non permanent (5 million hectares) areas (MINEF 1996; FAO 2005). This partition has made it difficult to integrate forest and agriculture issues in the research and development agenda (Diaw and Oyono 1998). The assessment made through the forest and environment sectoral programme (PSFE) showed that the forestry innovations of 1994, such as community forests, encountered the same problems of implementation due to their overlapping on socio-ecological processes on which communities based their survival, livelihood, resource governance and development. Secondly, the thinking on tropical biodiversity conservation has been guided over the past decades by the assumptions of the inability of local resource users to respond to the imperatives of sustainable management (GEF 1993; ASB 1995, 2000; Van Noordwijk et al. 2001). This thinking has seriously transformed the way conservation is carried out and this seems at odds with the ways local people view the natural world, their practices, their knowledge systems and their livelihoods at the forest-agriculture interface. This has been reflected by the fact that concepts, methods and tools of formal conservation and sustainable forest management have yet to be translated effectively and comprehensively into local languages as to make them understandable and accessible to local people (Instone 2003a,b; Oyono et al. 2007). Thus, attention has focused more on uncertainty-associated local ecological knowledge than on its real value, nature and resilience capacity (Geldenhuys 2000). Moreover, the old ecological thinking has always been characterised by circularity and inter-connections, and has not yet been able to incorporate the complexity inherent to forest-agriculture in the context of high

5
biodiversity and socio-ecological systems at spatio-temporal scales. Finally, current approaches to agriculture and forestry seem incapable of dealing with the complexities of forest-agricultural mosaics in tropical rainforest areas because they are based on reductionist paradigms. The result is that neither the paradigms of agriculture nor those of forestry actually fit; whether they are old or new is of secondary importance. An integrating paradigm is needed and the best way of getting there is to start integrating local knowledge based on its nature, processes and values (MEA 2005; Wallington et al. 2005). Thirdly, the scale of analysis and intervention of conventional processes of forest-agriculture innovations, such as technologies, are intrinsically linked to the thinking on biodiversity conservation. However, their links with the land use management patterns within the cropping-fallow-forest conversion cycle have not received sufficient attention (Mala et al 2006). This inadequate delineation has affected the nature and values of field processes such as participation or similar processes (Oyono et al. 2003b, 2007; Diaw et al. 2006). Moreover, conventional research approaches in agriculture have not effectively included other forms of knowledge (Mala et al. 2006). This has had negative implications for the management of natural resources. For example, the overly simplistic and artificial segregation of ‘innovators’ from ‘adaptors’ has seriously affected the delivery of innovations to forestry and agriculture in the kind of complex environments that exist in southern Cameroon (Mala et al. 2003; Oyono et al. 2003a,b; Mala and Oyono 2004). Additionally, disjointed attempts at addressing biodiversity at three different scales, i.e. farms, the larger natural landscapes they belong to, and protected areas, illustrate just one aspect of the difficulty of analysing agroecosystem problems and developing feasible innovations (Altieri 2002; Instone 2003b; Prabhu 2003). While most agricultural research has focused almost exclusively at the small-plot level involving households, forestry research has focused on bigger scales (protected areas, community forests, council forests, state forest plantations, etc) with little exchange between the two. At the forest margin, what is clearly required is an integration of scales (spatial and temporal) as well as approaches if we are to develop sustainable agricultural resource management approaches based on an understanding of both the human dimensions and the ecological processes in these landscapes. Fourthly, several technologies, methods and approaches proposed for managing the forest-agriculture interface under conditions of high biological and social diversity are questionable with regard to their feasibility (Diaw et al. 1999; Cormier-Salem 1999; Mala et al. 2003; Oyono et al. 2003a). In southern Cameroon, most forest-agriculture innovations have been mainly focusing on developing technologies for soil fertility improvement, improved crop varieties and integrated natural resource management systems (Binswanger and Pigali 1987; Borlaug 1992; ASB 1995; COMBS 1997; Nolte et al. 1997). There is a need to improve the performance of forest-agriculture land use options in the long-term that will respond to community livelihood strategies in terms of household consumption, income generation and sustainable conservation of agricultural biodiversity, including both crop and non-agricultural species, that contribute to the dynamics of agroecosystems (Lefroy et al. 1999; Michon and Laforesta 1999; Nancy et al. 2003; McNeel 2004; Wiersum 2004). However, the innovations introduced to improve

6
soil fertility management; farmer’s income and household protein-intake have not yet integrated local agricultural biodiversity knowledge systems and decision-making processes behind them. It will be relevant to know if soil fertility innovations match with the social mechanisms regulating soil fertility and the maintenance of land and forest productivity at spatio-temporal scales. In summary, the complexity of socio-ecological systems and the inadequacy of most research approaches adopted to deal with this complexity currently hamper the development of sustainable forest–agriculture. This underlines the need for changes in scientific approach, the criteria for impact assessment, and the conceptual frameworks used (Ruitenbeck and Cartier 2001; Prabhu 2003; MEA 2005). In southern Cameroon, little or no attention has been given to understanding the adaptive capacity of local socio-ecological systems as they regulate land and forest productivity, manage soil fertility and adapt their ecological knowledge and management of biodiversity; it is the system and farmers are part of the system. The development of forest-agriculture innovations cannot be achieved without an understanding of the knowledge and decision-making of local farmers in the choice of crop and non-agricultural species, farming/land uses systems and livelihood strategies resulting from the management of agricultural biodiversity. The challenge is to reconcile global/national agriculture and forestry goals, with formal forestry and agricultural practices and traditional practices. The aim should be to integrate biodiversity conservation and agricultural production systems for rural livelihoods and income generation so that larger landscapes are managed in a sustainable manner. One way in addressing this challenge should be via the integration of knowledge systems. There is a need to question the thinking and processes in designing forest-agriculture innovations through approaches that are systematically based on cognition and learning. The research of this study is designed to analyse decision-making that leads to local agricultural biodiversity in order to develop sustainable innovations that take into account the potential of high (agricultural) biodiversity, diverse and effective knowledge systems that deal with the interface between forests and agriculture in the humid forest zone. This research will investigate the possible contribution that an adaptive collaborative management framework might make to sustainably bridging the kinds of scientific information gaps that have been stated earlier. A problem tree presented in figure 1.2.1 explains the conceptual framework and linkages between the components of the study.
7
Figure 1.2.1 The problem tree in sustainable forest-agriculture innovations, knowledge systems and local NRM practices
Inappropriate approaches for integrating linkages between knowledge and
decision-making
-
Inappropriate scale of analysis
and intervention in the agroecosystem
Weak feasibility of forest and natural resources
management policy options at the forest margins
Misconceptions of units of management and research doubled by disconnections
between forest and agricultural policies
Poor responses and adaptive feedback mechanisms resulting from the lack of integration of
knowledge systems and innovations in resource
management at the forest margins
Weak integration between knowledge systems and
development of sustainable forest-agriculture innovations
Lack of feedback mechanisms between
policy and local practices
Limited impacts in resolving conflicts between forest and
agriculture
Inconsistent knowledge generation

8
1.3 CONCEPTUAL FRAMEWORK OF THE STUDY New understandings of forest-agriculture innovations, their organisations, their forms, their processes and their paradigmatic issues have emerged over the past decade through the conjunction of work on innovative systems, systems thinking, evolutionary economics and adaptive co-management theories (Ediquist 1997a,b; Boyle 2001; Ruitenbeck and Cartier 2001; Clark 2002; Prabhu 2003; Olsson et al. 2004; Berkes 2005; Spielman 2005, 2006). Even if the literature on innovation systems in tropical agriculture has recently received the interests of the scientific community, there are still very few examples in practice showing how to make it happen or how to ensure its potential to generate the distribution of social and economic gains from innovations. The conventional natural management approaches based on the reductionist paradigm of relationships between social and ecological systems are ill-equipped to respond to new types of problems faced by resources managers (Wallington et al. 2005; Spielman 2006). The innovation systems in agricultural research and technological changes are rapidly becoming popular (Spielman 2005). Therefore their applications at the forest-agriculture interface should take into account a few critical issues such as the complexity of resource management, the stakeholders’ configuration and their interactions, the relationships between knowledge and decision-making, and the development of institutional learning and changing cycles. These elements are presented in details in the next paragraphs. In fact, the complexity of management systems at the forest-agriculture interface are related to multiple ecological dimensions and scales ranging from cultivated land uses to common land embedded in different hierarchical levels of ownership and rights (Diaw 1997; Carrière 1999; Diaw and Oyono 1998). This complexity is reflected in nine land uses organized in four broad categories including: forests, complex agroforests, simple agroforests and food crop-fallow systems (Gockowski et al. 2004, 2005; Sanchez et al. 2005; Palm et al. 2005; Diaw et al. 2006). These land uses are described below: The forest resources include three lands uses, i.e. natural forests, logged forests, and community managed forests (corresponding to forest landscape mosaics where the landscape is subject to the claim of land tenure arrangements) (Diaw 1997; Diaw and Oyono 1998; Carrière 1999). Undisturbed or so-called primary forests (natural forests) are rare and can be found mostly in southern Cameroon (Sanchez et al. 2005; Palm et al. 2005). Disturbed forests include some degree of logging and are dominant, with the intensity of logging low where a few trees are harvested per hectare. Some amount of non-timber forest products are harvested from forests of different categories (Gockowski et al. 2004, 2005). Complex agroforests include mainly cocoa agroforests that contain a wide variety of economic plants and usually have a rotation time greater than 20 years (Sonwa 2004; Sanchez et al. 2005). The trees generally shade out the crops, occupy different strata, and produce high-value products such as fruits, resins, medicines, and commercially valuable timber. Plant diversity in mature complex agroforest is in the order of 300 species/ha,

9
which approximates that of adjacent undisturbed forests (420 species/ha). They are complex because they contain several economic plant species such as cocoa with many varieties – other agroforest species such as exotic trees (Musa spp, Mangifera indica, …), wild fruit trees (Persea americana, Dacryodes edulis, Irvingia gabonensis, Ricinodendron hedeulotti… etc,), other NTFP species used by farmers, timber trees (Terminalia superba, Pycnanthus angolensis…) and many others tree species that fulfil ecosystem services including shade and soil fertility. Simple agroforests are called simple because they contain usually fewer than five economic plant species, whereas tree crop plantations include only one (i.e mono-specific stands). These systems have less plant diversity than the complex agroforest, higher levels of management are needed, and the regeneration of forest species is restricted Sanchez et al. 2005; Palm et al. 2005). This category includes two of the nine land uses that are mostly monoculture plantations such as oil palm and shade cocoa with few fruits, and shade trees generally implemented where the infrastructure is well developed. Food crop-fallow systems include three of these land uses, i.e. melon and mixed food crops of 15-years old, mixed food crops of 4-years bush fallow, and mixed food crops of fallow dominated by Chromoleana odorata (Gockowski et al. 2005; Sanchez et al. 2005; Palm et al. 2005). Slash and burn annual crop-fallow cycles (rotations) refers to traditional shifting cultivation with long-term fallows with both mixed groundnuts (Arachis hypogea), cassava production and mixed with melon seed (Cucumeropsis mannii), plantain (Musa paradisica), cassava (Manihot esculenta), and cocoyam (Xanthosoma sagitiffolum). In the first system, the two dominant crops are groundnuts and cassava, and other interplanted crops in lower densities include cocoyam (Xanthosoma sagitiffolum), maize (Zea mays), leafy vegetables (Solanum scabrum, Corchorus olitorius, Amaranthus spp.), and plantain (Musa paradisiaca). Surplus revenues tend to be controlled by women. This cropping system can combine a higher number of crop species i.e close to 20. In the second system, the dominant crops are melon seed, plantain, maize and cocoyams, planted after slashing and burning of nine to 23 years old secondary forests fallow and grown for two years, after which they are put back into another secondary forest fallow. It has been shown that multiple ecological dimensions delineate multiple uses in terms of food, timber, tools, medicines and services such as shade and enhanced fertility but also serves as an ecological memory for the regeneration and/or regrowth of forest and vegetation (Carrière 1999; Geldenhuys 2000). Moreover, every innovative natural resource management approach should first understand what competing/conflicting management objectives exist at the intersection of forest, agriculture and natural resources. What are the social references and the world views guiding them? What are the social and economic benefits that people can use in a negotiation and those which are difficult to negotiate in developing innovations at the forest-agriculture interface? The second issue affecting the management of the forest-agriculture is related to stakeholders’ sociodiversity, their interactions and the related type of agricultural biodiversity knowledge used in order to lead to sustainable agroecosystem outcomes. It
10
is known that when stakeholders are involved in the management of natural resources, the complexity of socio-ecological systems increases, creating much higher demands on the nature of field processes and the quality of research outcomes needed (Oyono et al. 2003a,b, 2007; Prabhu 2003; Spielman 2006). The lessons learned from recent implementation of adaptive co-management processes have shown that the social and institutional learning are key tools in decision-making and change paths leading to sustainable natural resource and environment management outcomes (Armitage 2003; Prabhu 2003; Colfer 2006; Diaw et al. 2006; Plummer and Armitage 2006). Moreover, the incomplete understanding of cause-and-effect relationships of decision-making on biodiversity management, and other natural resources, increases uncertainty about the consequences of alternative natural resource management options. That is why Laxman et al. (2004) have advocated research and development (R&D) based not on the scientific-local knowledge divide but on knowledge and innovations that complement appropriate scientific investigation. This confirms that the discourse of agricultural sustainability should be implemented by a social learning approach based on cognition and learning (Diaw et al. 1999; Boyle 2001; Prabhu 2003; Colfer 2006). The third issue is related to the development of institutional learning and changes through active monitoring. The questions arise as to how decisions are made, who makes decisions and what types of institutional arrangements are needed to generate well accumulated knowledge that will be disseminated and used for action. If adaptive management relies on an accumulation of credible evidence to support a decision that demands action (Boyle 2001; Conley et al. 2001; Prabhu 2003), then such a process can only be feasible/relevant when the feedbacks from the effects or outcomes of decisions are taken in response to management systems. These management systems should be based on a shared decision, defined monitoring-evaluation indicators of success and changes that can be adapted to respond to new challenges (Ruitenbeck and Cartier 2001; Gunderson and Holling 2002; Scheffer et al. 2002; Prabhu 2003; Olsson et al. 2004; Berkes 2005). Adaptive co-management practices should be based on agricultural biodiversity knowledge and adaptive management processes designed for situations where there is uncertainty in terms of satisfying livelihood needs, acquiring income, reduce crop-pest-disease incidence, adjust to climate stress and that justify a need for action adapted both to ecological and natural systems. In summary, it is important to improve our understanding of how ecological rationality and dynamics of local knowledge can contribute to the above-mentioned emerging cognition and learning based approaches for resource management. Relationships between knowledge systems, agricultural biodiversity, forest-agriculture innovations and adaptive co-management will form the framework of this study. The complex relationships among components of the study are shown in figure 1.2.2. 1.4 OBJECTIVES OF THE STUDY, RESEARCH QUESTIONS AND HYPOTHESES The general objective of the study was to analyse how the structure, organization and dynamics of different knowledge systems can be integrated to provide a basis for the
11
design of adaptive collaborative agricultural-forest management of natural resources at the forest agriculture interface under conditions of high biodiversity in the humid forest zone of southern Cameroon. The general research question: Can the integration of the structure, organization and dynamics of different, sometimes contradictory knowledge systems provide a basis for the design of adaptive agriculture-forest management options at the forest margin? The general hypothesis was that the integration of the structure, organisation and dynamics of traditional knowledge systems on agricultural biodiversity provides a basis for the design of adaptive agriculture-forest management options at the forest margins. All hypotheses associated with the specific objectives are stated as general hypotheses and are not meant to be specifically testable hypotheses. This study has the following specific objectives: Objective 1: to characterize sustainable slash-and-burn agriculture innovations at the forest-agriculture interface in terms of structure, organization and processes. Research questions: 1.1 What are the R&D themes associated with slash-and-burn agriculture innovations? 1.2 What are the processes supporting the development of slash-and-burn agriculture innovations at spatio-temporal scales? 1.3 How do stakeholders interact to develop slash-and-burn agriculture innovations which would integrate livelihood needs, institutions of knowledge and learning, social organisations and income improvement? 1.4 What are the emerging slash-and-burn agriculture innovations which were derived from agroecosystem analysis over the past decade at the forest-agriculture interface? 1.5 What have been the operational limitations of these processes in relation to the social demand for innovations? 1.6 To what extent did the introduced agricultural and agroforestry land uses and technologies adapt to local agricultural biodiversity knowledge systems? Hypothesis 1: The interplay of knowledge systems and the deployment of slash-and-burn agriculture innovations are affected by the biophysical and socio-economic context, natural resources management options, institutions of knowledge and social learning, and scale of analysis and intervention of resource users at the forest-agriculture interface. Objective 2: to examine the relationships between local perception of nature, forest knowledge management systems and adaptive forest-agriculture practices. Research questions: 2.1 What are the local perceptions of nature amongst the people of the study area? 2.2 What are the relationships between the components of these perceptions of nature? 2.3 What are the perceptions of forests and knowledge systems derived from them? 2.4 How do they affect forest management and agricultural practices? Hypothesis 2: Local perceptions of nature and natural resources knowledge systems guide the implementation of traditional adaptive local forest management and agricultural practices.

Figure 1.3.1 The relationships between knowledge systems, agricultural biodiversity, forest-agriculture innovations and adaptive co-management (Adapted from Boyle 2001)
• Multiple ecological
dimensions and scale • Multiple uses and
variables to build socio-ecological resilience
• Competing
and/confliction management objectives and perspectives
Approaches and interactions of stakeholders Approaches to generate, analyze, maintain impact /knowledge
Complex systems management of natural resources
Stakelholders’ sociodiversity
Science/practices interface Information value-infused Decision process on innovative options
Adaptive collaborative management
Decide Monitor Evaluate Adapt
Scenarios Trade-offs Priorities Collaborative options Data layers on social, cultural, economic and biophysical context
Responses and adaptive capacity of traditional agricultural biodiversity knowledge to this complexity
Characterisation of the interplay between knowledge systems and forest agriculture innovations that derived Local conceptualisations of nature and forest management knowledge systems Characterisation of the biophysics and socio-economics of local agricultural biodiversity knowledge within spatio-temporal scales Conflicts between traditional ecological knowledge of agricultural biodiversity and expert knowledge
Integration of pieces of agricultural biodiversity knowledge systems to find a compromise between biodiversity conservation, productivity and forest agriculture sustainability
Structure, organization and dynamics of different knowledge systems can be integrated to provide a basis for the design of adaptive collaborative agricultural-forest management of natural resources

13
Objective 3: to analyze the relationships between the social representation of land uses patterns and their local indicators, and agro-ecological resilience in the agriculture-forest interface. Research questions: 3.1 What are the social representations of the spatial resource associated with land uses patterns and the indicators of human modified landscape? 3.2 What are the local indicators of agro-ecological resilience at the forest-agriculture interface? 3.3 How do people use the indicators in practices at the forest agriculture interface? 3.4 How does this knowledge system affect the land use management patterns to enhance the sustainability of forest-agriculture? Hypothesis 3: The resilience of slash-and-burn agriculture is guided by historical-ecological perspectives of land use patterns and local indicators of slash-and-burn agriculture sustainability. Objective 4: to characterise local management of agricultural biodiversity knowledge systems at the forest-agriculture interface. Research questions: 4.1 What are the biophysical determinants of local management of agricultural biodiversity at the forest-agriculture interface? 4.2 How does this local agricultural biodiversity knowledge vary at different socio-ecological scales and processes? 4.3 How does the local agricultural biodiversity knowledge of people affect the relationships between agricultural and non-agricultural plant species in natural resource management practices at the forest-agriculture interface? Hypothesis 4: The agricultural biodiversity is affected by local management of ecological knowledge affecting agricultural and forest productivity, ecological processes (forest dynamics) and species richness patterns within the cropping-fallow-forest conversion cycles. Objective 5: to analyze how local agricultural biodiversity knowledge is used to adapt and to satisfy household consumption needs, to respond to market preferences, and to sustain livelihoods of farmers. Research questions: 5.1 What are the socio-economic determinants of agricultural biodiversity management at the forest-agriculture interface? 5.2 How do people use local agricultural biodiversity knowledge in natural resources management practices at the forest-agriculture interface? 5.3 What socio-economic considerations affect the decision behind the domestication of plant species or farming practices?

14
Hypothesis 5: Local agricultural biodiversity knowledge is a tool used to satisfy/respond and adapt to market preferences and needs for household consumption and sustainable livelihoods. Objective 6: to examine the consequences of local perceptions of climate variability for the ability and adaptive capacity of people of farmers in slash-and-burn agriculture to use their local knowledge to deal with the effect of pest-diseases on crop yield, their corrective management actions, and adaptive forest-agriculture management in general. Research questions: 6.1 What are the perceptions of climate variability affecting the management of activities in slash-and-burn agriculture? 6.2 What are perceptions and management actions of pest-disease problems on the main crop species? 6.3 How do local agricultural biodiversity knowledge systems help farmers to respond and adapt to the incidence of pests and diseases on crops? 6.4 How do the socio-economic conditions of villages and farmers affect the management actions of pest-disease problems on the main crop species? Hypothesis 6: Local perceptions of climate variability affect farmers’ pest-disease management strategies to respond and adapt slash-and-burn agricultural practices. Objective 7: To synthesise the findings from chapter 2 to chapter 7 by analysing the sphere of conflicts and the paths for integration of knowledge systems at the forest-agriculture interface. Research questions: 7.1 How can pieces of ecological knowledge, both from local and modern groups, be integrated to find a compromise between biodiversity conservation, productivity and forest-agriculture sustainability? 7.2 What are the conflicts between small scale ecological knowledge of agricultural biodiversity and large scale expert agricultural technology development? 7.3 What is the sphere of integration of knowledge systems, innovations and sustainable NRM options at the forest-agriculture interface? Hypothesis 7: Adaptive collaborative management is an appropriate framework for the integration of ecological knowledge of relevant processes, from both local and scientific groups, and for the integration of biodiversity conservation, productivity and agricultural and forest sustainability. 1.5 IMPORTANCE OF THE STUDY The study will help to integrate forest and agriculture issues at the forest-agriculture interface on the forest margin. It is the first time that local knowledge and traditional agroecosystems in humid tropical Africa will be evaluated for inclusion/integration into forest-agriculture options with a focus on maintenance of the biodiversity patterns, agricultural and forest productivity and ecological processes (forest dynamics and recovery). This innovative study is centred at the interface between the dynamics of knowledge systems, the integration of agro-biodiversity
15
knowledge systems, the stakeholders’ involvement in participatory system analysis and the adaptive collaborative management of forest and natural resources in the humid forest zone of southern Cameroon. Other important key issues include the contribution of agricultural biodiversity to millennium development goals (MDG), the management of biodiversity outside protected areas, and the integration of forest regeneration, timber and agricultural productivity components at the forest-agriculture interface. 1.6 STRUCTURE OF THE THESIS The study is divided into eight chapters. Chapter 1 (this chapter) presents the background of the study, the problem statement followed by the general and specific objectives, related research questions and hypotheses, importance of the study, definition of concepts/terms, and the structure of the thesis. Chapter 2 will show how the interplay of knowledge systems and the deployment of slash-and-burn agriculture innovations are affected by the biophysical and socio-economic context, natural resources management options, institutions of knowledge and social learning, and scale of analysis and intervention of resource users at the forest-agriculture interface (objective 1). Chapter 3 will address Local perceptions of nature and natural resources knowledge systems guide the implementation of traditional adaptive local forest management and agricultural practices (objective 2). Chapter 4 will show how the resilience of slash-and-burn agriculture is guided by historical-ecological perspectives of land use patterns and local indicators of slash-and-burn agriculture sustainability (objective 3). Chapter 5 will show agricultural biodiversity is affected by local management of ecological knowledge affecting agricultural and forest productivity, ecological processes (forest dynamics) and species richness patterns within the cropping-fallow-forest conversion cycles (objective 4). Chapter 6 will show how local agricultural biodiversity knowledge is a tool used to satisfy/respond and adapt to market preferences and needs for household consumption and sustainable livelihoods (objective 5). Chapter 7 will show how local perceptions of climate variability affect farmers’ pest-disease management strategies to respond and adapt slash-and-burn agricultural practices (objective 6). Chapter 8 is a general discussion on knowledge systems in developing adaptive forest-agriculture innovations in terms of gap analysis, sphere of conflicts and knowledge integration. It will show how adaptive collaborative management is an appropriate framework for the integration of ecological knowledge of relevant processes, from both local and scientific groups, and for the integration of biodiversity conservation, productivity and agricultural and forest sustainability. It ends with conclusions and recommendations in terms of this thesis. The chapters have been prepared as papers to be submitted for publication, for this reason, the formats may differ from chapter to chapter, and may include duplication because of that.
1.6 REFERENCES Altieri AM. 2002. Agroecology: the science of natural resource management for poor farmers in marginal environments. Agriculture, Ecosystems and Environments 93 (2002) 1-24. Armitage DR. 2003. Traditional Agroecological Knowledge, adaptive management and the socio-politics of conservation in Central Sulawesi, Indonesia. Environmental Conservation 30(1): 70-90.

16
ASB. 1995. Alternatives to Slash and Burn Phase I Report: Forest Margins Benchmark of Cameroon, Alternatives to Slash and Burn Programme. Yaoundé: IITA Humid Forest Ecoregional Centre. ASB. 2000. Alternatives to Slash and Burn Phase II Report: Forest Margins Benchmark of Cameroon, Alternatives to Slash and Burn Programme. Yaoundé: IITA Humid Forest Ecoregional Centre. Berkes F. 2005. Adaptive Collaborative Management and Complexity: Exploring the Many Faces of Collaborative management. Paper for the Adaptive Collaborative management Symposium, Wilfrid Laurier University, February 2005. 4 p. Binswanger H, Pigali P. 1987. Technology Priorities for Farming in Sub-Saharian Africa. Research Observer 3. Borlaug N. 1992. Small-scale agriculture in Africa: the myths and realities. Feeding the future. Newsletter of Sasakawa Africa Association 4/2. Boyle JB. 2001. Can organization learn? Adaptive Management, Confident Decisions and Science. University of Washington Conference, December 2-4, 2001. 10 p. Carlsson B, Jacobson S, Holmén M, Rickne A. 2002. Innovations Systems: Analytical and Methodological Issues. Research Policy 31:233-245. Carrière S. 1999. Les orphelins de la forêt: Influence de l'agriculture itinérante sur brûlis de Ntumu et des pratiques agricoles associées sur les dynamiques forestière du sud Cameroun. These de Doctorat. Montpellier :Université de Montpellier. 448 p. Charyulu AS. 1999. Dissemination of Indigenous Knowledge: A way to Sustainable Agriculture. Faculty Paper. Rajendranagar: National Institute of Agricultural Extension Management Clark N. 2002. Innovations systems, Institutional Change and the New Knowledge Market: Implications for the Third World Agricultural Development. Economics of Innovations and New Technology 11 (4-5):353-368. Colfer CJP (ed.). 2006. The Complex Forest: Communities, Uncertainties and Adaptive Collaborative Management. Washington DC: RFF and Bogor:CIFOR. 370p. Colfer CJP, Dudley RG. 1993. Shifting Cultivators of Indonesia: Marauders or Managers of the Forest? Rice Production and Forest Uses Among The Ula’ Jalan of East Kalimantan. FAO Community Forestry Case Study series No. 6. Rome: FAO. COMBS. 1996. Soil fertility Improvement and Weed Suppression Through Legume-based Technologies. Collaborative Res. Paper No.1. Ibadan: IITA. Conley T, Udry C. 2001. Social Learning Through Networks: The Adoption of New Agricultural Technologies in Ghana. American Journal of Agricultural Economics 83 (3):668-673.
17
Cormier-Salem MC. 1999. Innovations et relations société-environnement. In : Chauveau JP, Cormier-Salem MC, Mollard E (eds.), Innovations en Agriculture : Questions de méthodes et de terrains d’observation. Paris: IRD. pp 127-140. Diaw MC. 1997. Si, Nda bot and Ayong: Shifting Cultivation, Land Use and Property Rights in Southern Cameroon. Rural Development Forestry Network Paper 21e. Diaw MC, Oyono P R. 1998. Dynamiques et Représentations des Espaces Forestiers au Sud Cameroun: pour Une Relecture Sociale Des Paysages. Arbres, Forêts et Communautés Rurales 15/16: 36-43. Diaw MC, Colfer CJP, Prabhu R. 1999. Pour le suivi participatif et la cogestion adaptive des forêts tropicales africaines. Bogor : CIFOR. 14p. Diaw CM, Tiani AM, Nguiebouri J, Jum C, Akwah G, Mala W A, Robiglio V. 2006. Adaptive Collaborative Management in Diverse Contexts, Case 5 Cameroon-Central and South. In: Colfer CJP (ed.), The Complex Forest, communities, uncertainty andadaptive collaborative management. Washington DC: RFF press & Bogor : CIFOR. pp 238-251. Dounias E. 1995. Du jardin au recrû forestier : agroforêts, cueillette et chasse chez les Mvae du Sud-Cameroun (Littoral forestier). In : Proceedings of the Symposium on ‘Recherche et Développement dans les Zones Tropicales Humides d’Afrique Centrale et de l’Ouest’ held in Yaoundé, Cameroun. Ediquist C. 1997a. Systems of Innovations Approaches – Their Emergence and Characteristics. London: Cassell Academic. Ediquist C. 1997b. Systems of Innovations Approaches: Technologies, Institutions and Organizations. London: Printer. FARA. 2004. Sub-saharian Africa Challenge Program: Building Sustainable Livelihoods Through Integrated Agricultural Research for Development, Vol. 1 (June). Accra: Forum for Agricultural Research for Africa. FAO 1999. Sustaining agricultural biodiversity and agroecosystem functions: Farming Systems Approaches for the Sustainable Use and Conservation of Agricultural Biodiversity and AgroEcosystems. Report of International Technical Workshop organized jointly by the Food and Agriculture Organization of the United Nations and the Secretariat of the Convention on Biological Diversity, with the support of the Government of the Netherlands, 2 - 4 December 1998. Rome: Food and Agricultural Organization. FAO. 2005. Forest Resource Assessment 2005. Rome: Food and Agriculture Organization of the United Nations. http://www.fao.org/forestry/foris/webview/ forestry2/index.jsp. Fujisaka S, Escobar G. 1997. Vers une classification pratique des systèmes d’agriculture itinérante sur brûlis. Réseau foresterie pour le développement rural (RFDR) Number 21c.

18
Garrity D, Bandy D. 1995. A Global Focus on Alternatives To Slash and Burn. In: LiYu X, YuangZhang Y, JinHui Q. (eds.), Proceedings of an International Symposium on Alternatives to Slash-and-Burn Agriculture held in Kunming, PR. China, 6-16 March 1995. pp 52-58. GEF. 1993. Global Alternatives to Slash and Burn. New York: Global Environment Facility/United Nations Development Program (GEF/UNDP). 87 p. Geldenhuys CJ. 2000. Ecological processes the basis for sustainable nature conservation. Plantlife 23: 2-4. Gockowski J, Tonye J, Baker D, Legg C, Weise S, Ndoumbé M , Tiki-Manga T, Fouaguegué A. 2004. Characterization and diagnosis of farming systems in the ASB forest margins Benchmark of Southern Cameroon. Study Resport. Ibadan: IITA. 67 p. Gockowski J, Tonye J, Diaw MC, Hauser S, Kotto-Same J, Njomgang R, Mounkam A, Nwaga D, Tiki-Manga T, Tondoh T, Tchoundjeu Z, Zapfack L. 2005. The Forest Margins of Cameroon. In: Palm CA, Vosti AS, Sanchez AP, Polly JE (eds.), Slash and burn agriculture: the search for alternatives. New York: Columbia University Press. pp 305-331. Gunderson LH, Holling CS. 2002. Panarchy, Understanding Transformations in Human and Natural Systems. Washington DC: Islands Press. 507 p. Guyer IJ. 1982. Family and farm in Southern Cameroon. African Research Studies N°15. Boston: Boston University/African Studies Center. Holling C. 2001. Understanding the complexity of economic, ecological and social systems. Ecosystems 11:41-47. Instone L. 2003a. Shaking the Ground of Shifting Cultivation: Or Why (Do) We Need Alternatives to Slash-and-Burn? Resource management in Asia-Pacific Program Working Paper No.43. Camberra: Research School of Pacific and Asian Studies/The Australian National University. Instone L. 2003b. T(r)opical Translations : Reterritorialising the space of Biodiversity Conservation. Resource management in Asia-Pacific Program Working Paper No.46. Camberra: Research School of Pacific and Asian Studies/The Australian National University. Laxman J, Shrestha P, Moss C, Sinclair FL. 2004. Locally derived knowledge of soil fertility and its emerging role in integrated natural resource management. In: Van Noordwijk M, Cadisch G, Ong CK (eds.), Belowground Interactions in Tropical Agroecosystems: Concepts and Models with Multiple Plant Components. London: CABI. Lefroy EC, Hobbs RJ, O’Connor MH, Pate JS (eds.). 1999. Agriculture as a mimic of natural ecosystems. Agroforest. Sys. 45: 275-289.
19
Levang P, Michon G, De Forestra H. 2001. De la jachère arborée aux agro-forêts, des stratégies paysannes adaptées à des milieux de fertilité médiocre. In : CIRAD, Ministère de la coopération (eds.), Actes du Séminaire sur Fertilité du milieu et Stratégies paysannes sous les tropiques humides’ 13-17 novembre 1995. Montpellier : France. Mala WA, Oyono PR. 2004. Some dimensions of local practices of natural management in Southern Cameroon. Research Review NS 20.2 (23-31). Mala WA, Oyono PR, Ebene Y, Diaw MC. 2003. Assessing of the Context of Forest Agriculture and the Dynamics of Landscape Changes in Southern Cameroon. Scientific Report. Yaoundé : CIFOR. 34 P. Mala WA, Zoa F, Biyong M, Abéga P, Ela CV, Oyono PR, Diaw MC. 2006. Perceptions et connaissances locales des systèmes de gestion des forêts au Cameroun Méridional: instruments de prise de décision et d’aménagement durable. Rapport final de projetpour le copmte du Projet de réhabilitation et redynamisation de la station de recherche d'Ipassa/Makokou. Yaoundé: CIFOR. McNeel JA. 2004. Nature vs. nurture: managing relationships between forests, agrorestry and wild biodiversity. Agroforestry systems 61:155-165. Michon G, De Laforesta G. 1999. Agroforests : incorporating a forest vision in agroforetry. pp. 381-406. In: Buck LE, Lassoie JP, Fernandes ECM (eds.), Agroforestry Systems. Boca Raton: CRC Press. MEA. 2005. Living Beyond Our Means: Natural Assets and Human Well-Being. Statement from the Board of Millennium Ecosystem Assessment. Washington DC: Island Press. MINEF. 1996. Conservation, gestion et valorisation de la biodiversité et des ressources forestières. Rapport d’étude. Yaoundé : Ministère de l’Environnement et des Forêts du Cameroun. Nancy JT, Davidson-Hunt IJ, O’Flaherty M. 2003. Living on the Edges: Ecological and Cultural Edges as Sources of Diversity For Socio-Ecological Resiliences. Human Ecology Vol. 31.No. 3 September 2003. Nolte C, Duguma B, Wendt J. 1997. Research and development of fallows in the humid forest zone of Cameroon. A working paper prepared for the launching of EPHTA Humid Forest Margins Benchmark, Yaoundé, Hilton, May 26-28, 1997. O’brien W. 2002. The nature of Shifting Cultivation: Stories of Harmony, Degradation, and Redemption. Human Ecology 30(4): 483-502. OECD. 1999. Managing National Innovations Systems. Paris: Organization for Economic Cooperation and Development.
20
Olsson P, Folke C, Berkes F. 2004. Adaptive co-management for building resilience in socio-ecological systems. Environmental Management (34): 75-90. Oyono PR, Mala AW, Tonyé J. 2003a. Rigidity versus adaptation: Contribution to the debate on agricultural viability and forest sustainability in Southern Cameroon. Culture and Agriculture Vol. 25. No.2. Fall 2003. Oyono PR, Akwah G. Diaw MC, Jum C, Tiani A-M, Mala WA, Assembe S, Nguiébouri J, Ebene Y, Efoua S, Kouna C. 2003b. Developing Collaborative Monitoring for Adaptive Co Management of Tropical Forests (ACM). Final Report – Cameroon. Yaoundé;Center for International Forestry Research (CIFOR). Oyono PR, Diaw MC, Efoua S, Mala WA, Assembe S. 2007. Issue-Appropriate Collaborative Monitoring: Examples From Forest Management in Cameroon. In: I. Gujit (ed.), Learning from Collaborative Monitoring: Triggering Adaptation in Adaptive and Collaborative Management (ACM)"., Bogor: CIFOR. Palm AC, Vosti AS, Sanchez AP, Ericksen J P (eds.). 2005. Slash and Burn Agriculture: Search for Alternatives. New York: Columbia University Press 461 p. Plummer R, Armitage D. 2006. A resilience-based framework for evaluating adaptive co-management: Linking ecology, economy and society. E c olo g i c a l e c o n o m i c s 6 1 ( 2 0 0 7 ): 6 2 – 7 4. Prabhu R. 2003. Developing collaborative monitoring for adaptive collaborative management of African Forests. Final Report, of the January 1, 2000-December 31, 2002. Harare: CIFOR. Pretty JN. 2002. Agri-culture: Reconnecting People, Land and Nature. London: Earthscan. Pretty JN. 2006. Agroecological Approach to Agricultural Development. Section Report prepared for the World Development Report 2008. Rimsip-Latin American Center for Rural Development. 37 p. Pretty JN, Smith D. 2004. Social capital in biodiversity conservation and management. Conservation Biology 18(5): 631-638. Roseboom H. 2004. Adopting an Agricultural Innovations System Perspective: Implications for ASARECA’s Strategy. Entebbe: ASARECA. Roux DJ, Rogers KH, Biggs HC, Ashton PJ, Sergeant A. 2006. Bridging the Science-managing divide: moving from unidirectional knowledge transfer to knowledge interfacing and sharing. Ecology and Society 11(1):4. Ruitenbeck J, Cartier C. 2001. The Invisible Wand: Adaptive Co-Management as an Emergent Strategy in Complex Bio-economic Systems. Occasional paper No. 34. Bogor: Centre for International Forestry Research.
21
Sanchez AP, Palm AC, Vosti AS, Tomich PT, Kayoski J. 2005. Alternatives to Slash and Burn: Challenge and Approaches of an International Consortium. In: Palm AC, Vosti AS, Sanchez AP, Ericksen JP (eds.), Slash and Burn Agriculture: Search for Alternatives. New York: Columbia University Press. pp 3- 37. Scheffer M, Westley F, Brock WA, Holmgren M. 2002. Dynamics Interactions of Societies and Ecosystems-Linking Theories from Ecology, Economy and Sociology. In: Holling CS, Gunderson LH (eds.), Panarchy: Understanding Transformations in Human and Natural Systems. Washington DC: Island Press. Sonwa JD. 2004. Biomass management and diversification within cocoa agroforests in the humid forest zone of Southern Cameroon. PhD Dissertation. Bonn: Universitat Bonn. 112 p. Spielman JD. 2005. Innovations Systems Perspectives on Developing-Country Agriculture: A critical Review. ISNAR Discussion Paper 2. Spielman JD. 2006. Systems of Innovations: Models, Methods, and Future Directions. Innovations Strategy Today 2(1):55-66. www.biodevelopment.orginnovations/index.htm. Van Noordwijk M, Kurniatun H, Weise S. 2001. Sustainability of tropical land use systems following forest conversion. ASB Lecture Note 3. December 2001 Bogor:ICRAF. Wallington TJ, Hobbs RJ, Moore SA. 2005. Implication of Current Ecological Thinking for Biodiversity Conservation: A Review of the Salient Issues. Ecology and Society. Wiersum KF. 2004. Forest gardens as an ‘intermediate’ land uses system in the nature-culture continuum: Characteristics and future potential. Agroforestry Systems 61: 123-134. Woodley E. 2005. Local and indigenous ecological knowledge as an emergent property at a complex system: A case study in the Solomon Islands. In: CIP-UPWARD, IDRC, IFAD (eds.), Source Book on Participatory Research and Development.. Zhang Xin and He PiKun. 1995. Advantages and limitations of slash and burn system of agriculture and its countermeasures. In: LiYu X, YuangZhang Y, JinHui Q(eds.), Alternatives to Slash-and-Burn Agriculture. Kunmimg: China. pp 50-51.
22
CHAPTER TWO
FOREST AGRICULTURE INNOVATIONS: KNOWLEDGE BASE AND FIELD PROCESSES
2.1 INTRODUCTION Over the last two decades, there have been some radical changes at international level regarding the understanding of the relationships between economic growth, development, environment and natural resources management. In the tropical world, these changes are driven by the necessity to reverse the trends of deforestation, forest degradation and biodiversity loss and to reduce related poverty (ASB 1995, 2000; CARPE 2001). These changes have been accompanied by the promotion of the concept of sustainability (GEF 1993; Garrity and Bandy 1996; Palm et al. 2005). The tropical forest margin represents an important niche where the relationships between forest and agriculture have been seen in a conflictual perspective with the issue of forest agriculture or ‘slash and burn’ (ASB 1995; IITA 1999; Instone 2003; Sanchez et al. 2005; Palm et al. 2005; Ickowitz 2006). The urgent need is to reconcile the maintenance of forest ecosystem services, to conserve forest resources and biodiversity, and to improve the performance of forest agriculture and agricultural landscape mosaics. This forms the critical triangle of sustainable forest agriculture (ASB 2000; Palm et al. 2005). In Central Africa, over the past decade, the main entry point to integrate conservation-development at the forest-agriculture interface was made through technological intervention and development of policy options that would be able to mitigate the impact of small scale agriculture on deforestation (Binswanger and Pigali 1987; Borlaug 1992; ASB 1995, 2000; FAO 1999; Gockowski et al. 2004). However, on the fringe of these scientific deployments, the current approaches in research and development (R&D) expected to lead to sustainable outcomes have been seriously questioned. The gap observed between the conceptualisation of global paradigms such as deforestation, biodiversity and conservation, and the scale of agro-ecosystem analysis and intervention was the major issue (Alson et al. 1995; Diaw et al. 1999; Oyono et al. 2003a). Moreover, the transposition of these paradigms in the context where the relationships between agriculture, nature and people is still insufficiently understood, is also questionable (Chauveau 1999; Gu-Konu 1999; Instone 2003; Ickowitz 2006; Pretty 2006). These factors partly justify the limited impact of the transfer-of-technology and adoption of improved forest-agriculture land use options (Chambers 1997; Cormier-Salem 1999; Adesina et al. 2000; Altieri 2002). Meantime, the recent advances made in systems thinking and innovative systems approaches indicate the possibility to overcome these limits and to improve the performance of agricultural landscape mosaics. These scientific advances are presented below with supporting evidence. The studies of complexity and adaptive co-management of natural resources show that sustainability is evident only at the ‘socio-ecological system’ i.e. the composite emergent framework of human actions that seek to harness the productive potential of living natural systems, and the ecological responses of these systems to those interventions (Kay and Schneider
23
1994; Gunderson et al. 1995; Ruitenbeck and Cartier 2001; Prabhu 2003; Colfer 2005; Plummer and Armitage 2006). The introduction of new thinking on non-equilibrium in natural systems shows that natural systems follow nonlinear processes and that they have their own adaptive capacity even when they have been disturbed by human activities (Geldenhuys 2000; Wallington et al. 2005). The systems thinking and practices in agriculture show that the challenge to improve the conventional practices in agricultural extension should be addressed through horizontal processes starting from the problem analyses to monitoring-evaluation of outcomes supported by a learning cycle (Bawden 1991). The emergence of innovative systems approaches with a potential challenge to improve how society generates, utilizes and disseminates knowledge is more likely to lead to sustainable social and economic gains (Benchaïm and Schembri 1996; Ediquist 1997a,b; Spielman 2006). The paradigms of public participation need to be used not only as an added value process to collect data, but more importantly as a process that catalyzes sustainable social change and improvement of governance (Chambers 1997; Buchy and Hoverman 2000). In particular, the challenge to address forest-agriculture via innovative systems should put forward the complex relationships between societies, knowledge, and institutions of social learning and change. This challenge represents an alternative way to understand how society generates, utilizes and disseminates knowledge to improve social and economic gains. This is also the opportunity to analyze how it is possible to address a new class of natural resource management problems for which conventional approaches to assess and manage agro-ecosystems are ill equipped (Ruitenbeck and Cartier 2001; Prabhu 2003). In this chapter, the concept of innovation refers to new and original ways of doing things that changes the current thinking, improves the performances of practices and/or the social and economic gains. The concept of improvement refers to a change resulting from the introduction of innovations that makes something better or adds to its value. Development refers to a process of creating, testing and maintaining opportunity in order to improve income and livelihoods. These opportunities can be either technical, market oriented or socio-organizational. Development is generally boosted by the introduction of innovative improvements (Holling et al. 2002 cited in Colfer 2005).
In the humid forest zone of southern Cameroon, agricultural technology improvement and policy options face the same challenges of social feasibility. In fact, their scientific orientations have been dictated by the adoption of technological schemes that were applied equally to all farmers (Matike 1990; Adesina et al. 2000; Mala and Endamana 2001). However, such a scientific orientation, also based on the socio-psychological notions of individual decision making, does not integrate the concepts of distribution of the natural resource base, the structure of decision making ranging from the individual to the community, and market access. In several cases, the context of high biodiversity at the forest-agriculture interface is not taken in account to understand the decision-making and the roles of social institutions behind the management of natural resources (Diaw 1997; Diaw and Oyono 1998; Oyono et al. 2003a; Mala and Oyono 2004). Furthermore, the critical questions encountered by this expert approach of technology improvement have not yet been examined in relation to innovative systems approaches (Mala and Diaw 2001; Mala et al. 2003; Mala and Sogbossi 2004). Such questions include: (i) At what level would natural resources management lead to relevant sustainable forest-agriculture outcomes? (ii) What are the observed limits to the current focus on mono-cropping or single-species crops or

24
on a single agricultural land use in terms of sustainable outcomes? (iii) What are the weaknesses of the current monitoring-evaluation indicators of well-being, livelihood, and changes in forest landscape mosaics? Several studies have already mentioned the resilience, adaptability, rationality and dynamics of traditional social institutions, and their ability to contain social change within the boundaries of a set of fundamental institutional and land tenure principles. These studies also confirmed their validity as vehicles of sustainable community-based development and livelihood strategy (Diaw 1997; Diaw and Oyono 1998; Vermeulen and Karsenty 2001). However, the linkages between livelihoods, institutions of knowledge and learning, income generation and social organisations - as vectors of changes over time - have received no attention. Lastly, the recent emergence of adaptive collaborative management (ACM) is a new opportunity to understand and identify gaps in the knowledge base of traditional R&D approaches. CIFOR (2003) defines ACM as a value-adding approach whereby people who have 'interests' in a forest, agree to act together to plan, observe and learn from the implementation of their plans (recognizing that plans often fail to fulfil their stated objectives). As an additional new framework for integration, ACM is characterized by conscious efforts among such stakeholder groups to communicate, collaborate, negotiate and seek out opportunities to learn collectively about the impacts of their actions (Prabhu 2003). With these issues in mind, the objective of this chapter is to characterize sustainable forest-agriculture innovations at the forest-agriculture interface in terms of structure, organization and processes. A number of questions arise concerning the research themes and processes associated with forest-agriculture: What are the R&D themes associated with sustainable forest-agriculture? What are the processes supporting the development of forest-agriculture innovations at spatio-temporal scales? How do stakeholders interact to develop forest-agriculture innovations which would integrate livelihood needs, institutions of knowledge and learning, social organisations and income improvement? What are the emerging forest-agriculture innovations which were derived from agroecosystem analysis over the past decade at the forest-agriculture interface? What have been the operational limitations of these processes in relation to the social demand for innovations? To what extent did the introduced agricultural and agroforestry land uses and technologies adapt to local agricultural biodiversity knowledge systems? The general hypothesis in this chapter is that the interplay of knowledge systems and the deployment of forest-agriculture innovations is affected by the biophysical and socio-economic context, natural resources management options, institutions of knowledge and social learning, and scale of analysis and intervention of resource users at the forest-agriculture interface. 2.2 METHODS 2.2.1 Description of study area The study was conducted within the forest margins benchmark (FMB) area in the humid forest zone of southern Cameroon (Figure 2.2.1), designed by the Alternatives to Slash and Burn (ASB ASB is the acronym for the Alternatives to Slash and Burn Programme, a world-wide programme involving more than 50 national and international institutions and NGOs around the world) programme (Gockowski et al. 2004, 2005). The 15 500 km2 benchmark area covers gradients in

25
both intensity of resource use and population density. The intensity of resource use is defined by the length of fallow which increases from the Yaoundé block (3.9 years), through the Mbalmayo block (5.4 years) to the Ebolowa block (7.5 years), The population density decreases from the Yaoundé block, with 30 to 90 people per square kilometer, through the Mbamayo block, with 10 to 30 people per square kilomter, to the Ebolowa block, with less than 10 people per square kilometer, corresponding to high, medium and low levels of the population density gradient. This gradient is associated with varying degrees of agricultural intensification, institutional development and environmental degradation. The Ebolowa block in the south has a low population density and large tracts of intact primary forest (59% of land cover). The Yaoundé block in the north has more land in the different phases of the agricultural cycles, with only 4% of the land remaining covered by primary forests. There is a high variation in the contribution of agricultural and non agricultural products towards farmer’revenue across both blocks and villages (Gockowski et al. 2004, 2005). The contribution of non-agricultural income (including bushmeat, fish, honey, basketry, forest foods, palm wine and medicinal plants) to household income, when compared to income from agriculture, increased significantly from the north to the south in the benchmark area, from 20% up to 44% (Ndoye et al. 1997, 1999; Dijk 1999; Ndoye and Tieguhong 2004).
Figure 2.2.1 The ASB forest margins benchmark area in southern Cameroon (Gockowski et al. 2005). The landscape of the benchmark area is a complex mosaic of nine predominant land uses (described in more detail in Chapter 1, Section 1.3). Cocoa is the primary source of farm income, followed by plantain, cassava, cocoyams and groundnuts; with food crops grown mainly to meet subsistance needs and to generate income where the market access is manageable (Gockowski et al. 2004). However, local agricultural markets are comparatively small, agricultural inputs are simple, road infrastructure is poor and not maintained. There is a significant reliance on natural resource-based activities, such as gathering of non-wood forest products such as bushmeat, wild fruits, lianas, and tree bark, to mention a few (Gokowski et al. 2005). The recent introduction of
26
improved oil palm varieties has generated a rapid expansion of its cultivation in the study area as a alternative to cocoa and as a source of income, under the leadership of urban elites and state projects (Abega 2007). The spread of farmers’ organizations in the study area is also an important issue that could affect the processes of improvement of forest-agriculture land use options (Oyono and Diaw 1999). 2.2.2 Sampling methods There are 45 villages within the humid forest benchmark area distributed equally in the three blocks. Each block was delineated to contain only 15 villages (ASB 2000). Three different sets of samples of villages were used to collect the data for this chapter. For set one, 21 villages were selected and distributed equally in the three blocks (seven villages per block) in order to capture the deployment of R&D activities conducted at the forest-agriculture interface during the past 10 years. The major criteria for the selection of villages were the intensity of research activities. The intensity of research activities was measured by three categories based on the monthly duration of the interventions, as follows: low = three days of activities; medium = one week of activities; high = more than 10 days of activities, including a report of the field activities. For each block, a matrix was used to categorize each village as having low, medium or high intensity of research activities, using the different criteria. In each block the villages with the high category were retained. Within these ‘high’ villages a random selection of seven villages was made because the hypothesis was to see how the outcomes of the interplay of knowledge systems to forest-agriculture innovations are affected by the biophysical and socio-economic context, knowledge base and field processes. When there were less than seven villages in the high category, additional villages were selected at random from the medium category. In each selected village, a focus group was formed to participate in the discussions around the relevant parameters within the questionnaire. The focus groups were composed of 13-17 persons, selected on the basis of socio-diversity within each village, and not based on the total population of each village (data were not available on total population of selected villages). The socio-diversity was based on (i) age (young i.e <30 years old, adult i.e 30 to 60 years old; and old i.e >60 years old); (ii) gender, considering the balance between males and females, because they are conducting different types of activities and have different perspectives; (iii) people who were directly involved in the research activities via on-farm research; (iv) people belonging to a farmer-to-farmer organization because all the farmers organizations were linked in a network, and (v) people of specialized user groups such as hunters, fishermen and “artisanal” loggers, selected on the advice of villagers because of their good knowledge of the village territory, their availability in time and their capacity to contribute to discussion. Within each village, a list of potential persons was compiled per category. Based on the number of categories per village, persons were randomly selected from each category to make up the number of 13 to 17 per focus group. For set two, the two top villages in terms of the higher intensity R&D activities, from the seven villages selected for set one, were selected per block. In each selected village, five households were sampled to give a total of 30 households (5*6=30) for the study. The purpose was to evaluate the trends of forest-agriculture innovations introduced, abandoned, and adopted over the past 10 years. In each selected village, the five households were selected based on the criteria of
27
their participation in the development and utilization of the innovations. These criteria included three categories: (i) farmers involved in on-farm research and testing the innovations; (ii) farmers who were not directly involved in on-farm research but who have received benefits from on-farm research and have tested them; (iii) those who were not involved in any activity and who did not test any innovations. A list of names of respondents in each category was compiled to select respondents based on the estimated proportion of each group (category) over the total numbers given by each village. These households were invited to participate in the group interviews. For set three, one village was selected per block from the two villages selected for set two, for the evaluation of adaptive collaborative management parameters. The major criterium for selection was the highest intensity of R&D over the 10 years. An additional criterion was that the village must have been involved during the third phase of the ASB programme conducted between 2000 and 2004. In each selected village, focus groups of 15-20 people were formed. Persons were selected based on their level of participation in the development and utilization of the innovations (as in set two). At first all the persons who have participated in the individual interviews in the set two discussions were automatically included. These numbers were complemented with additional persons randomly selected from the three categories following the same procedure as for set two. 2.2.3 Data collection The data were collected via a semi-structured and structured questionnaire (Appendix 1, Section 1 and 2), that was administrated to individual respondents and to three rounds of focus group discussions. The first round of the interviews covered sections 1 to 4 of Appendix 1 for the 21 villages: (i) Socio-economic information of villages and of households’ respondents (Appendix 1, Section 1). The responses were based on group consensus, i.e. a maximum of 21 responses for each of the four parameters. The categories of response for each of the parameters were defined as follows: a. Information for villages: (i) Block (Yaoundé=high, Mbalmayo=medium, Ebolowa=low); (ii) Village name ; (iii) Distance to the closest market estimated in Km); (iv) Distance to the most important market(s) estimated inKm; (v) Perception of market access (bad; manageable good; (vi) Availability of rainfall data; (vii) Intensity of contacts with extension services (one visit per month; 2-3 visits per month; four or more visits per month); (viii) Socio-diversity (internal: 1-2 clans/lineages; 3 clans/lineages; more than 3 clans or lineages; external: 1-2 active external stakeholders i.e. not village members such as researchers, agricultural extension workers, state workers; 3-4 active external stakeholders; more than 4 active external stakeholders). b. Information on household respondents: (i) Name of respondent;(ii) Main occupation with three categories (peasant farmer; retired civil servant; civil servant); (iii) gender with two categories; (iv) marital status with three categories (married; single; widow); (v) age (extimated in years: <30; 30-45; >45); (vi) education level with four categories (never being to school; primary education; secondary education; tertiairy education); (vii) belonging to social organizationswith two categories (yes; no); (viii) family or household size with four categories (1-4 persons; 5-8 persons; >8 person); (ix) natural capital i.e. estimated land owned (ha) with four

28
categories (5-10 ha; 10-15ha; 15-20ha; >20 ha); (x) financial capital (CFA local currency) with three categories (<250000; 250000-300000; >350000). (ii) Information on R&D themes at the forest-agriculture interface (Appendix 1, Section 2). The analysis was based on the individual responses, i.e. the number of responses was the number of individuals who participated at the 21 villages. A list of seven potential themes was proposed to farmers based on a literature review. The seven themes included soil fertility, and the six most important crops: peanuts/groundnuts (Arachis hypogea); cassava (Manihot esculenta); melon (Cucumeropsis mannii); plantain (Musa paradisiaca); cocoa (Theobroma cocoa); and cocoyam (Dioscorea spp). This list was reviewed and updated by farmers in each village, adding crops and themes specific to the village. Each theme was assessed on the basis of three major types of innovation, as follows: (a) technical orientation, based on increased yield in terms of agronomic, agroforestry and forestry production, with main focus on new crop varieties; (b) commercial orientation, based on the structure of market chains, including the introduction of collective ways of selling, improvement of post-harvest technologies and crop processing, and the introduction of market-oriented crops such as maize and horticultural crops; (c) socio-organizational orientation, based on the capacity building of local communities to participate in R&D in terms of negotiation, planning, implementation, monitoring and evaluation. (iii) Information on the nature of farmers’ participation in the field research approaches and major orientation of innovations (Appendix 1, Section 3). The analysis was based on individual responses, as for Section 2. Four field approaches were defined: (a) passive on-farm research (technology is designed by external agent and it is tested on the farmer’s farm and articulation of the solution does not necessarily depend on the farmer’s participation); (b) semi-active on farm research (the farmer’s agro-ecological knowledge is the base of collaborative research processes and he is the one leading the research based on scientific principles); (c) participatory agricultural technology development (farmers are involved in all steps of the research process, including problem analysis, identification of solutions, implementation, up to the follow-up); (d) participatory monitoring and evaluation of the farmer’s technology (the farmer’s agroecological knowledge is documented over time but with no impact on the farmer’s normal activities). Each field approach was assessed in terms of the major orientation of the innovation (technical, commercial and socio-organizational). In each village, the farmers listed all the organizations (being formal or informal) that have initiated, facilitated and funded R&D activities in their village for the past ten years. Then, each organization was linked to the four field approaches. The institutions were later grouped based on their external linkages, such as State, NGOs, research institutes, vocational and training centres, and farmers’ organizations. (iv) Information on the level of participation of farmers involved in a given R&D activity (Appendix 1 section 4). The information was collected based on the number of activities in which the three levels of decision-making (village, household or individual level) were effectively involved with over the total number of activities conducted in a village per the type of innovation (i.e technical, commercial and socio-organizational), per each of the three phases of the innovation processes (planning, implementation, monitoring and evaluation) and per each of the three scales of intervention (individual, farmer group and village community). The second round of interviews covered five households per selected two top villages per block, i.e. 30 households (5*6=30), using Appendix 1 section 5. The households were interviewed to
29
capture the trends of innovations introduced, abandoned and those which have probably increased their yield/income, and increased the quantity of food available (see Appendix 1, Section 5). The observations analysed included responses from individuals within the group (for the trends of innovation management and the social demand for improvement) and for the whole group (for social demand for improvement). The trend in innovation management was assessed as follows: (a) In each village, each selected household listed the innovations introduced, abandoned and those that have improved the yield/income. Then the selected household classified each of the innovations according to one of three types of innovations (technical, commercial or social-organizational) already defined in the previous sub-section of the questionnaire. For each innovation listed, its presence during different periods was indicated. The time frame covered 10 years and was divided into three periods (today or current; five years ago; ten years ago. (b) In each village, the social demand for improvement was assessed as follows: the five households selected plus other farmers who have participated to review and validate the information captured from the individual interviews on social demand for improvement. The list of improvements was validated and a ranking was made based on group consensus. This was made on the basis of their knowledge of technical, socio-organizational and market constraints, and the potential impact of this demand of improvement on both livelihood and income generation. The third round of interviews involved the focus group (15-20 people) from the top village per block to evaluate the six parameters of adaptive collaborative management (ACM) resulting from stakeholder involvement in R&D processes (Appendix 1, Section 2). The assessment was based on the general consensus of rating (low, medium and high) within each of the three focus groups. The information collected was based on the definition of each of the six ACM parameters, adapted from the definitions made by Colfer (2005), as follows: (i) horizontal collaboration and openness to institutional pluralism as: low = no requests from community and no local actions are taken; medium = requests from community and disparate local actions are taken; high = demands expressed by community and local actions are taken with a framework of indicators for monitoring; (ii) Vertical collaboration categorized as low = disparate interactions and lack of two-way communication; medium = interactions are effective and the two-way communications are made but through inappropriate channels; high = interactions are effective and the two-way communications are functional; (iii) Sharing of methodologies and mutual learning categorized as low = no platform or sessions to share lessons, successes and failures and there are many conflicts due to misunderstanding between stakeholders; medium = platforms exist to share lessons, successes and failures, but they do not function and lessons are not used in new planning; high = platforms exist to share lessons, successes and failures, and new planning of intervention are made based on such lessons; (iv) Level of conflicts/resistance to improvement categorized as low = the why, what and whom are not discussed and not defined but based on stakeholders’ power and position; medium = the why, what and whom are discussed and defined but the stakeholders are not using their power and position to test the solutions; high =the why, what and whom are discussed and defined; and stakeholders’ power and position are used to test, monitor and evaluate the level of conflicts; (v) Conflict resolution categorized as low = mechanisms are not defined; medium = mechanisms are defined but not applied; high = mechanisms are defined and rules are applied;
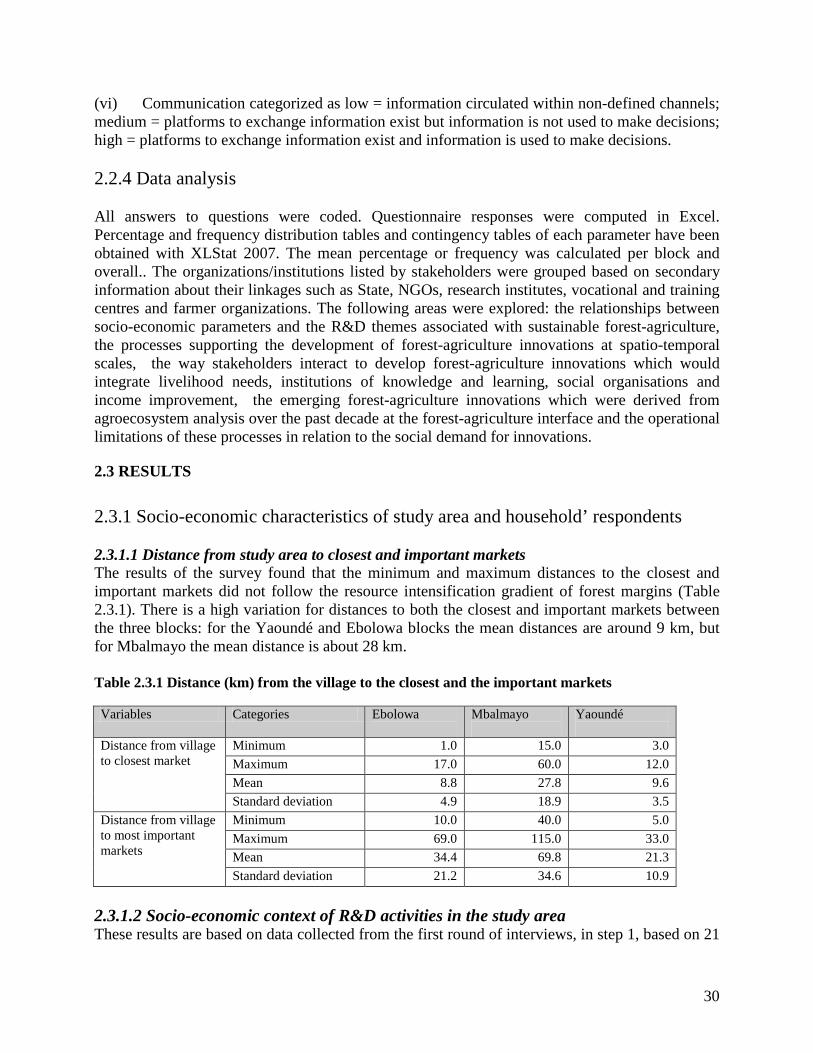
30
(vi) Communication categorized as low = information circulated within non-defined channels; medium = platforms to exchange information exist but information is not used to make decisions; high = platforms to exchange information exist and information is used to make decisions. 2.2.4 Data analysis All answers to questions were coded. Questionnaire responses were computed in Excel. Percentage and frequency distribution tables and contingency tables of each parameter have been obtained with XLStat 2007. The mean percentage or frequency was calculated per block and overall.. The organizations/institutions listed by stakeholders were grouped based on secondary information about their linkages such as State, NGOs, research institutes, vocational and training centres and farmer organizations. The following areas were explored: the relationships between socio-economic parameters and the R&D themes associated with sustainable forest-agriculture, the processes supporting the development of forest-agriculture innovations at spatio-temporal scales, the way stakeholders interact to develop forest-agriculture innovations which would integrate livelihood needs, institutions of knowledge and learning, social organisations and income improvement, the emerging forest-agriculture innovations which were derived from agroecosystem analysis over the past decade at the forest-agriculture interface and the operational limitations of these processes in relation to the social demand for innovations.
2.3 RESULTS 2.3.1 Socio-economic characteristics of study area and household’ respondents 2.3.1.1 Distance from study area to closest and important markets The results of the survey found that the minimum and maximum distances to the closest and important markets did not follow the resource intensification gradient of forest margins (Table 2.3.1). There is a high variation for distances to both the closest and important markets between the three blocks: for the Yaoundé and Ebolowa blocks the mean distances are around 9 km, but for Mbalmayo the mean distance is about 28 km. Table 2.3.1 Distance (km) from the village to the closest and the important markets Variables Categories Ebolowa
Mbalmayo
Yaoundé
Distance from village to closest market
Minimum 1.0 15.0 3.0 Maximum 17.0 60.0 12.0 Mean 8.8 27.8 9.6 Standard deviation 4.9 18.9 3.5
Distance from village to most important markets
Minimum 10.0 40.0 5.0 Maximum 69.0 115.0 33.0 Mean 34.4 69.8 21.3 Standard deviation 21.2 34.6 10.9
2.3.1.2 Socio-economic context of R&D activities in the study area These results are based on data collected from the first round of interviews, in step 1, based on 21

31
village responses representing 395 observations (individual responses). There were more people in the focus groups than were planned for in the methodology, although the procedure for selection was the same. The perceptions of the farmers on the socio-economic characteristics of their area varied between the different blocks and parameters (Table 2.3.2). Market access is manageable in Ebolowa and Yaounde and manageable to good in Mbalmayo. Very few respondents in all three blocks when considered market access as bad. The majority of respondents in Ebolowa and Yaounde reported 1 to 2 contacts (low intensity) with the extension service, and in Mbalmayo the intensity of contact was low to medium (2-3 visits per month). The socio-diversity per block is generally high internally (more than three clans or lineages) and externally (more than four external stakeholders). Involvement of the population in the R&D activities (with three different assessments regarding technical, commercial/market and socio-organizational aspects) shows the same proportions in all three blocks: very low (less than 6% of population) in technical aspects; very high (>90%) in commercial/market aspects and high (>70%) in socio-organizational aspects.
Table 2.3.2 Socio-economic context of R&D activities in the study area Parameters Categories* Ebolowa
N=117 Mbalmayo N=132
Yaoundé N=146
% of responses Market access Bad 16.7 16.7 14.3
Manageable 50.0 33.3 71.4 Good 33.3 50.0 14.3
Contact with extension services
Low 80.0 55.0 80.0 Medium 15.0 40.0 15.0 High 5.0 5.0 5.0
Internal socio-diversity
Low 5.0 2.0 5.0 medium 25.0 18.0 25.0 high 70.0 80.0 70.0
External socio-diversity
low 5.0 2.0 5.0 medium 25.0 18.0 25.0 high 70.0 80.0 70.0
Proportion of village population involved in the R&D activities
Technical 5.0 6.0 4.0 Commercial / market 100.0 90.0 95.0 Socio-organizational 60.0 65.0 75.0
*Explanations: Intensity of contacts with extension services (low=up to one visit per month; medium=2-3 visits per month; high =4 visits per month); Socio-diversity (Internal: low =1-2 clans/lineages; medium =3 clans/lineages; high = more than 3 clans/lineages; External: low =1-2 active external stakeholders; medium =3-4 active external stakeholders; high =more than 4 active external stakeholders); Number of respondents (N=395)[ N=117 (15 persons*4 villages + 17 persons*1 village + 20 persons*2 villages); N=132 (18*4+20*3); N=146 (19*4+20*3)]. 2.3.1.3 Socio-economic profile of household’ respondents The socio-economic profile of the respondents (Table 2.3.3) indicates that 64.6% were peasant farmers; 77.7% were female; 92.2% were married; 70.5% were more than 45 years old; 54.7% had gone to secondary education school; 95.8% belonged to social organizations; 44.3% had a family size ranging from 5 to 8 members; 55.2% had an estimated land area of more than 20 ha; 65.2% had an estimated annual revenue of more than FCFA350,000 (local currency with 1USD=540 FCFA). There is much variation between blocks for each of the variables (Table 2.3.3).
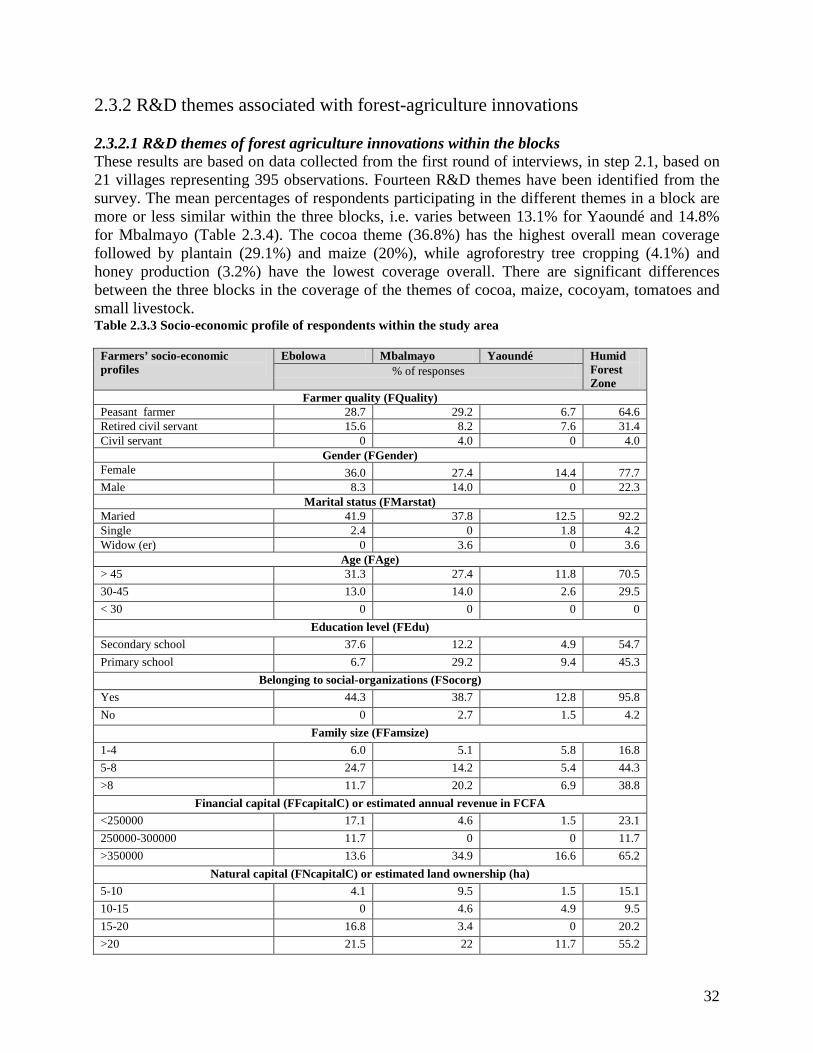
32
2.3.2 R&D themes associated with forest-agriculture innovations 2.3.2.1 R&D themes of forest agriculture innovations within the blocks These results are based on data collected from the first round of interviews, in step 2.1, based on 21 villages representing 395 observations. Fourteen R&D themes have been identified from the survey. The mean percentages of respondents participating in the different themes in a block are more or less similar within the three blocks, i.e. varies between 13.1% for Yaoundé and 14.8% for Mbalmayo (Table 2.3.4). The cocoa theme (36.8%) has the highest overall mean coverage followed by plantain (29.1%) and maize (20%), while agroforestry tree cropping (4.1%) and honey production (3.2%) have the lowest coverage overall. There are significant differences between the three blocks in the coverage of the themes of cocoa, maize, cocoyam, tomatoes and small livestock. Table 2.3.3 Socio-economic profile of respondents within the study area
Farmers’ socio-economic profiles
Ebolowa Mbalmayo Yaoundé Humid Forest Zone
% of responses
Farmer quality (FQuality) Peasant farmer 28.7 29.2 6.7 64.6 Retired civil servant 15.6 8.2 7.6 31.4 Civil servant 0 4.0 0 4.0
Gender (FGender) Female 36.0 27.4 14.4 77.7 Male 8.3 14.0 0 22.3
Marital status (FMarstat) Maried 41.9 37.8 12.5 92.2 Single 2.4 0 1.8 4.2 Widow (er) 0 3.6 0 3.6
Age (FAge) > 45 31.3 27.4 11.8 70.5 30-45 13.0 14.0 2.6 29.5 < 30 0 0 0 0
Education level (FEdu) Secondary school 37.6 12.2 4.9 54.7 Primary school 6.7 29.2 9.4 45.3
Belonging to social-organizations (FSocorg) Yes 44.3 38.7 12.8 95.8 No 0 2.7 1.5 4.2
Family size (FFamsize) 1-4 6.0 5.1 5.8 16.8 5-8 24.7 14.2 5.4 44.3 >8 11.7 20.2 6.9 38.8
Financial capital (FFcapitalC) or estimated annual revenue in FCFA <250000 17.1 4.6 1.5 23.1 250000-300000 11.7 0 0 11.7 >350000 13.6 34.9 16.6 65.2
Natural capital (FNcapitalC) or estimated land ownership (ha) 5-10 4.1 9.5 1.5 15.1 10-15 0 4.6 4.9 9.5 15-20 16.8 3.4 0 20.2 >20 21.5 22 11.7 55.2
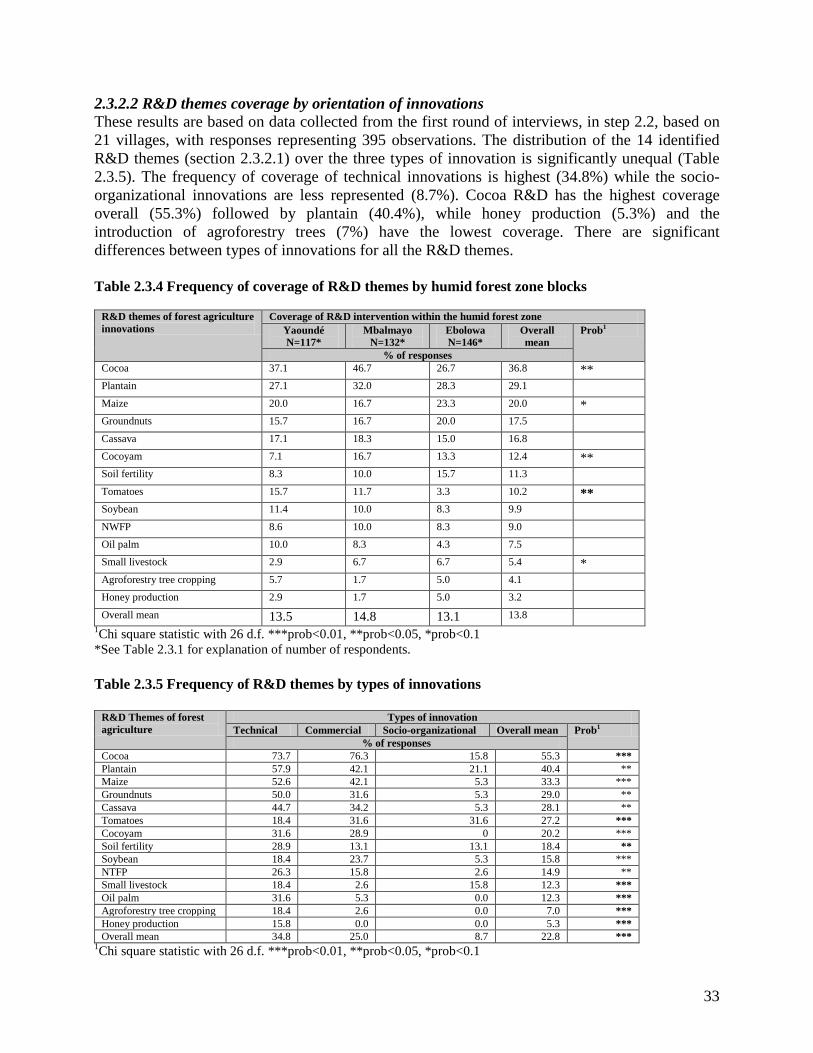
33
2.3.2.2 R&D themes coverage by orientation of innovations These results are based on data collected from the first round of interviews, in step 2.2, based on 21 villages, with responses representing 395 observations. The distribution of the 14 identified R&D themes (section 2.3.2.1) over the three types of innovation is significantly unequal (Table 2.3.5). The frequency of coverage of technical innovations is highest (34.8%) while the socio-organizational innovations are less represented (8.7%). Cocoa R&D has the highest coverage overall (55.3%) followed by plantain (40.4%), while honey production (5.3%) and the introduction of agroforestry trees (7%) have the lowest coverage. There are significant differences between types of innovations for all the R&D themes. Table 2.3.4 Frequency of coverage of R&D themes by humid forest zone blocks
R&D themes of forest agriculture innovations
Coverage of R&D intervention within the humid forest zone Yaoundé N=117*
Mbalmayo N=132*
Ebolowa N=146*
Overall mean
Prob1
% of responses Cocoa 37.1 46.7 26.7 36.8 ** Plantain 27.1 32.0 28.3 29.1 Maize 20.0 16.7 23.3 20.0 * Groundnuts 15.7 16.7 20.0 17.5 Cassava 17.1 18.3 15.0 16.8 Cocoyam 7.1 16.7 13.3 12.4 ** Soil fertility 8.3 10.0 15.7 11.3 Tomatoes 15.7 11.7 3.3 10.2 ** Soybean 11.4 10.0 8.3 9.9 NWFP 8.6 10.0 8.3 9.0 Oil palm 10.0 8.3 4.3 7.5 Small livestock 2.9 6.7 6.7 5.4 * Agroforestry tree cropping 5.7 1.7 5.0 4.1 Honey production 2.9 1.7 5.0 3.2 Overall mean 13.5 14.8 13.1 13.8
1Chi square statistic with 26 d.f. ***prob<0.01, **prob<0.05, *prob<0.1 *See Table 2.3.1 for explanation of number of respondents. Table 2.3.5 Frequency of R&D themes by types of innovations
R&D Themes of forest agriculture
Types of innovation Technical Commercial Socio-organizational Overall mean Prob1
% of responses Cocoa 73.7 76.3 15.8 55.3 *** Plantain 57.9 42.1 21.1 40.4 ** Maize 52.6 42.1 5.3 33.3 *** Groundnuts 50.0 31.6 5.3 29.0 ** Cassava 44.7 34.2 5.3 28.1 ** Tomatoes 18.4 31.6 31.6 27.2 *** Cocoyam 31.6 28.9 0 20.2 *** Soil fertility 28.9 13.1 13.1 18.4 ** Soybean 18.4 23.7 5.3 15.8 *** NTFP 26.3 15.8 2.6 14.9 ** Small livestock 18.4 2.6 15.8 12.3 *** Oil palm 31.6 5.3 0.0 12.3 *** Agroforestry tree cropping 18.4 2.6 0.0 7.0 *** Honey production 15.8 0.0 0.0 5.3 *** Overall mean 34.8 25.0 8.7 22.8 ***
1Chi square statistic with 26 d.f. ***prob<0.01, **prob<0.05, *prob<0.1
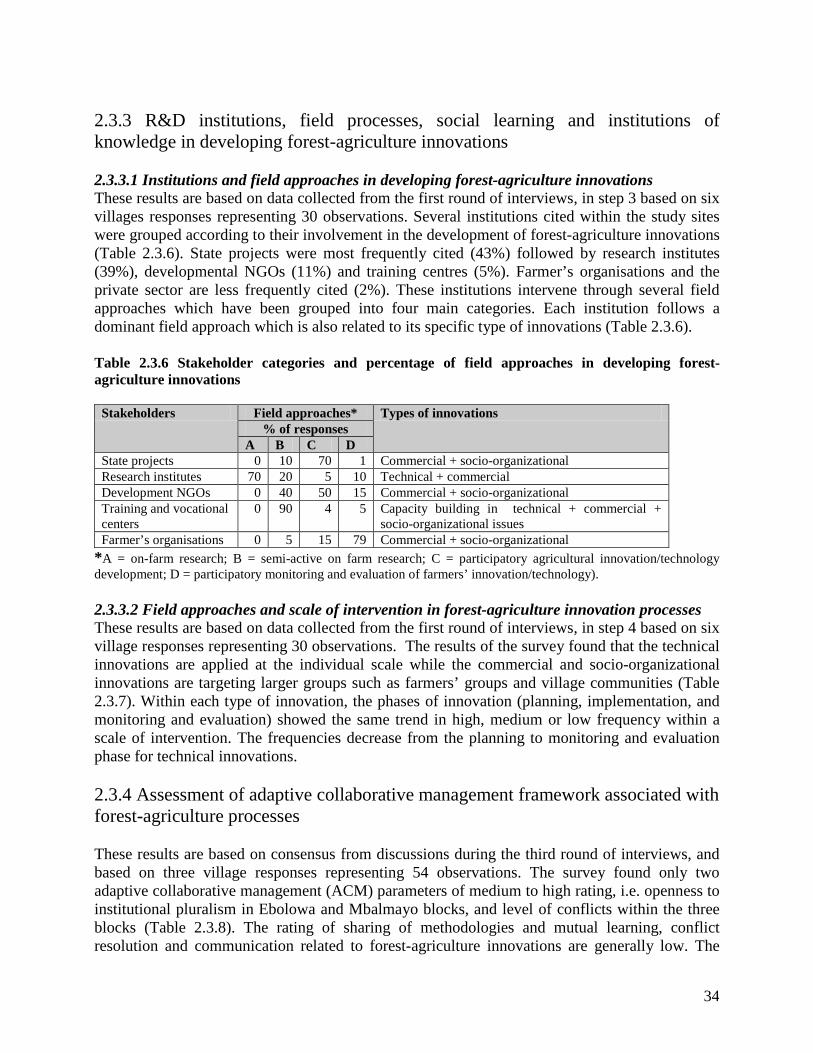
34
2.3.3 R&D institutions, field processes, social learning and institutions of knowledge in developing forest-agriculture innovations 2.3.3.1 Institutions and field approaches in developing forest-agriculture innovations These results are based on data collected from the first round of interviews, in step 3 based on six villages responses representing 30 observations. Several institutions cited within the study sites were grouped according to their involvement in the development of forest-agriculture innovations (Table 2.3.6). State projects were most frequently cited (43%) followed by research institutes (39%), developmental NGOs (11%) and training centres (5%). Farmer’s organisations and the private sector are less frequently cited (2%). These institutions intervene through several field approaches which have been grouped into four main categories. Each institution follows a dominant field approach which is also related to its specific type of innovations (Table 2.3.6). Table 2.3.6 Stakeholder categories and percentage of field approaches in developing forest-agriculture innovations
Stakeholders Field approaches* Types of innovations % of responses
A B C D State projects 0 10 70 1 Commercial + socio-organizational Research institutes 70 20 5 10 Technical + commercial Development NGOs 0 40 50 15 Commercial + socio-organizational Training and vocational centers
0 90 4 5 Capacity building in technical + commercial + socio-organizational issues
Farmer’s organisations 0 5 15 79 Commercial + socio-organizational *A = on-farm research; B = semi-active on farm research; C = participatory agricultural innovation/technology development; D = participatory monitoring and evaluation of farmers’ innovation/technology). 2.3.3.2 Field approaches and scale of intervention in forest-agriculture innovation processes These results are based on data collected from the first round of interviews, in step 4 based on six village responses representing 30 observations. The results of the survey found that the technical innovations are applied at the individual scale while the commercial and socio-organizational innovations are targeting larger groups such as farmers’ groups and village communities (Table 2.3.7). Within each type of innovation, the phases of innovation (planning, implementation, and monitoring and evaluation) showed the same trend in high, medium or low frequency within a scale of intervention. The frequencies decrease from the planning to monitoring and evaluation phase for technical innovations. 2.3.4 Assessment of adaptive collaborative management framework associated with forest-agriculture processes These results are based on consensus from discussions during the third round of interviews, and based on three village responses representing 54 observations. The survey found only two adaptive collaborative management (ACM) parameters of medium to high rating, i.e. openness to institutional pluralism in Ebolowa and Mbalmayo blocks, and level of conflicts within the three blocks (Table 2.3.8). The rating of sharing of methodologies and mutual learning, conflict resolution and communication related to forest-agriculture innovations are generally low. The

35
rate of evaluation of ACM parameters do not vary enough between blocks. The results from Ebolowa block and Mbalmayo blocks seem closer than those from Yaoundé block. Table 2.3.7 Type of innovations and scale of local stakeholders’ involvement
Types of forest-agriculture innovations
Phase of innovation processes Scale of intervention with local stakeholders
Overall mean
% of responses Individual Farmer
group Village community
Technical Planning 75 30 20 41.7 Implementation 78 17 5 33.3 Monitoring and evaluation 70 10 1 27.0
Commercial Planning 0 30 20 16.7 Implementation 5 75 20 33.3 Monitoring and evaluation 20 20 40 26.7
Socio-organizational
Planning 10 25 70 35.0 Implementation 10 35 25 23.3 Monitoring and evaluation 25 25 30 26.7
Table 2.3.8 Participatory assessment of adaptive collaborative management parameters
Adaptive collaborative management parameters
Assessment of ACM parameters Ebolowa Mbalmayo Yaoundé
Horizontal collaboration and openness to institutional pluralism
Medium Medium
Medium
Vertical collaboration Medium Medium Low Sharing of methodologies and mutual learning
Low Low Low
Level of conflicts/resistance to adopt innovation options imposed by external stakeholders
High High Medium
Conflict resolution Low Low Low Communication Low Low Low
Number of observations (N=54)[ N=16)+ (N=18)+(N=20)]. 2.3.5 Deployment of R&D innovations: introduction, abandonment and improvement These results are based on data collected from the second round of interviews; in step 1 based on individual interviews in six villages with 30 observations. The general results of the survey, summarized in Table 2.3.9, found that: (i) Twelve forest-agriculture innovations have been introduced in the study sites over the past 10 years, with nine (75%) having a technical orientation (crop varieties). Introduction of cassava varieties (31.4%) had the highest presentation throughout the period, followed by maize varieties (18.1%), improved farming techniques (13.3%) and seed treatment techniques (10.3%). (ii) Four categories of forest-agriculture innovations have been abandoned, all of a technical orientation. The abandonment of the introduction of exotic agroforestry trees is mentioned by most (38.3%) and the only important abandoned innovation. (iii) Five categories of forest-agriculture innovations have been adopted

36
and/or have affected the structure of household income. The most adopted innovations are improved oil palm varieties (50.5%) and cassava varieties (22.1%). Technical innovations are the most frequently adopted although the highest category of oil palm varieties does have a component of market and socio-organization innovations. The frequency of adoption of innovations does not follow the frequency of their introduction; the higher frequency of adoption improved oil palm varieties does not correspond to its low frequency of coverage as R&D theme introduced. Table 2.3.9 Frequency of the deployment forest-agriculture innovations
Type innova-tions
Period
% of responses
Innovations introduced Y-0 Y-5 Y-10 Overall
T Varieties of cassava 25.9 33.3 34.8 31.4
T+C Varieties of maize 13.0 15.4 26.1 18.1
T Improved farming techniques 18.5 12.8 8.7 13.3
T Techniques of seed treatment 13.0 18.0 0.0 10.3
T Varieties of sweet and irish potatoes 7.4 5.1 8.7 7.1
C Crop processing and post-harvest technologies 5.6 5.1 8.7 6.5
T Agroforestry trees (Calliandra and Inga spp.) 1.9 5.1 4.4 3.8
T Varieties of plantain 3.7 2.6 0.0 2.1
T+C Varieties of groundnuts and soybean 3.7 2.6 0.0 2.1
T + SO Management of crop nurseries 1.9 0.0 4.4 2.1
T Oil palm varieties 0.0 0.0 4.4 1.5
T+C Horticultural crops 3.7 0.0 0.0 1.2
Innovations abandoned Y-0 Y-5 Y-10 Overall
T Agroforestry trees (Calliandra and Inga spp.) 25.0 40.0 50.0 38.3
T Techniques for treatment of seeds 12.5 20.0 0.0 10.8
T Improved farming techniques 12.5 20.0 0.0 10.8
T Varieties of cassava 25.0 0.0 0.0 8.3
Innovations adopted Y-0 Y-5 Y-10 Overall
T+C+SO Improved oil palm varieties 36.4 40.0 75.0 50.5
T Cassava varieties 36.4 30.0 0.0 22.1
T Plantain varieties 0.0 0.0 25.0 8.3
T Techniques - treatment of seeds 9.1 10.0 0.0 6.4
T+C Soybean varieties 0.0 10.0 0.0 3.3
Legend: type of innovations (T=technical; C=commercial; SO=socio-organizational; time frame or period (Y-0=current; Y-5=five years ago; Y-10=ten years ago). 2.3.6 Social demand of improvements within the humid forest blocks These results are based on data collected from the second round of interviews, in step 2 with focus groups in six villages and 56 observations. The results of the survey found that each block

37
has its own social demand for improvements (Table 2.3.10). The priority demands are based on the respondents’ perception and knowledge of market access and their technical, market and socio-organizational constraints. Of the ten priority innovations cited per block, six are common to all the blocks: cocoa (Theobroma cacao), oil palm (Elaeis guineensis), poultry and pork breeding, honey production and aquaculture/fish ponds. Three improvements requested by respondents are common for two sites: food crops, sustainable forest management including NTWFP and community forests, and Cucumeropsis farms. Cucumeropsis crop (commonly called melon seeds) looks like a melon but it is culticated only for its seeds which are rich in protein. It is a cash ‘food crop’ because it provides income and it also has a cultural value. Some improvements are highly confined to one block such as micro-credit, maize, plantain and tomatoes for Yaoundé block and fruit trees for Ebolowa block. The implementations of this social demand require the combination of technical, market and socio-organizations improvements. Table 2.3.10 Social demand for improvements in the humid forest blocks
Humid Forest Zone Blocks Ebolowa
Mbalmayo
Yaoundé
List of 10 priority innovations
1. Food cropsC2 1. Cocoa C3 1. Cocoa C3 2. Cocoa C3 2. Oil palm plantations C3 2. Micro- credit C1 3. Poultry breeding C3 3. Food crops C2 3. Oil palm C3 4. Sustainable forest management
options (NTFPs and community forests) C2
4. Pork breeding C3 4. Maize C1
5. Cucumeropsis farms C2 5. Poultry breeding C3 5. Tomatoes C1 6. Oil palm plantationsC3 6. Sustainable forest management
options (NTFPs and community forests) C2
6. Aquaculture /fish ponds C3
7. Fruit trees C1 7. Cucumeropsis farms C2 7. Plantain C1 8. Aquaculture/fish ponds C3 8. Fruit trees C1 8. Poultry breeding C3 9. Pork breeding C3 9. Aquaculture/fish ponds C3 9. Pork breeding C3 10. Honey production C3 10. Honey production C3 10. Honey production C3
Explanations: C3: common for the three blocks; C2: common for two blocks; C1: specific for one block. Number of observations (N=56)[ N=18)+ (N=18)+(N=20)]. 2.4 DISCUSSION 2.4.1 Structure and organizations of R&D themes per block and type of innovations The 14 R&D themes identified from the survey are equally distributed within the three blocks of the humid forest benchmark area (Table 2.3.4). The R&D themes with the higher overall frequency is cocoa (36.8%) followed by plantain (29.1%), maize (20%), groundnuts (17.5%), cassava (16.8%) and cocoyam (12.4%). Except for maize, this ranking confirms the socio-economic importance of these products, as the most important commodities for generating household revenues in the study area (ASB 2000; Gockowski et al. 2004). The significant differences between several R&D themes (cocoa, maize, cocoyam, tomatoes and small-livestock)

38
between the three blocks, confirm the high variation in the commodity composition of revenue rankings across both blocks and villages within the benchmark (Gockowski et al. 2004, 2005). The perceptions of market access and the natural resource base are the key factors affecting the choice of commodities for commercialization of products, which is not followed by the spatial distribution of R&D themes. The lower frequencies observed in the R&D themes such as agroforestry trees cropping and honey production indicate the strong agronomic orientation of R&D themes at the forest-agriculture interface against a more integrative framework for intervention. Moreover, the role of Cucumeropsis farms which is a key land use system in the understanding of the forest-cropping-fallow conversion cycle is ignored; this absence is an indication of a gap in integrating the complexity of the land tenure system as well as the rationality and dynamics of social institutions in the management of innovations (Diaw 1997; Diaw and Oyono 1998; Vermeulem and Karsenty 2001). The 14 R&D themes identified by the survey are significantly unequally distributed across type of innovation. The overall frequency of distribution of R&D themes per type of innovations follows more or less the coverage of R&D themes per block, except for plantain (Tables 2.3.4, 2.3.5). However, the significant differences between the R&D themes per five innovations dominated by food crops and with the high frequency observed for technical innovations (34.8%), confirm the agronomic orientation of innovations with crop variety development. This technical/agronomic orientation is in contrast to the commercial innovations with crops such as maize (33.3%) and tomato (27.2%). These results confirm that technical changes still guide the pathway for sustainable development, even in the case of the forest-agriculture interface (Benchaïm and Schembri 1996) and even if there is a recent introduction of market-orientated innovations for villages with good market access (Gockowski et al. 2004). The fact that the socio-organizational innovations are the less represented (8.7%) of the three types of innovations, indicate that the heterogeneity of the blocks in terms of their institutional, market, technical and socio-organizational factors were not properly taken in account during the R&D intervention (Gockowski et al. 2005; Spielman 2006). W hile it appears that there is a variation in perception of market access between blocks (Table 2.3.4), these variations are not properly taken in account in the distribution of the types of innovations. The non-agricultural products such as the sustainable management of non-wood forest products and community forests, are less represented within the innovations developed. However, while they represent an important part in the contribution to household income (Ndoye et al. 1997, 1999; Dijk 1999; Gockowski et al. 2004), the results show that there is a lack of perspective in the integration of forest and agriculture issues. 2.4.2 Stakeholders and field processes in forest-agriculture innovations The analysis of stakeholders’ involvement in developing forest-agriculture innovations shows that each stakeholder has their dominant approach of intervention within the study site. The state projects have the higher frequency (43%) of intervention (Table 2.3.6). Such projects have two particularities: the first is related to the major approaches focusing on participatory innovation development with mostly commercial and socio-organizational innovations; the second particularity is that they generally intervene at village or community village scale (Table 2.3.7). At this scale of intervention, these projects presume to provoke a large scale impact. The other
39
important category of stakeholders is the research institutes which intervene in the field mainly via on-farm research. The activities related to their approaches cover food-crop farming systems while the farmer’s field school approach targeted only cocoa agroforests in terms of integrated pest-disease management (Mala and Sogbossi 2004). An important element that comes from the stakeholders analysis is that besides the complexity of the problems they are addressing, there is very little or sometimes no collaboration between them for R&D in the phases of planning, implementation and facilitation of change in the study site (Chambers 1997; Buchy and Hoverman 2000). This result indicates that there is an important gap in the R&D framework to overcome the challenge for the integration of forest and agriculture (Oyono et al. 2003a; Prabhu 2003; Colfer 2005). These results also show that if the challenge of external stakeholders approaches, including state projects, research institutes and developmental non-governmental organization (NGO) is to capture farmer’s knowledge first (Chambers 1997); however, their level of participatory monitoring and evaluation of farmer’s technology remains very weak (Table 2.3.8). This suggests that the integration of farmers’ knowledge and the process of participation remains an issue in the R&D of forest-agriculture innovations, as in other parts of the Central Africa region (Chambers 1997; Diaw and Oyono 1998; Cormien-Salem 1999; Buchy and Hoverman 2000; Mala et al. 2003). The results do suggest that the stakeholders use approaches slightly inspired by participatory technology development approaches (PTD) which engages the ecological responsibility of farmers. However, in several cases, farmers were not encouraged to evaluate indigenous knowledge or to choose, test and adapt modern technologies on the basis of their own agro-ecological knowledge (Roux et al. 2000; Altieri 2002; Pretty 2002, 2006). The processes described below as underlying the development of agricultural technologies do not follow the steps that contribute to building ownership, trust, learning and a capacity to drive changes (Oyono et al. 2003a; Prabhu 2003; Colfer 2005). The relationships between the stakeholders, the phases of development of innovations and their scale of implementation show that the innovation development activities are concentrated at the planning level (Table 2.3.7). The frequency of involvement is much higher at the individual level of intervention. However, this did not guarantee the scaling-up of innovation processes and benefits with the other decision-making and natural resource management levels, such as farmer organizations and village communities (Table 2.3.7). It has been shown that the level of stakeholder involvement in every phase of innovation development is pre-requisite for adaptive monitoring-evaluation and it can become a key process in support of adaptive co-management within the complex systems (Peterson et al. 1998; Ruitenbeck and Cartier 2001; Prabhu 2003 ; Olsson et al. 2004). Results from the assessment of adaptive co-management parameters show little variation between blocks and indicate the high openness to institutional pluralism and level of conflicts/resistance to adopt innovation options imposed by external stakeholders (Table 2.3.8). The results could indicate the lack of defining shared objectives and perspectives of R&D in terms of benefits and ownership. As a result, the biophysical dimension of sustainable agricultural technologies covered more crop-variety issues than other issues such as the local stakeholders’ organisational development, the exploration of market opportunities, and exploitation of non-wood forest products (NWFPs). This confirms the assertion that environment and natural resources

40
management were perceived in past years, and particularly since the 'Green Revolution’, as an expert biophysical task in the search for higher yields (Woodhill and Röling 1998; Colfer 2005). 2.4.3 Outcomes of field processes, forest-agriculture innovation development and collaborative management The major outcomes of the field processes can be analysed for the forest-agriculture innovations generated and for social learning. At the level of innovations, there is a gap between the number and content of R&D themes and those of the innovations. Cocoa and plantain, which have the higher coverage of R&D themes per block and per type of innovation, have been dominated by cassava and maize as innovations introduced (Tables 2.3.4 and 2.3.9). This gap is partly justified by the high investment towards understanding the agro-ecosystem organization and functioning, to provide recommendations for innovation processes, and that cassava is the most important crop, both as a source of income and in terms of energy intake in the diet of the people in the study area and in central Africa, (Manyong et al. 1996; Gockowski et al. 1998; ASB 2000). The technical innovations present a high frequency of abandonment, represented by innovations of agroforestry (38.3%) with the introduction of improved shorten fallow system (Table 2.3.9). This innovation includes the crop-fallow rotation system with bio-fertilizer agroforestry species such as Calliandra spp., Inga spp., Mucuna spp., Pueraria spp., It is partly justified by their environmental orientation. Their implementation used techniques and methods to improve land management rather than to increase farm and forest productivity – in this case, the costs should be borne by the individual farmers, while the benefits should have been social (ASB 2000; Kanmegne 2004). That confirms that most abandoned forest-agriculture innovations were not in the economic interests of farmers and do not take into account the local farming practices and socio-ecological mechanisms behind the resilience of the forest-cropping-fallow conversion cycle (Oyono et al. 2003b; Mala and Oyono 2004). Moreover, it also confirms that these innovations overlap on local mechanisms used to regulate and manage soil fertility (Carrière 1999). The forest-agriculture innovation with the highest adopted frequency is improved oil palm varieties (50.5%). The adoption of improved oil palm varieties occurred for two reasons: firstly it has a good comparative advantage compared to cocoa in terms of stability of income generated; secondly its diffusion has been driven by the intervention of several stakeholders, mainly state projects, development NGOs, training and vocational centres and research institutes. The Institute of Agricultural Research for Development (IRAD) of Cameroon provided the technical, commercial and socio-organizational know-how of this innovation. This introduction is a key step towards the re-organization of the land use system within the existing spatial arrangements of land use of the cropping-fallow-forest conversion cycles (Dounias 1996; Diaw 1997; Carrière 1999). The high potential of adoption of these impact-oriented innovations such as the cassava varieties and oil plam trees on yield/income illustrate the evolution of traditional farming and the needs of to diversify their genetic crop stocks, to improve the agro-ecological productivity and to reduce their socio-economic vulnerability (Gockowski et al. 2005). In the context of the deployment of forest-agriculture innovations, social learning can occur when the field processes are designed to generate the platforms of social learning based on monitoring and evaluation. The results of the survey show that the types of innovations are highly correlated
41
with the phase of innovation processes and the scale of intervention with local stakeholders (Table 2.3.5). However, the frequency of participation in village meetings decreases from the planning to the monitoring and evaluation phases. This indicates that there were no existing mechanisms for the generation of social learning between stakeholders involved in the development of innovations, and by extension, a low adaptive capacity in innovation processes (Plummer and Armitage 2006). There is a high level of socio-diversity and a low level of conflict resolution resulting from misunderstanding of the what, why and how to address the technical, market and socio-organizational constraints. This indicates the poor governance of the processes of forest-agriculture innovations. The evaluation of ACM parameters such as methodology sharing and mutual leaning, communication with a low assessment rate, confirm this trend (Table 2.3.6). These results suggest that the incorporation of social capital is still an unresolved issue in the processes of innovations related to biodiversity management and conservation but also for forest-agriculture in the context of high biodiversity (Prabhu 2003; Pretty and Smith 2004; Colfer 2005). 2.4.4 Social demand of improvements, forest-agriculture innovations and adaptive co-management The results of the survey found that there is a specialization of social demand of improvements that is correlated with the blocks of the humid forest zone (Table 2.3.10). This specialization reflects two things: the influences of market access and their technical, market and socio-organizational constraints; and the ratio between agricultural products versus NWFPs within the natural resource intensification gradient that prevailed in the study area (Gockowski et al. 2004, 2005). The social demand for improvements common for the three sites include both cash crops such as cocoa) and oil palm trees, and new improvements that are not in the culture of people of the study area such as poultry and pork breeding, honey production and aquaculture/fish ponds (Table 2.3.10). This indicates an integrated perspective of NRM and probably its alignment with the current trends in integrated natural resources management (Campbell et al. 2006). These results also confirm the role of cash crops in the rural economy and the structure of income-generation, the need to reduce farmers’ economic vulnerability, and the existence of a pathway for adaptive management based on socio-economic resilience. The results also indicate the gap existing between the social demand for improvements and the innovations introduced (Table 2.3.9, 2.3.10). For example, maize is not a traditional food crop in the study area but its introduction is more market-oriented. There is also a conflict between the introduction of oil palm and the debate of deforestation. This has limited the interests in the field of R&D by international research agencies over the environmental innovations. This confirms that the innovative improved oil palm varieties have been introduced by state projects and urban elites, and development NGOs and not by a classical R&D approach used by international agencies and national agricultural research agencies (Abega 2007). Some specific issues concerning the social demand for improvements are both common and specific for sites. These include sustainable community managed forests, including NWFPs and community forests, and Cucumeropsis spp. Micro-credit, maize, plantain and tomatoes were specifically requested for the Yaoundé block, and fruit trees for Ebolowa block (Table 2.3.10). These issues indicate the need for an integrative approach to address the complex interrelations between technical, market, financial and socio-organizations constraints (Woodhill and Röling
42
1998; Borrini-Feyerabend et al. 2000; Holling 2001; Ruitenbeck and Cartier 2001; Prabhu 2003). The results of evaluation of ACM parameters confirm the disparity of outcome intervention within blocks (Table 2.3.8). In particular, the analysis of ACM parameters and field processes show that the conflict resolution mechanisms, mutual learning and sharing of methodologies, and collaboration and open to institutional pluralism are the key supports for change to happen in forest-agriculture innovations. These supports were not properly used to enhance ownership in innovative process as in the case of farmers’ field school with cocoa plantations (Mala and Sogbossi 2004). This could have been possible if the social scale of intervention was appropriately selected and the objectives of research were shared. These field processes were not based on socio-institutional arrangements in order to ensure that innovations generated will be disseminated and utilized in order to generate social and economic gains (Ediquist 1997a,b; Ruitenbeck and Cartier 2001; Prabhu 2003; Pretty and Smith 2004; Plummer and Armitage 2006; Spielman 2006). The developments of forest-agriculture innovations carried out within the study area over the last decade have generated technologies. These technologies were based on the orthodox view of forest-agriculture in terms of low productivity and weak performance of agricultural landscape mosaics. They encountered some serious socio-ecological feasibility problems. This confirms the gap still existing between the expert view of innovations (Binswanger and Pigali 1987; Borlaug 1992; FAO 1999) and the socio-ecological and economic realities behind forest-agriculture. The changes and improvements expected from R&D forest-agriculture innovations have been affected by several factors such as the limited understanding of the real dynamics of agro-ecosystems, the local agro-ecological knowledge supporting the resilience of the cropping-fallow-forest conversion cycle (Dounias 1996; Carrière 1999; Vermeulen and Karsenty 2001; Oyono et al. 2003b) and sometimes the little consideration of the socio-economic context (Table 2.3.1, 2.3.2, 2.3.3). Moreover, the design of innovations and the R&D themes supporting their development were based on the separation of forest and agricultural spaces (ASB 1995). Unfortunately, the context of high biodiversity as one of the key elements of the cropping-fallow-forest cycle and the gradient of resource intensification were not appropriately used during the design of innovations and the field processes. This confirms the knowledge gaps in the understanding of complex relationships between forest, agriculture and biodiversity at the forest-agriculture interface (Mala et al. 2003; Pretty 2006). The results show that the development of forest-agriculture innovations delineated different meaning and representation that are not in contradiction with several scientific orientations of innovations (Binswanger and Pigali 1987; Borlaug 1992; FAO 1999; ASB 2000). The recent shift of technical innovations to environmental innovations with the global issue of deforestation and climate, will probably enlarge the level of misunderstanding between local and modern knowledge. The challenge remains to know how the introduction of innovations will affect the livelihood strategy, land tenure and the perception of human-nature relationships. Moreover, besides the use of certain principles of participation, their developments have encountered some serious social and ecological feasibility problems. The adoption of technologies was the main target and not the process by which it was to be achieved. Still, the socio-ecological scales of forest-agriculture innovation developments and socio-institutional arrangements behind them were not appropriately selected or applied to create the conditions for this to happen in an adaptive way. In developing new forest-agriculture innovations, a key issue is the selection of

43
appropriate scales of analysis and intervention, and the creation of a platform of learning, knowledge, change and adaptation. 2.5 CONCLUSIONS This chapter has characterised the R&D themes and derived innovations at the forest-agriculture interface in terms of structure, organization and processes observed over the past 10 years. The results found 14 R&D themes that are distributed equally within the three blocks of the benchmark area and unequally between the types of innovations. The technical orientation of innovations was the best covered while the socio-organizational orientation was poorly implemented. There is a shift between the list of 14 R&D themes and the list of 12 innovations generated in the study site. The most frequently cited abandoned innovations are improved shortened fallow systems with agroforestry trees, shrubs and herbs (38.3%) while the most frequently cited adopted innovation is improved oil palm varieties (50.5%) with a more market orientation. These results confirm the technical agricultural orientation of innovations rather than its combination with commercial and socio-organizational dimensions necessary to address the sustainability of forest and agriculture. The field processes supporting the development of forest-agriculture innovations have been characterized. However, the way stakeholders interact to develop forest-agriculture innovations was only partly analysed because of the nature of the methodology of the study. This would have integrated livelihood needs, institutions of knowledge and learning, social organisations and income improvement. The emerging forest-agriculture innovations derived from agroecosystem analysis have been adequately identified. The R&D themes and the innovations derived do not reflect the economic structure of farmers, including both agricultural and non agricultural products at spatio-temporal scales. The operational limitations of the field processes in relation to the social demand for innovations were addressed in terms of the gap between the social demand for improvement and the nature of innovations developed. The extent to which the introduced agricultural and agroforestry land uses and technologies adapt to local agricultural biodiversity knowledge systems was partly addressed. The data collection related to this section did not link the adaptive capacity of innovations to traditional knowledge systems. However, the overall results indicate that the interplay of knowledge systems and the deployment of forest-agriculture innovations are affected by the biophysical and socio-economic context, natural resources management options, institutions of knowledge and social learning, and scale of analysis and intervention of resource users. To overcome this complexity and gap in the future intervention of R&D for sustainable forest agriculture, an integrated approach is needed. This approach should take into account the complexity of local forest management, the traditional knowledge and practices, the market infrastructures and socio-organizational and institutional dimensions in managing forest agriculture. 2.6 REFERENCES Abega AP. 2007. L’impact socio-économique et environnemental des palmeraies à Zoétélé. Mémoire de DIPES II. Yaoundé : Ecole Normale Superieure (ENS).
44
Adesina AA, Mbila D, Nkamleu GB, Endamana D. 2000. Econometric analysis of the determinants of adoption of alley farming by farmers in the forest zone of southwest Cameroon. Study Report. Yaoundé: IITA. Alson JM, Norton GW, Pardey PG. 1995. Science under Scarcity: Principles and Practice for Agricultural Research Evaluation and Priority Setting. Ithaca: Cornell University Press. Altieri AM. 2002. Agroecology: the science of natural resource management for poor farmers in marginal environments. Agriculture, Ecosystems and Environments 93 (2002): 1-24. ASB. 1995. Alternatives to Slash and Burn Phase I Report: Forest Margins Benchmark of Cameroon, Alternatives to Slash and Burn Programme. Yaoundé: IITA Humid Forest Ecoregional Centre.
ASB. 2000. Alternatives to Slash and Burn Phase II Report: Forest Margins Benchmark of Cameroon, Alternatives to Slash and Burn Programme. Yaoundé: IITA Humid Forest Ecoregional Centre. Bawden RJ. 1991. Systems Thinking and Pratice in Agriculture. J Dairy Sci 74: 2362-2373. Benchaïm J, Schembri P. 1996. Technical change: An essential variable in the choice of a sustainable development trajectory. In: Faucheux S, Pearce D, Proops J (eds.), Models of Sustainable Development. News Horizons in Environmental Economics. pp 73-86. Binswanger H, Pigali P. 1987. Technology Priorities for Farming in Sub-Saharian Africa. Research Observer 3. Borlaug N. 1992. Small-scale agriculture in Africa: the myths and realities. Feeding the future. Newsletter of Sasakawa Africa Association 4/2. Borrini-Feyerabend GM, Farvar F, Nguinguiri JC, Ndangang V. 2000. Co-management of natural resources: Organising, negotiating and learning-by-doing. Heidelberg: GTZ and Kasparek Verlag: International Union for the Conservation of Nature (IUCN). Buchy M, Hoverman S. 2000. Understanding public participation in forest planning: a review. Forest Policy and Economics 1 (2000) 15-25. Campbell BM, Hagmann J, Stroud A, Thomas R, Wollenberg E (eds.). 2006. Navigation amidst complexity: Guide to implementing effective research and development to improve livelihoods and the environment. Bogor : Center for International Forestry Research. CARPE. 2001. Congo Basin. Information series. Taking Action to Manage and Conserve Forest. Resource in the Congo Basin. Results and Lessons Learned from First Phase (1996-2000). Washington : Central Africa Regional Programme for the Environment.

45
Carrière S. 1999. Les orphelins de la forêt: Influence de l'agriculture itinérante sur brûlis de Ntumu et des pratiques agricoles associées sur les dynamiques forestière du sud Cameroun. Thèse de Doctorat. Montpellier: Université de Montpellier. 448 p. Chambers R. 1997. Whose Reality Counts? Putting the First Last. London : Intermediate Technology Publications. 106 p. Chauveau JP. 1999. Le modèle sociologique des sociétés paysannes et l’innovation. In : Chauveau JP, Cormier-Salem MC, Mollard E (eds,), Innovations en Agriculture: Questions de méthodes et de terrains d'observation.. Paris: IRD Editions. pp 127-140. CIFOR. 2003. CIFOR Adaptive Collaborative Management (ACM) Strategy. Report of the Steering Committee. Bogor: Centre for International Forestry Research. Colfe, CJP. 2005. The complex forest: Communities, Uncertainties and Adaptive Collaborative Management. Washington: RFF and Bogor: CIFOR. 370 p. Cormier-Salem MC. 1999. Innovations et relations société-environnement. In : Chauveau JP, Cormier-Salem MC, Mollard E (eds.), Innovations en Agriculture: Questions de méthodes et de terrains d'observation. Paris: IRD Editions. pp 127-140. Diaw MC. 1997. Si, Nda bot and Ayong: Shifting Cultivation, Land Use and Property Rights in Southern Cameroon. RDF Network paper 21e.. London: Oversas Development Institute. 28 p. Diaw MC, Oyono PR. 1998. Dynamiques et représentations des espaces forestiers au Sud Cameroun: pour une relecture sociale du paysages. Arbres, Forêts et Communautés Rurales 15/16: 36-43. Diaw MC, Colfer CJP, Prabhu R. 1999. Pour le suivi participatif et la cogestion adaptive des forêts tropicales africaines. Document de travail. Bogor : CIFOR. 14 p. Dijk J.V. 1999. An assessment of Non-Wood Forest Products Resources for the Development of Sustainable Commercial Extraction. In: Sunderland TCH, Clark LE, Vantomme P (eds.), The NWFP of Central Africa: Current research issues and prospects for conservation and development. Rome: FAO. Dounias E. 1996. Dynamique et gestion différentielle d'un système de production à dominance agricole des Mvae du Sud-Cameroun. Thèse de Doctorat. Montpellier : Université des Sciences et Technique du Languedouc. 644 p. Ediquist C. 1997a. Systems of Innovations Approaches – Their Emergence and Characteristics. London : Cassell Academic. Ediquist C. 1997b. Systems of Innovations Approaches: Technologies, Institutions and Organizations. London: Printer.
46
FAO. 1999. Agricultural Policies for Sustainable Management and Use of Natural Resources in Africa. Rome: Food & Agricultural Organization (FAO) and Ibadan: IITA. 81 p. Garrity D, Bandy D. 1996. A global focus on Alternatives To Slash and Burn. In: LiYu X, YuangZhang Y, JinHui Q (eds.), Proceedings of an International symposium on Alternatives to Slash-and-Burn Agriculture held in Kunming, PR. China, 6-16 March 1995. pp 52-58. GEF. 1993. Global Alternatives to Slash and Burn. New York: Global Environment Facility/United Nations Development Program. 87 p. Geldenhuys CJ. 2000. Ecological processes the basis for sustainable nature conservation. Plantlife 23: 2-4. Gockowski J, Tonye J, Baker D, Legg C, Weise S, Ndoumbé M , Tiki-Manga T, Fouaguegué A. 2004. Characterization and diagnosis of farming systems in the ASB forest margins Benchmark of Southern Cameroon. Study Report. Yaounde: IITA. 67 p. Gockowski J, Tonye J, Diaw MC, Hauser S, Kotto-Same J, Njomgang R, Mounkam A, Nwaga AD, Tiki-Manga T, Tondoh T, Tchoundjeu Z, Zapfack L. 2005. The Forest Margins of Cameroon. In: Palm CA, Vosti AS, Sanchez AP, Polly JE (eds.), Slash and burn agriculture: the search for alternatives. New York: Columbia University Press. pp 305-331. Gu-Konu YE. 1999. Les concepts d’analyse du processus d’innovation agricole en Afrique. In : Chauveau JP, Cormier-Salem MC, Mollard E (eds.), Innovations en Agriculture: Questions de méthodes et de terrains d'observation. Paris: IRD Editions. pp 187-198. Gunderson LH, Holling CS, Light SS. 1995. Barriers and bridges to the renewal of ecosystems and institutions. New York: Columbia University Press. Holling C. 2001. Understanding the complexity of economic, ecological and social systems. Ecosystems 11:41-47. Holling CS, Gunderson LH, Ludwig D. 2002. In Quest of a Theory of Adpative Change. In: Gunderson LH, Holling CS (eds.), Panarchy : Understanding Transformations in Human and Natural Capital. Washington DC: Island Press. Ickowitz A. 2006. Shifting Cultivation and Deforestation in Tropical Africa: Critical Reflections. Development and Change 37 (3): 599-626. IITA. 1999. The Ecoregional Program for the Humid and the Sub-humid Tropics of Sub-Saharan Africa (EPHTA). Ibadan: International Institute of Tropical Agriculture (IITA). Instone L. 2003. Shaking the Ground of Shifting Cultivation: Or Why (Do) We Need Alternatives to Slash-and-Burn? Resource management in Asia-Pacific Program Working Paper No.43. Camberra: Research School of Pacific and Asian Studies/The Australian National University.
47
Kanmegne J. 2004. Slash and Burn Agriculture in the Humid Forest Zone of Southern Cameroon: Soil Quality Dynamics, Improved Fallow Management and Farmers' Perception. PhD Dissertation. Wageningen: Wageningen University. 184 p. Kay JJ, Schneider E. 1994. Embracing complexity: The challenge of Ecosystem Approach. Alternatives 20 (3): 33-39. Mala WA, Diaw MC. 2001. The Alternatives to Slash and Burn Programme (ASB) information day : What perspectives for adaptive collaborative management at the forest- agriculture interface?. Participatory System Analysis Report. Yaoundé: CIFOR. Mala WA, Endamana D. 2001. Impact of improved cassava varieties in Southern Cameroon. Study Report. Yaoundé : IITA. Mala WA, Sogbossi J. 2004. Participatory-evaluation of the 3rd Phase of the ASB end of Project. Study Report. Yaoundé: IITA. Mala WA, Oyono PR. 2004. Some dimensions of local practices of natural management in Southern Cameroon. Research Review NS 20.2 (23-31). Mala WA, Oyono PR, Ebene Y, Diaw MC. 2003. Assessment of the Context of Forest Agriculture and the Dynamics of Landscape Changes in Southern Cameroon. Unpublisehd Report. Yaoundé: CIFOR. Manyong VM, Smith J, Weber GK, Jagtap SS, Oyewole B. 1996. Macrocharacterization of Agricultural Systems in central Africa: An Overview. Resource and crops Management Research Monograph No 22. Ibadan: IITA. Matike R. 1990. Etude des facteurs qui influencent l’adoption des variétés améliorées de manioc : Cas du Département du Moungo, Province du Littoral. Mémoire à l’Institut National de Développement Rural en vue de l’Obtention du Diplôme d’Ingénieur Agronome. Dschang: Centre Universitaire de Dschang. Ndoye O, Tieguhong JC. 2004. Forest resources and rural livelihoods: conflict between timber and non-timber forest products in the Congo Basin. Scandinavian Journal of Forest Research 19 (suppl.4): 36-44. Ndoye O, Ruiz-Perez M, Eyebe A. 1997. The markets of Non-timber Forest products in the humid Forest Zone of Cameroon. Rural Development Forestry Network Paper No 22c. London: ODI. Ndoye O, Ruiz-Perez M, Eyebe A. 1999. NTFP Markets and Potential Forest Resource Degradation in Central Africa. The Role of Research for a Balance Between Welfare Improvement and Forest Conservation. In: Sunderland TCH, Clark LE, Vantomme P (eds.), The NWFP of Central Africa: Current research issues and prospects for conservation and development. Rome: FAO.

48
Olsson P, Folke C, Hahn T. 2004. Socio-Ecological Transformations for Ecosystems Management: the Development of Adaptive Collaborative management of a Wetland Landscape in Southern Sweden. Ecology and Society 9(4). Oyono PR, Diaw MC. 1999. A l’interface des ONG et des organisations paysannes au Sud-Cameroun: trajets, connexion et ruptures dans l’évolution des schémas institutionnels pour l’action collective et le développement durable. Unpublished Report. Yaounde: IITA. Oyono PR, Akwah G, Diaw MC, Jum C, Tiani A-M, Mala WA, Assembe S, Nguiébouri J, Ebene Y, Efoua S,Kouna C. 2003a. Developing Collaborative Monitoring for Adaptive Co Management of Tropical Forests (ACM). Final Report – Cameroon. Yaoundé: Center for International Forestry Research (CIFOR). Oyono PR, Mala WA, Tonyé J. 2003b. Rigidity versus adaptation: Contribution to the debate on agricultural viability and forest sustainability in Southern Cameroon. Culture and Agriculture Vol. 25. (No.2 Fall 2003). Palm AC, Vosti AS, Sanchez AP, Ericksen JP (eds.). 2005. Slash and Burn Agriculture: Search for Alternatives. New York: Columbia University Press. 461 p. Peterson G, Allen CR, Holling CS. 1998. Ecological resilience, biodiversity, and scale. Ecosystems (1): 6-18. Plummer R, Armitage D. 2006. A resilience-based framework for evaluating adaptive comanagement: Linking ecology, economy and society. Ecological Economics 61 (2007):62-74. Prabhu R. 2003. Developing collaborative monitoring for adaptive collaborative management of African Forests. Final Report of the January 1, 2000-December 31, 2002. Harare: CIFOR. Pretty J. 2002. Agri-culture: Reconnecting People, Land and Nature. London: Earthscan. Pretty J. 2006. Agroecological Approach to Agricultural Development. Section Report prepared for the World Development Report 2008. Rimsip-Latin American Center for Rural Development. 37 p. Pretty J, Smith D. 2004. Social capital in biodiversity conservation and management. Conservation Biology 18(5): 631-638. Roux DJ, Rogers KH, Biggs HC, Ashton PJ,Sergeant A. 2006. Bridging the Science-managing divide: moving from unidirectional knowledge transfer to knowledge interfacing and sharing. Ecology and Society 11(1):4. Ruitenbeck J, Cartier C. 2001. The Invisible Wand: Adaptive Co-Management as an Emergent Strategy in Complex Bio-economic Systems. Occasional paper No. 34. Bogor : Centre for International Forestry Research.

49
Sanchez AP, Palm AC, Vosti AS, Tomich PT, Kayoski J. 2005. Alternatives to Slash and Burn: Challenge and Approaches of an International Consortium. In: Palm AC, Vosti AS, Sanchez AP, Ericksen JP (eds.), Slash and Burn Agriculture: Search for Alternatives. New York: Columbia University Press. pp: 3- 37. Spielman JD. 2006. Systems of Innovations: Models, Methods, and Future Directions. Innovations Strategy Today 2(1): 55-66. Vermeulen C, Karsenty A. 2001. Place et légitimité des terroirs villageois dans la conservation. In : Delvingt W (ed.), La forêt des hommes : terroirs villageois en forêt tropicale africaine. Gembloux : Les presses Universitaires de Gembloux. pp 216-134. Wallington TJ, Hobbs RJ, Moore S. A. 2005. Implication of Current Ecological Thinking for Biodiversity Conservation: A Review of the Salient Issues. Ecology and Society 10 (1):15. Woodhill J, Röling NG. 1998. The second wing of the eagle: the human dimension in learning our way to more sustainable future. In: ‘Facilitating Sustainable Agriculture: Participatory Learning and Adaptive Management in Times of Environment Uncertainty’. Cambridge: Cambridge University Press.
50
CHAPTER THREE
LOCAL PERCEPTIONS OF NATURE AND FOREST KNOWLEDGE MANAGEMENT
3.1. INTRODUCTION Despite major investments and joint efforts to rationalize the management of tropical forests over the past two decades, progress and changes remain weak, limited and localized (Diaw et al. 1999). One key reason for this state of affairs is the weak integration between science, policy and management practices (Holling 2001; Ruitenbeck and Cartier 2001; Prabhu 2003). Scientific knowledge is an input factor to inform policy and resource managers to facilitate progress and change (Funtowicz and Ravetz 1990; Sinclair and Walker 1998). However, the main approach towards acquiring scientific knowledge and development of sustainable natural resource management options remains based on the prism of Western orthodox view and on their segregation approach of human-nature relationships (Funtowicz and Ravetz 1990; Joshi et al. 2001; Gunderson and Holling 2002; Prabhu 2003). Furthermore, the belief that we know, understand and can make wise decisions/choices about how we live on this planet and generalize them within the tropical world have been radicalized – this ‘self confidence’ has risen with the exponential growth of scientific knowledge (Wilson 1999 cited in Woodley 2004). This legacy of ‘enlightment’ resulted in the application of management principles that led to conflictual understanding and perspectives between forest actors, and very few changes in the livelihoods of local actors and sustainable outcomes. Examples are the segregation approach of land uses or the isolation of forest ecosystem entities into management options, and/or the implementation of ‘legal management’ practices (Diaw et al. 1999; Holling 2001; Prabhu 2003). Natural resource and forest management innovations resulting from this dominant view tend to neglect and overshadow local forest management practices and ecological knowledge on which rural communities base their survival and livelihood strategies (Mviena 1970; Mveng 1984; Fisher 1991; Bahuchet 1996, 1997; Haïla 1999; Brodt 2001; Altieri 2002; Armitage 2003; Instone 2003). In the humid forests of Central Africa, the current technical management of natural resource options at the forest-agriculture interface encounters the same socio-ecological fitness problems (ASB 1995, 2000; FAO 1999). These technical approaches still focus on sustaining the productivity of single-species crops such as cocoa (Theobroma cacao.) and/or specific crops such as maize (Zea mays) or single components of an ecosystem that is of economic interest. Furthermore, they overlap on the connections of different land uses determining the viability of the agroecosystem (Oyono et al. 2003; Mala and Oyono 2004; Mala et al. 2006). The positive impact of local forest and tree management to sustain forest-agriculture outcomes and forest recovery/regeneration is acknowledged (Dounias 1996; Carrière 1999; Sène 2003; Mala et al. 2006). However, in relation to the gap between policy, science and local practices, the local practices and knowledge systems are not yet incorporated into the agroecosystem analysis and intervention for the understanding of their real dynamics and for the facilitation of change
51
processes (Diaw et al. 1999). The management of forestry innovations, such as community forestry in southern Cameroon, overlaps with the agricultural landscape mosaics irrespective of their simple management plan that has a segregation background approach (Vermeulem and Carrière 2001; Mala and Oyono 2004; Mala et al. 2006). This overlap affects the institutions of tenure and the forest-cropping-fallow conversion cycles which represent the physical dimension of the land tenure that regulates households and community livelihood strategies and forest regeneration/recovery (Dounias and Hladik 1996; Diaw and Oyono 1998; Vermeulem and Carrière 2001; Oyono et al. 2003). All these statements show that the failure of many technical management approaches in the tropics occurred because there is a gap in mutual understanding when people with different world views are working together on a common issue (Woodley 2004). The general concepts such as forest and biodiversity, which are the expressions of global environmental narratives (Gyde 2002; Helms 2002; FAO 2005), have not yet been translated in order to create the conditions for a symbosis with the social representation of forest, local practices and their knowledge systems, and the dynamics of traditional institutions of managing natural resources (Gillon 1992; Fairhead and Leach 1994; Takacs 1996; Colfer et al. 2001; Instone 2003). Furthermore, despite the recent recognition of local ecological knowledge (LEK) as an asset for the sustainable local livelihood improvement and natural resource management, its integration remains weak in the design of innovation processes within the agroecosystem (Dounias 1996; Bahuchet 1997; Cormier-Salem 1999; Vermeulem and Carrière 2001; Joshi et al. 2001). To properly address the issue and to fill this gap in understanding, an integrated conceptual approach is needed. Key steps are the understanding of the socio-ecological bases of local forest knowledge systems, their linkages with livelihood strategies and natural resource management practices. With this in mind, the objective of this chapter is to examine the relationships between local perceptions of nature, forest knowledge management systems and adaptive forest-agriculture practices. The questions are: What are the local perceptions of nature amongst the people of the study area? What are the relationships between the components of these perceptions of nature? What are the perceptions of forest knowledge systems derived from them? How do the perceptions affect forest management and agricultural practices? It is hypothesized that local perceptions of nature and natural resource knowledge systems guide the implementation of adaptive local forest management and agricultural practices. Background: Perception of nature and evolution of land tenure systems in the study area The perception of nature by the people of study area (often called the people of Ntem-Sanaga region with the major ethnic groups including Eton, Kolo, Bene, Bulu, Bulu, Fang and Ntumu as mentioned by Alexandre 1965) can not be understood without a review of their historical settlement in southern Cameroon. The permanent settlement process of these people started at the end of the 19th century and ended at the beginning of the 20th century with the fixation of village territory (dzaa) (Dugast 1949; Alexandre 1965; Laburthe-Tolra 1981; Mveng 1981; Balandier 1982; Vansina 1990; Leplaideur 1992; Diaw 1997). The villages were characterized by fixed boundaries as opposed to their temporary settlements observed before this period. This fixation coincided both with the introduction of cocoa plantations and the imposition to set villages along

52
the road for the collection of taxes by colonial administration (Assoumou 1977; Guyer 1982; Leplaideur 1992; Santoir 1992). These permanent settlements contributed to the changed base of the indigenous economy, from subsistence to cash. Social institutions of land tenure were adapted to the new economic context in order to regulate land access rights within lineages (mvo’o) and extended families (nda bot). The axe rights were recognised as the predominant land rights of access from which derived the others rights of access in the abandoned villages (Diaw 1997; Oyono et al. 2000). During this current phase, the village territory becomes a vital space (dzaa) in terms of livelihood strategy and economic development. The use of markers like cocoa plantations and certain non timber-wood forest products (NTFP) such as Irvingia gabonensis (andok), Guibourtia tessmanii (esingang), Guibourtia demeussi (oveng), Baillonella toxisperma (adjap) and Ricinodendron heudelotii (njansang) became capital to individual tree-ownership and to secure space (Diaw 1997). The perception of nature amongst people of the study area is based on their views of the world, philosophy of life and beliefs, and traditional religions (Mviena 1970; Laburthe-Tolra 1981, 1985; Oyono 2002). These conceptions, partly influenced by the introduction of Christianism, delineate two major representations of nature, i.e. the spiritual and terrestrial worlds. These representations are described as follows: (i) the spiritual world comprises their cosmo-vision of God (zamba), the phantoms (bekon), the knowers (beyem) and the witchcraft (ngwbel); (ii) the terrestrial world (si don) includes the human and natural worlds. It represents where and how life takes place in terms of provision, habitat, creation and social life, as mentioned by Gonese (1999) in the study of the Bantu conception of life. The natural world is represented by water (medim), lands (mesi), plants including trees and herbs (bile, bilok), wild and domestic animals (betid) and overall living and non-living things (bikomnga). The human world is represented by the human-beings (bot), the social institutions that govern their life and the style of natural resource property, ranging from household to common pool (elig, nda bot, ayong). The relationships between the components of the conception of nature converge into the search of well-being (mvoe) within the community (Ngono Undated; Mviena 1970; Dounias and Hladik 1996; Carrière 1999; Oyono 2002; Oyono et al. 2003; Mala et al. 2006). It has been shown that the local management of biodiversity and natural resources is based on certain ecological beliefs, ideological values, and perceptions of nature and knowledge systems. These empirical and cognitive schemes guide human activities to set the conditions of coexistence of plants, fauna and the factors of the environment in order to maintain a threshold of agricultural and forest productivity, and the recovery of vegetation (Dounias 1996; Dounias and Hladik 1996; Bahuchet 1997). The examination of how local ecological knowledge can interfere with scientific knowledge for the development of sustainable adaptive collaborative natural resource management options integrating forest dynamics, agriculture viability and biodiversity sustainability is a key issue to address. Figure 3.1.1 presents the Bantu conception of nature.
3.2 METHODS 3.2.1 Description of study area The study was conducted in the humid forest zone of southern Cameroon within the forest margins benchmark area (FMB) of the Alternatives to slash and burn programme (ASB). This

53
benchmark area delineated research and development domains on the basis of resource use intensification and associated socio-economic and demographic variables (ASB 2000; Gockowski et al. 2004). The 15 500 km2 benchmark area encompasses gradients of both population density (from <5 persons km-2 to over 150 persons km-2) and market access (ASB 2000; Gockowski et al. 2004). The climatic, ecological and biophysical characteristics of the area are well documented (Letouzey 1985; Leplaideur 1992; Santoir 1992; Gockowski et al. 2004). The benchmark area falls within the Sanaga-Ntem region and reflects the socio-economic and cultural characteristics of the people (Balandier 1982; Leplaideur 1992; Santoir 1992; Diaw 1997; Gockowski et al. 2004). The study area is presented in Figure 3.2.1.
Figure 3.1.1 The Ntem-Sanaga region conception of nature. Adapted from Gonese (1999) and Haverkort and Rist (2004) The study area represents the physical and cultural area extending from the Sanaga to the Ntem and Woleu rivers in the southern Cameroon, northen Gabon and Equatorial Guinea, emphasizing its cultural and linguistic coherence (Dugast 1949; Laburthe-Tolra 1981; Mveng 1981; Balandier 1982; Vansina 1990; Leplaideur 1992; Diaw 1997). The inhabitants of this study area are Western Bantu forest dwellers who practise shifting cultivation; This practice is based on a system of property rights which is the product of both migration and history (Diaw 1997). This system of rights and the corresponding tenure principles are not merely linked to, but are actually embedded in, the principles of achieving livelihood and community socio-economic development, mainly genealogical rights and processes of segmentation (Diaw 1997; Vermeulem and Karsenty 2001). 3.2.2 Sampling methods Six villages were selected within the humid forest benchmark of southern Cameroon, distributed equally in its three blocks based on the intensity of R&D activities. The two top villages in terms of the higher intensity R&D activities, were selected per block. The major criteria for the selection of villages was the intensity of research activities. The intensity of research activities was measured by three categories based on the monthly duration of the interventions, as follows:
Conserve to maintain communication channels with spiritual world
Providing messages
Provide guidance, punishement or blessing
Request blessing + guidance
Provision and habitat
Creation of habitat
Natural World
Si
Human World
Si
Spiritual
world yop
Well-being (mvoe)

54
low = three days of activities; medium = one week of activities; high = more than 10 days of activities, including a report of the field activities. For each block, a matrix was used to categorize each village as low, medium and high intensity of research activities, using the different criteria. In each block the two villages with the highest rating for intensity of R&D activities were retained because the hypothesis was to see how the outcomes of the interplay of knowledge systems to forest-agriculture innovations are affected by the biophysical and socio-economic context, knowledge base and field processes. This was followed by the selection of two levels of samples for interviews: focus groups and individual survey. Figure 3.2.1 Research study sites within the benchmark of southern Cameroon
In each village, 10 persons were selected for the individual interviews, i.e. a total of 60 persons (10*6) for this specific study. The first criterion for the selection was the internal socio-diversity in terms of number of clans/lineages in each village. The other criteria used, was the designation
Memgomo
Akok
Ebolowa
Mvoutessi
Mbalmayo
Awae
Nkometou
Nkolfoulou
Yaoundé
◊ ◊
◊
◊
◊ ◊
17, 2374 km
N
E O
Nkogmesse Nkolmelok
Etoud
.
. .
. . .
.
. .
Kaya II
Evindissi Ngat
Nkolmetet
Obang II
Minsele
Mekoe
Legend
◊ Study sites

55
of individuals by the villages based on their knowledge of the socio-cultural and history of the villages by considering, when possible, a balance in gender (women and men) and user groups (such as hunters, fishermen and “artisanal” loggers). In each village, a list of potential persons was compiled with the relevant categories assigned to each name. In each category, names were selected randomly, except for members of user groups. In this category, due to their specific activities and relation with the forest, they were often very few people and everybody knows them in the village.
A focus group of 15-20 persons was constituted in each village. Firstly, the 10 people who participated in the individual interviews formed part of the focus group. In addition, other people who could not participate in the interviews but who have been designated by the villages were incorporated into the focus groups. These focus groups were used for development of the participatory agroecological map of villages and for the general discussion on the concept of nature, and perception and knowledge of forests and NRM practices. 3.2.3 Data collection The data were collected using a semi-structured questionnaire (Appendix 1, Section 3), that was administrated in three rounds as follows: The first round of interviews targeted the focus group in each village. In each village, the focus group discussons were conducted, with facilitation from the researchers, to develop a participatory agro-ecological map of the village. The process started with the delimitation of the territorial boundaries, followed by the positioning of all the rivers and streams, the cocoa plantations, the different forests and fallow stages and current mixed food-crop farms. The hunting and fishing areas, sacred places, and important niches for collection of non wood timber forest products (NTWFP) were located. Each focus group discussion took 3.5 to 4.5 hours because some discussions among village members took a long time before a consensus could be reached. An agroecological map with several layers of information was generated. In the second round, the individual interviews were carried out during 1.5 to 2 hours in both French and local languages (Ntumu, Bulu, Bene-Ewondo and Eton) to describe components of the vital space and the relationships between the society, the natural world and the spiritual world, the perception of forests. It has been also discussed and the how its the components of living space affect livelihoods, its major utilization and resource management practices, the social and economic functions of forests, the local classification of forests in relation to their main activities, and local agro-climatic and time management knowledge systems affecting forest and NRM practices. The third round was a general discussion with focus groups followed by their validation at the village level. During this round, the maps generated in the first round and some information obtained from the second round were used as basis for the general discussions on the identification/names of local indicators for the description of forests, classification of forests, the management of time, and to clarify with the whole group the pending data that were not consistent from the individual interviews. Each focus group discussion took 3- 4 hours because some discussions among village members were intensive before a consensus could be reached.

56
3.2.4 Data analysis The discourses of respondents have been transcripted and organized by clusters in order to get meaningful information. For data analysis, a matrix was developed to deconstruct the discourse of respondents on the concepts of nature guiding the structuring of local knowledge of forest management. First, several traits of this discourse that brought out some generalizations of the perceptions, beliefs and the ideological values were identified. Secondly, some traits relating to local perceptions of forests were characterized based on the aggregation of markers on the discourse. These markers were either for utilitarian uses, functional and representative of the nature and forest. Thereafter, for each marker, some elements of perceived distance between the forests, its uses, and its socio-economic functions were assigned to each marker. Then, the percentage of responses over the total number of respondents was calculated and assigned to each of the forest discourse markers. Concerning the formulation of local knowledge of forest management, a cross-checking of similarities and contradictions was made through the identification of indicators by the type of markers of forest classification, tree and animal names, relations between trees/animals, management of time and management of natural resources. This helped to analyze the relationships between local perceptions of nature and their components of the perceptions of nature, forest knowledge systems derived and how these perceptions affect forest management and agricultural practices. 3.3 RESULTS 3.3.1 Description of the vital space of the people of study area The discussions of agroecological maps of the respondents generated a social representation of nature that is embedded in their vital space (dzaa). This vital space of the people is spatially structured from the household or family (nda bot/mvôg) to the village territory (dza’a), as one entire global system. This vital space integrates progressively five major traits: the household combining the house plus a variant which is the man house in French ‘corps de garde’ (n’da, abaa), the court (n’seng), the bin (akun), the private zone (fa’a), the agricultural fields (ekotok or ekorog) and the forest area (afane). Each zone is more or less defined and delimited, and its uses are well known. These zones are described in detail in Table 3.3.1 in terms of social meanings, their forms and their uses. 3.3.2 Characterization of the relationships between the components of vital space of the people of study area The discourse of the respondents generated a list of six categories of natural resource management based on the perception of the landscape affecting the human activities (Table 3.3.2). These components of vital space include the spatial markers affecting human activities such as forest land including its content and its biodiversity (trees, food and crops), agricultural lands, animals and rivers. Each category of NRM provides messages for humans, which serves to build the maintenance of communication channels in terms knowledge to interpret natural phenomena and to capitalize them for food, house building, medicine, rituals and person family names. These relationships are presented in detail in Table 3.3.2. The messages provided to human systems refers to the fact that humans can capture some messages from others living
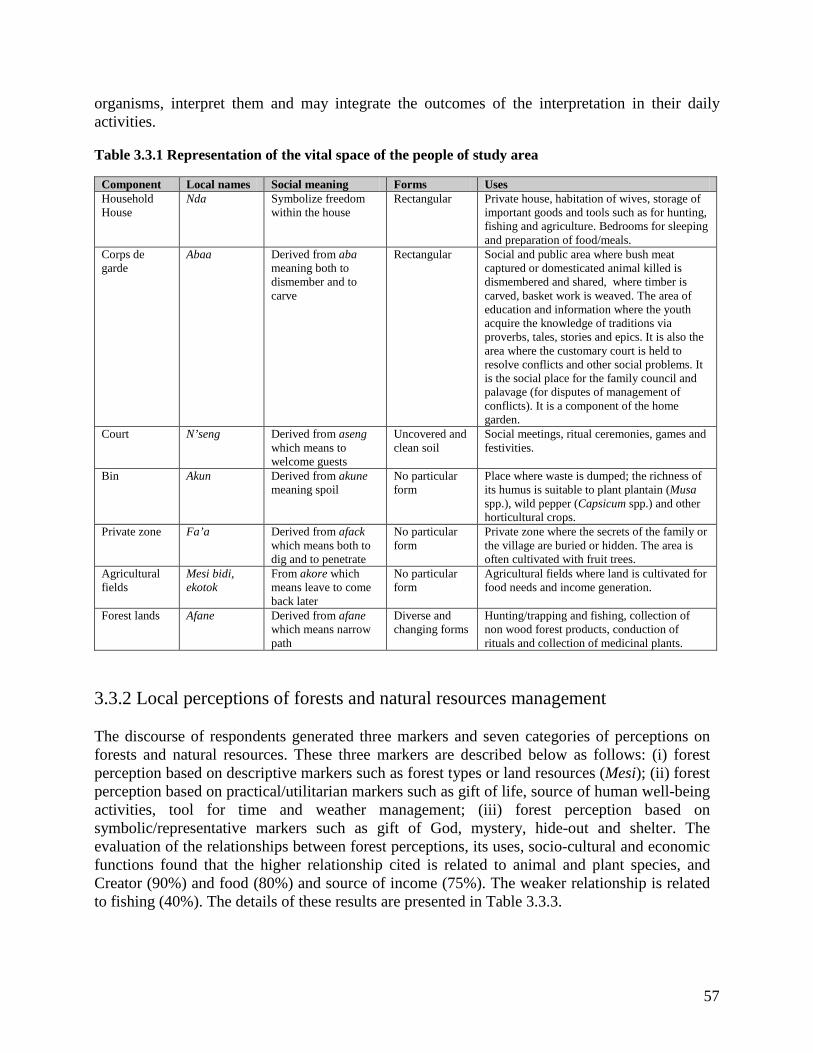
57
organisms, interpret them and may integrate the outcomes of the interpretation in their daily activities. Table 3.3.1 Representation of the vital space of the people of study area
Component Local names Social meaning Forms Uses Household House
Nda Symbolize freedom within the house
Rectangular Private house, habitation of wives, storage of important goods and tools such as for hunting, fishing and agriculture. Bedrooms for sleeping and preparation of food/meals.
Corps de garde
Abaa Derived from aba meaning both to dismember and to carve
Rectangular Social and public area where bush meat captured or domesticated animal killed is dismembered and shared, where timber is carved, basket work is weaved. The area of education and information where the youth acquire the knowledge of traditions via proverbs, tales, stories and epics. It is also the area where the customary court is held to resolve conflicts and other social problems. It is the social place for the family council and palavage (for disputes of management of conflicts). It is a component of the home garden.
Court N’seng Derived from aseng which means to welcome guests
Uncovered and clean soil
Social meetings, ritual ceremonies, games and festivities.
Bin Akun Derived from akune meaning spoil
No particular form
Place where waste is dumped; the richness of its humus is suitable to plant plantain (Musa spp.), wild pepper (Capsicum spp.) and other horticultural crops.
Private zone Fa’a Derived from afack which means both to dig and to penetrate
No particular form
Private zone where the secrets of the family or the village are buried or hidden. The area is often cultivated with fruit trees.
Agricultural fields
Mesi bidi, ekotok
From akore which means leave to come back later
No particular form
Agricultural fields where land is cultivated for food needs and income generation.
Forest lands Afane Derived from afane which means narrow path
Diverse and changing forms
Hunting/trapping and fishing, collection of non wood forest products, conduction of rituals and collection of medicinal plants.
3.3.2 Local perceptions of forests and natural resources management The discourse of respondents generated three markers and seven categories of perceptions on forests and natural resources. These three markers are described below as follows: (i) forest perception based on descriptive markers such as forest types or land resources (Mesi); (ii) forest perception based on practical/utilitarian markers such as gift of life, source of human well-being activities, tool for time and weather management; (iii) forest perception based on symbolic/representative markers such as gift of God, mystery, hide-out and shelter. The evaluation of the relationships between forest perceptions, its uses, socio-cultural and economic functions found that the higher relationship cited is related to animal and plant species, and Creator (90%) and food (80%) and source of income (75%). The weaker relationship is related to fishing (40%). The details of these results are presented in Table 3.3.3.

58
Table 3.3.2 Relationships between components of the vital space of the people of study area
Natural resource management categories
Messages provided to human systems
Maintenance of communication channels: local agro-ecological knowledge
Benefits to human and natural systems
Forests and agricultural landscapes (trees and food crops)
Behaviour, physical qualities; ecological and biophysical responses to climate stress; attacks by animals and humans; their uses
Regulation in use and maintenance of use; domestication and plantation; space markers
Human names derived from such knowledge such as trees (Bile), forest (Afana), Gnetum spp. (Okoa), stone (Akoa), etc.
Agronomic performances and crop qualities; resistance of crops to pests-diseases and comparison among crops in terms of quality of crops; and food taste and qualities
Cropping and cultivation Crop varieties are given names which are symbolically charged and transferred them a ‘spirit’ to produce high and quality yields. Wild fruit trees such as Dracryodes edulis (sa’a) and Persea americana (fia) received names that reflected the abundance and the quality of their fruits
Animals Behaviour, ecology, biology of reproduction and representativeness vis à vis other animals Insect movements
Domestication, hunting, trapping, consumption for good health and protection against certain diseases
Animal names are given to humans such as panthers (Ze) and elephant (Zoa), etc… Natural phenomena names such as the transition from one season to the other such as dry season (esep) are linked to the movements of animals and insects such as termites, birds, butterflies which are used as indicateors to conduct local activities, on one hand, and on the spread of human diseases, on the other
Rivers Behaviour of rivers and their content, quality of their contents, abundance of specific fishery products and other indicators of animals
Fishing; space marker
Rivers are given names linked to local knowledge of bio-indicators of the dominant fish species or niche of animals or other social events; humans received the names of some fish products
Lands and hills
Complexity of nature and ecological niches
Uses and markers of lands and spaces
Lands, hills, mountains are also personalized to maintain communication channels and names are also given to these resources such as toponyms
Table 3.3.3 Local perceptions of nature and forests resource management of the people of study area
Markers of the perception of nature and forest
Content of markers
Perception of distance* between forest, its uses, its socio-cultural and economic functions
Percentage of responses
Descriptive Forest types or land use system (Mesi)
Animal and plant species 90
Practical/utilitarian Gift of life Source of human well-being activities Tool for time and weather management
Food Income generation (money) Raw material/house building Labor Hunting Fishing
80 75 55 40 40 30
Representative Gift of God Mystery /hide-out/shelter Fear
Creator Creation Witchcraft
90 75 65
*Similar to linkage or relationship, but this is what is in the mind of the respondents.
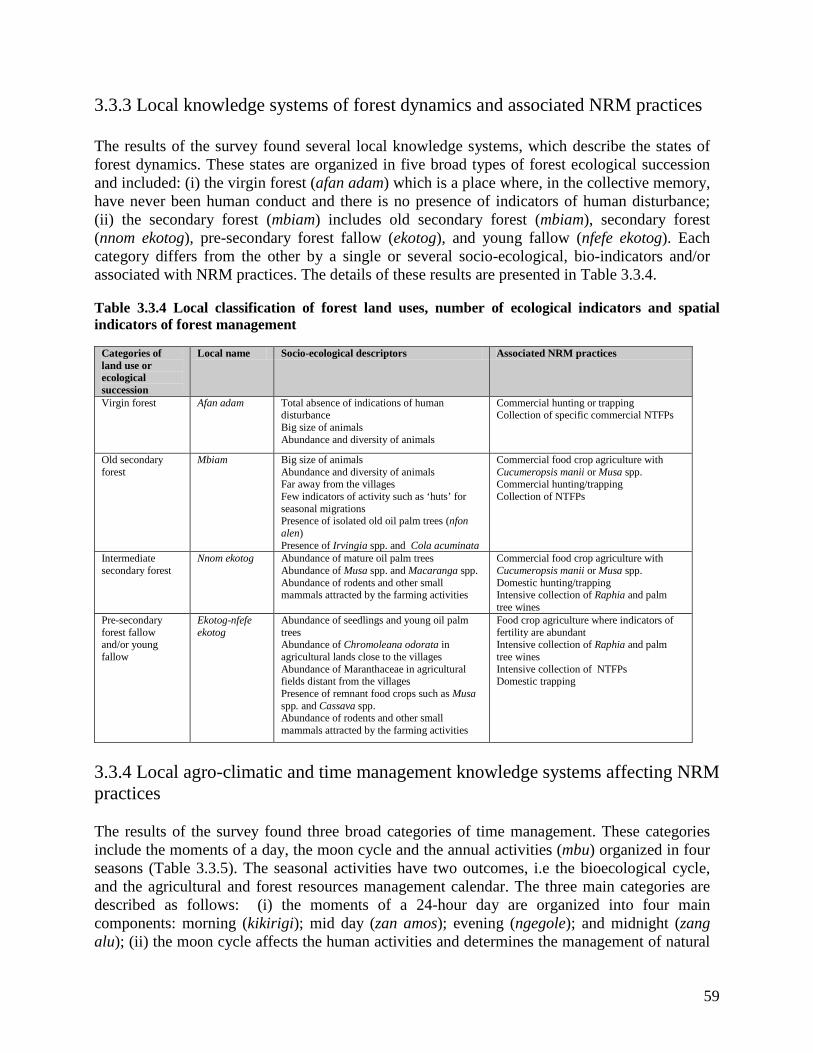
59
3.3.3 Local knowledge systems of forest dynamics and associated NRM practices The results of the survey found several local knowledge systems, which describe the states of forest dynamics. These states are organized in five broad types of forest ecological succession and included: (i) the virgin forest (afan adam) which is a place where, in the collective memory, have never been human conduct and there is no presence of indicators of human disturbance; (ii) the secondary forest (mbiam) includes old secondary forest (mbiam), secondary forest (nnom ekotog), pre-secondary forest fallow (ekotog), and young fallow (nfefe ekotog). Each category differs from the other by a single or several socio-ecological, bio-indicators and/or associated with NRM practices. The details of these results are presented in Table 3.3.4. Table 3.3.4 Local classification of forest land uses, number of ecological indicators and spatial indicators of forest management
Categories of land use or ecological succession
Local name Socio-ecological descriptors Associated NRM practices
Virgin forest
Afan adam Total absence of indications of human disturbance Big size of animals Abundance and diversity of animals
Commercial hunting or trapping Collection of specific commercial NTFPs
Old secondary forest
Mbiam Big size of animals Abundance and diversity of animals Far away from the villages Few indicators of activity such as ‘huts’ for seasonal migrations Presence of isolated old oil palm trees (nfon alen) Presence of Irvingia spp. and Cola acuminata
Commercial food crop agriculture with Cucumeropsis manii or Musa spp. Commercial hunting/trapping Collection of NTFPs
Intermediate secondary forest
Nnom ekotog Abundance of mature oil palm trees Abundance of Musa spp. and Macaranga spp. Abundance of rodents and other small mammals attracted by the farming activities
Commercial food crop agriculture with Cucumeropsis manii or Musa spp. Domestic hunting/trapping Intensive collection of Raphia and palm tree wines
Pre-secondary forest fallow and/or young fallow
Ekotog-nfefe ekotog
Abundance of seedlings and young oil palm trees Abundance of Chromoleana odorata in agricultural lands close to the villages Abundance of Maranthaceae in agricultural fields distant from the villages Presence of remnant food crops such as Musa spp. and Cassava spp. Abundance of rodents and other small mammals attracted by the farming activities
Food crop agriculture where indicators of fertility are abundant Intensive collection of Raphia and palm tree wines Intensive collection of NTFPs Domestic trapping
3.3.4 Local agro-climatic and time management knowledge systems affecting NRM practices The results of the survey found three broad categories of time management. These categories include the moments of a day, the moon cycle and the annual activities (mbu) organized in four seasons (Table 3.3.5). The seasonal activities have two outcomes, i.e the bioecological cycle, and the agricultural and forest resources management calendar. The three main categories are described as follows: (i) the moments of a 24-hour day are organized into four main components: morning (kikirigi); mid day (zan amos); evening (ngegole); and midnight (zang alu); (ii) the moon cycle affects the human activities and determines the management of natural

60
resources and the farming practices when it is full or medium full; (iii) the four seasons of the year (mbu) are the main dry season (esep) and short dry season (oyôn), and the main rainy season (sugu-oyôn) and the short rainy season (sugu-esep). This division of time determines agricultural practices, gathering of forests products, hunting and fishing, and livelihood strategies, and is presented in Table 3.3.5. Table 3.3.5 Effects of the seasonality knowledge and time management on local natural resource management activities by the people of study area
Main season category
Season classification
Local name
Type of indicators
Associated activities per gender Men Women
Dry season Short dry season oyôn Presence of caterpillars Abundance of wild fruits
Forest clearing Trees felling
Harvesting of food crops Patch clearing and cultivation of food crop farms Harvesting and commercialization of forest products
Long dry season esep Movement of insects, birds and wildlife Falling of tree leaves
Forest patch clearing Hunting of small rodents
Traditional fishing
Rainy season
Short rainy season sugu-esep
Flowering of cocoa plantations
Maintenance of cocoa plantations
Intensive farming activities and harvesting of food crops Harvesting of forest products
Long rainy season sugu-oyôn
Harvesting of cocoa Commercialization of cocoa production Intensive hunting/trapping
Support to cocoa harvesting Harvesting of food crops
3.4 DISCUSSION 3.4.1 Concept of nature based on the social representation of the vital space of the people of study area The description of the vital space of people of the study area is structured from the family house (nda bot/mvôg) to the village territory (dzaa); it is both a geographical and sociological space (Table 3.3.1). This social representation can be aligned to the philosophical concept of nature by the Bantu, such as the people of Ntem-Sanaga region, as follows: the physical world corresponds to several land uses. The human world corresponds to the family house and social institutions. Its link with the spiritual world is made though the private zone (fa’a) and the forest lands (mefane). It has been shown that each trait of this vital space has a function that affects the economic, social and spiritual life of people. This structure contributes to fulfill their life in terms of knowledge sharing, livelihood and solidarity. This social representation of the vital space confirms the results of similar studies conducted with other people of the Ntem-Sanaga region but also from the benchmark area, such as the Mvae and Yassa in the coastal area (Dounias 1996; Dounias and Hadlik 1996) and by the Fong in Mvoutessi (Diaw and Oyono 1998), villages in the southern Cameroon.

61
It has been shown that the social and geographical universe of the people of study area is divided into several zones, each having a social meaning that symbolizes their use to fulfill the socio-cultural, spiritual, ecological and economic functions (Laburthe-Tolra 1985; Vansina 1990; Woodley 2004). These results indicate the existence of a strong socio-cultural background for the conception of nature within the study area, and confirm the socio-cultural dimension of forests and natural resource management in southern Cameroon (Bahuchet 1996; Dounias 1996; Oyono 2002). For this reason, people of study area have defined rules to provide equitable acces and sharing of natural resources for their management and to live in harmony with nature. This confirms the existence of such conception of nature in other similar Bantu groups and that the existence of the concepts of nature and forests are well integrated in their beliefs and ideological values (Gonese 1999; Haverkort and Rist 2004). 3.4.2 Characterization of the relationships between the components of vital space of the study area The relationships between the natural and human worlds are the important channels to maintain interactions with the spiritual world. These relationships contribute to the formulation of local ecological and environmental knowledge systems, the utilization of available natural resources, the appropriation of the natural world, and the integration of the biophysical, economic and spiritual values of elements of the natural world within the human world (Table 3.3.2). The provision of messages to the human system and the maintenance of communication channels between the spiritual world and natural systems are regulated through several components of the natural world. These components include wild trees, food and tree crops, animals, and the management of resources in rivers, on agricultural fields and other lands and hills, and seasons. They affect the perception of human activities. These components are given names based on local knowledge of their biology, ecology, agronomic performance, pharmaco-dynamic properties and biophysical adaptability of these resources (Table 3.3.2). For example, names are given to humans in order to transfer these spiritual and qualitative values. This contributes to an interdependence of the components of nature. The illustration is given by the messages received and benefits of maintaining communication channels between the spiritual, social and natural dimension of vital space (Laburthe-Tolra 1981, 1985). The maintenance of these relationships is designed to maintain a threshold of well-being and livelihoods of life and it confirms the existence of similar conceptualizations of nature by other forest-dependent peoples (Colfer et al. 2001; Sène 2003; Woodley 2004). The formulation of local knowledge on bio-physical characteristics, behaviour, values and uses of trees, herbs and animals also indicate the symbiosis that exists within the conception of nature by the people of Ntem-Sanaga region. This symbiosis determines the management of nature and the conservation of its social, ecological and economical functions. These relationships are reflected in the major benefits of the natural system, such as the cultivation of several crop varieties and the keeping and/or plantings of trees during and after the clearing, like those observed in the indigenous people practices in South America and in South East Asia (Ingold 2000; Joshi et al. 2001; Sinclair and Joshi 2001). This confirms the existence of social symbolism behind certain names that determines also the consumption of certain crops, forest products or wild animals

62
through which people require provision and protection against diseases (Laburthe-Tolra 1985; Oyono 2002). 3.4.3 Local perceptions of forests and natural resources management The markers and seven categories of perceptions on forests and natural resources generated from the discussions indicate that these perceptions delineated socio-cultural and socio-economic functions (Table 3.3.3). The results show that the local definition of a forest is not linear, but that it is based on indicators of its uses and practices associated with its different states (Table 3.3.3). The results emerging from discussions with respondents show that forest perceptions are rooted in a conception of God (95%). The results show that the distance (close to linkage but in the perception of the respondents) between forest and God represents the highest citing by the respondents, illustrating the cosmological background of the local perception of forest and its natural resources in the study area. The discussions around the creation of living things, the value of labor and the management of time (Table 3.3.3) indicate that every natural world knowledge system built by forest people is driven by the cosmo-vision of value (God, labor), emotion (blood ties and solidarity), goals (well-being, markets and land appropriation) and actions to anticipate uncertainties and surprises. This confirms the socio-cultural and cosmological background of local forest management in spatio-temporal scales similar to people living in other similar areas such as in Indonesia and Brazil (Laburthe-Tolra 1981; Vansina 1990; Colfer et al. 2001; Altieri 2002; Armitage 2003). Besides these cosmomogical dimensions, the perceptions behind forest and natural resources are maintained by the perceptions of the social representation of forests is more linked tree-animals-hunting (90%), to food (80%) and to money(75%). These results indicate the reasons of the rural settlement, the introduction of cocoa plantations and land tenure systems of the people of Ntem-Sanaga region, change the nature of their relationships with land and the perception of wealth (Ngono Undated; Assoumou 1977; Balandier 1982; Laburthe-Tolra 1985; Leplaideur 1992; Diaw 1997; Vermeulen and Carrière 2001). These results are also similar to the perceptions of forests by indigenous people in West Kalimantan in Indonesia (Brodt 2001; Colfer et al. 2001). 3.4.4 Local knowledge systems of forest dynamics and forest management The results show that the local knowledge systems of forest dynamics and forest management are related to the socio-ecological descriptors and associated NRM practices. There is a kind of polarization of these socio-ecological indicators and practices between the ‘virgin’ forest and the different states of secondary forests (Table 3.3.5). These descriptions are built on a chain of functions, ecological and socio-ecological attributes and human activities defined over time. This indicates that forest management practices are based on factors which regulate vegetation development, land and forest productivity, wildlife abundance and management of other natural resource components (Colfer and Dudley 1993; Fairhead and Leach 1994; Dounias 1996; Dounias and Hadlik 1996; Diaw and Oyono 1998). This confirms the effective socio-economic and cultural uses of forests already shown for Pygmies and Beti in their relationships with their natural environment in southern Cameroon (Mviena 1970; Bahuchet 1996, 1997; Oyono 2002).

63
While most international definitions of forests are linear, and highlight the biophysical functions such as the minimal size of trees, the area of ecosystems, and environmental services (FAO 1998; Gyde 2002; Helms 2002), the local perceptions of forests put forward the distance between the perceptions of forest and its socio-cultural and economic functions (Table 3.3.3). The relationships between the attributes of local forests and labor are key to defining forest land use ownership. This also confirms that for forest people, land rights are inherent to the reproduction of the social system by creating the socio-ecological conditions. This would determine the natural resource management within the village (dzaa) for sustainable livelihoods and to enhance its adaptive capacity within spatial-temporal scales (Diaw 1997; Vermeulen and Carrière 2001). This conception of life of people of the Ntem-Sanaga region shapes the local ecological knowledge of factors concerning the ecology and biology of the reproduction of plants and animals, and the symbiotic interactions between plants, animals and soil (Gillon 1992; Fairhead and Leach 1994; Altieri 2002; Joshi et al. 2004). 3.4.5 Local agro-climatic and time management knowledge systems affecting NRM practices The results show that there is a relationship between the management of time and the sequences of human forest and agricultural practices. Each division of time, during the year (seasons), the moon cycle and the moments of a day, is associated with a specific task in agriculture, hunting, fishing and/or collection of non wood forest products (Table 3.3.5). There is also a polarization of activities between the season categories. Forests are cleared and trees are felled during the dry season, while farms are maintained and crops are harvested during the rainy seasons. Hunting/trapping and fishing are intensively conducted during the rainy and dry seasons (Table 3.3.5). The local management of time is also associated with the bioecological processes of elements of the natural system (Table 3.3.5). The results show that the factors affecting the time management such as weather, seasonal changes, and ecological behavior of plants and animals, are well integrated in the local knowledge management. The processes associated with the seasons and climate transitions affect the development of living species, such as the falling of leaves of certain tree species such as Mammea africana (abotzok) and Ceiba pentendra (doum), and the movements/migrations of insects, termites, birds and animals. These seasonal processes then become time management tools to anticipate management practices in terms of seasons, using these nature-based indicators which integrate the complexity and uncertainty of nature (Mviena 1970). All these factors impact on the management of the agricultural calendar which is the main support for the organization of agricultural strategies, and non-agricultural activities such as hunting, fishing and gathering of non wood forests products (Ngono undated; Vermeulen and Carrière 2001). The human disease names are also an expression of such disequilibrium in the maintenance of communication channels between the human and natural worlds (Laburthe-Tolra 1981, 1985; Gonese 1999). Overall the results moderate the dominant discourse on biodiversity conservation and sustainable natural resources management which claim the inability of local systems of forest management systems to rationalize their practices. Importantly, results from this study confirm that local natural resource management practices are based on integrated and interrelated components of a

64
world view of relationships between society, economy and environment (Holling 2001; Altieri 2002; Gunderson et al. 2002; Instone 2003; Haverkort and Rist 2004) and not through a conflictual perspective between these components (ASB 1995, 2000). These relationships are dynamic and complex, and determine the ecological rationality of the practices of the people of Ntem-Sanaga. The management of the concept of nature and the associated local knowledge and practices are effective in the interpretation of natural processes and in the management of forest resources. The utilization of local knowledge channels the maintenance of coexisting agricultural land uses and forest ecological succession states, as mosaics as in the case of the forest - savanna transition areas (Fairhead and Leach 1994). These derived local natural resource management practices confirm the knowledge base for decision-making which resulted from the interface between social systems and natural resources (Gillon 1992; Ingold 1992, 2000) or the relationships between environment, ecology, cultural and spiritual practices and history (Dounias 1996; Dounias and Hadlik 1996; Oyono 2002). The local perceptions of nature and forest knowledge management systems are tools that affect the management systems at the forest-agriculture interface and guide the implementation of adaptive forest management and agricultural practices. These tools could be used as some entry points to negotiate world views, and to share understanding of sustainable outcomes. They could also serve to overcome cultural clashes associated with biodiversity conservation, and to integrate knowledge systems in developing adaptive collaborative management options in the context of high biodiversity that prevailed in the humid forest zone of Cameroon. 3.5 CONCLUDING REMARKS This chapter has examined the relationships between local perceptions of nature, forest knowledge systems and forest-agriculture practices. Local perceptions of nature are based on the social representation of the vital space of the people of the study and in relationships with their life activities. Three forest management knowledge systems were derived from this conception of nature, which combine the space, the time and the supernatural. Traditional forest knowledge systems link the descriptions of their vital space based on ecological, social and economical indicators of forest and natural resource management. These knowledge systems affect forest management and agricultural practices in terms of understanding and interpretation of states of nature where human activities will take place. The local perception of nature and natural resource knowledge systems are tools that guide the implementation of human activities in terms of gathering forest products, hunting/trapping, fishing, and suitable agricultural practices, in order to warrant a threshold of forest and agricultural productivity. The overall results confirm that the local perception of nature and natural resource knowledge systems guide the implementation of local forest management and agricultural practices. 3.6 REFERENCES Alexandre P. 1965. Protohistoire du groupe Béti-People of Ntem-Sanaga région : Essai de systematization. Cahiers d’Études Africaines (5): 503-560.
65
Altieri AM. 2002. Agroecology: the science of natural resource management for poor farmers in marginal environments. Agriculture, Ecosystems and Environments 93 (2002): 1-24. Armitage DR. 2003. Traditional Agroecological Knowledge, adaptive management and the socio-politics of conservation in Central Sulawesi, Indonesia. Environmental Conservation (30(1)): 70-90. ASB. 1995. Alternatives to Slash and Burn Phase I Report: Forest Margins Benchmark of Cameroon, Alternatives to Slash and Burn Programm. Yaoundé: IITA Humid Forest Ecoregional Centre. ASB. 2000. Alternatives to Slash and Burn Phase II Report: Forest Margins Benchmark of Cameroon, Alternatives to Slash and Burn Programm. Yaoundé: IITA Humid Forest Ecoregional Centre. Assoumou J. 1977. L’économie du cacao. Paris : Delarge.156 p. Bahuchet S. 1996. La mer et la forêt : Ethnoécologie des populations forestières et des pêcheurs du Sud-Cameroun. In : Froment A, De Garine I, Binam Bikoï C, Loung J-F (eds.), Anthropologie alimentaire et développement en Afrique intertropicale: du biologique au social. Actes du colloque tenue à Yaoundé (1993). Paris : ORSTOM Bahuchet S. 1997. Introduction. Un style de vie en voie de mutation: Considération sur les peuples des forêts denses humides. Civilisation (44): 16-31. Balandier G. 1982. Sociologie Actuelle de l’Afrique Noire. Dynamique Sociale en Afrique Centrale. Paris: Presses Universitaires de France. 2è Edition. Brodt SB. 2001. A systems Perspective on the Conservation and Erosion of indigenous Agriculture Knowledge in central India. Human Ecology 29(1): 99-120. Carrière S. 1999. Les orphelins de la forêt: Influence de l'agriculture itinérante sur brûlis de Ntumu et des pratiques agricoles associées sur les dynamiques forestière du sud Cameroun. Thèse de Doctrorat. Montpellier : Université de Montpellier. 448 p. Colfer CJP, Dudley GR. 1993. Shifting Cultivators of Indonesia: Marauders or Managers of the Forest? Rice Production and Forest Uses Among The Ula’ Jalan of East Kalimantan. Rome: FAO. Colfer CJP, Woelfel J, Wadley RL, Harwell E. 2001. Assessing people's perceptions of forests: Research in West Kalimantan, Indonesia. In: Colfer CJP, Byron Y (eds.), People managing forests: the links between human well-being and sustainability. Washington DC: RFF. Cormier-Salem MC. 1999. Innovations et relations société-environnement. In : Chauveau JP, Cormier-Salem MC, Mollard E (eds.), Innovations en Agriculture: Questions de méthodes et de terrains d'observation. Paris: IRD Editions. pp 127-140.

66
Diaw MC. 1997. Si, Nda bot and Ayong: Shifting Cultivation, Land Use and Property Rights in Southern Cameroon. RDF Network paper 21e. London: ODI. 28 p. Diaw MC, Oyono PR. 1998. Dynamiques et Représentations des Espaces Forestiers au Sud Cameroun: pour Une Relecture Sociale Des Paysages. Arbres, Forêts et Communautés Rurales (15/16): 36-43. Diaw MC, Colfer C, Prabhu R. 1999. Pour le suivi participatif et la cogestion adaptive des forêts tropicales africaines. Document de travail. Bogor : CIFOR. 14 p. Dounias E. 1996. Recrus forestiers post-agricoles: perceptions et usages chez les Mvae du Sud-Cameroun. Journal d'Agriculture Tropicale et de Botanique Appliquée (38): 153-178. Dounias E, Hladik M. 1996. Les agroforêts Mvae et Yassa au Cameroun Littoral: functions socio-culturelle, structure and composition floristique. In : Hladik AH, Pagezy H, Linares OF, Koppert GJA, Froment A (eds.), L'alimentation en forêt tropicale; interactions socioculturelles et perspectives de développement. Paris : Editions UNESCO. pp 1103-1126. Dugast I. 1949. Inventaire ethnique du Sud Cameroun. Dakar: IFAN. Fairhead J, Leach M. 1994. Représentations culturelles africaines et gestion de l'environnement. Politique Africaine (53). FAO. 1999. Agricultural Policies for Sustainable Management and Use of Natural Resources in Africa. Rome: Food and Agricultural Organization (FAO) and Ibadan: IITA. 81 p. FAO. 2005. Forest Resource Assessment 2005. Rome: Food and Agriculture Organization of the United Nations (FAO). Fisher B. 1991. Studying indigenous forest management systems in Nepal: Toward a more systematic approach. USA: Environment and Policy Institute. Funtowicz S, Ravetz JR. 1990. Uncertainty and Quality in Science for Policy. Dordrecht : Kluwer Academic Publishers. Gillon Y. 1992. Empreinte humaine et facteurs du milieu dans l'histoire écologique de l'Afrique tropicale. Afrique Contemporaine 161 (30). Gockowski J, Tonye J, Baker D, Legg C, Weise S, Ndoumbé M, Tiki-Manga T, Fouaguegué A. 2004. Characterization and diagnosis of farming systems in the ASB forest margins Benchmark of Southern Cameroon. Ibadan: IITA. 67 p. Gonese C. 1999. The three worlds. Compass newsletter N°1. February 1999. Gunderson LH, Holling CS. 2002. Panarchy, Understanding Transformations in Human and Natural Systems. Washington: Islands Press.

67
Guyer IJ. 1982. Family and farm in Southern Cameroon. African Research Studies N°15. Boston: African Studies Center/Boston University. Gyde LH. 2002. When is a forest not a forest? Journal of Forestry (December 2002). pp 21-28. Haïla Y. 1999. Biodiversity and the divide between Culture and Nature. Biodiversity and Conservation (8): 165-181. Haverkort B, Rist S. 2004. Towards Co-evolution of knowledges and sciences: No shortcut in integrating local and global knowledge. Paper for the Compas panel in the conference: Bridging Scales and Epistemologies: Linking Local Knowledge with Global Science in Multi-Scale Assessments, Alexandria March 2004. Helms AJ. 2002. What Do These Terms Mean? Forest, Forestry and Foresters. Journal of Forestry (December 2002): 15-19. Holling C. 2001. Understanding the complexity of economic, ecological, and social systems. Ecosystems 11: 41-47. Ingold T. 1992. Culture and the perception of the environment. In: Croll E, Parkin D (eds.), Bush base: Forest farm - culture, environment and development. London: Routledge. pp 39-56. Ingold T. 2000. The perception of the Environment: Essays on Livelihood Dweling and Skilll. London: Routledge. Instone L. 2003. T(r)opical Translations : Reterritorialising the space of Biodiversity Conservation. Resource management in Asia-Pacific Program Working Paper No.46. Camberra: Research School of Pacific and Asian Studies/The Australian National University. Joshi L, Suyanto S, Catacutan DC, Van Noordwijk M. 2001. Recognising local knowledge and giving farmers a voice in the policy development debate. In: Van Noordwijk M, Verbist B (eds.), Towards integrated natural resource management. Forest margins of the humid tropics: local action and global concerns. Bogor: ICRAF-SEA. Joshi L, Shrestha P, Moss C, Sinclair FL. 2004. Locally derived knowledge of soil fertility and its emerging role in integrated natural resource management. In: Van Noordwijk M, Cadisch G, Ong CK (eds.), Belowground Interactions in Tropical Agroecosystems: Concepts and Models with Multiple Plant Components. London: CABI. Laburthe-Tolra P. 1981. Les seigneurs de la forêt. Essai sur le passé historique, l’organisation sociale et les normes éthiques des anciens Béti du Cameroun. Paris : Publications de la Sorbonne. Laburthe-Tolra P. 1985. Initiations et sociétés secrètes au Cameroun. Essai sur la religion Béti. Paris : Karthala. Leplaideur A. 1992. Les paysans du Centre Sud Cameroun. Rapports d’Etude. Montpellier : CIRAD/IRAT.
68
Letouzey R. 1985. Notice sur la géographie du Cameroun au 1/500 000. Toulouse : Institut de la Carte Internationale de la Végétation. Mala WA, Oyono PR. 2004. Some dimensions of local practices of natural management in Southern Cameroon. Research Review NS (20.2): 23-31. Mala WA, Zoa F, Biyong M, Abéga P, Ela CV, Oyono PR, Diaw MC. 2006. Perceptions et connaissances locales des systèmes de gestion des forêts au Cameroun Méridional: instruments de prise de décision et d'aménagement durable. Rapport final de projet pour le compte du Projet de réhabilitation et redynamisation de la station de recherche d'Ipassa/Makokou. Yaoundé : CIFOR. Mveng E. 1984. Histoire du Cameroun. Yaoundé : CEPER. Mviena P. 1970. Univers culturel et religieux du peuple beti. Yaoundé : Librairie Saint Paul. Ngono OP. Undated. Agriculture traditionelle chez les Ntumu. Study Report. Oyono PR, Diaw MC, Efoua S. 2000. Structures et contenu anthropologique du bilik : Au Cameroun. Environnement Africain XI (41-42): 10-20. Oyono PR. 2002. Usages Culturels de la Forêt au Sud-Cameroun: Rudiments d’Ecologie Sociale et Matériau pour la Gestion du Pluralisme. Africa LVII (3, 2002): 334-355. Oyono P R, Mala WA, Tonyé J. 2003. Rigidity versus adaptation: Contribution to the debate on agricultural viability and forest sustainability in Southern Cameroon. Culture and Agriculture Vol. 25. (No.2 Fall 2003). Prabhu R. 2003. Developing collaborative monitoring for adaptive collaborative management of African Forests. Final Report of the January 1, 2000-December 31, 2002. Harare: CIFOR. Ruitenbeck J, Cartier C. 2001. The Invisible Wand: Adaptive Co-Management as an Emergent Strategy in Complex Bio-economic Systems. Occasional paper No. 34. Bogor: Centre for International Forestry Research. Santoir C. 1992. Sous l'empire du cacao. Etude diachronique de deux terroirs Camerounais. A travers les champs. Paris : ORSTOM Editions.191 p. Sène EH. 2003. Arbres, forêts, croyances et religions en Afrique de l’Ouest Sahélienne. Unasylva 213 Vol. 55: 29-37. Sinclair FL, Walker DH. 1998. Acquiring qualitative knowledge about complex agroecosystems. Part 1: Representation as natural language. Agricultural Systems 56(3): 341-363. Sinclair FL, Joshi L. 2001. Taking local knowledge about trees seriously. Forestry, forest users and research: new ways of learning. ETFRN: 45-61.
69
Takacs D. 1996. The Idea of Biodiversity: Philosophies of Paradise. Baltimore: The John Hopkins University Press. Vansina J. 1990. Paths in the Rainforests: Toward a History of Political Tradition in Equatorial Africa. Madison: University of Wisconsin Press. Vermeulem C, Carrière S. 2001. Stratégies de gestion des ressources naturelles fondées sur les maîtrises foncières coutumières. In : Delvingt W (ed), La forêt des hommes: Terroirs villageois en forêt tropicale africaine. Gembloux: Les presses agronomiques de Gembloux. pp109-141. Wilson EO. 1999. Consilience: the unity of knowledge. New York: Random House. Woodley E. 2004. Local and Indigenous Ecological Knowledge as An Emergent Property of A complex System: A case Study in The Solomon Islands. Bridging Scales and Epistemologies: Linking Local and Global Science in Multi-Scale Assessment, March, 17-20, 2004. Alexandria, Egypt.
70
CHAPTER FOUR
LAND USE PATTERNS AND LOCAL INDICATORS OF FOREST-AGRICULTURE SUSTAINABILITY
4.1 INTRODUCTION The concept of sustainable agriculture refers to agriculture that is economically viable, socially balanced and ecologically sound, i.e. the corner stones of sustainable development (Zahm et al. 2004). Although, the challenge of sustainability is today universal, its interpretation varies and is often `controversial’ from one country to another, from one agro-ecological zone to another, and from a conventional to a traditional farm (Pim et al. 2003; Pretty 2006). In addition, the difficulty of universalizing agricultural sustainability is posed in terms of analytical scale and definition of indicators with relevant socio-ecological significance (Jeffrey 2000; Campbell et al. 2001; Prabhu et al. 2001; Altieri 2002; Mendoza and Prabhu 2004). This chapter will not examine agricultural sustainability from the perspective of the three components: economy, socio-territoriality and agro-ecology – that would be too broad (Woodwill and Röling 1998; Holling 2001; Zahm et al. 2004). Rather, this chapter is limited to sustainable agro-ecological outcomes (Gockowski et al. 2005).
Defined as the ability to maintain the fertility and productive potential of a farm in the long-term (Altieri 2002; Zahm et al. 2004; Pretty 2006), over the past 20 years, the main entry to address agro-ecological sustainability has been based on agronomic indicators in the humid tropics of West and Central Africa (Binswanger and Pigali 1987; Borlaug 1992; Lal 1993; Tonye et al. 1994; FAO 1999). During this period, attempts to use conventional agricultural sustainability indicators in terms of yield, nutrient management and performance of agricultural landscape mosaics in areas under slash and burn cultivation quickly showed their shortcomings (Mala et al. 2002; Oyono et al. 2000, 2003). In southern Cameroon, several land use innovations were based on the reasoning that forest-agriculture practices had a negative effect on soil fertility (ASB 1995, 2000; FAO 1999; Franzel 1999) and were considered a threat to economic development of Africa (Mokwunye 1996). However, those innovations have often encountered similar socio-ecological feasibility problems as crop-variety innovations (Mala and Oyono 2004).
These shortcomings are a challenge to the conceptual framework of technical innovation approaches. To overcome this gap, there is a need to understand the resilience of local natural resource management systems and under which conditions this resilience occurs (Hauser et al. 1994; Diaw and Oyono 1998; Altieri 2002). The studies and interventions leading to agro-ecological sustainability have continually focused on the introduction of agrochemical fertilizers and/or on the introduction of biofertilizers using trees, poles, shrubs and herbs (Tonye et al. 1994; Nolte et al. 1997; Kanmegne et al. 1999; Degrande and Duguma 2000; Kotto-Same et al. 2000). These efforts to find alternative innovations to slash and burn were articulated in six technological innovations, i.e. alley farming, multistrata systems, improved fallow systems, improved tree and shrub systems, improved herbaceous fallow systems, and integrated nutrient

71
management (INM) systems (Kang et al. 1990; Tonye et al. 1994; Duguma and Mollet 1997; Adesina et al. 1997; FAO 1999; Sanchez 1999; Degrande and Duguma 2000; Kanmegne 2004).
The range of these innovations indicates the complexity to address the issue of soil fertility management in a non-conventional agricultural system with a gradient of resource intensification, demographic and market access constraints (Gockowski et al. 2004). Such innovations were more or less adopted in the humid savanna areas (Adesina et al. 1997), but there seems to be a high abandonment of these innovations in the humid forest zone. Their high rate of abandonment may indicate that the knowledge systems behind their introduction were biased and that most of these innovations/technologies were both ill-adapted to social demand and overlapped on local mechanisms and indicators to regulate soil fertility (Gillon 1992; Grenand and Grenand 1996; Levang et al. 2001; Mala and Oyono 2004; Mala et al. 2006). It is often said that the maintenance of soil fertility in cropping systems on the forest margin of southern Cameroon is achieved largely through the system of fallow rotation. According to Gockowski et al. (2004), the critical parameters determining the effectivness in fertility restoration are the fallow period, the number of previous cropping cycles and the natural soil fertility. However, very little attention has been given to the understanding of local soil fertility maintenance mechanisms, the long-term production potential of non-conventional agriculture (Büttner and Hauser 2003), and how it enhances the performance of agricultural landscape mosaics.
Pioneer studies carried out in southern Cameroon have highlighted the resilience of local social institutions in relation to forest agriculture via the cropping-fallow-forest conversion cycle (Dounias 1996a; Diaw 1997; Robiglio et al. 2002; Robiglio and Mala 2005; Mala et al. 2006). Earlier studies on agro-ecological resilience have shown the positive impact of forest-agriculture and associated practices on forest regeneration dynamics (Dounias 1996a,b; Carrière 1999) and the traditional practices to manage soil fertility within the cropping-fallow-forest conversion cycle (Ngono Undated; Pourtier 1986; Hauser et al. 1994; Russel and Tchamou 2001; Büttner and Hauser 2003). These studies enriched discussions on the historical agroecological background of the organization and plant composition of tropical agroecosystems and their relevance to address the issue of sustainability. However, local factors that determine agroecological sustainability at the forest-agriculture interface were up till then not properly examined to identify under which conditions they enhance the performance of landscape agroforestry mosaics. This chapter attempts to link the local systems of ecological knowledge and the need to translate the concept of sustainability and resilience of local natural resource management systems at the forest-agriculture interface.
The objective of this chapter is to analyze the relationships between the social representation of land use patterns and their local indicators and agroecological resilience at the forest-agriculture interface. With this in mind, the key questions are: What are the social representations of the spatial resource associated with land use patterns and the indicators of human modified landscapes? What are the local indicators of agro-ecological resilience at the forest-agriculture interface? How do people use the indicators in practices at the forest-agriculture interface? How does this knowledge system affect the land use management patterns to enhance the sustainability of forest-agriculture? The main hypothesis in this chapter is that the resilience of forest-agriculture is guided by the historical-ecological perspectives of land use patterns and local indicators of forest-agriculture sustainability.
72
4.2 METHODS 4.2.1 Description of study area The study area is situated in southern Cameroon, a bio-geographical area with a surface of 22.5 million ha of which more than 0.5 million ha are under cultivation (Gockowski et al. 2004). The vegetation is influenced by an equatorial climate with a bimodal rainfall regime comprising four seasons (two rainy and two dry seasons). The climatic, ecological, biophysical and socio-economic characteristics of the area are well documented (Letouzey 1985; Santoir 1992; Gockowski et al. 1998). Under the umbrella of the Alternatives to Slash and Burn (ASB) programme, a benchmark area has delineated research and development domains on the basis of resource use intensification and associated socio-economic and demographic variables (ASB 2000). The 15,500 km2 benchmark area encompasses gradients of both population density (from <5 persons km-2 to over 150 persons km-2) and market access (ASB 2000; Gockowski et al. 2004). These gradients facilitated the segregation of the benchmark area into three blocks of high, medium and low ‘levels’ or ‘degrees’ of agricultural intensification, institutional development and environmental degradation, correspondng respectively to Yaoundé, Mbalmayo and Ebolowa. Soils in the benchmark area fall into the FAO grouping of orthic Ferrasols or Exisol-Ustox or Orthox with the exception of some alluvial soils in the northern-most portion of the benchmark area along the Sanaga river. These soils are characterized by their low nutrient status (Gockowski et al. 2005). The peneplain on which these soils have evolved varies from level to slightly undulating to rolling-hilly terrain. The dark red and red-yellow soils in the benchmark area are suitable for cocoa, coffee, oil palm and probably rubber if the clay content is high and the organic horizon has a good base saturation. Rubber is more suitable for the poorer sandy units (Gockowski et al. 1998, 2004). Four soil profile classes - Saa, Yaoundé, Mbalmayo and Ebolowa - with distinctive physical-chemical properties, form a north-south fertility gradient with a lower fertility in the southern part of the benchmark area (Gockowski et al. 1998). Annual precipitation falls in a bimodal pattern and ranges from 1350 mm to 1900 mm, with an increasing precipitation gradient from the northwest to the southeast (Gockowski et al. 2005).
The study sites are indicated in Chapter 3 in section 2 (see Figure 3.2.1). 4.2.2 Sampling methods Six villages were selected from within the humid forest benchmark area, with two in each block. The two top villages in terms of the higher intensity of R&D activities were selected per block. The major criteria for the selection of villages were the intensity of research activities. The intensity of research activities was measured by three categories based on the monthly duration of the interventions in three categories (three days of activities; one week of activities; more than 10 days of activities). For each block, a matrix was used to categorize each village as low, medium and high intensity of research activities, using the different criteria. In each block the two villages with the highest ratings were retained because the hypothesis was to see how the outcomes of the interplay of knowledge systems to forest-agriculture innovations are affected by the biophysical and socio-economic context, knowledge base and field processes. This was followed by the selection of two levels of samples for interviews: focus groups and households.

73
In each selected village, a focus group was constituted to develop participatory agro-ecological maps and to review and validate information on the indicators of human modified landscapes, their social meaning, the local types of soils and their local indicators of agro-ecological sustainability and forest productivity. The focus groups were composed of 15-20 persons, selected on the basis of socio-diversity within each village, and not based on the total population of each village (data were not available on total population of selected villages). The socio-diversity was based on: (i) age (young i.e <30 years old, adult i.e 30 to 60 years old; and old i.e >60 years old); (ii) gender, considering the balance between males and females, because they are conducting different types of activities and have different perspectives; (iii) people who were directly involved in the research activities via on-farm research; (iv) people belonging to a farmer-to-farmer organization because all the farmer organizations were linked in a network, and (v) people of specialized user groups such as hunters, fishermen and “artisanal” loggers, selected on the advice of villagers because of their good knowledge of the village territory, their availability in time and their capacity to contribute to discussion. Within each village, a list of potential persons was compiled per category. The people were selected from names listed by villagers of people who have a memory of the history of the village, the composition of clans/lineages, the sequence of settlement dynamics, the meanings of land use indicators and/or toponyms and knowledge of the limits and boundaries of the villages. Based on the number of categories per village, persons were randomly selected from each category to make up the number of 15 to 20 per focus group. In each selected village, five households were sampled to give a total of 30 households (5*6=30) for the study. The purpose was to assess bio-indicators of soil fertility management within the forest-agriculture interface and to gain an understanding of the conditions of soil fertility before forest clearing. In each selected village, the five households were selected based on the criteria of their participation in the development and utilization of the innovations. These criteria included three categories: (i) farmers involved in on-farm research and testing the innovations; (ii) farmers who were not directly involved in on-farm research but who have received benefits from on-farm research and have tested them; (iii) those who were not involved in any activity and who did not test any innovations. A list of names of households in each category was compiled to select respondents based on the estimated proportion of each group (category) over the total numbers given by the village. Four land uses were selected, from the nine land uses described before (Chapter 1, Section 1.3), for the assessment of bio-indicators of soil fertility management: cocoa agroforests, Cucumeropsis agroforests, preforest young fallow, and young secondary forest. These land uses were selected based on their role in the cropping-fallow-forest conversion cycle. They also cover a large spectrum of bio-indicators to understand the management of soil fertility within spatio-temporal scale (see Chapter 1, Section 1.4). Each household selected four land uses from their pool of land uses and then one person of the household, generally the head, brought the researchers to the site for data collection. In each of the land use types, one to four plots of 20 m x 20 m size were established based on the farmer’s knowledge of the farm size for cocoa and Cucumeropsis agroforests, and for the two others land uses, one plot has been applied in the site of the former farm site. It was subdivided into four sub-units in order to facilite the identification of indicators of soil fertility.
74
4.2.3 Data collection A structured questionnaire, divided into three sections, was used to collect data at the village and land use levels (Appendix 1, Section 4).
Sections 4 of the questionnaire were used to collect information from the focus groups based on group consensus at each village. The information collected included: (i) list of toponyms i.e the way people name the landscape units, and appropriate land use indicators for different landscape units; (ii) the meaning of each land use indicator and/or toponym, recorded per land use type; (iii) the classes of soil and the perception of their fertility status (as low, medium, high) with an indication of the suitable agricultural land use(s).
Land use information (bio-indicators of soil fertility management and conditions of soil fertility before forest clearing) was collected from the 30 selected households. The following data were collected: (i) the local names of the sites and their social meaning, when it was possible; (ii) Within each of the four selected land uses, the list of local indicators of soil fertility management, including age of vegetation/fallow, the plant species, soil type, and presence of earthworm activitiy; (iii) evaluation of the soil by the farmer, giving its local name and color, its soil quality and potential use for cropping, and allocating a rate of fertility ranging from low to high.
4.2.4 Data analysis Data were captured into Windows Excel spreadsheets. The list of toponyms was organized according to their meaning in relation to animals, plants and social systems in each village, and summarized at the study area level. The number of land use indicators per land use type was counted and the frequency of each indicator was calculated. The number of positive responses to soil fertility perception allocated to soil classes were calculated and the proportion of responses per soil class determined. The bio-indicators recorded per land were listed and the frequency of the top ten bio-indicators was generated per land use. A Chi-square test, using XLStat2007, was used to calculate the statistical significance of the relationships between local soil classification systems and types of appropriate agricultural land use.
4.3 RESULTS 4.3.1 Land use patterns and indicators of human modified landscapes: the toponyms These results are based on data collected from focus groups based on group consensus. The surveys recorded many toponyms in each of the six villages. These toponyms representing names of places have been organized into two sub-groups. The first group of toponyms reflected the nature of the name, i.e. its relationship with land use patterns. The examples include the spatial distribution of land uses such as rivers and streams (asoe, oton, oto'o), forests (afan), hills (nkol) and abandoned villages (bilik). The second group of toponyms reflected the meaning of the name. Each land use has a name in relation to animal species such as forest of panther (afan ze), plant species such as forest of Garcinia kola (afan essok), or Guibourtia demeussi (afan oveng), and
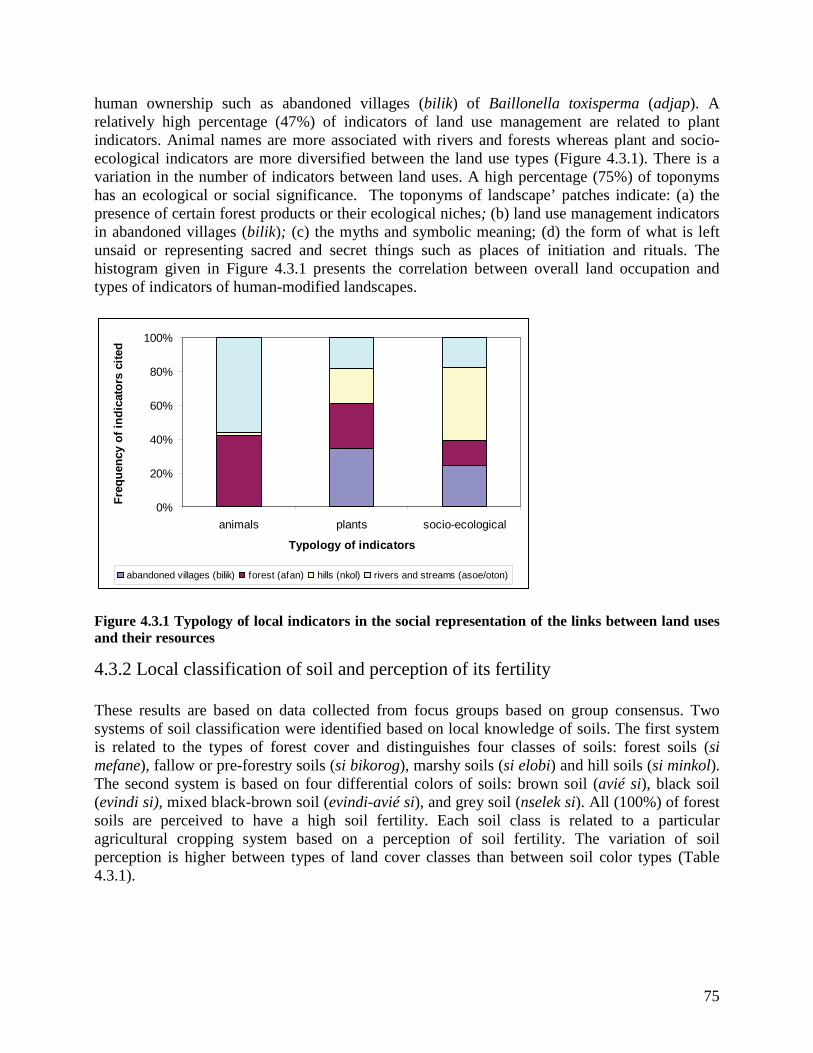
75
human ownership such as abandoned villages (bilik) of Baillonella toxisperma (adjap). A relatively high percentage (47%) of indicators of land use management are related to plant indicators. Animal names are more associated with rivers and forests whereas plant and socio-ecological indicators are more diversified between the land use types (Figure 4.3.1). There is a variation in the number of indicators between land uses. A high percentage (75%) of toponyms has an ecological or social significance. The toponyms of landscape’ patches indicate: (a) the presence of certain forest products or their ecological niches; (b) land use management indicators in abandoned villages (bilik); (c) the myths and symbolic meaning; (d) the form of what is left unsaid or representing sacred and secret things such as places of initiation and rituals. The histogram given in Figure 4.3.1 presents the correlation between overall land occupation and types of indicators of human-modified landscapes.
0%
20%
40%
60%
80%
100%
animals plants socio-ecological
Typology of indicators
Freq
uenc
y of
indi
cato
rs c
ited
abandoned villages (bilik) forest (afan) hills (nkol) rivers and streams (asoe/oton)
Figure 4.3.1 Typology of local indicators in the social representation of the links between land uses and their resources
4.3.2 Local classification of soil and perception of its fertility These results are based on data collected from focus groups based on group consensus. Two systems of soil classification were identified based on local knowledge of soils. The first system is related to the types of forest cover and distinguishes four classes of soils: forest soils (si mefane), fallow or pre-forestry soils (si bikorog), marshy soils (si elobi) and hill soils (si minkol). The second system is based on four differential colors of soils: brown soil (avié si), black soil (evindi si), mixed black-brown soil (evindi-avié si), and grey soil (nselek si). All (100%) of forest soils are perceived to have a high soil fertility. Each soil class is related to a particular agricultural cropping system based on a perception of soil fertility. The variation of soil perception is higher between types of land cover classes than between soil color types (Table 4.3.1).

76
4.3.3 Land uses patterns and recurrence of soil fertility indicators for the selection of agroforestry land uses These results are based on data collected from household interviews and represent 30 household responses. The respondents used 23 different types of biophysical indicators of soil fertility and land suitability for land use selection. These indicators covered five categories: age of forest/vegetation; presence of species of trees, poles, shrubs and herbs; earthworm activity; perception of depth of humus; and soil color. However, there are variations between blocks for indicators within these categories. The top ten most frequently cited indicators are as follows (Table 4.3.2): (i) For cocoa agroforest, the most frequently cited indicator is Pycnanthus angolensis (35.0%) but indicators vary between blocks. (ii) For Cucumeropsis agroforest, three indicators show a relative high frequency of citing: Musanga cecropioides (18.4%), Ficus spp. (17.5%) and Pycnanthus angolensis (17.0%) but the citing vary between blocks. In general, only plant indicators were found within the top ten indicators, except for soil color listed for Ebolowa. (iii) For pre-secondary forest young fallows, Chromoleana odorata is most frequently cited (32.3%) in all the blocks, followed by a relative high citing for Haumania danckelmanniana in the three blocks. Other indicators vary between blocks. (iv) For young secondary forests, Musanga cecropioides (50.0%) is most frequently cited (lowest in Yaounde block). Other indicators vary much between blocks. Table 4.3.1 Local classification of soil and perception soil fertility in southern Cameroon
Category of soils
Classification of soils
Local names Soil fertility perception
Perception of soil suitability
Percentage of respondents
Types of forest cover
Forest soils Si mefane High Cucumeropsis, plantain and cocoa agroforesty systems
100
Fallow soils Si bikorogo Low to high Mixed food crops 85 Swamp soils Si elobi High Food crops 85 Hill soils Si minkol High Several farming systems 75
Soil color Black soil Evindi si High Several farming systems 85 Grey soil Nselek si Low Less used for cropping 80 Brown soil Avie si High Mixed food crop
agroforests 75
Mixed brown-black soil
Evindi-avie si
Low Used by those who do not have land available
65
4.3.4 Local systems of classification of soils and types of appropriate agricultural land uses These results are based on data collected from household interviews representing 30 household responses. The local soil classification significantly influences the selection of forest lands for cropping (Chi-square=333.4, df=12, p<0.05). Respondents considered black soils (evindi si) good for all cropping systems, with all (100%) considering them suitable for cocoa-plantain and 61-78% consider them suitable for other cropping systems (Table 4.3.3). Brown soil (avie si) is less frequently associated with growing of plantain, cassava, cocoyam and maize (39%), mixed food

77
crops (22%) or Cucumercopsis mannii (ngon), plantain and cocoyam. Black-brown (evindi-avie si) and sandy soils (neslek si) were generally not associated with these listed land uses. Table 4.3.3 Frequency of occurrence of top ten bio-ecological indicators of soil fertility and suitability for selected land uses
Soil fertility indicators for Cocoa agroforest system Blocks Pa Mu Ts Co Ma Sc Pe Fi Tc Afv
Ebolowa 68.2 0 20.6 0 11.2 0 0 0 0 0
Mbalmayo 21.0 31.0 19.7 0 3.5 5.2 5.5 0 7.2 6.90
Yaoundé 5.6 13.1 0 33.6 0 17.8 9.4 20.6 0 0
HFZ 34.9 17.0 16.5 5.9 5.6 5.6 4.3 3.6 3.4 3.3 Soil fertility indicators for Cucumeropsis agroforest system Blocks Mu Fi Pa Ma Tc Sc Pr Afv Cp Hd
Ebolowa 20.2 0 10.6 20.1 18.5 15.4 15.0 0 0 0
Mbalmayo 19.2 28.4 25.3 0 0 0 0 12.2 9.8 5.1
Yaoundé 0 73.5 8.9 0 0 0 0 0 0 17.7
HFZ 18.4 17.5 17.0 9.8 9.1 7.6 7.3 5.4 4.4 3.5 Soil fertility indicators for preforest young fallow system Blocks Co Hd Ma Ar Mu Fi Mr Ts St Sc
Ebolowa 36.4 19.2 20.2 8.9 5.7 0 0 9.4 0 0
Mbalmayo 24.1 12.4 2.2 16.1 14.6 0 10.8 0 10.2 9.7
Yaoundé 37.1 18.0 0 0 9.4 31.6 3.9 0 0 0
HFZ 32.3 16.6 10.0 9.7 9.5 6.2 4.5 4.3 3.5 3.4 Soil fertility indicators for young secondary forest system Blocks Mu Ma Fi Hd Fu Dh Pa Af Afv Pe
Ebolowa 71.2 21.7 0 0 0 7.1 0 0 0 0
Mbalmayo 39.4 6.1 10.0 11.8 15.0 5.6 0 7.2 0 4.9
Yaoundé 17.1 0 22.8 12.4 0 0 27.9 0 16.4 3.4
HFZ 50.0 12.1 7.6 6.6 5.9 5.3 4.5 2.8 2.7 2.5 Explainations: HFZ=Humid forest zone; Af=Alchornea floribunda; Afv=age of fallow/vegetation; Ar=Aframomum spp. ; Co=Chromolaena odorata; Cp=Ceiba petandra; Dh=Depth of humus; Fi=Ficus spp.; Fu=Funtumia spp.; Hd= Haumania danckelmanniana ; Ma=Macaranga spp. ; Mr=Myrianthus aboreus ; Mu=Musanga cecropioides ; Pa=Pycnanthus angolensis ; Pe=Presence of earthworms ; Pr=Parkia spp. ; Sc=Soil color; St=Solanum torvum; Tc=Triplochyton scleroxylon ; Ts=Terminalia superba. Table 4.3.4 Selection of appropriate agricultural land uses for cropping in relation to local soil classes
Agricultural land use Local soil classes Brown soil
avie si black soil evindi si
black-brown soils evindi-avie si
sandy soils nselek si
% of responses Cocoa-plantain 0 100 0 0 Plantain, cassava, cocoyam and maize
39 61 0 0
Cucumercopsis mannii (ngon), plantain and cocoyam
19 78 3 0
Tomato farm 0 100 0 0 Mixed food crops 22 70 5 3

78
4.4 DISCUSSION 4.4.1 Land use patterns and indicators of human modified landscapes: the toponyms The results of the study show that the two dimensions in representing the links for land uses and their resources, are complementary and associate natural resource management with local knowledge of nature and practices. The first dimension of this representation divides space into land use patterns which are fixed natural features that include abandoned villages (bilik), forests (afan), hills (nkol) and rivers (asoe, oton, ototon). These land use categories can be linked to major local practices such as farming, gathering of non forest forest products, hunting/trapping and fishing (Figure 4.3.1). Plants represent a relative high percentage (47%) of the indicators of this first dimension. This indicates the high level of their daily handling through agricultural practices, harvesting of fuelwood and/or forest products and traditional medicines. This confirms the definition of a forest landscape based on its productive functions as is the case amongst other forest peoples in the forest-savana interface, humid forest zone of Cameroon and in South-East Asia (Fairhead and Leach 1995; Carrière 1999; Colfer et al. 2001). The second dimension of social representation of land use is based on the local knowledge of ecological dynamics or vegetation regeneration. This dimension is essential for the interpretation of nature where human activities will take place. The coverage of village territories by several significant toponyms confirms the efficiency of local tools in deciphering the ecological history of landscapes as well as the development of forest landscape mosaics (Fairhead and Leach 1995; Oyono et al. 2000; Van Germeden et al. 2003). This is a clear indication of concurrence between the name of landscape elements and their uses by the indigenous people.
4.4.2 Local classification of soils and soil fertility indicators The local soil classification related to the types of forests and to differential color of soils influence the soil fertility management strategy (Table 4.3.1). The local classification of soils influences the social mechanisms in regulating soil fertility within the cropping-fallow-forest conversion cycle. Type of land cover and soil color are important criteria in the decision of land management strategies. Knowledge of the soil fertility patterns within the village territory is a basis for linking type of land cover and soil color with land use management strategies (Table 4.3.2). These management strategies fit with the technical classification of the dark red and red-yellow soils in the benchmark areas and their suitable agricultural land uses (Gockowski et al. 1998, 2004). Moreover, the 23 indicators distributed in five categories for soil fertility and land suitability indicate the multicriteria approach that farmers use in the management of soil in agricultural land uses. The plant species frequently cited as an indicator of soil fertility in the cocoa and Cucumeropsis agroforests-based system are Pycnanthus angolensis and Terminalia superba. The high frequencies observed for Musanga cecropiodes and Macaranga spp. indicate their role in the dynamics of forest vegetation as pioneer semi-woody species. The use of Chromoleana odorata as a key indicator of preforest young fallow moderate the discourse of its qualification as an invasive species that usually competes with food crops (Gockowski et al. 1998, 2004; Rusell and Tchamou 2001).
79
Considering that plant species are the most representative indicators in perceptions of land use-resource zonation, plant species are used for the spatial demarcation of soil fertility. The variations observed between blocks for the quality and quantity of indicators of soil fertility in terms of plant species, soil color, depth of humus and age of forest/vegetation, indicate that there is a demarcation of soil fertility based on the soil classes with forest types where forest resources are still abundant or not (Table 4.3.3). Plant species that indicate poor soil fertility are systematically felled during forest clearing while those that indicate good soil fertility are selectively felled depending on the knowledge of their other uses such as timber, NTFPs, tools, etc., if they would affect the co-existence with crops. These results confirm that multi-purpose plant species such as Pycnanthus angolensis, Terminalia superba and Triplochyton scleroxylon are kept or maintained during clearing (Dounias 1996a,b; Carrière 1999; Kamegne 2004). However, plant species are not the only factors that determine the choice of forest patch to be cleared. Other indicators such as soil color, depth of humus and age of forest/vegetation, and presence of earthworms also play a key role; they are used as discrimant variables in the selection process of lands for clearing. Indicators such as age of vegetation and presence of earthworm excrements fall either in the category of plant indicators, or they are considered as a result of good soil quality (Lal 1993; Hauser et al. 1994). 4.4.3 Local classification of soil systems and types of appropriate agricultural land use There is a correlation between local soil classification systems and types of uses by local communities to ensure agricultural and forest productivity. Black soil is most suitable for the five agricultural land uses. The relationship between soil color and appropriate land use (Table 4.3.4) indicates that cocoa-plantain farming systems are totally (100%) associated with black soils. There is a relatively high percentage (61%) consideration of plantain/cassava/cocoyam/maize cropping as suitable in black soils. The Cucumeropsis/plantain/cocoyam suite is associated with three types of soil but mainly black soils (78%). Tomato cultivation, like cocoa-plantain, is 100% associated with the black soil. Mixed food crops are associated with four types of soil classes but mainly black soils (70%). These results confirm that the knowledge of soil fertility status is combined with a number of indicators to decide to clear a forest patch and to allocate it to an appropriate agricultural land use. This indicates a multi-criteria analysis of the appropriate state and conditions of the natural environment that affect agricultural production strategies and their use on the land (Levang et al. 2001). The high abandonment of innovations based on soil fertility is partly justified by the existence of a local multi-criteria approach of soil fertility management. This approach highlights the coherence and ecological rationality of local natural resource management practices that have often been stigmatized by expert approaches to agricultural sustainability (ASB 1995). It has been shown that there is a gradient of soil fertility from the north to the south of the benchmark (Gockowski et al. 1998). However, in the management of soil fertility, local farmers use five categories of indicators in the selection of a forest patch to clear. This result illustrates the complexity of managing soil fertility in the context of non conventional agriculture (Table 4.3.4). This complexity is not only related to agronomic indicators but it affects the whole village territory in terms of historical ecology of landscape mosaics that presents the patterns of soil
80
fertlity. These practices suggest that under such conditions, any new transformation of the ecology/natural environment is predetermined by previous ecological transformation (forest farm, fallows, cocoa farms) or it is based on a series of transformed ecological units (Gillon 1992; Fairhead and Leach 1994, 1995; Dounias 1996a). These cycles of human-nature relationships therefore highlight ecology and/or agroecology as the product of a succession of human intervention and not as the result of only natural processes. Indeed, when one clears the forest to open up a farm, this marks the beginning of a new process of transformation of the natural ecology/environment which will contribute to the consolidation of agro-ecological resilience. Over the past decades, the management of soil fertlity has been addressed by technical approaches as seen with six technological options used within West and Central Africa (Binswanger and Pigali 1987; Borlaug 1992; Tonye et al. 1994; Nolte et al. 1997; Kanmegne et al. 1999; FAO 1999; Degrande and Duguma 2000; Kotto-Same et al. 2000). The implementation of the land use options has encountered some serious socio-feasibility problems. Within this chapter, the assessement of bio-physical conditions of land uses indicate that rather than a technical approach, the management of soil fertility requires a multi-criteria approach and intervention scheme (Campbell et al. 2001; Altieri 2002; Pretty 2006). This local management starts with the social representation of space based on two dimensions of land uses-ressources that help to capture both the historical ecology and the human-nature relationship that prevailed in local context. An important element here is to understand the state and quality of nature in which local natural resource management practices take place. This dual representation illustrates the influence of the organization of local land use management patterns by shaping ecological identities while re-specifying their socio-cultural roots. Each segment of the forest and/or land use has an identity in relation to its agricultural uses. These factors thus contribute in regulating soil fertility, in a cycle of self-sustaining development that could lead to a threshold of agricultural productivity. The multicriteria approach of land use indicates that soil fertility is a key factor that is likely to lead management of sustainable agro-ecological outcomes. Local knowledge systems and traditional practices to manage of soil fertility is an undeniable asset and could, if adequately used, contribute to the articulation of agroecological innovations for sustainable management of soil fertility in community village territories in Central Africa where the problem is yet to be addressed. 4.5 CONCLUSIONS This chapter has analyzed the relationships between land uses patterns and local indicators of sustainable forest-agriculture outcomes. The social representation of spatial resources has been captured via a dual complementary representation. These representations are based on five categories of local spatio-ecological indicators including plants, soil color, depth of humus, age of vegetation/forest and presence of earthworms. The results show that there is a variation in the number and the quality of indicators used by farmers between blocks. This range of indicators indicates the local multi-criteria approach in the management of soil fertility as the most important dimension of agroecological sustainability. The results also show that these local indicators influence the selection of patches of land and partly contribute to allocating the appropriate land use. The local management of agroecological knowledge systems is a tool to identify the conditions that could lead to productive agricultural and forest outcomes. These indicators also define the fertility patterns by associating ecological identities with the rationality

81
of local natural resource management practices while specifying their socio-cultural roots. The overall results confirm that the social representation of the links for land uses and their resources and local indicators of ecological suitability of land uses are key factors that influence agro-ecological resilience in the agriculture-forest interface. 4.6 REFERENCES Adesina AA, Chainu J, Mbila D. 1997. Property rights and alley farming technology adoption in West and Central Africa. Paper presented at the International Workshop on Propperty Rights, Collective Action and Technology Development Adoption., 22-25 Nov 1997, ICARDA, Aleppo, Syria. Altieri AM. 2002. Agroecology: The Science of Natural Resource Management for Poor Farmers in Marginal Environments. Agriculture, Ecosystems and Environments 93 (2002) 1-24. ASB. 1995. Alternatives to Slash and Burn Phase I Report: Forest Margins Benchmark of Cameroon, Alternatives to Slash and Burn Programm. Yaoundé:IITA Humid Forest Ecoregional Centre. ASB. 2000. Alternatives to Slash and Burn Phase II Report: Forest Margins Benchmark of Cameroon, Alternatives to Slash and Burn Programm. Yaoundé:IITA Humid Forest Ecoregional Centre. Binswanger H, Pigali P. 1987. Technology Priorities for Farming in Sub-Saharian Africa. Research Observer 3. Borlaug N. 1992. Small-scale agriculture in Africa: the myths and realities. Feeding the future. Newsletter of Sasakawa Africa Association 4/2. Büttner U, Hauser S. 2003. Farmer’s nutrient management practices in indigenous cropping systems in Southern Cameroon. Agriculture, ecosystems and Environment 100 (2, 3): 103-110. Campbell B, Sayer JA, Frost P, Vermeulen S, Ruiz Pérez M, Cunningham A, Prabhu R. 2001. Assessing the performance of natural resource systems. Conservation Ecology [online]. URL: http://www.consecol.org/vol5/iss2/art22. Carrière S. 1999. Les orphelins de la forêt : Influence de l’agriculture itinérante sur brûlis de Ntumu et des pratiques agricoles associées sur les dynamiques forestière du sud Cameroun. Thèse de Doctorat. Montpellier : Université de Montpellier. Colfer CJP, Woelfel J, Wadley RL, Harwell E. 2001. Assessing people's perceptions of forests: Research in West Kalimantan, Indonesia. In : Colfer CJP, Byron Y (eds.), People managing forests: the links between human well-being and sustainability. Washington DC: RFF. Degrande A, Duguma B. 2000. Adoption potential of rotational hedgerow intercropping in the humid lowlands of Cameroon. Agricultural Research Network Paper No. 103. London: ODI.

82
Diaw M C. 1997. Si, nda bot and ayong: Shifting Cultivation, Land Use and Property Rights in Southern Cameroon. Rural Development and Forestry Network Paper 21e. London: Overseas Development Agency. Diaw MC, Oyono PR. 1998. Dynamiques et représentations des espaces forestiers au Sud Cameroun: pour une relecture sociale du paysages, Arbres, Forêts et Communautés Rurales 15/16: 36-43. Dounias E. 1996a. Recrus forestiers post-agricoles: perceptions et usages chez les Mvae du Sud-Cameroun. Journal d'Agriculture Tropicale et de Botanique Appliquée (38): 153-178. Dounias E. 1996b. Dynamique et gestion différentielle d'un système de production à dominance agricole des Mvae du Sud-Cameroun. Thèse de Doctorat. Montpellier : Université des Sciences et Technique du Languedouc. 644 p. Duguma B, Mollet M. 1997. Provenance evaluation of Calliandra calothyrsus meissner in the humid lowalands of Cameroon. Agroforestry Systems 37: 45-57. Fairhead J, Leach M. 1994. Représentations Culturelles Africaines et Gestion de l’Environnement. Politique Africaine 53. Fairhead J, Leach M. 1995. L’enrichissement des paysages des zones de transition forêt savane en guinée. Histoire sociale et pratiques paysannes. In : CIRAD et Ministère de la coopération (Dir.), Actes du Séminaire sur Fertilité du milieu et Stratégies paysannes sous les tropiques humides 13-17 novembre 1995 à Montpellier. pp 407-418. FAO 1999. Agricultural Policies for Sustainable Management and Use of Natural Resources in Africa. Rome : Food and Agricultural Organization (FAO)/IITA. 81 p. Franzel S. 1999. Socioeconomic factors affecting the adoption potential of improved tree fallows in Africa. Agroforestry Systems 47: 305-321. Gillon Y. 1992. Empreinte humaine et facteurs du milieu dans l'histoire écologique de l'Afrique tropicale. Afrique Contemporaine 161 (30). Gockowski J, Baker D, Tonye J, Weise S, Ndoumbé M, Tiki-Manga T, Fouaguégué A. 1998. Characterization and Diagnosis of Farming Systems in the ASB Forest Margins Benchmark of Southern Cameroon. Yaoundé: IITA Humid Forest Ecoregional Center. Gockowski J, Tonye J, Baker D, Legg C, Weise S, Ndoumbé M, Tiki-Manga T, Fouaguegué A. 2004. Characterization and diagnosis of farming systems in the ASB forest margins Benchmark of Southern Cameroon. Ibadan: IITA. 67 p. Gockowski J, Tonye J, Diaw MC, Hauser S, Kotto-Same J, Njomgang R, Mounkam A, Nwaga AD, Tiki-Manga T, Tondoh T, Tchoundjeu Z, Zapfack L. 2005. The Forest Margins of Cameroon. In : Palm CA, Vosti AS, Sanchez AP,Polly JE (eds.), Slash and burn agriculture: the search for alternatives. New York: Columbia University Press. pp 305-331.

83
Grenand P, Grenand F. 1996. Connaissance du vivant et gestion de l’environnement chez les Wayapi (Améridiens de Guyane). Cah. Sci. Hum. 32 (1) 96: 51-63. Hauser S, Vanlauwe B, Asawalan DO, Norgrove L. 1994. Role of earthworms in traditional and improved low-input agricultural systems in West Africa. In: Brussard L, Ferrera-Cerrato R (eds.), Soil Ecology in Sustainable Agricultural Systems. Lewis Publishers. pp 113-132. Holling C. 2001. Understanding the complexity of economic, ecological and social systems. Ecosystems 11:41-47. Jeffrey EH. 2000. Soil quality: an indicator of sustainable land and management? Applied Soil Ecology 15: 75-83. Kang BT, Reynolds L, Attah-Krah AN. 1990. Alley farming: A alternative to shitting cultivation. Advances in Agronomy 43: 315-359. Kanmegne J. 2004. Slash and Burn Agriculture in the Humid Forest Zone of Southern Cameroon: Soil Quality Dynamics, Improved Fallow Management and Farmers' Perception. PhD Dissertation. Wageningen: Wageningen University. 184 p. Kanmegne J, Duguma B, Henrot J, Isirimah NO. 1999. Soil fertility enhancement by planted tree fallow species in the humid lowland of Cameroon. Agroforestry systems 49:31-39. Kotto-Same J, Moukam A, Njomgang R, Tiki-Manga T, Tonye J, Diaw MC (eds.). 2000. Alternatives to Slash-and-Burn in Cameroon. Summary Report and Synthesis of phase II. Nairobi : ICRAF. Lal R. 1993. Soil Degradation, Soil Quality and Soil Resilience. Soil Tillage Research 29:1-8. Letouzey R (ed). 1985. Notice sur la géographie du Cameroun au 1/500 000. Toulouse : Institut de la Carte Internationale de la végétation. Levang P, Michon G, De Forestra H. 2001. De la jachère arborée aux agro-forêts, des stratégies paysannes adaptées à des milieux de fertilité médiocre. In: CIRAD et Ministère de la coopération (dir.), Actes du Séminaire sur la Fertilité du milieu et Stratégies Paysannes sous les Tropiques Humides, 13-17 novembre 1995 à Montpellier. pp 228-235. Mala WA, Oyono PR. 2004. Some Dimensions of Local Practices of Natural Resources Management in the Central Africa Region. Research Review NS 20.2 (2004) 23-31. Mala WA, Ebene Y, Oyono PR, Diaw MC. 2002. Context Studies of Forest Agriculture and NRM options : Implications for adaptive co-management.UnpublishedReport.Yaoundé: CIFOR. 35 p. Mala WA, Zoa F, Biyong M, Abéga P, Ela CV, Oyono PR,Diaw MC. 2006. Perceptions et connaissances locales des systèmes de gestion des forêts au Cameroun Méridional: instruments

84
de prise de décision et d'aménagement durable. Rapport final de projet pour le compte du Projet de réhabilitation et redynamisation de la station de recherche d'Ipassa Makokou. Yaoundé: CIFOR. Mendoza GA, Prabhu R. 2004. A Community-driven Multi-criteria Approach to Developing Indicators of Sustainable Resource Management. Journal of Forest Policy Vol. 10:1-21. Mokwunye U. 1996. Nutrient depletion: Africa’a greatest threat to economic development. Paper presented at the STAP expert Workshop on Land Degradation, 18-20 Septembre 1996, Dakar, Senegal. Ngono OP. Undated. Agriculture traditionelle chez les Ntumu. Study Report. Libreville : Institut Recherche Agricole du Gabon. Nolte C, Duguma B, Wendt J. 1997. Research and development of fallows in the humid forest zone of Cameroon. A working paper prepared for the launching of EPHTA Humid Forest Margins Benchmark, Yaoundé, Hilton, May 26-28, 1997. Oyono PR, Diaw MC, Efoua S. 2000. Structures et contenu anthropologique du bilik : Au Cameroun. Environnement Africain XI, (41-42): 10-20. Oyono PR, Mala WA, Tonye J. 2003. Rigidity versus adaptation: Contribution to the Debate on Agricultural Viability and Forest Sustainability in Southern Cameroon. Culture & Agriculture Vol.25, No2 Fall 2003:32-40. Pim M, Rotmans J, De Groot D. 2003. Biodiversity: luxury or necessity? Global Environmental Change 13 (2003):75-81. Pourtier R. 1986. La dialectique du vide. Densité des populations et pratiques foncières en Afrique centrale forestière. Politique Africaine N°21:16-34. Prabhu R, Ruitenbeek HJ, Boyle TJB, Colfer CJP. 2001. Between voodoo science and adaptive management: the role and research needs for indicators of sustainable forest management. In: Raison RJ, Brown AG, Flinn DW (eds.), Criteria and indicators for sustainable forest management. London: CABI-IUFRO. pp 39-66. Pretty J. 2006. Agroecological Approach to Agricultural Development. Section Report prepared for the World Development Report 2008. Rimsip-Latin American Center for Rural Development. 37 p. Robiglio V, Mala WA. 2005. Between local and expert knowledge: integrating participatory mapping and GIS for the implementation of integrated forest management options. Case study of Akok – Cameroon. The Forestry Chronicle Volume 81, Number 3, May/June 2005:392-397. Robiglio V, Mala WA, Diaw MC. 2002. Mapping Landscapes: Integrating GIS and Social Science Methods to Model Human–Nature Relationships in Southern Cameroon. Small-scale Forest Economics, Management and Policy Journal 2 (2): 171-184.

85
Russell D, Tchamou N. 2001. Soils fertility and the Generaton Gap. The Bënë of Southern Cameroon. In: Colfer CJP, Byron Y (eds.), People Managing Forests: the links between well-being and sustainability. Washington DC: RFF Pulishers and Bogor: CIFOR. pp 229-249. Sanchez PA. 1999. Improved fallows come of age in the tropics. Agroforestry Systems 47: 3-12. Santoir C. 1992. Sous l'empire du cacao. Etude diachronique de deux terroirs Camerounais. A travers les champs. Paris: ORSTOM Editions. 191 p. Tonye J, Duguma B,Tiki-Manga T. 1994. Stepwise approach to alley cropping technology development and transfer in theforest zone of Cameroon. Agroforestry systems 29: 269-278. Van Germeden BS, Olff H, Parren PE, Brongers F. 2003. The pristine rainforest? Remants of historical impacts of current trees species composition and diversity. Journal of Biogeography 30: 1381-1390. Woodhill J, Röling NG. 1998. The second wing of the eagle: the human dimension in learning our way to more sustainable future. In: ‘Facilitating Sustainable Agriculture: Participatory Learning and Adaptive Management in Times of Environment Uncertainty’. Cambridge: Cambridge University Press. Zahm F, Viaux P, Vilain L, Girardin P, Mouchet C. 2004. La méthode IDEA (indicateur de durabilité des Exploitations Agricoles): une méthode de diagnostic pour passer du concept de durabilité à son évaluation à partir d'indicateurs. In: PEER Conférence, novembre 2004, Helsinki.
86
CHAPTER FIVE
BIOPHYSICAL CHARACTERIZATION OF LOCAL MANAGEMENT OF AGRICULTURAL BIODIVERSITY
KNOWLEDGE 5.1 INTRODUCTION The concept of local agricultural biodiversity knowledge systems delineates a cognitive structure in which theories and perceptions of biodiversity and culture are conceptualized in the management of agro-ecosystems (adapted from Charyulu 1999; Armitage 2003; Vernooy and Song 2004; Woodley 2004). It includes definitions, classifications and concepts of the physical, natural, social and economic environments (FAO 2005). The dynamics of local agricultural biodiversity knowledge systems can take place at two different levels: the cognitive and the empirical. At the empirical level, they are visible mainly in institutions and technologies (Charyulu 1999). At the cognitive level, they are visible in perceptions, languages, collective and individual memory, reasoning and decision, and movement. Agricultural biodiversity encompasses the variety and variability of animals, plants and micro-organisms that are important to food, agriculture and forest management (Brookfield 2002). It is the result of the interactions between the environment, genetic resources, and the management systems and practices used by people over centuries (FAO 1999a, 2005). These natural entities include plants and animals, both wild and domesticated, that have been combined, modified and managed by people for millennia, in complex and diverse agricultural systems (Reichardt et al. 1994; Dounias 1996a; Carrière 1999; Lefroy et al. 1999; Brodt 2001; Gari 2001; Brookfield 2002; Eyzaguire 2003; Toledo et al. 2003). While these human-nature processes for managing agricultural biodiversity have been largely documented and described in the tropics, however, the relationships between the quantity and quality of plant composition of agricultural biodiversity and the dynamics of land use systems remain poorly investigated. This is significant from the historical-ecological perspectives as well as how this knowledge management influences the forest regeneration and regrowth outcomes in forest landscape mosaics (Van Germeden et al. 2003; Woodley 2004). It has been shown that farmers use several criteria to manage land uses based on agricultural biodiversity knowledge with a set of biophysical indicators of land recovery age and of active agricultural land use practices (Carrière 1999; Parrotta et al. 2008). Meantime, tropical agro-ecosystems are often been described by putting forward mainly the issues of biodiversity loss, weak soil restoration, low productivity and unsustainable forest and natural resource management outcomes (ASB 1995, 2000; FAO 1999a; Van Noordwijk et al. 2001). The actions taken to address these issues for improving the performance of forest landscape mosaics are based on tools for conservation of biodiversity through conservation policies, conservative natural resource management (NRM) options and protection of natural resources (Instone 2003a; Wallington et al. 2005). Meantime, these actions have been, or still are, largely about categorizing conservation values in terms of static species assemblages, purchasing and protecting conservation areas,
87
isolating these from surrounding altered landscapes, and preventing human disturbance such as the segregation approach used at the forest-agriculture interface (Sandy et al. 2001). However, the cognitive processes that take place when the forest is cleared and that lead to an accumulation of different plant species of different plant sizes and density, and how the processes affect the recovery and regeneration of vegetation, remains insufficiently analyzed. In southern Cameroon, the ecology of selected land uses within the cropping-fallow-forest conversion cycle has been studied mainly from the sustainable tree management perspectives (Dounias 1996a; Carrière 1999; Vermeulen and Carrière 2001; Vermeulen and Karsenty 2001; Ngobo 2002; Sonwa 2004). The biophysical characterization of certain land uses in terms of plant species composition have often been made but the connections between these land uses have not yet been analyzed properly to understand the bases of their ecological resilience. These most common land uses are described below. In cocoa plantations, the studies of the relationship between the management of shade and the productivity of cocoa have shown that three of the 10 most frequently found plant species in cocoa fields in the humid forest zone are by order of importance represented by Elaeis guineensis, Dacryodes edulis and Persea americana (Gockowski and Dury 1999; Gockowski et al. 2004a,b; Sonwa 2004; Bidzanga 2005). In mixed food-crop and Cucumeropsis farms, three broad categories of plant species were found after the clearing of a patch: (i) plant species with agronomic qualities such as indicators of soil fertility with Terminalia superba, Triplochiton scleroxylon and Pycnanthus angolensis; (ii) semi-woody pioneer and long-living hardwood species; (iii) light-canopy tree species that do not disturb the development of crops and that can filter sun (Dounias 1996a,b; Carrière 1999; Ngobo 2002). Carrière (1999) found that the stem density of tree species increase from the small-sized to large-sized tree category for remnant trees found in mixed food crops and Cucumeropsis farms. Some studies on the ecology of young fallows in the humid forest zone of southern Cameroon have shown that the plant composition is largely influenced by the former non agricultural land use prior to the current land use (Ngobo 2002). In this land use, five broad groups of plants were found, including (i) weedy species, (ii) semi-woody pioneers (e.g. Musanga cecropioides), (iii) understorey species of mature forest (e.g. Alchornea floribunda, Carapa procera, Rothmannia sp, Stephania sp, Thalia welwitschii and Trichilia rubescens), (iv) long-living pioneer species (e.g. Disthemonanthus benthamianus, Diospyros cocnocarpa, Tetrochidium didymostemon), and (v) understorey species of secondary forests (e.g. Bertiera sp, Cissus sp, Culcasia sp, Ficus sp, Letonychia sp, Megaphrynium sp, Sarcophrynium sp, and Smilax kraussiana) (Ngobo 2002). In the scientific literature, the remnant tree species have often been presented as the driver of forest regeneration and recovery, and confirms that most of the forest landscape is the result of historical interactions between humans and nature in southern Cameroon (Dijk 1995, 1999; Dounias 1996a,b; Carrière 1999; Van Germeden et al. 2003). However, these results did not take into account the dynamics of human-nature relationships affecting the composition of different land uses within the cropping-fallow-forest conversion cycle. Still, very little is known about how far the interactions between the environment, the size-categories of plant species maintained during the clearing of the forest, and management practices, may have determined the specific

88
current composition of forest landscape mosaics of southern Cameroon. This understanding is a crucial step towards the understanding of the selection of local plant species in order to design the research and intervention processes, and the appropriate conditions for the implementation of adaptive co-management of natural resource options in a context of high biodiversity (Prabhu 2003; Woodley 2004; Colfer 2005). With this in mind, the objective of this chapter was to characterize local management of agricultural biodiversity knowledge systems at the forest-agriculture interface through addressing the following research questions: What are the biophysical determinants of local management of agricultural biodiversity at the forest-agriculture interface? How does this local agricultural biodiversity knowledge vary at different socio-ecological scales and processes? How does the local agricultural biodiversity knowledge of people affect the relationships between agricultural and non-agricultural plant species in natural resource management practices at the forest-agriculture interface? It is hypothesised that knowledge of agricultural biodiversity management affect agricultural and forest productivity, ecological processes (forest dynamics) and species richness patterns within the cropping-fallow-forest conversion cycles. The study is limited to the agricultural biodiversity of plant species and related socio-ecological scales affecting the local management knowledge. The concept of plant species domestication refers to the process of maintaining/retaining plant species when the farmers clear a patch opposed to the plant species that are systematically felled. These retained species include both plant species found in Cucumeropsis and cocoa agroforests and in mixed food-crop agroforests that will have a direct effect on regrowth of the forest i.e. the change over from the cultivated product towards regrowth forest. The domesticated plant species also included the wild plant species planted by farmers during their intervention in the forest landscape mosaics. Sometimes in the secondary forests and mature forests, people generally clear herbaceous plants around the planted species. Conceptual Framework: Evolution of thinking about agricultural biodiversity The understanding of agricultural biodiversity has evolved during the last three decades; from the recognition of the importance of genetic diversity, particularly for crops, to an emphasis on the ex situ approach in the 1970s, to the adoption of the in situ approach in the 1990s, to the current development of the agro-ecosystem approach (Brookfield and Padoch 1994, 2002; Carrière 1999; FAO 1999a,b, 2005). There is a need to consider which elements are an appropriate unit of analysis for agricultural biodiversity in agro-ecosystems, what is an appropriate scale and what is an appropriate set of indicators? There is a need for an integrated and holistic approach, linking the genetic level, the species level and the farm and agro-ecosystem level. In southern Cameroon, the cropping-fallow-forest conversion cycle is the basis of socio-ecological and economic resilience behind the management of resources at the forest-agriculture interface. The process of forest conversion for agriculture delineates two types of management sequences. The first sequence is temporary and forms part of the food-crop agricultural systems. It starts with Cucumeropsis/plantain/cocoyam agroforestry systems. It is followed by a rotation of mixed food-crop agroforests and/or then by different stages of fallow systems. The length of the fallow period is an adaptive practice to regulate soil fertility (Gockowski et al. 2004a). The

89
fallows are probably most used for mixed food-crop agroforests, and then the cycle starts again (Carrière 1999). The specific characteristic of this management sequence is that a number of useful trees are kept (domesticated) during the clearing phase of the forest for the better development of crops. The major outcome is the capacity of the socio-ecological system to regulate land and forest productivity through the process of fallows (Dounias 1995; Diaw 1997; Carrière 1999; Vermeulen and Carrière 2001; Gockowski et al. 2004a). The second sequence is permanent and is related to the cash-crop agroforestry systems. It also starts with food crops or Cucumeropsis agroforests, followed by the implementation of cocoa or palm tree agroforests, and/or by conversion into mature secondary forests (Diaw 1997; Oyono et al. 2003). The specific characteristic of this sequence is that the land use mimics the structure and composition of the natural forest. Each element of the conversion cycle belongs to a social unit ranging from a household, extended family and lineage in order to regulate the governance of natural resources on which the economy, the livelihoods, the social reproduction systems and the functioning of social institutions are based. Each land use phase is attached to a social control presented as follows: Lineage or segmented lineage or extended family (1); Household (2); Household-man-woman (3); Household-man (4); Household-woman (5). The sequence is illustrated in Figure 5.1.1. Figure 5.1.1 Cropping-fallow-forest conversion cycles in southern Cameroon (Adapted from Diaw 1997).
Forest farm (4)
Forest (1) Fallow (3)
Young fallow (3)
Fallow (2)
Mixed food-crop agroforests (5)
Cocoa agroforests (4)
Secondary forest (2)
Palm tree farms

90
5.2 METHODS 5.2.1 Description of study area The study was done in the forest margins benchmark area of southern Cameroon designed to cover natural resource use intensification and population density gradients. The area was divided into three blocks i.e. low, medium and high levels of resource use intensification, represented respectively by Ebolowa, Mbalmayo and Yaoundé (Gockowski et al. 2004a, 2005; Sanchez et al. 2005). The biophysical and socio-economic characteristics of the study area have been described and presented in Chapter 2, Section 2.2 (Gockowski et al. 2004a, 2005). Its climax vegetation is three main types of forest ecosystems: dense, semi-deciduous forest characteristic of the Yaoundé block, which extends southwards into the Mbalmayo block; dense, humid, Congo Basin forest in the southern reaches of the Mbalmayo block, which extends into the Ebolowa block; and small pockets of biologically diverse, moist, evergreen, Atlantic forests along the western border of the Ebolowa and Mbalmayo blocks (Letouzey 1985; Vivien and Faure 1985; Gartlan 1992). These forest ecosystems are described below. The dense humid evergreen Atlantic forest (Biafran) is characterized by a very high floristic diversity with marked endemism. It contains flora with affinities to South American forests, and is a centre of diversity for various plant taxa, including the genera Cola, Diospyros, Garcinia and Dorstenia. The Biafran forest type is characterised by associations of species from the family of Caesalpinaceae. Within the Biafran forests, one can isolate the coastal forest of low altitude which is dominated by Lophira alata and Sacoglottis gabonensis, also characterized by Cynometra hankei and Coula edulis, which is a forest of substitution, having regenerated old cleared forests. Long time ago this type of forest provided timber for the market, including Lophira alata (bongossi/azobé) and Pycnanthus angolensis (Eteng/Ilomba). The rest of the Biafrean forest is essentially a forest of legumes supplemented by species of Irvingiaceae and Rosaceae. Some Caesalpiniaceae form pure stands of important species such as Brachystegia spp., Cynometra hankei, Didelotia brevipaniculata, Gilbertiodendron brachystegicides, Julbernadia spp., Monopetalanthus spp. and Tetraberlinia spp. Many species typical of old secondary forest may also be present such as Ceiba pentandra, Terminalia superba, Pycnanthus angolensis, Triplochiton scleroxylon, Lophira alata, Canarium schweinfurthii, and many species of Macaranga and Petersianthus macrocarpus (Letouzey 1985 cited in Carrière 1999; Vivien and Faure 1985). The dense humid evergreen Congolese forest is characterized by an intermediate floristic diversity between the Atlantic forest and the semi-deciduous forest. The flora has affinities with the Congo Basin forests. This is an important ecosystem for large primates and elephants. The dense humid evergreen Congolese forest at medium altitude ranges from the Biafran forest in the west to near the 15°E meridian. Floristically, it is distinguished from the semi-deciduous forest further north, separated by transition forest and the Biafran forest with no gregarious Caesalpiniaceae exceptionnaly for Gilbertiodendron dewevre. It forms small stands more or less located in the valleys. Another characteristic species is Baillonella toxisperma (adjap/moabi), a hard and heavy wood with very fine grain, appreciated by farmers for seed fat (Letouzey 1985; Vivien and Faure 1985).

91
The semi-dense deciduous forest is often fragmented, and subject to fire during the dry season. It is particularly rich in commercial timber species although biologically less diverse than other tropical forest types. It occurs close to the savannah zone. This forest occurs at average altitude and is characterized by abundant Sterculiaceae species such as Cola spp., Eribroma oblonga (eyong), Mansonia altissima (nkula/bete), Nesogordonia spp., Pterygota spp., Sterculia spp., Triplochiton scleroxylon (ayous/obeche), and supplemented by many Ulmaceae including the most abundant Celtis spp. These forests border onto the Central African Republic. They are particularly rich in commercial species such as Triplochiton scleroxylon and species of Meliaceae with a significant volume of red wood, including Entandrophragma cylindricum (asié/sapelli) and Lovoa trichilioides (bibolo/dibétou) (Letouzey 1985; Vivien and Faure 1985). Farms in the Cameroon benchmark area are generally small and fragmented. The average number of annual-crop fields is slightly more than 4. The predominant annual food-crop fields have an average size of slightly over 0.13 ha. The mean annual land cover associated with productive agricultural land use (a figure which does not include fallow fields) was 2.6 ha per household in the Yaoundé block, 2.4 ha in the Mbalmayo block, and 3.6 ha in the Ebolowa block. Roughly 50% of this area is covered by complex cocoa agroforests (Gockowski et al. 2004a). 5.2.2 Sampling methods Six villages were selected from within the humid forest benchmark area of southern Cameroon. The two top villages per block were selected in terms of their higher intensity of R&D activities. The intensity of research and development (R&D) activities was measured by three categories based on the monthly duration of the interventions (three days of activities; one week of activities; more then 10 days of activities). For each block, a matrix was used to categorize each village as low, medium and high intensity of R&D activities, using the different criteria. In each block, the two villages with the highest rating were retained because the hypothesis was to see how the outcomes of the interplay of knowledge systems to forest-agriculture innovations are affected by the biophysical and socio-economic context, knowledge base and field processes. In each selected village, five households were sampled to give a total of 30 households (5*6=30) for the study. The households were selected based on the criteria of their participation in the development and utilization of the innovations. These criteria included three categories: (i) farmers involved in on-farm research and testing the innovations; (ii) farmers who were not directly involved in on-farm research but who have received benefits from on-farm research and have tested them; (iii) those who were not involved in any activity and who did not test any innovations. A list of names of respondents in each category was compiled to select respondents based on the estimated proportion of each group (category) over the total numbers given by the village. Five of the nine land uses described before (see Chapter 1, Section 2) were selected to determine the farmer knowledge management affecting the biophysical charateristics of agricultural biodiversity. The criteria used for their selection included spatio-temporal processes that take place within the cropping-fallow-forest conversion cycle, as follows: (i) the land use system (LUS) with a high number of crop species; (ii) the LUS having both a high economic importance and a high density of crop and non-agricultural plant species, i.e. seedlings, saplings, poles and

92
trees kept during the clearing of primary or old secondary forest; (iii) the key LUS in the spatial deployment of the cropping-fallow–forest conversion cycle; iv) the LUS with the highest/lowest retained number of economic plant species found; (iv) the length of the fallow period corresponding to another rotation i.e. 15 years as the mean of nine to 23 years old. The combination of these criteria guided the selection of the five land use types in the logical sequence of the cropping-fallow-forest conversion cycle: (i) cocoa agroforest, (ii) Cucumeropsis agroforest, (iii) mixed food-crop agroforest (or mixed groundnut-based crop farm), (iv) young preforest fallow (five years old), and (v) young secondary forest (15 years old). 5.2.3 Data collection Semi-structured and structured questionnaires (Appendix 1, Section 5) were used with the households to describe the biophysical processes behind the management of agricultural biodiversity within spatio-temporal scales. This included food and crop species as well as non agricultural plant species such as seedlings, saplings, poles and trees. Both men and women of each household, when possible, participated. Men participated with the cocoa and Cucumeropsis agroforests, young preforest fallow and young secondary forest. Women were involved with the mixed food-crop agroforests. Section 5 of the questionnaire was used to collect data within each land use. Sub-section 5.1 of the questionnaire was used to collect data on the biophysical characteristics of selected land uses: (i) the time of departure (from the village) and arrival (at the specific land use field), i.e. distance from house, in three categories (close to house=below 20 minutes by foot; far from house= between 20 to 40 minutes by foot; very far to house=more than 40 minutes by foot); (ii) the name of the former land use and its approximate age, for both agricultural and non agricultural land uses. The non agricultural land use categories included virgin forest, old secondary forest, intermediate secondary forest, pre-secondary forest fallow and young fallow. Agricultural land use categories included mixed food-crop agroforests, cocoa agroforests, Cucumeropsis agroforests, and tomato farms. Section 5.2 and 5.3 of the questionnaire was used to collect data on agricultural plant diversity at the land use level. Plots were used to collect biophysical data at the land use level, adapted from the multidisciplinary landscape assessment approach (Sheil et al. 2003). A total of 184 plots were sampled, distributed as follows: 41 plots of 20 m x 20 m for cocoa agroforests covering a total area of 1.64 ha; 36 plots of 20 m x 20 m for Cucumeropsis agroforests covering a total area of 1.44 ha; 30 plots of 20 m x 20 m for each of the young preforest fallows (five years old) and young secondary or regrowth forests (15 years old) covering a total area of 2.40 ha for the two land uses combined; and 47 plots of 40 m x 5 m for mixed food-crop agroforests representing 0.94 ha. One to four plots of 20 m x 20 m were sampled in cocoa and Cucumeropsis agroforests on each farm, depending on the total size of the farm. One plot of 20 m x 20 m was systematically sampled for each of regrowth fallow and regrowth forests on a farm. This was used in order to avoid the problems of boundaries and size of the former farm. Each 20 m x 20 m plot was subdivided into four sub-units of 20 m x 5 m (0.01 ha), and each 40 m x 5 m plot was subdivided into 10 consecutive 4 m x 5 m subunits (0.002 ha). Within these plots, the following data were collected: (i) local name of the place; (ii) local name of the plant;
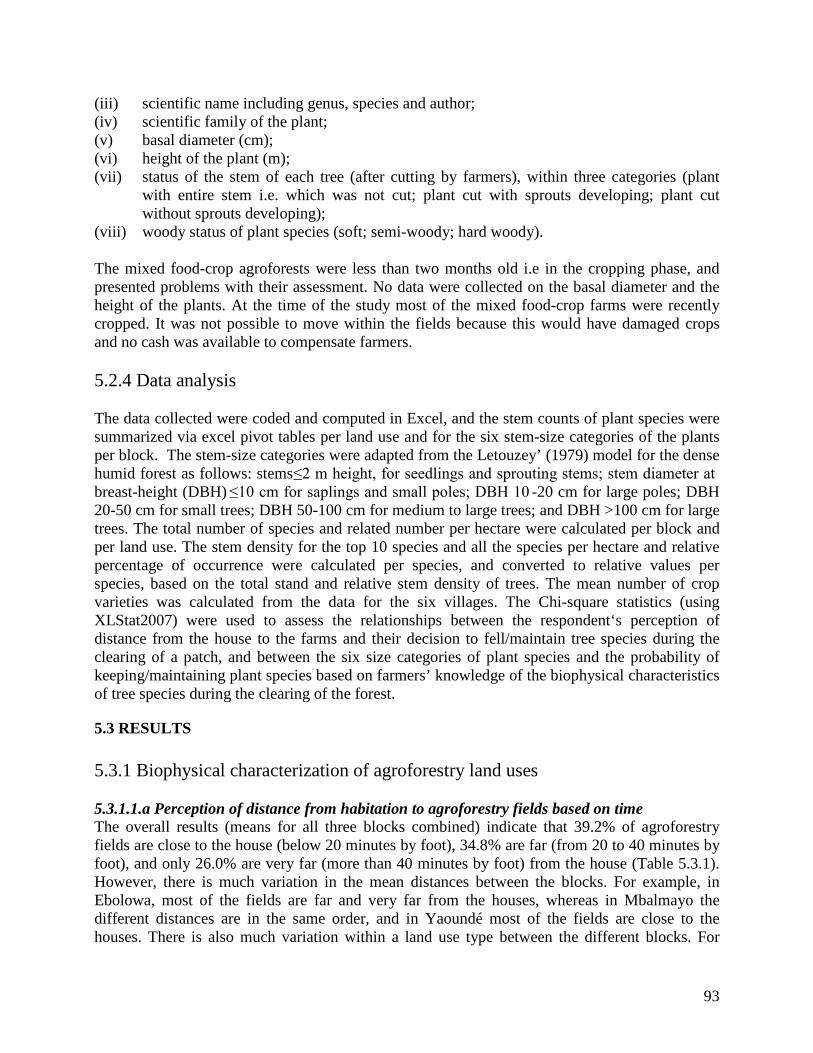
93
(iii) scientific name including genus, species and author; (iv) scientific family of the plant; (v) basal diameter (cm); (vi) height of the plant (m); (vii) status of the stem of each tree (after cutting by farmers), within three categories (plant
with entire stem i.e. which was not cut; plant cut with sprouts developing; plant cut without sprouts developing);
(viii) woody status of plant species (soft; semi-woody; hard woody). The mixed food-crop agroforests were less than two months old i.e in the cropping phase, and presented problems with their assessment. No data were collected on the basal diameter and the height of the plants. At the time of the study most of the mixed food-crop farms were recently cropped. It was not possible to move within the fields because this would have damaged crops and no cash was available to compensate farmers. 5.2.4 Data analysis The data collected were coded and computed in Excel, and the stem counts of plant species were summarized via excel pivot tables per land use and for the six stem-size categories of the plants per block. The stem-size categories were adapted from the Letouzey’ (1979) model for the dense humid forest as follows: stems ≤2 m height, for seedlings and sprouting stems; stem diameter at breast-height (DBH) ≤10 cm for saplings and small poles; DBH 10 -20 cm for large poles; DBH 20-50 cm for small trees; DBH 50-100 cm for medium to large trees; and DBH >100 cm for large trees. The total number of species and related number per hectare were calculated per block and per land use. The stem density for the top 10 species and all the species per hectare and relative percentage of occurrence were calculated per species, and converted to relative values per species, based on the total stand and relative stem density of trees. The mean number of crop varieties was calculated from the data for the six villages. The Chi-square statistics (using XLStat2007) were used to assess the relationships between the respondent‘s perception of distance from the house to the farms and their decision to fell/maintain tree species during the clearing of a patch, and between the six size categories of plant species and the probability of keeping/maintaining plant species based on farmers’ knowledge of the biophysical characteristics of tree species during the clearing of the forest.
5.3 RESULTS 5.3.1 Biophysical characterization of agroforestry land uses 5.3.1.1.a Perception of distance from habitation to agroforestry fields based on time The overall results (means for all three blocks combined) indicate that 39.2% of agroforestry fields are close to the house (below 20 minutes by foot), 34.8% are far (from 20 to 40 minutes by foot), and only 26.0% are very far (more than 40 minutes by foot) from the house (Table 5.3.1). However, there is much variation in the mean distances between the blocks. For example, in Ebolowa, most of the fields are far and very far from the houses, whereas in Mbalmayo the different distances are in the same order, and in Yaoundé most of the fields are close to the houses. There is also much variation within a land use type between the different blocks. For
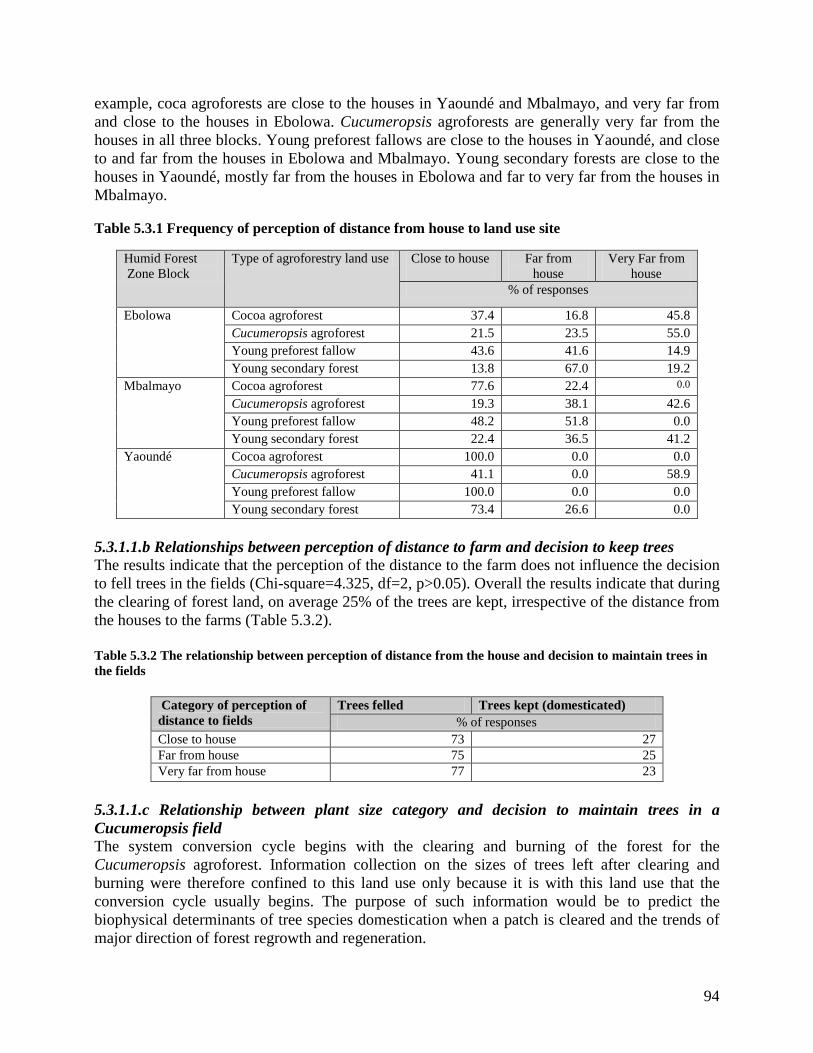
94
example, coca agroforests are close to the houses in Yaoundé and Mbalmayo, and very far from and close to the houses in Ebolowa. Cucumeropsis agroforests are generally very far from the houses in all three blocks. Young preforest fallows are close to the houses in Yaoundé, and close to and far from the houses in Ebolowa and Mbalmayo. Young secondary forests are close to the houses in Yaoundé, mostly far from the houses in Ebolowa and far to very far from the houses in Mbalmayo. Table 5.3.1 Frequency of perception of distance from house to land use site
Humid Forest Zone Block
Type of agroforestry land use Close to house
Far from house
Very Far from house
% of responses
Ebolowa
Cocoa agroforest 37.4 16.8 45.8 Cucumeropsis agroforest 21.5 23.5 55.0 Young preforest fallow 43.6 41.6 14.9 Young secondary forest 13.8 67.0 19.2
Mbalmayo
Cocoa agroforest 77.6 22.4 0.0 Cucumeropsis agroforest 19.3 38.1 42.6 Young preforest fallow 48.2 51.8 0.0 Young secondary forest 22.4 36.5 41.2
Yaoundé
Cocoa agroforest 100.0 0.0 0.0 Cucumeropsis agroforest 41.1 0.0 58.9 Young preforest fallow 100.0 0.0 0.0 Young secondary forest 73.4 26.6 0.0
5.3.1.1.b Relationships between perception of distance to farm and decision to keep trees The results indicate that the perception of the distance to the farm does not influence the decision to fell trees in the fields (Chi-square=4.325, df=2, p>0.05). Overall the results indicate that during the clearing of forest land, on average 25% of the trees are kept, irrespective of the distance from the houses to the farms (Table 5.3.2). Table 5.3.2 The relationship between perception of distance from the house and decision to maintain trees in the fields
Category of perception of distance to fields
Trees felled Trees kept (domesticated) % of responses
Close to house 73 27 Far from house 75 25 Very far from house 77 23
5.3.1.1.c Relationship between plant size category and decision to maintain trees in a Cucumeropsis field The system conversion cycle begins with the clearing and burning of the forest for the Cucumeropsis agroforest. Information collection on the sizes of trees left after clearing and burning were therefore confined to this land use only because it is with this land use that the conversion cycle usually begins. The purpose of such information would be to predict the biophysical determinants of tree species domestication when a patch is cleared and the trends of major direction of forest regrowth and regeneration.
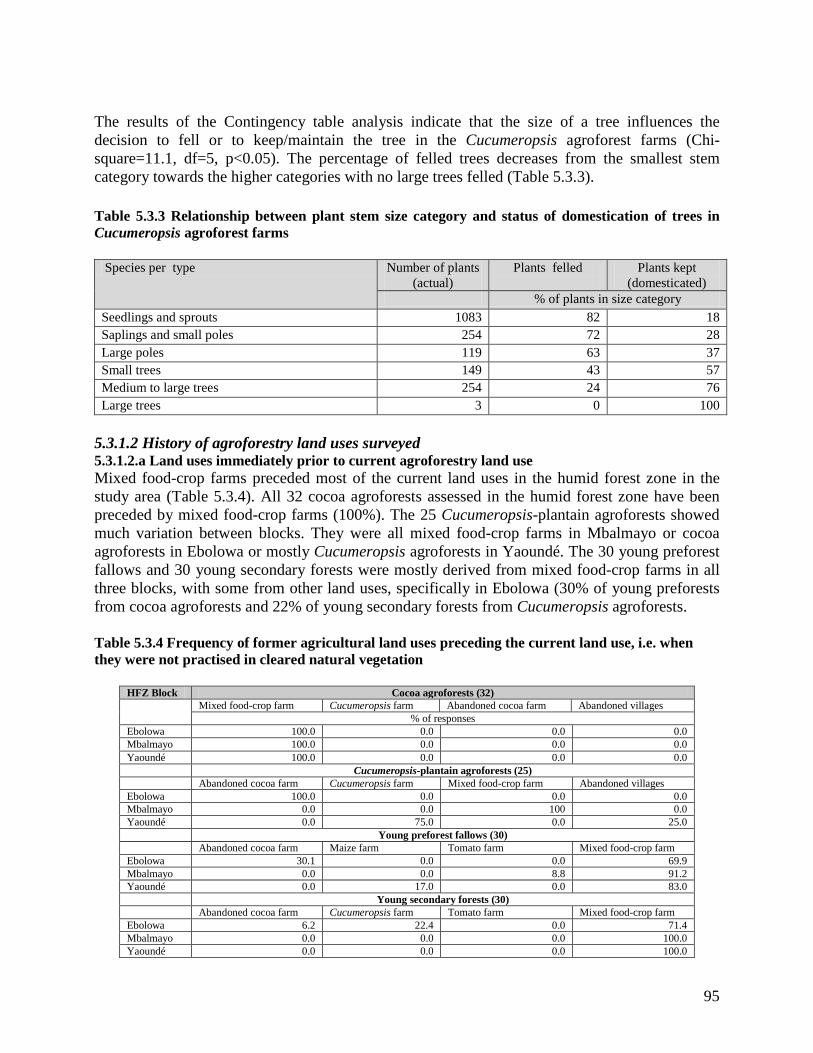
95
The results of the Contingency table analysis indicate that the size of a tree influences the decision to fell or to keep/maintain the tree in the Cucumeropsis agroforest farms (Chi-square=11.1, df=5, p<0.05). The percentage of felled trees decreases from the smallest stem category towards the higher categories with no large trees felled (Table 5.3.3). Table 5.3.3 Relationship between plant stem size category and status of domestication of trees in Cucumeropsis agroforest farms
Species per type Number of plants (actual)
Plants felled
Plants kept (domesticated)
% of plants in size category Seedlings and sprouts 1083 82 18 Saplings and small poles 254 72 28 Large poles 119 63 37 Small trees 149 43 57 Medium to large trees 254 24 76 Large trees 3 0 100
5.3.1.2 History of agroforestry land uses surveyed 5.3.1.2.a Land uses immediately prior to current agroforestry land use Mixed food-crop farms preceded most of the current land uses in the humid forest zone in the study area (Table 5.3.4). All 32 cocoa agroforests assessed in the humid forest zone have been preceded by mixed food-crop farms (100%). The 25 Cucumeropsis-plantain agroforests showed much variation between blocks. They were all mixed food-crop farms in Mbalmayo or cocoa agroforests in Ebolowa or mostly Cucumeropsis agroforests in Yaoundé. The 30 young preforest fallows and 30 young secondary forests were mostly derived from mixed food-crop farms in all three blocks, with some from other land uses, specifically in Ebolowa (30% of young preforests from cocoa agroforests and 22% of young secondary forests from Cucumeropsis agroforests. Table 5.3.4 Frequency of former agricultural land uses preceding the current land use, i.e. when they were not practised in cleared natural vegetation
HFZ Block Cocoa agroforests (32) Mixed food-crop farm Cucumeropsis farm Abandoned cocoa farm Abandoned villages
% of responses Ebolowa 100.0 0.0 0.0 0.0 Mbalmayo 100.0 0.0 0.0 0.0 Yaoundé 100.0 0.0 0.0 0.0 Cucumeropsis-plantain agroforests (25) Abandoned cocoa farm Cucumeropsis farm Mixed food-crop farm Abandoned villages Ebolowa 100.0 0.0 0.0 0.0 Mbalmayo 0.0 0.0 100 0.0 Yaoundé 0.0 75.0 0.0 25.0 Young preforest fallows (30) Abandoned cocoa farm Maize farm Tomato farm Mixed food-crop farm Ebolowa 30.1 0.0 0.0 69.9 Mbalmayo 0.0 0.0 8.8 91.2 Yaoundé 0.0 17.0 0.0 83.0 Young secondary forests (30) Abandoned cocoa farm Cucumeropsis farm Tomato farm Mixed food-crop farm Ebolowa 6.2 22.4 0.0 71.4 Mbalmayo 0.0 0.0 0.0 100.0 Yaoundé 0.0 0.0 0.0 100.0
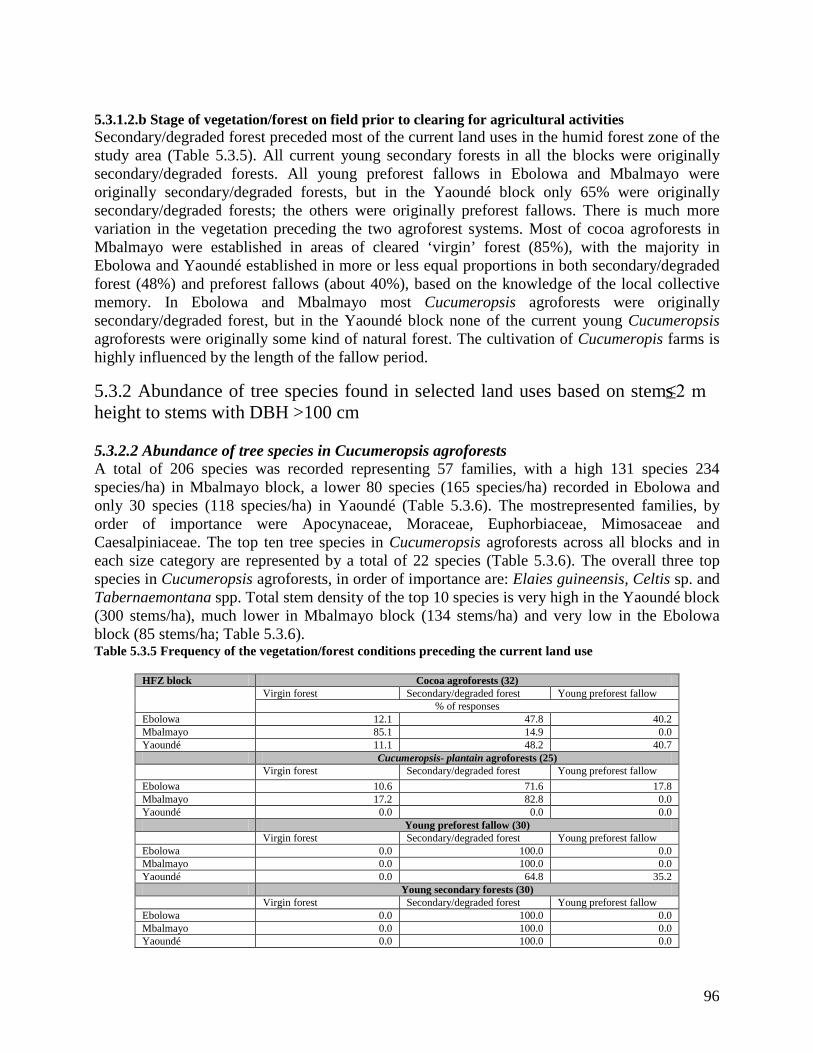
96
5.3.1.2.b Stage of vegetation/forest on field prior to clearing for agricultural activities Secondary/degraded forest preceded most of the current land uses in the humid forest zone of the study area (Table 5.3.5). All current young secondary forests in all the blocks were originally secondary/degraded forests. All young preforest fallows in Ebolowa and Mbalmayo were originally secondary/degraded forests, but in the Yaoundé block only 65% were originally secondary/degraded forests; the others were originally preforest fallows. There is much more variation in the vegetation preceding the two agroforest systems. Most of cocoa agroforests in Mbalmayo were established in areas of cleared ‘virgin’ forest (85%), with the majority in Ebolowa and Yaoundé established in more or less equal proportions in both secondary/degraded forest (48%) and preforest fallows (about 40%), based on the knowledge of the local collective memory. In Ebolowa and Mbalmayo most Cucumeropsis agroforests were originally secondary/degraded forest, but in the Yaoundé block none of the current young Cucumeropsis agroforests were originally some kind of natural forest. The cultivation of Cucumeropis farms is highly influenced by the length of the fallow period.
5.3.2 Abundance of tree species found in selected land uses based on stems ≤2 m height to stems with DBH >100 cm 5.3.2.2 Abundance of tree species in Cucumeropsis agroforests A total of 206 species was recorded representing 57 families, with a high 131 species 234 species/ha) in Mbalmayo block, a lower 80 species (165 species/ha) recorded in Ebolowa and only 30 species (118 species/ha) in Yaoundé (Table 5.3.6). The mostrepresented families, by order of importance were Apocynaceae, Moraceae, Euphorbiaceae, Mimosaceae and Caesalpiniaceae. The top ten tree species in Cucumeropsis agroforests across all blocks and in each size category are represented by a total of 22 species (Table 5.3.6). The overall three top species in Cucumeropsis agroforests, in order of importance are: Elaies guineensis, Celtis sp. and Tabernaemontana spp. Total stem density of the top 10 species is very high in the Yaoundé block (300 stems/ha), much lower in Mbalmayo block (134 stems/ha) and very low in the Ebolowa block (85 stems/ha; Table 5.3.6). Table 5.3.5 Frequency of the vegetation/forest conditions preceding the current land use
HFZ block Cocoa agroforests (32) Virgin forest Secondary/degraded forest Young preforest fallow
% of responses Ebolowa 12.1 47.8 40.2 Mbalmayo 85.1 14.9 0.0 Yaoundé 11.1 48.2 40.7 Cucumeropsis- plantain agroforests (25) Virgin forest Secondary/degraded forest Young preforest fallow Ebolowa 10.6 71.6 17.8 Mbalmayo 17.2 82.8 0.0 Yaoundé 0.0 0.0 0.0 Young preforest fallow (30) Virgin forest Secondary/degraded forest Young preforest fallow Ebolowa 0.0 100.0 0.0 Mbalmayo 0.0 100.0 0.0 Yaoundé 0.0 64.8 35.2 Young secondary forests (30) Virgin forest Secondary/degraded forest Young preforest fallow Ebolowa 0.0 100.0 0.0 Mbalmayo 0.0 100.0 0.0 Yaoundé 0.0 100.0 0.0

97
The stem density of individual top 10 species varied much between the blocks. Very few of the top 10 species had ≥20 stems/ha for all sizes. The species occurring with ≥10 stems/ha for all sizes in a block were as follows: Musanga cecropioides (14 stems/ha) and Macaranga sp. (10 stems/ha) in Ebolowa; Elaeis guineensis (45 stems/ha), Voacanga africana (13 stems/ha) and Hylodendron gabonense (11 stems/ha) in Mbalmayo. In the Yaoundé block all top 10 species occurred with ≥20 stems/ha for all sizes and the species with particularly high density were Celtis spp (60 stems/ha), Elaeis guineensis (50 stems/ha) and Tabernaemontana spp. (35 stems/ha). Most of these top 10 species are fast-growing ones, but their density varied between blocks with different successional status but seems to be dominated by early regrowth and advanced regrowth species (Table 5.3.6). The top 10 species occurring with ≥9 stems/ha for small to large trees in a block were as follows: Musanga cecropioides (12 stems/ha) in Ebolowa block; Elaeis guineensis and Hylodendron gabonense (9 stems/ha each) in Mbalmayo block; Celtis sp, Oncoba welwitschii and Tabernaemontana sp (15 stems/ha each), and Elaeis guineensis and Dacryodes edulis (10 stems/ha each) in Yaoundé block. Total stem density/ha for all species over all sizes is very high in Mbalmayo block (1309 stems/ha), lower in Ebolowa block (1113 stems/ha) and much lower in Yaoundé block (730 stems/ha, Table 5.3.6). The general trend for the stem density over the different stem size categories is that the smallest size category has the highest density with a decline towards the medium to large trees but there is much variation between blocks in the different size categories. Seedlings represented a very high 999 stems/ha in Ebolowa (89.7% of all stems), 570 stems/ha in Mbalmayo (46% of all stems), and 425 stems/ha in Yaoundé (58% of all stems). The Mbalmayo block has the highest stem density/ha for the saplings and poles combined (568 stems/ha), with 170 stems/ha in Yaoundé and 40 stems/ha in Ebolowa. The small to large trees represented 172 stems/ha in Mbalmayo, 165 stems/ha in Yaoundé and 75 stems/ha in Ebolowa. The ratio of stem density/ha of all sizes between the top 10 and all the species is very high (0.41) in Yaoundé block, relative lower (0.10) in Mbalmayo block and much lower (0.08) in Ebolowa block (Table 5.3.6). 5.3.2.2 Abundance of tree species in cocoa agroforests The total of 127 species were recorded, representing 41 plant families, with a high of 71 species (89 species/ha) in Mbalmayo block, 51 species (a highest 128 species/ha) in Ebolowa compared to the two others sites, and only 27 species (61 species/ha) in Yaoundé (Table 5.3.7). The most represented families, by order of importance were Sterculiaceae, Euphorbiaceae, Apocynaceae, Moraceae, Lauraceae, Caesalpiniaceae and Burseraceae. The top 10 tree species in cocoa agroforests in each block over all size categories represent 17 species (Table 5.3.7). The overall five top species in order of importance are Persea americana, Elaies guineensis, Funtumia sp., Margaritaria discoides and Dacryodes edulis. Total stem density for the top 10 species is similar in the Ebolowa and Yaoundé blocks (228 to 230 stems/ha), but much lower in the Mbalmayo block (131 stems/ha).

98
Table 5.3.6 Stem density (stems/ha) by plant size categories in Cucumeropsis agroforests for top 10 plant species in each block Species; Wood quality*; Successional status**
Seedlings & sprouts
Saplings & small poles
Large Poles
Small Trees
Medium-sized trees
Large trees
Grand total
Ebolowa block (sampled area = 0.68 ha) Musanga cecropiodes: 1 ; a & b 2.9 11.8 14.7 Macaranga sp: 1; b 5.9 2.9 1.5 10.3 Elaeis guineensis: 1; a, b & c 7.4 1.5 8.8 Albizia adianthifolia: 3; b 2.9 5.9 8.8 Icacina mannii: 3; b & c 5.9 1.5 7.4 Voacanga africana: 1; b & c 4.4 1.5 5.9 Tabernaemontana sp: 1; a & b 5.9 5.9 Panda oleosa: 3 4.4 1.5 5.9 Margaritaria discoides: 3; c 4.4 1.5 5.9 Funtumia sp: 1; a & b 4.4 1.5 5.9 Enantia chlorantha:2; b & c 5.9 5.9 Total species/ha (actual) 108.8 (74) 14.7 (10) 16.2 (11) 27.9 (19) 16.2 (11) 1.5 (1) 117.6 (80) Total stems/ha for top 10 species (relative density % )
50.0 (58.6)
0.0 (0.0)
0.0 (0.0)
26.5 (31.0)
1.5 (1.7)
1.5 (1.7)
85.3
Total stems/ha for all species (relative density %)
998.5 (89.7)
19.1 (1.7)
20.6 (1.9)
57.4 (5.2)
16.2 (1.5)
1.0 (0.1)
1113.2
Mbalmayo block (sampled area = 0.56 ha) Elaeis guineensis 33.9 1.8 3.6 5.4 44.6 Voacanga Africana 3.6 3.6 1.8 3.6 12.5 Hylodendron gabonense: 2-3; b & c 1.8 3.6 5.4 10.7 Scyphocephamiiun ochocoa : 3; c & d 3.6 3.6 1.8 8.9 Ricinodendron heudelotii: 1; b & c 7.1 1.8 8.9 Petersianthus macrocarpus : 3; c & d 1.8 7.1 8.9 Margaritaria discoides 1.8 1.8 5.4 8.9 Albizia adianthifolia 3.6 3.6 1.8 8.9 Terminalia superba:2; a, b & c 1.8 1.8 3.6 7.1 Milicia exelsa: 3; c & d 1.8 1.8 1.8 1.8 7.1 Distemonathus benthamianus : 3 1.8 3.6 1.8 7.1 Total species/ha (actual) 121.4 (68) 98.2 (55) 73.2 (41) 64.3 (36) 14.3 (8) 1.8 (1) 233.9 (131) Total stems/ha for top 10 species (relative density % )
50.0 (37.3)
7.1 (5.3)
16.1 (12.0)
30.4 (22.7)
30.4 (22.7)
0.0 (0.0)
133.9
Total stems/ha for all species (relative density %)
569.6 (45.5)
400.0 (30.6)
167.9 (12.8)
155.4 (11.9)
14.3 (1.1)
1.8 (0.1)
1308.9
Yaoundé block (sampled area = 0.20 ha) Celtis sp.: 3; c & d 45.0 15.0 60.0 Elaeis guineensis: 1 40.0 10.0 50.0 Tabernaemontana sp.:1 20.0 15.0 35.0 Spathodea campanulata: 1; a & b 20.0 5.0 25.0 Funtumia sp. 15.0 5.0 5.0 25.0 Alchornea floribunda 25.0 25.0 Oncoba welwitschii : 3; b & c 5.0 15.0 20.0 Ficus mucuso ; 3; a 20.0 20.0 Didelotia letouzeyi 10.0 5.0 5 0 20.0 Dacryodes edulis 10.0 10.0 20.0 Total species/ ha (actual) 110.0 (22) 30.0 (6) 40.0 (8) 45.0 (9) 25.0 (5) 5.0 (1) 165.0 (33) Total stems/ha for top 10 species (relative density % )
180.0 (60.0)
25.0 (8.3)
25.0 (8.3)
15.0 (5.0)
55.0 (18.3)
0.0 (0.0)
300.0
Total stems/ha for all species (relative density %)
425.0 (58.2)
85.0 (11.6)
55.0 (7.5)
115.0 (15.8)
45.0 (6.2)
5.0 (0.7)
730.0
*Wood quality: 1=soft; 2=semi-woody; 3=hard woody; **successional status: a=pioneer; b=early regrowth, c=advanced regrowth; d=mature forest; Seedlings & sprouts = Seedlings & resprouting stems ≤2 m height; Saplings & small poles = Stems >2 m height and DBH≤10 cm; Large poles = stem with DBH 11-20 cm; Small trees = stems with DBH 21-50 cm; Medium-sized trees = stem with DBH 51-100 cm; and Large trees = stems with DBH >100 cm.
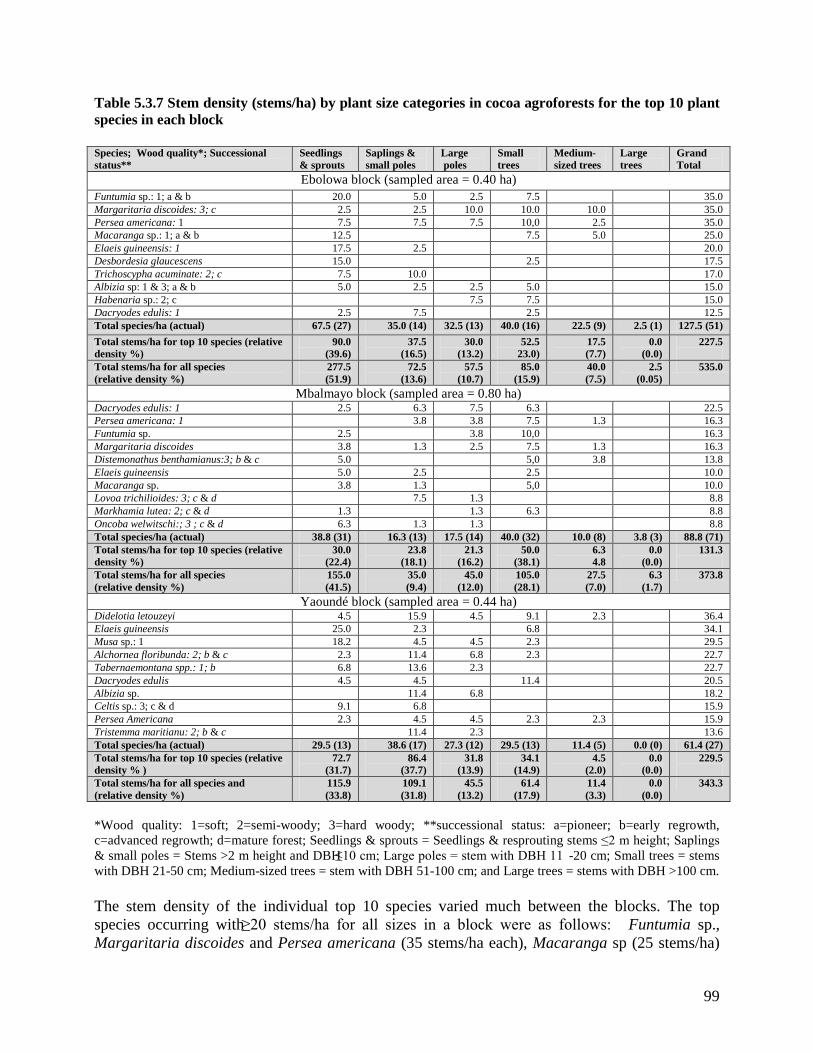
99
Table 5.3.7 Stem density (stems/ha) by plant size categories in cocoa agroforests for the top 10 plant species in each block Species; Wood quality*; Successional status**
Seedlings & sprouts
Saplings & small poles
Large poles
Small trees
Medium-sized trees
Large trees
Grand Total
Ebolowa block (sampled area = 0.40 ha) Funtumia sp.: 1; a & b 20.0 5.0 2.5 7.5 35.0 Margaritaria discoides: 3; c 2.5 2.5 10.0 10.0 10.0 35.0 Persea americana: 1 7.5 7.5 7.5 10,0 2.5 35.0 Macaranga sp.: 1; a & b 12.5 7.5 5.0 25.0 Elaeis guineensis: 1 17.5 2.5 20.0 Desbordesia glaucescens 15.0 2.5 17.5 Trichoscypha acuminate: 2; c 7.5 10.0 17.0 Albizia sp: 1 & 3; a & b 5.0 2.5 2.5 5.0 15.0 Habenaria sp.: 2; c 7.5 7.5 15.0 Dacryodes edulis: 1 2.5 7.5 2.5 12.5 Total species/ha (actual) 67.5 (27) 35.0 (14) 32.5 (13) 40.0 (16) 22.5 (9) 2.5 (1) 127.5 (51) Total stems/ha for top 10 species (relative density %)
90.0 (39.6)
37.5 (16.5)
30.0 (13.2)
52.5 23.0)
17.5 (7.7)
0.0 (0.0)
227.5
Total stems/ha for all species (relative density %)
277.5 (51.9)
72.5 (13.6)
57.5 (10.7)
85.0 (15.9)
40.0 (7.5)
2.5 (0.05)
535.0
Mbalmayo block (sampled area = 0.80 ha) Dacryodes edulis: 1 2.5 6.3 7.5 6.3 22.5 Persea americana: 1 3.8 3.8 7.5 1.3 16.3 Funtumia sp. 2.5 3.8 10,0 16.3 Margaritaria discoides 3.8 1.3 2.5 7.5 1.3 16.3 Distemonathus benthamianus:3; b & c 5.0 5,0 3.8 13.8 Elaeis guineensis 5.0 2.5 2.5 10.0 Macaranga sp. 3.8 1.3 5,0 10.0 Lovoa trichilioides: 3; c & d 7.5 1.3 8.8 Markhamia lutea: 2; c & d 1.3 1.3 6.3 8.8 Oncoba welwitschi:; 3 ; c & d 6.3 1.3 1.3 8.8 Total species/ha (actual) 38.8 (31) 16.3 (13) 17.5 (14) 40.0 (32) 10.0 (8) 3.8 (3) 88.8 (71) Total stems/ha for top 10 species (relative density %)
30.0 (22.4)
23.8 (18.1)
21.3 (16.2)
50.0 (38.1)
6.3 4.8
0.0 (0.0)
131.3
Total stems/ha for all species (relative density %)
155.0 (41.5)
35.0 (9.4)
45.0 (12.0)
105.0 (28.1)
27.5 (7.0)
6.3 (1.7)
373.8
Yaoundé block (sampled area = 0.44 ha) Didelotia letouzeyi 4.5 15.9 4.5 9.1 2.3 36.4 Elaeis guineensis 25.0 2.3 6.8 34.1 Musa sp.: 1 18.2 4.5 4.5 2.3 29.5 Alchornea floribunda: 2; b & c 2.3 11.4 6.8 2.3 22.7 Tabernaemontana spp.: 1; b 6.8 13.6 2.3 22.7 Dacryodes edulis 4.5 4.5 11.4 20.5 Albizia sp. 11.4 6.8 18.2 Celtis sp.: 3; c & d 9.1 6.8 15.9 Persea Americana 2.3 4.5 4.5 2.3 2.3 15.9 Tristemma maritianu: 2; b & c 11.4 2.3 13.6 Total species/ha (actual) 29.5 (13) 38.6 (17) 27.3 (12) 29.5 (13) 11.4 (5) 0.0 (0) 61.4 (27) Total stems/ha for top 10 species (relative density % )
72.7 (31.7)
86.4 (37.7)
31.8 (13.9)
34.1 (14.9)
4.5 (2.0)
0.0 (0.0)
229.5
Total stems/ha for all species and (relative density %)
115.9 (33.8)
109.1 (31.8)
45.5 (13.2)
61.4 (17.9)
11.4 (3.3)
0.0 (0.0)
343.3
*Wood quality: 1=soft; 2=semi-woody; 3=hard woody; **successional status: a=pioneer; b=early regrowth, c=advanced regrowth; d=mature forest; Seedlings & sprouts = Seedlings & resprouting stems ≤2 m height; Saplings & small poles = Stems >2 m height and DBH≤10 cm; Large poles = stem with DBH 11 -20 cm; Small trees = stems with DBH 21-50 cm; Medium-sized trees = stem with DBH 51-100 cm; and Large trees = stems with DBH >100 cm. The stem density of the individual top 10 species varied much between the blocks. The top species occurring with ≥20 stems/ha for all sizes in a block were as follows: Funtumia sp., Margaritaria discoides and Persea americana (35 stems/ha each), Macaranga sp (25 stems/ha)

100
and Elaeis guineensis (20 stems/ha) in Ebolowa block; Dacryodes edulis (23 stems/ha) in Mbalmayo; Didelotia letouzeyi (36 stems/ha), Elaeis guineensis (34 stems/ha), Musa sp. (30 stems/ha), Alchornea floribunda and Tabernaemontana spp. (both 23 stems/ha), and Dacryodes edulis (21 stems/ha) in Yaoundé block. Most of these top 10 species are fast-growing with different successional status, but seems to be dominated by early regrowth and advanced regrowth species (Table 5.3.7). The top 10 species occurring with ≥10 stems/ha for small to large trees in a block were as follows: Margaritaria discoides (20 stems/ha), and Persea americana and Macaranga sp (both 13 stems/ha) in the Ebolowa block; Funtumia spp. (10 stems/ha) in the Mbalmayo block; Didelotia letouzeyi and Dacryodes edulis (both 11 stems/ha) in the Yaoundé block. Total stem density/ha for all species over all sizes is high in Ebolowa block (535 stems/ha), and much lower in both the Mbalmayo (374 stems/ha) and Yaoundé blocks (343 stems/ha, Table 5.3.7). The general trend for the stem density over the different stem size categories is that the smallest size category has the highest density with a decline towards the medium to large trees, but there is much variation between blocks in the different size categories (Table 5.3.7). Seedlings represented a high 278 stems/ha in Ebolowa (52% of all stems), 155 stems/ha in Mbalmayo and 116 stems/ha in Yaoundé. The Yaoundé block has the highest stem density for the saplings and poles combined, represented 155 stems/ha in Yaounde, 130 stems/ha in Ebolowa and 80 stems/ha in Mbalmayo. Small to large trees represented 140 stems/ha in Mbalmayo block, 128 stems/ha in Ebolowa block and 73 stems/ha in Yaoundé. The ratio of stem density/ha of all sizes between the top 10 species and all the species is relatively high in Yaoundé block (0.67) and much lower in the Ebolowa (0.43) and Mbalmayo blocks (0.35; Table 5.3.7). 5.3.2.3 Abundance of tree species in young preforest fallows The total of 176 species was recorded, representing 51 families, with a high of 88 species (220 species/ha) in Mbalmayo block, 79 species (198 species/ha) in Ebolowa block, and a much lower 60 species (150 species/ha) in Yaoundé block (Table 5.3.8). The well-represented families, by order of importance were Moraceae, Euphorbiaceae, Apocynaceae, Mimosaceae and Caesalpiniaceae. The top ten tree species in young preforest fallow in each block over all size categories represent 22 species (Table 5.3.8). The overall three top species in young preforest fallow, in order of importance, are: Macaranga sp., Myrianthus arboreus and Elaeis guineensis. Total stem density of the top 10 species is highest in Ebolowa block (713 stems/ha), and lower in the Yaoundé (598 stems/ha) and Mbalmayo blocks (578 stems/ha; Table 5.3.8). The stem density of the individual top 10 species varied much between the blocks. The top species occurring with ≥60 stems/ha for all sizes in a block were as follows: Myrianthus arboreus (140 stems/ha), Macaranga sp. (135 stems/ha), Musanga cecropioides (63 stems/ha) and Funtumia sp. (60 stems/ha) in Ebolowa block; Elaeis guineensis (170 stems/ha), Macaranga sp. (80 stems/ha) and Didelotia letouzeyi (68 stems/ha) in Mbalmayo block; and Celtis sp. (110

101
Table 5.3.8 Stem density (stems/ha) by plant size categories in young preforest fallows for top 10 plant species in each block
Species; Wood quality*; Successional status**
Seedlings & sprouts
Saplings & small poles
Large poles
Small trees
Medium-sized trees
Large trees
Grand Total
Ebolowa block (sampled area = 0.40 ha) Myrianthus arboreus: 1; b & c 47.5 35.0 15.0 42.5 140.0 Macaranga sp.: 1; a & b 42.5 50.0 27.5 12.5 2.5 135.0 Musanga cecropioides 12.5 7.5 10.0 27.5 5 62.5 Funtumia sp.: 1; a & b 40.0 15..0 5.0 60.0 Pentaclethra macrophylla: 3 37.5 7.5 2.5 5.0 5.0 57.5 Albizia ferruginea: 1 ; a & b 32.5 12.5 5.0 50.0 Oncoba welwitschii 25.0 12.5 2.5 2.5 42.5 Antiraris africana: 2; c & d 20.0 20.0 2.5 42.5 Pycnanthus angolensis 17.5 17.5 7.5 42.5 Ficus mucuso 17.5 17.5 5.0 40.0 Voacanga africana 37.5 2.5 40.0 Total species /ha (actual) 135.0 (54) 105.0 (42) 75.0 (30) 47.5 (19) 17.5 (7) 2.5 (1) 197.5 (79) Total stems/ha for top 10 species (relative density %)
330.0 (46.3)
197.5 (27.7)
82.5 (11.6)
90.0 (12.6)
12.5 (1.8)
0.0 (0.0)
712.5
Total stems/ha for all species (relative density %)
732.5 (46.3)
462.5 (29.2)
205.0 (13.95)
157.5 (9.95)
22.5 (1.4)
2.5 (0.2)
1 582.5
Mbalmayo block (sampled area = 0.40 ha) Elaeis guineensis: 1 72.5 22.5 22.5 45.0 7.5 170.0 Macaranga sp. 5.0 52.5 20.0 2.5 80.0 Didelotia letouzeyi: 1; a & b 25.0 37.5 5.0 67.5 Myrianthus arboreus 10.0 15.0 12.5 20.0 57.5 Tristemma maritianu 10.0 22.5 7.5 40.0 Albizia adianthifolia 2.5 17.5 5.0 7.5 2.5 2.5 37.5 Alchornea floribunda: 2; b & c 7.5 15.0 7.5 5.0 35.0 Antiraris africana: 1; b & c 2.5 17.5 7.5 2.5 30.0 Funtumia sp. 5.0 10 2.5 10.0 2.5 30.0 Margaritaria discoides 5.0 17.5 5.0 2.5 30.0 Total species/ha (actual) 100.0 (40) 152.5 (61) 100.0 (40) 92.5 (37) 15.0 (6) 5.0 (2) 220.0 (88) Total stems/ha for top 10 species (relative density %)
135.0 (23.4)
215.0 (37.2)
110.0 (19)
102.5 (17.7)
12.5 (2.2)
2.5 (0.4)
577.5
Total stems/ha for all species (relative density %)
267.5 (21.8)
492.5 (40.2)
232.5 (19.0)
205.0 (16.7)
22.5 (1.8)
5.0 (0.4)
1225.0
Yaoundé block (sampled area = 0.40 ha) Celtis sp.: 3; c & d 37.5 70.0 2.5 110.0 Didelotia letouzeyi 12.5 50.0 22.5 15.0 100.0 Tabernaemontana sp 17.5 35.0 15.0 5.0 72.5 Antiraris africana 35 27.5 5.0 67.5 Albizia adianthifolia 7.5 42.5 7.5 5.0 62.5 Macaranga sp. 2.5 20.0 10.0 2.5 35.0 Alchornea floribunda 2.5 17.5 5.0 7.5 2.5 35.0 Myrianthus arboreus 2.5 17.5 12.5 32.5 Elaeis guineensis 27.5 2.5 30.0 Ficus mucuso 2.5 7.5 2.5 2.5 2.5 17.5 Margaritaria discoides 10.0 5.0 2.5 17.5 Musa sp. 7.5 10.0 17.5 Total species / ha (actual) 57.5 (23) 77.5 (31) 40.0 (16) 42.5 (17) 10.0 (4) 0.0 (0) 150.0 (60) Total stems/ha for top 10 species (relative density %)
147.5 (24.6)
300.0 (50.2)
95.0 (15.9)
50.0 (8.4)
5.0 (0.9)
0.0 (0.0)
597.5
Total stems/ha for all species (relative density %)
227.5 (25.9)
395.0 (45.0)
162.5 (17.9)
82.5 (9.4)
10.0 (1.1)
0.0 (0.0)
877.5
*Wood quality: 1=soft; 2=semi-woody; 3=hard woody; **successional status: a=pioneer; b=early regrowth, c=advanced regrowth; d=mature forest; Seedlings & sprouts = Seedlings & resprouting stems ≤2 m height; Saplings & small poles = Stems >2 m height and DBH≤10 cm; Large poles = stem with DBH 11 -20 cm; Small trees = stems with DBH 21-50 cm; Medium-sized trees = stem with DBH 51-100 cm; and Large trees = stems with DBH >100 cm.
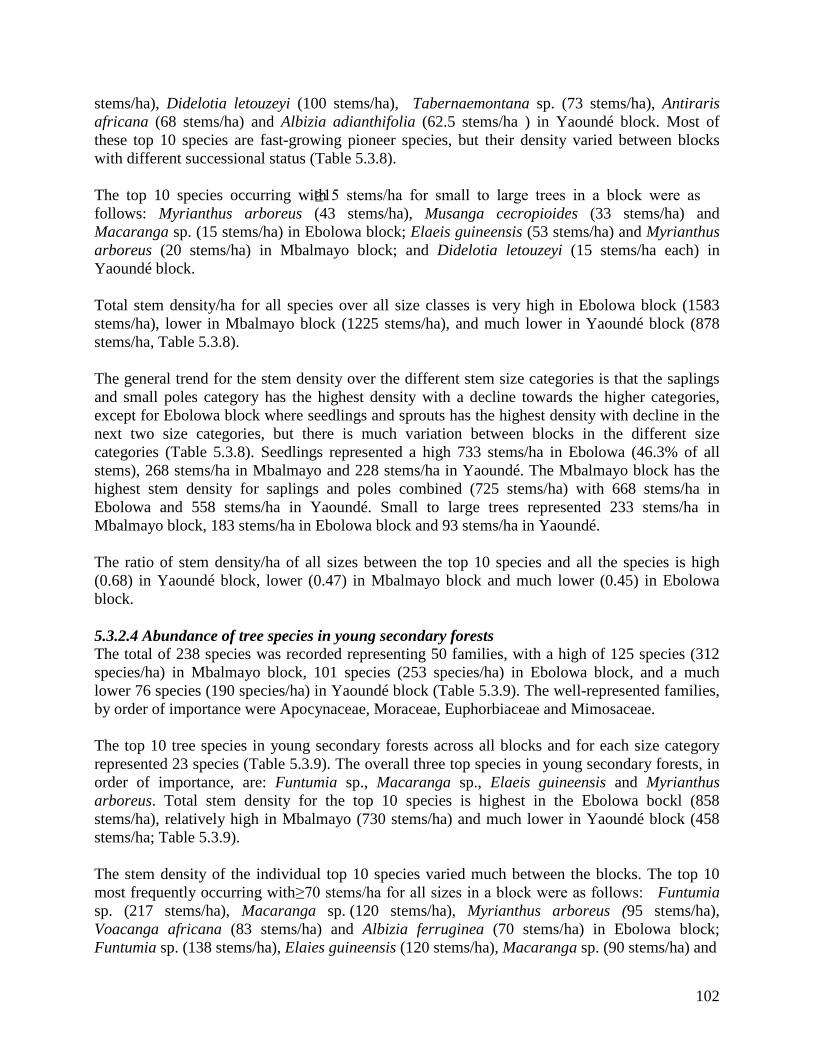
102
stems/ha), Didelotia letouzeyi (100 stems/ha), Tabernaemontana sp. (73 stems/ha), Antiraris africana (68 stems/ha) and Albizia adianthifolia (62.5 stems/ha ) in Yaoundé block. Most of these top 10 species are fast-growing pioneer species, but their density varied between blocks with different successional status (Table 5.3.8). The top 10 species occurring with ≥15 stems/ha for small to large trees in a block were as follows: Myrianthus arboreus (43 stems/ha), Musanga cecropioides (33 stems/ha) and Macaranga sp. (15 stems/ha) in Ebolowa block; Elaeis guineensis (53 stems/ha) and Myrianthus arboreus (20 stems/ha) in Mbalmayo block; and Didelotia letouzeyi (15 stems/ha each) in Yaoundé block. Total stem density/ha for all species over all size classes is very high in Ebolowa block (1583 stems/ha), lower in Mbalmayo block (1225 stems/ha), and much lower in Yaoundé block (878 stems/ha, Table 5.3.8). The general trend for the stem density over the different stem size categories is that the saplings and small poles category has the highest density with a decline towards the higher categories, except for Ebolowa block where seedlings and sprouts has the highest density with decline in the next two size categories, but there is much variation between blocks in the different size categories (Table 5.3.8). Seedlings represented a high 733 stems/ha in Ebolowa (46.3% of all stems), 268 stems/ha in Mbalmayo and 228 stems/ha in Yaoundé. The Mbalmayo block has the highest stem density for saplings and poles combined (725 stems/ha) with 668 stems/ha in Ebolowa and 558 stems/ha in Yaoundé. Small to large trees represented 233 stems/ha in Mbalmayo block, 183 stems/ha in Ebolowa block and 93 stems/ha in Yaoundé. The ratio of stem density/ha of all sizes between the top 10 species and all the species is high (0.68) in Yaoundé block, lower (0.47) in Mbalmayo block and much lower (0.45) in Ebolowa block. 5.3.2.4 Abundance of tree species in young secondary forests The total of 238 species was recorded representing 50 families, with a high of 125 species (312 species/ha) in Mbalmayo block, 101 species (253 species/ha) in Ebolowa block, and a much lower 76 species (190 species/ha) in Yaoundé block (Table 5.3.9). The well-represented families, by order of importance were Apocynaceae, Moraceae, Euphorbiaceae and Mimosaceae. The top 10 tree species in young secondary forests across all blocks and for each size category represented 23 species (Table 5.3.9). The overall three top species in young secondary forests, in order of importance, are: Funtumia sp., Macaranga sp., Elaeis guineensis and Myrianthus arboreus. Total stem density for the top 10 species is highest in the Ebolowa bockl (858 stems/ha), relatively high in Mbalmayo (730 stems/ha) and much lower in Yaoundé block (458 stems/ha; Table 5.3.9). The stem density of the individual top 10 species varied much between the blocks. The top 10 most frequently occurring with ≥70 stems/ha for all sizes in a block were as follows: Funtumia sp. (217 stems/ha), Macaranga sp. (120 stems/ha), Myrianthus arboreus (95 stems/ha), Voacanga africana (83 stems/ha) and Albizia ferruginea (70 stems/ha) in Ebolowa block; Funtumia sp. (138 stems/ha), Elaies guineensis (120 stems/ha), Macaranga sp. (90 stems/ha) and

103
Table 5.3.9 Stem density (stems/ha) by plant size categories in young secondary forests for top 10 tree species in each block
Species; Wood quality*; Successional status**
Seedlings & sprouts
Saplings & small poles
Large poles
Small trees Medium-sized trees
Large trees
Grand Total
Ebolowa block (sampled area = 0.40 ha) Funtumia sp.: 1; a & b 105.0 85.0 10.0 17.5 217.5 Macaranga sp. 15.0 22.5 32.5 47.5 2.5 120.0 Myrianthus arboreus : 1; b & c 27.5 27.5 27.5 12.5 95.0 Voacanga africana: 2; b & c 52.5 12.5 10.0 7.5 82.5 Albizia ferruginea 20.0 20.0 10.0 17.5 2.5 70.0 Tabernaemontana sp : 1; a & b 30.0 27.5 2.5 60.0 Icacina mannii 42.5 10.0 5.0 57.5 Distemonathus benthamianus: 3 22.5 22.5 7.5 52.5 Musanga cecropioides : 1 a 5.0 30.0 17.5 52.5 Petersianthus macrocarpus: 3 17.5 17.5 12.5 2.5 50.0 Total species/ ha (actual) 120.0 (48) 127.5 (51) 72.5 (29) 62.5 (25) 27.5 (11) 0.0 (0) 252.5 (101) Total stems/ha for top 10 species (Relative density %)
332.5 (38.7)
245.0 (28.6)
110.0 (12.8)
145.0 (16.9)
25.0 (2.9)
0.0 (0.0)
857.5
Total stand density/ha for all species (relative density %)
835.0 (40.8)
652.5 (31.9)
267.5 (13.1)
245.0 (11.96)
45.0 (2.2)
2.5 (0.1)
2 047.5
Mbalmayo block (sampled area = 0.40 ha) Funtumia sp. 25.0 50.0 37.5 25.0 137.5 Elaeis guineensis 70.0 25.0 2.5 22.5 120.0 Macaranga sp. 7.5 22.5 17.5 42.5 90.0 Voacanga africana 27.5 47.5 2.5 77.5 Scyphocephamiiun ochocoa 12.5 42.5 7.5 5.0 67.5 Margaritaria discoides: 3; c & d 10.0 22.5 7.5 15.0 5.0 60.0 Markhamia lutea 7.5 32.5 7.5 2.5 2.5 52.5 Myrianthus arboreus 5.0 25.0 7.5 10.0 47.5 Oncoba welwitschii: 2; c & d 7.5 30.0 2.5 40.0 Lovoa trichilioides 2.5 30.0 2.5 2.5 37.5 Total species/ha (actual) 110.0 (44) 170.0 (68) 117.5 (47) 102.5 (41) 25.0 (10) 7.5 (3) 312.5 (125) Total stems/ha for top 10 species (relative density %)
175.0 (24)
327.5 (44 .8)
92.5 (12.7)
125.0 (17.1)
10.0 (1.4)
0.0 (0.0)
730.0
Total stand density per ha for all species (relative density %)
422.5 (22.2)
840.0 (44.2)
317.5 (16.7)
280.0 (14.7)
32.5 (1.7)
7.5 (0.4)
1900.0
Yaoundé block (sampled area = 0.40 ha) Celtis sp. 7.5 47.5 10.0 5.0 70.0 Didelotia letouzeyi 17.5 20.0 27.5 65.0 Tabernaemontana sp. 2.5 30.0 15.0 17.5 65.0 Elaeis guineensis 25 10.0 10.0 45.0 Macaranga sp. 2.5 17.5 10.0 12.5 2.5 45.0 Albizia adianthifolia 10.0 15.0 12.5 2.5 40.0 Rauwolfia spp. 2.5 12.5 5.0 15.0 35.0 Antiraris africana 5.0 22.5 5.0 32.5 Ficus mucuso 7.5 5.0 15.0 2.5 30.0 Musa sp. 22.5 2.5 5.0 30.0 Total species/ha (actual) 77.5 (31) 90.0 (36) 80.0 (32) 75.0 (30) 22.5 (9) 2.5 (1) 190.0 (76) Total stems/ha for top 10 species (relative density %)
67.5 (14.8)
175.0 (38.3)
87.5 (19.0)
120.0 (26.2)
5.0 (1.1)
2.5 (0.6)
457.5
Total stand density per ha for all species (relative density %)
142.5 (13.9)
357.5 (34.9)
245.0 (23.9)
225.0 (22.0)
25.0 (2.4)
5.0 (0.5)
1025.0
*Wood quality: 1=soft; 2=semi-woody; 3=hard woody; **successional status: a=pioneer; b=early regrowth, c=advanced regrowth; d=mature forest; Seedlings & sprouts = Seedlings & resprouting stems ≤2 m height; Saplings & small poles = Stems >2 m height and DBH≤10 cm; Large poles = stem with DBH 11 -20 cm; Small trees = stems with DBH 21-50 cm; Medium-sized trees = stem with DBH 51-100 cm; and Large trees = stems with DBH >100 cm.

104
Voacanga africana (78 stems/ha) in Mbalmayo block; and Celtis sp (70 stems/ha) in Yaoundé block. Most of these ten 10 species are fast-growing species, with different successional status but seems to be dominated by early regrowth, advanced regrowth and mature forest species (Table 5.3.9). The top 10 species occurring with ≥20 stems/ha for small to large trees in a block were as follows: Macaranga sp. (50 stems/ha), Musanga cecropioides (48 stems/ha) and Albizia ferruginea (20 stems/ha) in Ebolowa block; Macaranga sp. (43 stems/ha), Funtumia sp. (25 stems/ha), Elaeis guineensis (23 stems/ha) and Margaritaria discoides (20 stems/ha) in Mbalmayo block; and Didelotia letouzeyi (28 stems/ha) in Yaoundé block. Total stem density/ha for all species over all sizes is very high in Ebolowa block (2048 stems/ha), a little lower in Mbamayo block (1900 stems/ha) and much lower in Yaoundé block (1025 stems/ha; Table 5.3.9). The general trend for the stem density over the different stem size categories were that the saplings and small poles category have the highest density with a decline to the next higher category, except for Ebolowa block where seedlings and sprouts category has the highest density with a decline in the next two size categories, but there was much variation between blocks in the different size categories (Table 5.3.9). Seedlings represented a relatively high 835 stems/ha in Ebolowa (41% of all stems), 423 stems/ha in Mbalmayo and 143 stems/ha in Yaoundé. The Mbalmayo block had the highest stem density for the saplings and poles combined (1158 stems/ha), with 920 stems/ha in Ebolowa and 603 stems/ha in Yaoundé. Small to large trees represented 320 stems/ha in Mbalmayo block, 293 stems/ha in Ebolowa block and 255 stems/ha in Yaoundé. The ratio of stem density/ha of all sizes between the top 10 species and all the species is relatively high (0.45) in Yaoundé block, lower (0.42) in Ebolowa block and much lower (0.38) in Mbalmayo block (Table 5.3.9).
5.3.3 Characterization of food crop varieties and associated plant species within mixed food-crop agroforest systems 5.3.3.1 Distribution of agricultural biodiversity in mixed food-crop agroforests 5.3.3.1.a Number of crop species and their mean number of cultivars per species Twenty six crop species were recorded with a total of 55 cultivars i.e. separate genetic entities (Table 5.3.10). There was a relative high mean number of cultivars per crop species within the study area, with six cultivars for cassava (Manihot esculenta) and five cultivars for plantain (Musa paradisiaca). Twelve per cent of crop species have four or more cultivars, 8% have three, 23% have one and 58% have two cultivars. 5.3.4.1.b Stem density per ha of tree species associated with crops in mixed food-crop agroforest systems The total of 56 species was recorded, representing 51 plant families, with a similar relatively high 42 to 43 species (150 to 154 species/ha) respectively in Ebolowa and Mbalmayo blocks respectively, and a much lower 23 species (61 species/ha) in Yaoundé block (Table 5.3.11). The

105
well-represented families by order of importance were Apocynaceae, Moraceae, Euphorbiaceae, Mimosaceae and Caesalpiniaceae. Table 5.3.10 Crop species and cultivars per species within mixed food-crop agroforests
Crop species Common names
Local names
Number of cultivars per crop species
Crop species Common names
Local names
Number of cultivars per crop species
Manihot esculenta cassava mbon 6 Cucumeropsis mannii melon seed ngôn 2 Musa paradisiaca plantain ekon 5 Cucurbita spp squash ndzeng 2 Arachis hypogea groundnut owondo 4 Hibiscus esculentus gumbo etetam 2 Zea mays maize fon 3 Solanum incanum eggplant zong 2 Solanum nigrum eggplant zom 3 Capsicum spp. pepper ondondo 2 Vernonia amygdalina ndole metet 2 Lycopersicon esculentum tomatoe ngoro 2 Musa sapientum banana odjoé 2 Dioscorea sp yam ekoara 2 Ipomea batatas sweet
potatoe meboura 2 Colocasia esculenta cocoyam atu 1
Xanthosoma sagittifolium macabo akaba 2 Talinum triangulare epinard elók soup
1
Allium spp onion ayan 2 Solanum aethiopicum eggplant zom nnam
1
Amaranthus spp amarantha folong 2 Nicotiana tabacum tabaco ta’a 1 Carica papaya papaya fofo 2 Cucumis sativa cucumber ombalak 1 Corchorus olitorius tegue 2 Solanum tuberosum potatoe atora 1
The stem density of the individual top 10 species varied much between the blocks. The top species occurring with ≥20 stems/ha for all sizes in a block were as follows: Funtumia sp., Margaritaria discoides and Persea americana (35 stems/ha each), Macaranga sp. (25 stems/ha) and Elaeis guineensis (20 stems/ha) in Ebolowa block; Dacryodes edulis (23 stems/ha) in Mbalmayo block; and Didelotia letouzeyi (36 stems/ha), Elaeis guineensis (34 stems/ha), Musa sp. (30 stems/ha), Alchornea floribunda and Tabernaemontana spp. (both 23 stems/ha), and Dacryodes edulis (20.5 stems/ha) in Yaoundé block. Most of these top 10 species are fast-growing with different successional status, but seems to be dominated by early regrowth and advanced regrowth species (Table 5.3.6). The top 10 most frequently occurring species, by stem density, are shown in Table 5.3.11. The top four species recorded were: Tabernaemontana sp., Elaeis guineensis Albizia adianthifolia and Didelotia letouzeyi. Total stem density was very high in the Ebolowa block (421 stems/ha), much lower in Yaoundé block (392 stems/ha) and very lower in Mbalmayo block (239 stems/ha; Table 5.3.11). The stem density of the individual top 10 species varied much between the blocks. The top species occurring with ≥35 stems/ha for all sizes in a block were as follows: Tabernaemontana spp. (107 stems/ha), Elaeis guineensis (61 stems/ha), Albizia adianthifolia (46 stems/ha), Rauwolfia vomitoria (43 stems/ha), Didelotia letouzeyi (39 stems/ha) and Macaranga sp. (36 stems/ha) in Ebolowa block; Macaranga spp. (39 stems/ha) and Albizia adianthifolia (36 stems/ha) in Mbalmayo block; and Tabernaemontana spp. (163 stems/ha), Elaeis guineensis (45 stems/ha), and Didelotia letouzeyi and Pseudospondias longifolia (42 stems/ha each) in Yaoundé block. Most of these 10 species are fast-growing pioneer species, but vary between blocks with different successional status (Table 5.3.11).
106
Total stem density/ha for all species over all sizes is high in Ebolowa block (629 stems/ha), and similarly lower in Mbamayo block (493 stems/ha) and Yaoundé blocks (468 stems/ha). The ratio of stem density/ha of all sizes between the top 10 species and all the species is high (0.84) in Yaoundé block, relatively high (0.67) in Ebolowa block and much lower (0.46) in Mbalmayo block (Table 5.3.11). Table 5.3.11 Stem density (stems/ha) of the top 10 plant species associated with food crops within mixed food-crop agroforests Woody plant species Ebolowa Mbalmayo Yaoundé Mean Wood quality Succesional
status Tabernaemontana spp. 107.1 25.0 163.2 98.4 1 a & b Elaeis guineensis 60.7 28.6 44.7 44.7 1 Albizia adianthifolia 46.4 35.7 34.2 38.8 1 a & b Didelotia letouzeyi 39.3 28.6 42.1 36.7 1 b Pseudospondias longifolia 28.6 7.1 42.1 25.9 1 b & c Macaranga spp. 35.7 39.3 2.6 25.9 1 a Rauwolfia vomitoria 42.9 25.0 7.9 25.3 1 b & c Alchornea floribunda 25.0 28.6 18.4 24.0 2 b & c Antiraris africana 21.4 21.4 5.3 16.0 1 b & c Celtis spp. 14.3 0.0 31.6 15.3 1 c & d Total number of species 42 43 23 36.0 Total species/ha (actual) 150.0 153.6 60.5 121.4 Total stems /ha for top 10 species (% of total)
421.4 (67.0)
239.3 (48.5)
392.1 (83.7)
350.9 (66.4)
Total stems/ ha for all species 628.6 492.9 468.4 530.3
*Wood quality: 1=tender; 2=semi-woody; 3=hard woody; **successional status: a=pioneer; b=early regrowth; c=advanced regrowth; d=mature forest. 5.3.4 Comparison of stand composition between land uses 5.3.4 a Comparison of stand stem density between land uses The total stand density for all species over all plant size categories varied much between the five selected land uses. Young secondary forests had a very high (4948 stems/ha), with a decline to 3685 stems/ha in young preforest fallows and 3152 stems/ha in Cucumeropsis agroforests, and much lower densities in mixed food-crop agroforests (1590 stems/ha) and Cocoa agroforests (1573 stems/ha; Table 5.3.12). The total stand density for the top 10 species follows a similar order over the different land uses, i.e. from a very high 1 750 stems/ha in the young secondary forests to a relatively very low 479 stems/ha in Cocoa agroforests (Table 5.3.12). However, the ratio of total stem density of the top 10 species to that of all species is relatively constant between 30% and 39%, except for the 66% for the mixed food-crop agroforests (Table 5.3.12). The total stem density of the individual top 10 species varied much between the five studied land uses (Table 5.3.12). If one considers species as particularly important if they have ≥60 stems/ha for all sizes in any particular land use, then the top species in the different land uses were as follows (for details see Table 5.3.12): Persea americana (67 stems/ha) and Elaeis guineensis (64 stems/ha) in cocoa agroforests; all 10 species listed for Cucumeropsis agroforests with stem densities ranging from 165 stems/ha for Musanga cecropiodes to 64 stems/ha for Myrianthus

107
arboreus; eight species listed for mixed food-crop agroforests with stem densities ranging from 295 stems/ha for Tabernaemontana sp. to 72 stems/ha for Celtis sp.; five species listed for young preforest fallows with stem densities ranging from 100 stems/ha for Macaranga sp to 66 stems/ha for Didelotia letouzeyi; six species listed for young secondary forests with stem densities ranging from 151 stems/ha for Funtumia sp. to 63 stems/ha for Tabernaemontana sp. and Myrianthus arboreus. Most of these top 10 species are fast-growing with differences in successional status (Table 5.3.6). Four of the top 10 tree species are common (i.e. amongst top 10 species) in the five land uses: Albizia sp, Tabernaemontana sp, Elaeis guineensis and Macaranga sp. (Table 5.3.12). Only Funtumia sp. is common to four land uses (not in mixed food-crop agroforests). Only Didelotia letouzeyi and Myrianthus arboreus are common in three land uses. The other plant species are either common in two land uses or in only one land use. Cocoa agroforests have three ‘unique’ top 10 species, i.e. Persea americana, Dacryodes edulis and Musa sp. (all three species are mostly planted, representing 32.5% of the recorded stems). Mixed food-crop agroforests and Cucumeropsis agroforests each have two ‘unique’ top 10 species (respectively representing 15.9% and 14.2% of the total stem density of top 10 species), young secondary forests have one, and young preforest fallows had none (Table 5.3.12). 5.3.4.b Comparison of the number of top 10 species that are shared between two land uses Two combinations share eight of the top 10 species each (Table 5.3.13): Mixed food-crop agroforests with young preforest fallows; and young secondary forests with Cucumeropsis agroforests. Four combinations share six species. Musa sp., Dacryodes edulis and Persea americana are specific species for cocoa agroforests. Timber species such as Pycnanthus angolensis and Terminalia superba become established during Cucumeropsis agroforests. Rauwolfia vomitoria is a medicinal plant (for the treatment of malaria) and specifically occur in high numbers in mixed food-crop agroforests (Table 5.3.13). Table 5.3.13 Comparison of number of species common to two land uses
Land uses Cucumeropsis agroforests
Mixed food-crop agroforests
Young preforest fallows
Young secondary
forests Number of species common to two land uses
Cocoa agroforest 5 4 6 6 Cucumeropsis agroforest All 4 6 8 Mixed food-crop agroforest All 8 4 Young preforest fallow All 6 Young secondary forest All
5.4 DISCUSSION The results have shown that agricultural biodiversity, i.e. the numbers of tree species recorded in fields of different agricultural land uses, is affected by the local land use practices. The practices in the cropping-fallow-forest conversion cycles relate to the history of the current land use patterns, the agricultural biodiversity knowledge of the local farmers, and the characteristics of the agricultural and non-agricultural plant species. The results are discussed in more detail below.

108
Table 5.3.12 Comparison of total stand density for all plant size categories of the top 10 tree species between the five land uses of the cropping-fallow-forest conversion cycles Cocoa agroforests Cucumeropsis agroforests Mixed food-crop agroforests Young preforest fallows Young secondary forests Tree species Grand
total Tree species Grand
total Tree species Grand
total Tree species Grand
total Tree species Grand
total Persea americana C1 67.2 Musanga cecropioides C2 165.0 Tabernaemontana spC5 295.3 Macaranga sp C5 100.0 Funtumia sp. C4 151.0 Elaeis guineensis C5 64.1 Macaranga sp. C5 159.0 Didelotia letouzeyi C3 134.0 Elaeis guineensis C5 87.0 Macaranga sp. C5 103.0 Margaritaria discoides C2 55.8 Albizia sp. C5 159.0 Albizia sp. C5 116.4 Myrianthus arboreus C3 86.0 Elaeis guineensis C5 87.0
Dacryodes edulis C1 55.5 Funtumia sp. C4 130.2 Pseudospondias sp. C1 110.0 Albizia sp. C5 76.0 Albizia sp. C5 79.0
Funtumia sp. C4 51.3 Tabernaemontana sp. C5 103.6 Alchornea floribunda C2 77.8 Didelotia letouzeyi C3 66.0 Tabernaemontana sp C5 63.0 Macaranga sp. C5 41.8 Voacanga africana C2 102.3 Rauwolfia vomitoria C1 77.6 Antiaris africana C2 56.0 Myrianthus arboreus C3 63.0
Didelotia letouzeyi C3 41.4 Elaeis guineensis C5 92.7 Macaranga sp. C5 75.8 Tabernaemontana sp C5 44.0 Voacanga africana C2 59.0
Albizia sp. C5 40.7 Pycnanthus angolensis C1 83.8 Celtis sp. C2 72.0 Celtis sp. C2 44.0 Oncoba welwitschii C1 40.0
Musa sp.C1 33.3 Terminalia superba C1 79.5 Elaeis guineensis C5 48.1 Alchornea floribunda C2 40.0 Musanga cecropioides C2 40.0 Tabernaemontana sp. C5 27.7 Myrianthus arboreus C3 63.6 Antiaris africana C2 45.9 Funtumia sp. C4 39.0 Margaritaria discoides C2 38.0
Total stems/ha for top 10 species (% of all species)
478.8 (30.4)
1 145.4 (36.3)
1 052.8 (66.2)
1 432.5 (38.9)
1 750.0 (35.4)
Total stems/ha for all species
1572.8 3152.2 1 589.8 3 685.0 4 947.5
Explanations: C5: common (= in top 10 species) for five land uses; C4: common for four land uses; C3: common for three land uses; C2: specific for two land uses; C1: specific for one land use.
110
5.4.1 Land use patterns, their history and effects on tree species domestication The variations in the mean distances from houses to agroforestry fields, particularly between the Yaoundé (fields mostly close to the house) and Ebolowa (fields mostly far to very far away) blocks (Table 5.3.1), suggest a bipolarization of natural resource management options within the vital space of the respondents. This bipolarization of land use patterns in villages of the study area resulted from the settlement process of village territories as recent as a hundred years ago. With the arrival of colonial administration, the villages were relocated along the roads (Mveng 1985; Balandier 1982). Prior to that time the villages were scattered temporary settlements within the forest (Leplaideur 1992; Santoir 1992; Vermeulen and Karsenty 2001). These patterns of bipolarization of natural resource management options are illustrated by the distribution of land uses between abandoned villages (bilik) and the recent resettlement of villages (Oyono et al. 2000; Vermeulen and Karsenty 2001; Mala and Oyono 2004; Mala et al. in prep.). For example, cocoa agroforests are closer to houses in Yaoundé and Mbalmayo, and very far and close to the houses in Ebolowa. Cucumeropsis agroforests are generally very far from the houses in all three blocks. This result illustrated an important dimension of the spatio-temporal deployment of rights over land. During this deployment, Cucumeropsis agroforests play a key role as the entry land use in the materialization of axe rights of the first settlers within the cropping-fallow-forest conversion cycle (Diaw 1997; Vermeulen and Carrière 2001). This right gives the first occupant the rights over land in case of a land dispute. The variations observed with a land use type between the different blocks, such as young preforest fallows and young secondary forests, confirm the bipolarization of social representation of land use that give a picture of land uses and their resources, and the local indicators that are used for the sustainable agro-ecological sustainability (Chapter 4, Tables 4.3.1 and 4.3.3). This high occurrence of young forest and young secondary forests far or very far in the Mbalmayo and Ebolowa blocks is a strategy to maintain the rights over land in the abandoned fields. There is a need to maintain the land rights in activities because the status of rights changes with the successional status of the land use. It moves from the individual-household to the community (Diaw 1997; Carrière 1999; Vermeulen and Carrière 2001). The perception of the distance to the farm does not influence the decision to fell tree species (Table 5.3.2). On average 25% of the trees are kept, irrespective of the distance from the houses during the clearing of forest land. Factors other than the distance from houses to farms affect the decision-making to maintain plant species, such as the knowledge of their uses and the availability of labor (Carrière 1999). This may also be attributed to the process to access land and the tenure system. The practices associated with slash-and-burn agriculture are embedded in the management of rights over lands. These rights change from household to lineage/clan rights with biophysical characteristics of land use within the cropping-fallow-forest conversion cycle (Dounias 1995; Diaw 1997; Delvingt 2001; Vermeulen and Karsenty 2001; Robiglio et al. 2002; Robiglio and Mala 2005). This context leads to a spatial distribution of a pool of farms, fallows and forests. The management of this pool of land uses is based on the use of local
111
bio-indicators of agro-ecological sustainability which help to maintain soil fertility within the spatio-temporal scale (Chapter 4, Section 4.3.3). The knowledge of the history of land use practices contributed to the maintenance of the relationships between human systems and natural systems in their perception of nature, forests and description of land use (Chapter 3, Section 3, Table 3.3.2, 3.3.4 and 3.3.4; Dounias and Hladik 1996). The size of a plant influences the decision to fell or to keep/maintain it in the Cucumeropsis agroforest farms (Table 5.3.3). The percentage of felled trees decreased from the smallest stem category towards the higher categories with a sharp decline towards large trees. The percentage of trees retained follows the inverse trend (Table 5.3.3). This indicates that the larger the plant size category, the higher is its probability to be kept/maintained during the clearing/felling of the forest. It shows the same trend as a previous study in southern Cameroon on the influence of slash and burn agriculture from Ntumu and the agricultural practices associated with forest dynamics (Carrière 1999). Trees are part of the crop cultivation system as shown by the retention of 57 to 76% of all small to large trees available before clearing (Table 5.3.3), within Cucumeropsis agroforests. When a forest patch is cleared, the trees left behind will eventually influence the major direction of forest regeneration and regrowth when the patch is abandoned to become fallow, probably through dissemination of seeds and other external influences. Inversily, a low percentage (18 to 37% of the stems) of seedlings, sprouts, saplings, and small to large poles are maintained. This percentage is desired to maintain a balance between reduced competition with the cultivated food crops and reducing the high cost of labour for farm maintenance with cutting larger trees. The mixed food-crop agroforest is a key land use in the management of forest and agriculture. Such farms preceded most of the current land uses in the humid forest zone in the study area (Table 5.3.4). This pattern also shows the socio-economic role of this land use in terms of providing household consumption and income within the forest margins (Gockowski et al. 2004a, 2005). All 32 cocoa agroforests assessed in the humid forest zone have been preceded by mixed food-crop farms. Mixed food-crop farms were often converted into cocoa agroforest as an ideal conversion cycle i.e. from non-permanent land use (mixed food-crop agroforests) to a permanent human-modified land use option (cocoa agroforest), and with permanent land rights. However, this permanent conversion has been disrupted by macro-economic and policy changes due the cocoa crisis of 1980, followed by the structural adjustment programme (Ndoye 1997). The collapse of the cocoa market resulted in the liberalization of the cocoa market with unprecedented drop of the cocoa price. People abandoned cocoa agroforests and shifted their interests to more competitive land uses such as Cucumeropsis agroforests and recently to oil palm agroforests and horticultural crops (Ndoye 1997; Sunderlin et al. 2000; Sunderlin and Pokam 2002; Gockowski et al. 2004a,b; Sunderland and Ndoye 2004). The phenomenon of abandonment of cocoa farms has been observed particularly in the Ebolowa block where there are several other alternative natural resource management options, such as hunting and fishing (Gockowski et al. 2004a, 2005).
112
The history of the 25 Cucumeropsis-plantain agroforests showed much variation between the blocks. They were all mixed food-crop farms in Mbalmayo or cocoa agroforests in Ebolowa or mostly Cucumeropsis agroforests in Yaoundé. These block-specific variations confirm that the cycle of land use conversion seems to be shorter in Yaoundé and Ebolowa than in Mbalmayo (Gockowski et al. 2004a; 2005). In the case of Ebolowa, the results show that cocoa agroforests are converted to another land use. This conversion hides some key reasons such as the abandonment of cocoa plantations after the cocoa crisis of the 1980 and the poor performance of cocoa farms (Ndoye 1997). Normally most of the human-modified land uses seem to have the structure, composition and stability of cocoa plantations. The 30 preforest young fallows and 30 young secondary forests were mostly derived from mixed food-crop farms in all three blocks, with some from other land uses, specifically in Ebolowa (30% of young preforest fallows from cocoa agroforests and 22% of young secondary forests from Cucumeropsis agroforests). All current young secondary forests in all the blocks were originally secondary/degraded forests. This result indicates that farmers use more fallows/secondary/degraded forests than virgin forests. It contradicts the claims in the literature that the traditional slash-and-burn agriculture is a major source of forest loss and degradation when the reality shows that farmers manage a pool of farms, fallows and forests (ASB 1995, 2000). The low percentage (13%) of Cucumeropsis agroforests derived from virgin forest confirms that the act of clearing virgin forest to establish land ownership is confined to Ebolowa and Mbalmayo where forest land is still abundant. In the Yaoundé area no Cucumeropsis agroforest is derived from virgin forest (Diaw 1997; Carrière 1999; Vermeulen and Karsenty 2001; Gockowski et al. 2004a). Secondary/degraded forest preceded most of the current land uses (Table 5.3.5). In Ebolowa and Mbalmayo most Cucumeropsis agroforests were originally secondary/degraded forest, but in the Yaoundé block none of the current young Cucumeropsis agroforests were originally some kind of natural forest. The cultivation of a Cucumeropsis farm is highly influenced by the length of the fallow period. This indicates that the cropping-fallow-forest conversion cycle does not easily revert back to mature or ‘virgin’ forest and this confirms the previous studies that have shown that farmers are mostly using fallows, and not virgin forest (Dounias 1996a; Carrière 1999; Vermeulen and Carrière 2001). It also shows that there is not a continuous clearing of ‘virgin’ forest; secondary/degraded forest can be used for cultivation of crops, i.e. they show potential for fertility recovery and use as suitability indicators (Mala et al. In prep.). The former vegetation of current cocoa agroforests shows much variation. A high percentage (85%) of cocoa agroforests land in the Mbalmayo block was derived from virgin forest. In the Yaoundé and Ebolowa blocks a relative high frequency of former land uses was secondary/degraded forest and preforest young fallow prior to clearing (Table 5.3.5). These variations between blocks follow the gradient of resource intensification and population density along the study area (ASB 1995, 2000; Gockowski et al. 2004a, 2005).

113
5.4.2 Relationships between species richness, tree stem density by plant size, distance to the farm, land use history, use values and characteristics of the biophysical environment 5.4.2.1 Species richness and total stem density in different land uses The differences in species richness between the blocks primarily relate to the species richness of the adjacent natural forests (Table 5.3.6, 5.3.7, 5.38, 5.3.9, 5.3.11). Species richness is higher in the Atlantic Coast forests in the Ebolowa block, intermediate in the dense humid evergreen Congo-basin forests in the Mbalmayo area, and lower in the semi-deciduous forests in the Yaoundé area (Section 5.3.1; Letouzey 1979, 1985; Vivien and Faure 1985; Carrière 1999; Gockowski et al. 2004a, 2005). This species richness gradient also increases with the decreasing gradients of natural resource use intensification or population density of the benchmark area of the humid forest zone of Southern Cameroon, but this inverse relationship is probably not a causal relationship. Irrespective of these gradients, species richness is overall higher to much higher in the Mbalmayo block, except for the cocoa agroforests, than in the other two blocks. This pattern could relate to the specific biophysical conditions that existed immediately prior to clearing a specific farm for agricultural activities, i.e. the history of land uses. All current land uses in Mbalmayo were preceded by secondary/degraded or virgin forest which may have influenced the species richness in Mbalmayo (Table 5.3.5). The cocoa agroforests, however, is the only land use where the species richness seems to follow the decreasing gradient of natural resource use intensification and population density i.e. the higher species richness on cocoa farms in the Atlantic Coast forests of Ebolowa to the lower species richness in the Yaoundé area. It contradicts the trend observed in cocoa agroforests by Sonwa (2004) with a high total species/ha in Mbalmayo block and much lower numbers in Yaoundé and Ebolowa blocks. Species richness has a significant linear relationship with the total number of stems over all sizes (R2 = 0.76; 15 observations; Species richness = 55.2 + 0.113 [Stem density]). The total stem density varies between specific land uses and the specific blocks, and hence influences species richness. Overall species richness and total stem density of trees is lowest in the cocoa forests (93 species/ha; 417 stems/ha), and then increases from the mixed food-crop agroforests (121 species/ha; 530 stems/ha) to the young secondary forests (252 species/ha; 1658 stems/ha), i.e. showing a successional gradient back to forest from the intensively managed mixed food-crop systems to the low-activity young fallows and young secondary forests. Previous studies have shown that the stem density/ha of mature complex cocoa agroforests often approximates that of adjacent undisturbed forests (Sanchez et al. 2005). Species richness of the Cucumeropsis agroforests shows a different pattern between the blocks than the other land uses. It varies significantly between Mbalmayo and Ebolowa blocks (in the order of 120 species/ha, with a specifically high value for Mbalmayo and the lowest value for Ebolowa), and shows a relatively high value in the Yaoundé block (Table 5.4.1). Two factors may have contributed to this pattern: Cucumeropsis agroforests is the entry point in the selection of species to be maintained within the

114
agroecosystem; then there is also the influence of the biodiversity of the adjacent/surrounding natural forests of the three blocks (Section 5.3.1, Chapter 5). The relationship between total stem density for all species and the total number of species gives a ratio of number of stems per species (Table 5.4.1). Overall there are 5.9 stems per species, but this ratio is much higher in the Ebolowa area (7.0 stems/species, with similar lower values for the other blocks. Cucumeropsis agroforests, young preforest fallows and young secondary forests have the same stems/species ratio of 6.5, with the other two land uses having ratio’s around 5.0 stems/species. The ratio’s for Ebolowa block show the same patterns as for the overall patterns over the land uses, but is much higher (8.0 to 9.5 stems/species) compared to the others two blocks. The only other relatively high ratio is for the mixed food-crop farms in the Yaoundé area (7.7 stems/species). This result suggests that the maintenance and recovery of biodiversity in the study area may be based on a higher diversity of species and stem size category in Mbalmayo block compared to less diversified species richness and relative fewer stem size categories in Yaoundé and Ebolowa blocks (Table 5.3.6, 5.3.7, 5.3.8, 5.3.9, 5.3.11). 5.4.2.2 Top 10 species and their stem density in different land uses The top 10 species in the different sites (land uses x blocks) included 40 species, with 30 species occurring with ≥20 stems over all size categories in at least one of the sites (Table 5.3.6, 5.3.7, 5.3.8, 5.3.9). Four of the top 10 species occur with a high frequency across the different sites for both regeneration and trees, represented in order of importance by Funtumia sp, Elaeis guineensis, Macaranga sp., and Margaritaria discoides. These species occur with significant variations between land uses and blocks. As an illustration, there is a high occurrence of Elaeis guineensis for regeneration plus trees in all the four land uses mainly in two sites (Mbalmayo and Yaoundé) but it is absent for regeneration in Cucumeropsis agroforest, preforest fallow and secondary forest in the Ebolowa block. This result suggests that the higher occurrence of this species within the top 10 species is the result of the high degree of intensification of natural resource use and population density (Gockowski et al. 2004a, 2005). This result also indicates that people living in areas of higher natural resource use intensity and population density tend to maximize their accumulation of species with high use value (Elaeis guineensis) than people living in areas of low natural resource use intensity and population density. Macaranga sp. occurs with both regeneration and trees mainly in preforest fallows and secondary forest in the three sites. This result may suggest that this species is more affected by the successional status of land use and more or less by the intensity of land use activities. However, in cocoa agroforest in the Ebolowa block the higher occurrence of this species in the post-agricultural land use may have been influenced directly by its level of abundance in cocoa agroforest. This high occurrence of Macaranga sp. may be amplified if the cocoa agroforest (in Ebolowa) is not maintained and/or abandoned. The result also shows that Funtumia sp. occurs with both regeneration and trees mainly in preforest fallows and secondary forest in Ebolowa and Mbalmayo. Funtumia spp. and Macaranga spp. seem to be influenced by the same conditions, i.e. both are affected by the successional status of land use. The two species seem to be the bio-indicators of change from agricultural to post-agricultural land use status. There is a high occurrence

115
of Margaritaria discoides as regeneration, mainly in preforest fallows and secondary forest, and occur only as trees in Cucumeropsis and cocoa agroforests in Ebolowa and Mbalmayo. This result suggests that the occurrence of Margaritaria discoides regeneration in the post-agricultural land uses may be attributed to the previous land use activities. In Cucumeropsis and mixed food-crop agroforests, this species was kept with different stand densities. This may have influenced its regeneration and promoted its development in cocoa agroforests and in two post-agricultural land uses when the land use has been abandoned similar as to what is happening in natural forests when a gap is created by the felling of trees. The variation in the presence of the top 10 species between land uses and blocks indicates that repetitive agricultural land use activities such as clearing, felling of trees, maintenance of some tree species and cropping affect and regulate the evolution of the number of the top 10 species and their stem density. Depending on the intensity of these activities, the occurrence of species with a higher use value (Elaies guineensis) or with soft to semi-hard woody quality is maintained in the post-agricultural land uses in order to reduce the labour costs for clearing and to facilitate the land use activities for cropping in the next conversion cycle. These land use activities are often undertaken based on the local knowledge of land use indicators for the selection of a suitable patch of land for cropping activities (Table 4.3.2, 4.3.3, Chapter 4). This result confirms previous studies which have shown that the traditional land use management systems is based on the knowledge of interactions between tree and soil fertility (Hauser et al. 1994; Dounias 1996b ; Carrière 1999; Altieri 2002; Büttner and Hauser 2003; Kanmegne 2004). Other species such as Dacryodes edulis occurs specifically as regeneration in cocoa agroforest only in Mbalmayo block, and as trees in Cucumeropsis and cocoa agroforests in Mbalmayo and Yaoundé blocks. This result suggests that the land use activities (based on the trade-off between the desirability of species and the socio-economic constraints) within Cucumerospis agroforests favor/perpetuate the accumulation of species having important use values both with a high potential for regeneration and the maintenance of current production of these fruit trees. This may also be justified by the good market access in these two blocks that allows the commercialization of this non timber forest product (See Table 2.3.2, 2.3.3, Chapter 2; Gockowski and Dury 1999; Gockowski et al. 2004a; Sonwa 2004). This high occurrence observed in Yaoundé and Mbalmayo confirms the higher degree of maintenance of species with use values by people living in areas of higher natural resource use intensification and population density (Gockowski et al. 2004a, 2005). The explanation for Dacryodes edulis also applies to Persea americana (an introduced fruit species which occurs as regeneration and trees in Cucumeropsis agroforest in Ebolowa and as trees in cocoa agroforests in Mbalmayo) and to Musa spp. (occurs on both agricultural and post-agricultural land uses only in Yaoundé block) (Table 5.3.7, 5.3.8, 5.3.9). The high occurrence of these indigenous and introduced species may be attributed to their importance for household consumption needs and income generation within specific sites (Vivien and Faure 1985; Ndoye 1997; Sunderland and Ndoye 2004).

116
Elaeis guineensis, Macaranga sp. and Myrianthus arboreus, occur with high stem density both as regeneration and as trees, whereas the other species occur with a high stem density either as regeneration (Funtumia sp. and Celtis sp.) or as trees (Musanga cecropioides). This variation observed for regeneration and trees indicates how the intensity of land use activities favour some species (mainly pioneer and early regrowth) after agricultural activities. The abundance of some tree species promotes their availability for use when the land matures towards the species composition and stem density of the climax vegetation (Section 5.3.1, Chapter 5). The high stand density of Musanga cecropioides and Macaranga sp confirms their use as one of the bio-indicators in the management of soil fertility and agro-ecological sustainability as mentioned by previous studies in the study area (Carrière 1999; Mala and Oyono 2004; See Section 4.3, Table 4.3.3, Chapter 4). Several species occurred in one site only, sometimes by only regeneration (and may be considered as accidental or by chance presence) and more often by both regeneration and trees (with trees most likely left when sites were cleared for crops). Spathodea campanulata, Panda oleosa, Enantia chlorantha (all in Cucumeropsis agroforest), Trichoscypha acuminata (cocoa agroforest), and Pycnanthus angolensis (preforest fallow) occurred in only one site and were represented only by regeneration (Table 5.3.6, 5.3.7, 5.3.8, 5.3.9). All other species were represented by both regeneration and/or trees. Ricinodendron heudelotii and Milicia exelsa were represented by both regeneration and trees in only Cucumeropsis agroforest in Mbalmayo. Desbordesia glaucescens occurred only in cocoa agroforest (Ebolowa) as regeneration with ≥1 5 stems/ha. Hylodendron gabonense and Terminalia superba (both in Cucumeropsis agroforest in Mbalmayo) and Habenaria sp (cocoa agroforest in Ebolowa) represented as trees with ≥5 stems/ha (with some regeneration) in only one site. Pentaclethra macrophylla (preforest fallow in Ebolowa) and Rauwolfia spp (secondary forest in Yaounde) occurred as regeneration with ≥15 stems/ha and as trees with ≥5 stems/ha. Several species occurred in two sites, with some as trees with ≥5 stems/ha in the Cucumeropsis or cocoa agroforests and some regeneration, or as both regeneration with ≥15 stems/ha and as trees wth ≥5 stems/ha in preforest fallow and/or secondary forest: Scyphocephamiiun ochocoa, Lovoa trichilioides, Petersianthus macrocarpus, Markhamia lutea, Tristemma maritianu, Albizia ferruginea, Icacina mannii and Albizia sp.. This may suggest that the trees were present on the sites after preparation for crops, and when the site was abandoned, the species regenerated on site as part of succesional development. 5.4.2.3 Absolute and relative stem density of the top 10 species within land uses In Cucumeropsis agroforests, both absoltute and relative (percentage of total stem density of all species) total stem density of the top 10 species increases with the gradient of increasing natural resource use intensification and population density (Table 5.3.6; Gockowski et al. 2004a, 2005). Absolute and relative stem density of the top 10 species is higher with a higher natural resource use management intensity and population density in an area with lower species richness (Yaoundé block) and lower where they are fewer people and with larger farms (Ebolowa block). For example, Musanga cecropioides, Macaranga sp. and Albizia sp. occur more frequently and are favored by more intensive land use activities. They may be considered as bio-indicators of human-modified

117
landscapes. This variation may also relate to the history of land use immediately prior to clearing for agricultural activities which seems to be older in Mbalmayo compared to Ebolowa; 83% and 17% of Cucumeropsis fields are respectively derived from secondary forests and virgin forests in Mbalmayo block, whereas a more diversified 72%, 18% and 11% are respectively derived from secondary forests, preforest fallows and virgin forests in Ebolowa block (Table 5.3.5). The variation of the total stem density within land uses may also be affecting the trade off made by the farmers for keeping certain tree species based on the importance of their use value, their biophysical characteristics and socio-economic constraints such as labor availability and their effects on soil fertility. This is illustrated by the increase of the percentage of felled trees from the small to large size categories (Table 5.3.3). This result shows the same trend as trees kept in the study of the impact of slash-and-burn agriculture on forest regeneration and regrowth (Carrière 1999). In mixed food-crop agroforests, the absolute and relative total stem density of the top 10 species does not follow any of the gradients of natural resource use intensification and population density in the study area (Table 5.3.11; Gockowski et al. 2004a, 2005). Stems of the top 10 species accumulate based on the intensity of land use activities and the trade-off to be made between the desirability of species and their socio-economic constraints specific to each block. This trade-off is made based on the farmers’ knowledge of complementary, competitive and supplementary interactions between crop species and regeneration/tree species. Some species such as Musanga cecropioides, Macaranga sp. and Albizia sp. may not be desired by farmers but they may be kept in an acceptable density so that they would not hamper the proper development of crop species. This result suggests that the implementation of mixed food-crop agroforests plays a filtering role in the management of the agricultural biodiversity stock within the cropping-fallows-forest conversion cycle. It regulates the abundance of useful natural and introduced plant species. The management practices around slash-and-burn agriculture create the conditions of coexistence of crops and other plant species as part of agro-ecological processes and resilience of land use for maintenance of the threshold between agricultural and forest productivity already mentioned in previous studies (Dounias 1995, 1996a,b; Carrière 1999; FAO 1999a; Lefroy et al. 1999; Gari 2001; Chapter 4 , Section 4.4.4). In cocoa agroforests, the absolute and relative total stem density of the top 10 species also do not follow any gradient of natural resource use intensity and population density (Table 5.3.7; Gockowski et al. 2004a, 2005). Stems of the top 10 species accumulate by the inheritance of species found when the cocoa plantations were created. These species were selected (maintained) on the basis of their potential characteristics to persist within the cocoa agroforests and to provide a positive coexistence with the cocoa trees in terms of the development of cocoa, the management of shade and other ecosystem services such as soil fertility (Sonwa 2004; Gockowski et al. 2004b). This variation may also have been influenced by the intensity of land use activities in cocoa agroforests such as clearing, pruning of cocoa trees, felling of timber species, rehabilitation of cocoa trees, and enrichment by useful indigenous and introduced species such as Persea americana, Dacryodes edulis and Mangifera indica already mentioned in previous studies (Dounias 1996b; Carrière 1999; Sonwa 2004).

118
In young preforest fallows, the absolute and relative total stem density of the top 10 species increases with the gradient of increasing natural resource use intensification and population density in the study area (Table 5.3.8; Gockowski et al. 2004a, 2005). Stems of the top 10 species accumulate as the influences of land use activities prior to the current land use are terminated. This termination favors the recruitment of species present as regeneration and trees, with a stronger influence on the nature of the developing forest ecosystem. These developing ecosystems are characterized by the forest stand density increasing from where there is a higher natural resource use management intensity and population density (Yaoundé and Mbalmayo block) to where it is lower (Ebolowa block). For example, Macaranga sp., Myrianthus arboreus and Elaeis guineensis occur more frequently and are favored by more intensive land use activities but their density is based on their recruitment from the former agricultural land use. In young secondary forests, the absolute total stem density of the top 10 species decreases with the gradient of increasing natural resource use intensification and population density in the study area but their relative total stem density does not follow any gradient (Table 5.3.9; Gockowski et al. 2004a, 2005). Stems of the top 10 species accumulate as result of radical change of sucessional status from fallow to secondary forest. The recorded stem numbers give an approximation of total stem density when secondary forest approach the natural conditions of the climax vegetation in the three blocks. Most of the land uses are bearing progressively the biophysical characteristics of the climax vegetation in the three sites: dense, semi-deciduous forest characteristic of the Yaoundé block, which extends southwards into the Mbalmayo block; dense, humid, Congo Basin forest in the southern reaches of the Mbalmayo block, which extends into the Ebolowa block; and small pockets of biologically diverse, moist, evergreen, Atlantic forests along the western border of the Ebolowa and Mbalmayo blocks (Letouzey 1985; Vivien and Faure 1985; Gartlan 1992). This result confirms that the present-day tree composition of a structurally complex and species-rich central African rain forest still echoes historical disturbances, most probably caused by human land uses of the previous centuries (Van Germeden et al. 2003). 5.4.2.4 Diversity of crop species and percentage of total stems for top 10 species in mixed food agroforests The results recorded 26 crop species with a total of 55 cultivars i.e. separate genetic entities (Table 5.3.10). There is a relative high mean number of cultivars per crop species within the study area, with six cultivars for cassava (Manihot esculenta) and five cultivars for plantain (Musa paradisiaca). Twelve per cent of crop species have four or more cultivars, 8% have three, 24% have one and 60% have two cultivars. However, it seems that the three crops (cassava, plantain, groundnuts) represent the most important socio-economic food crops in terms of household consumption needs and income generation (ASB 2000; Gockowski et al. 2004a, 2005). This high number of crop cultivars may be attributed to the particularity of traditional African farming systems that use a high range of crops and multi-cropping techniques (FAO 1999a,b, 2005; Abate et al. 2000; Eyzaguire 2003). This diversity of crop species found in a single farm contributes to minimize the incidence of crop pests and diseases, to guarantee the quality of different crops, to maintain a pool of intra-genetic diversity, and to reduce the risk of yield loss
119
(Westphal et al. 1985; Abate et al. 2000). Importantly, these three top crops affect in different ways household agricultural production strategy. As an example, groundnut (Arachis hypogea) is a key source of cheaper plant-protein, it contributes to the daily food consumption needs, and it is cultivated twice a year. This result confirms the relationships between the cultural and socio-economic factors, and the composition of human-modified landscapes, particularly for agricultural and tree species within agricultural land uses (Reichardt et al. 1994; Dounias 1996a,b; Dounias and Hladik 1996; FAO 1999b, 2005). 5.4.3 Relationships between agricultural biodiversity management and patterns of land uses The results show that the total stand density for the top 10 species varies between the five land uses (Table 5.3.12). These variations are attributed to a combination of several factors: (i) the history of land use for both agricultural and post-agricultural land types (Table 5.3.4 & 5.3.5); (ii) the type of forest ecosystem particularly present in each block as well as the influence of the differences in biodiversity of the adjacent/surrounding natural forests of the three blocks (see Section 5.2.1 Chapter 5; Letouzey 1985; Vivien and Faure 1985; Gockowski et al. 2004a); (iii) the intensity of land use activities such as clearing, pruning of certain species (such as Elaeis guineensis and cocoa trees), felling of trees and cropping, which regulates the abundance of species by stems size category. These land use activities have contributed to the common characteristics of the top four common species for the five land uses, i.e. Albizia sp., Tabernaemontana sp., Elaeis guineensis and Macaranga sp., to be mainly pioneer species and bio-indicators of fallows and secondary forests, i.e. of the human-modified landscape. The ratio of total stem density of the top 10 species to that of all species is a high 66% for the mixed food-crop agroforests (Table 5.3.12) but relatively constant between 30% and 40% for the others land uses. This result confirms the role of mixed food-crop agroforests as a filter in the selection of plant/tree species in subsequent land uses. The assemblage of species on mixed food-crop agroforests seems to be the motor of regeneration and conservation of useful species but also of those which would ease the clearing and felling of trees (reduce labour demand) in the next cultivation cycle. This result also indicates the independence of land uses in the dynamics of the cropping-fallows-forest conversion cycle in order to maintain the essential spatial and temporal functions of the site and biodiversity. The total stand density for all species varies between the five selected land uses, similar to the trend of total stand density of the top 10 species, ranging from a high 4 948 stems/ha in young secondary forests to a much lower 1573 stems/ha in cocoa agroforests (Table 5.3.12). Total stand density of all species is an important factor on which the selection of plant/tree species is based to fell, to keep or to maintain within the cropping-fallow-forest conversion cycle. Cocoa agroforests are often claimed to be a more stable land use system but they contains the lowest total stem density of the five land uses. Mixed food-crop agroforests serves as the filter and regulator in the quality and abundance of natural and introduced species. This result suggests that sustainable management of agroecosystems through the conversion processes depends on the specific

120
biophysical and socio-economic conditions within spatial and temporal scales (Table 5.3.2, 5.3.3, 5.3.4, 5.3.5). Mixed food-crop agroforests and young preforest fallows share the highest number (eight species) of the top 10 plant species (Table 5.3.13). Cucumeropsis agroforests and young preforest fallow shared seven species. Musa sp., Dacryodes edulis and Persea americana are specific species for cocoa agroforests while timber species such as Pycnanthus angolensis and Terminalia superba establish in Cucumeropsis agroforests. Rauwolfia vomitoria (a medicinal plant for the treatment of malaria) is specifically abundant in mixed food-crop agroforests (Table 5.3.11 and 5.3.12). These results indicate the management of agricultural biodiversity is based in a pool of forest species; the establishment of species such as Terminalia superb and Pycnanthus angolensis are facilitated by specific land uses such as cocoa and Cucumeropsis agroforests. Their selection is refined in mixed food-crop agroforests through the domestication of very useful introduced and natural species such as for timber, food, medicine and cultural uses (Table 5.3.12). Stem density of the individual top 10 species varied much between the land uses (Table 5.3.12). This may relate to the characteristics of the species and the differences in successional status that each land use represents in the development stages within the conversion cycle. The results indicate that the assemblage of species is maintained within a dynamic conversion cycle. The top 10 species occurring with ≥60 stems/ha for all sizes are represented by respectively 10, 8, 6, 5 and 1 species in Cucumeropsis agroforests, mixed food-crop agroforests, young secondary forests, young preforest fallows and cocoa agroforests. Furthermore, the top 10 species occurring with ≥60 stems/ha in the different land uses represent 16 of the almost 300 plant species recorded (Persea americana, Musanga cecropioides, Macaranga sp., Albizia sp., Funtumia sp., Tabernaemontana sp., Voacanga africana, Elaeis guineensis, Pycnanthus angolensis, Terminalia superba, Myrianthus arboreus, Didelotia letouzeyi, Pseudospondias longifolia, Alchornea floribunda, Rauwolfia vomitoria and Celtis sp.). These species represent a mixture of species with different wood qualities (soft, semi-woody and hard-woody) and successional status (pioneer, early regrowth, advanced regrowth and mature forest). These results suggest that Cucumeropsis agroforest is the departure point for natural domestication of plant species which is refined in the implementation of cocoa agroforests or in mixed food-crop agroforests. It seems also that cocoa agroforests favor the domestication of two useful species, Persea americana and Elaeis guineensis, within the study area. The other land use activities favor the promotion of pioneer and early regrowth species characterized by soft to semi-hard wood qualities such as Musanga cecropioides, Myrianthus arboreus, Tabernaemontana sp., Celtis sp., Macaranga sp., Didelotia letouzeyi, Funtumia sp, Tabernaemontana sp and Myrianthus arboreus (Table 5.3.12). Four of the top 10 plant species found in Cucumeropsis agroforest are found in mixed food-crop agroforests indicating that this agricultural land use filters and refines the selection of plant species to be kept (Table 5.3.13). The top species amongst the top 10 species found in mixed food-crop agroforests are also found in young preforest fallows

121
indicating that they are very similar in composition of species. Five of the top 10 species in young preforest fallows are found in young secondary forests. Six of the top 10 species of young secondary forests are found in cocoa agroforests. Six of the top 10 species of cocoa agroforests are found in Cucumeropsis agroforests. This indicates that these land uses have more similarities than differences and that this shared pool of species resulted from the repetitive conversion cycles within the spatio-temporal scales of natural resource management. This pool of plant species seems to be the base of biodiversity maintenance and conservation, and regeneration and recovery of forests within the cropping-fallow-forest conversion cycle. 5.4.4 General discussion The conventional thinking of biodiversity and its segregation practices that have dominated the approaches of NRM during the last two decades, are still considering biodiversity components as fixed entities to be managed out of human encroachment (Instone 2003b). This thinking has largely influenced the portrayal of the relationships between slash-and-burn agriculture, deforestation and biodiversity loss in the humid tropics as well as the approaches and interventions to address the issues (Van Noordwijk et al. 2001; Instone 2003a; Ickowitz 2006). Most of the practices of biodiversity conservation put forward the issue of control of space and territory as illustrated by the implementation of protected areas and the development of agricultural innovations for which the first objective seems to be to avoid more deforestation (Instone 2003b). However, the results of this study show that traditional agriculture is fundamentally based on the co-existence of crops and other plant species. The plant associations are established based on local knowledge of complementary, supplementary and competitive interactions between crops and other plant species within the available space and time. Several biophysical determinants of local management of agricultural biodiversity can be seen at the forest-agriculture interface including: the distance to the farms (Table 5.31, 5.3.2), the land use history of agricultural and post-agricultural land uses (Table 5.3.4, 5.3.4), and plant-size characteristics (Table 5.3.3). The knowledge of these determinants influences directly and indirectly farmers’ decisions to favour the natural domestication of species or the introduction of useful species (See Table 5.3.6, 5.3.7). The results show that a very small percentage of new forest areas are cleared by farmers and that from 56 to 76% of tree species are maintained (See Table 5.3.3; 5.3.4), contrary to the discourse that is often presented in the global portray of slash-and-burn agriculture. Importantly, when a forest patch is converted into an agricultural land use, this land use enters into a cycle of conversion aimed at maintaining the productivity of the land and the sustainability of natural resources within differentspatio-temporal scales (Dounias 1996a; Carrière 1999). This maintenance is based on the traditional knowledge of bio-indicators for agricultural and forest sustainability (See Table 4.3.3, Chapter 4). Futhermore, it seems that within the conversion cycle, some land uses such as Cucumeropsis agroforests facilitate the establishment of the ‘forest’ species such as Pycnanthus angolensis, Terminalia superba, Petersianthus macrocarpus, Milicia exelsa, Distemonathus benthamianus, Scyphocephamiiun ochocoa, Desbordesia glaucescens and Hylodendron gabonense (Table 5.3.6, 5.3.7, 5.3.12). Other land uses, because of their longer
122
production period, have a much larger range in sizes of trees, and show changes in the top 10 species. This result indicates that the length of a fallow is not linear but depends of many factors, such as the local perception of forests and their socio-economic values (See Table 3.3.3, Chapter 3), the availability of a pool of post-agricultural land uses of different successional status and the use of bio-indicators for the selection of a suitable land use for cultivation and the necessity to save labour (See Table 4.3.4, Chapter 4; Carrière 1999). The variations of local agricultural biodiversity knowledge management at different socio-ecological scales and processes are affected by the differences in the nature and intensity of land use activities, and the biodiversity of the adjacent/surrounding natural forests of the three blocks. The results of this chapter suggest the necessity to get a definition of agricultural biodiversity that is more contextual than generic (Charyulu 1999; Brookfield 2002; Woodley 2004). This definition should link agricultural biodiversity components to landscape history, and the environmental, cultural, societal and socio-economic dimensions of local management practices (Armitage 2003; Eyzaguire 2003; Toledo et al. 2003; Woodley 2004). The results show that the concept of agricultural biodiversity must cover species from a range of more than 280 plant species and more than 26 crop species but also complex associations on which their management are based. This association forms at any point in time a complex and multi-stratified human-modified landscape, enough to maintain its heterogeneity within the cropping-fallow-forest cycle as a source of socio-ecological resilience. This resilience of traditional land use management strategies, based on the use of a pool of farms, fallows and forest stands has been mentioned in previous studies (Dounias 1996a,b; Diaw 1997; Carrière 1999). Another key issue is the fact that the stem density of the top 10 species are maintained based on the balanced availability of regeneration and trees of species within agricultural land uses. This confirms the relative adaptive capacity of the system to recover after the ‘disturbance’ (in the sense of a gap in the natural forests) created by Cucumeropis and mixed food-crops agroforests in the viability of the agroecosystem (Carrière 1999; Ngobo 2002). The role of tree species is very important in the cropping-fallow-forest conversion cycles, as illustrated by the higher percentage of tree sizes of species kept compared to the smaller plant size categories (See Table 5.3.3). This result confirms the important role of trees in the crop cultivation system but could be subject to change depending on the changes of use values and cultural needs, and increase in human population density (Dounias 1996a,b; Carrière 1999; Van Germeden et al. 2003). This co-existence between crops and other plant species affects the variety of plant species characteristics and the management of natural resources and biodiversity via the conversion cycle of land uses from mixed food-crop agroforests to post-agricultural land uses such as young secondary forests or to mature cocoa agroforests. This conversion cycle contributes to the maintenance of the balance between composition of species by different sizes in the human-modified landscape as a result of complex interactions between society i.e. land tenure system, local knowledge of bio-ecological processes and bio-economy for sustaining livelihoods (Dounias 1996a,b; Dounias and Hladik 1996; Brown and Shreckenberg 1998; Armitage 2003; Brookfield 2004; Ngobo et al. 2004).
123
The human-nature relationships have generated over centuries some practices and knowledge systems of plant species that continue to influence and play a key role in the patterns of agricultural biodiversity. This happens by redefining at any time the conditions of the natural milieu in which natural resource management practices take place. This dual representation illustrates the influence of the organization of land use management and species composition by shaping ecological identities while re-specifying their historical ecological roots. Each segment of the forest and/or land use has an identity in relation to its agricultural uses and former non-agricultural land use that facilitate the establishment of forest species within the spatio-temporal scales for the co-existence between forest and agriculture. Slash-and-burn agriculture as an indigenous agricultural system is currently a subject of intensive debate as its contribution to agricultural production is still claimed to lead to biodiversity loss. Strong evidence emerges from this chapter in terms of determinants of sustainable traditional land use management to suggest that both the practices and land use systems have something to offer to the current thinking and agroforestry innovation processes in terms of high returns to labour, species enrichment, inter-dependence of agroforestry options and the issue of regulating community property rights, land use sustainability and biodiversity conservation. 5.5 CONCLUSIONS In this chapter, the biophysical determinants of local agricultural biodiversity management at the forest-agriculture interface were characterized based on the perception of distance from villages to farms, the history of land uses and on the biophysical characteristics of plants. The results show that the farmers’ perception of distance does not have any influence on the decision to keep tree species at the clearing phase of a patch while knowledge of the history of a land use, being agricultural or non-agricultural and the use value of species affect this decision. The overall results show that the species and stem density of trees retained on the land increase significantly from small to large trees in balance with the potential for regeneration (seedlings, sprouts, saplings and poles) and the density of tree species. This stratification creates the conditions for plant species to regenerate and regrow the forest/vegetation. The maintenance of a pool of plant species is based on local knowledge of complementary, competitive and supplementary interactions between tree and crop species. The farmers’ practices and their bio-ecological knowledge are the drivers of agricultural and forest productivity, ecological processes and species richness patterns by combining both crop and non-agricultural plant species within the cropping-fallow-forest conversion cycle. 5.6 REFERENCES Altieri AM. 2002. Agroecology: The Science of Natural Resource Management for Poor Farmers in Marginal Environments. Agriculture, Ecosystems and Environments 93 (2002): 1-24.
124
Abate T, Van Huis A, Ampofo JKO. 2000. Pest Management Strategies in Traditional Agriculture: An African Perspective. Annual Review of Entomology Vol. 45: 631-659. Armitage DR. 2003. Traditional Agroecological Knowledge, adaptive management and the socio-politics of conservation in Central Sulawesi, Indonesia. Environmental Conservation 30(1): 70-90. ASB. 1995. Alternatives to Slash and Burn Phase I Report: Forest Margins Benchmark of Cameroon, Alternatives to Slash and Burn Programme. Yaoundé: IITA Humid Forest Ecoregional Centre. ASB. 2000. Alternatives to Slash and Burn Phase II Report: Forest Margins Benchmark of Cameroon, Alternatives to Slash and Burn Programme. Yaoundé: IIITA Humid Forest Ecoregional Centre. Balandier G. 1982. Sociologie Actuelle de l’Afrique Noire. Dynamique Sociale en Afrique Centrale. Paris: Presses Universitaires de France. 2è Edition. Bidzanga N. 2005. Farmers’ ecological and agronomic knowledge about the management of multistrata cocoa systems in Southern Cameroon. PhD Dissertation. Bangor: School of Agricultural and Forest Sciences/University of Wales. 258 p. Brodt SB. 2001. A systems Perspective on the Conservation and Erosion of Indigenous Agriculture Knowledge in central India. Human Ecology 29(1): 99-120. Brookfield H. 2002. Exploring Agrobiodiversity. Washington DC: Columbia University Press. Brookfield H, Padoch C. 1994. Appreciating Agrobiodiversity: A look at the dynamism and diversity of indigenous farming practices. Environment 36(5): 6. Brown D, Schreckenberg K. 1998 Shifting cultivators as agents of deforestation: assessing the evidence. ODI Natural Resource Perspectives No.29. Büttner U, Hauser S. 2003. Farmer’s nutrient management practices in indigenous cropping systems in Southern Cameroon. Agriculture, ecosystems and Environment 100 (2,3): 103-110. Carrière S. 1999. Les orphelins de la forêt : Influence de l’agriculture itinérante sur brûlis de Ntumu et des pratiques agricoles associées sur les dynamiques forestière du sud Cameroun. Thèse de doctorat. Montpellier :Université de Montpellier.448 p. Charyulu AS. 1999. Dissemination of Indigenous Knowledge: A way to Sustainable Agriculture. Faculty Paper. Rajendranagar: National Institute of Agricultural Extension Management.

125
Colfer CJP. 2005. The Complex Forest: Communities, Uncertainties, and Adaptive Collaborative Management. Washington DC : Resources For the Future. 370 p. Delvingt W. 2001. Appropriation de l'espace et gestion des ressources naturelles en forêt dense humide africaine: une synthèse provisoire. In: Delvingt W (ed.), La forêt des hommes: Terroirs villageois en forêt tropicale africaine. Gembloux: Presses Agronomiques de Gembloux. pp 255-270. Diaw MC. 1997. Si, Nda bot and Ayong: Shifting Cultivation, Land Use and Property Rights in Southern Cameroon. London : ODI. Dijk JFW Van. 1995. Assessment of NTFP resources in view of the development of sustainable commercial extraction. Wageningen ; Wageningen Agricultural University. Dijk JFW Van. 1999. An assessment of Non-Wood Forest Products Resources for the Development of Sustainable Commercial Extraction. In: Sunderland TCH, Clark LE, Vantomme P (eds.), The NWFP of Central Africa: Current research issues and prospects for conservation and development. Rome : FAO. Dounias E. 1995. Du jardin au recrû forestier: agroforêts, cueillette et chasse chez les Mvae du Sud-Cameroun (Littoral forestier). In : Proceedings of the Symposium on 'Recherche et Développement dans les Zones Tropicales Humides d'Afrique Centrale et de l'Ouest', Yaoundé, Cameroun. Dounias E. 1996a. Dynamique et gestion différentielle d'un système de production à dominance agricole des Mvae du Sud-Cameroun. Thèse de Doctorat. Montpellier : Université des Sciences et Technique du Languedouc. 644 p. Dounias E. 1996b. Recrus forestiers post-agricoles: perceptions et usages chez les Mvae du Sud-Cameroun. Journal d'Agriculture Tropicale et de Botanique Appliquée (38): 153-178. Dounias E, Hladik M. 1996. Les agroforêts Mvae et Yassa au Cameroun Littoral: functions socio-culturelle, structure and composition floristique. In: Hladik AHCM, Pagezy H, Linares OF, Koppert GJA, Froment A (eds.), L'alimentation en forêt tropicale; interactions socioculturelles et perspectives de développement. Paris: Editions UNESCO. pp 1103-1126. Eyzaguire PB. 2003. Cultural Factors and Crops Genetic Diversity, Conservation and Sustainable Use of Agricultural Biodiversity. CIP-UPWARD in collaboration with GTZ, IDRC, IPGRI and SEARICE. FAO. 1999a. Sustaining agricultural biodiversity and agro-ecosystem functions: Farming Systems Approaches for the Sustainable Use and Conservation of Agricultural Biodiversity and Agroecosystems. Rome: Food and Agriculture Organization of the United Nations (FAO).

126
FAO. 1999b. Background Papers: Agricultural biodiversity, Food and Agriculture Organization of the United Nations (FAO)/Netherlands Conference on the Multifunctional Character of Agriculture and Land. Rome: FAO. FAO. 2005. Building on Gender, Agrobiodiversity and Local Knowledge. Rome: Food and Agriculture Organisation of the United Nations (FAO). Gari AJ. 2001. Biodiversity and Indigenous Agroecology in Amazonia: The Indigenous Peoples of Pastaza. Etnoecologica Vol.5 (No.7): 21-37. Gartlan S. 1992. Cameroon. In: Sayer JA, Harcourt CS, Collins MN (eds.), The Conservation of Tropical Forests. Africa. London : Macmillan Publishers. Gockowski J, Dury S. 1999. The economics of cocoa-fruit agroforests in southern Cameroon. Paper presented on IUFRO/ICRAF/CATIE International Conference on Multi-strata Agroforests, Turrialba Costa Rica. Gockowski J, Tonye J, Baker D, Legg C, Weise S, Ndoumbé M, Tiki-Manga T, Fouaguégué A. 2004a. Characterization and diagnosis of farming systems in the ASB Forest Margins Benchmark of southern Cameroon. Study Report. Ibadan: IITA. Gockowski J, Weise SF, Sonwa DJ, Tchatat M, Ngobo MP. 2004b. Conservation because it pays: shaded cocoa agroforests in West Africa. Yaoundé: IITA-HFC. 29 p. Gockowski J Tonye J, Diaw MC, Hauser S, Kotto-Same J, Njomgang R, Moukam A, Nwaga A, Tiki-Manga T, Tondoh J, Tchoundjeu Z, Weise SW, Zapfack L. 2005. The Forest Margins of Cameroon. In: Palm CA, Vosti AS, Sanchez AP, Polly JE (eds.), Slash-and-burn Agriculture: The Search For Alternatives. New York : Columbia University Press. pp 305-331. Hauser S, Vanlauwe B, Asawalan DO, Norgrove L. 1994. Role of earthworms in traditional and improved low-input agricultural systems in West Africa. In Brussard L, Ferrera-Cerrato R (eds.), Soil Ecology in Sustainable Agricultural Systems. Lewis Publishers. pp 113-132. Ickowitz A. 2006. Shifting Cultivation and Deforestation in Tropical Africa: Critical Reflections. Development and Change 37 (3): 599-626. Instone L. 2003a. Shaking the Ground of Shifting Cultivation: Or Why (Do) We Need Alternatives to Slash-and-Burn? Resource management in Asia-Pacific Program Working Paper No.43. Camberra: Research School of Pacific and Asian Studies/The Australian National University. Instone L. 2003b. T(r)opical Translations : Reterritorialising the space of Biodiversity Conservation. Resource management in Asia-Pacific Program Working Paper No.46.

127
Camberra : Research School of Pacific and Asian Studies/The Australian National University,. Kanmegne J. 2004. Slash and Burn Agriculture in the Humid Forest Zone of Southern Cameroon: Soil Quality Dynamics, Improved Fallow Management and Farmers' Perception. PhD Dissertation. Wageningen: Wageningen University. 184 p. Lefroy EC, Hobbs RJ, O'Connor MH, Pate JS. 1999. Agriculture as a mimic of natural ecosystems. Agroforest. Sys. (45): 275-289. Leplaideur A. 1992. Les paysans du Centre Sud Cameroun. Rapports d’Etude. Montpellier : CIRAD/IRAT. Letouzey R. 1979. Vegetation. In: Atlas of the United Republic of Cameroon. Paris: Editions Jeune Afrique. pp 20–22. Letouzey R. 1985. Notice sur la géographie du Cameroun au 1/500 000. Toulouse : Institut de la Carte Internationale de la Végétation. Mala WA, Oyono PR. 2004. Some Dimensions of Local Practices of Natural Resources Management in the Central Africa Region. Research Review NS 20.2 (2004): 23-31. Mala WA, Geldenhuys CJ, Prabhu R. In Preparation. Forest agriculture: Sustainable Livelihoods Strategies and Biodiversity Conservation in Southern Cameroon. Mveng E. 1985. Histoire du Cameroun. Yaoundé: CEPER. Ndoye O. 1997. The impacts of macroeconomic and agricultural policies on forest conditions in Cameroon. Yaoundé: CIFOR. Ngobo MP. 2002. Ecology and socio-economic importance of short fallows in humid forest zone of Southern Cameroon. PhD Dissertation. Bangor : School of Agriculture/Univeristy of Wales. Ngobo MP, Weise SF, McDonald MA. 2004. Revisiting the performance of natural fallows in central Africa. Scand. J. For. Res. 19 (Suppl. 4): 14-24 Oyono PR, Diaw MC, Efoua S. 2000. Structures et contenu anthropologique du bilik: Au Cameroun. Environnement Africain XI (41-42): 10-20. Oyono PR, Mala WA. Tonyé J. 2003. Rigidity versus adaptation: Contribution to the debate on agricultural viability and forest sustainability in Southern Cameroon. Culture and Agriculture Vol. 25 (No.2 Fall 2003).

128
Parrotta AJ, Jinlong L, Heok-Choh S (eds.). 2008. Sustainable Forest Management and Poverty Alleviation: Roles of Traditional Forest-related Knowledge. IUFRO World Series Vol. 21. Vienna: IUFRO. 223p. Prabhu R. 2003. Developing collaborative monitoring for adaptive collaborative management of African Forests. Final Report of the January 1, 2000-December 31, 2002. Harare: CIFOR. Reichardt LK, Mellink E, Nabhan PG, Rea A. 1994. Habitat Heterogeinity and biodiversity associated with the indigenous agriculture in the Sonoran desert. Etnoecologica Vol.2 (No.3). Robiglio V, Mala WA. 2005. Between local and expert knowledge: integrating participatory mapping and GIS for the implementation of integrated forest management options. Case study of Akok – Cameroon. The Forestry Chronicle, Volume 81, Number 3, May/June 2005: 392-397. Robiglio V, Mala WA, Diaw MC. 2002. Mapping Landscapes: Integrating GIS and Social Science Methods to Model Human–Nature Relationships in southern Cameroon. Small-scale Forest Economics, Management and Policy Journal 2 (2): 171-184. Sanchez AP, Palm AC, Vosti AS, Tomich PT, Kayoski J. 2005. Alternatives to Slash and Burn: Challenge and Approaches of an International Consortium. In: Palm AC, Vosti AS, Sanchez AP, Ericksen JP (eds.), Slash and Burn Agriculture: Search for Alternatives. New York: Columbia University Press. pp 3- 37. Sandy EW, Gillison A, Van Noordwijk M. 2001. Biodiversity: issues relevant for the integrated natural resource management in the humid tropics. ASB Lecture Note 5. Nairobi: International Center for Research in Agroforestry (ICRAF). Santoir C. 1992. Sous l'empire du cacao. Etude diachronique de deux terroirs Camerounais.Paris : ORSTOM Editions. Sonwa JD. 2004. Biomass management and diversification within cocoa agroforests in the humid forest zone of southern Cameroon. Bonn: Universitat Bonn. 112 p. Sunderland T, Ndoye O (eds.). 2004. Forest Products, Livelihood and Conservation. Cases studies of Non-Timber Forests Products Systems. Volume 2 – Africa. 128 p. Bogor: CIFOR. Sunderlin WD, Pokam J. 2002. Economic Crisis and Forest Cover Change in Cameroon: The Roles of Migration, Crop Diversification, and Gender Division of Labor. Economic Development and Cultural Change April 2002 Vol. 50 No. 3: 581-606.
129
Sunderlin W, Ndoye O, Bikié H, Laporte N, Mertens B,Pokam J. 2000. Economic crisis, small-scale agriculture, and forest cover change in southern Cameroon. Environmental Conservation 27 (3): 284-290. Toledo VM, Ortiz-Espejel B, Cortès L, Moguel P, Ordonez M. 2003. The multiple uses of tropical forests by indigenous peoples in Mexico: a case of adaptive management. Conservation Ecology, Vol. 7 (Issue 3). Van Germeden BS, Olff H, Parren PEE,Brongers F. 2003. The pristine rainforest? Remnants of historical impacts of current tree species composition and diversity. Journal of Biogeography 30: 1381-1390. Van Noordwijk M, Hairiah K,Weise S. 2001. Sustainability of tropical land use systems following forest conversion. Bogor : ICRAF-SEA. Vermeulen C, Carrière S. 2001. Stratégies de gestion des ressources naturelles fondées sur les maîtrises foncières coutumières. In: Delvingt W (ed.), La forêt des hommes: Terroirs villageois en forêt tropicale africaine. Gembloux : Les presses agronomiques de Gembloux. pp109-141. Vermeulen C, Karsenty A. 2001. Place et légitimité des terroirs villageois dans la conservation. In : Delvingt W (ed.), La forêt des hommes : terroirs villageois en forêt tropicale africaine. Gembloux :Les presses Universitaires de Gembloux. pp 216-134. Vernooy R, Song Y. 2004. New Approaches To supporting The Agricultural Biodiversity Important for Sustainable Rural Livelihoods. International Journal of Agricultural Sustainability Vol.2. No.1: 55-66. Vivien J, Faure JJ. 1985. Arbres des forêts denses d’Afrique centrale. Paris : Ministère des Relations Extérieures, Coopération et Développement et Agence de Coopération Culturelle et Technique. 565 p. Wallington TJ, Hobbs RJ, Moore SA. 2005. Implication of Current Ecological Thinking for Biodiversity Conservation: A Review of the Salient Issues. Ecology and Society 10 (1):15. Westphal E, Embrechts J, Ferwerda JD, Van Gils-Meeus EAH, Mutsaers WJH, Westphal-Stevels CMJ. 1985. Cultures vivrières tropicales avec référence spéciale au Cameroun. Wageningen: Pudoc Wageningen/Centre for Agricultural Publishing Documentation. 514 p. Woodley E. 2004. Local and Indigenous Ecological Knowledge as An Emergent Property of A complex System: A case Study in The Solomon Islands. Bridging Scales and Epistemologies: Linking Local and Global Science in Multi-Scale Assessment, March, 17-20, 2004, Alexandria.
130
CHAPTER SIX
AGRICULTURAL BIODIVERSITY KNOWLEDGE AND ADAPTIVE CAPACITY TO SATISFY HOUSEHOLD
CONSUMPTION AND INCOME GENERATION
6.1 INTRODUCTION Adaptive co-management is emerging as a new challenge to deal with the management of complex systems applied to natural resources (Peterson et al. 1998; Holling 2001; Ruitenbeck and Cartier 2001; Prabhu 2003; Olsson et al. 2004a; Woodley 2004). Adaptive capacity is defined as the general ability of institutions, systems and individuals to adjust to potential damage, to take advantage of opportunities, or to cope with the consequences (Prabhu 2003; Olsson et al. 2004a; MEA 2005). In the humid tropics, the agro-ecosystems resulting from the interactions between society, agriculture and natural systems, are complex and diversified to respond to human resource uses (Altieri 2002; Plummer and Armitage 2006). These ecosystems include, by definition, people and their institutions, as well as the agricultural biodiversity that they use and influence through their diverse range of social goals and definitions of well-being (Dietz et al. 2003; Prabhu 2003; Plummer and Armitage 2006). It has been shown that dynamic and complex livelihood systems usually rely on plant and animal diversity, both wild and in different stages of domestication, in their agro-ecosystem management (Carrière 1999). Different types of agricultural biodiversity are used by different people at different times and in different places, and so contribute to livelihood strategies in a complex fashion (Dounias 1996; FAO 1999a,b; Brookfield 2002). It is essential to understand how cultivation, natural domestication, collection, use and marketing of different types of agricultural resources (diversity) are differentiated by wealth, gender, age and ecological situation in order to evaluate their overall economic value and the resilience of the socio-ecological systems. In southern Cameroon, the socio-economic studies of land uses within the cropping-fallow-forest conversion cycle have been conducted mainly to propose alternative land uses options (ASB 1995, 2000; Gockowski et al. 2004a, 2005, Ickowitz 2006). Few studies have analyzed the resilient capacity of anthropogenic actions affecting forest landscape mosaics, and leading to sustainable land use management outcomes (Dounias 1996; Carrière 1999; Ngobo 2002; Sonwa 2004; FAO 2005). However, it has been shown that tree species found within forest-landscape mosaics are the result of a long process of domestication based on farmers’ knowledge of their socio-economic uses such as food, medicine, construction material and timber (Ndoye 1995, 1997; Dounias 1996; Ndoye et al. 1997, 1999; Carrière 1999; Ngobo 2002; Sonwa 2004; Gockowski et al. 2004b). Multipurpose trees seem to occur with a higher density than trees with a single use (Dounias 1996; Dounias and Hladik 1996; Carrière 1999; Ngobo 2002; Mala et al. 2008).
131
Some studies present the remnant trees found in the active farms as the drivers of forest regeneration and recovery. This suggests that the structure and composition of the forest-landscape mosaics resulted from historical interactions between human and nature in southern Cameroon (Dounias 1996; Carrière 1999; Van Germeden et al. 2003). However, very little is known about how the interactions between the environment, the qualities of crop varieties and the uses of tree species maintained during the clearing of the forest, determine the specific current composition of forest-landscape mosaics. It is recognized that agro-ecosystems are complex adaptive systems that require flexible management. However, the research and intervention processes are still implemented from the cognitive processes behind the domestication of nature and biodiversity patterns (Bawden 1991; Berkes et al. 2000; Ruitenbeck and Cartier 2001; Prabhu 2003). The ratio of crop to non-crop species in agricultural biodiversity patterns within the forest-landscape mosaics indicates the links between food crops, perennial crops, and other tree species. The decision-making processes behind tree domestication have not yet been understood to guide resource management options and innovation processes (Brookfield and Padoch 1994; Brookfield 2002). This understanding is a crucial step in order to design research and intervention processes, and the appropriate conditions for the implementation of options for adaptive co-management of natural resources in the context of high biodiversity and the uncertainty of climate variability (Ellis 1995; Scoones 1995; Prabhu 2003; Woodley 2004; Colfer 2005). The contribution of non-timber forest products (NTFPs) and other non-wood forest products to rural household income generation and food security is also well documented in Central Africa (Ndoye 1995; Dijk 1995, 1999; Ndoye et al. 1997, 2006; Ruiz-Perez et al. 1999, 2000; Ndoye and Tieguhong 2004; Sunderland and Ndoye 2004). However, the links between the socio-economic status of resource users and market opportunities have been made only to understand the structure of their income. Very little is known about the decision-making of the farmers managing their natural resources to maintain a threshold of income. Furthermore, the ability of farmers to use their ecological knowledge to adapt to uncertainty and unpredictable changes has not yet been analyzed to understand the links between ecology, society and economy within the forest-landscape mosaics. Conventional studies are essentially market-oriented and target a very few crop species such as maize, improved oil palm and cocoa varieties. Less interest is shown in terms of other traditional food crops that contribute to a certain extent to provide food and income when the yield from major food crops is lost (Gockowski and Baker 1996; ASB 2000; Gockowski et al. 2004a, 2005). Advances made in agroforestry research and NTFPs show that only few products are promoted for technical domestication, such as Daryodes edulis, Gnetum africana, Irvingia gabonensis, Cola sp., Ricinodendron heudoleutii. The list is short when compared with the range of forest products that are used by farmers for their livelihood strategy and income generation. The links between timber and NTFP species were often poorly analyzed to understand the cognitive processes that take place for the domestication of tree species. However, there is a high degree of uncertainty about the behavior of African ecosystems. This makes it difficult or impossible to predict the levels of production that systems might yield from year to year, or how ecosystem structures

132
may change (Ellis 1995; Scoones 1995; Scheffer et al. 2002; Prabhu 2003; Berkes 2005). The ability of farmers to adjust to potential losses due to the uncertainty, to take advantage of the high biodiversity context and market opportunities, or to cope with the consequences of uncertainty is poorly understood. Such understanding is necessary to build the ability to adapt (resilience) the traditional natural resource management practices towards sustainable forest-agriculture outcomes. One way to address these issues is to understand the links between agricultural biodiversity knowledge, ecology, economy and social institutions that guide farmers’ decisions to maintain their food culture, income outcomes and sustainable livelihoods. The dynamics of local agricultural biodiversity knowledge systems is an important issue to understand, particularly at the cognitive level with reasoning and decision associated with agro-ecosystem management (Charyulu 1999). The objective of this study was to analyze how local agricultural biodiversity knowledge is used and adapted to satisfy the household consumption needs, to respond to market preferences, and to sustain livelihoods of farmers in southern Cameroon. The following questions were addressed: What are the socio-economic determinants of agricultural biodiversity at the forest-agriculture interface? How do people use local agricultural biodiversity knowledge in natural resource management practices at the forest-agriculture interface? What socio-economic characteristics of agricultural plant diversity affect the decision behind the domestication or farming practices? It is hypothesized that local agricultural biodiversity knowledge is a tool used to satisfy/respond and adapt to market preferences and needs for household consumption and sustainable livelihood. Conceptual framework: adaptive capacity theory and socio-ecological resilience Conceptually this paper deals with the theories of resilience and adaptive capacity as applied to natural resources management. The adaptive co-management school is based on the theory of resilience of socio-ecological systems. Learning-by-doing, integration of different knowledge systems, collaboration and power-sharing, and management flexibility characterize adaptive co-management. This approach represents a potentially important development in the design of governance systems to respond to reactions and to orientate complex socio-ecological systems towards sustainable practices (Prabhu et al. 2001; Ruitenbeck and Cartier 2001; Olsson et al. 2004b; Berkes 2005). In ecological systems, adaptive capacity is related to genetic diversity, biological diversity and the heterogeneity of forest-landscape mosaics in terms of goods and environmental services (Peterson et al. 1998; Pretty and Smith 2004; Campbell et al. 2006). In social systems, the existence of institutions and networks that learn and store knowledge and experience, create flexibility in problem solving, and balance power among interest groups, play an important role in adaptive capacity (Scheffer et al. 2002; Berkes 2005). Systems with high adaptive capacity are able to re-organize themselves without significant declines in crucial functions in relation to primary productivity, hydrological cycles, social relations and economic prosperity.
133
Resilience is a key to enhancing adaptive capacity of the elements that sustain the social-ecological systems in a world that is constantly changing in terms of socio-economic and political transforms. The most neglected and the least understood aspects in conventional resource management and science are to understand how to address the response of people to periods of change, and how society reorganizes itself following such change(s) (Diaw et al. 1999; Prabhu et al. 2001; Gunderson and Holling 2002). When dealing with natural resource dynamics during periods of change and reorganization, four critical factors interact at spatio-temporal scales: learning to live with change and uncertainty; nurturing diversity for resilience; combining different types of knowledge for learning; and creating opportunity for self-organization towards social-ecological sustainability (Folke et al. 2002). In southern Cameroon, the cropping-fallow-forest conversion cycle is a management strategy within the socio-ecological system that regulates the ecological and economic functions of natural resources for sustainable livelihoods (Dounias 1996; Diaw 1997; Diaw and Oyono 1998; Carrière 1999; Oyono et al. 2003b). However, the main criterion for the viability of innovative research and/or development is that it should lead to an institution of learning. The issue here, in relation to change, is the capacity to understand and manage the complexity in nature and biological diversity, in the context of cropping (phase of disorder in the landscape mosaics) and stages of fallow, fertility (phase of re-organization) and forest recovery (state of stabilization of goods and ecosystem services). The development of sustainable slash-and-burn agriculture is rooted in the management of complex systems with links between profitability, biodiversity and productivity, multiple socio-ecological dimensions and scales, multiple uses and variables, and competing management objectives between expert and local knowledge systems. To facilitate such developments, the socio-economic conditions under which farmers perceive their land uses and take decision based on their knowledge of agricultural biodiversity should be analyzed. 6.2 METHODS 6.2.1 Study area The study was done in the forest margins benchmark area of southern Cameroon where the Alternatives to Slash and Burn (ASB) technological interventions and policy recommendations for the Congo basin have been conducted over the past decade. The benchmark area, covering 1.54 million ha, spans a gradient of resource use and population density and also encompasses significant spatial variation in market access, soils and climate (Gockowski et al. 2004a, 2005). The benchmark area encompasses gradients of both population density (from <5 persons km-2 to over 150 persons km-2) and market access (ASB 2000; Gockowski et al. 2004a). These gradients facilitated the segregation of the benchmark area into three blocks of high, medium and low ‘levels’ or ‘degrees’ of agricultural intensification, institutional development and environmental degradation, correspondng respectively to Yaoundé, Mbalmayo and Ebolowa.

134
The forest-landscape mosaics are composed of both agricultural land uses and non agricultural land uses. The agricultural land uses found in the study area by order of importance include: (i) mixed food cropping systems which largely guarantee household food security, and in areas with market access, generate marketable surpluses (ASB 1995, 2000; Gockowski et al. 2004a); (ii) cocoa plantations, the largest source of household agricultural revenue; (iii) plantain/banana fields; (iv) horticultural; and (v) Cucumeropsis agroforest systems (Gockowski et al. 2004a). Both the plantain and plantain/melon-based fields are generally targeted to become longer-period fallow fields and secondary forests (Gockowski et al. 2005). Input intensive, horticultural monocrops and maize, intended for the fresh-produce market, are frequently encountered in the Yaoundé block, which has the best access to urban markets of the three blocks. Another process associated with increasing resource use intensification and farming system diversification is both the differentiation of field types and fallow fields. Fallow fields of more than five years duration were significantly more frequent in Ebolowa and Mbalmayo blocks than in Yaoundé block. In the Yaoundé block, land constraints are more pronounced with 54% of the households managing fallow rotations of less than six years (Gockowski and Baker 1996). Commercialisation strategies across households are a function of the intensification process. Cocoa is the primary source of farm income, with food crops grown mainly to meet subsistence needs. There is still a significant focus on natural resource-based activities, such as bush meat hunting and gathering of other NTFPs (Ndoye et al. 1997, 1999; Gockowski et al. 2005). Intensively managed horticultural production systems are an important strategy for households in the Lekie division of the Yaoundé block. At the opposite end of this spectrum (Ebolowa block), however, households pursue an extensive production strategy and use almost no purchased inputs or management innovations to produce plantains and cocoyams for the market (Gockowski and Baker 1996). These households tend to use long fallows in areas of abundant land. As forest resources decrease across the different blocks, livelihood strategies change towards households allocating less time to natural resource-based activities such as NTFP gathering, fishing, and hunting (Ndoye 1997; Sunderlin et al. 2000). Households in the Yaoundé block, for example, devote a much smaller proportion of their efforts to such activities than households in the other blocks. Sectoral and macro-economic policy reforms since the late 1980s impacted on slash-and-burn agricultural systems. Unfortunately, these reforms took place in the context of, and indeed were necessitated by, an overvalued FCFA (local currency) and by depressed world commodity markets. As a result, cocoa and coffee producers in Cameroon, faced with historically low prices, neglected their plantations and shifted towards horticultural production and the production of plantain and cocoyams. Such restructuring put significant additional pressure on the forest margins, as new forest lands were cleared and used for annual food crop production (Gockowski et al. 2004a). Institutions and infrastructure are, in general, much better developed in the Yaoundé block, with higher population densities than in the Mbalmayo or Ebolowa blocks. The Yaoundé block has a fairly competitive marketing system for both outputs and inputs
135
(Gockowski and Baker 1996, 2004a). In general, households in this block have to face higher land pressures (as measured by the ratio of annual crop fields to fallow fields). They have intensified their production systems to a much greater degree than households in the Mbalmayo or Ebolowa blocks. This resulted from the high population densities, good rural infrastructure (resulting in excellent urban market access) and the development of market institutions. The intensification of the production process in the Yaoundé block is the result of numerous factors and an increasing differentiation between field types targeted at specific spatial and temporal niches (Gockowski et al. 2004a). At the southern end is the Ebolowa block with a low population density and large tracts of intact primary forests, i.e. 59% of the land cover (Gockowski et al. 2005; Sanchez et al. 2005). 6.2.2 Sampling methods Six villages were selected from within the humid forest benchmark area, with two in each block. The two top villages selected per block were primarily selected in terms of their higher intensity of R&D activities. The intensity of research activities was measured by three categories based on the monthly duration of the interventions (three days of activities; one week of activities; more then 10 days of activities). For each block, a matrix was used to categorize each village as low, medium and high intensity of research activities, using the different criteria. In each block the two villages with the highest rating were retained. In each selected village, five households were sampled to give a total of 30 households (5*6=30) for the study through interviews. In each selected village, the five households were selected based on the criteria of their participation in the development and utilization of the innovations. These criteria included three categories: (i) farmers involved in on-farm research and testing the innovations; (ii) farmers who were not directly involved in on-farm research but who have received benefits from on-farm research and have tested them; (iii) those who were not involved in any activity and who did not test any innovations. A list of names of respondents in each category was compiled to select respondents based on the estimated proportion of each group (category) over the total numbers given by the village. 6.2.3 Data collection The data were collected through household interviews based on individual responses, using a semi-structured questionaire (Appendix 1, Section 5.3.1 and Section 6), to assess the ability of local agricultural biodiversity knowledge to satisfy and adapt to household consumption needs, market preferences, and sustainable livelihoods of farmers. The minimum number of people who participated in the household discussions was three and the maximum was five. With sub-section 5.3.1, the following data were collected:
i. the different uses of tree species found during the inventory of the land use plot, coded as SPU with ten categories including (food ; medicinal; material for house
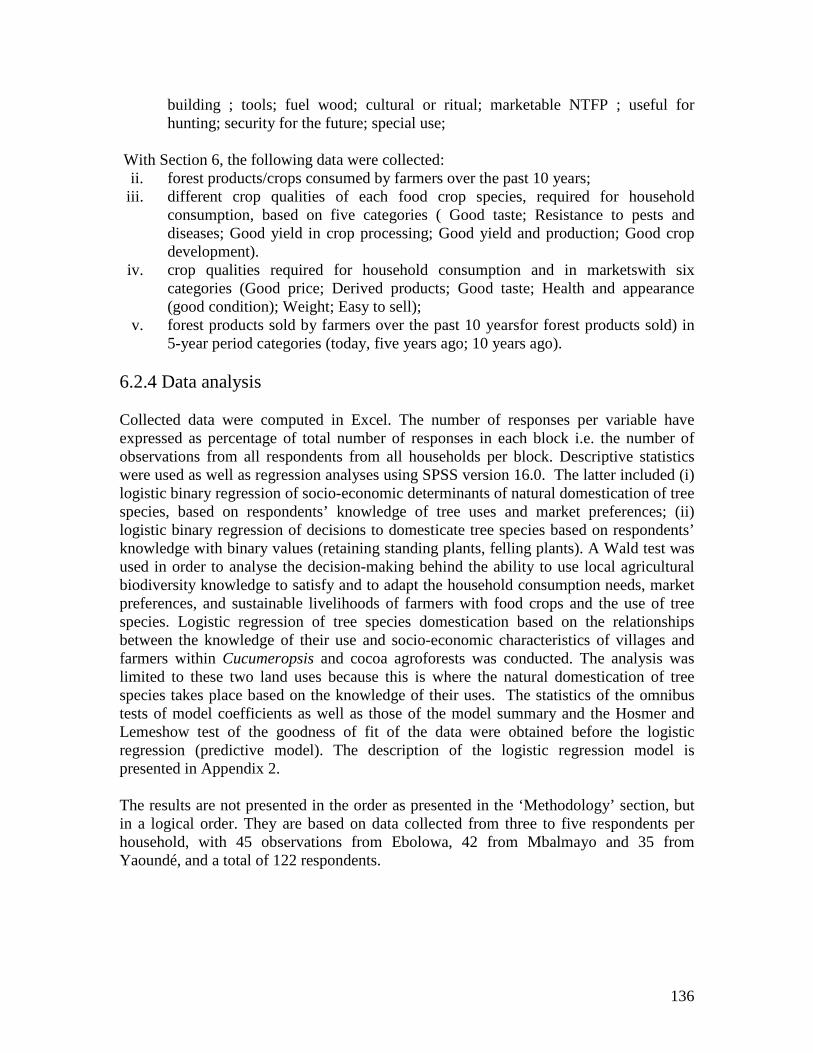
136
building ; tools; fuel wood; cultural or ritual; marketable NTFP ; useful for hunting; security for the future; special use;
With Section 6, the following data were collected:
ii. forest products/crops consumed by farmers over the past 10 years; iii. different crop qualities of each food crop species, required for household
consumption, based on five categories ( Good taste; Resistance to pests and diseases; Good yield in crop processing; Good yield and production; Good crop development).
iv. crop qualities required for household consumption and in marketswith six categories (Good price; Derived products; Good taste; Health and appearance (good condition); Weight; Easy to sell);
v. forest products sold by farmers over the past 10 yearsfor forest products sold) in 5-year period categories (today, five years ago; 10 years ago).
6.2.4 Data analysis Collected data were computed in Excel. The number of responses per variable have expressed as percentage of total number of responses in each block i.e. the number of observations from all respondents from all households per block. Descriptive statistics were used as well as regression analyses using SPSS version 16.0. The latter included (i) logistic binary regression of socio-economic determinants of natural domestication of tree species, based on respondents’ knowledge of tree uses and market preferences; (ii) logistic binary regression of decisions to domesticate tree species based on respondents’ knowledge with binary values (retaining standing plants, felling plants). A Wald test was used in order to analyse the decision-making behind the ability to use local agricultural biodiversity knowledge to satisfy and to adapt the household consumption needs, market preferences, and sustainable livelihoods of farmers with food crops and the use of tree species. Logistic regression of tree species domestication based on the relationships between the knowledge of their use and socio-economic characteristics of villages and farmers within Cucumeropsis and cocoa agroforests was conducted. The analysis was limited to these two land uses because this is where the natural domestication of tree species takes place based on the knowledge of their uses. The statistics of the omnibus tests of model coefficients as well as those of the model summary and the Hosmer and Lemeshow test of the goodness of fit of the data were obtained before the logistic regression (predictive model). The description of the logistic regression model is presented in Appendix 2. The results are not presented in the order as presented in the ‘Methodology’ section, but in a logical order. They are based on data collected from three to five respondents per household, with 45 observations from Ebolowa, 42 from Mbalmayo and 35 from Yaoundé, and a total of 122 respondents.
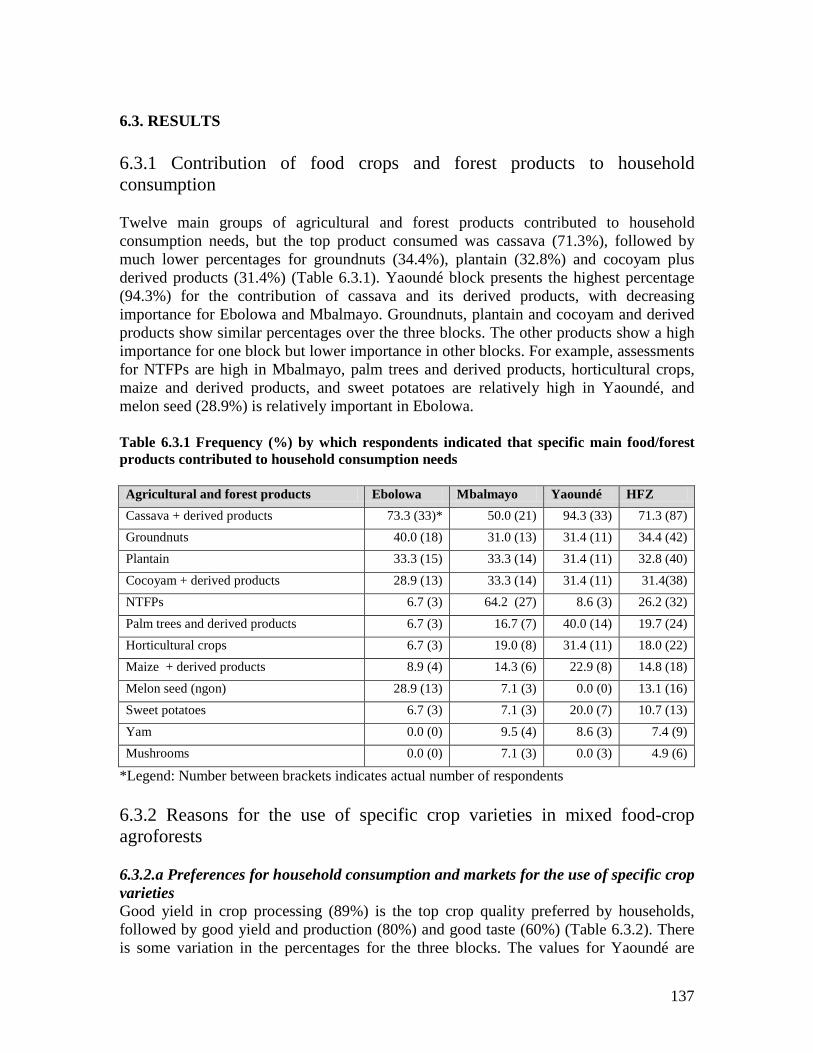
137
6.3. RESULTS 6.3.1 Contribution of food crops and forest products to household consumption Twelve main groups of agricultural and forest products contributed to household consumption needs, but the top product consumed was cassava (71.3%), followed by much lower percentages for groundnuts (34.4%), plantain (32.8%) and cocoyam plus derived products (31.4%) (Table 6.3.1). Yaoundé block presents the highest percentage (94.3%) for the contribution of cassava and its derived products, with decreasing importance for Ebolowa and Mbalmayo. Groundnuts, plantain and cocoyam and derived products show similar percentages over the three blocks. The other products show a high importance for one block but lower importance in other blocks. For example, assessments for NTFPs are high in Mbalmayo, palm trees and derived products, horticultural crops, maize and derived products, and sweet potatoes are relatively high in Yaoundé, and melon seed (28.9%) is relatively important in Ebolowa. Table 6.3.1 Frequency (%) by which respondents indicated that specific main food/forest products contributed to household consumption needs Agricultural and forest products Ebolowa Mbalmayo Yaoundé HFZ Cassava + derived products 73.3 (33)* 50.0 (21) 94.3 (33) 71.3 (87) Groundnuts 40.0 (18) 31.0 (13) 31.4 (11) 34.4 (42) Plantain 33.3 (15) 33.3 (14) 31.4 (11) 32.8 (40) Cocoyam + derived products 28.9 (13) 33.3 (14) 31.4 (11) 31.4(38) NTFPs 6.7 (3) 64.2 (27) 8.6 (3) 26.2 (32) Palm trees and derived products 6.7 (3) 16.7 (7) 40.0 (14) 19.7 (24) Horticultural crops 6.7 (3) 19.0 (8) 31.4 (11) 18.0 (22) Maize + derived products 8.9 (4) 14.3 (6) 22.9 (8) 14.8 (18) Melon seed (ngon) 28.9 (13) 7.1 (3) 0.0 (0) 13.1 (16) Sweet potatoes 6.7 (3) 7.1 (3) 20.0 (7) 10.7 (13) Yam 0.0 (0) 9.5 (4) 8.6 (3) 7.4 (9) Mushrooms 0.0 (0) 7.1 (3) 0.0 (3) 4.9 (6)
*Legend: Number between brackets indicates actual number of respondents 6.3.2 Reasons for the use of specific crop varieties in mixed food-crop agroforests 6.3.2.a Preferences for household consumption and markets for the use of specific crop varieties Good yield in crop processing (89%) is the top crop quality preferred by households, followed by good yield and production (80%) and good taste (60%) (Table 6.3.2). There is some variation in the percentages for the three blocks. The values for Yaoundé are
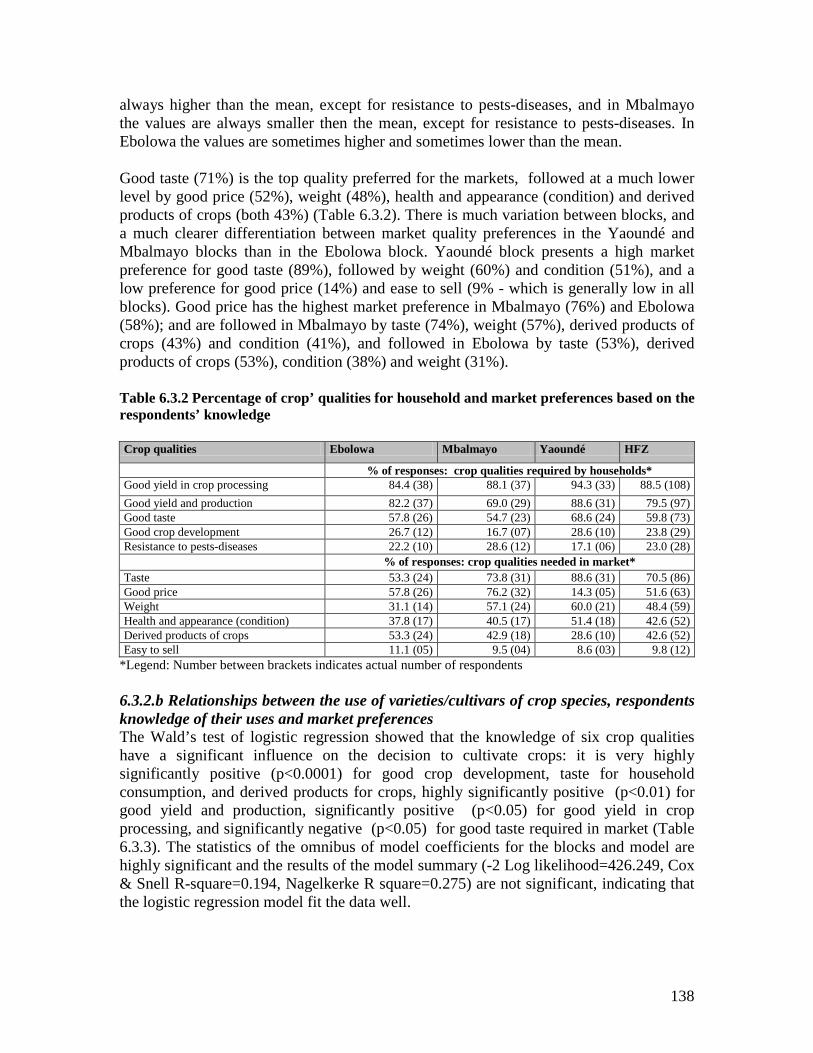
138
always higher than the mean, except for resistance to pests-diseases, and in Mbalmayo the values are always smaller then the mean, except for resistance to pests-diseases. In Ebolowa the values are sometimes higher and sometimes lower than the mean. Good taste (71%) is the top quality preferred for the markets, followed at a much lower level by good price (52%), weight (48%), health and appearance (condition) and derived products of crops (both 43%) (Table 6.3.2). There is much variation between blocks, and a much clearer differentiation between market quality preferences in the Yaoundé and Mbalmayo blocks than in the Ebolowa block. Yaoundé block presents a high market preference for good taste (89%), followed by weight (60%) and condition (51%), and a low preference for good price (14%) and ease to sell (9% - which is generally low in all blocks). Good price has the highest market preference in Mbalmayo (76%) and Ebolowa (58%); and are followed in Mbalmayo by taste (74%), weight (57%), derived products of crops (43%) and condition (41%), and followed in Ebolowa by taste (53%), derived products of crops (53%), condition (38%) and weight (31%). Table 6.3.2 Percentage of crop’ qualities for household and market preferences based on the respondents’ knowledge Crop qualities Ebolowa Mbalmayo Yaoundé HFZ
% of responses: crop qualities required by households* Good yield in crop processing 84.4 (38) 88.1 (37) 94.3 (33) 88.5 (108) Good yield and production 82.2 (37) 69.0 (29) 88.6 (31) 79.5 (97) Good taste 57.8 (26) 54.7 (23) 68.6 (24) 59.8 (73) Good crop development 26.7 (12) 16.7 (07) 28.6 (10) 23.8 (29) Resistance to pests-diseases 22.2 (10) 28.6 (12) 17.1 (06) 23.0 (28) % of responses: crop qualities needed in market* Taste 53.3 (24) 73.8 (31) 88.6 (31) 70.5 (86) Good price 57.8 (26) 76.2 (32) 14.3 (05) 51.6 (63) Weight 31.1 (14) 57.1 (24) 60.0 (21) 48.4 (59) Health and appearance (condition) 37.8 (17) 40.5 (17) 51.4 (18) 42.6 (52) Derived products of crops 53.3 (24) 42.9 (18) 28.6 (10) 42.6 (52) Easy to sell 11.1 (05) 9.5 (04) 8.6 (03) 9.8 (12)
*Legend: Number between brackets indicates actual number of respondents 6.3.2.b Relationships between the use of varieties/cultivars of crop species, respondents knowledge of their uses and market preferences The Wald’s test of logistic regression showed that the knowledge of six crop qualities have a significant influence on the decision to cultivate crops: it is very highly significantly positive (p<0.0001) for good crop development, taste for household consumption, and derived products for crops, highly significantly positive (p<0.01) for good yield and production, significantly positive (p<0.05) for good yield in crop processing, and significantly negative (p<0.05) for good taste required in market (Table 6.3.3). The statistics of the omnibus of model coefficients for the blocks and model are highly significant and the results of the model summary (-2 Log likelihood=426.249, Cox & Snell R-square=0.194, Nagelkerke R square=0.275) are not significant, indicating that the logistic regression model fit the data well.
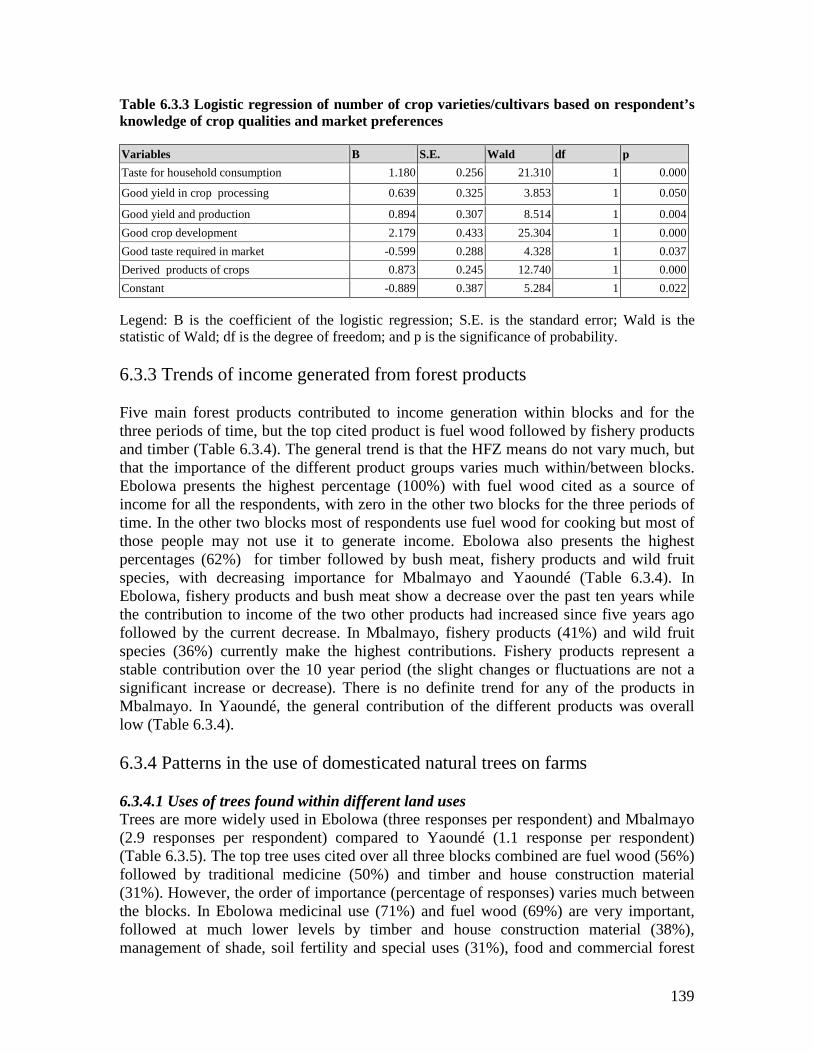
139
Table 6.3.3 Logistic regression of number of crop varieties/cultivars based on respondent’s knowledge of crop qualities and market preferences Variables B S.E. Wald df p Taste for household consumption 1.180 0.256 21.310 1 0.000
Good yield in crop processing 0.639 0.325 3.853 1 0.050
Good yield and production 0.894 0.307 8.514 1 0.004 Good crop development 2.179 0.433 25.304 1 0.000 Good taste required in market -0.599 0.288 4.328 1 0.037 Derived products of crops 0.873 0.245 12.740 1 0.000 Constant -0.889 0.387 5.284 1 0.022 Legend: B is the coefficient of the logistic regression; S.E. is the standard error; Wald is the statistic of Wald; df is the degree of freedom; and p is the significance of probability. 6.3.3 Trends of income generated from forest products Five main forest products contributed to income generation within blocks and for the three periods of time, but the top cited product is fuel wood followed by fishery products and timber (Table 6.3.4). The general trend is that the HFZ means do not vary much, but that the importance of the different product groups varies much within/between blocks. Ebolowa presents the highest percentage (100%) with fuel wood cited as a source of income for all the respondents, with zero in the other two blocks for the three periods of time. In the other two blocks most of respondents use fuel wood for cooking but most of those people may not use it to generate income. Ebolowa also presents the highest percentages (62%) for timber followed by bush meat, fishery products and wild fruit species, with decreasing importance for Mbalmayo and Yaoundé (Table 6.3.4). In Ebolowa, fishery products and bush meat show a decrease over the past ten years while the contribution to income of the two other products had increased since five years ago followed by the current decrease. In Mbalmayo, fishery products (41%) and wild fruit species (36%) currently make the highest contributions. Fishery products represent a stable contribution over the 10 year period (the slight changes or fluctuations are not a significant increase or decrease). There is no definite trend for any of the products in Mbalmayo. In Yaoundé, the general contribution of the different products was overall low (Table 6.3.4). 6.3.4 Patterns in the use of domesticated natural trees on farms 6.3.4.1 Uses of trees found within different land uses Trees are more widely used in Ebolowa (three responses per respondent) and Mbalmayo (2.9 responses per respondent) compared to Yaoundé (1.1 response per respondent) (Table 6.3.5). The top tree uses cited over all three blocks combined are fuel wood (56%) followed by traditional medicine (50%) and timber and house construction material (31%). However, the order of importance (percentage of responses) varies much between the blocks. In Ebolowa medicinal use (71%) and fuel wood (69%) are very important, followed at much lower levels by timber and house construction material (38%), management of shade, soil fertility and special uses (31%), food and commercial forest

140
products (24% each) and tools (22%). In Mbalmayo fuel wood (60%), medicine (55%) and timber and construction material (43%) are important, followed at much lower levels by special uses, food and commercial forest products (26% each), and tools (21%). In Yaoundé the most important use is fuel wood (34%), with some medicine (17%), and little use of the other products. Table 6.3.4 Frequency by which respondents indicated income generation from specific forest products over the 10 past years Period Forest products Ebolowa Mbalmayo Yaoundé HFZ % of responses*
Current Fuel wood 100.0 (45) 0.0 (0) 0.0 (0) 36.9 (45) Timber 51.7 (23) 30.9 (13) 17.1 (6) 36.9 (45) Fishery products 48.9 (22) 40.8 (17) 11.4 (4) 35.2 (43) Wild fruit species 42.2 (19) 35.7 (15) 22.9 (8) 34.4 (42) Bush meat 51.1 (23) 26.2 (11) 22.9 (8) 34.4 (42)
Five years ago
Fuel wood 100 (45) 0.0 (0) 0.0 (0) 36.9 (45) Fishery products 51.1 (23) 42.9 (18) 8.6 (3) 36.1 (44) Timber 62.2 (28) 28.6 (12) 8.3 (3) 35.2 (43) Wild fruit species 46.7 (21) 30.9 (13) 22.9 (8) 34.4 (42) Bush meat 53.3 (24) 23.8 (10) 22.9 (8) 34.4 (42)
Ten years ago Bush meat 60.0 (27) 31.0 (13) 17.1 (6) 37.7(46) Fishery products 55.5 (25) 40.5 (17) 8.6 (3) 36.9 (45) Fuel wood 100.0 (45) 0.0 (0) 0.0 (0) 36.9 (45) Wild fruit species 51.1 (23) 42.9 (18) 8.6 (3) 36.1 (44) Timber 55.6 (25) 35.7(15) 8.6 (3) 35.2 (43)
*Legend: Number between brackets indicate actual number of respondents Table 6.3.5 Importance of trees for different uses based on respondents’ knowledge Use for trees species Ebolowa Mbalmayo Yaoundé HFZ % of responses Fuel wood 68.9 (31) 59.5 (25) 34.3 (12) 55.7 (68) Medicine 71.1 (32) 54.7 (23) 17.1 (6) 50.0 (61) Timber and house construction material 37.8 (17) 42.9 (18) 8.6 (3) 31.1 (38) Management of shade, soil fertility and special uses 31.1 (14) 26.2 (11) 8.6 (3) 22.9 (28) Food 24.4 (11) 26.2 (11) 11.4 (4) 21.3 (26) Tools 22.2 (10) 21.4 (9) 8.6 (3) 18.0 (22) Commercial forest products 24.4 (11) 26.2 (11) 8.6 (3) 20.5 (25) Hunting 8.9 (4) 11.9 (5) 8.6 (3) 9.8 (12) Ritual 6.7 (3) 11.9 (5) 8.6 (3) 9.0 (11) Future security 6.7 (3) 11.9 (5) 0.0 (0) 6.6 (8)
*Legend: Number between brackets indicate actual number of respondents 6.3.4.2 Relationship between status of trees species domestication, respondents knowledge of their uses and market preferences The results of the Wald test of logistic regression found that three uses of tree species affect the decision of farmers to keep them: very highly significant (P<0.001) for food uses, highly significant (P<0.01) for medicinal uses and significantly (P<0.05) for timber
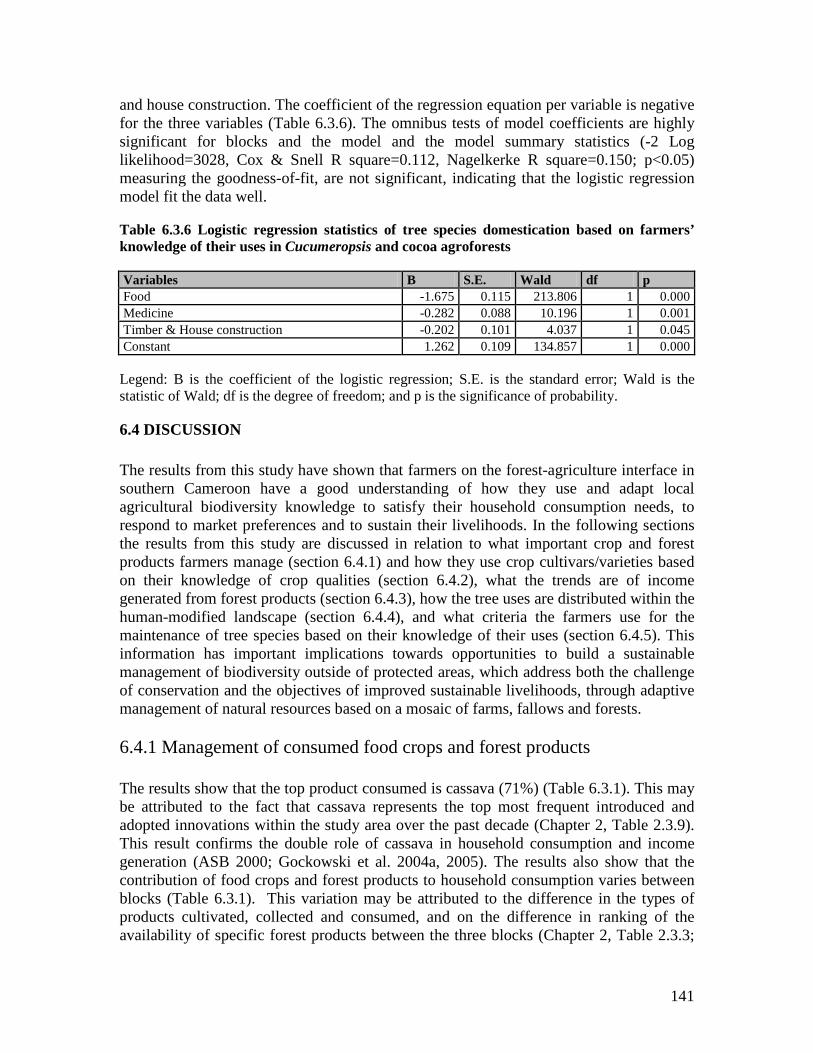
141
and house construction. The coefficient of the regression equation per variable is negative for the three variables (Table 6.3.6). The omnibus tests of model coefficients are highly significant for blocks and the model and the model summary statistics (-2 Log likelihood=3028, Cox & Snell R square=0.112, Nagelkerke R square=0.150; p<0.05) measuring the goodness-of-fit, are not significant, indicating that the logistic regression model fit the data well. Table 6.3.6 Logistic regression statistics of tree species domestication based on farmers’ knowledge of their uses in Cucumeropsis and cocoa agroforests Variables B S.E. Wald df p Food -1.675 0.115 213.806 1 0.000 Medicine -0.282 0.088 10.196 1 0.001 Timber & House construction -0.202 0.101 4.037 1 0.045 Constant 1.262 0.109 134.857 1 0.000
Legend: B is the coefficient of the logistic regression; S.E. is the standard error; Wald is the statistic of Wald; df is the degree of freedom; and p is the significance of probability.
6.4 DISCUSSION The results from this study have shown that farmers on the forest-agriculture interface in southern Cameroon have a good understanding of how they use and adapt local agricultural biodiversity knowledge to satisfy their household consumption needs, to respond to market preferences and to sustain their livelihoods. In the following sections the results from this study are discussed in relation to what important crop and forest products farmers manage (section 6.4.1) and how they use crop cultivars/varieties based on their knowledge of crop qualities (section 6.4.2), what the trends are of income generated from forest products (section 6.4.3), how the tree uses are distributed within the human-modified landscape (section 6.4.4), and what criteria the farmers use for the maintenance of tree species based on their knowledge of their uses (section 6.4.5). This information has important implications towards opportunities to build a sustainable management of biodiversity outside of protected areas, which address both the challenge of conservation and the objectives of improved sustainable livelihoods, through adaptive management of natural resources based on a mosaic of farms, fallows and forests. 6.4.1 Management of consumed food crops and forest products The results show that the top product consumed is cassava (71%) (Table 6.3.1). This may be attributed to the fact that cassava represents the top most frequent introduced and adopted innovations within the study area over the past decade (Chapter 2, Table 2.3.9). This result confirms the double role of cassava in household consumption and income generation (ASB 2000; Gockowski et al. 2004a, 2005). The results also show that the contribution of food crops and forest products to household consumption varies between blocks (Table 6.3.1). This variation may be attributed to the difference in the types of products cultivated, collected and consumed, and on the difference in ranking of the availability of specific forest products between the three blocks (Chapter 2, Table 2.3.3;

142
Gockowski et al. 2004a, 2005; Sanchez et al. 2005). This difference suggests that the ranking order of products for income generation with plantains, cassava, cocoyam and groundnuts is not the same as the ranking of their use for household consumption with cassava, groundnuts, plantain and cocoyam. This result suggests that plantain and cocoyam are more market-oriented while cassava is both market and domestic consumption-oriented and groundnuts is more domestic consumption-oriented. The results also show that the contribution of NTFPs to domestic consumption is high (64.2%) in Mbalmayo compared to the other two areas. This difference does not follow any gradient of natural resources management within the forest margins. It may be justified by the fact that the nature of NTFPs was not mentioned or specified; it was an open question with no indication of the type of product. This result also indicates that the ranking for the consumption of forest products such as wild fruit (Dacryodes edulis, Ricinodendron heudolitti and Irvingia gabonensis) does not follow the ranking for their contribution to income which increases significantly following the increasing gradient of natural resource use intensification of the forest margins i.e. from high (Yaoundé) to low (Ebolowa) (ASB 2000; Gockowski et al. 2004a). This should also be justified by the fact the there is specific NTFPs* block interactions within the study area as follows: wild fruits and bushmeat in Ebolowa, palm wine in Mbalmayo, and fuel wood, palm wine and wild fruits in Yaoundé (Gockowski et al. 2004a; Awono and Manirakiza 2008). The results also show that the use of palm trees and derived products, horticultural crops, maize and derived products, and sweet potatoes are relatively high in Yaoundé. The cultivation of these products in Yaoundé is justified by the high demand due to the proximity to the important market in Yaoundé and to the lower transportation costs due to the good market access. This result indicates that a certain proportion of these products is used for domestic consumption (Chapter 2, Table 2.3.3). In Ebolowa, the relative high importance in the consumption of melon seed (29%) is justified by the important cultivation of this product in this block. The cultivation of melon seed is highly dependent on the existence of mature and/or secondary forests and or undisturbed forests; its cultivation requires the use of lands with good indicators of soil fertility plus the need for tall trees that will be felled to serve as wooden structures for the climbing of melon vines. Ebolowa block and more or less Mbalmayo fit the biophysical characteristics of lands suitable for the cultivation of melon-seed (Gockowski et al. 2004a, 2005). The variations observed in the rating of assessments of products consumed between products and blocks indicate the effect of traditional knowledge in the management of food systems. These food systems are based on a range of food crops and forest products that reflect the context of high agribiodiversity and forest diversity in the study area (Chapter 5, Table 5.3.10, 5.3.11, 5.3.12). This diversity of products is a source of resilient food security, livelihood and income access. This ability of farmers to manage the biodiversity is a key factor that may be an asset in the development of agricultural innovations that incorporate complexity and diversity in diet, and market opportunities. This confirms the results of previous studies on the significance of diet for the management of landscape mosaic agroforests in others sites of southern Cameroon
143
(Bahuchet 1996; Dounias 1996; Dounias and Hladik 1996; Gockowski et al. 2004b; Mala et al. 2006, 2008). 6.4.2 Use of crop cultivars/varieties based on respondents knowledge of their qualities The results show that good yield in crop processing is the top cited (89%) crop quality preferred for households consumption (Table 6.3.2). This may be justified by the relative importance of tuber and root crops such as cassava, cocoyam, sweet potatoes and yam. These products are characterized by their high degree of perishability, i.e they cannot be stored for long after harvesting before they loose their taste quality. This may also be justified by the fact that in addtition to tuber and root crops, other products such as palm trees and derived products and maize can also be processed both for generating income and household consumption needs (Table 6.3.1). However, the ratings of assessment of the qualities do not follow the increasing gradient of natural resource use intensity of the forest margins. This may depend on the capacity of farmers to see processed products as added value, the knowledge of cost-benefits of processed products and of the situation of market access. For example, processed cassava can be stored for several days and perceived to provide more benefits than fresh cassava. This result may explain why the Yaoundé block presents the highest percentage (94.3%) for good yield in crop processing, with decreasing importance for Ebolowa and Mbalmayo. This high rating for good yield may also be attributed to the relative good market access. Good market access really reduces the risk for farmers when they decide to commercialize processed products such as cassava, and palm wine and its derived products to the market (Chapter 2, Table 2.3.3). The overall results show that good taste is the top cited quality preferred for products at the market, but this is only really true for the Yaoundé and Mbalmayo blocks (Table 6.3.2). Similarly, other generally preferred qualities for the market vary in their preference rating in the different villages because each village has its own socio-economic specificity in terms of market access. Crops that orientated the interests for specific products, for example both fresh and processed cassava and dessert bananas, are more commercialized in Yaoundé block while plantain, cocoyam and melon seed are more commercialized in the Ebolowa and Mbalmayo blocks. The differences in rating based on the knowledge of crop qualities may also be justified by the sophistication of market organization. It has been shown that the great proportion of innovations introduced were very high (>90%) in commercial/market aspects and high (>70%) in socio-organizational aspects (Chapter 2, Table 2.3.2). This difference in rating may also be attributed to the farmers’ knowledge of crop qualities and to the experience in market and commercialization in different blocks on which is based their decision to minimize the risk and to produce good quality crops for the market. These variations in the ratings of assessments of crop qualities may also be attributed to the fact that people in the study areas live within different specific environments affecting people’s perception of nature, livelihood and well-being and their strategy to achieve it. These variations in the assessment (Table 6.3.2) may also be attributed to the fact that the

144
farmers’ decision to bring products to the market is based on farmers’ knowledge of taste, price, weight, healthy appearance and nature of derived products. The nature of derived products is a very important determinant in the traditional use and management of crops towards household consumption and market orientation (Chapter 3, Table 3.3.1). The results show that there are variations between blocks for good taste, weight, health and appearance, good price, derived products, i.e. qualities needed in the market (Table 6.3.2). These variations may be attributed to the differences in market access, the nature of products predominantly produced in each block and the availability of several varieties per crop providing these market qualities. The implication of this result is that farmers keep their knowledge active to deal with both market preferences and households’ consumption needs by using several varieties per crop on the same farm and at the same time. The development of food crop innovations to improve adaptive management practices should be negotiated based on the complexity on these crop quality determinants that are used within the learning cycle of farmers. The results suggest that the development of forest-agriculture innovations does not need fixed prescriptions or one ideal variety but should be based in a negotiation that would generate a number of options and genotypes to choose from (Abate et al. 2000). The knowledge of six crop qualities have significant positive and negative influences (p<0.05) on the decision to cultivate several crop varieties/cultivars (Table 6.3.3). The positive values of the coefficient indicate that the crop qualities are used as cumulative factors in the decision of farmers to relate to market preferences and household consumption preferences. Maybe these factors are under the farmer’s control to cultivate ‘good and suitable crop varieties’. The negative value such as associated with good taste preferred in the market indicates that the crop quality behaves as competitive factor in the decision of farmers to relate to household and market preferences but also to relate to crops with different qualities. This result suggests that good taste for the market is a more competitive factor than other factors because it depends on several other external factors including labour availability, the status of land suitability for these crops, the cost of transportation, the quality of market access and the level of sophistication of its organization. This difference may also be justified by the fact that these results appear to be influenced by uncontrolled factors such as environmental conditions of soil fertility and rainfall. These results also suggest that to address the quantity and quality of food crop biodiversity and their conservation, one should first target crops with the qualities used by farmers. Cassava, plantain and cocoyams with high numbers of crop cultivars (5-6 per block) are illustrative of the competition exerted by crop quality, such as taste for the market, on the farmer’s decision on several crops/products and/or the level of multi-cropping. These crops are characterized by a dominant market-orientation rather than a domestic consumption orientation with crops such as groundnuts (Chapter 5, Table 5.3.11). These results also suggest that the more crop cultivars/varieties are used, the higher is the socio-economic importance of the particular crop. The four top crops cited have had an important contribution towards income generation from agricultural products over the past 10 years to fill the gap for income generation resulted from a significant
145
drop in cocoa commercialization since the cocoa crisis on the 1980s (Ndoye 1997; Ruiz-Perez et al. 1999, 2000). The criteria affecting a farmer’s decision to cultivate several crop varieties/cultivars in southern Cameroon are partly similar to those obtained from studies of habitat heterogeneity and biodiversity associated with indigenous agriculture in the Americas and South-East Asia. They show that the role of traditional knowledge is effective in terms of consumption habits, knowledge of the ecological environment, and cultural/ritualistic activities of crop production (Brookfield and Padoch 1994; Reichadrt et al. 1994; Dounias 1996; Dounias and Hladik 1996; Gari 2001; Brookfield 2002; Ezaguire 2003). The knowledge of crop qualities and the ability of farmers to manage a range of crops within their farms indicate that that farmers’ resource is based on the maintenance of stocks of crops with various qualities (Table 6.3.2, 6.3.3). The results also suggest that the knowledge of crop qualities can be a tool in the process of participatory crop breeding with the integration of factors such as taste, good yield and high yield from crop processing, i.e. the integration of technical and commercial innovations with societal needs (Chapter 2, Table 2.3.9, 2.3.10). 6.4.3 Trends in income generated from forest products The results show that, overall, there is no difference in the contribution of the different forest products to income generation, including over time, but there are major differences in terms of the blocks (Table 6.3.4). These differences may be justified by the differences in resource allocation that follow the increasing gradient of natural resource use intensification of the humid forest zone. In addition, these differences may also be attributed to the categories of products from natural resource management and their socio-economic valorisation that depend also on the availability of the main products, their nature being fresh or dry bushmeat and fish, fresh and/or processed wild fruits and their post-harvest technology. These results confirm those obtained in the previous studies except for fishery products which are not often cited as forest products. They show that the contribution of forest products to income generation increase from the low (Yaoundé) to the high (Ebolowa) within the study areas (Dijk 1995, 1999; Gockowski et al. 2004a). Ebolowa is the only block where all respondents (100%) cited fuel wood as a source of income over the total period. This may be justified by the fact that people did not answer to the open question adequately. It seems that there was a misunderstanding or interpretation of the question which was wrongly phrased between fuel wood and timber in the collection of data. This result contradicts literature that has shown that the market of fuel wood is important in villages closer to main cities such as Yaoundé (Gockowski and Baker 1996; Gockowski et al. 2004a). There are variations in the rating of benefits from forest products between blocks and periods of time for timber (Table 6.3.4). These variations reflect the differences in resource allocations between blocks that have shown that the trends of benefits from forest products increase follow the resource use intensification gradient of forest margins i.e. Ebolowa (low) to Yaoundé (high) (ASB 2000; Gockowski et al. 2004a, 2005). These results indicate that the higher the percentage of forest cover is, the higher is the rating of

146
income generated from timber. For example, more people benefit from timber in Ebolowa compared to the other two blocks. This may be justified by the presence of several forest logging concessions that are located around the villages of Ebolowa block, but also community forests and protected areas. These logging concessions provide annual forest royalties to both councils and communities in order to develop socio-economic infrastructures such as building of schools, wells and providing small equipment for health centres. These benefits are also perceived in the recruitment of local community members in activities of logging companies and in the maintenance of the roads and bridges (Oyono et al. 2003a,b; 2005). In Yaoundé, the general level of response is much lower in the other blocks with only 23% of respondents indicated that they receive benefits from timber and fishery products. This may be justified by the large difference in natural resource allocation between Yaoundé (low) and the other two blocks (medium to high for Mbalmayo and Ebolowa). This difference is reflected in the respondents’ practices, the uses and commercialization of agricultural and forest biodiversity (Table 6.3.4). However, people in the Yaoundé block domesticated valuable timber species in cocoa agroforests because their good access to the market (Chapter 2, Table 2.3.3; Chapter 5, Table 5.3.7). The recent development of fish pond activities in the area in response to a social demand for innovations (Chapter 2, Table 2.3.9), increased the contribution of fishery products to income generation but most of the fishery products from Mbalmayo and Ebolowa come from rivers. There is a relative high increase in the contribution of wild fruit species, timber and bush meat to income generation over the past 15 years. This increase may have been caused by the collapse of the cocoa market in 1990 with farmers having to revise their livelihood strategies (Ndoye 1997; Ruiz-Perez et al. 1999, 2000). This situation has induced an increased contribution of forest products towards household income and livelihoods over the past two decades (Sunderland and Ndoye 2004). This change contributed to modified land use management and farming systems characterized by a diversification of source of income. This may have affected the land use composition within the forest landscape mosaics (Carrière 1999; Gockowski et al. 2004b; Chapter 6, Section 5.3.11 and 5.3.12). 6.4.4 Distribution of tree uses within human-modified landscape Most respondents use trees for fuel wood, traditional medicine and material for timber and house construction (Table 6.3.5). There are real differences in the ratings based on farmers’ knowledge of trees use in the Ebolowa and Mbalmayo blocks compared to Yaoundé. This may be attributed to the fact that people in the medium and low parts of the natural resource use intensification gradient are dealing more frequently and daily with these tree uses. The daily use is centered on fuel wood for cooking and traditional medicine for their health problems because they live far from modern hospitals and are often constrained by their socio-economic condition (Chapter 3, Table 3.3.3). This result confirms the assumption that households in low resource intensification areas tend to rely on the still abundant resources as additional sources of household income. The variations for the three top uses of tree species may, however, be the consequences of a relative

147
difference in resource use intensities and infrastructural development across the forest margins benchmark area (Gockowski et al. 2004a, 2005). Ebolowa block presents relative much higher use of the other seven tree uses, including timber, when compared to the other two blocks (Table 6.3.4). This may be justified by the fact that because of the high density of timber species found within this block (Chapter 5, Table 5.3.6, 5.3.7, 5.3.9, 5.3.12), they often sell to 'artisanal' loggers for cash and also because of their proximity to forest concessions from where they receive forest royalties as a direct benefit to implement socio-economic infrastructures. Respondents varied in their response on the use of trees for medicine, fuel wood, management of shade, soil fertility and special uses, and tools. The responses followed a sharp decline from Ebolowa via Mbalmayo to Yaoundé (Table 6.3.5). These variations are attributed to the socio-economic context under which respondents are involved in terms of intensity of natural resource use. This context is characterized by an increase level ofthe natural resource use intensification gradient within the study area, i.e. high in Yaoundé and low in Ebolowa (Gockowski et al. 2004a, 2005). The respondents in Ebolowa and Mbalmayo blocks indicate more frequently the use of tree species than those in the Yaoundé block. Forest is still relatively more important in these two blocks (Gockowski et al. 2004a). The knowledge and use of tree species for food, medicine, commercial forest products, and management of soil fertility are more important here than in the Yaoundé block (Table 6.3.5). There is more use of individual knowledge in the management of soil fertility in Ebolowa compared to the others blocks where people seem to rely more on modern fertilizers. Local indicators, such as Chromoleana odorata, Haumania danckelmanniana, Musanga cecropioides and Pycnanthus angolensis, are used for agro-ecological sustainability in the human-modified landscapes (Chapter 4, Table 4.3.2). C. odorata is an alien invader species which is abundant in many slash & burn areas. This species is used as a positive indication of soil fertility when the patch is to be used for mixed food crops but it is negative for the other cropping systems, such as Cucumeropsis agroforests, which require good restoration of soil fertility ranging from young secondary to old secondary forest patches. This variation in the use of local indicators confirms the results from previous studies which have shown that the use of modern inputs for farms decrease following the decreasing resource use intensification gradient (Gockowski et al. 2004a). 6.4.5 Maintenance of tree species based on respondents knowledge of their uses The results show that food, medicinal uses and timber and house construction have influence the decision of farmers to keep trees when clearing forests (Table 6.3.6). The negative values indicate that there is a competitive cognitive process in the association of the trees having these uses and the cultivation of crop species within farms. This result suggests that maybe the knowledge of the tree uses are not the only factors that determine the decision to keep trees but maybe also their potential to generate income and the availability of trees with these uses in other land uses. These results suggest the need to target these tree uses when addressing the issue of quantity and quality of the domestication of forest tree species within agricultural landscape mosaics. The results

148
also show that the tree uses that affect household and market preferences overall represent more than 50% of tree uses. The results reflect the efficiency of traditional forest knowledge based on the local perceptions of nature, forest and forest knowledge management for integrating forest and agriculture to maintain a threshold of forest-agriculture sustainability (Chapter 3, 4). These results confirm the perceived close links between forest and timber, and forest and food which are presented in the social description of forests (Chapter 3, Table 3.3.3; Chapter 5.5.3), while the descriptions of forest succession are mostly based on both socio-ecological descriptors and associated activities such as agriculture, collection of NTFPs, hunting and fishing (Chapter 3, Table 3.3.4). These results may also be attributed to the key role played by these tree uses in the livelihood and well-being of the respondents for household consumption and income access (Table 6.3.5). This result confirms the previous studies which have shown that farmers adapt to macro-economic policies and policy changes by adopting more competitive food-crops farming systems such as plantain and melon seed and by the selling of forest products (Ndoye 1997; Ndoye et al. 1997; Sunderlin et al. 2000). This is also demonstrated by the density of trees of species such as Dacryodes edulis, Persea americana and Elaeis guineensis as well as those of commercial timber species within the forest landscape mosaics (human-modified landscape) (Sonwa 2004; Chapter 5, Table 5.3.12; Mala et al. in prep.). The role of food, timber and medicinal uses in the domestication of tree species corroborate similar results obtained in the study of the impact of slash-and-burn agriculture on forest dynamics. The previous studies have shown that local knowledge of ecological, cultural, agronomic and socioeconomic functions of trees determine the natural domestication of tree species during the clearing of forest and/or the cultivation of wild tree species in other areas in southern Cameroon (Dounias and Hladik 1996; Carrière 1999). The results also show that the contribution of each category of forest products to respondents’ income decreases from a high in Yaoundé to a low in Ebolowa (Table 6.3.4). These variations are due to the differences observed in the resource allocation within blocks (Gockowski et al. 2004a, 2005; Palm et al. 2005). The results also confirm those obtained in the study of the biomass dynamics in the cocoa agroforests. Those results have shown that timber species in cocoa agroforests occur with low density in the Ebolowa block and high density in the Yaoundé block. However, the density of wild fruit trees (NTFPs) developed in the opposite direction (Gockowski and Dury 1999; Gockowski et al. 2004b; Sonwa 2004). Five of the top ten commercialized timber species are domesticated in cocoa agroforests such as Distemonathus benthamianus, Lophira alata, Milicia excelsa, Pterocarpus soyauxii and Terminalia superba even if their density is not the same. Six of the top ten timber species are found in Cucumeropis agroforests, and seven in preforestry young fallows and in young secondary forests (Chapter 5, Table 5.3.6, 5.3.7, 5.3.8, 5.3.9, 5.3.12; Mala et al. in prep.). These results confirm that the current composition of landscape mosaics is the result of the repetitive succession of conversion cycles, with some footprints of human modifications (Carrière 1999; Ngobo 2002; Van Germeden et al. 2003).
149
6.4.6 General discussion Over the past decade, the conventional management of biodiversity has been based on a top-down strategy with the creation of protected areas. The fixed (in time and space) boundaries of such conservation territories contradict environmental flows that feature in global discourse, and perpetuate human-nature separation (Instone 2003; Palm et al. 2005). This thinking has expanded even beyond the protected areas. In the case of the forest-landscape mosaics, decisions on the research and intervention processes were made under the segregation approach. This was based on a separation of forests and agriculture spatially, administratively and conceptually into two separate units for management and research (Instone 2003; Oyono et al. 2003). The implications of this conceptual approach were that the dynamic interactions of societies and ecosystems were not properly captured and the socio-ecological systems became more attached to only their ability to respond to uncertainty and complex interactions with their environment (Diaw 1999; Ruitenbeck and Cartier 2001; Scheffer et al. 2002; Prabhu 2003; Olsson et al. 2004a,b; Walker et al. 2004; Plummer and Armitage 2006). The results of this chapter show that the management of agricultural biodiversity is designed to respond both to household consumption needs and market preferences. Their management processes take place around a pool of crop varieties/cultivars and tree species that are maintained within the cropping-fallow-forest conversion cycle (Table 5.3.3, 5.3.10, 5.3.12). The uses of tree species and crop qualities are based on cognitive trajectories to satisfy household consumption and market needs under heterogeneous socio-economic and bio-physical conditions (Chapter 2, Table 2.3.3; Table 6.3.3, 6.3.7). These resultsindicate that there is anumber of factors that contribute tomaintain a threshold of resilience of traditional agro-ecosystems. This resulted from the interactions between society, agriculture and natural systems, and livelihood strategies, complex and diversified enough to respond to resource user needs (FAO 1999a, b, 2005; Altieri 2002; Colfer 2005; Plummer and Armitage 2006). These complex agro-ecosystems include, by definition, people and their institutions, as well as the agricultural biodiversity knowledge systems that they use and influence through their diverse range of social goals and definitions of well-being (Dietz et al. 2003; Prabhu 2003; Plummer and Armitage 2006). The results of this study show that the patterns in the composition of biodiversity are based on dynamic and complex livelihood systems that usually rely on crops and tree diversity. These patterns reflect the traditional knowledge systems and decision-making processes that affect the local biodiversity management and conservation practices (Carrière 1999; Penkuri and Jokinen 1999; Instone 2003; Mala et al. 2008). The variations observed between blocks in terms of composition of crops and tree species for household consumption needs and income generation are very critical to understand how the human-modified landscapes evolved over time and space. The results indicate the link between space and the ability of farmers to manage biodiversity for their livelihood and well-being. The purpose and goals of the management are well defined in contrast to conventional thinking that perpetuates human-nature separation with the implementation of the segregation approach for biodiversity conservation. However, Instone (2003) suggests the notion of territorialisation to overcome this limit in analysis

150
and intervention – as a particular form of spatial and conceptual translation. This may be useful and helpful to rethink conservation space. For Instone (2003), territorialisation is about connection, ordering and organization across all scales, from the genetic to the global, and across all forms of life – human and non human. The results show how the human intervention, consumption needs and market strategy affect the structure of vegetation and the plant composition of forest landscape mosaics. These results indicate that the space of biodiversity from the human-nature perspective is affected by local knowledge systems on both ecological ordering but also a cultural, political and economic realignment (Instone 2003). This confirms the roles of human-nature interactions on forest landscape mosaic composition that have already been acknowledged in the studies of biodiversity of the post-agricultural landscape (Dounias 1996; Dounias and Hladik 1996; Ngobo 2002; Van Germeden et al. 2003), on mixed food crops, and Cucumeropis agroforests (Carrière 1999) and cocoa agroforests (Sonwa 2004) in southern Cameroon. The results show that forest landscape mosaics developed from the historical ecology, food culture and bio-economy which is managed within a cycle of transformations of socio-ecological systems. The resilience cycle supporting local knowledge systems is considered as the driver of the adaptation to uncertainty promoted by a variable climate (Ellis 1995; Scoones 1995; Holling 2001; Walker et al. 2004). The decision-making processes that take place within the management of natural resources indicate the potential ability of farmers to link ecology and economy in order to anticipate potential damage, to take advantage of opportunities, or to cope with the consequences of uncertainty promoted by the climate variability (Ellis 1995; Scoones 1995; Prabhu 2003). This confirms the role of local and indigenous ecological and biodiversity knowledge as an emergent property of a complex system (Woodley 2004; Plummer and Armitage 2006). These results also confirm the relationships existing between diet choice, risk, and plant domestication (Bahuchet 1996; Winterhalder and Goland 1997; Carrière 1999) and the relationships between socio-cultural functions, structure and floristic composition within the forest landscape mosaics as a result of human intervention (Dounias and Hladik 1996; Van Germeden et al. 2003). Agricultural biodiversity knowledge is a key tool that can be used in the design of research and development processes aiming to integrate agriculture and forest issues adapted to the heterogeneity of socio-economic and biophysical context under which farmers operate within the blocks of forest margins benchmark in southern Cameroon. Adaptive co-management provides the flexibility to deal with the complex systems on which farmers rely for their livelihood scenarios and options towards sustainable outcomes of slash-and-burn agriculture. 6.5 CONCLUSIONS The objective of this chapter was to analyze how agricultural biodiversity knowledge satisfies and adapts to household consumption needs, market preferences and sustainable livelihood. The socio-economic characteristics of farmers determining agricultural biodiversity distribution have been characterized as well as the socio-economic uses and qualities of tree species needed for household consumption needs and market preferences. The results of the Wald test indicate that it is possible to predict the quantity and quality
151
of domesticated tree species based on respondents knowledge of their uses such as food, medicine, and timber and household material as well as the number of varieties/cultivars per crop species based on crop qualities such as taste for household consumption and market requirements, derived products for crops, good yield in crop processing and good yield in crop processing. These results confirm that the composition of the forest landscape mosaics are largely influenced by the motivations behind the tree uses, whether cultural, social, agronomic and/or economic - they have oriented the specific composition of forests over centuries of slash-and-burn agricultural practices. These results suggest that there are real opportunities to build a sustainable management of biodiversity outside of protected areas, which address both the challenge of conservation and the objectives of improved sustainable livelihoods. Local agricultural biodiversity knowledge affects the composition of forest landscape mosaics that is adapted to household consumption strategies, market preferences and sustainable livelihoods through adaptive management of natural resources based on a mosaic of farms, fallows and forests. 6.6 REFERENCES Altieri AM. 2002. Agroecology: the science of natural resource management for poor farmers in marginal environments. Agriculture, Ecosystems and Environments 93 (2002): 1-24. ASB. 1995. Alternatives to Slash and Burn Phase I Report: Forest Margins Benchmark of Cameroon, Alternatives to Slash and Burn Programme. Yaoundé: IITA Humid Forest Ecoregional Centre. ASB. 2000. Alternatives to Slash and Burn Phase II Report: Forest Margins Benchmark of Cameroon, Alternatives to Slash and Burn Programme. Yaoundé: IITA Humid Forest Ecoregional Centre. Awono A, Manirakiza D. 2008. Mobilisation et renforcement des capacités des petites et moyennes entreprises impliquées dans les filières des produits forestiers non ligneux en Afrique Centrale. GCP/RAF/408/EC. Etude de base du ndo’o (Irvingia gabonensis) au Centre, Sud et Littoral Cameroun. Yaoundé : CIFOR. Bahuchet S. 1996. La mer et la forêt : Ethnoécologie des populations forestières et des pêcheurs du Sud-Cameroun. In : Froment A, De Garine I, Binam Bikoï C, Loung J-F (eds.), Anthropologie alimentaire et développement en Afrique intertropicale: du biologique au social, Actes du colloque tenue à Yaoundé (1993). Paris : ORSTOM. Bawden RJ. 1991. Systems Thinking and Practice in Agriculture. J Dairy Sci 74: 2362-2373. Berkes F. 2005. Adaptive Collaborative Management and Complexity: Exploring the Many Faces of Collaborative management. Paper for the Adaptive Collaborative management Symposium, Wilfrid Laurier University, February 2005. 4 p.
152
Berkes F, Colding J, Folke C. 2000. Rediscovery of traditional ecological knowledge as adaptive management. Ecological Applications 10: 1251-1262. Brookfield H. 2002. Exploring Agrobiodiversity. NY: Columbia University Press. Brookfield H, Padoch C. 1994. Appreciating Agrobiodiversity: A look at the dynamism and diversity of indigenous farming practices. Environment 36(5): 6. Campbell BM, Hagmann J, Stroud A,Thomas R,Wollenberg E (eds.). 2006. Navigation amidst complexity: Guide to implementing effective research and development to improve livelihoods and the environment. Bogor : Center for International Forestry Research. Carrière S. 1999. Les orphelins de la forêt: Influence de l'agriculture itinérante sur brûlis de Ntumu et des pratiques agricoles associées sur les dynamiques forestière du sud Cameroun. Thèse de Doctorat. Montpellier : Université de Montpellier. 448p. Charyulu A S. 1999. Dissemination of Indigenous Knowledge: A wayto Sustainable Agriculture. Faculty Paper. Rajendranagar : National Institute of Agricultural Extension Management . Colfer CJP. 2005. The complex forest: Communities, Uncertainties and Adaptive Collaborative Management. Washington DC: RFF and Bogor : CIFOR. 370 p. Diaw MC. 1997. Si, Nda bot and Ayong: Shifting Cultivation, Land Use and Property Rights in southern Cameroon. London: ODI. Diaw MC, Oyono PR. 1998. Dynamiques et Représentations des Espaces Forestiers au Sud Cameroun: pour Une Relecture Sociale Des Paysages. Arbres, Forêts et Communautés Rurales (15/16): 36-43. Diaw MC, Colfer C, Prabhu R. 1999. Pour le suivi participatif et la cogestion adaptive des forêts tropicales africaines. Document de travail. Bogor : CIFOR. 14 p. Dietz T, Ostrom E, Stern P. 2003. The Struggle to Govern the Commons. Science 302(5652): 1907-1912. Dijk J FW Van. 1995. Assessment of NTFP resources in view of the development of sustainable commercial extraction. Wageningen: Wageningen Agricultural University. Dijk JFW Van. 1999. An assessment of Non-Wood Forest Products Resources for the Development of Sustainable Commercial Extraction. In: Sunderland TCH, Clark LEVantomme P (eds.), The NWFP of Central Africa: Current research issues and prospects for conservation and development. Rome : FAO.

153
Dounias E. 1996. Dynamique et gestion différentielle d'un système de production à dominance agricole des Mvae du Sud-Cameroun. These de Doctorat. Montpellier : Université des Sciences et Technique du Languedouc. 644p. Dounias E, Hladik M. 1996. Les agroforêts Mvae et Yassa au Cameroun Littoral: functions socio-culturelle, structure and composition floristique. In: Hladik A, Hladik CM, Pagezy H Linares OF Koppert GJA Froment A (eds.), L'alimentation en forêt tropicale : interactions socioculturelles et perspectives de développement. Paris: Editions UNESCO. pp 1103-1126. Ellis J. 1995. Climatic variability and complex ecosystem dynamics: implication for pastoral development. In: Scoones I (ed.), Living with Uncertainty: New directions in Pastoral development in Africa. London: Intermediate Technology Publications. pp 37-46. Eyzaguire PB. 2003. Cultural Factors and Crops Genetic Diversity. In: CIP-UPWARD in collaboration with GTZ, IDRC, IPGRI and SEARICE. Conservation and Sustainable Use of Agricultural Biodiversity. FAO. 1999a. Sustaining agricultural biodiversity and agro-ecosystem functions: Farming Systems Approaches for the Sustainable Use and Conservation of Agricultural Biodiversity and Agroecosystems. Rome: Food and Agriculture Organization of the United Nations (FAO). FAO. 1999b. Background Papers: Agricultural biodiversity. Food and Agriculture Organization of the United Nations (FAO)/Netherlands Conference on the Multifunctional Character of Agriculture and Land, Rome, Italy. FAO. 2005. Building on Gender, Agrobiodiversity and Local Knowledge. Rome: Food and Agriculture Organization of the United Nations (FAO). Folke C, Colding J, Berkes F. 2002. Building resilience for adaptive capacity in social-ecological systems. In: Berkes F, Folke C (eds.), Navigating Social-Ecological Systems: Building Resilience for Complexity and Change. Cambridge: Cambridge University Press. Gari AJ. 2001. Biodiversity and Indigenous Agroecology in Amazonia : The Indigenous Peoples of Pastaza. Etnoecologica Vol.5, No.7: 21-37. Gockowski J, Baker D. 1996. An ecoregional methodology for targeting resource and crop management research in the humid forest of Central and West Africa. 1996 Biennial Meeting of Rockefeller Social Science Research Fellows, Nairobi, Kenya. Gockowski J, Dury S. 1999. The economics of cocoa-fruit agroforests in southern Cameroon. IUFRO/ICRAF/CATIE International Conference on Multi-strata Agroforests, Turrialba Costa Rica.

154
Gockowski J, Tonye J, Baker D, Legg C, Weise S, Ndoumbé M, Tiki-Manga T, Fouaguégué A. 2004a. Characterization and diagnosis of farming systems in the ASB Forest Margins Benchmark of southern Cameroon. Study Report. Ibadan: IITA. Gockowski J, Weise SF, Sonwa DJ, Tchatat M, Ngobo MP. 2004b. Conservation because it pays: shaded cocoa agroforests in West Africa. Yaoundé: IITA-HFC. 29 p. Gockowski J, Tonye J, Diaw C, Hauser S, Kotto-Same J, Njomgang R, Moukam A, Nwaga A,Tiki-Manga T, Tondoh J, Tchoundjeu Z, Weise SW, Zapfack L. 2005. The Forest Margins of Cameroon. In: Palm CA, Vosti AS, Sanchez AP, Polly JE (eds.), Slash-and-burn Agriculture: The Search For Alternatives. New York: Columbia University Press. pp 305-331. Gunderson LH, Holling CS. 2002. Panarchy, Understanding Transformations in Human and Natural Systems. Washington: Islands Press. 507 p. Holling C. 2001. Understanding the complexity of economic, ecological, and social systems. Ecosystems 11: 41-47. Ickowitz A. 2006. Shifting Cultivation and Deforestation in Tropical Africa: Critical Reflections. Development and Change 37 (3): 599-626. Instone L. 2003. T(r)opical Translations : Reterritorialising the space of Biodiversity Conservation. Resource management in Asia-Pacific Program Working Paper No.46. Camberra: Research School of Pacific and Asian Studies/The Australian National University. Mala WA, Zoa F, Biyong M, Abéga P, Ela CV, Oyono PR, Diaw MC. 2006. Perceptions et connaissances locales des systèmes de gestion des forêts au Cameroun Méridional: instruments de prise de décision et d'aménagement durable. Rapport final de projet pour le compte du Projet de réhabilitation et redynamisation de la station de recherche d'Ipassa Makokou. Yaoundé: CIFOR. Mala WA, Geldenhuys CJ, Prabhu R. 2008. A predictive model of local agricultural biodiversity knowledge management in southern Cameroon. Biodiversity 9 (1 & 2): 96-101. Mala AW, Geldenhyus CJ, Prabhu R. In Preparation. Modelling Woody-Plant Domestication and Local Knowledge within Agricultural Landscape Mosaics in Southern Cameroon. MEA. 2005. Living Beyond Our Means: Natural Assets and Human Well-Being. Statement from the Board, Millennium Ecosystem Assessment. Washington DC: Island Press.

155
Ndoye O. 1995. Commercialization and Diversification Opportunities for Farmers in the Humid Forest Zone of Cameroon: The Case Study of Non-Timber Forest Products. Yaoundé: CIFOR. 42 p. Ndoye O. 1997. The impacts of macroeconomic and agricultural policies on forest conditions in Cameroon. Yaoundé: CIFOR. Ndoye O, Tieguhong JC. 2004. Forest resources and rural livelihoods: conflict between timber and non-timber forest products in the Congo Basin. Scandinavian Journal of Forest Research 19 (suppl.4): 36-44. Ndoye O, Ruiz-Perez M, Eyebe A. 1997. The markets of Non-timber Forest Products in the humid Forest Zone of Cameroon. Rural Development Forestry Network. Paper No 22c. London: ODI. Ndoye O, Ruiz-Perez M, Eyebe A. 1999. NTFP Markets and Potential Forest Resource Degradation in Central Africa. The Role of Research for a Balance Between Welfare Improvement and Forest Conservation. In: Sunderland TCH, Clark LE, Vantomme P (eds.), The NWFP of Central Africa: Current research issues and prospects for conservation and development. Rome: FAO. Ndoye O, Awono A, Preece L. 2006. Contribution of Non-Timber Forest Products to MDGs Evidence from CIFOR research in Central and West Africa. Communication made in CIFOR, Yaoundé, March 2006. Ngobo MP. 2002. Ecology and socio-economic importance of short fallows in humid forest zone of southern Cameroon. PhD Dissertation. Bangor: School of Agriculture/University of Wales, Bangor. Olsson P, Folke C, Berkes F. 2004b. Adaptive co-management for building resilience in socio-ecological systems. Environmental Management (34): 75-90. Olsson P, Folke C, Hahn T. 2004a. Socio-Ecological Transformations for Ecosystems Management: the Development of Adaptive Collaborative management of a Wetland Landscape in Southern Sweden. Ecology and Society 9(4). Oyono PR, Akwah G, Diaw MC, Jum C, Tiani A-M, Mala WA, Assembe S, Nguiébouri J, Ebene Y, Efoua S, Kouna C. 2003a. Developing Collaborative Monitoring for Adaptive Co Management of Tropical Forests (ACM). Final Report – Cameroon. Yaoundé: Center for International Forestry Research (CIFOR). Oyono PR, MalaWA, Tonyé J. 2003b. Rigidity versus adaptation: Contribution to the debate on agricultural viability and forest sustainability in southern Cameroon. Culture and Agriculture Vol. 25 (No.2 Fall 2003).
156
Oyono P R, Kouna C, Mala WA. 2005. Window on access to forest benefits in southern Cameroon. Global structure, social scene and decisionmaking/management hiccoughs. Forest Policy and Economics Management: Volume 7, Issue 3: 357-368 Oyono PR, Diaw MC, Efoua S, Mala WA, Assembe S. 2007. Issue-Appropriate Collaborative Monitoring: Examples From Forest Management in Cameroon. In: Gujit I (ed.), Learning from Collaborative Monitoring: Triggering Adaptation in Adaptive and Collaborative Management (ACM). Bogor: CIFOR. Palm AC, Vosti AS, Sanchez AP, Ericksen JP (eds.). 2005. Slash and Burn Agriculture: Search for Alternatives. New York : Columbia University Press. 461 p. Penkuri J, Jokinen P. 1999. The role of knowledge and spatial contexts in biodiversity policies: A sociological perspective. Biodiversity and Conservation 8: 761-147. Peterson G, Allen CR, Holling CS. 1998. Ecological resillience, biodiversity, and scale. Ecosystems (1): 6-18. Plummer R, Armitage D. 2006. A resilience-based framework for evaluating adaptive co-management: Linking ecology, economy and society. Ecological Economics 61 (2007): 62-74. Prabhu R, Ruitenbeek HJ, Boyle TJB, Colfer CJP. 2001. Between voodoo science and adaptive management: the role and research needs for indicators of sustainable forest management. In: Raison RJ, Brown AG, Flinn DW (eds.), Criteria and indicators for sustainable forest management. London: CABI-IUFRO. pp 39-66. Prabhu R. 2003. Developing collaborative monitoring for adaptive collaborative management of African Forests. Harare: CIFOR. Pretty J, Smith JD. 2004. Social capital in biodiversity conservation and management. Conservation Biology 18(5): 631-638. Reichhadrt LK, Mellink E, Nabhan PG, Rea A. 1994. Habitat Heterogeinity and biodiversity associated with the indigenous agriculture in the Sonoran desert. Etnoecologica Vol.2 No.3. Ruitenbeck JH, Cartier C. 2001. The Invisible Wand: Adaptive Co-Management as an Emergent Strategy in Complex Bio-economic Systems. Occasional Paper No 34. Bogor: Centre for International Forestry Research. Ruiz-Perez M, Ndoye O, Eyebe A. 1999. Marketing of non-wood forest products in the humid forest zone of Cameroon. Unasylva 198(50): 12-19.
157
Ruiz-Perez M, Ndoye O, Eyebe A, Puntodewo A. 2000. Spatial characterisation of non-timber forest products markets in the humid forest zone of Cameroon. International Forestry Review 2(2): 71-83. Sanchez AP, Palm AC, Vosti AS, Tomich PT, Kayoski J. 2005. Alternatives to Slash and Burn: Challenge and Approaches of an International Consortium. In: Palm AC, Vosti AS, Sanchez AP, Ericksen JP (eds.), Slash and Burn Agriculture: Search for Alternatives. New York: Columbia University Press. pp 3- 37. Scheffer M, Westley F, Brock WA, Holmgren M. 2002. Dynamics Interactions of Societies and Ecosystems-Linking Theories from Ecology, Economy and Sociology. In: Holling CS, Gunderson LH (eds.), Panarchy: Understanding Transformations in Human and Natural Systems. Washington DC: Island Press. Scoones I (ed.). 1995. Living with Uncertainty: New directions for Pastoral development in Africa. London : Intermediate Technology Publications. Sonwa JD. 2004. Biomass management and diversification within cocoa agroforests in the humid forest zone of southern Cameroon. PhD Dissertation. Bonn: Universitat Bonn. 112 p. Sunderland T, Ndoye O (eds.). 2004. Forest Products, Livelihood and Conservation. Cases studies of Non-Timber Forests Products Systems. Volume 2 – Africa. Bogor: CIFOR. 128 p. Sunderlin W, Ndoye O, Bikié H, Laporte N, Mertens B, Pokam J. 2000. Economic crisis, small-scale agriculture, and forest cover change in southern Cameroon. Environmental Conservation 27 (3): 284-290. Van Germeden BS, Olff H, Parren PE, Brongers F. 2003. The pristine rainforest? Remnants of historical impacts of current trees species composition and diversity. Journal of Biogeography 30: 1381-1390. Walker B, Holling CS, Carpenter SR, Kinzig A. 2004. Resilience, adaptability and transformability in social-ecological systems. Ecology and Society 9(2)(5). Winterhalder B, Goland C. 1997. An evolutionary ecology perspective on diet choice, risk, and plant domestication. In: Gremillian KJ (ed.), Peoples, Plants, and Landscapes: Studies in Paleoethnobotany. Tuscaloosa-Alabama: University of Alabama Press. Woodley E. 2004. Local and Indigenous Ecological Knowledge as An Emergent Property of A complex System : A case Study in The Solomon Islands. Bridging Scales and Epistemologies: Linking Local and Global Science in Multi-Scale Assessment, March, 17-20, 2004, Alexandria, Egypt.
158
CHAPTER SEVEN
PERCEPTIONS OF CLIMATE VARIABILITY, INCIDENCE OF PESTS AND DISEASES ON CROPS AND ADAPTIVE
MANAGEMENT PRACTICES AT THE FOREST-AGRICULTURE INTERFACE
7.1 INTRODUCTION During the last five years, there have been unprecedented shifts in the interests of the scientific community and international policy arena with the threatsof climate change and global warming. These shifts occur with the probable direct high effects of these two environmental narratives on global development and economic growth (MEA 2005). Climate change represents a nightmare scenario for the future of the people of Africa, the world's poorest continent (MEA 2005). Emerging analyses by the Stern Review into the economic impact of climate change suggests one of the poorest places on the planet will also be the worst affected. The consequence would be dramatic declines in rainfall and a fall in crop yields that could make previous famines look like small tragedies, and increase of bush fires in humid forest (UK Government 2006). There are likely to be severe water shortages and serious disturbances in the rainfalls patterns in many parts of the African continent. The disproportionate impact on Africa will be for a combination of reasons being political with more or less poor governance, weak institutional capacity and weak economic growth. The Stern Review (UK Government 2006) describes climate change as an economic externality and therefore addressing this externality should allow market forces to develop low carbon technologies. The report concludes that mitigation, i.e. addressing the issue, now is the best economic choice. Meantime, the early criticism of the Stern Review was that it is a political, rather than an analytical document (Nordhaus 2007). The review seems to have ignored historical human-nature relationships that are recognized as the major factors in the development of human societies and their adaptation to specific climatic conditions within the history of human kind (Richerson et al. 2001; Instone 2003a). For tens of thousands of years, humans were foragers, yet in a relatively short period (ca. 10,000 – 5,000 years ago) agricultural systems appeared in several widely separated parts of the Old and New World. By 2,000 years ago most human populations were dependent on agriculture. This subsistence shift radically transformed human ecology, social organization, demography, and even art and religion; yet we still do not have a widely agreed explanation for why (as opposed to how) it occurred (Rindos 1984; Winterhalder 1993; Winterhalder and Goland 1997). According to Winterhalder and Kennett (2006), two basic types of agriculture are revealed in archaeological records: (i) seed-crops with cereal grains (wheat, maize, rice) which grow in simple ecological communities (low species diversity); they are very productive, but unstable - cultivation requires constant human intervention (e.g. burning,

159
tilling, weeding, etc.); (ii) vegeculture with root crops and tree crops (cassava, yams, taro, avocado, potato) which grow in complex (multi-species) plant communities; they are less productive but more stable than seed-crops, but less labor inputs are needed. This suggests that seed-crop domestication took place primarily in arid regions with good archaeological preservation, while vegecultures originated in the moist tropics (poor preservation, difficult to locate sites). These findings also suggest that even the current natural resource management (NRM) practice of slash-and-burn agriculture or ‘shifting cultivation’ has a historical background and the practices associated with it, have been determined by adaptation of human-nature interactions to the climate variability, transitions of seasons, migrations and population pressure (Rindos 1980, 1989; Westphal et al. 1985; Winterhalder 1993; ASB 2000). Present consensus seems to be that while climate change may be a factor in the origins of agriculture, it is not sufficient in itself to justify the development of agriculture. The relationships between climate variability, transition of seasons and the spread/incidence of pests-diseases on crops is well documented all over the world (Weiss 1990; Altieri and Nicholls 1999; MEA 2005). This is also true for how activities such as agriculture, pastoralism, hunting, honey production and fishing, and the collection of non timber forest products are influenced by the management of local ecological knowledge and climate variability (Mviena 1970; Ellis 1995; Scoones 1995; Altieri 2002; Joshi et al. 2004). In Africa, agriculture is largely traditional and characterized by a large number of smallholdings with more or less one hectare per household. Crop production takes place under extremely variable agro-ecological conditions, with annual rainfall ranging from 250 to 750 mm in the Sahel in the northwest and in the semi-arid east and south, to 1500 to 4000 mm in the forest zones in Central and West Africa (FAO 1999; Abate et al. 2000). Besides this agro-ecological heterogeneity, the same research and development processes are often implemented without understanding the contextual economic and social constraints under which local pest management strategies take place. These processes focusing towards either the introduction of improved crop varieties or the use of pesticides mostly adapted for cash crops, were implemented irrespective of the role of knowledge and spatial contexts of agricultural biodiversity management (Penkuri and Jokinen 1999; Abate et al. 2000; Instone 2003a, b; Woodley 2004, 2005). Although many government extension programs encourage the use of pesticides, the majority of African farmers still rely on indigenous pest management approaches to manage pest problems (Abate et al. 2000). It has been shown that there is a high degree of uncertainty in the behaviour of many African ecosystems. This makes it difficult to predict the levels of production that a system might yield from year to year, and how ecosystem structure may change over time (Ellis 1995; Scoones 1995). African farmers have learned to deal with uncertainties by using complex plant communities, i.e. multi-species crops to reduce risks on yield and to influence their diverse range of social goals and definitions of well being (Scoones 1995; Altieri and Nicholls 1999; Smith and McSorely 2000; Winterhalder and Kennett 2006). Farmers often select well-adapted, stable crop varieties, and cropping systems are such that two or more crops are grown in the same field at the same time. These diverse traditional systems balance natural enemy abundance and generally keep pest numbers at
160
low levels (Abate et al. 2000; Smith and McSorely 2000; Altieri 2002). Pest management practice in traditional agriculture is a built-in process in the overall crop production system rather than a separate well-defined activity (Abate et al. 2000; Altieri 2002; Joshi et al. 2004). Economic and social constraints have kept pesticide use in Africa the lowest among all the world regions and these figures are not about to change (FAO 1999; Abate et al. 2000). Despite the huge investment made in pest management research activities in Africa with classical biological control and breeding of host plant resistance, except for classical biological control of the cassava mealy bug, research results have not been widely adopted in field management. This could be due to African farmers facing heterogeneous conditions, not needing fixed prescriptions or one ideal variety but a number of options and genotypes to choose from (Abate et al. 2000). Recent studies have shown that farmers learn through experimentation with the management of their crops and the effects of the incidence of pests/diseases on crop yields (Altieri and Nicholls 1999, 2002; Joshi et al. 2004; Van Mele and Van Chien 2004). Each season is an experiment during which new knowledge is obtained and new ideas are generated. This happens by considering market conditions or market access, the decision to diversify the number of farms and crops, and farmers’ social and livelihood goals. In Cameroon, farmers’ response to uncertainty is promoted by climate variability and seasonal transitions, by anticipating or delaying the field management activities such as clearing, burning, tillage, ridging, sowing, use of crop varieties and pesticides (Molua and Lambi 2007). In southern Cameroon, between 18 and 25 crop species can be found in a single mixed food-crop farm (Chapter 5, Table 5.3.10). The number of crop varieties of cassava (Manihot esculenta), plantain (Musa paradisiaca), groundnuts (Arachis hypogea) is variable (three to four) and it is largely influenced by farmers’ knowledge of their biophysical qualities such as resistance to pests and diseases, good taste and good yield in crop processing (Mala et al. 2008; Mala et al. in prep.; Chapter 6). This diversity of crop varieties seems to be a source of bio-ecological resilience. Local natural resource management decisions and practices are highly influenced by various forms of knowledge such as the bio-ecological indicators associated with the climate variability and transition of seasons (Altieri 2002; Joshi et al. 2004). However, the links between these forms of knowledge and the ability to adapt management practices to uncertainty generated by climate variability has yet to be examined. This understanding of resilience is required to build/develop adaptive capacity in social-ecological systems (Folke et al. 2002; Scheffer et al. 2002; Prabhu 2003). The relationships between the spatial distribution of agricultural biodiversity, the incidence and effect of pests-diseases on crop yield, the perception of climate variability, and the uncertainty conditions through which farmers adapt their agricultural practices, have received little attention and remain poorly analysed. This study was developed with the objective to examine the consequences of local perceptions of climate variability on the ability and adaptive capacity of farmers in slash-and-burn agriculture in southern Cameroon to use their local knowledge as well as to deal with pests-diseases on crop yield, their corrective management actions, and adaptive

161
management in slash-and-burn agriculture. The following questions were addressed: What are the perceptions of climate variability and how do these affect management activities in slash-and-burn agriculture? What are the perceptions and management actions to deal with pest-disease problems on the main crop species? How do local agricultural biodiversity knowledge systems help farmers to respond and adapt to the incidence of pests and diseases on crops? How do the socio-economic conditions of villages and farmers affect the management actions of pest-disease problems on the main crop species? The general hypothesis was that local perceptions of climate variability affect farmers’ pest-disease management strategies to respond and adapt slash-and-burn agricultural practices. 7.2. METHODS 7.2.1 Study area The study site is located in the forest margins of southern Cameroon where the Alternatives to Slash and Burn (ASB) program with their technological interventions and policy recommendations for the Congo basin conducted research (Gockowski et al. 2005). The 15 500 km2 benchmark area covers gradients in both intensity of resource use and population density. (i) The intensity of resource use is defined by the length of fallow which increases from the Yaoundé block (3.9 years), through the Mbalmayo block (5.4 years) to the Ebolowa block (7.5 years); (ii) The population density decreases from the Yaoundé block, with 30 to 90 people per square kilometer, through the Mbalmayo block, with 10 to 30 people per square kilometer, to the Ebolowa block, with less than 10 people per square kilometer, corresponding to high, medium and low levels of the population density gradient (Gockowski et al. 2004, 2005). The climate is equatorial and rain falls in a bimodal pattern with 1350 mm to 1900 mm per annum, and an increasing gradient from the northwest to the southeast. The climate-related constraints such as droughts and heavy rains, affect water availability and humidity extremes. This in turn affects the development of fungal/bacterial diseases and insect pests on food and tree crops, and the whole farming strategy and management of the land (Manyong et al. 1996; Gockowski et al. 2004). There is much variation between blocks for different important characteristics (Chapter 2, Table 2.3.2, 2.3.3). Market access is manageable in Ebolowa and Yaounde and manageable to good in Mbalmayo. Very few respondents in all three blocks considered market access as bad. Fifty five percent of farmers had an estimated land area of more than 20 ha, and 65% had an estimated annual revenue of more than CFA 350,000 (local currency) (see Table 2.3.3, Chapter 2). The most important agricultural land uses in the study area include food cropping systems such as groundnut/cassava-based mixed food-crop fields, cocoa plantations, and plantain/melon-based fields. They contain the crops which are susceptible to disease and pest attacks. For each of these crops, the associated diseases/pests have been identified in the literature as follows: cocoa with fruit rot; plantain with nematodes, sigatoka disease and cigar-end diseases; groundnuts with leaf-spot disease, root rot, rust, aflaroot and rosette-virus diseases; cassava with anthracnose, leaf spot, and tuber rots; and palm tree with blast, crown disease, vascular-wilt disease, trunk and bud rots (Westphal et al.
162
1985). Both the plantain and plantain/melon-based fields are generally targeted in the longer period fallow fields and secondary forests because of the better site conditons. Input intensive, horticultural monocrops and maize, intended for the fresh-produce market, are frequently encountered in the Yaoundé block, which has the best access to urban markets of the three blocks. Another process associated with increasing resource use intensification and farming system diversification is the number of different field types (Gockowski and Baker 1996). ASB survey results reveal that 62% of the households in the Yaoundé block had 5-8 distinct field types, versus only 28% in the Mbalmayo block and 44% in the Ebolowa block (Gockowski et al. 2004). The field management practices are greatest in Yaoundé block. The use of purchased input-improved varieties, pesticides, and fertilizers (with annual crops), was not common in the Mbalmayo block, was nearly non-existent for fertilizers and pesticides in the Ebolowa block. However, in the Yaoundé block, 56% of households used improved varieties, 39% used fertilizers and 51% used pesticides. The tillage before planting, the use of ridges and planting in rows was also more frequent in the Yaoundé block. The intensity of field management practices follows the resource use intensification gradient within the forest margins of southern Cameroon. These differences are very significant for the use of improved varieties, fertilizers, fungicides and insecticides (Gockowski et al. 2004). 7.2.2 Sampling methods Six villages were selected from within the humid forest benchmark area, with two in each block, to understand the decision-making processes behind the traditional practices for the management of the incidence of pests and diseases on crop species. The two top villages in terms of the higher intensity R&D activities were selected per block. The intensity of research activities was measured by three categories based on the monthly duration of the interventions (three days of activities; one week of activities; more then 10 days of activities). For each block, a matrix was used to categorize each village as low, medium and high intensity of research activities, using the different criteria. In each block the two villages with the highest rating were retained for this study. In each selected village, five households were sampled to give a total of 30 households (5*6=30) for the study. In each selected village, the five households were selected based on the criteria of their participation in the development and utilization of the innovations. These criteria included three categories: (i) farmers involved in on-farm research and testing the innovations; (ii) farmers who were not directly involved in on-farm research but who have received benefits from on-farm research and have tested them; (iii) those who were not involved in any activity and who did not test any innovations. A list of names of respondents in each category was compiled to select respondents based on the estimated proportion of each group (category) over the total numbers given by the village. Five crop species were selected from the more than 25 species for the assessment of the incidence of pests on crops and the strategies for their management. The criteria used for their selection were: (i) their economic importance; (ii) the high number of cultivars per crop species; (iii) the importance of crops for household consumption based on a
163
literature review; and (iv) the impact of pests on crop yields. The selected five crop species were cocoa, cassava, groundnuts, plantain and cocoyam. 7.2.3 Data collection The data were collected through household interviews, using a semi-structured questionaire (Appendix 1, Section 7), to analyse the relationships between the perception of climate stress, the incidence of pests-diseases on crops, and the adaptive management practices in slash-and-burn agriculture. Data on perceptions of the effect of climate variability on slash-and-burn agricultural practices based on local indicators were collected. A list of indicators was proposed to farmers for analysis and validation and eventual retention. Six indicators were retained and covered the following variables: (i) abundance of insects; (ii) severity of crop pests/diseases; (iii) appearance of new crop pest-disease species; (iv) disappearance of certain plant/crop species; (v) occurrence of extreme rainfall events or heavy rains; (vi) occurrence of extreme drought events or severity of drought. The evaluation was based on three categories or levels in terms of the agricultural calendar (low effects; medium effects; high effects) with four periods: today, 5 years ago, 10 years ago and 15 years ago. The perception of the impacts of selected local indicators of climate variability on the implementation of field management activities was assessed at three levels (low; medium; high). Following this, data on the perception of the effect of pests-diseases on crop yield/income for the five most important crops (cocoa, plantain, cassava, cocoyam and groundnuts) were collected. The assessment was based on three categories: low effects on yield/income; medium or manageable effects on yield/income; and high effects on yield/income. In addition, the management actions to mitigate the effects of pests-diseases on crop yield/income were recorded. Five actions were proposed to farmers who then discussed the relevance of each and validated them. Seven categories of action were used: nothing/no action; use of modern pesticides; abandonment of crop varieties; introduction of new crop varieties and tree species; introduction of improved varieties; introduction of new cropping practices; use of local pesticides. The adaptive local responses to the management of crop pests-diseases were recorded: rotation of crops between season/years; abandonment of a field to become fallow and opening of a new farm; modern farming methods such as the use of modern or local pesticides, insecticides and fertilizers, improved local varieties, etc. 7.2.4 Data analysis Data were computed in Excel and descriptive statistics were calculated using XLStat2007. The calculations were made based on the number of persons participating in the household survey over the total number of observations. For the calculation of the percentages, the minimum number of people who participated in the household discussions was considered, with generally three to five people per household. The number of responses per variable was expressed as percentage of total number of

164
respondents, i.e a total of 124 respondents with respectively 45 in Ebolowa, 42 in Mbalmayo and 37 in Yaoundé. Frequency tables and contingency tables were prepared to analyze the relationships between the crop pest-disease management strategies and perception of village market access, perception of climate variability/stress, farmer’s financial and natural capitals, and history of land uses. Several types of relationships were investigated including between perceptions of current climate variability and pest management strategies; between pest-disease management strategies and farmer’s financial and physical capital; between pest management strategies and former land use in the cropping-fallow-forest conversion cycles; and between perceptions of climate variability and the implementation of field activities. The results are based on data collected from household census within 30 households with the responses of the individual members of the households. Where perceptions were tested for the different years up to 15 years ago, it should be considered that the assessment for the current year would be more accurate than perceptions from memory for periods of 10 to 15 years ago. 7.3 RESULTS 7.3.1 Perception of climate variability/stress The surveyed farmers had different perceptions of changes in different factors used as indicators of climate variability (Table 7.3.1). (i) Perception of abundance of insects is that about 40% of the respondents considered this to be low, throughout the 15 years, but about 60% of the respondents had different opinions of the medium to high abundance. (ii) Perception ofsseverity of crop pests/diseases was high 15 years ago (65% of respondents), a low (47%) to medium (50%) 10 to 5 years ago, and currently low (87%). (iii) Perception of appearance of new plant species (invader species not used)was high (67%) 15 years ago, low (40%) to medium (43%) 10 to 5 years ago, but stable since the last five years (30%) with a current low appearance (44%). About 56% of the respondents had different opinions of the medium to high assessment of appearance of new plant species. (iv) Disappearance of certain plant species is that the perception was high 15 years ago (56%) but this rating of high decreased sharply to the present (21%), and 58% of respondents considered it as currently low (58%). (v) About the xtreme rainfall events or heavy rains,the perception was that 15 years ago the high or extreme rainfall events were few (low) (61%) and this changed to low to medium 10 years ago (50 to 43% respectively), to medium 5 years ago (63%), and to the current low (47%) to medium (47%). (vi) About extreme drought events, the perception 15 years ago was that it was low (71 %), which then changed to low to medium 10 years ago, to the current medium perception (53%).
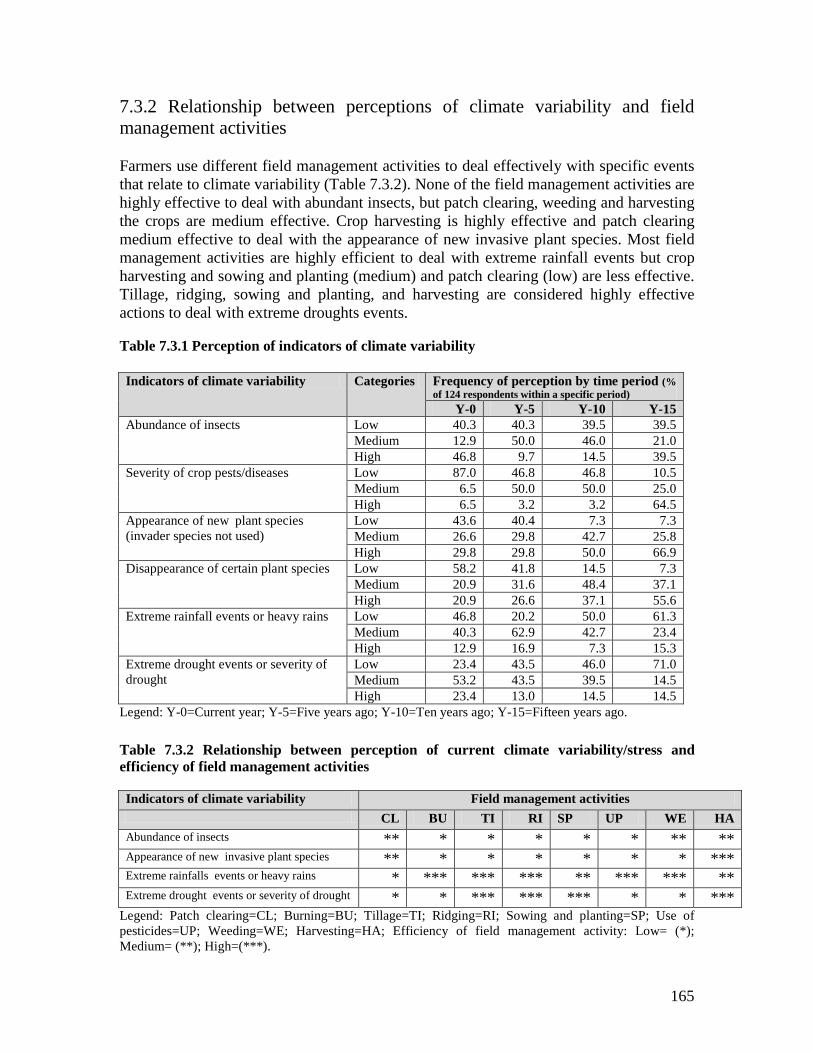
165
7.3.2 Relationship between perceptions of climate variability and field management activities Farmers use different field management activities to deal effectively with specific events that relate to climate variability (Table 7.3.2). None of the field management activities are highly effective to deal with abundant insects, but patch clearing, weeding and harvesting the crops are medium effective. Crop harvesting is highly effective and patch clearing medium effective to deal with the appearance of new invasive plant species. Most field management activities are highly efficient to deal with extreme rainfall events but crop harvesting and sowing and planting (medium) and patch clearing (low) are less effective. Tillage, ridging, sowing and planting, and harvesting are considered highly effective actions to deal with extreme droughts events. Table 7.3.1 Perception of indicators of climate variability Indicators of climate variability Categories Frequency of perception by time period (%
of 124 respondents within a specific period) Y-0 Y-5 Y-10 Y-15
Abundance of insects Low 40.3 40.3 39.5 39.5 Medium 12.9 50.0 46.0 21.0 High 46.8 9.7 14.5 39.5
Severity of crop pests/diseases Low 87.0 46.8 46.8 10.5 Medium 6.5 50.0 50.0 25.0 High 6.5 3.2 3.2 64.5
Appearance of new plant species (invader species not used)
Low 43.6 40.4 7.3 7.3 Medium 26.6 29.8 42.7 25.8 High 29.8 29.8 50.0 66.9
Disappearance of certain plant species Low 58.2 41.8 14.5 7.3 Medium 20.9 31.6 48.4 37.1 High 20.9 26.6 37.1 55.6
Extreme rainfall events or heavy rains Low 46.8 20.2 50.0 61.3 Medium 40.3 62.9 42.7 23.4 High 12.9 16.9 7.3 15.3
Extreme drought events or severity of drought
Low 23.4 43.5 46.0 71.0 Medium 53.2 43.5 39.5 14.5 High 23.4 13.0 14.5 14.5
Legend: Y-0=Current year; Y-5=Five years ago; Y-10=Ten years ago; Y-15=Fifteen years ago. Table 7.3.2 Relationship between perception of current climate variability/stress and efficiency of field management activities Indicators of climate variability Field management activities CL BU TI RI SP UP WE HA Abundance of insects ** * * * * * ** ** Appearance of new invasive plant species ** * * * * * * *** Extreme rainfalls events or heavy rains * *** *** *** ** *** *** ** Extreme drought events or severity of drought * * *** *** *** * * ***
Legend: Patch clearing=CL; Burning=BU; Tillage=TI; Ridging=RI; Sowing and planting=SP; Use of pesticides=UP; Weeding=WE; Harvesting=HA; Efficiency of field management activity: Low= (*); Medium= (**); High=(***).

166
7.3.3 Relationship between pest-disease management strategies and perceptions and characteristics of farmers and farms 7.3.3.1 Importance of different pest-disease management strategies used by farmers A high number of farmers (82%) follow a crop strategy whereby a field is abandoned to become fallow and a new patch is cleared for cultivation (Table 7.3.3). A few farmers (15%) use of modern farming methods (i.e. use chain saws to cut trees, improved seeds, modern pesticides and fertilizers) and the rest (3%) rotate crops between seasons/years. 7.3.3.2 Influence of current perceptions of climatic variability A majority of farmers (71%) following a crop management strategy whereby a field is abandoned to become fallow, and a new patch is cleared for cultivation, perceive that climate variability or stress is high (Table 7.3.3). All the farmers (100%) using modern farming methods to local pests-diseases perceive that climate variability or stress is medium. 50% of the farmers using rotation of crops between seasons/years as a means to manage pests/diseases perceive that climate variability or stress is high. 7.3.3.3 Influence of access to markets A high majority of farmers (85%) following a crop strategy whereby a field is abandoned to become fallow and a new patch is cleared for cultivation perceive that market access is acceptable (Table 7.3.3). All the farmers (100%) using modern farming methods to manage local pests-diseases perceive that market acccess is good while 75% of farmers rotating crops between seasons/years perceive that market acesss is good. 7.3.3.4 Influence of farmer’s financial capitals A majority of these farmers (73%) following a crop strategy whereby a field is abandoned to become fallow and a new patch is cleared for cultivation, have annual financial revenue of more than CFA350,000 (Table 7.3.3). All farmers (100%) using modern farming methods have an annual financial revenue of more than CFA350,000. 50% of farmers using rotation of crops between seasons/years have an annual financial revenue of more than CFA350,000 while 50% have annual financial revenue of less than CFA 300,000. 7.3.3.5 Influence of farmer’s physical capitals A high majority of the farmers (80%) following a crop strategy whereby a field is abandoned to become fallow, and a new patch is cleared for cultivation, have a natural capital of more than 20 ha (Table 7.3.3). A relative majority of farmers (53%) using modern farming methods have natural capital of more than 20 ha while 47% of them have a natural capital of less than 10 ha each. 50% of farmers using rotation of crops between seasons/years having a natural capital of more than 20 ha. 7.3.3.6 Influence of former land uses A relative high majority of farmers (49%) following a crop strategy whereby a field is abandoned to become fallows and a new patch is cleared for cultivation, use secondary forests as former land use (Table 7.3.3). 50% of farmers using modern farming methods
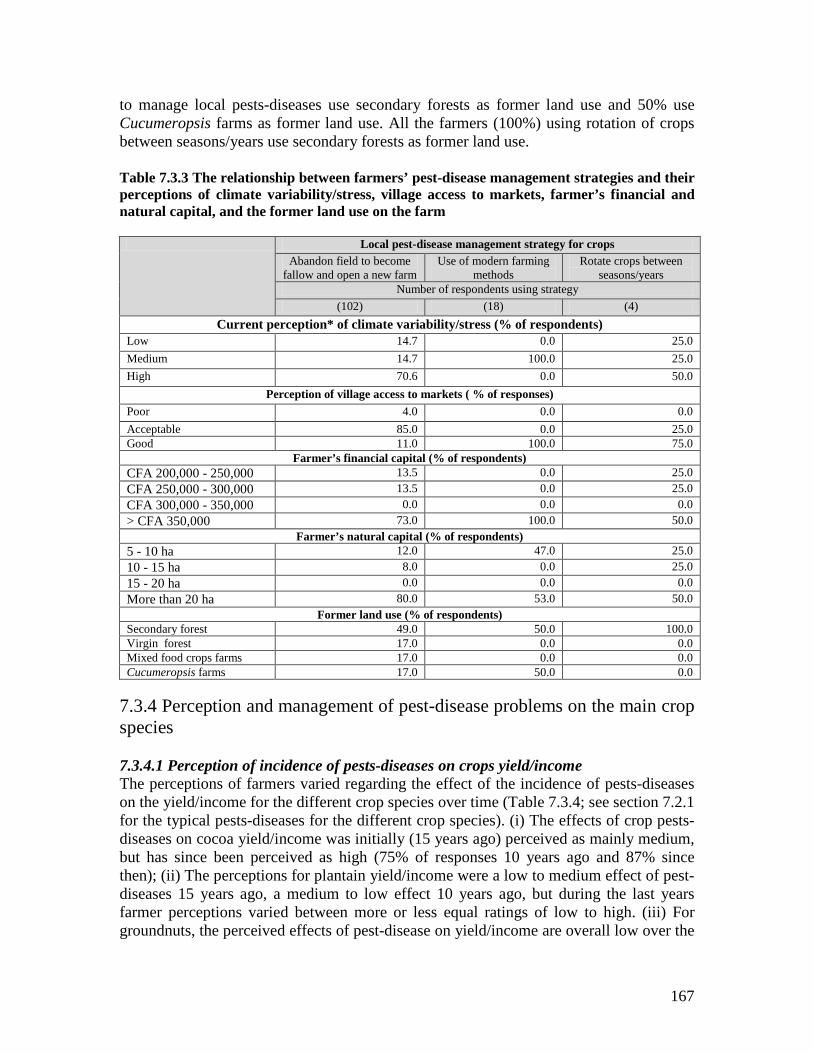
167
to manage local pests-diseases use secondary forests as former land use and 50% use Cucumeropsis farms as former land use. All the farmers (100%) using rotation of crops between seasons/years use secondary forests as former land use. Table 7.3.3 The relationship between farmers’ pest-disease management strategies and their perceptions of climate variability/stress, village access to markets, farmer’s financial and natural capital, and the former land use on the farm
Local pest-disease management strategy for crops Abandon field to become
fallow and open a new farm Use of modern farming
methods Rotate crops between
seasons/years Number of respondents using strategy
(102) (18) (4) Current perception* of climate variability/stress (% of respondents)
Low 14.7 0.0 25.0 Medium 14.7 100.0 25.0 High 70.6 0.0 50.0
Perception of village access to markets ( % of responses) Poor 4.0 0.0 0.0 Acceptable 85.0 0.0 25.0 Good 11.0 100.0 75.0
Farmer’s financial capital (% of respondents) CFA 200,000 - 250,000 13.5 0.0 25.0 CFA 250,000 - 300,000 13.5 0.0 25.0 CFA 300,000 - 350,000 0.0 0.0 0.0 > CFA 350,000 73.0 100.0 50.0
Farmer’s natural capital (% of respondents) 5 - 10 ha 12.0 47.0 25.0 10 - 15 ha 8.0 0.0 25.0 15 - 20 ha 0.0 0.0 0.0 More than 20 ha 80.0 53.0 50.0
Former land use (% of respondents) Secondary forest 49.0 50.0 100.0 Virgin forest 17.0 0.0 0.0 Mixed food crops farms 17.0 0.0 0.0 Cucumeropsis farms 17.0 50.0 0.0
7.3.4 Perception and management of pest-disease problems on the main crop species 7.3.4.1 Perception of incidence of pests-diseases on crops yield/income The perceptions of farmers varied regarding the effect of the incidence of pests-diseases on the yield/income for the different crop species over time (Table 7.3.4; see section 7.2.1 for the typical pests-diseases for the different crop species). (i) The effects of crop pests-diseases on cocoa yield/income was initially (15 years ago) perceived as mainly medium, but has since been perceived as high (75% of responses 10 years ago and 87% since then); (ii) The perceptions for plantain yield/income were a low to medium effect of pest-diseases 15 years ago, a medium to low effect 10 years ago, but during the last years farmer perceptions varied between more or less equal ratings of low to high. (iii) For groundnuts, the perceived effects of pest-disease on yield/income are overall low over the
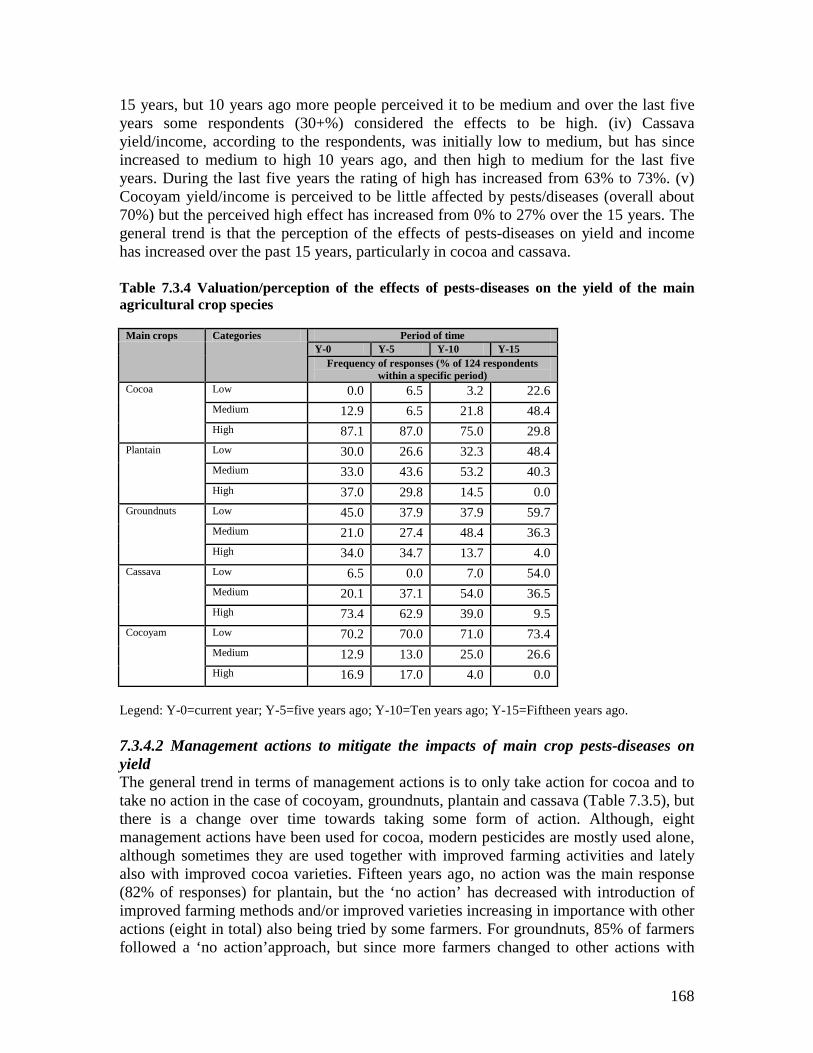
168
15 years, but 10 years ago more people perceived it to be medium and over the last five years some respondents (30+%) considered the effects to be high. (iv) Cassava yield/income, according to the respondents, was initially low to medium, but has since increased to medium to high 10 years ago, and then high to medium for the last five years. During the last five years the rating of high has increased from 63% to 73%. (v) Cocoyam yield/income is perceived to be little affected by pests/diseases (overall about 70%) but the perceived high effect has increased from 0% to 27% over the 15 years. The general trend is that the perception of the effects of pests-diseases on yield and income has increased over the past 15 years, particularly in cocoa and cassava. Table 7.3.4 Valuation/perception of the effects of pests-diseases on the yield of the main agricultural crop species
Main crops Categories Period of time Y-0 Y-5 Y-10 Y-15
Frequency of responses (% of 124 respondents within a specific period)
Cocoa Low 0.0 6.5 3.2 22.6
Medium 12.9 6.5 21.8 48.4
High 87.1 87.0 75.0 29.8
Plantain Low 30.0 26.6 32.3 48.4
Medium 33.0 43.6 53.2 40.3
High 37.0 29.8 14.5 0.0
Groundnuts Low 45.0 37.9 37.9 59.7
Medium 21.0 27.4 48.4 36.3
High 34.0 34.7 13.7 4.0
Cassava Low 6.5 0.0 7.0 54.0
Medium 20.1 37.1 54.0 36.5
High 73.4 62.9 39.0 9.5
Cocoyam Low 70.2 70.0 71.0 73.4
Medium 12.9 13.0 25.0 26.6
High 16.9 17.0 4.0 0.0
Legend: Y-0=current year; Y-5=five years ago; Y-10=Ten years ago; Y-15=Fiftheen years ago. 7.3.4.2 Management actions to mitigate the impacts of main crop pests-diseases on yield The general trend in terms of management actions is to only take action for cocoa and to take no action in the case of cocoyam, groundnuts, plantain and cassava (Table 7.3.5), but there is a change over time towards taking some form of action. Although, eight management actions have been used for cocoa, modern pesticides are mostly used alone, although sometimes they are used together with improved farming activities and lately also with improved cocoa varieties. Fifteen years ago, no action was the main response (82% of responses) for plantain, but the ‘no action’ has decreased with introduction of improved farming methods and/or improved varieties increasing in importance with other actions (eight in total) also being tried by some farmers. For groundnuts, 85% of farmers followed a ‘no action’approach, but since more farmers changed to other actions with
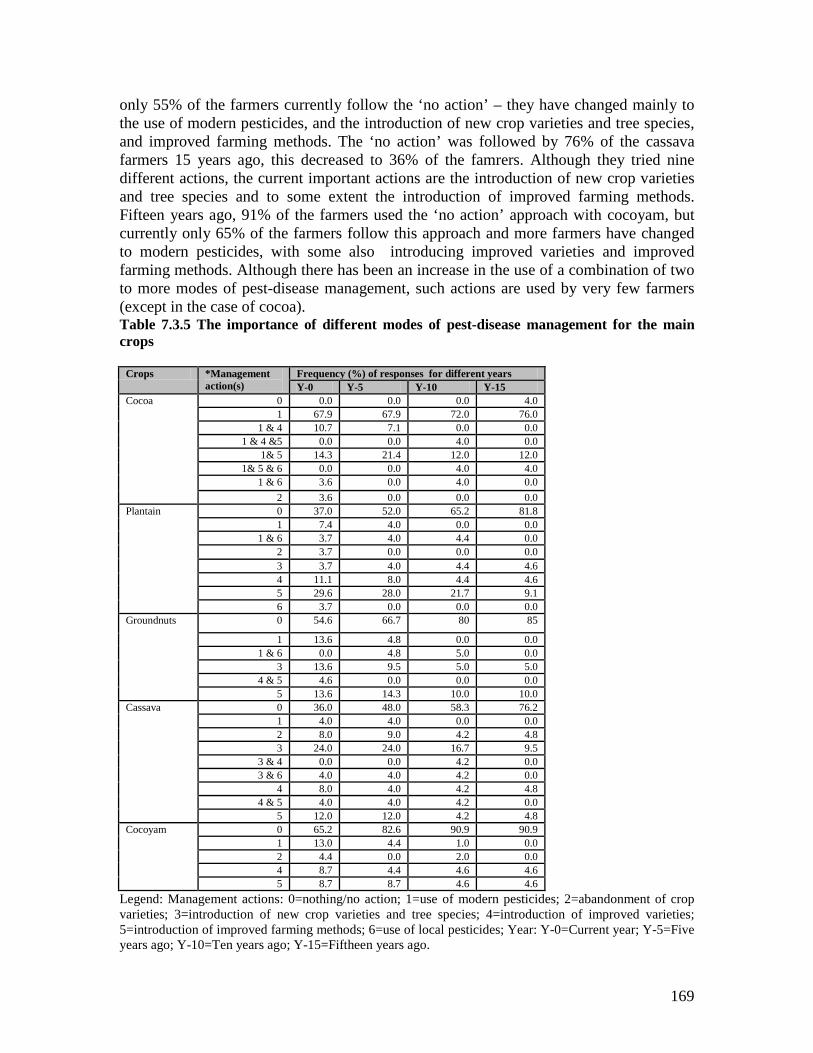
169
only 55% of the farmers currently follow the ‘no action’ – they have changed mainly to the use of modern pesticides, and the introduction of new crop varieties and tree species, and improved farming methods. The ‘no action’ was followed by 76% of the cassava farmers 15 years ago, this decreased to 36% of the famrers. Although they tried nine different actions, the current important actions are the introduction of new crop varieties and tree species and to some extent the introduction of improved farming methods. Fifteen years ago, 91% of the farmers used the ‘no action’ approach with cocoyam, but currently only 65% of the farmers follow this approach and more farmers have changed to modern pesticides, with some also introducing improved varieties and improved farming methods. Although there has been an increase in the use of a combination of two to more modes of pest-disease management, such actions are used by very few farmers (except in the case of cocoa). Table 7.3.5 The importance of different modes of pest-disease management for the main crops
Crops *Management action(s)
Frequency (%) of responses for different years Y-0 Y-5 Y-10 Y-15
Cocoa 0 0.0 0.0 0.0 4.0 1 67.9 67.9 72.0 76.0
1 & 4 10.7 7.1 0.0 0.0 1 & 4 &5 0.0 0.0 4.0 0.0
1& 5 14.3 21.4 12.0 12.0 1& 5 & 6 0.0 0.0 4.0 4.0
1 & 6 3.6 0.0 4.0 0.0 2 3.6 0.0 0.0 0.0
Plantain 0 37.0 52.0 65.2 81.8 1 7.4 4.0 0.0 0.0
1 & 6 3.7 4.0 4.4 0.0 2 3.7 0.0 0.0 0.0 3 3.7 4.0 4.4 4.6 4 11.1 8.0 4.4 4.6 5 29.6 28.0 21.7 9.1 6 3.7 0.0 0.0 0.0
Groundnuts 0 54.6 66.7 80 85
1 13.6 4.8 0.0 0.0 1 & 6 0.0 4.8 5.0 0.0
3 13.6 9.5 5.0 5.0 4 & 5 4.6 0.0 0.0 0.0
5 13.6 14.3 10.0 10.0 Cassava 0 36.0 48.0 58.3 76.2
1 4.0 4.0 0.0 0.0 2 8.0 9.0 4.2 4.8 3 24.0 24.0 16.7 9.5
3 & 4 0.0 0.0 4.2 0.0 3 & 6 4.0 4.0 4.2 0.0
4 8.0 4.0 4.2 4.8 4 & 5 4.0 4.0 4.2 0.0
5 12.0 12.0 4.2 4.8 Cocoyam 0 65.2 82.6 90.9 90.9
1 13.0 4.4 1.0 0.0 2 4.4 0.0 2.0 0.0 4 8.7 4.4 4.6 4.6 5 8.7 8.7 4.6 4.6
Legend: Management actions: 0=nothing/no action; 1=use of modern pesticides; 2=abandonment of crop varieties; 3=introduction of new crop varieties and tree species; 4=introduction of improved varieties; 5=introduction of improved farming methods; 6=use of local pesticides; Year: Y-0=Current year; Y-5=Five years ago; Y-10=Ten years ago; Y-15=Fiftheen years ago.
170
7.4 DISCUSSION 7.4.1 Perception of climate variability, uncertainty and pest-disease management strategies The results show that the values given in Table 7.3.1 on local indicators of climate variability fluctuate widely within the periods and the categories of assessment - indicating that there is no pattern. This may be justified by the macroclimatic differences observed within the equatorial climate and the regimes of rainfall with a bimodal pattern varying from 1350 mm to 1900 mm per annum, and with an increasing gradient of this rainfall from the northwest to the southeast within the study area (Chapter 2 Section 2.1). This result may also be attributed to the high degree of uncertainty in the behaviour of many African ecosystems that make it difficult to predict the levels of production that a system might yield from year to year, and how ecosystem structure may change over time (Ellis 1995; Scoones 1995). This result also shows how the traditional knowledge of climatic and environmental conditions help African farmers to learn to deal with uncertainties by using complex plant communities, i.e. multi-species crops to reduce risks on yield and to influence their diverse range of social goals and definitions of well-being (Scoones 1995; Altieri and Nicholls 1999; Smith and McSorely 2000; Winterhalder and Kennett 2006; Chapter 2, Table 2.3.3; Chapter 3, Table 3.3.1). The results show that 82% of farmers follow a crop management strategy whereby a field is abandoned to become fallow and a new patch is cleared for cultivation (Table 7.3.2). This may be justified by the fact that most of the farmers in the study area use slash-and-burn agriculture; this practice is characterized by an alternation between a period of cultivation of a patch and a period of abandonment of a farm for the restoration of soil fertility. The conversion cycle attached to this alternation begins with the clearing and burning of the forest for the Cucumeropsis agroforest followed by the implementation of other agricultural land uses depending on the household and income generation perspectives (Chapter 5, 5.3.12). The results show that there are variations in the use of specific crop management strategies between the categories of the current perception of climate variability with 71% of farmers perceiving that climate variability or stress is high. This may be justified by the fact that some of the indicators of climate variability do not have the same weight in the respondents’ assessment; some factors help to predict or to manage others. For example, the knowledge of behavior of some insect species are used by farmers to predict the level of severity of the dry season and/or the rainy season; if the climatic events are extreme, this may have some implications for the level of severity of crop pests/diseases. The results also show that 20% of farmers use appropriate farming methods and rotation of crops between seasons/years to manage local pests-diseases with a majority perceiving that climate variability or stress is medium to high. This may be justified by the differences in the intensity of field management practices that follows the resource use intensification gradient within the forest margins of southern Cameroon (Gockowski et al. 2005). This result suggests that that pest-disease management practices in traditional
171
agriculture is a built-in process in the overall crop production management system rather than a separate well-defined activity (Abate et al. 2000; Altieri 2002; Joshi et al. 2004). However, in the scientific literature, the climatic conditions affect biotic processes with micro-organisms (virus, bacteria and fungi) responsible for crop pests and diseases. The spread or incidence of pests and diseases is highly influenced by climatic conditions, mainly by alternation between seasons, level of rainfall and severity of the dry season (Weiss 1990; Altieri 2002). This result confirms that the relationships between farmers, biodiversity and plant protection cannot be analyzed from a linear perspective but needs to take into account the learning cycle through which farmers operate (Abate et al. 2000; Altieri 2002; Van Mele and Van Chien 2004). It has been shown that the farmers obtain knowledge through experimentation on an everyday basis, and is part of their agricultural activities, not separated from them, while the conventional practices tend to understand this climate variability and the incidence of pests on crops from a highly technical a top-down perspective (Van Mele and Van Chien 2004; Vernooy and Song 2004). 7.4.2 Relationship between perceptions of climate variability and field management activities The results show that most field management activities are highly efficient to deal with extreme rainfall events but crop harvesting and sowing and planting (medium) and patch clearing (low) are less effective. This difference in perception may be attributed to the fact that the knowledge of the regimes of rainfall is one of factors that determine the management of field activities and the allocation of time to others non agricultural activities. Meantime, the perception of extreme drought events seems to be a limiting factor for the management of field activities taking place after clearing and burning. This result confirms the idea that farmers operate under uncertainty with no meteorological information on weather for their calendar of activities; they rely mostly on the knowledge and experiences of agro-climatic indicators for time management and in the predictions of the length of the rainfall or drought periods (Chapter 3, Table 3.3.6). The fact to have an abundance of insects and the appearance of new invasive plant species with low effects on field management activities except for harvesting, may indicate that these factors does not have an influence on field activities compared to the others listed (Table 7.3.1). These results also suggest that the local indicators of the perception of climate variability are not the only factors which contribute to the understanding of the link between the perception of climate and pest-disease management strategies, but may also be the local perceptions of the natural world and of the relationship between the components of the vital space (Chapter 3, Table 3.3.1, 3.3.2). 7.4.3 Relationship between pest-disease management strategies and perceptions and characteristics of farmers and farms 7.4.3.1 Importance of different pest-disease management strategies used by farmers The results show that a higher number of farmers (82%) follow a crop strategy whereby a field is abandoned to become fallow and a new patch is cleared for cultivation (Table 7.3.3). This may be justified by the fact that most people in the study area practice slash-

172
and-burn agriculture; it is characterized by a period of cultivation followed by a period of abandonment of a patch to enable land for restoring soil fertility. Different ages of vegetation are used for each appropriate farming system, ranging from young fallow with mixed food crops to Cucumeropsis farms with young to old secondary forest (Chapter 5, Table 5.3.4, 5.3.5). The results also show that few farmers (15%) modern farming methods (i.e. make use of machines to cut trees, improved seeds, modern pesticides and fertilizers). This may be justified by the recent introduction of oil palm plantations in the study area, particularly in the Ebolowa block, and the cultivation of horticultural products in the Yaoundé block. These cropping systems require the use of appropriate field management practices with an intense use of agricultural inputs.The results show that only 3% of farmers rotate crops between seasons/years. This may be justified by the gradient of resource use intensification that decreases from the Yaoundé to Ebolowa blocks. This percentage may be confirmed in Yaoundé where the intensification gradient is high (Gockowski et al. 2004, 2005). 7.4.3.2 Influence of access to markets The results show that the majority of farmers (71%) following a crop management strategy whereby a field is abandoned to become fallow and and a new patch is cleared for cultivation perceive that climate variability or stress is high (Table 7.3.3). This may be justified by the fact very few respondents in all three blocks considered market access as bad (Chapter 2, Table 2.3.2). This result confirms that market access is manageable in Ebolowa and Yaoundé and manageable to good in Mbalmayo, and shows that rotation of crops and use of appropriate field management methods are mainly used with good market access (Table 7.3.3). This strategy is relatively higher associated with manageable market access and relatively well associated with good markets, such as people close to urban towns where the size of market demand is high (ASB 2000; Gockowski et al. 2004, 2005). These results indicate that the perception of a good market may be the driving factor for crop rotation and use of appropriate land use even if the responses are given by few people, i.e. those practicing crop rotation around Yaoundé (Chapter 2, Table 2.3.3). These rotations are made between horticultural crops, mixed food crops and maize production systems. The cultivation of horticultural crops require an intensive field management exercise with fertilizers, pesticides, fungicides and insecticides; it has been shown the intensity of field management practices follows the decreasing gradient of natural resource use intensification within the forest margins (Gockowski et al. 2004, 2005). This is confirmed by previous results which have shown that in Yaoundé block, 56% of households used improved varieties, 39% used fertilizers and 51% used pesticides. This result confirms also the occurrence of rotation practices in Yaoundé block, mainly between mixed food crops and horticultural crops and/or monocropping systems such as maize, practiced by 74% of the households and as the second most frequent cropping system in the intensification blocks (Gockowski et al. 2004, 2005). 7.4.3.3 Influence of the financial and physical capital of farmers The results show that the majority of farmers (73%) following a crop strategy whereby a field is abandoned to become fallow and a new patch is cleared for cultivation have
173
annual financial revenue of more than CFA350,000 (local currency; Table 7.3.3). This may be justified by the differences observed in the estimated annual revenue with 65% of respondents having an estimated annual revenue of more than FCFA350 000 and the variations observed in the use of specific crop strategies between categories of financial capital. This result suggests that farmers with a high annual income tend to use only modern pesticides in cocoa plantations, palm tree stands and Cucumeropsis farms, easily introduce new cropping practices in plantain farms and new food crop varieties such as maize. These farmers target specific market-oriented crops such as maize, cocoyam, oil palm, melon seed and plantain (Table 7.3.3). Farmers with a medium or low annual income tend to combine several management options to mitigate the incidence and effects of pests and diseases on crop yield/income (Table 7.3.3). There are important block effects because farmers with the higher annual income come mainly from Mbalmayo and Yaoundé blocks (Chapter 2, Table 2.3.3). The results also show that a majority of farmers (80%) following a crop strategy whereby a field is abandoned to become fallow and a new patch is cleared for cultivation have a natural capital of more than 20 hectare of land (Table 7.3.3). This may be justified by the differences observed in the estimated natural capital with a relative high majority of respondents (55%) having more than 20 hectare. This may lead to the variations observed in the used crop strategies between physical capital categories. It is therefore expected that most of the farmers with land >20 hectare will adopt the strategy to abandon land to become fallow and then open up new farms. There are therefore other factors that also determine the adoption of this land management strategy such as the perception of market access and distance to the most important markets, and the estimated annual revenues (Chapter 2, Table 2.3.3). The estimated annual income and land size of farmers affect not only respondents’ resource management strategies, but also the level of intensification, diversification and commercialization strategies of crops within the specific socio-economic and biophysical context (Chapter 2, Table 2.3.3; Gockowski et al. 2004, 2005). This is an important area to explore if someone wants to deal with collective action that link the level of income, the pest-disease management strategy at landscape level and the farmers’ level of estimated land area (Prabhu 2003; Gockowski et al. 2004, 2005; Campbell et al. 2006). The results suggest that farmers with higher annual income are those who use mainly the crop strategy whereby field is abandoned for fallow and utilization of appropriate farming methods as pest-disease crop management strategy while farmers with estimated land less than 20 ha tend to use rotation of crops between seasons/years and appropriate farming methods i.e. they are more subject to intensification. This trend confirms that the field management intensity follow the decreasing gradient of the natural resource use intensification of the forest margins benchmark area (Gockowski et al. 2004). 7.4.3.4 Influence of former land uses within the cropping-fallow-forest conversion cycles The results show that the relative high majority of farmers (49%) following a crop strategy whereby a field is abandoned to become fallows and a new patch is cleared for cultivation use secondary forests as former land use (Table 7.3.3). Secondary/degraded

174
forest preceded most of the current land uses in the study area (Chapter 5, Table 5.3.4, 5.3.5). These results indicate that the knowledge of environmental conditions affect in some way the differences observed in the ratings of crop pest-disease management strategies but this incidence may be reduced with the duration of the fallow. There are variations in the use of former land between secondary forest and the other land uses. They result from differences in the knowledge of respondents and in the availability of different types of land uses, their characteristics and the knowledge of indicators of suitable forest and agricultural sustainability (Chapter 4, Table 4.3.3). The absence of the link between pest-disease management strategies and former land use of the specific current land use is partly due to the fact that the yield from the cultivation of certain crops, such as melon seed, is seriously affected by pests-diseses. That is why there is a collective mechanism that regulates its cultivation to every second year in order to break the cycles of associated insects (pests). 7.4.4 Perceptions of incidence of pests-diseases and management actions to mitigate crop pests-diseases on yield and/or income The results show that the perception of the incidence of pests-diseases of crop yield/income has increased over the past 15 years for cocoa (70% of responses) and cassava (46% of responses) (Table 7.3.4). Concerning cocoa, this result may be attributed to the weak management in the cocoa plantations since the withdrawal of the State from the commercialization and production of cocoa in the 1990’s. Since this withdrawal, very few farmers are able to properly conduct cocoa field management practices such as the use of pesticides for the treatment of cocoa fruits which are susceptible to fruit rot, considered as one of the main causes of cocoa production loss (Gockowski et al. 2004, 2005). This result confirms the differences existing in the use of fungicides and insecticides within the forest margins that follow the increasing gradient of natural resource use intensification within the study area (Gockowski et al. 2004, 2005). Concerning cassava, this result may be attributed to the socio-economic importance of cassava in terms of household consumption and income generation, and also because it is one of the key crops for the most important cropping system of the study area, called groundnut field (afub owondo). The two dominant crops of this system are cassava considered as a chief starch source and groundnuts as the chief source of plant protein. This result also confirms the figures already shown in the socio-economic and biophysical macro-characterisation of the study area with the high rate of pests-diseases observed for cassava and cocoa (Manyong et al. 1996; ASB 2000; Gockowski et al. 2004, 2005). These results concerning cocoa confirm the high pest management associated with cocoa plantations in the study which increase following the resource use intensification gradient (Gockowski et al. 2005). The relative high level of no action as management actions should not be understood only by no activity; this may represent the time during which the farmer’ learning and understanding processes of the behaviour of crops and the pests-diseases within its environment take place. This day-by-day learning process has been already mentioned in several studies which have shown that the farmers accumulate their knowledge on crop qualities to be used for predictions of future events taking place
175
in the field and crop management (Abate et al. 2000; Haverkot and Risk 2004; Joshi et al. 2004). The results show that the use of local pesticides represent a very low percentage for the five selected crops; this may be attributed to the fact that farmers have other strategies to cope with the uncertainty of pests-diseases on crops such as the use of complex plant communities’ i.e. multi-species crops (Altieri and Nicholls 1999; Abate et al. 2000; Altieri 2002). The uses of multi-species crops are based on the knowledge of crop qualities such as the resistance to pests/diseases; this result confirms that there is already a threshold of ability of farmers to deal with pests-diseases that starts with the knowledge of qualities for the selection of crop varieties/cultivars (Chapter 6, Table 6.3.2, 6.3.3). It has been shown that farmers often select well-adapted, stable crop varieties; more than two crops are often cultivated and for each crop, several varieties are grown in the same field at the same time. These diverse and complex traditional systems often reduce natural enemies’ abundance and generally keep pest-disease numbers at low levels. This result confirms the fact that pest-disease management practices in traditional agriculture are a built-in process in the overall crop production system rather than a separate well-defined activity (Altieri and Nicholls 1999; Abate et al. 2000; Altieri 2004). The results show that the general trend is to only take action for cocoa and to take no action in the case of cocoyam, groundnuts, plantain and cassava (Table 7.3.5), but there is a change over time to take some form of action. This trend may be justified by the differences in the socio-economics of the five main crops and the nature of field activities required to keep a threshold of yield in order to satisfy both household consumption and income generation. The results also show that there are variations in the use of eight management actions between their use for cocoa and the other four crops, but also in the use of modern pesticides that are mostly used alone, but sometimes it is used together with improved farming activities and lately also with improved cocoa varieties. These differences may be justified by the level of intensity of field management activities required for each crop and of the respondent’s knowledge of specific use of complex multi-species crops. The current period of time represents the relatively high percentage for the introduction of new crop varieties, of improved varieties and improved farming methods for cassava, cocoyam and plantain with the development of innovations. This period may be justified by the increased intensity of R&D of forest-agriculture innovations in the study area; a period characterized by different levels of involvement of the population in the R&D activities regarding technical, commercial/market and socio-organizational aspects which show the same proportions in all three blocks of the study area (Chapter 2, Table 2.3.2). 7.4.5 General discussion We started this chapter by challenging the prescriptive solutions for pests-diseases in crop management in Africa based on the use of pesticides and of improved varieties, that have touched only a very few number of farmers due to economic and social constraints (Abate et al. 2000). There is a need for building an adaptive management approach to deal with crop pests-diseases based on the understanding of the resilience of local pest-

176
disease management strategies that contribute to sustainable slash-and-burn agriculture outcomes where climate variability promotes uncertainty (Ellis 2002; Folke et al. 2002; Scoones 2002). The results show that the six local indicators used to capture farmers’ perception of climate variability fluctuate too much (Table 7.3.1) and this confirms the high degree of uncertainty that characterizes the behaviour of climate and that influences human life-style, field management activities and the agricultural calendar (Ellis 2002). The results also show that the local pest management strategies are dynamic processes that take place each farming season; it is an outcome of learning, reasoning and perception, and a basis for perceptions of future events that link field management activities to crop uses both for household consumption and income generation (Chapter 3, Table 3.3.1, 3.3.3, 3.3.6; Joshi et al. 2004). Each farming season is an experiment in which new knowledge is obtained and new ideas are generated from the field management activities. This happens by considering market conditions or market access, the decision to diversify the number of farms and crops, and farmers’ social and livelihood goals (Den Biggelaar et al. 1996; Altieri and Nicholls 1999; Chapter 2, Table 2.3.3; Van Mele and Van Chien 2004). Although, the results show that the perception of climate variability influence pest-disease management via related field management activities; the occurrence of heavy rains could affect the proper use of pesticides and may also result in the anticipation or delay of the field management activities such as burning and tillage. These activities are often perceived as the one that mitigate the spread of weeds considered as host of vectors of pests-diseases (Westphal et al. 1985; Molua and Lambi 2007). However, the respondents’ pest-disease management strategies are also influenced by their heterogeneous socio-economic context characterised by their ability to fill both their consumption needs and market preferences (Chapter 2, Table 2.3.3; Chapter 6, Table 6.3.2, 6.3.3, 6.3.4). This ability is based on the management of a range of crop varieties with diverse qualities. In the study area, up to 25 crop species can be found in a single mixed food-crop farm. The number of crop varieties of cassava (Manihot esculenta), plantain (Musa paradisiaca), groundnuts (Arachis hypogea) is variable (three to four) and largely influenced by farmers’ knowledge of their biophysical qualities such as resistance to pests and diseases, good taste and good yield in crop processing (Chapter 6, Table 6.3.4; Mala et al. 2008; Mala et al. in prep.). This confirms the fact that African farmers face heterogeneous conditions, not needing fixed prescriptions or one ideal variety but a number of options and genotypes to choose from (Abate et al. 2000; Altieri 2002; Joshi et al. 2004). The perception of high incidence/effects of pest-disease problems on the yield of cocoa, plantain and cassava is more significant than on the other crops (Table 7.3.4). These results suggest the more the economic importance of a crop, the more it is affected by pests-diseases. This is justified by the increased demand for crop production in Africa correlated with increased population pressure that has necessitated agricultural expansion, as well as an increase in plant material movement that in turn has facilitated the accidental introduction of local and foreign pests-diseases (Abate et al. 2000; Fomekong et al. 2008). Even if a high number of farmers indicate that they do not take any action for several of these crops in case of pests-diseases, this should be taken by caution. This time
177
is probably the one taken by the farmers to learn from the behaviour of its crops in the plots. At the plot, it seems that each crop has its own specific management practices to mitigate pests-diseases which is determind not only by the perception of climate variability but also by the knowledge of crop behaviour and the experiences in farming. These pest-disease management practices are based on one or more management actions ranging from the use of modern or local pesticides, abandonment of varieties, introduction of improved varieties of specific crop species or new varieties and tree crop species, and introduction of new farming practices. The use of these combinations illustrates the complexity of local management and the challenge to avoid prescriptive solutions for pest-disease management in the study area. This is because farmers live in specific biophysical conditions of land availability and rainfall regimes, and socio-economic conditions with the level of market sophistication and organisation and market access that also determine their relying on traditional land use practices and particularly the use of intercropping systems (Westphal et al. 1985; Abate et al. 2000; Altieri 2002; Gockowski et al. 2004, 2005). At the landscape level, the three pest-disease management strategies used within the cropping-fallow-forest conversion cycle, including the abandonment of field to become fallow and clearing up of patches, the use of appropriate farming methods and the rotation of crops, are all influenced by farmers’ knowledge of land ownership, level of income and perception of access to market (Table 7.3.7). There also exist collective strategies to break the cycles of insect or disease outbreaks as illustrated by the farming of melon seed which is done once every two years; this period is necessary to break the biological cycle of insect pests such as Dysderus voelkeri (Hem Dysdercus Voelkeri iptera: Pyrrhocoridae) and Dacus bivitattus (Diptera: Tephritedae) that attack melon seed fruits and cause high yield loss (Fomekong et al. 2008). The results suggest that the farmers respond positively to their perception of pests-diseases on crops by adopting both adaptive management strategies and field management practices that generally keep pest numbers at low levels and to maintain a threshold of agricultural and forest sustainability outcomes. The abandonment of fields to become fallow plus opening of new farms seems to be the shared and common pest management strategies among farmers with different levels of land ownership, income, access to market and with various levels of incidence of crops on yield and income. This can be related to the resource use intensification gradient within the forest margins. To deal with pest management within the study area, three scenarios could be drawn following the heterogeneity of resource use that differentiate the blocks defined by the length of fallow which increases from Yaoundé block (3.9 years), then to Mbalmayo block (5.4 years) and to Ebolowa block (7.5 years). Except for the market access that is perceived to be manageable for all blocks, the heterogeneity of market access constraints, estimated annual revenue, land ownership, local climate variability indicators, and the knowledge of the ability of crops to adapt and the alternative solutions for food consumption and income generation after a loss in a field are critical factors to integrate in order to build the resilience capacity of pest-disease management strategies under climate variability/stress, and eventually climate change

178
scenarios specific for each block within forest margins of the benchmark area of southern Cameroon. 7.5 CONCLUSION The objective of this chapter was to explore the relationships between local perceptions of climate variability, pests-disease incidence on crops and its management actions, and adaptive slash-and-burn agriculture practices. The perceptions of climate variability have been captured based on six local indicators; the values given by respondents fluctuate considerably and there were no discernable patterns. Five main crop species (cocoa, cassava, plantain, cocoyam, groundnuts) have been used to identify three pest-disease management strategies both at the landscape and farmlevel (field pest management) including the abandonment of fields to become fallow plus opening of new farms and rotation of land use between years/seasons for the higher production and the use of modern farming methods.. Each of the main crops seems to have its own pest-disease management strategy based on a range of management actions that were not isolated from the whole management of the field. The socio-economic context of respondents including their perception of market access, estimated annual income and estimate land ownership affect the adoption of management strategies both at landscape and plot level. The results confirm that local agricultural biodiversity knowledge determines the perception of climate variability and farmers’ response and adaptation to the incidence of pests/diseases under uncertainty engendered by climate variability. Several gaps have been identified in the chapter in terms of methodology and research areas needed. This was an exploratory study with extractive processes of data analyses, thus, it is difficult to generate appropriate solutions. The information generated can guide the improvement of our methodology in terms of linking knowledge generated to participatory action research. It seems to be an appropriate framework to refine the identification of local indicators of climate variability such as insects which are good indicators of the change in the environment and to understand under which conditions it is possible to improvelocal pest-disease management practices. Additional research is also needed to understand how farmers respond and adapt their consumption needs and income generation in case of major crop yield losses and to capture the role that alternative forest products can play in the replacement of the losses. It is also important to understand how the different regimes of heavy rains and extreme drought affect the field management activities. 7.6 REFERENCES Abate T, Van Huis A, Ampofo JKO. 2000. Pest Management Strategies in Traditional Agriculture: An African Perspective. Annual Review of Entomology Vol. 45: 631-659. Altieri AM. 2002. Agroecology: the science of natural resource management for poor farmers in marginal environments. Agriculture, Ecosystems and Environments 93: 1-24.
179
Altieri MM, Nicholls CI. 1999. Biodiversity, ecosystem function, and insect pest management in agricultural systems. In: Colins WW, Qualset CO (eds.), Biodiversity in Agro-ecosystem. Boca Raton: CRC Press. pp 69-84. ASB. 2000. Alternatives to Slash and Burn Phase II Report: Forest Margins Benchmark of Cameroon, Alternatives to Slash and Burn programme. Yaoundé: IITA Humid Forest Ecoregional Centre. Den Biggelaar C. 1996. Farmer experimentation and innovation. A case study of knowledge generation processes in agroforestry systems in Rwanda. Community Forestry Case Studies Series. Rome: FAO. Ellis J. 1995. Climatic variability and complex ecosystem dynamics: implication for pastoral development. In: Scoones I (ed.), Living with Uncertainty: New directions in Pastoral development in Africa. London: Intermediate Technology Publications. pp 37-46. FAO. 1999. Agricultural Policies for Sustainable Management and Use of Natural Resources in Africa. Rome: Food and Agricultural Organization (FAO)/IITA. 81 p. Folke C, Colding J, Berkes F. 2002. Building resilience for adaptive capacity in social-ecological systems. In: Berkes F, Folke C (eds.), Navigating Social-Ecological Systems: Building Resilience for Complexity and Change. Cambridge: Cambridge University Press. Fomekong A, Messi J, Kekeunou S, Tchuenguem-Fohouo F-N, Tamesse JL. 2008. Entomofauna of Cucumeropsis mannii Naudin, its impacts on plant yield and some aspects of the biology of Dacus bivitattus (Diptera: Tephritidae). African Journal of Agricultural Research vol 3 (5): 363-370. Gockowski J, Baker D. 1996. An ecoregional methodology for targeting resource and crop management research in the humid forest of Central and West Africa. Commuication of 1996 Biennial Meeting of Rockefeller Social Science Research Fellows. Nairobi: ICRAF. Gockowski J, Tonye J, Baker D, Legg C, Weise S, Ndoumbé M, Tiki-Manga T, Fouaguégué A. 2004. Characterization and diagnosis of farming systems in the ASB Forest Margins Benchmark of southern Cameroon. Study Report. Ibadan : IITA. Gockowski J, Tonye J, Diaw C, Hauser S, Kotto-Same J, Njomgang R, Moukam A, Nwaga A, Tiki-Manga T, Tondoh J, Tchoundjeu Z, Weise S, Zapfack L. 2005. The Forest Margins of Cameroon. In : Palm CA, Vosti A, Sanchez AS, Polly JE (eds.), Slash-and-Burn Agriculture: The Search for Alternatives. New York: Columbia University Press. pp 305-331. Haverkort B, Rist S. 2004. Towards Co-evolution of Knowledge and sciences: No shortcut in integrating local and global knowledge. Paper presetented in Bridging Scales

180
and Epistemologies: Linking Local Knowledge with Global Science in Multi-Scale Assessments Conference, Alexandria, March 2004. Instone L. 2003a. Shaking the Ground of Shifting Cultivation: Or Why (Do) We Need Alternatives to Slash-and-Burn? Resource management in Asia-Pacific Program Working Paper No.43. Camberra: Research School of Pacific and Asian Studies/The Australian National University. Instone L. 2003b. T(r)opical Translations : Reterritorialising the space of Biodiversity Conservation. Resource management in Asia-Pacific Program Working Paper No.46. Camberra: Research School of Pacific and Asian Studies/The Australian National University. Joshi L, Shrestha P, Moss C, Sinclair FL. 2004. Locally derived knowledge of soil fertility and its emerging role in integrated natural resource management. In: Van Noordwijk M, Cadisch G Ong CK (eds.), Belowground Interactions in Tropical Agroecosystems: Concepts and Models with Multiple Plant Components. London: CABI. MEA. 2005. Living Beyond Our Means: Natural Assets and Human Well-Being. Statement from the Board of Millennium Ecosystem Assessment. Washington DC: Island Press. Mala WA, Geldenhuys CJ, Prabhu R. 2008. A predictive model of local agricultural biodiversity knowledge management in Southern Cameroon. Biodiversity 9 (1 & 2): 96-101. Mala WA, Geldenhyus CJ, Prabhu R. In Preparation. Local Perceptions of Climate Variability, Pests-Diseases Incidence on Crops and Adaptive Forest-Agriculture Practices: Lessons Learned. Manyong MV, Smith J, Weber GK, Jagtap SS, Oyewole B. 1996. Macrocharacterization of Agricultural Systems in Central Africa: An Overview. Resource and Crop Management Research Monograph No.22. Ibadan: IITA. 58 p. Molua LE, Lambi MC. 2007. The Economic Impact of Climate Change on Agriculture in Cameroon. The World Bank, Development Research Group, Sustainable Rural and Urban Development Team. New York: World Bank. Mviena P. 1970. Univers culturel et religieux du peuple Beti. Yaoundé : Librairie St Paul. Nordhaus WD. 2007. A Review of the Stern Review on the Economics of Climate Change. Journal of Economic Literature Vol. 45, Issue 3: 686-702. Penkuri T, Jokinen P. 1999. The role of knowledge and spatial contexts in biodiversity policies: A sociological perspective. Biodiversity and Conservation 8: 761-147.

181
Prabhu R. 2003. Developing collaborative monitoring for adaptive collaborative management of African Forests. Harare: CIFOR. Rindos D. 1980. Symbiosis, instability, and the origins and spread of agriculture: a new model. Current Anthropology 21(6): 751-72. Rindos D. 1984. The Origins of Agriculture: An Evolutionary Perspective. New York: Academic Press. Scheffer MF, Westley-Brock WA, Holmgren M. 2002. Dynamics Interactions of Societies and Ecosystems-Linking Theories from Ecology, Economy and Sociology. In: Holling CS, Gunderson LH (eds.), Panarchy: Understanding Transformations in Human and Natural Systems. Washington DC: Island Press. Scoones I. 1995. Living with Uncertainty: New directions in Pastoral development in Africa. London: Intermediate Technology Publications. Smith H A, McSorely R. 2000. Intercropping and pest management: a review of major concepts. Am. Entomol. 46:154-161. UK Government. 2006. Stern Review on the Economics of Climate Change. UK Government - Office of Climate Change. www.sternreview.org.uk. Van Mele P, Van Chien H. 2004. Farmers, Biodiversity and Plant Protection: Developing a learning Environment for Sustainable Tree Cropping Systems. International Journal of Agricultural Sustainability Vol.2 No.1:67-75. Vernooy R, Song Y. 2004. New Approaches To supporting The Agricultural Biodiversity Important for Sustainable Rural Livelihoods. International Journal of Agricultural Sustainability Vol.2 No.1:55-66. Weiss A. 1990. The role of climate-related information in pest management.Theoretical and Applied Climatology Vol. 41 No. 1-2 : 87-92. Westphal E, Embrechts J, Ferwerda JD, Van Gils-Meeus EAH, Mutsaers WJH, Westphal-Stevels CMJ. 1985. Cultures vivrières tropicales avec référence spéciale au Cameroun. Wageningen: Pudoc Wageningen/CAP Documentation. 514 p. Winterhalder B. 1993. Work, resources, and population in foraging societies. Man 28:321-340. Winterhalder B, Goland C. 1997. An evolutionary ecology perspective on diet choice, risk, and plant domestication. In : Gremillian K J (ed.), Peoples, Plants, and Landscapes: Studies in Paleoethnobotany. Tuscaloosa-Alabam: University of Alabama Press.
182
Winterhalder B, Kennett D. 2006. Behavioral ecology and the transition from hunting and gathering to agriculture. In: Kennett D, Winterhalder B (eds.), Behavioral Ecology and the Transition to Agriculture. Berkeley: U. of California Press. pp 1-21. Woodley E. 2004. Local and Indigenous Ecological Knowledge as An Emergent Property of A complex System: A case Study in The Solomon Islands. Paper presented in Bridging Scales and Epistemologies: Linking Local and Global Science in Multi-Scale Assessment Conference, March, 17-20, 2004, Alexandria, Egypt.
183
CHAPTER EIGHT
KNOWLEDGE SYSTEMS INTERFACE IN DEVELOPING ADAPTIVE FOREST-AGRICULTURE INNOVATIONS:
SPHERE OF CONFLICTS AND KNOWLEDGE INTEGRATION
8.1 INTRODUCTION The last 10 years have seen significant changes in ecological and conservation thinking; the old thinking based on the theory of equilibrium has been challenged by non-equilibrium theorists recognizing that there is a high degree of uncertainty about the functioning of many tropical ecosystems. This makes it difficult to predict the levels of production that a system may yield from one year to the next, and how ecosystem structure may change over time (Ellis 1995; Scoones 1995; Forsyth 2002; Wallignton et al. 2005). Meantime, in the humid forest tropics, the search for alternatives to forest agriculture (slash-and-burn agriculture) with limited understanding of human-nature interactions, has been the main entry point for many initiatives to addressing sustainable forest-agriculture interface (ASB 1995, 2000; Instone 2003a; Gockowski et al. 2005; Palm et al. 2005). However, a shift has occurred from transferring alternative forest-agriculture options, often at the local level, to create enabling institutional conditions for empowerment and livelihood improvement (Diaw et al. 1999; Instone 2003a; Prabhu 2003; Colfer 2005). Yet, contradictions and paradoxes remain: the rhetoric of biodiversity conservation; farmers’ capacity building; participation and institutional change often clash with the social demand for specific, short term innovations and improvements such as input products, market opportunities, improved crop varieties with local characteristics/qualities, management of crop diseases and pests, and reduction of physical effort during farming activities (Charyulu 1999; Cormier-Salem 1999; Conley and Udry 2001; Van Noordwjik et al. 2001; Altieri 2002, 2004; Carlsson et al. 2002; Clark 2002; Mala et al. 2004). In several cases, some significant causes of failure of scientifically promising forest-agriculture innovations have been attributed to limited understanding of the traditional institutions of learning and of resources management, and false assumptions about the inability of local knowledge systems of natural resource management to align to the conventional indicators of agro-ecological sustainability (Zham et al. 2004; Palm et al. 2005; Gujit 2007). Most field approaches oriented towards the adoption of new technologies often clash with the local processes of institutional and social learning for coping with uncertainty (Ellis 1995; Scoones 1995; Bawden 1999; Abate et al. 2000; Altieri 2002). These failures also happened because farmers and scientists often have different knowledge systems and perspectives about the role and functions of biodiversity in agro-ecosystems (Haila 1999; Altieri 2002; Instone 2003b; Van Mele and Van Chien 2004). Failures of conventional approaches for analysis and intervention to find a
184
compromise between development and conservation have induced the emergence of alternative approaches such as co-management and more recently adaptive co-management (Holling 2001; Ruitenbeck and Cartier 2001; Gunderson and Holling 2002; Prabhu 2003; Olsson et al. 2004a; Berkes 2005; Colfer 2005). In the humid forest zone of southern Cameroon, the management of forest landscape mosaics follows the cropping-fallow-forest conversion cycle which is embedded in social institutions and customary tenure systems (Dounias 1995, 1996; Diaw 1997; Carrière 1999). From the farmers’ perspectives of livelihoods and thresholds of agro-ecological sustainability, the role of agricultural biodiversity is central to understanding the spatio-temporal scales under which the agro-ecosystems function and are organized. These spatio-temporal scales are embedded in the nature and value of agricultural biodiversity, and are necessary to overcome the misconceptions of scale of natural resources management and of research (Robiglio et al. 2002; Robiglio and Mala 2005). This also challenges the disconnections between forest and agricultural policies for addressing sustainable livelihood and biodiversity conservation in the human-modified forest landscapes (Dounias 1995, 1996; Dounias and Hladik 1996; Carrière 1999; Mala et al. 2004, 2006, 2008a). The current management of agricultural biodiversity based on technical orientations towards external knowledge systems still dominates R&D by putting forward mono-cropping of crops such as maize, and still clashes with the local agricultural biodiversity within land uses. These orientations are currently uncritically applied in two diverse situations: situations characterized by high ecological complexity embedded in dynamic processes of socio-ecological systems; situations of institutional and economic transformations since the devaluation of the CFA franc (local currency), and macro-economic reforms since the crisis in the international cocoa market and forestry reforms (Ndoye 1997; Ndoye et al. 1997; Diaw et al. 1999; Oyono et al. 2003b). This has often resulted in poor responses and adaptive feedback mechanisms from the interplay of knowledge systems and innovations. The biophysical and socio-economic context of agricultural biodiversity management has not been understood in relationship to: (i) the conditions for their integration with other forms of biodiversity knowledge systems; and (ii) the socio-institutional conditions of resource users that enable them to collaborate and adapt to changes in forest-agriculture innovations. A first step will be to document the conflicts between local agricultural biodiversity knowledge and external knowledge systems of technology development. The second step is to identify conditions under which the interplay of these knowledge systems could affect the way society generates, disseminates and utilizes forest-agriculture innovations leading to sustainable ecological, social and economic gains. This study was initiated to analyse how decision-making within the framework of ‘adaptive collaborative management’ can contribute to generating more appropriate innovations for managing complex forest-agricultural systems under conditions of high biodiversity in the humid forest zone of southern Cameroon (general objective of the study, see subsection 1.7, Chapter 1). Data were collected with structured and semi-structured questionnaires and on the review of secondary information. These
185
questionnaires were administrated to households and focus groups selected in three blocks along a gradient of high to low levels of resource use intensification and population density: (i) the intensity of resource use, inversely defined by the length of the fallow period, increases from Yaoundé block (3.9 years), through Mbalmayo block (5.4 years) to Ebolowa block (7.5 years); (ii) the population density decreases from Yaoundé (30-90 people/km2), via the Mbamayo block (10-30 people/km2) to the Ebolowa block (<10 people/km2). Six specific studies, each with a specific objective, were conducted to examine different parts of this overall study (see Chapters 2 to 7): (i) forest-agriculture innovations, their knowledge-based systems and field processes; (ii) local perception of nature and forest knowledge management; (iii) agricultural land use patterns and local indicators of forest-agriculture sustainability; (iv) biophysical characterization of local agricultural biodiversity knowledge management; (v) agricultural biodiversity knowledge and adaptive capacity to satisfy household consumption needs and income generation; (vi) perception of climate variability, incidences of pests and diseases on crops and adaptive management of forest-agriculture practices. Each chapter presents the detailed results and discussion for each specific study. This chapter synthesizes information and recommendations from the different studies (see Chapters 2 to 7) with specific reference to how the structure, organization and dynamics of agricultural biodiversity knowledge systems and their integration provide a basis for the design of adaptive collaborative forest-agriculture options to ensure sustainable livelihoods in the humid forest region of Central Africa. 8.2. DISCUSSIONS AROUND SPECIFIC OBJECTIVES 8.2.1 Forest-agriculture innovations: Knowledge base and field processes Six questions were the focus for this part of the study: (i) What R&D themes are associated with sustainable forest-agriculture? (ii) What are the processes supporting the development of forest-agriculture innovations at spatio-temporal scales? (iii) How do stakeholders interact to develop forest-agriculture innovations which would integrate livelihood needs, institutions of knowledge and learning, social organisations and income improvement? (iv) What are the emerging forest-agriculture innovations which were derived from agroecosystem analysis over the past decade at the forest-agriculture interface? (v) What have been the operational limitations of these processes in relation to the social demand for innovations? (vi) To what extent did the introduced agricultural and agroforestry land uses and technologies adapt to local agricultural biodiversity knowledge systems? Cocoa, plantain, maize, peanuts and cassava are the common R&D themes often associated with forest-agriculture innovations (See Table 2.3.4, Chapter 2) because of they are crops of high socio-economic importance in the study area (Gockowski et al. 2004, 2005). However, more attention was given to technical issues, particularly at the individual level, than to socio-organizational and market issues. This partly explains the high rating for the introduction of cassava and maize; they do not follow the distribution of R&D themes within blocks (see Table 2.3.5, Chapter 2). Furthermore, there is a large consensus about the rapid dissemination of maize in the study area. However, the dissemination of other crops cannot only be the result of R&D because farmers also use their traditional varieties. During the study farmers were sometimes unable to present the

186
improved cassava varieties on their farms. Soil fertility and agroforestry innovations were the highest category of technologies abandoned by farmers. The development of improved soil fertility technology with plant species such as Calliandra spp., Mucuna spp. and Inga edulis (Nolte et al. 1997; FAO 1999; Kanmegne 2004) often overlap with the range of species domesticated by farmers when they clear a patch in terms of their uses and functions (Dounias and Hladik 1996; Carrière 1999). This indicates that there has been a bias in the analysis of traditional agro-ecosystem dynamics and functioning embedded within the cropping-fallow-forests conversion cycle. Within this cycle, a stock of multiple-use tree species are often kept and associated with food crops to maintain a threshold of agricultural and forest sustainability. The assessment of field processes associated with slash-and-burn agriculture showed that they dominated on-farm research centred on technology development at individual level i.e. either woman-managed land uses such as mixed food crops, or man-managed land uses such as cocoa plantations or Cucumeropsis agroforests. Socio-institutional arrangements focused on the generation, dissemination and utilization of knowledge and innovations. The field processes varied according to their planning, implementation and monitoring-evaluation. The types of innovations were mainly technical, socio-organizational and commercial (see Table 2.3.7, Chapter 2). This bias in the field processes resulted in the low enhancement of institutional and social learning. This result indicates that the scales of decision-making, including individual, farmer group and village community level, are linked by local governance, tenure system and rules of authorities. They should be critically analysed to understand human-nature inter-actions (Robiglio and Mala 2005). If these points are not taken into account, then the management of R&D outcomes, i.e. the forest-agriculture innovations introduced, abandoned and adopted, is affected (see Tables 2.3.5, 2.3.6 and 2.3.8, Chapter 2). This seems to be the reason for the low adoption of forest-agriculture innovations within the socio-economic and biophysical conditions under which farmers take decisions and intervene in the forest landscape mosaics. The adaptive co-management framework was partially assessed. Besides the high levels of openness to institutional pluralism and conflict, the field processes have been implemented without the set-up of socio-institutional arrangements to generate, utilize and disseminate knowledge and innovations (Table 2.3.9, Chapter 2). The important elements in the building of a learning cycle are communication flow, sharing of methodologies and mutual learning, and horizontal and vertical collaboration. As a result, the R&D showed a low capacity for farmers to benefit from and take ownership of the slash-and-burn agricultural innovations. The limitations of this assessment are related to the inappropriately designed time-frame in the methodology. It should have been attached to a specific activity in order to capture the status of ACM parameters along the R&D processes for a comparative basis between the beginning, middle-term implementation and the end. These results suggest that one should address sustainability through a focus on linked processes, including technical innovations, socio-organisational aspects and market opportunities. This result confirms the assertion that environment and natural resources management were perceived before as a technical task focused on a reductionist paradigm of adoption of improved varieties, and less on addressing
187
sustainability by integrating the ecological, social and economic dimensions of NRM (Prabhu 2003; Sayer and Campbell 2003; Colfer 2005). The social scale of intervention and the institutional arrangements should be taken into account to ensure that the knowledge generated should improve the social and economic gains in a learning cycle as stated in the principles of adaptive collaborative management (Oyono et al. 2003b; Prabhu 2003; Colfer 2005; Plummer and Armitage 2006; Gujit 2007). 8.2.2 Local perceptions of nature and forest knowledge management The following four questions were clearly and adequately assessed: (i) What are the local perceptions of nature within the people of the Ntem-Sanaga region? (ii) What are the relationships between the components of these perceptions of nature? (iii) What are the perceptions of forest knowledge systems derived from them? (iv) How do the perceptions affect forest management and agricultural practices? The local perceptions of nature and forest knowledge are not isolated from the conception of the world and are linked to both the human and spiritual worlds (see Table 3.3.1, 3.3.2, Chapter 3). The search for human well-being and livelihoods is central to these relationships. The conception of human well-being is not just something abstract but it is a shared life objective within a group or between community members just as in modern societies. This search of well-being exerts itself in the effective use of local knowledge systems in the identification, classification and utilization of natural resources for their bio-ecological and economic value (Berkes 2005). The social definition of forest is based on the uses and practices associated with the existence of forests and natural resources, and not on fixed parameters found in technical definitions (see Table 3.3.3, 3.3.4, 3.3.5, Chapter 3). This confirms the results already found in similar environments in West Kalimantan-Indonesia (Colfer and Byron 2001) and in the study of local dimensions of natural resources management and cultural uses of forests in southern Cameroon (Dounias and Hladik 1996; Oyono 2002; Mala and Oyono 2004). These local forest knowledge systems are effective in the interpretation of the responses of the natural environment and guide the directions of resource management practices for farming, hunting and collection of forest products (Dounias and Hladik 1996; Carrière 1999; Kanmegne 2004). This ability of farmers to interpret the responses also affect the integration of forest and agriculture issues based on the coexistence of trees, crops, and biodiversity conservation of flora and wildlife. The management of biodiversity and natural resources is based on certain ecological beliefs, ideological values and perceptions guiding human activities to set the conditions of coexistence of plants and wildlife in order to maintain the productivity of lands and forests, and to facilitate the recovery of the vegetation. 8.2.3 Influences of local agro-ecological indicators on sustainability of agricultural land uses This chapter assessed the following four questions clearly and adequately: (i) What are the social representations of the spatial resource associated with land use patterns and the indicators of human modified landscapes (human ecology)? (ii) What are the local
188
indicators of agro-ecological resilience at the forest-agriculture interface? (iii) How do people use the indicators in practices at the forest-agriculture interface? (iv) How does this knowledge system affect the land use management patterns to enhance the sustainability of forest-agriculture? The results show that local bio-ecological indicators of agro-ecological sustainability are based on the two major social representations of forest landscapes/land uses, as follows: (i) fixed natural establishments represented by toponyms; (ii) land use dynamics represented by stages of vegetation regeneration and regrowth (see Figure 4.3.1, Chapter 4). This result reinforces the idea related to the complexity of human-nature relationships and that forest landscape mosaics are the results of human and historical ecological processes (see Section 3.1.2). The range of plant indicators, including trees, poles, saplings, shrubs and herbs, local soil characteristics and earthworm activities, affects the farmers’ decisions in soil fertility management and the selection of land for agro-ecological uses within space and time (Table 4.3.1, Chapitre 4). This indicates the existence of a multi-criteria approach of soil fertility management that is based on the identification of the appropriate conditions under which forest-agricultural production strategies will take place (Levang et al. 2001) and not the fact of isolated technical indicators related to soil properties towards agro-ecological sustainability (Kanmegne 2004). The relationships between types of local land uses, bio-indicators of status of soil fertility and management practices (Table 4.3.2, 4.3.3, Chapter 4), highlight the coherence and ecological rationality of traditional NRM practices. The functionality of these relationships have often been stigmatized by expert approaches working on agro-ecological sustainability (GEF 1993; ASB 1995; Nolte et al. 1997). These results indicate that any new transformation of the ecology/natural environment is predetermined by only one previous transformation (forest farm, fallows, cocoa farms) or it is based on a series of transformed ecological units. This confirms the results of other studies conducted in humid savannah (Fairhead and Leach 1995) and in some areas of southern Cameroon (Dounias 1995, 1996; Carrière 1999; Mala and Oyono 2004). The dynamics of the forest landscape mosaics present ecology as the product of a succession of human transformations, and not as the result of only natural processes. When the farmer clears the forest to make a farm, this marks the beginning of a new process of transformation of the natural ecology/environment which will contribute to the consolidation of agro-ecological resilience in terms of vegetation structure and floristic composition and diversity. 8.2.4 Influences of bio-physical determinants on local agricultural biodiversity knowledge management The following three questions were clearly and adequately assessed: (i) What are the biophysical determinants of local management of agricultural biodiversity at the forest-agriculture interface? (ii) How does this local agricultural biodiversity knowledge vary at different socio-ecological scales and processes? (iii) How does the local agricultural biodiversity knowledge of people affect the relationships between agricultural and non-agricultural plant species in natural resource management practices at the forest-agriculture interface? Farmers’ knowledge of distance to land uses (farms), i.e. both to
189
former land uses and to local bio-ecological indicators, affect their decision to select a specific land for a specific use (see Tables 5.3.1, 5.3.2, 5.3.4, 5.3.5, Chapter 5). The specific biophysical characteristics of plant species, such as their size and use values, are important selection factors at the plot level (see Table 5.3.6, 5.3.7, 5.3.8, 5.3.9, Chapter 5). These factors allow the domestication (maintained during land cover clearing) of plant species to complement positive interactions with crops (see Section 1.2, Chapter 5). The processes of natural domestication of plant species cover non timber fruit species, mostly represented by Persea americana, Mangifera indica, Elaeis guineensis, Dacryodes edulis, Trichoscypha acuminata and Irvingia gabonensis, by valuable timber species such as Disthemonathus benthamianus, Lophira alata, Pterocarpus soyauxii, Milicia excelsa, Terminalia superba and Triplochiton scleroxylon. The domestication of these species have affected the structure, composition and diversity of forest landscape mosaics in the study area, as demonstrated by other studies (Dounias 1995, 1996; Dounias and Hladik 1996; Carrière 1999). The forest landscape mosaics in southern Cameroon are not only the result of biophysical processes but to a large extent influenced by human ecology (Van Germeden et al. 2003). However, even if timber species have been domesticated by farmers during a succession of cropping-fallow-forest conversion cycles, they are not allowed to be commercially used prior to the issuing of a logging title prescribed in the Cameroon forest law of 1994. The management of agricultural plant biodiversity is centered around about 250 wild species distributed in 79 families and more than 26 crop varieties with more than 55 cultivars. This context of high diversity illustrates the patterns in the constitution of mixed food-crop farming systems and the rationality behind of their implementation within spatio-temporal scales. These patterns cannot be easily reversed in the monoculture farming systems as advocated by the conventional approaches aimed at finding alternatives to slash-and-burn traditional agriculture. This result show that the farmers use more fallows/secondary/degraded forests than virgin forests and contradicts the claims in the literature that the traditional slash-and-burn agriculture is a major source of forest loss and degradation when the reality shows that farmers manage a pool of farms, fallows and forests (Harisson 1992; ASB 1995, 2000). This high crop diversity indicates the diversity of food consumption which is an essential characteristic of the livelihoods of people in the humid tropics, such as the indigenous people of South America, in New Guinea, and among Bantu people in the coastal area of southern Cameroon (Reichardt et al. 1994; Dounias 1996). The behaviour of the traditional agro-ecosystem is characterized by a high degree of uncertainty, aggravated by climate variability (Ellis 1995; Scoones 1995). This diverse food cropping is an adapted response to cope with uncertainty and to anticipate thresholds of yield, food security and income generation. This complex association of trees*crops within spatio-temporal scales is a management strategy that may serve as a source of resilience and adaptation to the incidence of pests-diseases, to maintain a threshold of good yield, and different crop qualities in traditional agro-ecosystems (FAO 1999; Abate et al. 2000; Altieri 2002; 2004; Armitage 2003; Toledo et al. 2003).
190
8.2.5 Influences of local agricultural knowledge on household consumption needs, market preferences and sustainable livelihood The following three questions were clearly and adequately assessed: (i) What are the socio-economic determinants of agricultural biodiversity at the forest-agriculture interface? (ii) How do people use local agricultural biodiversity knowledge in natural resource management practices at the forest-agriculture interface? (iii) What socio-economic characteristics of agricultural plant diversity affect the decision behind the domestication or farming practices? The socio-economic characteristics of natural resources affect the management of agricultural biodiversity knowledge (see Tables 6.3.1, 6.3.2, 6.3.3, 6.3.4, Chapter 6). These results confirm the idea that small-scale farmers operate within a range of heterogeneous socio-economic and biophysical conditions (Pretty and Smith 2004). This variability of context should be taken into account in the design and analysis of intervention approaches. Three tree uses, such as food, medicine, timber and/or household material, are the most important factors to consider when addressing the quantity and quality of tree species for household consumption needs, income generation and sustainable livelihoods (see Table 6.3.5, 6.3.6, Chapter 6). The composition of the forest landscape mosaics is the result of a farmer’s choice and maintenance of trees and tree species over the past centuries around key NTFPs such as Dacryodes edulis, Irvingia gabonensis, Ricinodendron heudelottii and Gnetum spp. which are mostly found in agroforest land uses. This confirms the socio-economic role of tree species in the forest landscape mosaics of the humid forest zone (Ndoye 1997, Ndoye et al. 1997; Gockowski and Dury 1999; Ndoye and Tieguhong 2004; Sonwa 2004). Three qualities of crops seem to be the most important for farmers’ household consumption needs and market preferences including resistance to pests-diseases, easy to sell and good yield in crop processing (see Table 6.3.2, 6.3.3, Chapter 6). There is a link between the number of cultivars per crop and their use by farmers. It appears that the more the cultivars/varieties, the higher is the contribution to household consumption and source of income with crops such as cassava (Manihot esculenta), groundnuts (Arachis hypogea) and plantain (Musa paradisiaca). The results also confirms the ideas that traditional farmers have learned to live with uncertainties by using complex plant communities i.e. multi-crop species, to reduce risks on yield and to influence their diverse range of social goals and definitions of well being (Scoones 1995; Smith and McSorely 2000; Nacy et al. 2003; Woodley 2004; Winterhalder and Kennett 2006). However, even if there doesn’t seem to be ownership issues, there are certainly issues around the ownership of domesticated tree species used for both timber and non-timber forest products. The first constraint is that the forests and timber-trees are the property of the State even when the plant species have been domesticated by farmers. Farmers have access rights, user rights but no property rights which can affect the number of plant species domesticated. This can be an opportunity for stakeholders to negotiate an opportunity for collaborative and adaptive management with a prospect to create small-scale management of planted forest tree species by individuals, as a basis for a negotiated tenure of access rights.
191
8.2.6 Influences of local perceptions of climate variability on adaptive management strategy of crops pests-diseases Four questions were addressed in this part of the study: (i) What are the perceptions of climate variability and how do these affect the management activities in slash-and-burn agriculture? (ii) What are the perceptions and management actions to deal with pest-disease problems on the main crop species? (iii) How do local agricultural biodiversity knowledge systems help farmers to respond and adapt to the incidence of pests and diseases on crops? (iv) How do the socio-economic conditions of villages and farmers affect the management actions of pest-disease problems on the main crop species? Questions two to four were clearly and adequately assessed, but the first question was only partly assessed. Local perceptions of climate variability are combined with factors such as the severity level of the incidence of crop pests-diseases, abundance of insects and disappearance of certain plant species (see Table 7.3.1, Chapter 7). However, the results showed no clear patterns. The responses fluctuated too much among the perceptions of climate variability within the past 15 years. This indicated that the traditional agro-ecosystems are characterized by a high degree of uncertainty (Abate et al. 2000). There is also no a link between this perception of climate variability and the local strategies for the mitigation of the incidence of pests-diseases on crops. Only the incidence of pests-diseases on the yield of cocoa, plantain and cassava is more significant than on the other crops but their management requires several actions (see Table 7.3.4, Chapter 7). The use of modern pesticides remains the major pest-disease management, in particular for cash crops such as cocoa and horticultural crops (see Table 7.3.5, Chapter 7). The incidence of pests-diseases on crop yield is inversely correlated with the number of cultivars; the higher the number of cultivars, the lower is the incidence of pests-diseases. This result confirms the role of mixed food-crop farming in the regulation of the incidence of crop pests-diseases (Altieri 2002, 2004; Van Mele and Van Chien 2004; Vernooy and Song 2004). Local resource management strategies and land use practices that are implemented to minimize the effects of crop pests-diseases, such as the abandonment of land in fallows, the adoption of appropriate farming methods and the rotation of crops, are adapted according to farmers’ observations, practices and learning cycles (see Table 7.3.3, 7.3.4, Chapter 7). The farmers respond positively to their perception of the incidence of pests-diseases by adopting management strategies and farming practices that can improve the sustainability of the cropping-fallow-forest conversion cycles. The farmers’ livelihood strategies are characterized by adaptation to a high degree of uncertainty promoted by climate variability. Several gaps have been identified in this chapter in terms of methodology and research areas needed. This exploratory study was based on a fixed time-period and did not include dynamic field processes over a year, and more importantly, based on a few respondents. Therefore, it is difficult to generate appropriate solutions. Participatory action research processes could have provided more detailed and useful indicators than this extractive process of data collection. However, this study provides an appropriate framework to refine the identification of local indicators of climate variability, such as the types of insects or plant behaviour which are good indicators of the change of the environment. This could also help to understand under

192
which conditions an adaptive framework for developing resilience and diversity of pest management practices can be implemented. Additional research areas are also needed to understand how farmers respond and adapt their consumption needs and income generation in case the crop yields are impacted upon by a massive pest-disease attack. It is also important to understand how the different regimes of heavy rains and extreme drought affect the field management activities.
8.3 DISCUSSIONS AROUND ALL THE DIFFERENT SUB-OBJECTIVES AND IMPLICATONS FOR CURRENT R & D PRACTICES
8.3.1 Discussions in terms of achievement of the overall objective Decision-making is a key element within the framework of ‘adaptive collaborative management’ in generating more appropriate innovations for managing complex forest-agricultural systems under conditions of high biodiversity. The results from chapters 2 to 7 challenge the conventional thinking around slash-and-burn agriculture and the search for its alternatives that have dominated the R&D at the forest margins over the past decade (Instone 2003a,b; Gockowski et al. 2005; Palm et al. 2005; Sanchez et al. 2005). This study assessed both the empirical and cognitive dimensions of traditional knowledge systems particularly the decision-making behind agricultural biodiversity management within selected land uses in the real dynamics of traditional agro-ecosystem. The assessment of knowledge-based systems and field processes associated with forest-agriculture innovations show that local decision-making is not often appropriately taken in account in the design of agro-ecosystem analysis and intervention, nor the high context of biodiversity prevailing in the study area (Chapter 2). The interplay of knowledge systems in developing forest-agriculture technology was entirely dominated by external knowledge because of the authority and financial resources of external R&D. This technical orientation resulted in a poor response from local stakeholders followed by the dissemination and implementation of only a few technologies, such as those for maize and cassava (Chapter 2). The cognitive conditions under which the resilienestatus of the traditional agro-ecosystem takes place i.e. structure, organization and dynamics of decision-making, are important to be understand rather than only on its ‘weaknesses’ that have been put forward addressed over the past decades (ASB 1995, 2000; Gockowski et al. 2004, 2005; Palm et al. 2005). Importantly, the results show that loclperception of nature and forest knowledge management affect the way people define well-being and how they maintain it within the dimensions of space and time (Chapter 3). For example, the social representations of agricultural land use patterns and the use of knowledge of local indicators affect the decision-making for the selection of land uses based on the knowledge of biophysical conditions under which crops will be associated with remnant tree species in order to maintain a threshold of forest-agriculture sustainability (Chapter 4 & 5). Biophysical determinants of both land uses and tree species are important factors determining local agricultural biodiversity knowledge management. This confirms that the structure, composition and dynamics of agro-ecosystems are the results of history, migrations, management practices, farmer’s knowledge of the ecological, economic and social values of tree species, and of a range of crop species qualities (Chapter 5 & 6) and not only on biophysical processes..

193
The traditional agricultural biodiversity knowledge system affects the adaptive capacity to satisfy and respond to household consumption needs and income generation in a context characterized by a high degree of uncertainty (Oyono et al. 2003b; Prabhu 2003; Colfer 2005). For example, the perception of incidence of pests on crops affects the decision-making of adaptive local management actions and practices. To reduce pest incidence on crops, farmers use several crop varieties and/or cultivars with a range of qualities in one single farm and at the same time (Chapters 5, 6 & 7; Abate et al. 2000). External and local knowledge systems have both similarities and differences. It is probably around their differences that the integration of the structures, organisations and dynamics of knowledge systems on agricultural biodiversity provide a good basis for the design of adaptive forest-agriculture innovations at the forest margins. 8.3.2 Meaning on understanding and management of local biodiversity knowledge towards the implementation into integrated management of forest-agricultural resources and sustainable development in the humid tropics The understanding and management of local agricultural biodiversity knowledge is used on a day-to-day basis; its management covers a large spectrum of plant species both crop and non-crop species. However, the results have shown that only a few of the many crop species are used during the development of forest-agriculture innovations (Chapter 2). This means that there is a high number of crop species that are still poorly recognized by conventional approaches in agricultural R&D that promote only global food crops, such as maize in monocultural practices. Motof these crops are often ill-adapted to the situations of the humid tropics. The concept of biodiversity management, which emerged with the Rio Earth Summit, has evolved around the theory of equilibrium in natural processes, which is currently challenged (Olsson et al. 2004a; Wallington et al. 2005; Roux et al. 2006). Conservation science has taken advantage of this theory to design management options for which the protected areas are the main tool. However, from the local conception of nature to the management of agricultural biodiversity within land uses, there is interdependency and inter-connectivity between land use components (including farms, fallows and forest stands) on which livelihood strategies are built and planned (Chapter 5, 6 & 7). This spatial inter-connectivity of land uses contradict the segregation approach used in addressing forest and agriculture issues within forest landscape mosaics. It shows just one aspect of the difficulty of analysing agro-ecosystem problems and developing feasible innovations (Prabhu 2003; Robiglio et al. 2002; Colfer 2005; Robiglio and Mala 2005). What is clearly required at the forest margins is an integration of scales of management and decision-making as well as the use of flexible processes/approaches during the analysis and intervention. If we are to develop sustainable forest-agriculture, then a crucial barrier to overcome is to understand the human-nature interactions in these forest landscape mosaics. The conventional understanding of human-nature interactions is that anthropogenic activities have a negative impact on agro-ecosystem dynamics i.e. productivity, regrowth and regeneration (GEF 1993; ASB 1995, 2000). This understanding has been based on a
194
segregation approach of management of natural resources characterized by the overly simplistic and artificial separation of ‘agriculture’ from ‘forest’ issues. This has seriously affected the processes of innovations and their outcomes, linking forestry and agriculture in the kind of complex environments that exist in southern Cameroon (Chapter 2, Table 2.3.6, 2.3.7, 2.3.8, 2.3.9; Colfer 2005; Mala et al. 2008a,b). There is no single approach to harvesting timber and non-timber products together with satisfying agricultural cropping needs for sustainable livelihoods (household consumption needs i.e. food security), industry development (small scale agroforestry and forest enterprises), and environmental/biodiversity conservation. The results show that forest landscape mosaics are a complex combination of agricultural and non-agricultural land uses. The non-agricultural land uses often contain a range of food and cash crops, and non-agricultural crops such as trees, poles, saplings and seedlings, fulfilling a range of biophysical and socio-economic functions (Chapter 5). The use of flexible approaches characterized by inter-active schemes, starting from the diagnosis to the monitoring and evaluation in the phases of innovative development, is critical to rethink the understanding of current paradigms, such as slash-and-burn agriculture, deforestation and poverty under their real context of high biodiversity. The results within this study suggest that the concept of forest-agriculture seems to be more appropriate than the slash-and-burn agriculture. The concept of forest-agriculture challenges the current bias in the understanding of its impacts both on livelihoods, biodiversity conservation and agro-ecosystem dynamics (Chapters 4, 5 & 6). It reflects the real processes that take place within the complementary interactions between trees and crops within the spatio-temporal scale. The contribution of NTFPs is very important to community livelihoods and income, when compared to other forest products such as timber and fuel wood. It has been shown that the contribution of such products to a farmer’s income can be as high as 45% in southern Cameroon (Dijk 1999). This indicates their potential in the design of adaptive co-management options within forest landscape mosaics where there is a productive co-existence between trees, poles, shrubs, herbs and different crops. Meantime, every land use within the cropping-fallow-forest conversion cycle carries a stock of high value timber species that were kept and maintained by farmers for the household needs and not necessary for the market (Chapters 5 and 6). The quantity and quality of these tree species domesticated within agricultural land uses are a capital for the development of integrated slash-and-burn agriculture innovations. The key issue should be to link them to market opportunities and to the processes of timber certification as an added-value or an incentive for farmers. The lack of property rights is another critical factor limiting the interest of farmers to maintain a stock of timber species. Such trees of timber species can be commercialized only if a farmer holds a permit for that purpose. This situation of insecure rights over trees favours the conditions for illegal exploitation of timber. The long-term forest-agriculture land use options should be articulated to respond to community livelihood strategies in terms of household consumption and income generation and which could lead to sustainable forest-agriculture outcomes. The level of knowledge in the management of agricultural biodiversity is critical for the design of sustainable land uses options to overcome the conflicts that exist between using land for cash crops, food crops, other crops and woody plant species, in order to guarantee food security and ecosystem goods and services

195
within the cropping-fallow-forest conversion cycle (Lefroy et al. 1999; Michon and Laforesta 1999; Wiersum 2004; Mala et al. 2008a,b). 8.3.3 Implications for ways to approach timber and non-timber harvesting together with agricultural cropping needs In the quest for integration of the conservation and utilization of biodiversity, there is a need to reverse is the trends of a global concern about biodiversity loss not only for economic value tree species or animals but also for agricultural biodiversity in its large sense. The big challenge remains how (as opposed to why) conservation efforts may take into account the dynamics of ecological-social systems towards socio-economic gains (Chazdon et al. 2008). Moreover, other conflicting perspectives also remain unresolved about the what (i.e. the paradigms and concepts such as conservation, biodiversity, sustainability in their real meaning in the context where they are supposed to be applied) and the how (i.e. the understanding of phenomena and processes of analysis and intervention within forest landscape mosaics). This quest for integrating conservation and utilization of biodiversity clearly shows why the dominant thinking and processes on sustainable slash-and-burn agriculture used over the past years have failed. This happened because the critics could not see forest management and agriculture as two integrated activities in forest landscape mosaics within traditional agro-ecosystems. These dominant approaches have sought to separate forests and agriculture spatially, administratively and conceptually, into two separate units for management and research (GEF 1993; Garrity and Bandy 1996; FAO 1999). . Moreover, this segregation approaches have been transposed to the management of slash-and-burn agriculture without the understanding of local decision-making related to traditional governance, tenure systems and authority behind the management of agricultural biodiversity taken in its broad sense. The segregation approaches have not been useful in the context of slash-and-burn agriculture where agriculture production systems are embedded within a cropping-fallow-forest conversion cycle (Dounias 1995; Diaw 1997; Diaw and Oyono 1998; Oyono et al. 2003a; Diaw et al. 2005). The results from this study have show that there is a very small percentage of primary forest that is opened every year by farmers compared to the global environmental narrative about the impacts of slash-and-burn agriculture on forest loss and deforestation (O’brien 2002; Forsyth 2002). The robustness of the management of forest landscape mosaics is based on the combination of farms, fallows and forests within a conversion cycle to maintain a threshold of forest-agriculture sustainability. The title does honour the thesis: knowledge systems involved in the management of forest agriculture were looked at from the interactions between ‘external’ and ‘local’ knowledge systems. These interactions were characterized to see whether they lead to positive outcomes or not, and if so, under what conditions. In many cases, the interplays were dominated by external knowledge perspectives for technical solutions to complex problems (Chapter 2). This confirms the idea that the interplay of knowledge systems is still borne out of power differentials i.e. external knowledge tends to be more ‘powerful’ because it is backed up by ‘authority’ and ‘resources’. For a more responsive interplay, a
196
first step in this study was to understand in what context external knowledge operates and imposes its power in the design and scale of analysis and intervention within agro-ecosystems. Then, the observations and understanding of the resilience of local knowledge were made around traditional governance, tenure and systems of authority, from their conception of nature to adaptive pest-disease management actions and practices under uncertainty promoted by climate variability. Importantly, the ways and means to create positive reinforcements between the two knowledge systems (traditional and scientific) have been identified around: (i) the rethinking of paradigms of slash-and-burn agriculture and of the concepts associated with it such as deforestation, poverty and livelihoods; (ii) the selection of appropriate scales for agro-ecosystem analysis and intervention by taking into account the interactions between ecology, society and economy in the real dynamics of the agro-ecosystem; (iii) the use of innovative and flexible processes that can allow the enhancement of social learning and adaptive capacity to cope with uncertainty and change; (iv) adaptive co-management which already provides a framework to deal with such complexities. All knowledge is constantly changing. The use of both the similarity and differences between the two knowledge systems to deal with the complexity of traditional agro-ecosystems in their heterogeneous context, can create the conditions for providing positive outcomes. 8.3.4 Implications for the improvement of the conceptual frameworks presented in Chapter 1 and specifically the diagrams in Figures 1.2.1 and 1.2.2 The framework presented in Figure 1.2.1 (Chapter 1) can be improved by : (1) the selection of an appropriate scale for the analysis and intervention based on the adaptive co-management framework; (2) the selection of flexible approaches for integrating the linkages between knowledge, decision-making and innovations; (3) the initiation of a dialogue around science-policy-practices on issues relevant to the integration of both agriculture and forest management; (4) a better definition of the units of forest landscape mosaics for management and research combined with connections between forest and agricultural policies that reflect the integration of timber, non-timber and crop species. The results of this study have shown that the use of paradigms such as slash-and-burn agriculture and the misconception of units of management and research have a serious negative effect on the development of feasible forest-agriculture innovations and of sustainable land use options. The achievement of such complex goals requires that the technology development should rely on an appropriate institutional framework and on socio-organizational settings (Ediquist 1997; Prabhu 2003; Spielman 2006). The major entry point to develop forest-agriculture technology seems to have focused more on the weaknesses of traditional agro-ecosystems rather than on their adaptive or resilience capacity within spatio-temporal scales. Disconnections between forest and agricultural policies caused that the requirements of sustainable forest management were equally applied to the permanent and non-permanent forest domains in Cameroon (MINEF 1994). Furthermore, the management of community and council forests is based on the existence of a management plan that overlap on the non-permanent forest domains i.e. supposed to be used for agricultural uses (MINEF 1994, 1995). The results is that

197
there is a big gap between the implementation of community forests, the management of forest agriculture, the development of profitable land use options and the real dynamics of socio-ecological systems. This suggests that there is a real need for an interaction on science-policy-practices to deal with issues relevant both to agriculture and forest management. This requires the implementation of platforms for sharing, learning and exchange that could channel the responses and adaptive feedback mechanisms. These platforms could be used to analyse land use development options to deal with the conflicts between crops and tree species, timber and non timber forest products, commercial and environmental developments, forest tenure and small scale agroforestry enterprises, market developments and industry in the context of high agricultural biodiversity at the forest margins. The traditional knowledge systems of forest-agriculture bear the characteristics of complex socio-ecological systems with multiple land uses ranging from cultivated land uses to common land embedded in different hierarchical levels of ownership and rights (Figure 1.2.2, Chapter 1). Sustainability, if it has to exist, should be evident only at this composite level, not at the level of individual actions or technologies. It is at this level where interactions of the social, ecological and economic components aggregate towards the ‘whole that is greater than the sum of its parts’ – as advocated by ACM. Indeed this concept, as in this research as a whole, will give rise to new tools, technologies, institutions and capacities (i.e. ‘innovations’) that would make the attainment of sustainability much more likely (Pretty 2002; Prabhu 2003; Colfer 2005; Plummer and Armitage 2006) The generation of this technological, institutional and socio-organizational apparatus should be made around the redefinition of social references such as livelihood, the worldviews of nature and philosophy of life as well as on easy negotiable issues related to governance and authority and difficult negotiable issues such as resources, well-being and livelihoods, and tenure. Another issue to invest in is related to the processes of stakeholders’ interactions in building institutional arrangements that lead to social learning and change. Adaptive co-management already provides an avenue to deal with such complexity in different scales of decision-making of natural resources management. Lastly, an important issue is related to the active monitoring of institutional and social learning. The question arises as to how decisions are made, who makes decisions and what types of institutional arrangements are needed to generate well accumulated knowledge that will be disseminated and used for action (Boyle 2001; Synclair and Joshi 2001; Prabhu 2003; Colfer 2006; Oyono et al. 2007; Mala et al. 2008b). The field processes (analysis and intervention) should take advantage of agricultural biodiversity and have to be designed for situations where there is uncertainty in terms of satisfying livelihood needs, acquiring income, reducing the incidence of crop pests-diseases, adjusting to climate variability; in situations justifying a need for action adapted both to natural and social systems. Sustainable forest-agriculture is a complex goal that requires the uses of innovative and flexible processes. The interplay of knowledge systems of agricultural biodiversity, the pace of innovative processes and adaptive co-management form the framework for the integration of structure, organization and dynamics of
-
198
different, sometimes contradictory, knowledge systems for the design of adaptive forest-agriculture developments at the forest margins in southern Cameroon. Past research have generated lot of useful information on ecology, economy, social systems and possible agricultural technologies, but which were not been successfully integrated into ‘socio-ecological system’, as a composite emergent framework of human actions that seeks to harness productive potential of living natural systems in relation to ecological responses of system to those intervention. Sustainability, if it exists, is evident only at this composite level without segregation of farms, fallows and forests; not at the level of individual or technology. Corollary to this is that focusing at this emergent level will give rise to new tools, technologies, institutions and capacities (i.e. ‘innovations’) that would make attainment of forest-agriculture interface sustainability much more likely. Inteactions of social, ecological and economic components aggregate as a ‘whole that is greater than the sum of its parts’, as advocatedby adaptive collaborative management and indeed along research and for perspectives of this study. 8.4 GENERAL CONCLUSIONS 8.4.1 In the past, forest-agriculture developments were entirely dominated by an orientation towards agricultural technology, which resulted in a weak integration between agriculture and forest issues in land use management at the same moment and place. 8.4.2 The scales of analysis and intervention of forest-agriculture developments were often not appropriately selected to create the conditions for social and institutional learning, and utilization and dissemination of knowledge to increase social and economic gains. 8.4.3 The local concept of nature structures the relationships between the human, natural and spiritual worlds, and in the end it is about the search for human well-being and sustainable livelihoods. The understanding of the concepts of nature and local knowledge systems is central to capture the key information of local ecological rationality, and their relations with livelihoods and adaptive natural resources management. 8.4.4 The understanding of how to achieve sustainable and shared livelihoods determine the role of local forest knowledge systems and their effectivity in the interpretation and responses of the natural environment. This guides the directions of natural resource management practices. 8.4.5 The social definition of forest is based on forest uses and utilization rather than only on biophysical characteristics and bio-ecological functions such as the size and height of trees as well as goods and environmental services they provide. That is why local forest knowledge is effective in the integration of forest and agriculture issues based on the coexistence between tree species and crops. 8.4.6 There is a local multi-criteria analysis prior to the management of forest landscape patches based on the combination of trees, poles, saplings, shrubs, herbs, soil color and

199
structure, and earthworm activity indicators for the selection of appropriate land where crops will be cultivated and to guarantee a threshold of agricultural and land productivity outcomes. 8.4.7 The concept of plant agricultural biodiversity is dynamic and its management is based on the knowledge of biophysical characteristics and socio-economic functions of tree species and the management of several crop cultivars with numerous qualities. The management of agricultural plant diversity is centered on tree species of different woody and successional status distributed in a multitude of families and more than 26 crop varieties with more than 55 cultivars. This is an indication of the capacity of local communities to conserve biodiversity for livelihood and sustainable management outside of protected areas. 8.4.8 Understanding the real management of forest-agriculture challenges the global environmental narrative about forest loss. Its contribution is crucial to the natural domestication of tree species, the management of a genetic stock of food crops and the management of wildlife associated with forest landscape mosaics. This management practice has also affected the livelihoods of people, the structure and floristic composition of forest landscapes, and forest dynamics in term of regrowth and/regeneration. 8.4.9 The natural domestication of tree species is determined by the knowledge of three broad socio-economic uses, including food, medicine and timber/woody material for house building. The more socio-economic uses are combined within a tree species, the higher is the likelihood for its domestication. 8.4.10 The cultivation of several crop cultivars is guided by the requirements to respond to both the household consumption and market preferences in terms of healthy products, derived products and good taste. The more cultivars the crop has, the higher is its contribution to household consumption needs and income generation such as cassava (Manihot esculenta), plantain (Musa paridisiaca) and groundnuts (Arachis hypogea). 8.4.11 The natural domestication of tree species and the use of the several crop cultivars are a source of ecological resilience, socio-economic sustainability and adaptive management. 8.4.12 The local perceptions of climate variability are based on farmers’ daily observations and experimentations; the fluctuations of responses confirm the high degree of uncertainty caused by climate variability. 8.4.13 A farmer’s perception of climate variability is not directly linked to his/her natural resource management strategies to mitigate the incidence of pests-diseases on crops. That is why the traditional management of the incidence of pests-diseases on crops is adapted to the availability of land and to the annual financial income of the farmer. 8.4.14 The farmers respond to the incidence of pests-diseases on crops based on their observation and learning through experimentation with their crops during each season

200
and not on fixed assumptions about the behavior of climate and its hypothetical effects on the crop pests-diseases. The management of crop pests-diseases is associated with the management of natural resources at both the land use level and the plot level. 8.4.15 The thinking and processes inincorporating agriculture and forestry issues should be based on the integration of traditional practices, and cross-cutting knowledge systems between biodiversity conservation and agricultural production systems for rural livelihoods. 8.5 RECOMMENDATIONS 8.5.1 The appropriate selection of the scale of analysis and intervention should take into acont the composite level including farms, fallows and forests in their socio-economic context as for the development of forest-agriculture innovations in non conventional forest and agricultural management systems. 8.5.2 The socio-institutional mechanisms in managing lands should be established withinthe R&Dativities by integrating different scales of decision-making natural as the conditions through which knowledge and forest-agriculture innovations will be generated, disseminated and utilized to increase both social and economic gains. 8.5.3 The conventional thinking on human well-being and its indicators are not the only framework to analyze the relationships between forest management and increase of rural poverty. The local concept of nature and its relationship with human well-being needs to be incorporated into the analysis and intervention within traditional agro-ecosystem. 8.5.4 The local management of biodiversity and natural resorces is based on certain ecological beliefs, ideological values and perceptions guiding human activities to set the conditions of coexistence of plants and wildlife. It is a key asset to consider in the management of biodiversity outside of protected areas by combiming participatory research with others scientific methods to develop feasible agroforestry innovations. 8.5.5 The scientific responses and local management knowledge of soil fertility needs to be integrated into a structural framework of adaptive soil fertility management options based on the coexistence between trees, shrubs, herbs and crops which are changing over time. 8.5.6 The structure and composition of forest landscape mosaics are based on the local knowledge of biodiversity functions and not only on the ecological processes. There is a need to understand and integrate the knowledge of how the landscape patterns are influenced by socio-economy and livelihoods perspectives. 8.5.7 Local agricultural biodiversity knowledge management is a key tool that can help forest dependent people to adapt their resource management strategies. There is a need to align this knowledge with other natural management scenarios and to design forest-

201
agriculture devlopent options towards adaptive collaborative management of natural resources. 8.5.8 The management of traditional forest-agriculture is an illustration of the way biodiversity can be managed outside of protected areas i.e. in a non conventional approach. 8.5.8 The role of biodiversity needs to be shared, defined and re-conceptualized between scientists and farmers around the decision-making behind the natural domestication of tree species and the cultivation of crop cultivars. 8.5.9 The adaptation to climate change/variability should be addressed via a participatory action research on issues relevant to the daily life of local farmers and on their adaptive capacity to deal with the high degree of uncertainty that characterizes African agro-ecosystems. 8.5.10 The documentation of local management of the incidence of pests-diseases on crops portrays the ways through which observations and learning through experimentation are key processes in the management of complex problems and where uncertainty is high in terms of climate variability. 8.5.11 Building adaptive collaborative management of natural resources at the forest margins requires the incorporation oflcal conceptions of plant agricultural biodiversity, the social construction of livelihoods and the patterns of land uses, as well as te regimes of property that can favorite the socio-economic and biophysical functions of agroforestry landscapes mosaics. This could be around the avenue provided by the framework of adaptive collaborative management of natural resources. 8.5 REFERENCES Abate T, Van Huis A, Ampofo JKO. 2000. Pest Management Strategies in Traditional Agriculture: An African Perspective. Annual Review of Entomology Vol. 45: 631-659. Altieri AM. 2002. Agro-ecology: the science of natural resource management for poor farmers in marginal environments. Agriculture, Ecosystems and Environments 93 (2002): 1-24. Altieri AM. 2004. Agroecology: principles and strategies for designing sustainable farming systems. htpp://www.agroeco.org. Armitage DR. 2003. Traditional Agro-ecological Knowledge, adaptive management and the socio-politics of conservation in Central Sulawesi, Indonesia. Environmental Conservation (30(1)): 70-90. ASB. 1995. Alternatives to Slash and Burn Phase I Report: Forest Margins Benchmark of Cameroon, Alternatives to Slash and Burn Programme. Yaoundé: IITA Humid Forest Ecoregional Centre.

202
ASB. 2000. Alternatives to Slash and Burn Phase II Report: Forest Margins Benchmark of Cameroon, Alternatives to Slash and Burn Programme. Yaoundé: IITA Humid Forest Ecoregional Centre. Bawden RJ. 1991. Systems Thinking and Practice in Agriculture. J Dairy Sci 1991, 74: 2362-2373. Berkes F. 2005. Adaptive Collaborative Management and Complexity: Exploring the Many Faces of Collaborative management. Paper for the Adaptive Collaborative management Symposium, Wilfrid Laurier University, February 2005. 4 p. Boyle JB. 2001. Can organization learn? Adaptive management, Confident Decisions and Science. University of Washington Conference, December 2-4, 2001. 10 p. Carlsson B, Jacobson S, Holmén M, Rickne A. 2002. Innovations Systems: Analytical and Methodological Issues. Research Policy 31:233-245. Carrière S. 1999. Les orphelins de la forêt: Influence de l'agriculture itinérante sur brûlis de Ntumu et des pratiques agricoles associées sur les dynamiques forestière du sud Cameroun. Thèse de Doctorat. Montpellier : Université de Montpellier. 448 p. Charyulu AS. 1999. Dissemination of Indigenous Knowledge: A way to Sustainable Agriculture. Faculty Paper. Rajendranagar: National Institute of Agricultural Extension Management. Chazdon RL, Harvey CA, Komar O, Griffith DM, Ferguson BG, Ramos MM, Morales H, Nigh R, Soto-Pinto L, Van Breugel M, Philpott SM. 2008. Beyond Reserves: A Research Agenda for Conserving Biodiversity in Human-Modified Tropical Landscape. Biotropica (2008). Clark N. 2002. Innovations systems, Institutional Change and the New Knowledge Market: Implications for the Third World Agricultural Development. Economics of Innovations and New Technology 11 (4-5):353-368. Colfer CJP. 2005. The complex forest: Communities, Uncertainties and Adaptive Collaborative Management. Washington DC: RFF/CIFOR. 370 p. Colfer CJP, Byron Y (eds.). 2001. People Managing Forests: The Links between Human Well-being and Sustainability. Washington DC: RFF and Bogor: CIFOR. Conley T, Udry C. 2001. Social Learning Through Networks: The Adoption of New Agricultural Technologies in Ghana. American Journal of Agricultural Economics 83 (3): 668-673.
203
Cormier-Salem, MC. 1999. Innovations et relations société-environnement. In : Chauveau JP, Cormier-Salem MC, Mollard E (eds.), Innovations en Agriculture : Questions de méthodes et de terrains d’Observation. Paris : IRD Editions. pp 127-140. Diaw MC. 1997. Si, Nda bot and Ayong: Shifting Cultivation, Land Use and Property Rights in southern Cameroon. Rural Development Forestry Network Paper 21e. Diaw MC, Oyono PR. 1998. Dynamiques et représentations des espaces forestiers au Sud Cameroun: pour une relecture sociale du paysages. Arbres, Forêts et Communautés Rurales 15/16: 36-43. Diaw MC, Tiani AM, Nguiebouri J, Jum C, Akwah G, Mala WA, Robiglio V. 2005. Adaptive Collaborative Management in Diverse Contexts, Case 5 Cameroon-Central and South. In: Colfer CJ (ed.), The Complex Forest, communities, uncertaintyand adaptive collaborative management. Washington DC: RFF press & Bogor: CIFOR. pp 238-51. Diaw MC, Colfer CJP, Prabhu R. 1999. Pour le suivi participatif et la cogestion adaptive des forêts tropicales africaines. Bogor: CIFOR. 14p. Dijk JFW Van. 1999. An assessment of Non-Wood Forest Products Resources for the Development of Sustainable Commercial Extraction. In: Sunderland TCH, Clark L E, Vantomme P (eds.), The NWFP of Central Africa: Current research issues and prospects for conservation and development. Rome : FAO. Dounias E. 1995. Du jardin au recrû forestier: agroforêts, cueillette et chasse chez les Mvae du Sud-Cameroun (Littoral forestier). In : Proceedings of the Symposium Recherche et Développement dans les Zones Tropicales Humides d’Afrique Centrale et de l’Ouest, Yaoundé, Cameroun. Dounias E. 1996. Recrus forestiers post-agricoles: perceptions et usages chez les Mvae du Sud-Cameroun. Journal d'Agriculture Tropicale et de Botanique Appliquée (38): 153-178. Dounias E, Hladik M. 1996. Les agroforêts Mvae et Yassa au Cameroun Littoral: functions socio-culturelle, structure and composition floristique. In : Hladik AH, Pagezy H, Linares OF, Koppert GJA, Froment A (eds.), L'alimentation en forêt tropicale; interactions socioculturelles et perspectives de développement. Paris: Editions UNESCO. pp 1103-1126. Ediquist C. 1997. Systems of Innovations Approaches: Technologies, Institutions and Organizations. London: Printer. Ellis J. 1995. Climatic variability and complex ecosystem dynamics: implication for pastoral development. In: Scoones I (ed.), Living with Uncertainty: New directions in Pastoral development in Africa. London: Intermediate Technology Publications. pp 37-46.
204
Fairhead J, Leach M. 1995. L'enrichissement des paysages des zones detransition forêt savane en guinée. Histoire sociale et pratiques paysannes. In : CIRAD, Ministère de la coopération (eds.), Actes du seminaire sur la Fertilité du milieu et Stratégies paysannes sous les tropiques humides. Montpellier : CIRAD. FAO. 1999. Sustaining agricultural biodiversity and agro-ecosystem functions: Farming Systems Approaches for the Sustainable Use and Conservation of Agricultural Biodiversity and Agro-Ecosystems. Report. International Technical Workshop organized jointly by the Food and Agriculture Organization of the United Nations (FAO) and the Secretariat of the Convention on Biological Diversity 2 - 4 December 1998. Rome: FAO. Forsyth T. 2002. Critical political ecology: The politics of Environmental Science. London: Routledge. 272 p. Garrity D, Bandy D. 1996. A Global Focus on Alternatives To Slash and Burn. In: LiYu X, YuangZhang Y, JinHui Q (eds.), Alternatives to Slash-and-Burn Agriculture. Proceedings of an International Symposium held in Kunming, PR. China, 6-16 March 1995. Kunmimg: China. pp 52-58. GEF. 1993. Global Alternatives to Slash and Burn. Global Environment Facility (GEF)/United Nations Development Program. New York: UNDP. 87 p. Geldenhuys CJ. 2000. Ecological processes the basis for sustainable nature conservation. Plantlife 23: 2-4. Gockowski J, Dury S. 1999. The economics of cocoa-fruit agroforests in southern Cameroon. IUFRO/ICRAF/CATIE International Conference on Multi-strata Agroforests. Turrialba: CATIE. Gockowski J, Tonye J, Baker D, Legg C, Weise S, Ndoumbé M, Tiki-Manga T Fouaguégué A. 2004. Characterization and diagnosis of farming systems in the ASB Forest Margins Benchmark of southern Cameroon. IITA Social Sciences Working Paper No1. Ibadan: IITA. 67p. Gockowski J, Tonye J, Diaw MC, Hauser S, Kotto-Same J, Njomgang R, Moukam A, Nwaga A, Tiki-Manga T, Tondoh J, Tchoundjeu Z, Weise S, Zapfack L. 2005. The Forest Margins of Cameroon. In : Palm CA, Vosti AS, Sanchez AP, Polly JE (eds.), Slash-and-Burn Agriculture: The Search for Alternatives. New York : Columbia University Press. pp 305-331. Gujit I (ed.). 2007. Learning from Collaborative Monitoring: Triggering Adaptation in Adaptive and Collaborative Management (ACM). Bogor: CIFOR. Gunderson LH, Holling CS. 2002. Panarchy, Understanding Transformations in Human and Natural Systems. Washington: Islands Press.

205
Haila Y. 1999. Biodiversity and the divide between Culture and Nature. Biodiversity and Conservation (8): 165-181. Harisson RP. 1992. Forests - The Shadow of Civilisation. Chicago: University of Chicago Press. Holling C. 2001. Understanding the complexity of economic, ecological, and social systems. Ecosystems 11: 41-47. Instone L. 2003a. Shaking the Ground of Shifting Cultivation: Or Why (Do) We Need Alternatives to Slash-and-Burn? Resource management in Asia-Pacific Program Working Paper No.43. Camberra: Research School of Pacific and Asian Studies/The Australian National University. Instone L. 2003b. T(r)opical Translations : Reterritorialising the space of Biodiversity Conservation. Resource management in Asia-Pacific Program Working Paper No.46. Camberra : Research School of Pacific and Asian Studies/The Australian National University. Kanmegne J. 2004. Slash and Burn Agriculture in the Humid Forest Zone of southern Cameroon: Soil Quality Dynamics, Improved Fallow Management and Farmers' Perception. PhD Dissertation. Wageningen: Wageningen University. 184 p. Lefroy EC, Hobbs RJ, O’Connor MH, Pate JS (eds.). 1999. Agriculture as a mimic of natural ecosystems. Agroforest. Sys. 45: 275-289. Levang P, Michon G, De Forestra H. 2001. De la jachère arborée aux agro-forêts, des stratégies paysannes adaptées à des milieux de fertilité médiocre. In : CIRAD et Ministère de la coopération (dir.), Actes du Séminaire sur la Fertilité du milieu et Stratégies paysannes sous les tropiques humides du 13-17 novembre 1995. Montpellier: CIRAD. pp 228-235. Mala WA, Oyono PR. 2004. Social dimensions of local practices of natural resource management in the Central Africa Region. Research Review 20.2: 23-31. Mala WA, Oyono PR, Ebene Y, Diaw MC. 2004. Assessment of the Context of Slash-and-burn agriculture and the Dynamics of Landscape Changes in Southern Cameroon. Unpublished Report. Yaoundé: CIFOR. Mala WA, Zoa F, Biyong M, Abéga P, Ela CV, Oyono PR, Diaw MC. 2006. Perceptions et connaissances locales des systèmes de gestion des forêts au Cameroun Méridional: instruments de prise de décision et d’aménagement durable. Rapport final de projet financé par l’Union Européenne/ Projet de réhabilitation et redynamisation de la station de recherche d'Ipassa/Makokou.
206
Mala WA, Geldenhuys CJ, Prabhu R. 2008a. A predictive model of local agricultural biodiversity knowledge management in southern Cameroon. Biodiversity 9 (1 & 2): 96-101. Mala WA, Prabhu R, Geldenhuys CJ, Diaw MC. 2008b. Agricultural Biodiversity Knowledge Systems and its Adaptive Capacity to respond to Household Consumption and Market Preferences. In: Parrotta JA, Jinlong L, Heok-Choh S (eds.),bSustainable Forest Management and Poverty Alleviation: Roles of Traditional Forest-related Knowledge. IUFRO World Series No. 21.Vienna: IUFRO. pp 114-115. McNeel JA. 2004. Nature vs. nurture: managing relationships between forests, agrorestry and wild biodiversity. Agroforestry systems 61:155-165. Michon G, De Laforesta G. 1999. Agroforests: incorporating a forest vision in agroforetry. In: Buck LE, Lassoie JP, Fernandes ECM (eds.), Agroforestry Systems. Boca Raton : CRC Press. pp 381-406. MINEF. 1994. Loi N°94 du 20 Juin 1994 portant régimes des forêts de la faune et de la pêche. Ministère de l’Environment et des Forêts, Gouvernement de la République du Cameroon. MINEF. 1995. Décret N°95/531/PM du 23 Août 1995 fixant les modalités d’applicationdu régime des forêts. Ministère de l’Environment et des Forêts, Gouvernement de la République du Cameroon. Nancy JT, Davidson-Hunt IJ, O’Flaherty M. 2003. Living on the Edges: Ecological and Cultural Edges as Sources of Diversity For Socio-Ecological Resiliences. Human Ecology Vol. 31.No. 3. Ndoye O. 1997. The impacts of macroeconomic and agricultural policies on forest conditions in Cameroon. Yaoundé: CIFOR. Ndoye O, Tieguhong JC. 2004. Forest resources and rural livelihoods: conflict between timber and non-timber forest products in the Congo Basin. Scandinavian Journal of Forest Research 19 (suppl.4): 36-44. Ndoye O, Ruiz-Perez M, Eyebe A. 1997. The markets of Non-timber Forest Products in the humid Forest Zone of Cameroon. Rural Development Forestry Network Paper No 22c. London: ODI . Nolte C, Duguma B, Wendt J. 1997. Research and development of fallows in the humid forest zone of Cameroon. A working paper prepared for the launching of EPHTA Humid Forest Margins Benchmark, Yaoundé, Hilton, May 26-28, 1997. O’brien W. 2002. The nature of Shifting Cultivation: Stories of Harmony, Degradation, and Redemption. Human Ecology 30(4): 483-502.
207
Olsson P, Folke C, Berkes F. 2004a. Adaptive co-management for building resilience in socio-ecological systems. Environmental Management (34): 75-90. Oyono PR. 2002. Usages Culturels de la Forêt au Sud-Cameroun: Rudiments d’Ecologie Sociale et Matériau pour la Gestion du Pluralisme. Africa LVII (3, 2002): 334-355. Oyono PR, Akwah G, Diaw MC, Jum C, Tiani A-M, Mala WA, Assembe S, Nguiébouri J, Ebene Y, Efoua S, Kouna C. 2003b. Developing Collaborative Monitoring for Adaptive Co Management of Tropical Forests (ACM). Final Report – Cameroon. Yaoundé : Center for International Forestry Research (CIFOR). Oyono PR, Mala WA, Tonye J. 2003a. Rigidity versus adaptation: Contribution to the Debate on Agricultural Viability and Forest Sustainability in southern Cameroon. Culture & Agriculture Vol.25, No2 Fall 2003: 32-40. Oyono PR, Diaw MC, Efoua S, Mala WA, Assembe S. 2007. Issue-Appropriate Collaborative Monitoring: Examples From Forest Management in Cameroon. In: Gujit I (ed.), Learning from Collaborative Monitoring: Triggering Adaptation in Adaptive and Collaborative Management (ACM). Bogor : CIFOR. Palm A C, Vosti A S, Sanchez A P, Ericksen JP (eds.). 2005. Slash and Burn Agriculture: Search for Alternatives. New York: Columbia University Press.USA. 461 p. Plummer R, Armitage D. 2006. A resilience-based framework for evaluating adaptive co-management: Linking ecology, economy and society. E c o l o g i c a l E c o n o m i c s 6 1 ( 2 0 0 7 ): 6 2 – 7 4. Prabhu R. 2003. Developing collaborative monitoring for adaptive collaborative management of African Forests. Final Report, of the January 1, 2000-December 31, 2002. Harare: CIFOR. Pretty J. 2002. Agri-culture: Reconnecting People, Land and Nature. London : Earthscan. Pretty J, Smith DJ. 2004. Social capital in biodiversity conservation and management. Conservation Biology 18(5): 631-638. Reichardt LK, Mellink E, Nabhan P G, Rea A. 1994. Habitat Heterogeinity and biodiversity y Associated with the indigenous agriculture in the Sonoran desert. Etnoecologica Vol.2 (No.3). Robiglio V, Mala WA. 2005. Between local and expert knowledge: integrating participatory mapping and GIS for the implementation of integrated forest management options. Case study of Akok – Cameroon. The Forestry Chronicle, Volume 81, Number 3, May/June 2005: 392-397.
208
Robiglio V, Mala WA, Diaw MC. 2002. Mapping Landscapes: Integrating GIS and Social Science Methods to Model Human–Nature Relationships in southern Cameroon. Small-scale Forest Economics, Management and Policy Journal 2 (2): 171-184. Roux DJ, Rogers KH, Biggs HC, Ashton PJ, Sergeant A. 2006. Bridging the Science-managing divide: moving from unidirectional knowledge transfer to knowledge interfacing and sharing. Ecology and Society 11(1):4. Ruitenbeck J, Cartier C. 2001. The Invisible Wand: Adaptive Co-Management as an Emergent Strategy in Complex Bio-economic Systems. Occassional Paper No. 34. Bogor: Centre for International Forestry Research.. Sanchez AP, Palm AC, Vosti AS, Tomich PT, Kayoski J. 2005. Alternatives to Slash and Burn: Challenge and Approaches of an International Consortium. In: Palm AC, Vosti AS, Sanchez AP, Ericksen JP (eds.), Slash and Burn Agriculture: Search for Alternatives. New York: Columbia University Press.pp: 3- 37. Sayer JA, Campbell BS. 2003. The Science of Sustainable Development: Local Livelihoods and Global Environment. Cambridge:Cambridge University Press. Scoones I. 1995. Living with Uncertainty: New directions in Pastoral development in Africa. London: Intermediate Technology Publications. Sinclair FL, Joshi L. 2001. Taking local knowledge about trees seriously. Forestry, forest users and research: new ways of learning. ETFRN: 45-61. Smith H A, McSorely R. 2000. Intercropping and pest management: a review of major concepts. Am. Entomol. 46:154-161. Sonwa JD. 2004. Biomass management and diversification within cocoa agroforests in the humid forest zone of southern Cameroon. PhD Dissertation. Bonn: Universitat Bonn. 112 p. Spielman JD. 2006. Systems of Innovations: Models, Methods, and Future Directions. Innovations Strategy Today 2(1):55-66. www.biodevelopment.orginnovations/index.htm. Toledo VM, Ortiz-Espejel B, Cortès L, Moguel P, Ordonez M. 2003. The multiple uses of tropical forests by indigenous peoples in Mexico: a case of adaptive management. Conservation Ecology Vol. 7(Issue 3). Van Germeden BS, Olff H, Parren PEE, Brongers F. 2003. The pristine rainforest? Remnants of historical impacts of current trees species composition and diversity. Journal of Biogeography 30: 1381-1390.

209
Van Mele P, Van Chien H. 2004. Farmers, Biodiversity and Plant Protection: Developing a learning Environment for Sustainable Tree Cropping Systems. International Journal of Agricultural Sustainability Vol.2, No.1: 67-75. Van Noordwijk M, Kurniatun H, Weise S. 2001. Sustainability of tropical land use systems following forest conversion. ASB Lecture Note 3. Bogor: ICRAF. Vernooy R, Song Y. 2004. New Approaches To supporting The Agricultural Biodiversity Important for Sustainable Rural Livelihoods. International Journal of Agricultural Sustainability Vol.2, No.1:55-66. Wallington TJ, Hobbs RJ, Moore SA. 2005. Implication of Current Ecological Thinking for Biodiversity Conservation: A Review of the Salient Issues. Ecology and Society. Wiersum KF. 2004. Forest gardens as an ‘intermediate’ land uses system in the nature-culture continuum: Characteristics and future potential. Agroforestry Systems 61: 123-134. Winterhalder B, Kennett D. 2006. Behavioral ecology and the transition from hunting and gathering to agriculture. In: Kennett D, Winterhalder B (eds.), Behavioral Ecology and the Transition to Agriculture. Berkeley: U. of California Press. pp 1-21. Woodley E. 2005. Local and indigenous ecological knowledge as an emergent property at a complex system: A case study in the Solomon Islands. In: Source Book on Participatory Research and Development CIP-UPWARD, IDRC, IFAD. Zahm F, Viaux P, Vilain L, Girardin P Mouchet C. 2004. La méthode IDEA (indicateur de durabilité des Exploitations Agricoles): une méthode de diagnostic pour passer du concept de durabilité à son évaluation à partir d'indicateurs. In: PEER Conférence, novembre 2004, Helsinki.
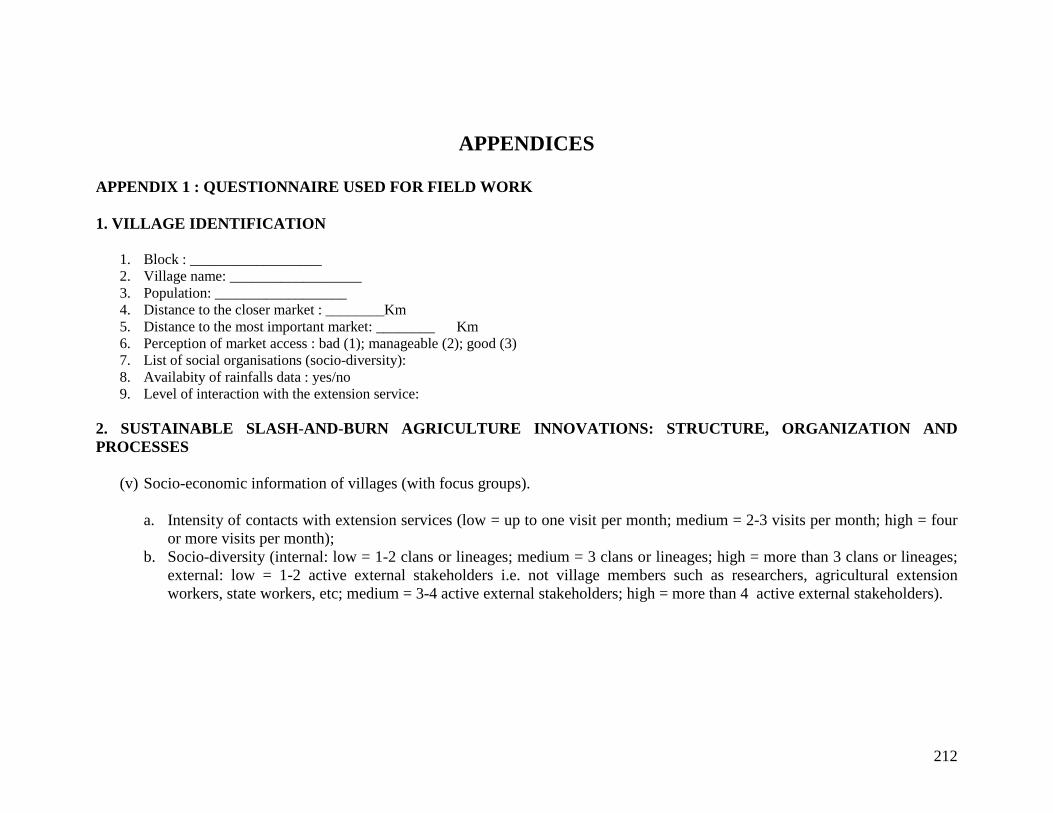
212
APPENDICES APPENDIX 1 : QUESTIONNAIRE USED FOR FIELD WORK 1. VILLAGE IDENTIFICATION
1. Block : __________________ 2. Village name: __________________ 3. Population: __________________ 4. Distance to the closer market : ________Km 5. Distance to the most important market: ________ Km 6. Perception of market access : bad (1); manageable (2); good (3) 7. List of social organisations (socio-diversity): 8. Availabity of rainfalls data : yes/no 9. Level of interaction with the extension service:
2. SUSTAINABLE SLASH-AND-BURN AGRICULTURE INNOVATIONS: STRUCTURE, ORGANIZATION AND PROCESSES
(v) Socio-economic information of villages (with focus groups). a. Intensity of contacts with extension services (low = up to one visit per month; medium = 2-3 visits per month; high = four
or more visits per month); b. Socio-diversity (internal: low = 1-2 clans or lineages; medium = 3 clans or lineages; high = more than 3 clans or lineages;
external: low = 1-2 active external stakeholders i.e. not village members such as researchers, agricultural extension workers, state workers, etc; medium = 3-4 active external stakeholders; high = more than 4 active external stakeholders).

213
(vi) Information on R&D themes at the forest-agriculture interface (with focus groups).
First discuss the list of seven potential themes: soil fertility, peanuts/groundnuts (Arachis hypogea) cassava (Manihot esculenta); melon seed (Cucumeropsis mannii); plantain (Musa paradisiaca); cocoa (Theobroma cocoa); and cocoyam (Dioscorea spp). This list was reviewed and updated by farmers in each village, adding crops and themes specific to the village. For each theme should be assessed on the basis of three major types of innovation, as follows:
a) technical orientation, based on increased yield in terms of agronomic, agroforestry and forestry production, with main focus on new crop varieties;
b) commercial orientation, based on the structure of market chains, including the introduction of collective ways of selling, improvement of post-harvest technologies and crop processing, and the introduction of market-oriented crops such as maize and horticultural crops;
c) socio-organizational orientation, based on the capacity building of local communities to participate in R&D in terms of negotiation, planning, implementation, monitoring and evaluation.
(vii) Information on the nature of farmers’ participation in the field research approaches and major orientation of
innovations (with individual interview). a. Based the evaluation on four field approaches were defined: (a) passive on-farm research (technology is designed by
external agent and it is tested on the farmer’s farm and articulation of the solution does not necessarily depend on the farmer’s participation); (b) semi-active on farm research (the farmer’s agro-ecological knowledge is the base of collaborative research processes and he is the one leading the research based on scientific principles); (c) participatory agricultural technology development (farmers are involved in all steps of the research process, including problem analysis, identification of solutions, implementation, up to the follow-up); (d) participatory monitoring and evaluation of the farmer’s technology (the farmer’s agroecological knowledge is documented over time but with no impact on the farmer’s normal activities).
b. For each field approach, assess in terms of the major orientation of the innovation (technical, commercial and socio-organizational). In each village, the farmers listed all the organizations (being formal or informal) that have initiated, facilitated and funded R&D activities in their village for the past ten years. Then, each organization was linked to the four field approaches. The institutions were later grouped based on their external linkages, such as State, NGOs, research institutes, vocational and training centres, and farmers’ organizations.
214
(viii) Information on the level of participation of farmers involved in a given R&D activity (individual follow by focus groups). Consider the number of activities in which the three levels of decision-making (village, household or individual level) are effectively involved with over the total number of activities conducted in a village per the type of innovation (i.e technical, commercial and socio-organizational), per each of the three phases of the innovation processes (planning, implementation, monitoring and evaluation) and per each of the three scales of intervention (individual, farmer group and village community).
The second round of interviews for trends of innovations and social demand of improvements (5 households follow by focus groups per village): (i) list the innovations introduced, abandoned and those which have probably increased their yield/income, and increased the
quantity of food available per type of innovations over the past 10 years wit a sequence of five years. The time frame covered 10 years and was divided into three periods as follows: Y-0 = today or current; Y-5 = five years ago; Y-10 = ten years ago.
(ii) list of improvements was validated and a ranking was made based on group consensus. This was made on the basis on their knowledge of technical, socio-organizational and market constraints, and the potential impact of this demand of improvement on both livelihood and income generation.
The third round of interview for the evaluation of ACM parameters (with focus group of 15-20 people per village) (i) Horizontal collaboration and openness to institutional pluralism: the social demand for livelihood improvements was
categorized as: low = no requests from community and no local actions are taken; medium = requests from community and disparate local actions are taken; high = demands expressed by community and local actions are taken with a framework of indicators for monitoring;
(ii) Vertical collaboration categorized as low = disparate interactions and lack of two-way communication; medium = interactions are effective and the two-way communications are made but through inappropriate channels; high = interactions are effective and the two-way communications are functional;
(iii) Sharing of methodologies and mutual learning categorized as low = no platform or sessions to share lessons, successes and failures and there are many conflicts due to misunderstanding between stakeholders; medium = platforms exist to share lessons, successes and failures, but they do not function and lessons are not used in new planning; high = platforms exist to share lessons, successes and failures, and new planning of intervention are made based on such lessons;
(iv) Level of conflicts/resistance to improvement categorized as low = the why, what and whom are not discussed and not defined but based on stakeholders’ power and position; medium = the why, what and whom are discussed and defined but the
215
stakeholders are not using their power and position to test the solutions; high =the why, what and whom are discussed and defined; and stakeholders’ power and position are used to test, monitor and evaluate the level of conflicts;
(v) Conflict resolution categorized as low = mechanisms are not defined; medium = mechanisms are defined but not applied; high = mechanisms are defined and rules are applied;
(vi) Communication categorized as low = information circulated within non-defined channels; medium = platforms to exchange information exist but information is not used to make decisions; high = platforms to exchange information exist and information is used to make decisions.
3. Local perception of nature, forest knowledge management systems and adaptive slash-and-burn agriculture practices Discuss in focus groups the following questions:
(i) What are the local perceptions of nature amongst the people of the study area?
(ii) What are the relationships between the components of these perceptions of nature?
(iii) What are the perceptions of forests and knowledge systems derived from them? (iv) How do they affect forest management and agricultural practices?
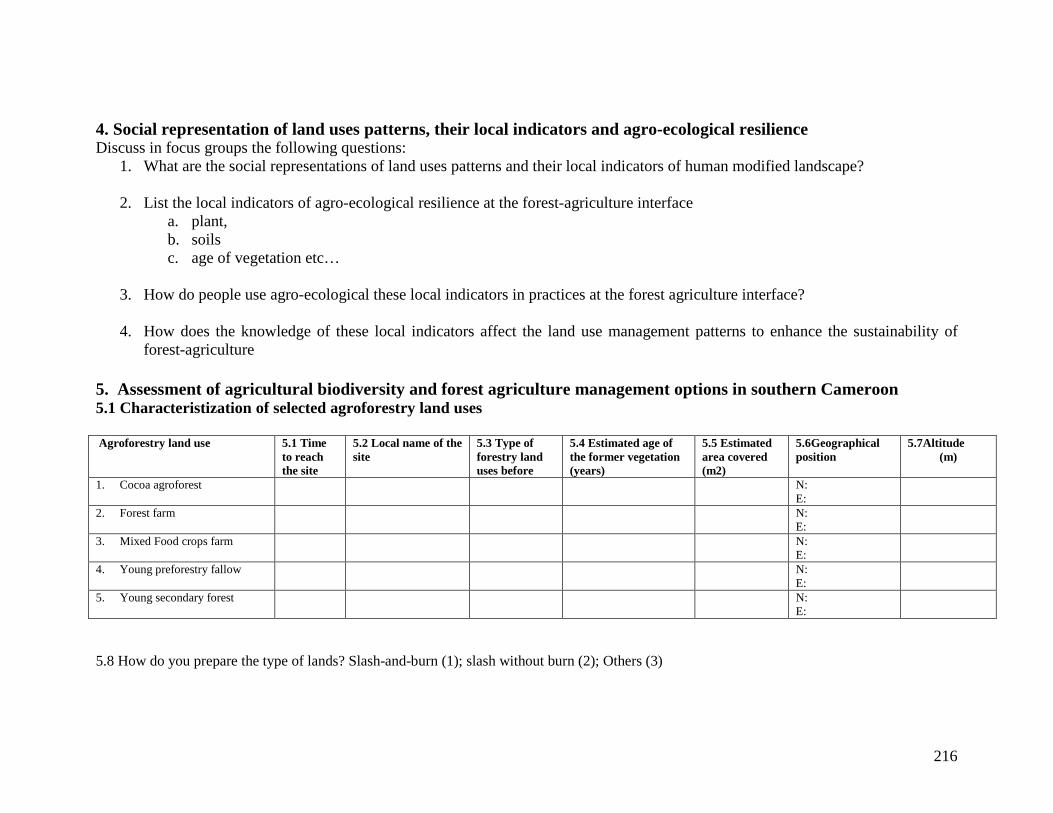
216
4. Social representation of land uses patterns, their local indicators and agro-ecological resilience Discuss in focus groups the following questions:
1. What are the social representations of land uses patterns and their local indicators of human modified landscape? 2. List the local indicators of agro-ecological resilience at the forest-agriculture interface
a. plant, b. soils c. age of vegetation etc…
3. How do people use agro-ecological these local indicators in practices at the forest agriculture interface? 4. How does the knowledge of these local indicators affect the land use management patterns to enhance the sustainability of
forest-agriculture 5. Assessment of agricultural biodiversity and forest agriculture management options in southern Cameroon 5.1 Characteristization of selected agroforestry land uses Agroforestry land use 5.1 Time
to reach the site
5.2 Local name of the site
5.3 Type of forestry land uses before
5.4 Estimated age of the former vegetation (years)
5.5 Estimated area covered (m2)
5.6Geographical position
5.7Altitude (m)
1. Cocoa agroforest N: E:
2. Forest farm N: E:
3. Mixed Food crops farm N: E:
4. Young preforestry fallow N: E:
5. Young secondary forest N: E:
5.8 How do you prepare the type of lands? Slash-and-burn (1); slash without burn (2); Others (3)
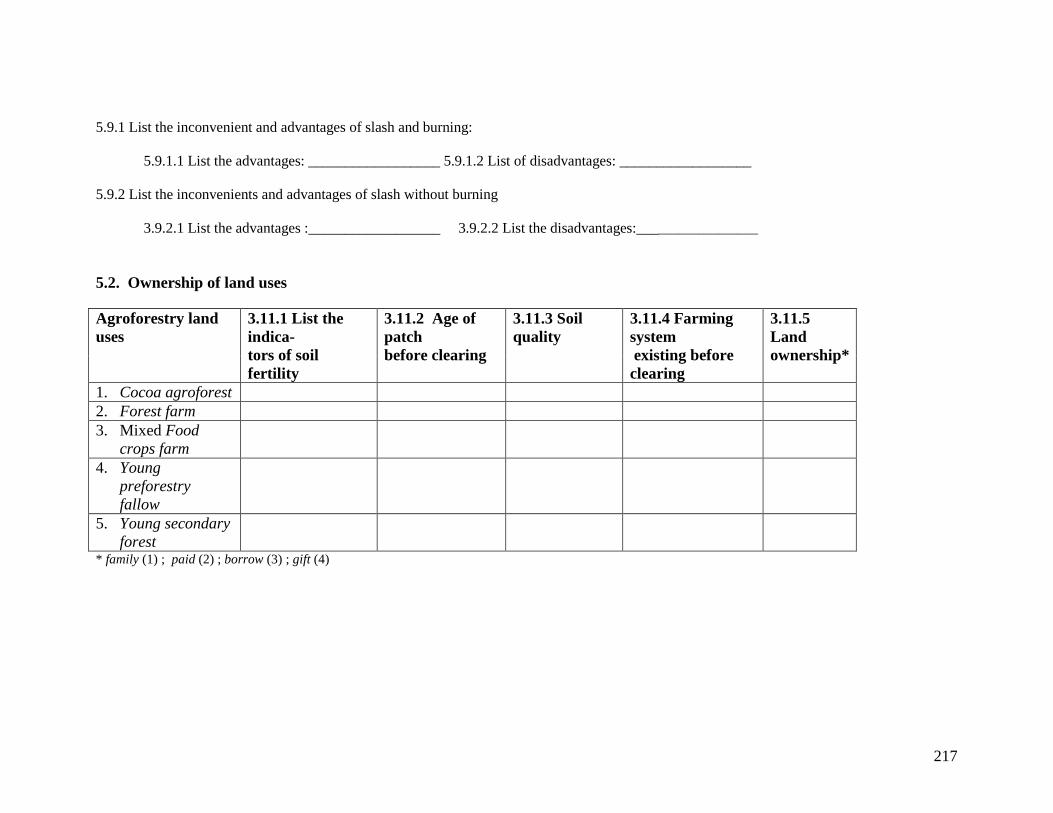
217
5.9.1 List the inconvenient and advantages of slash and burning:
5.9.1.1 List the advantages: __________________ 5.9.1.2 List of disadvantages: __________________ 5.9.2 List the inconvenients and advantages of slash without burning
3.9.2.1 List the advantages :__________________ 3.9.2.2 List the disadvantages:__________________ 5.2. Ownership of land uses
Agroforestry land uses
3.11.1 List the indica- tors of soil fertility
3.11.2 Age of patch before clearing
3.11.3 Soil quality
3.11.4 Farming system existing before clearing
3.11.5 Land ownership*
1. Cocoa agroforest 2. Forest farm 3. Mixed Food
crops farm
4. Young preforestry fallow
5. Young secondary forest
* family (1) ; paid (2) ; borrow (3) ; gift (4)

218
5.3 Data on agricultural biodiversity management 5.3.1 Data on woody-plant species with a diameter up to 10 cm [tmeasurements taken from sampling of square plot of 20x20m] Agrofo restry
land use
Plot ID
Local name
QualityT*
Index of furcation Forme du tronc Form of the trunk
Forme de la base du tronc Form of the base of the trunk
Generic & specie
DBH (cm)
Heigth (m)
Planting** status
Uses***
Most important tree use
* standing tree= 1 ; Stem with resprouting= 2 ; stem without resprouting= 3.; index of furcation=4 : **planted =1 ; spontanous =2 ***food=1 ; medicine=2 ; material for house building= 3 ; tools=4 ; fuelwood=5 ; cultural or ritual=6 ; marketable NWFP=7 ; useful for hunting= 8 ; Secuity of the future =9 ; special use=10 **** domestic use =1 ; height =2 ; diameter=3 ; commercial use =4 ; fertility =5 ; form of tronc =6 ; presence of buttresses =7 ; others

219
5.3.2 Données_ plantes autres que les arbres_ plantes cultivées, herbes, arbustes, plantes grimpantes > 1,5m, épiphytes de moins de 2m_ jeunes plants les plus abondants (<1,5m) _ arbustes/petits arbres les plus abondants (>1,5m) Data others than trees including food crops, herbs, shrubs and climbers Agrofo restry landuse
Plot ID
Local name
Quality CS*
Generic and specie
Family Agronomic and market qualities**
Numb of species in an rectangular area of 5x40m
Planting status***
Seed origins ****
1 2 3 4 5 6 7 8 9 0
*arbuste/jeune arbre spontané=1 ; arbuste issu d’une souche=2 **précocité (1) ; résistance aux maladies et aux pestes/resistance to pest and disease (2) ; bon développement physique/good ecological development (3) ; bon production/good production (4); bon goût/good taste (5), accès rapide aux revenus/rapide access to revenues (6), Autres/others ***planté =1 ; spontané=2 **** acquis chez les voisins/acquired from the neighours (1) ; acquis chez les parents-village d’origine/acquired from the women village (2) ; acquis d’un voyage/acquired from a travel (3) ; achat/paid (4) ; acquis de la recherche/vulgarisation (5)
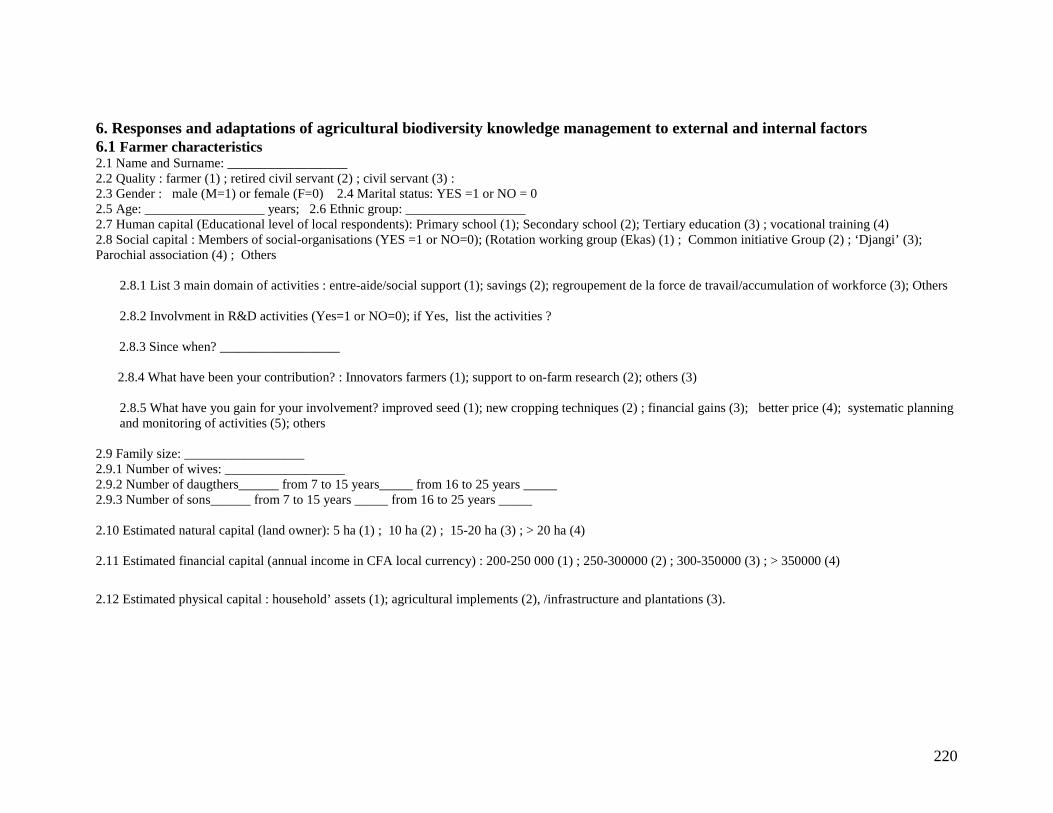
220
6. Responses and adaptations of agricultural biodiversity knowledge management to external and internal factors 6.1 Farmer characteristics 2.1 Name and Surname: __________________ 2.2 Quality : farmer (1) ; retired civil servant (2) ; civil servant (3) : 2.3 Gender : male (M=1) or female (F=0) 2.4 Marital status: YES =1 or NO = 0 2.5 Age: __________________ years; 2.6 Ethnic group: __________________ 2.7 Human capital (Educational level of local respondents): Primary school (1); Secondary school (2); Tertiary education (3) ; vocational training (4) 2.8 Social capital : Members of social-organisations (YES =1 or NO=0); (Rotation working group (Ekas) (1) ; Common initiative Group (2) ; ‘Djangi’ (3); Parochial association (4) ; Others
2.8.1 List 3 main domain of activities : entre-aide/social support (1); savings (2); regroupement de la force de travail/accumulation of workforce (3); Others 2.8.2 Involvment in R&D activities (Yes=1 or NO=0); if Yes, list the activities ?
2.8.3 Since when? __________________
2.8.4 What have been your contribution? : Innovators farmers (1); support to on-farm research (2); others (3)
2.8.5 What have you gain for your involvement? improved seed (1); new cropping techniques (2) ; financial gains (3); better price (4); systematic planning and monitoring of activities (5); others
2.9 Family size: __________________ 2.9.1 Number of wives: __________________ 2.9.2 Number of daugthers______ from 7 to 15 years_____ from 16 to 25 years _____ 2.9.3 Number of sons______ from 7 to 15 years _____ from 16 to 25 years _____ 2.10 Estimated natural capital (land owner): 5 ha (1) ; 10 ha (2) ; 15-20 ha (3) ; > 20 ha (4) 2.11 Estimated financial capital (annual income in CFA local currency) : 200-250 000 (1) ; 250-300000 (2) ; 300-350000 (3) ; > 350000 (4)
2.12 Estimated physical capital : household’ assets (1); agricultural implements (2), /infrastructure and plantations (3).
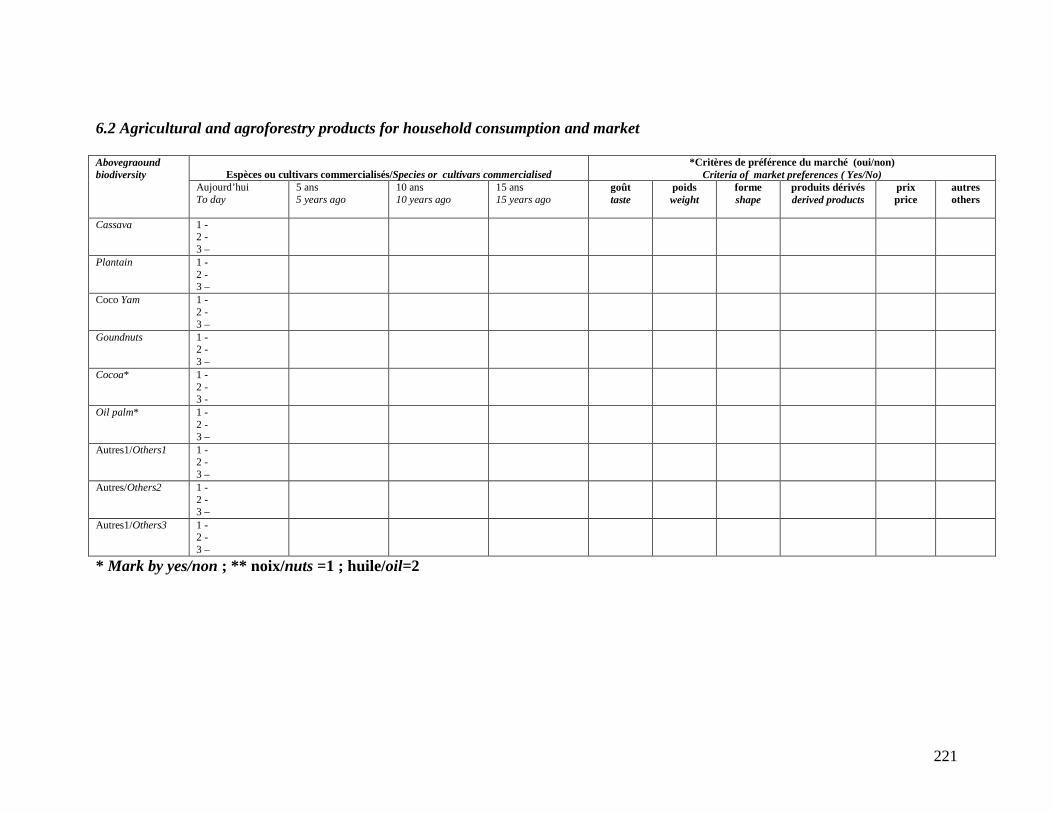
221
6.2 Agricultural and agroforestry products for household consumption and market Abovegraound biodiversity
Espèces ou cultivars commercialisés/Species or cultivars commercialised
*Critères de préférence du marché (oui/non) Criteria of market preferences ( Yes/No)
Aujourd’hui To day
5 ans 5 years ago
10 ans 10 years ago
15 ans 15 years ago
goût taste
poids weight
forme shape
produits dérivés derived products
prix price
autres others
Cassava 1 - 2 - 3 –
Plantain
1 - 2 - 3 –
Coco Yam 1 - 2 - 3 –
Goundnuts 1 - 2 - 3 –
Cocoa* 1 - 2 - 3 -
Oil palm* 1 - 2 - 3 –
Autres1/Others1 1 - 2 - 3 –
Autres/Others2 1 - 2 - 3 –
Autres1/Others3 1 - 2 - 3 –
* Mark by yes/non ; ** noix/nuts =1 ; huile/oil=2

222
6.2 List of forest products for household consumption and income/market Biodiversité au dessus du sol Abovegraound biodiversity
Espèces ou produits commercialisés/Species or products commercialised
Critères de préférence du marché (oui/non)* Criteria of market preferences ( Yes/No)
Aujourd’hui To day
5 ans 5 years ago
10 ans 10 years ago
15 ans 15 years ago
goût taste
poids weight
forme shape
produits dérivés derived products
Prix*****
price
autres others
PFNL/NTFP** 1 - 2 - 3 -
Plantes médicinales Medicinal plants**
1 - 2 - 3 -
Gibier/Bushmeat*** 1 - 2 - 3 -
Poissons d’eau douce /Fish from rivers***
1 - 2 - 3 -
Bois d’œuvre/ Timber****
1 - 2 - 3 -
Autres1/Others1 1 - 2 - 3 -
Autres/Others2 1 - 2 - 3 -
Autres1/Others3 1 - 2 - 3 -
* Mark by yes/non ; **écorce/bark=1 ; fruits/fruits =2; herbes/herbs=3 ; liquide/liquid=4 ; autres/others ; ***fumé/dry=1 ; fraiche/fresh=2 ; ****arbre debout/standing tree=1 ; bois scié/saw timber=2 ; autres/others ; *****prix + faible demande=1 ; prix + forte demande=2
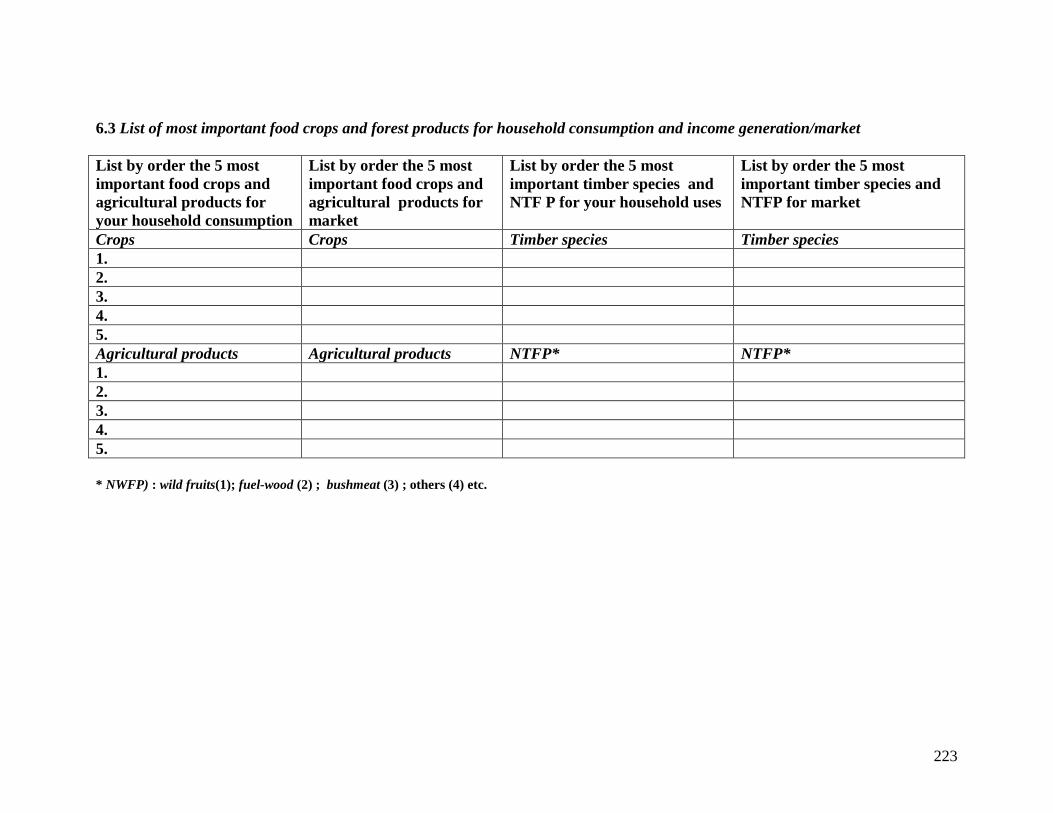
223
6.3 List of most important food crops and forest products for household consumption and income generation/market List by order the 5 most important food crops and agricultural products for your household consumption
List by order the 5 most important food crops and agricultural products for market
List by order the 5 most important timber species and NTF P for your household uses
List by order the 5 most important timber species and NTFP for market
Crops Crops Timber species Timber species 1. 2. 3. 4. 5. Agricultural products Agricultural products NTFP* NTFP* 1. 2. 3. 4. 5. * NWFP) : wild fruits(1); fuel-wood (2) ; bushmeat (3) ; others (4) etc.

224
7. Responses-adaptations of agricultural biodiversity knowledge to climate stress/variability 7.1 Local perception of climate variability Indicators of climate variability Perceptions of factors of
global climatic stress? *
Perception of climate varibility (low, medium, high)
Aujourd’hui To day
5 ans 5 years ago
10 ans 10 years ago
15 ans 15 years ago
1. Sécheresse /Drought *
2. Précipitations extrême s/Extrem rain or storms*
3. Régularité des saisons /Alternance of seasons*
4. Abondance des insectes /Abundance of insects**
5. Abondance des maladies et pestes des plantes et animaux/Abundance of pests/diseases of plants and animals**
6. Disparition de certaines espèces végétales –biodiversité /Disappearence of species – biodiversity***
7. Apparition de nouvelles espèces végétales/Appearence of new species***
* régulier/regular=1 ; irrégulier/irregular=2 ; pas de changement/no changes=3 **Elevé/high=1 ; moyen/medium=2 ; faible/low=3 *** importante/important=1]5-10 sp] ; moins importante/less important=2 [3-5 sp]; rare/rare=3 [1-2 sp]

225
7.2 Responses-adaptations of agricultural biodiversity knowledge to pests management Local name Perception of severity of pest on crops yield/income*
Local management actions of pests incidence ** Exclusivity
To day 2- 5 years 5-10 years 15 years To day 2- 5 years 5-10 years 15 years
Cassava
Plantain
Melon seed
Groundnuts
Maize
Coco yam
Oil palm tree
Cocoa
* Low (1) ; medium (2) ; high (3) * *modern pesticides (1) ; abandonment of varieties (2) ; introduction of new varieties and trees species (3) ; Introduction of improved varieties (4) ; Introduction of new cropping practices (5) ; use of local pesticides (6) ; Others solutions
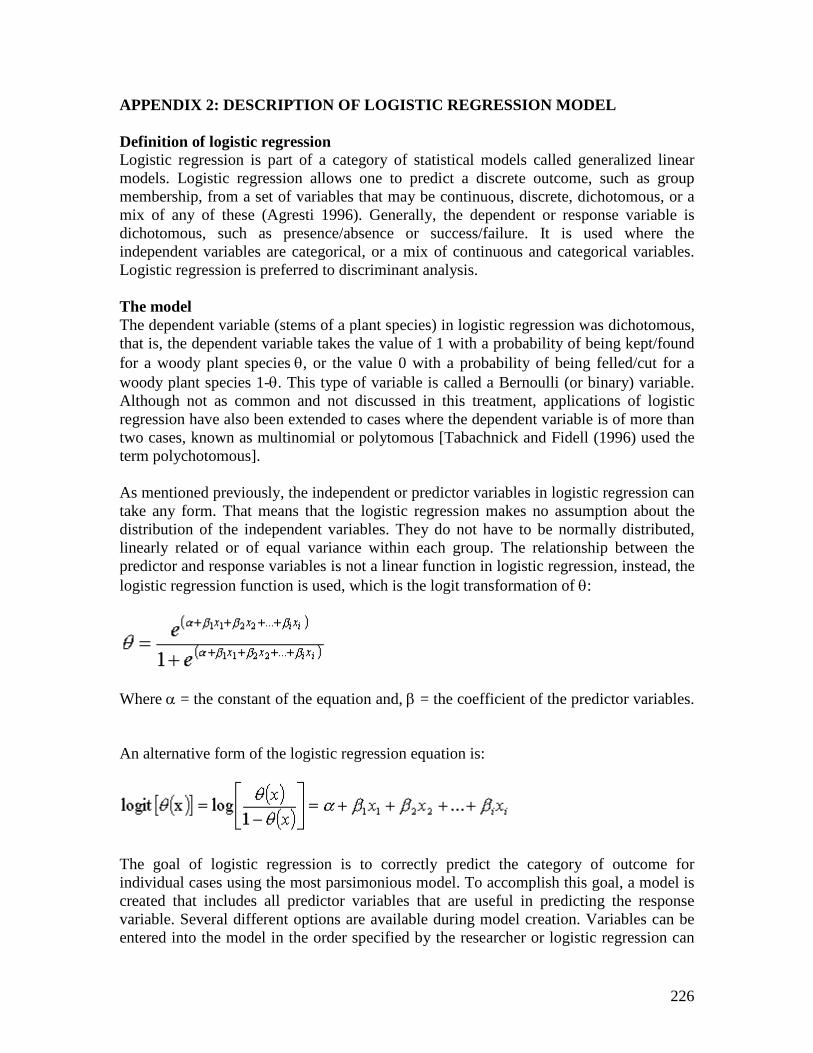
226
APPENDIX 2: DESCRIPTION OF LOGISTIC REGRESSION MODEL Definition of logistic regression Logistic regression is part of a category of statistical models called generalized linear models. Logistic regression allows one to predict a discrete outcome, such as group membership, from a set of variables that may be continuous, discrete, dichotomous, or a mix of any of these (Agresti 1996). Generally, the dependent or response variable is dichotomous, such as presence/absence or success/failure. It is used where the independent variables are categorical, or a mix of continuous and categorical variables. Logistic regression is preferred to discriminant analysis. The model The dependent variable (stems of a plant species) in logistic regression was dichotomous, that is, the dependent variable takes the value of 1 with a probability of being kept/found for a woody plant species θ, or the value 0 with a probability of being felled/cut for a woody plant species 1-θ. This type of variable is called a Bernoulli (or binary) variable. Although not as common and not discussed in this treatment, applications of logistic regression have also been extended to cases where the dependent variable is of more than two cases, known as multinomial or polytomous [Tabachnick and Fidell (1996) used the term polychotomous]. As mentioned previously, the independent or predictor variables in logistic regression can take any form. That means that the logistic regression makes no assumption about the distribution of the independent variables. They do not have to be normally distributed, linearly related or of equal variance within each group. The relationship between the predictor and response variables is not a linear function in logistic regression, instead, the logistic regression function is used, which is the logit transformation of θ:
Where α = the constant of the equation and, β = the coefficient of the predictor variables.
An alternative form of the logistic regression equation is:
The goal of logistic regression is to correctly predict the category of outcome for individual cases using the most parsimonious model. To accomplish this goal, a model is created that includes all predictor variables that are useful in predicting the response variable. Several different options are available during model creation. Variables can be entered into the model in the order specified by the researcher or logistic regression can

227
test the fit of the model after each coefficient is added or deleted, called stepwise regression.
Stepwise regression is used in the exploratory phase of research but it is not recommended for theory testing (Menard 1995). Theory testing is the testing of a-priori theories or hypotheses of the relationships between variables. Exploratory testing makes no a-priori assumptions regarding the relationships between the variables, thus the goal is to discover relationships.
Backward stepwise regression appears to be the preferred method of exploratory analyses, where the analysis begins with a full or saturated model and variables are eliminated from the model in an iterative process. The fit of the model is tested after the elimination of each variable to ensure that the model still adequately fits the data. When no more variables can be eliminated from the model, the analysis has been completed.
There are two main uses of logistic regression. The first is the prediction of group membership. Since logistic regression calculates the probability or success over the probability of failure, the results of the analysis are in the form of an odds ratio. For example, logistic regression is often used in epidemiological studies where the result of the analysis is the probability of developing cancer after controlling for other associated risks. Logistic regression also provides knowledge of the relationships and strengths among the variables (e.g., smoking 10 packs a day puts you at a higher risk for developing cancer than working in an asbestos mine).
The process by which coefficients are tested for significance for inclusion or elimination from the model involves several different techniques. Each of these will be discussed below.
Wald Test:
A Wald test is used to test the statistical significance of each coefficient (β) in the model. A Wald test calculates a Z statistic, which is:
This z value is then squared, yielding a Wald statistic with a chi-square distribution. However, several authors have identified problems with the use of the Wald statistic. Menard (1995) warns that for large coefficients, standard error is inflated, lowering the value of the Wald statistic (chi-square) value. Agresti (1996) states that the likelihood-ratio test is more reliable for small sample sizes than the Wald test.
Likelihood-Ratio Test:

228
The likelihood-ratio test uses the ratio of the maximized value of the likelihood function for the full model (L1) over the maximized value of the likelihood function for the simpler model (L0). The likelihood-ratio test statistic equals:
This log transformation of the likelihood functions yields a chi-squared statistic. This is the recommended test statistic to use when building a model through backward stepwise elimination.
Hosmer-Lemshow Goodness of Fit Test:
The Hosmer-Lemshow statistic evaluates the goodness-of-fit by creating 10 ordered groups of subjects and then compares the number actually in each group (observed) to the number predicted by the logistic regression model (predicted). Thus, the test statistic is a chi-square statistic with a desirable outcome of non-significance, indicating that the model prediction does not significantly differ from the observed.
Ten ordered groups are created based on their estimated probability; those with estimated probability below 0.1 form one group, and so on, up to those with probability 0.9 to 1.0. Each of these categories is further subdivided into two groups based on the actual observed outcome variable (success, failure). The expected frequencies for each of the cells are obtained from the model. If the model is good, then most of the subjects with success are classified in the higher deciles of risk and those with failure in the lower deciles of risk.
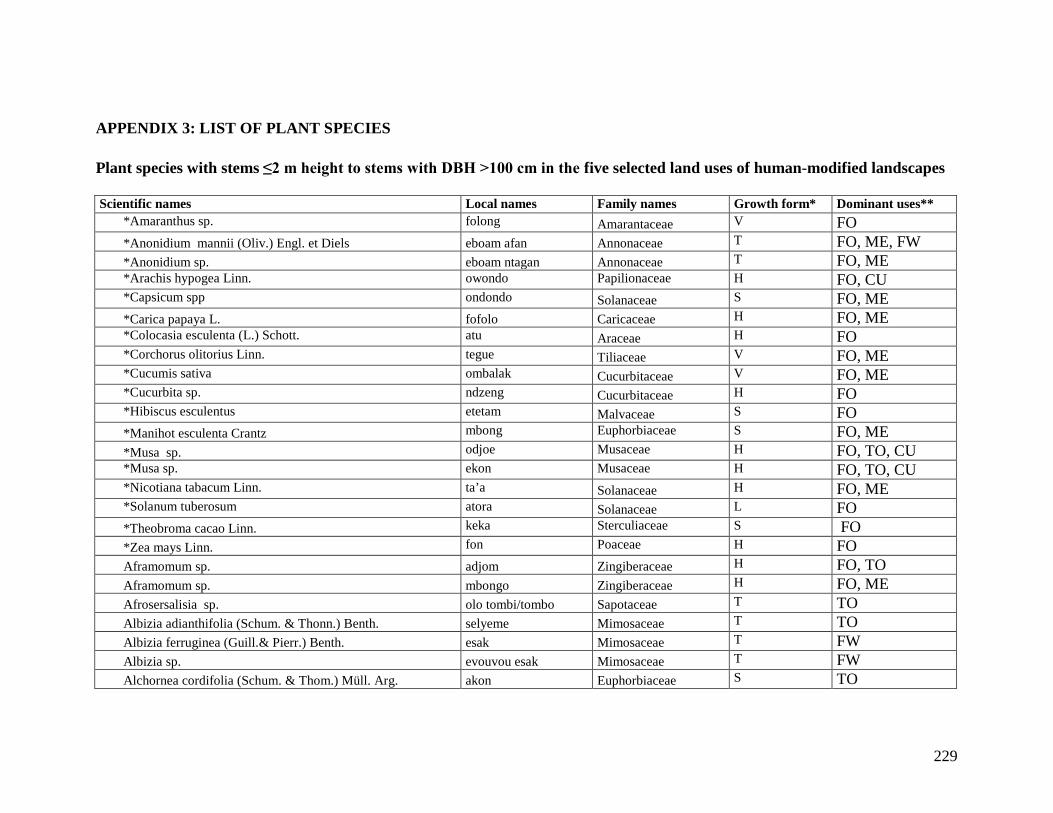
229
APPENDIX 3: LIST OF PLANT SPECIES
Plant species with stems ≤2 m height to stems with DBH >100 cm in the five selected land uses of human-modified landscapes Scientific names Local names Family names Growth form* Dominant uses**
*Amaranthus sp. folong Amarantaceae V FO *Anonidium mannii (Oliv.) Engl. et Diels eboam afan Annonaceae T FO, ME, FW *Anonidium sp. eboam ntagan Annonaceae T FO, ME *Arachis hypogea Linn. owondo Papilionaceae H FO, CU *Capsicum spp ondondo Solanaceae S FO, ME *Carica papaya L. fofolo Caricaceae H FO, ME *Colocasia esculenta (L.) Schott. atu Araceae H FO *Corchorus olitorius Linn. tegue Tiliaceae V FO, ME *Cucumis sativa ombalak Cucurbitaceae V FO, ME *Cucurbita sp. ndzeng Cucurbitaceae H FO *Hibiscus esculentus etetam Malvaceae S FO *Manihot esculenta Crantz mbong Euphorbiaceae S FO, ME *Musa sp. odjoe Musaceae H FO, TO, CU *Musa sp. ekon Musaceae H FO, TO, CU *Nicotiana tabacum Linn. ta’a Solanaceae H FO, ME *Solanum tuberosum atora Solanaceae L FO *Theobroma cacao Linn. keka Sterculiaceae S FO *Zea mays Linn. fon Poaceae H FO Aframomum sp. adjom Zingiberaceae H FO, TO Aframomum sp. mbongo Zingiberaceae H FO, ME Afrosersalisia sp. olo tombi/tombo Sapotaceae T TO Albizia adianthifolia (Schum. & Thonn.) Benth. selyeme Mimosaceae T TO Albizia ferruginea (Guill.& Pierr.) Benth. esak Mimosaceae T FW Albizia sp. evouvou esak Mimosaceae T FW Alchornea cordifolia (Schum. & Thom.) Müll. Arg. akon Euphorbiaceae S TO

230
Alchornea floribunda Müll. Arg. aboe Euphorbiaceae S ME Allanblackia floribunda Oliv. atyek/nsagomo Clusiaceae T ME, TO Allium sp. ayan H FO, ME Alstonia boonei De Wild ekouk Apocynaceae T TI, ME Amphimas ferrugineus Pierre ex Pellegr. edili Caesalpinioideae T FW Angylocalyx zenkeri Harms mbakoa bezombo Papilionaceae T TI, ME Aningeria robusta (A.Chev.) Aubr. & Pellegr. abam Sapotaceae T TI, FO, ME Anthocleista sp. elelom zam Loganiaceae T FW Anthocleista vogeli Planch. elelom Loganiaceae T FW Anthonotha ferruginea (Harms) Léornard akung ele Caesalpinioideae T TI, ME Antiaris toxicaria susp. welwitschii aloa Moraceae T TI, FO, ME Antiraris africana Engl. ekekel Moraceae T FO, ME Antrocaryon soyauxii (Engl.) Engl. angongui Anacardiaceae T TI, FO, ME Araliopsis sp. nka'a Rutaceae T TI, FO, ME Artocarpus communis Forst. owondo ntangana Moraceae T FO Aucoumea sp. okoumé Caesalpiniaceae T TI Autranella congolensis (De wild.) A. Chev. adjap elang Sapotaceae T TI, ME Baillonela sp. adjap Sapotaceae T TI, ME Beilschemiedia sp kanda Lauraceae T FO, ME Beilschmeidia sp. akum Lauraceae T TI, ME Berlinia confusa spp. esabem Mimosaceae T TI Bombax buonopozense P.Beauv. esedoum Bombacaceae T ME Bosquei angolensi (Welw.) Ficalho osomzo Moraceae T TI Bosqueia angolensis (Welw.) Ficalho tomba Moraceae T TI Brachystegia cynometroides Harms ekop Caesalpinioideae T TI, FW Bridelia micrantha (Hochst).) Baill. ewolot Euphorbiaceae T ME Calpocalyx heitzii Pellegr. minsi Mimosaceae S ME Canarium Schweinfurththii Engl. abel/otu Burseraceae T TI, ME, CU Canthium arnoldianum (De Wild. & Th. Dur.) Hepper ebouk bong Rubiaceae T TI, ME Carapa procera DC. engang Meliaceae T TI, ME
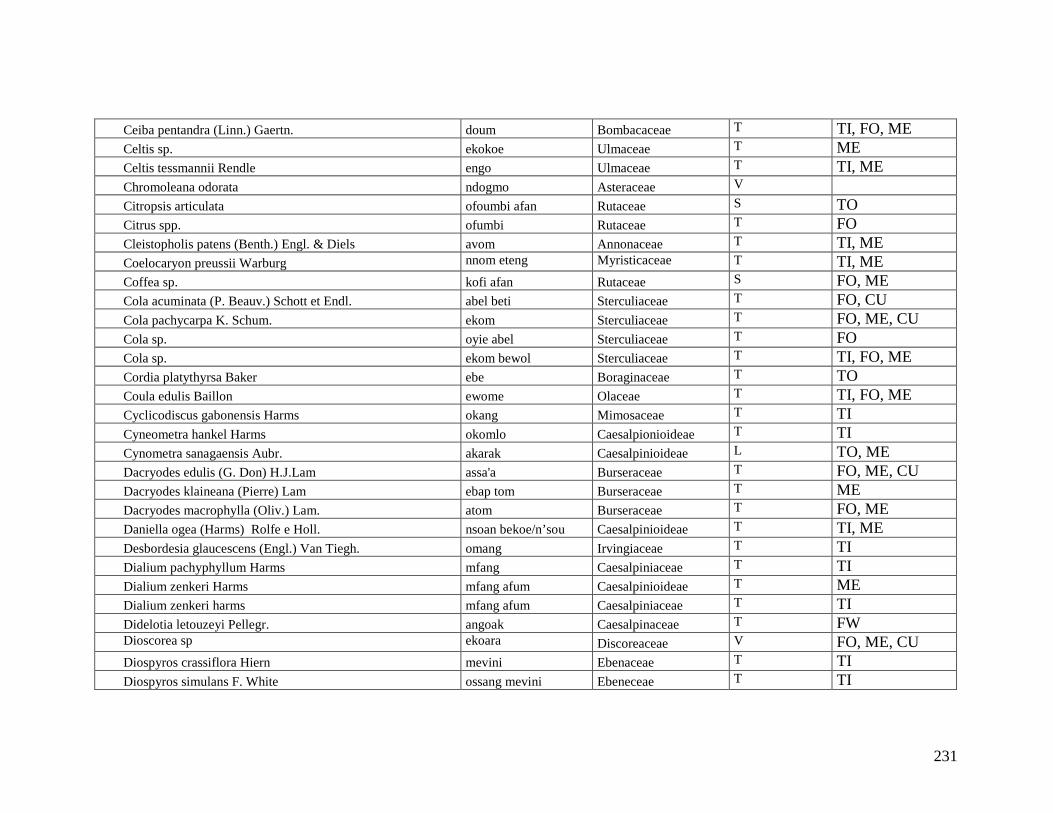
231
Ceiba pentandra (Linn.) Gaertn. doum Bombacaceae T TI, FO, ME Celtis sp. ekokoe Ulmaceae T ME Celtis tessmannii Rendle engo Ulmaceae T TI, ME Chromoleana odorata ndogmo Asteraceae V Citropsis articulata ofoumbi afan Rutaceae S TO Citrus spp. ofumbi Rutaceae T FO Cleistopholis patens (Benth.) Engl. & Diels avom Annonaceae T TI, ME Coelocaryon preussii Warburg nnom eteng Myristicaceae T TI, ME Coffea sp. kofi afan Rutaceae S FO, ME Cola acuminata (P. Beauv.) Schott et Endl. abel beti Sterculiaceae T FO, CU Cola pachycarpa K. Schum. ekom Sterculiaceae T FO, ME, CU Cola sp. oyie abel Sterculiaceae T FO Cola sp. ekom bewol Sterculiaceae T TI, FO, ME Cordia platythyrsa Baker ebe Boraginaceae T TO Coula edulis Baillon ewome Olaceae T TI, FO, ME Cyclicodiscus gabonensis Harms okang Mimosaceae T TI Cyneometra hankel Harms okomlo Caesalpionioideae T TI Cynometra sanagaensis Aubr. akarak Caesalpinioideae L TO, ME Dacryodes edulis (G. Don) H.J.Lam assa'a Burseraceae T FO, ME, CU Dacryodes klaineana (Pierre) Lam ebap tom Burseraceae T ME Dacryodes macrophylla (Oliv.) Lam. atom Burseraceae T FO, ME Daniella ogea (Harms) Rolfe e Holl. nsoan bekoe/n’sou Caesalpinioideae T TI, ME Desbordesia glaucescens (Engl.) Van Tiegh. omang Irvingiaceae T TI Dialium pachyphyllum Harms mfang Caesalpiniaceae T TI Dialium zenkeri Harms mfang afum Caesalpinioideae T ME Dialium zenkeri harms mfang afum Caesalpiniaceae T TI Didelotia letouzeyi Pellegr. angoak Caesalpinaceae T FW Dioscorea sp ekoara Discoreaceae V FO, ME, CU Diospyros crassiflora Hiern mevini Ebenaceae T TI Diospyros simulans F. White ossang mevini Ebeneceae T TI

232
Diospyros sp. obang mivini Ebeneceae T TI, TO Diospyros suaveolens Gurke ossang Ebenaceae T TI, ME Distemonathus benthamianus Baill. eyen Caesalpiniaceae T TI, ME Drypetes grossweileri S. Moore olelang Euphorbiaceae T TI Duboscia macrocarpa Bocq. akak Tiliaceae T TI, FO, ME Duboscia sp. ekak Tiliaceae T TI, ME Elaeis guineensis Jacq. alen Palmae T FO, TO, ME Enantia chlorantha Oliv. eve'e/mfol Annonaceae T TO, ME Endodesmia calophylloides Benth. kpa kpa ele Guttiferae S TO, ME Entandrophragma candollei Harm atom assié Meliaceae T TI, FO, ME Entandrophragma cylindricum Sprague assié Meliaceae T TI, FO, ME Eribloma oblongum (Mast.) Pierre ex R. Germ. eyong Sterculiaceae T TI, FW, ME
Eriocoelum macrocarpun (Gilg ex engl. awonog Sapindeae T TI, ME Erismadelphus exsul Mildbr. var. platyphyllus Keay & Stafleu
afob zam Vochysiaceae T FW
Erythriana sp. etom Palilionaceae T TI, ME, FW Erythrina milbraedii Harms engam Palilionaceae T TI Erythrophyleum ivorense A. Chev. elon Caesalpiniaceae T TI, FO, CU Erythroxylum mannii Oliv. landa Erythroxylaceae T TI Fagara heitzii Aubr. & Pellegr. bongo Rutaceae T TI, ME Fagara tesmannii Engl. bongo Rutaceae T TI, FW, ME Fagara tessmannii Engl. eyoyongo Rutaceae T FW Ficus exaspera Vahl. akole Moraceae T TO Ficus mucuso Welv. Ex Ficalho toal Moraceae T FW Ficus natalensis Hochst. ekekam Moraceae T ME, FW Ficus sp. mbikam Moraceae T FW Ficus sp. nnom akole Moraceae T TO Fillaeopsi discophora Harms nnon adum Mimosaceae T TI, FW, ME Funtumia africana (A. DC.) Pierre damba afan Apocynaceae T TI, FW Funtumia elastica (Benth.) Stapf. damba ete Apocynaceae T TI, FW
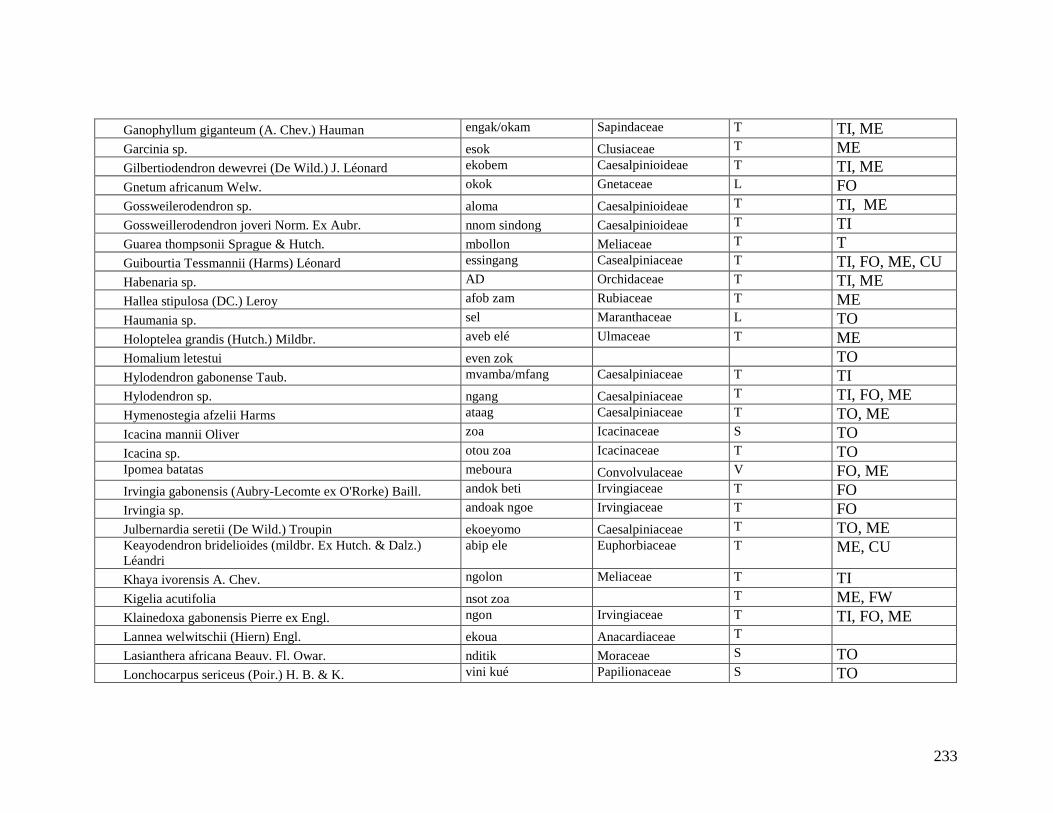
233
Ganophyllum giganteum (A. Chev.) Hauman engak/okam Sapindaceae T TI, ME Garcinia sp. esok Clusiaceae T ME Gilbertiodendron dewevrei (De Wild.) J. Léonard ekobem Caesalpinioideae T TI, ME Gnetum africanum Welw. okok Gnetaceae L FO Gossweilerodendron sp. aloma Caesalpinioideae T TI, ME Gossweillerodendron joveri Norm. Ex Aubr. nnom sindong Caesalpinioideae T TI Guarea thompsonii Sprague & Hutch. mbollon Meliaceae T T Guibourtia Tessmannii (Harms) Léonard essingang Casealpiniaceae T TI, FO, ME, CU Habenaria sp. AD Orchidaceae T TI, ME Hallea stipulosa (DC.) Leroy afob zam Rubiaceae T ME Haumania sp. sel Maranthaceae L TO Holoptelea grandis (Hutch.) Mildbr. aveb elé Ulmaceae T ME Homalium letestui even zok TO Hylodendron gabonense Taub. mvamba/mfang Caesalpiniaceae T TI Hylodendron sp. ngang Caesalpiniaceae T TI, FO, ME Hymenostegia afzelii Harms ataag Caesalpiniaceae T TO, ME Icacina mannii Oliver zoa Icacinaceae S TO Icacina sp. otou zoa Icacinaceae T TO Ipomea batatas meboura Convolvulaceae V FO, ME Irvingia gabonensis (Aubry-Lecomte ex O'Rorke) Baill. andok beti Irvingiaceae T FO Irvingia sp. andoak ngoe Irvingiaceae T FO Julbernardia seretii (De Wild.) Troupin ekoeyomo Caesalpiniaceae T TO, ME Keayodendron bridelioides (mildbr. Ex Hutch. & Dalz.) Léandri
abip ele Euphorbiaceae T ME, CU
Khaya ivorensis A. Chev. ngolon Meliaceae T TI Kigelia acutifolia nsot zoa T ME, FW Klainedoxa gabonensis Pierre ex Engl. ngon Irvingiaceae T TI, FO, ME Lannea welwitschii (Hiern) Engl. ekoua Anacardiaceae T Lasianthera africana Beauv. Fl. Owar. nditik Moraceae S TO Lonchocarpus sericeus (Poir.) H. B. & K. vini kué Papilionaceae S TO

234
Lophira alata Banks ex Gaertn. f. okoga/okoa Ochnaceae T TI Lovoa trichilioides Harms bibolo Meliaceae T TI Lycopersicon esculentum ngoro/ndodo Solanaceae V FO, ME, CU Macaranga sp. assas Euphorbiaceae T FW Macaranga sp. esob Euphorbiaceae T FW, ME Macaranga sp. nnom asas Euphorbiaceae T FW Maesobotrya sp. esese sanga Rahmnaceae T ME Maesopsis eminii Engl. assene koe/nkanga Rhamnaceae T TI Magnistipula tessmannii Engl. Prance evot Chrysbalanaceae FW Makhami sp. ose Bignoniaceae T TI, FO, ME Mangifera indica L. andok ntangan Anacardiaceae T FO, ME Mansonia altissima A. Chev. nkoul Sterculiaceae T TI, ME, FW Maranthes chrysophylla Oliv. Prance ex F. White ako Chrysobalanceae T Maranthes glabra (Oliv.) Prance asila Chrysobalanceae T Maranthes sp. koum Chrysobalanceae T TI, FO, ME Margaritaria discoides (Bail.) Webster ebebeng Euphorbiaceae T FW Markhamia lutea (Benth.) K. Shum angossa Bignoniaceae T TI, ME Massularia acuminata (G. Don) Bullock ex Hoyle oyebe Rubiaceae T TO Massularia sp. olo oyebe Rubiaceae S TO Megaphrynium macrostachyum akoe Maranthaceae H TO Microberlinia sp. alen ele Mimosaceae T Milicia exelsa (Welv.) C.C. Berg abang Moraceae T TI, ME Milicia sp. nnom abang Moraceae T TI, ME Milicia sp. mevul abang Moraceae T TI, FO, ME Morinda lucida Benth. akeng Rubiaceae T ME Musanga cecropioides R. Br. asseng Moraceae T TO Myrianthus arboreus P. Beauv. engakom Moraceae T FO, ME Nauclea didericchi (De Wild. & Th. Dur.) Merill akondok Rubiaceae T TI, ME Ochtocosmus africanus Hook. F. alan Ixonanthaceae T TI, FO, ME Odyendyea gabonensis (Pierre) Engl. ozek Simaroulaceae T

235
Omphalocarpum procerum P. Beauv. mebemengon Sapotaceae S TIME Oncoba welwitschii Oliver esolengom Flacourtiaceae T ME Ongokea gore (Hua) Pierre angueuk Olaceae T TI, ME Oubanguia alta Bak. J. megnou messi Scytopetalaceae T TI Pachypodanthium staudtii Engl. & Diels. ntom Annonaceae T TI Panda oleosa Pierre evindi afan Pandaceae S TO, ME Panda sp. dilik/afane Pandaceae S TO Panda sp. ndazoa Pandaceae S FO, ME
Panda sp. nditik Pandaceae S FO, ME Panda sp. ndjenda Pandaceae S FO, ME
Panda sp. onong mefane Pandaceae S TO Paraberlinia sp. avouta Mimosaceae T TI, ME Parinari excelsa Sabine asilkon Rosaceae T TI Parkia bicolor A. Chev. esseng Mimosoideae T TI, FO, ME Parkia sp. edzin Mimosoideae T Parkia sp. essang Mimosaceae T TI, FO, ME Pchyalthia suareclens otoungui Annonaceae S TO Pentaclethra macrophylla Benth. ebae Mimosaceae T TI, ME, CU Peptadeniastrum africanum (Hook f.) Brenan atui Mimosaceae T TI Persea americana Miller fia Lauraceae T FO, FW Petersianthus macrocarpus (P. Beauv.) Liben abing Lecythidaceae T TI, FO, ME Petersianthus macrocarpus (P. Beauv.) Liben nnom abing Lecythidaceae T TI, ME Picralima nitida (Stapf) Th. & H. Dur. ebam Apocynaceae T ME Piptadenia gabunensis (Harms) Robyns edoum Mimosaceae T TI, FW Plagiostyles africana (Muell. Arg.) Prain esoula Euphorbiaceae T TI, FO, ME Pseudospondias longifolia Engl. ofes Anacardiaceae T Pteleopsis hylodendron Mildbr. sikong Combretaceae T TI Pterocarpus soyauxii Taub. mbel (blanc) Papilionaceae T TI, ME Pterocarpus sp. esi (mbel) Papilionaceae T TI, ME Pterygota bequaertii De Wild. efok ayous Sterculiaceae T TI

236
Pycnanthus angolensis (welv.) Exell eteng Myristicaceae T TI, ME, FW Raphia sp. nkan-raphia Palmaceae T TO Raphia sp. zam Palmaceae T FO, TO Raphia sp. zam (ngonfe) Palmaceae T FO, ME Rauwolfia sp. essombi Apocynaceae T FW, ME Rauwolfia sp. medjanga Apocynaceae T TO, ME Ricinodendron heudelotii (Baill.) Heckel ezezang Euphorbiaceae T FO, ME Rothmannia sp. asom Rubiaceae T TI, FO, ME Saccharum officinarum nkok Poaceae H FO, ME Sacoglottis sp. bidou Huminaceae T TI Santiria trimeria (Oliv.) Aubréville ebap Burseraceae T ME Sarcocephalus diderrichii De Wild. et Th. Dur atondok Rubiaceae T TI, ME Sclerosperma mannii Wendl. adjimbi Palmae T TI, FO, ME Scottelia coriacea A. Chev. Ex Hutch. & Dalz. ngob issolo Flacourtiaceae T TI Scottellia coriacea bilo bi nkele Flacourtiaceae T TI, ME Scyphocephamiiun ochocoa Warb. ebal Myristicaceae T ME Scyphocephamiiun sp. eboug zok Myristicaceae T FW Scyphocephamiiun sp. eko'o Myristicaceae T TO Sida spp. zizim Malvaceae V TO Solanum aethiopicum zom nnam Amaranthaceae V FO, ME Solanum sp. zong Solanaceae V FO, ME Solanum sp. zom Solanaceae V FO, ME Spathodea campanulata P.B. evovon Bignoniaceae T FW, ME Spondianthus preussii Engl. var. preussii atom koe Euphorbiaceae T TI Spondias cytherea Sonner kasamangu Anarcardiaceae T FO Staudia Kamerunensis var. gabonensis (Warb. R. Fouilloy mbonda Myristicaceae T TI, ME Sterculia rhinopetala K. Schum nkanang Sterculiaceae T TI Sterculia rhinopetala K. Schum. nkana Steculiaceae T TI, ME Sterculia tragacantha Lindl. efok Sterculiaceae T FW Strombosia tetrandra Engl. oyan Olaceae T TI
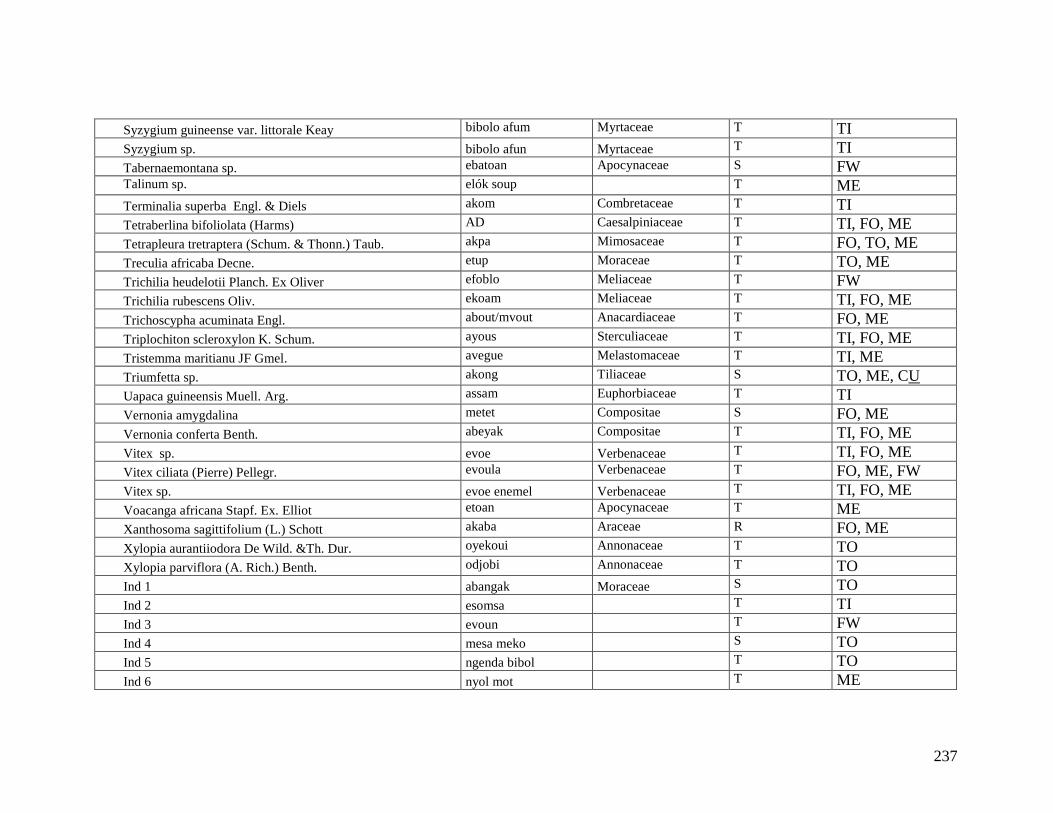
237
Syzygium guineense var. littorale Keay bibolo afum Myrtaceae T TI Syzygium sp. bibolo afun Myrtaceae T TI Tabernaemontana sp. ebatoan Apocynaceae S FW Talinum sp. elók soup T ME Terminalia superba Engl. & Diels akom Combretaceae T TI Tetraberlina bifoliolata (Harms) AD Caesalpiniaceae T TI, FO, ME Tetrapleura tretraptera (Schum. & Thonn.) Taub. akpa Mimosaceae T FO, TO, ME Treculia africaba Decne. etup Moraceae T TO, ME Trichilia heudelotii Planch. Ex Oliver efoblo Meliaceae T FW Trichilia rubescens Oliv. ekoam Meliaceae T TI, FO, ME Trichoscypha acuminata Engl. about/mvout Anacardiaceae T FO, ME Triplochiton scleroxylon K. Schum. ayous Sterculiaceae T TI, FO, ME Tristemma maritianu JF Gmel. avegue Melastomaceae T TI, ME Triumfetta sp. akong Tiliaceae S TO, ME, CU Uapaca guineensis Muell. Arg. assam Euphorbiaceae T TI Vernonia amygdalina metet Compositae S FO, ME Vernonia conferta Benth. abeyak Compositae T TI, FO, ME Vitex sp. evoe Verbenaceae T TI, FO, ME Vitex ciliata (Pierre) Pellegr. evoula Verbenaceae T FO, ME, FW Vitex sp. evoe enemel Verbenaceae T TI, FO, ME Voacanga africana Stapf. Ex. Elliot etoan Apocynaceae T ME Xanthosoma sagittifolium (L.) Schott akaba Araceae R FO, ME Xylopia aurantiiodora De Wild. &Th. Dur. oyekoui Annonaceae T TO Xylopia parviflora (A. Rich.) Benth. odjobi Annonaceae T TO Ind 1 abangak Moraceae S TO Ind 2 esomsa T TI Ind 3 evoun T FW Ind 4 mesa meko S TO Ind 5 ngenda bibol T TO Ind 6 nyol mot T ME

238
Ind 7 oboe nding T FO, ME Ind 8 obolso T ME Ind 9 okobze S ME Ind 10 okoeyoum T ME Ind 11 okpwam S TO Ind 12 ondodo befam S FO, ME Ind 13 osim T Ind 14 osso mezong T ME Ind 15 otolbo T TI, ME Ind 16 otougrou ele S TO Ind 17 tegue afan Tiliaceae T Ind 18 tsid modo T ME Ind 19 vande T TI Ind 20 zizim ele T TI
Legend : (*) indicate the introduced species ; the dominant growth form of the species, such as tree (T), shrub (S including woody or soft), herbs (H), liana (woody) represented by L or vine (soft or herbaceous) represented by V; The main species uses are represented by: timber (TI), food (FO), medicine (ME), tool (TO), fuel wood (FW) and cultural uses (CU).