wind-driven effects on the yellow sea warm current
TRANSCRIPT
JOURNAL OF GEOPHYSICAL RESEARCH, VOL. 103, NO. Cl3, PAGES 30,713-30.729, DECEMBER IS. 1~
Wind-driven effects on the Yellow Sea Warm Current
Andrea C. Mask and James J. O'BrienCenter for Ocean-Atmosphere Prediction Studies,Florida State University, Tallahassee
Ruth PrellerNawl Research Laboratory, Stennis Space Center, Mississippi
Abstract. The Yellow Sea is a shallow basin with an average depth of 44 m locatedbetween China_and the Korean Peninsula. One of the dominant ocean circulationfeatures of the Yellow Sea is a warm water intrusion known as the Yellow SeaWarm Current. This feature is present throughout the year but reaches its farthestnorthward extension in winter. The circulation of the Yellow, East China, andBohai Seas was modeled using the Princeton Ocean Model to better understandthe dynamics of the Yellow Sea Warm Current. The horizontal resolution ofthe model varies from 8 km in the Yellow Sea to 25 km in the East China Sea.Twenty-four sigma levels are used to define the vertical structure. The modeluses daily atmospheric forcing from the Navy Operational Global AtmosphericPrediction System for 1993. Open boundary conditions are applied at the TaiwanStrait, the Tsushima (Korea) Strait, an area south of Taiwan, and the TokaraStrait, with a closed boundary south of the Ryukyu Islands. The model resultsare examined to determine the effect of the wind on the northward extension ofthe warm water intrusion, using both water mass characteristics and northwardvelocity components. Sensitivity tests and spectrum analyses, performed to studythe influence of the wind on the Yellow Sea Warm Current, show that winds modifythe pathway and extent of the Yellow Sea Warm Current. The current's origin,however, appears to be due to external forcing from the current systems developedin the EaSt China Sea.
I
Asian continent, and the Aleutian Low, which coversthe northernmost section of the Pacific Ocean. Aprilis the period of alternating monsoons, when the winddirection is variable. By the end of May the southwestmonsoon begins. During the summer the wind blows tothe north with speeds that average about 1.5 m/s. Thismonsoon condition is associated with the seasonal lowpressure over China and the North Pacific High south-east of Japan [Fairbridge, 1966]. These winds affect thelocal ocean currents and heat fluxes.
There are several well-defined warm currents in theYellow Sea and the East China Sea (Figure 1). TheKuroshio, the dominant current in this system, with amaximum speed of >0.4 m/s [Song, 1994], enters theEast China Sea southeast of Taiwan, follows the con-tinental slope to the northeast, and exits south of theJapanese island of Kyushu through the Tokara Strait.Approximately 200 km west of Kyushu Island, a smallnorthward branch splits off. the Kuroshio, the TsushimaWarm Current, with a maximum speed of about 0.25m/s [Song, 1994]. The Tsushima Warm Current ex-its the East China Sea through the Korea (Tsushima)Strait. The Taiwan Warm Current flows north fromthe Taiwan Strait into the East China Sea. During thewinter it is at its weakest, about 0.13 m/s [Yuan and
1. IntroductionThe Yellow Sea, one of the western Pacific marginal
seas, is located between China and Korea.. Bounded tothe north by the Bohai Sea and to the south by theEast China Sea, this shallow, semienclosed sea has amaximum depth of 103 m and an average depth of 44m. The Bohai Sea is a shallow bay area with an averagedepth of 20 m, while the East China Sea has a maximumdepth of approximately 2000 m and is separated fromthe western Pacific by the RyukYu Islands. The divisionbetween the East China Sea and the Yellow Sea is oftentaken to be from the mouth of the Yangtze River toCheju Island.
The Yellow Sea region is dominated by a strongnortherly (NNE-NW) monsoon from late November toMarch that has an average speed in January of approx-imately 10 m/s [Yuan and Su, 1984}. This monsooncondition is associated with the steep pressure gradientbetween the Siberian High, which covers most of the
Copyright 1998 by the American Geophysical Union.
Paper number 1998JC900007.
0141-0227 /98/1998JC900007$09.00
30,713

30,714 MASK ET AL , WIND-DRIVEN EFFEC'l'S ON YELLOW SEA WARM CURRENT
120 125 1 ' F:
I
water mass intrudes into the Yellow Sea as far as 34°N[Hsueh, 1988; Liu et aI., 1992], while studies examin-ing only the current velocities have concluded that thewinter NE monsoon drives a southward coastal currentthat is balanced by a northward Bow in the Yellow Seabasin, i.e., the interior portion of the Yellow Sea [Hauehand Yuan, 1997] that can reach the Bohai Sea. In sum-mer the water mass does not penetrate into the YellowSea basin [Park, 1986]. The dynamic properties of thesummer, northward current have been attributed to ahorizontal gradient of density, implying geostrophic Bow[Lie, 1986].
In this paper the effect of the wind on the water massintrusion and the Bow of the Yellow Sea Warm Currentis investigated using a numerical ocean model. Numer-ical ocean models can be useful tools, providing insightto the dynamics and thermodynamics of a region wheredata are scarce. The Yellow Sea is one such region.Even though many oceanic observations in the YellowSea have been undertaken, most of these studies resultin time series less than a half a year in length. Long timeseries are particularly difficult to obtain in the YellowSea because of the intense fishing there. Many moor-ings placed in the Yellow and East China Seas havebeen damaged or recovered by fishing nets. Thus lim-ited verification data are available to improve models.Among the m~t important data for the modeling ofshallow seas are measurements of bottom topography,winds, and heat Buxes. This statement is particularlytrue for the Yellow Sea, which is shallow enough thatduring winter, when the winds are strong, the regionbecomes well mixed from the surface to the bottom.
The model used is described in the following section.The next section presents the basic model results. Sec-tion 3 discusses the extent of the intrusion of the mod-eled Yellow Sea Warm Current, which is followed by adiscussion of the relationship between the wind and theYellow Sea Warm Current based on spectrum analysis.The final section presents the conclusions, which indi-cate that the wind is not the only strong infiuence onthe Yellow Sea Warm Current.
Figure 1. Major currents of the Yellow Sea region(redrawn from Yuan and Su [1984]), for (left) winterand (right) summer: 1, Kuroshio; 2, Kuroshio Coun-tercurrent; 3, Tsushima Warm Current; 4, Yellow SeaWann Current; 5, Taiwan Warm Current; 6, Yellow SeaCoastal Current; 7, Taiwan Coast.&l Current; 8, KoreanCoastal Current; 9, Yellow Sea Cold Water; and 10,Cheju Cyclonic Gyre.
2. Model
Su, 1984]. The Yellow Sea Warm Current ftows north-ward following topographic contours, through the cen-tral part of the Yellow Sea basin, and has a maximumspeed of about 0.25 m/s [Fairbridge, 1966].
There are also several significant cool currents. TheYellow Sea Cold Water is a water mass that is formed inthe winter owing to strong vertical mixing. In the sum-mer this water mass ftows southward under the ther-mocline [Park, 19861. The Yellow Sea Coastal Cur-rent ftows southward along the China coast year round.The Zhejiang-Fujian Coastal Current hugs the coastof China from the Yangtze River southward and exitsthrough the Taiwan Strait. The Korean Coastal Cur-rent ftows southward along the western side of Koreaand then ftows along the southern edge of the KoreanPeninsula, exiting through the Korea Strait. For de-tails, see Zheng and Klema6 [1982] and Lie [1986].
The impingement of the Kuroshio on the East ChinaSea is an important aspect of the regional dynamics.This ~tem boundary current dominates the oceanog-raphy of the East China Sea. The Kuroshio also has alarge impact on the Yellow Sea, since the complicatedshelf topography of the East China Sea promotes thebranching of smaller currents. from the Kuroshio [H6Uehet aI., 1996; Yuan et al., 1986]. These smaller currentsare some of the most interesting and difficult aspects ofthe Yellow Sea to model. The least und~tood of thesecurrents is the Yellow Sea Warm Current.
In previous literature the Yellow Sea Warm Currentis defined both by its dynamic properties (velocity) orits thermodynamic properties (water mass). When theposition of the water mass is compared with that ofthe velocities, coDBicting patterns can occur, suggest-ing an interference by an external force. In winter the
The ocean model used in this study is a time-dependent,three-dimensional, primitive equation, sigma coordi-nate model, originally developed by Blumberg and M el-lor [1981J at Princeton University, and is commonly re-ferred to 88 the Princeton Ocean Model (POM) [Mel-lor, 1996J. The particular ~ersion used here contains amodified mixed layer 88 defined by K antha and Clayson[1994J.
The Yellow Sea model uses a rectilinear grid (Fig-ure 2) that has a horizontal resolution of 25 kin at itssouthernmost grid point (21.89°N, 122.44°E) and in-creases to 8 kin at its northernmost grid point (42.54°N,122.801°E) and. has 24 sigma levels in the vertical.There are fout open boundaries, one each north and
MASK ET AL.: WlND-DRIVEN EFFECTS ON YELLOW SEA WARM CURRENT -W,1l5
428N
38-N.G 34"N
~~
::3'~ 30"N
...~~~~
~~~b-
~o~~
2&-N t22-N
-r-r-r-. I I . I .'
118.. 122.. 128.. 13" 1."A.-'
Lo~tude
-
~-;
""
~
.
110". 114,". --.;
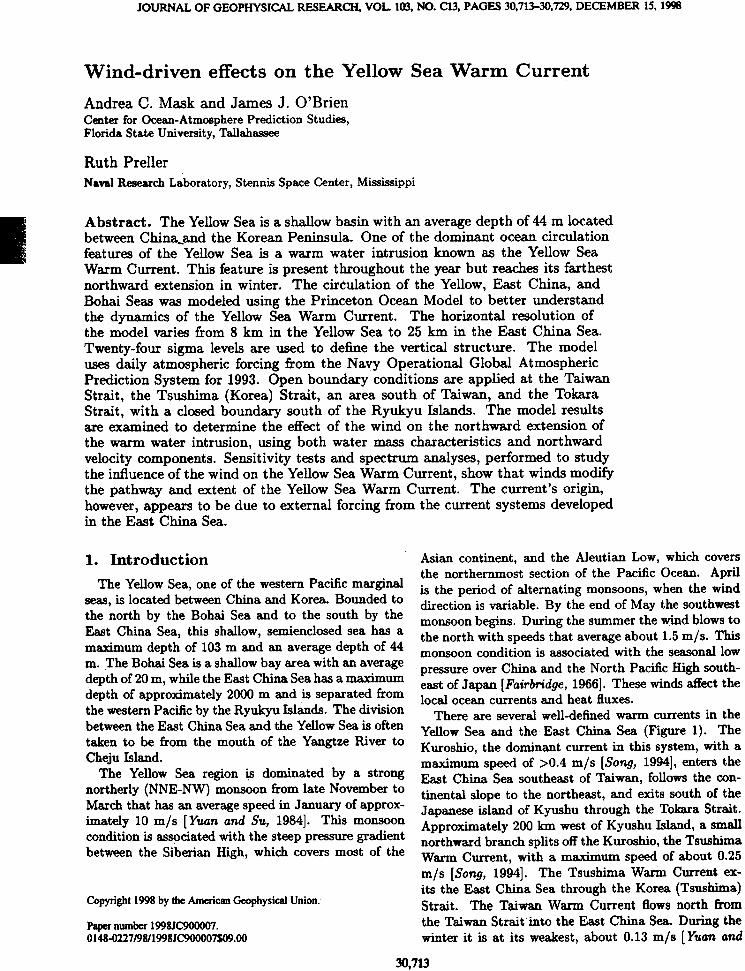
Figure 2. Yellow Sea model grid (every other pointplotted), with open boundaries at A, B, C, and D.
south .of Taiwan and one each north and south of Kyushu,Japan. At each of these boundaries the temperature,salinity, and velocities are prescribed. At boundaryA, the Taiwan Strait, the temperature and salinity areprescribed as seasonal profiles that are linearly interpo-lated &0 each model time step, and the vol1ime trans-port is aISUmed to be 1 Sv (Sv = lxlot m'/s) less thanthat through boundary C, the Tsushima (Korea) Strait.At boundary B, aouth of Taiwan, winter and 8',mmertemperature and salinity profiles are linearly interpo-lated to each model time step, and the transports aregeostrophically balanced inSows that are adjusted untilthe depth-integrated velocities yield a transport of 23Sv. At boundary C, if Bow is into the Yellow Sea re-gion, monthly profiles of temperature and salinity arelinearly interpolated to each model time step, and theoutBa.' velocity '9a1ues applied at the boundary are sea-sonal with '9a1uea between 2 and 4 Sv. At boundary D,the Tokara Strait, Japan, the conditioDS are the sameas for boundary B, except that the transport is 22 Sv.The offshore boundary is a closed boundary, assuming anegligible exchange of the mass and momentum acrossthe boundary.
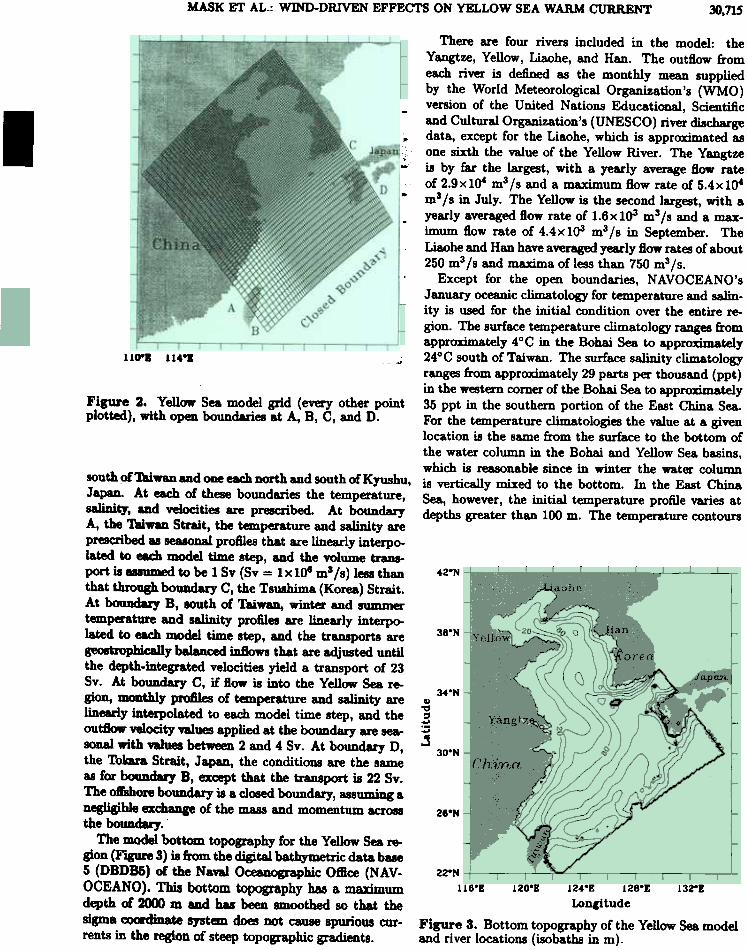
The model bottom topography for the Yellow Sea re-gion (Figure 3) is &om the digital bathymetric data base5 (DBDB5) of the Naval Oceanographic Office (NAV-OCEANO). This bottom topography has a maximumdepth of 2000 m and has been smoothed so that thesigma ooordinate syst~ does not cause spurious cur-rents in the region of steep topographic gradients.
There are four rivers included in the model: theYangtze, Yellow, Liaohe, and Han. The outflow fromeach river is defined as the monthly mean suppliedby the World Meteorological Organization's (WMO)version of the United Nations Educational, Scientificand Cultural Organization's (UNESCO) river dischargedata, except for the Liaohe, which is approximated asone sixth the value of the Yellow River. The Yangtzeis by far the largest, with a yearly average flow rateof 2.9x1Q4 m3/s and a maximum flow rate of 5.4x1Q4m3/s in July. The Yellow is the second largest, with ayearly averaged flow rate of 1.6x10³ m3/s and a max-imum flow rate of4.4x103 m3/s in September. TheLiaohe and Han have averaged yearly flow rates of about250 m3/s and maxima of less than 750 m3/s.
Except for the open boundaries, NAYOCEANO'sJanuary oceanic climatology for temperature and salin-ity is used for the initial condition over the entire re-gion. The surface temperature climatology ranges fromapproximately 4°C in the Bow Sea to approximately24°C south of Taiwan. The surface salinity climatologyranges from approximately 29 parts per thousand (ppt)in the western comer of the Bow Sea to approximately35 ppt in the southern portion of the East China Sea.For the temperature climatologies the value at a givenlocation is the same from the surface to the bottom ofthe water column in the Bow and Yellow Sea basins,which is reasonable since in winter the water columnis vertically mixed to the bottom. In the East ChinaSea, however, the initial temperature profile varies atdepths greater than 100 m. The temperature contours
4,2-N
38°N
MONI)
'C~..::I~
300N
2S0N
22"N116°1 120°1 124,°Z 128°£ 13~1
Lonlitude
Figure 3. Bottom topography of the Yellow Sea modeland river locations (isobaths in m).

30,716 MASK ET AL. WIND- DRJVEN EFFECTS ON YELLOW SEA WARM CURRENT
lie almost east to west, running nearly parallel to themouth of the Yellow Sea. The salinity climatology ispredominantly uniform from top to bottom in the Bo-hai and Yellow Sea basins; however, there is variationwith depth around Kyushu, Japa,n, along the Chinesecoast south of the Yangtze River, and in the deep por-tions of the East China Sea. The horizontal salinity con-tours are aligned in an east-west direction in the EastChina Sea, but they are oriented more north-south inthe Yellow Sea, with the higher salinities on the Ko-rean side of the basin. Atmospheric fo!cing (air tem-perature, wind stress, and vapor pressure) is from theNavY Operational Global Atmospheric Prediction Sys-tem (NOGAPS) 1.25° x 1.25°model for 1993. No tideshave been included in this model to simplify the studyof the major ocean currents.
I
northward at all levels; however, the flow is more orga-nized into currents between 20 and 50 m depth. Thisorganized northward flow is the Yellow Sea Warm Cur-rent. Other currents that dominate at all levels studiedinclude the Kuroshio and the Tsushima Warm Current,which flows into the Japan Sea.
In summer (Plate Ib) a southward coastal currentcalled the Yellow Sea Coastal Current by Yuan andSu [1984] dominates the surface circulation of the Yel-low Sea. The outflow of the Yangtze joins the YellowSea Coastal Current and Bows from the coast of Chinatoward the southern tip of Korea in the upper layers.Other important summer currents are the Kuroshio andthe Tsushima Warm Current, as in winter, but also theTaiwan Warm Current. The Yellow Sea Warm Cur-rent penetrates into the Yellow Sea basin; however, theinteraction with the Yangtze runoff complicates the vi-sualization of this feature. Because of this interaction,most of the Yellow Sea Warm Current appears to beblocked, at all model depths, from entering the basinand turns to Bow out of the basin between Cheju Islandand Korea.
3. Yellow Sea Model ResultsTwo runs of the model were performed to study the
Yellow Sea Warm Current. The first run, the windcase, was completed with all the forcing described inthe model section.. The second run, called the no-windcase, was completed with identical forcing, except thewind stress was set to zero after the calculation of thesensible and latent heat flux. That is, the wind stresswas only used for the calculation of sensible and latentheat flux to prevent unrealistic heat exchanges, and thewind exerts no mechanical stress on the ocean in thisexperiment. For both runs (the winter and summer)the surface, 20 m, and 50 m currents, temperature, andsalinity are discussed. February 3 and August 15, 1993,are the representative days chosen for winter and sum-mer, respectively. The wind stress for these 2 days istypical of a frontal passage during the respective season.On February 3, the wind stress magnitude was approxi-mately 0.02 NJm2 and is from the west over the YellowSea and from the north over most of the East ChinaSea. In August the wind stress magnitude is again ap-proximately 0.02 NJm2, and the wind is from the northover the Yellow Sea and from the west over the EastChina Sea. In winter a typical day with no frontal pas-sage has wind stress between 0.1 and 0.25 NJm2 and, iffrom the north, over the entire study area. In summer atypical day with no frontal passage has wind stress be-tween 0.02 and 0.15 NJm2 and is variable in direction,but often at least half of the study area has winds fromthe south.
3.2. Currents: No-Wind Case
Without wind forcing the currents are, at some loca-tions, almost an order of magnitude weaker (Plates lcand Id), this is especially true in the Yellow Sea basin.In Plates lc and Id, areas completely devoid of vectorshave speeds below 0.01 m/s. In winter (Plate lc) thereis a southward flow parallel to the Korean coast in theupper layers. Also, the Yellow Sea Warm Current flowsinto the basin at all levels.
There are many similarities between the wind and no-wind cases. The Kuroshio and Tsushima Warm Currentare present at all levels year round, with the TaiwanWarm Current increasing its presence in summer. Alsoin summer (Plate Id) there is southward moving coastalcurrent along the Korean side of the Yellow Sea basinin the upper layers. The Yellow Sea Coastal Currentjoins with the Yangtze outflow, as in the wind case,and flows across the mouth of the Yellow Sea towardKorea. Lastly, the Yellow Sea Warm Current appearsto penetrate the Yellow Sea basin, and it then turns andexits through the Korean Strait at all levels.
3.3. Temperature
Despite the initialization of the model by a highlysmoothed, climatological representation of the warmtongue, a well-defined warm tongue develops within aweek (Plate la). This warm tongue is a recognized win-ter feature of the Yellow Sea. Because of strong verticalmixing in the winter, the water column, in the Bohaiand Yellow Sea basins, is mixed to the bottom, withtemperature5 ranging from O°C in the Bohai Sea to ap-proximately 25°C just south of Taiwan. In summer(Plate Ib) the warm tongue is not as distinct, partlybecause of the strong eMtward How across the mouth
3.1. Currents: Wind Case
In winter and summer (Plates la and Ib) the currentsfollow the basic patterns of flow as described by Yuanand Su [1984]. In winter, at the surface, flow followsthe wind pattern. At 20 m (Plate la) there i5 south-ward flow along the Korean coast and a northward flowalong the Chinese coast of the Yellow Sea. In the inte-rior of the Yellow Sea, basin currents are predominantly

MASK ET AL WIND-DRIVEN EFFECl'S ON YELLOW SEA WARM CURRENT 30,717
was present or absent. This statement is also true forthe basic positioning of the currents. Therefore it canbe concluded that the local wind stress does not cre-ate the features of the Yellow and East China Seas.The boundary conditions (topography, river inHowandcurrent, temperature, and salinity input at the openboundarieS) and the heat fluxes are the major inHuenceon the generation of the currents and temperature andsalinity features of the Yellow and East China Seas.
of the Yellow Sea basin due to the increased outftowof the Yangtze and partly because of the reduction ofthe temperature gradient between warm water advectedwith the wann tongue and the radiationally warmedsurface wate:. The temperatures range from approxi-mately 22°C in the Bohai Sea to approximately 30°Csouth of Taiwan at the surface and approximately 10°Cin the central Yellow Sea to approximately 28°C southof Taiwan at 50 m depth.
The surface temperatures of the no-wind case are verysimilar to the temperatures of the wind case. However,in winter (Plate lc) the warm tongue does not pene-trate a& far into the Yellow Sea basin in the no-windcase. The temperature range in winter is the same forthe wind and no-wind cases at all levels. In summer(Plate Id) the basic temperature patterns are the same,but, at depth, the water is cooler in the no-wind case,particularly on the Korean side of the Yellow Sea basin.Temperatures range from approximately 20° C in theBohai Sea to approximately 30°C in the entire south-ern portion of the East China Sea at the surface, andat 50 m depth the temperature ranges from approxi-mately 6°C in the northern part of the Yellow Sea toapproximately 26°C south of Taiwan.
4. Yellow Sea Warm Current Intrusion
The two most common ways of defining the YellowSea Warm Current are (1) by its temperature and salin.ity and (2) by its velocity. Depending on the definition,the characteristics of the intrusion may be very differ.ent. To study the maximum penetration of the Yel-low Sea Warm Current, both definitions are examined.First, the water mass characteristics of Su and Weng[1994] were used, which are described in Table 1.
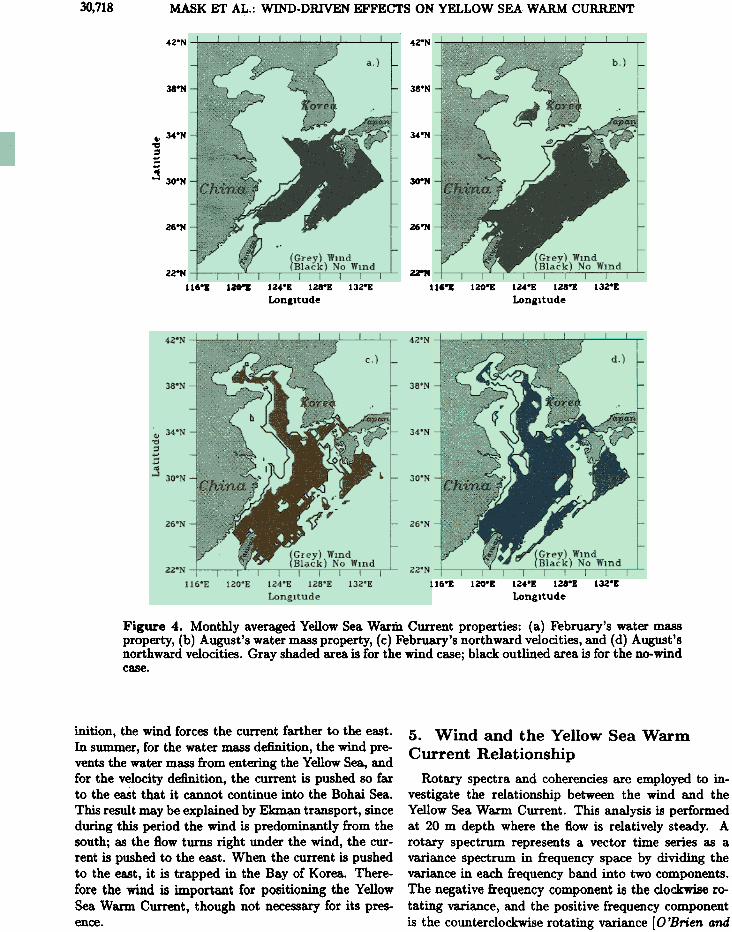
In February (Figure 4a) the wind case penetrates toMoN, which is also the penetration suggested by Hmeh[1988]; the no-wind case penetrates to 33°N. In August(Figure 4b) the wind case penetrates to 32DNj the no-wind case penetrates to 33°N.1n summer the wind casewater mass does not penetrate into the Yellow Sea basinas far because of the greater strength of the YangtzeRiver outftow, which reaches to the Korean coast, block-ing the entry of the Yellow Sea Warm Current. Thisblocking does not happen in the no-wind case becausethe Yangtze outflow does not re8cl1 Korea.
In the second characterization the Yellow Sea WarmCurrent was defined by velocities at 20 m depth withspeeds less than 0.25 m/s and directions with a north-ward component, since most of the flow in the YellowSea basin is either northward or southward with verylittle eastward or westward flow. In February (Figure4c) the flow continues into the Bohai Sea for the windcase. In the no-wind case it does not penetrate into theBohai Sea, and the path of the flow is to the west of thepath of the wind case. In August (Figure 4d), for thewind case the flow does not continue to the Bohai Seabut, instead, is detoured to the Bay of Korea. For theno-wind case the flow has a path similar to that of thewinter case, where it continues into the Bow Sea.
Hence, in winter, for the water mass definition thewind seems to force water of warmer temperature andhigher salinity into the basin, and for the velocity def-
Table 1. Yellow Sea Warm Current Water Ma88
Period Temperature,DC
Salinity,parts per thoU$aDd
June-November
December-May
>21 .
12 <T<21
>33.5>33.5
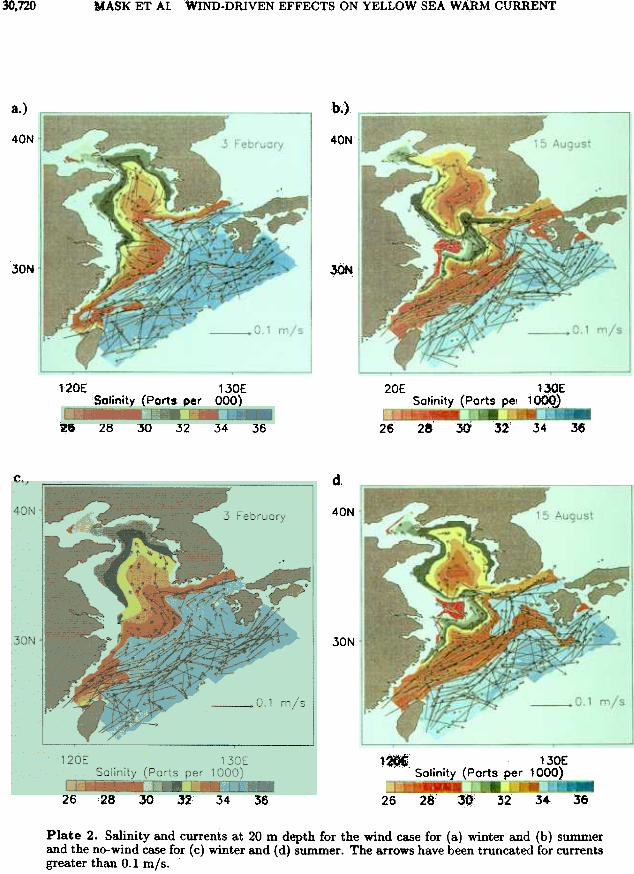
3.4. SalinityLike temperature, the salinity in winter (Plate 2a) is
mixed to the bottom and has higher salinity along thepath of the warm tongue. The salinity ranges from 29.5ppt at the mouth of the Yellow River in the Bohai Seato 35 ppt in the southern portion of the East ChinaSea. There is also a salinity minimum at the mouth ofthe Yangtze River. In summer (Plate 2b) the salinityanomaly from the Yangtze River extends from China tothe coast of Korea. Aside from this feature, the salin-ity increases from north to south in the upper layers.In th~ upper layers the salinity ranges from approxi-mately 29 ppt at the mouths of the Yellow and LiaoheRivers in the Bohai Sea to approximately 34.5 ppt inthe southern portion of the East China Sea. At 50 mdepth there is no indication of the salinity minimumcaused by the Yangtze outflow.
In winter (Plate 2c) the salinity of the no-wind caseis very similar to the wind case, mostly because of theinfluence of the initializing climatology. The main dif-ference is that, as in the temperatures, the penetrationof the salinity m~'timum is Dot as deep into the YellowSea basin for the no-wind case. In summer (Plate 2d)the minimum due to the Yangtze outflow is still presentin the upper layers but does not quite reach the Ko-rean coast. The range for the salinities is basically thesame as in the wind case, but the salinity at the mouthsof the Yellow and Yangtze Rivers is approximately 26ppt. The salinity is fairly uniform throughout the watercolumn, at least to a depth of 50 m.
In all levels of the model the temperature and salinityfollow the same basic pattern whether the wind forcing
30,718 MASK ET AL.: WIND-DRIVEN EFFECTS ON YELLOW SEA WARM CURRENT
4Z0N 4Z"N
380M 38'N
" 34°N~~...;;
j 3O"N
MON
3O0N
U'N 260M
22"N 2a-N116.. 120"1 lZ.'B lZa"B
LoDlltud~13~E 116"1 lZ0"E 12."E 128"£
Longitude
13Z"E
12..£ 128.£Longitude
13ze!116"£ 120'1
Figure 4. Monthly averaged Yellow Sea Wanil Current properties: (a) February's water massproperty, (b) August's water mass property, (c) February's northward velocities, and (d) August'snorthward velocities. Gray shaded area is for the wind case; black outlined area is for the no-windcase.
inition, the wind forces the current farther to the east.In summer, for the water mass definition, the wind pre-vents the water mass from entering the Yellow Sea, andfor the velocity definition, the current is pushed so farto the east that it cannot continue into the Bohai Sea.This result may be explained by Ekman transport, sinceduring this period the wind is predominantly from the50uth; as the Bow turns right under the wind, the cur-rent is pushed to the east. When the current is pushedto the east, it is trapped in the Bay of Korea. There-fore the wind is important for positioning the YellowSea Warm Current, though not necessary for its pres-ence.
5. Wind and the Yellow Sea WarmCurrent Relationship
Rotary spectra and coherencies are employed to in-vestigate the relationship between the wind and theYellow Sea Warm Current. This analysis is performedat 20 m depth where the How is relatively steady. Arotary spectrum represents a vector time series as avariance spectrum in frequency space by dividing thevariance in each frequency band into two components.The negative frequency component i5 the clockwise ro-tating variance, and the positive frequency componentis the counterclockwise rotating variance [0 'Brien and

MASK ET AL.: ~-DRIVEN EfFECTS ON YELLOW SEA WARM RREN!r 30,719
a..
40N
JON
0' ~ 20 ~ ~ 0 ~10 20 30 '.0
c. d.
.oN 40N
30N 30N
~o
0 1~"" 20 ~ :40 ;0 !YO) 20 30 40
Plate 1. Temperature and currents at 20 m depth for the wind case for (a) winter and (b)summer and the no-wind case for (c) winter and (d) summer. The arrows have been.truncatedfor currents greater than 0.1 m/s.
30.720 WIND-DRIVEN EFFECTS ON YELLOW SEA WA;RM CURRENTMASK ET AL
bJa.)
40N 40N
30N ~
120£ 130E000)
20E 1JOE1qQg)Salinity (Parts per Salinity (Ports pel
u 28 30 32 34 36 26 2&' 3ti 32 34 36
Co d.
40N
30N
1.*. 130£Salinity (Ports per 1000)
26 28 :;,0 ~'3" 34 34 36~ 26 28' ~ 32
Plate 2. Salinity and currents at 20 m depth for the wind case for (a) winter and (b) summerand the no-wind case for (c) winter and (d) summer. The arrows have been truncated for currentsgreater than 0.1 m/s.
3O.'nlMASK ET AL.: WIND-DRIVEN EFFECTS ON YELLOW SEA WARM CURRENT
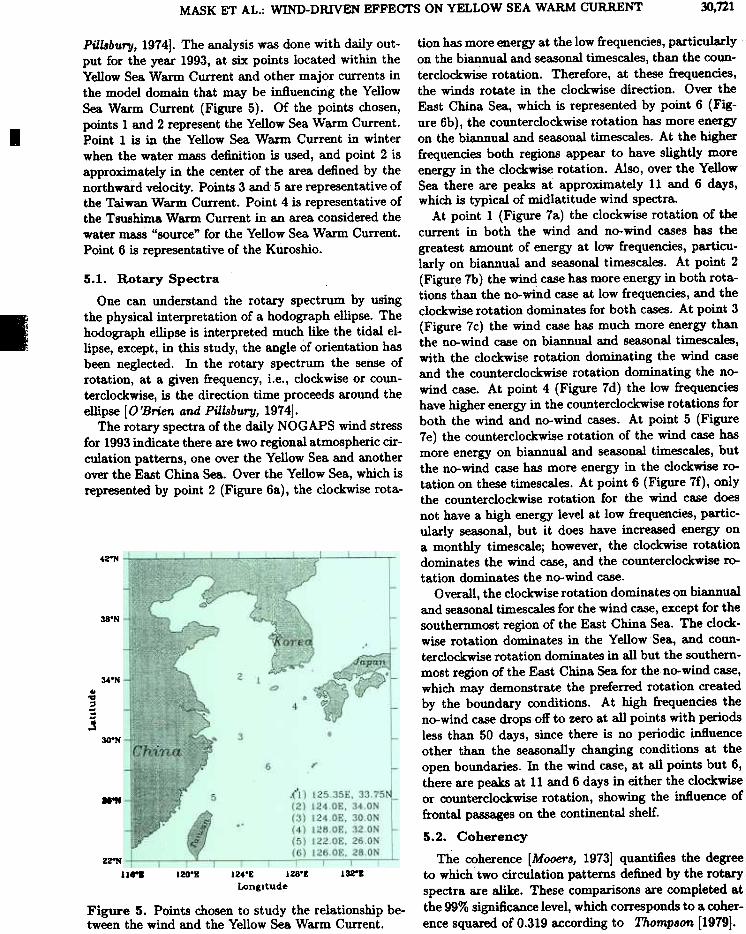
Pill6bury, 1974]. The analysis was done with daily out-put for the year 1993, at six points located within theYellow Sea Warm Current and other major currents inthe model domain that may ~ influencing the YellowSea Warm Current (Figure 5). Of the points chosen,points 1 and 2 represent the Yellow Sea Warm Current.Point 1 is in the Yellow Sea Warm Current in winterwhen the water mass definition is used, and point 2 isapproximately in the center of the area defined by thenorthward velocity. Points 3 and 5 are representative ofthe Taiwan Warm Current. Point 4 is representative ofthe Tsushima Warm Current in an area considered thewater mass "source" for the Yellow Sea Warm Current.Point 6 is representative of the Kuroshio.
.
.5.1. Rotary Spectra
One can understand the rotary spectrum by usingthe physical interpretation of a hodograph ellipse. Thehodograph ellipse is interpreted much like the tidal el-lipse, except, in this study, the angle of orientation hasbeen neglected. In the rotary spectrum the sense ofrotation, at a given frequency, i.e., clockwise or coun-terclockwise, is the direction time proceeds around theellipse [O'Brien and Pillsbury, 1974].
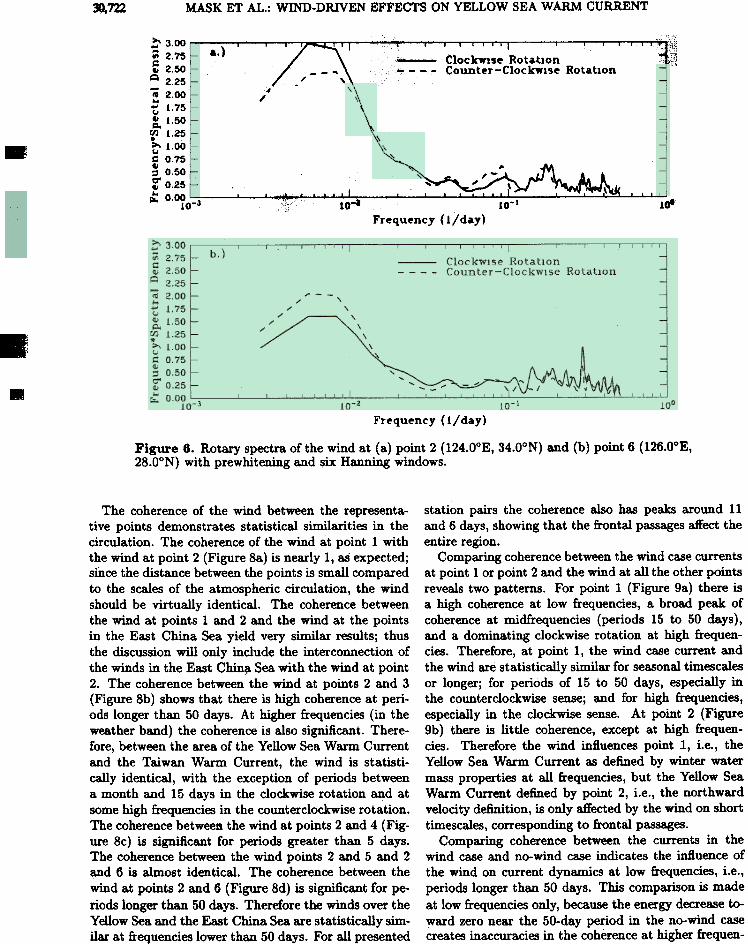
The rotary spectra of the daily NOGAPS wind stressfor 1993 indicate there are two regional atmospheric cir-culation patterns, one over the Yellow Sea and anotherover the East China Sea. Over the Yellow Sea, which isrepresented by point 2 (Figure 6a), the clockwise rota-
42"N
38'N
I34'N ...~=...:;
~
.s300M
,..e
(1) 125.35E,(2) 124.0E, M.ON(3) 124.0£, 30.0N(4) 128.0£. 32.0N(5) 122.0£, 26.0N(6) 126.0E, 28.0N
"..
tion has more energy at the low frequencies, particularlyon the biannual and seasonal timescales, than the coun-terclockwise rotation. Therefore, at these frequencies,the winds rotate in the clockwise direction. Over theEast China Sea, which is represented by point 6 (Fig-ure 6b), the counterclockwise rotation has more energyon the biannual and seasonal timescales. At the higherfrequencies both regions appear to have slightly moreenergy in the clockwise rotation. Also, over the YellowSea there are peaks at approximately 11 and 6 days,which is typical of midlatitude wind spectra.
At point 1 (Figure 7a) the clockwise rotation of thecurrent in both the wind and no-wind cases has thegreatest amount of energy at low frequencies, particu-larly on biannual and seasonal timescales. At point 2(Figure 7b) the wind case has more energy in both rota-tions than the no-~d case at low frequencies, and theclockwise rotation dominates for both cases. At point 3(Figure 7 c) the wind case has much more energy thanthe no-wind case on biannual and seasonal timescales,with the clockwise rotation dominating the wind caseand the counterclockwise rotation dominating the no-wind case. At point 4 (Figure 7d) the low frequencieshave higher energy in the counterclockwise rotations forboth the wind and no-wind cases. At point 5 (Figure7e) the counterclockwise rotation of the wind case hasmore energy on biannual and seasonal timescales, butthe no-wind case has more energy in the clockwise ro-tation on these timescales. At point 6 (Figure 7f), onlythe counterclockwise rotation for the wind case doesnot have a high energy level at low frequencies, partic-ularly seasonal, but it does have increased energy ona monthly timescale; however, the clockwise rotationdominates the wind case, and the counterclockwise ro-tation dominates the no-wind case.
Overall, the clockwise rotation dominates on biannualand seasonal timescales for the wind case, except for thesouthernmost region of the East China Sea. The clock-wise rotation dominates in the Yellow Sea, and coun-terclockwise rotation dominates in all but the southern-most region of the East China Sea for the no-wind case,which may demonstrate the preferred rotation createdby the boundary conditions. At high frequencies theno-wind case drops off to zero at all points with periodsless than 50 days, since there is no periodic inftuenceother than the seasonally changing conditions at theopen boundaries. In the wind case, at all points but 6,there are peaks at 11 and 6 days in either the clockwiseor counterclockwise rotation, showing the inftuence offrontal passages on the continental shelf.
5.2. Coherency
The coherence [Mooers, 1973] quantifies the degreeto which two circulation patterns defined by the rotaryspectra are alike. These comparisons are completed atthe 99% significance level, which corresponds to a coher-ence squared of 0.319 according to Thompson [1979].
Z2"NlUOE 1 28°E
Longitude
132"111" 120"X
Figure 5. Points cllosen to study the relationship be-tween the wind and the Yellow Sea Warm Current.
MASK ET AL.: WIND-DRIVEN EFFECTS ON YELLOW SEA WARM CURRENT~722
",'::' 3.00 ~
;; 2.75 a.) ~f 2.50 RotationQ 2.25
.. 2.00..t: 1.75
~ 1.50
~ 1.25~ 1.00~ 0.75II~ 0.500-Il 0.25 I~ 0.010-3 10-
4'of
-Frequency (l/day)
-.
Frequency (l/day)
Figure 6. Rotary spectra of the wind at (a) point 2 (124.0oE, 34.00N) and (b) point 6 (126.0oE,28.00N) with prewhitening and six Hanning windows.
The coherence of the wind between the representa-tive points demonstrates statistical similarities in thecirculation. The coherence of the wind at point 1 withthe wind at point 2 (Figure 8a) is nearly 1, as expected;since the distance between the points is small comparedto the scales of the atmospheric circulation, the windshould be virtually identical. The coherence betweenthe wind at points 1 and 2 and the wind at the pointsin the East China Sea yield very similar results; thusthe discussion will only include the interconnection ofthe winds in the East Chin~ Sea with the wind at point2. The coherence between the wind at points 2 and 3(Figure 8b) shows that there is high coherence at peri-ods longer than 50 days. At higher frequencies (in theweather band) the coherence is also significant. There-fore, between the area of the Yellow Sea Warm Currentand the Taiwan Warm Current, the wind is statisti-cally identical, with the exception of periods betweena month and 15 days in the clockwise rotation and atsome high frequencies in the counterclockwise rotation.The coherence between the wind at points 2 and 4 (Fig-ure 8c) is significant for periods greater than 5 days.The coherence between the wind points 2 and 5 and 2and 6 is almost identical. The coherence between thewind at points 2 and 6 (Fi~e 8d) is significant for pe-riods longer than 50 days. Therefore the winds over theYellow Sea and the East China Sea are statistically sim-ilar at frequencies lower than 50 days. For all presented
station pairs the coherence also has peaks around 11and 6 days, showing that the frontal passages affect theentire region.
Comparing coherence between the wind case currentsat point 1 or point 2 and the wind at all the other pointsreveals two patterns. For point 1 (Figure 9a) there isa high coherence at low frequencies, a broad peak ofcoherence at midfrequencies (periods 15 to 50 days),and a dominating clockwise rotation at high frequen-cies. Therefore, at point 1, the wind case current andthe wind are statistically similar for seasonal timescalesor longer; for periods of 15 to 50 days, especially inthe counterclockwise sense; and for high frequencies,especially in the clockwise sense. At point 2 (Figure9b) there is little coherence, except at high frequen-cies. Therefore the wind influences point I, i.e., theYellow Sea Warm Current as defined by winter watermass properties at all frequencies, but the Yellow SeaWarm Current defined by point 2, i.e., the northwardvelocity definition, is only affected by the wind on shorttimescales, corresponding to frontal passages.
Comparing coherence between the currents in thewind case and no-wind case indicates the influence ofthe wind on current dynamics at low frequencies, i.e.,periods longer than 50 days. This comparison is madeat low frequencies only, because the energy decrease to-ward zero near the 50-day period in the no-wind casecreates inaccuracies in the coherence at higher frequen-

30,723MASK ET AL.: WIND-DRIVEN EFFECTS ON YELLOW SEA WARM CURRENT
't}: 0.76 :' " , , , ,'t~"J. . , , , . , 'I .." ,. .:.
~ ..) c; I... Clockwise Rotation (Wmd)..
Q ; . - - - Counter-ClockWIse Rotation (Wmd)-~ 0.50 --'-..,. Clockwise Rotation (No Wmd)~ Counter-ClockWise Rotation (No Wmd)Corn.t' 0.25d..
~0' ..
..... ---
~ 0.00 ..;a!10-3 10- 10- IF ,
rrequ~ncy (l/day)
't;o 0.75~
~ ..} )41~ - - - - oun er- oc se 0 a Ion (Wrod)~ 0.50 ~ Clockwise Rotation (No WInd)...u Counter-Clockwise RotatIon (No WInd)41g.{/).~ 0.25
=41~a'" ~-=..,..~_..=~ - ~ ~ 0.00' ,~ =I-"-'"T'-'--,- ~~ ~ ~--- . - , ".
10-3 10-2 10-1."
Frequency (lid.,.)
..-......,
,
~ 0.75 ."- -~ :d - Clockwise Rotation (Wmd) ~:'.. ,.~ - - - Counter-Clockwl~e Rotation (Wmd)~ 0.50 ClockwiSe Rotation (No Wmd)...'t Counter-Clockwise Rotation (No Wmd)Q.f/).~ 0.25d.. . . J ":~:=~=~~~~:= =' " ~ 0' ",;" .. -,
~ 0.00 . . - - .10-3 10-2 10-1 ...
Frequency Cl/day)
Frequency (1/ day)
Figure 7. Rotary spectra of the current with prewhitening and six Hanning windows of the windcase and the no-wind case at (a) point 1 (125.35°E, 33.75°N), (b) point 2 (124.0oE, 34.00N), (c)point 3 (124.0oE, 30.00N), (d) point 4 (128.0oE, 32.00N), (e) point 5 (122.0oE, 26.00N), and (f)point 6 (126.0oE, 28.00N).

NASK ET AL.~.~-DRIVEN EFFECTS ON YELLOW SEA WARM CURRENT30.724
r: O'~o=3
~
,Ir
,--,..., .., /, .-' ' , /~,c... ... - , . ~.. ,':cC .. ,
.~,_'-',., "....,..-'- "
~. . '. ,"'-.~ c .
p,
10110-2 10-1
Frequency.(l/d.y)
~ 0.75
~ t:)II
Q-. 0.50..uII~
cn.~ 0.25ud ~" ~
~0-Il..r&. 0.00 310-
Frequency (1/ day)
Figure 7. (continued)
Frequency (1/ day)
.
Frequency (1/ day)
Figure 8. Coherence of the wind between (a) point 1 (125.35°E, 33.75°N) and point 2 (124.0oE,34.00N), (b) point 2 (124.0oE, 34.00N) and point 3 (124.0oE, 30.00N), (c) point 2 (124.oE, 34.00N)and point 4 (128.0oE, 32.00N), and (d) point 2 (124.0oE, 34.00N) and point 6 (126.0oE, 28.00N).
t' 0.75
a.. .. ClockWIse Rotation (Wind)"Q - - - - Counter-ClockWIse Rotation (Wmd).. 0.50 ClockWise Rotation (No Wind)..
t Counter-ClockWise Rotation (No Wind)"Q,
00.~ 0.25,="=~"

MASK ET AL.: WIND-DRIVEN EFFECTS ON YELLOW SEA WARM CURRENT 3O,m
_.0.80 i
'"GI~ 0.60GI..GI
.&:. 0.400
(.I
0.20
\'I I II '-1
Clock'lnse Rotation ~ 118\~~., , .:'" :- :'" ,-, ICounter,-Clo~~s~ ~o,t~t,lfn ~l \ \ , . , . .
O'OYO-I 10-2 10-1 .01
Frequency (1/ day)
,-d.)
0.80
"'\ ,,\ \ ...\
I
, vV' I", I\ '/ ,', I~
Clockwise Rotatlo~ 'J II I I- - - - .Counter-ClockWIse «.otatlQn " ;, 1,1000. . . .."" I ".' , , . , I ,", ,. . ...~ . . ... 10-3 10-a 10-1 1*'
Frequency (1/ d.y)
Figure 8. (continued)
Figure 9. Coherence between the wind case current and the wind at (a) point 1 (125.35°E,33.75°N) and (b) point 2 (124.0oE, 34.00N).
~

30,726 MASK ET AL.: WIND-DRIVEN EFFECTS ON YELLOW SEA WARM CURRENT
des. In thiS section, "dynamics" refers to boundaryforcing, river inflow, and sensible and latent heat flux,but not to wind, unless specifically noted. Also, re-call that points 1 and 2 represent different aspects ofthe Yellow Sea Warm Current; therefore it should notbe surprising that the two areas are coherent to theother currents in different ways. The no-wind case iscoherent between points 1 and 2, but the wind case iscoherent only in the counterclockwise rotation at lowfrequencies (Figure lOa). This result implies that, onlong timescales in the no-wind case, points 1 and 2 areinfluenced by dynamics; however, when wind forcingis introduced to the system, these two areas becomedynamically different. In the wind case there is also
coherence at 11 and 6 days, showing that the frontalpassages affect both points.
Between points I and 3 (Figure lOb) there is coher-ence in the wind case while the no-wind case is basicallyincoherent at low frequencies. Therefore the wind forc-ing creates a similarity in the periodicity of the Bowof the Yellow Sea Warm Current (as defined by point1) and the Tai~ Warm Current on long timescales.However, when comparing points 2 and 3 (Figure IDe),there is little coherence in either the wind or the no-wind case at low frequencies, showing that there is lit-tle similarity in the periodicity of the Bow of the YellowSea Warm Current (as defined by point 2) and the Tai-wan Warm Current. From these two analyses, point 1
I
0.80
'"QI~ 0.60QI...
QI.d 0.400
U
0.20
\\
1l'f---:\ ,
'"
\./°.0 '" 'I' ,0.00 c1~-3 ~'r:'c!~r I"..!';'-i ..;:' 108lr 10-1
Frequency (l/day)
1.00 I \'..r '~'iI:~"
b.)
I '" '1 ' , , , " , , I ,-' -, ' , , ,.. ,. ClockwIse RotatIon (WInd) .
- - - - Counter-ClockwIse RotatIon (Wmc, ,. Clockwls~ Rotation (N~ Wmd) ,
Counter-ClockW'lse Ro~tlon
~."
~jIf
e.1t10'" 10010-
Fr~qu~ncy (l/day)
1.00
c.)
, , . , , , , , I . '. ' , . ,..~~( ) ;
~ . Clockwls~ Rotation Wmd :5-- - - Counter-ClockwI5~ RotatIon (Wmd) ~, ClockWIse Rotation (No WIDt
, Counter-Clockwlse Ro1atlol\'.
0.80
NGI~ 0.60GI..GI
.d 0.400
tJ
0.20
I(No WInd)~~ ~...
-._'.
-~... -,
10010-3 lO-a )0-1
Frequency (1/ day)
Figure 10. Coherence of the Yellow Sea Warm Current for the wind and no-wind cases between(a) point 1 (125.35°E, 33.75°N) and point 2 (124.0oE, 34.00N), (b) point 1 (125.35°E, 33.75°N)and point 3 (124.0oE, 30.00N), (c) point 1 (125.35°E, 33.75°N) and point 4 (128.0oE, 32.00N),(d) point 1 (125.35°E, 33.75°N) and point 5 (122.0oE, 26.00N), (e) point 2 (124.0oE, 34.00N) andpoint 3 (124.0oE, 30.00N), and (f) point 2 (124.0oE, 34.00N) and point 4 (128.0oE, 32.00N).
1.00, ."o'~',II"l;' --'-"'_"'1__'_,' """a.) " . ClockwIse RotatIon (Wmd)
~ ~ C CI 1- RA (W ,,)"'. :c: ~., - ounter- OCA..Ise U\atl8n m~..':' '. ~ ClockwIse RotatIon.. c ,,~ ~ Counter-Clockwise
--~ ... ~,-
0.80....~ 0.60
..
.."A 0.4.00
{.J
0.20

MASK ET AL. WlND-DRIVEN EFFEcrs ON YELLOW SEA WARM CURRENT 30,727
1.. . .~':'.'.'I '~~""_"'I'd.} ~~ ClockWIse RotatIon (W'md)
- -- - Counter-ClockwIse Rotation (WInd)ClockWIse Rotabon (No WInd)Counter-ClockWIse RotatIon (No Wind)
~, '"L\~"
,','", ~ ~~,.~~
0.00 I . . . . I10-3 10-a 101
Frequency Cl/day)
1.-, ."
0.80 rN"~ 0.60".."
~ 0.400
u
0.20
'I Iv' ~~ \ c- I 1,\1.. '- I- - -":"a'.
~
:::::~=::;::;~...~~"".,' . . , .1 '
IO-aI 0.00' .
10-a, , . . . I
101Frequ~ncy (l/d.y)
. .c-~.
j
~
"I. I.. II
\/V.~
-I0.00' . ..
10-. JO-& 10010
Fr~qu~DCY (lid..,)
Figure 10. (continued)
and no-wind cases are coherent at low frequencies whilepoints 2 and 5 are incoherent. Therefore the Yellow SeaWarm Current at point 1 experiences dynamical forcingsimilar to the Taiwan Warm Current. In addition, thewind infiuences both currents. The Yellow Sea WarmCurrent at point 2 does not experience the same forc-ing as the Taiwan Warm Current. The comparisonsbetween points 1 and 6 and 2 and 6 indicate incoher-ence, 80 an analysis cannot be made beyond surmL~gthat the dynamics of the Yellow Sea Warm Current donot follow the fluctuations of the Kuroshio.
Thus the dynamics of the Yellow Sea Warm Currentat points 1 and 2 are different. Point 1 is predominantlywind driven, and its v8.riability ~ to be mmilar toanother wind-driven current, i.e., the Taiwan WarmCurrent. Also, the variability at point 1 is similar tothat of the Tsushima Warm Current, which is dynami-cally driven. Point 2 is mostly dynamically driven, and
is wind driven and the Taiwan WanD Current appearsto be wind driven also, and point 2 is influenced bydynamics other than the wind and its variability.
Between points 1 and 4 (Figure IOc) there is coher-ence in the no-wind case but basically no coherence inthe wind case on long timescales. Therefore the wind isnot the most important dynamic factor influencing thesimilarities in the variability of the How of the YellowSea W8I"m Current and the TSllAhimJl. Warm Current.Between points 2 and 4 (Figure 10£) there is coherenceat semiannual timescales in both the wind case and theno-wind case, yet the coherence in the wind case fallsoff quickly with increasing frequency, leaving only co-herence in the no-wind case. This result shows that theYellow Sea Warm Current at points 1 and 2 appearsto be periodically inftuenced by the non-wind-drivenTsushima Warm Current.
Between points 1 and 5 (Figure 10d) both the wind
0.80"1
II
~ 0.80
~.c 0.400
C.J
0.20
-, , , I . , . IClockWIse Rotation (Wmd)
- - - - Counter-Clocklflse RotatIon (Wlfld)ClockWIse RotatIon (No WInd)Counter-ClockWIse Rotation (N4:,md)
1.M .
t.) '~.' ClockWIse RotatIon (Wmd)010 " - - - - Counter-Clockwise Rotation (Wmd). --- ClockWIse Rotation (No Wind)
" Counter-ClockWIse Ro~tlon (No Wind)u 0.10 -._~a ~ I., " I
j 0.40 ~"" c - i I j I ~~, \8 I 1-
0.20 ',~~, , - ill

30,728 MASK ET AL WIND-DRIVEN EFFECTS ON YELLOW SEA WARM CURRENT
its variability is similar to that of one other dynamicallydriven current, i.e., the Tsushima Warm Current;
inflowing Taiwan Warm Current and the Kuroshio aswell as the boundary conditions imposed at the KoreaStrait, plus the river inflows. Hence the wind can act onthe Yellow Sea Warm Current as a steering force, and itcan also cause a pulse-like flow of the current. From therotary spectra and the coherence functions the dynam-ics force the observed current rotation over the YellowSea, but the wind induces the observed current rota-tion over the majority of the East China Sea, creatinga wind-influenced current, the Taiwan Warm Current.The variability of this current is similar to that of theYellow Sea Warm Current as defined by water masscharacteristics. The Yellow Sea Warm Current as de-fined by northward flow is predominantly dynamicallydriven.
Part of the difficulty with studying the Yellow Searegion is terminology. One such problem arises whendiscussing the Yellow Sea Warm Current. Is the authordescribing a northward moving current alone, or is hereferring to the water mass definition? As shown in thisstudy, the northward moving current appears even when
6. Conclusions
The POM version of the Yellow Sea Model imple-mented at Naval Research Laboratory (NRL) realisti-cally represents the major currents in the Yellow Seaand the surrounding regions. The NO GAPS wind stressused to force the model is a significant contribution tomaking the model simulations realistic. The NOGAPSatmospheric fields are good representations of the sea-sonal wind patterns, i.e., from the north in winter andfrom the south in summer. Since NOGAPS includesdata in its daily analysis, it provides synoptic scale vari-ability to the wind patterns. NO GAPS products shouldtherefore provide a more realistic estimate of the atmo-sphere than the seasonal climatological winds that havebeen used previously to study the region.
The Yellow Sea simulation is heavily influenced bythe open boundary conditions of the model, i.e., the
180360
140320
>-.IU 100
Q
C.~
-
~
280
60 240
200
122.0"E 123.0"E 124.0"E 125.0"E 126.0"£ 122.0"E 123.0"£ 124.0"E 125.0"E 126.0"£
longItude LOn<udePlate 3. Hoffmuller diagram across 33.875°E of the surface v velocities for Julian days 1-181and 182-365.
-..e-~~(.I0
-GJ
>
QGJ'"'"='
(.I
~Q0
~'"GJ
:s

MASK ET AL.: WIND-DRlVEN EFFECTS ON YELLOW SEA WARM CURRENT
there is no-wind forcing, but the water mass's movementdoes not appear without wind forcing. Therefore it is'proposed that the current that has a northward veloc-ity component and travels along the central part of theYellow Sea basin be called the Yellow Sea Warm Cur-rent, and the water mass usually associated with thiscurrent that follows the water mass definition given insection 3 of this paper be called the Yellow Sea WarmIntrusion. This analysis was completed at 20 m depth;however, the surface current may not follow the samebehavior. To address this issue, a Hoffmuller diagramwas generated for the wind case across 33.875°E at thesurface (Plate 3). This analysis indicates that there isa current year round, but it is disrupted by the windpulses from the north that occur approximately once aweek during the winter. Therefore the northward mov-ing current description of the Yellow Sea Warm Currentis valid at the surface, too.
I.
, Acknowledgments. Andrea C. Mask is supported as aNRL fellow under Naval Research Laboratory grant NOOOl4-94-1-G918. The basic support at FSU is derived from theSecretary of Navy Grant under J. J. O'Brien. Thanks to themany people at Center for Ocean-Atmosphere PredictionStudies (COAPS), who had input along the way. Thanksalso to Shelley Riedlinger from NRL at Stennis Space Cen-ter, who, along with Lakshmi Kantha of the University ofColorado, developed the regional application of the POM tothe Yellow Sea.
Lie, H. J., Summertime hydrographic featur~ in the south-eastern Hwanghae, Prog. Oceanogr., 17, 229-242, 1986.
Liu, S., X. Shen, Y. Wang, and S. Han, PreHmioary analysisof distribution and variation of perennial monthly meanwater masses in the Bohai Sea, the Huanghai Sea andthe East China Sea, Acta Oceanolog. Sinica, 11, 483-498,1992.
Mellor, G. L., User's guide for a three-dimensional, primi-tive equation, numerical ocean model, 40 pp., Program inthe Atmos. and Oceanic Sci., Princeton Univ., Princeton,N.J., 1996.
Mooers, C. N. K., A technique for the cross spectrum anal-ysis of pairs of complex-valued time seri~, with emphasison properti~ of polarized components and rotational in-variants, Deep Sea Res., 20, 1129-1141, 1973.
Naval Oceanographic Office, Data Base documentation forDigital Bathymetric Data Base Confidential (DBDBC),Doc. OAML-DBD-17A, Nav. Oceanogr. Off., StennisSpace Center, Miss., 1987.
O'Brien, J. J., and R. D. Pillsbury, Rotary wind spectra in asea breeze regime, J. Appl. Meteorol., 13,820-825; 1974.
Park, Y. H., Water characteristics and movements of theYellow Sea Warm Current in summer, Prog. Oceanogr.,17, 243-254, 1986.
Song, W., Characteristics of summer and winter circulationsand their variability as the source of the Tsushima WarmCurrent, Acta Oceanolog. Sinica, 13, 189-201, 1994.
Su, Y. S., and X.. C Weng, Water masses in China Seas, inOceanology of China Seas, vol. 1, edited by D. Zhou et.al., pp. 3-16, Kluwer Acad., Norwell, Mass., 1994.
Thompson, R. O. R. Y., Coherence significance levels, J. At-mos. Ru., 36, 2020-2021, 1979.
Yuan, Y., and J. Su, Numerical modelling of the circulationin the East China Sea, in Ocean Hydrodynamics of theJa1H1n and East China Seas, El..evier Oceanogr. Ser., vol.39, edited by T. Ichiye, pp. 167-186, Elsevier, New York,1984.
Yuan, Y., J. Su, and S. Xia, A diagnostic model of summercirculation on the northwest shelf of the East China Sea,Prog. Oceanogr., 17, 163-176, 1986.
Zheng, Q. A., and V. Klemas, Determination of winter tem-perature patterns, fronts, and surface currents in the Yel-low Sea and East China Sea from satellite imagery, Re-mote Sens. Emliron., 12, 201-218, 1982.
ReferencesBlumberg, A. F., and G. L. Mellor, A description of a three-
dimensional coastal ocean circulation model, in Th~ Di-""en8ional Coaltal Ocean Model" Coastal Estuarine Stud.,voU, edited by N. S. Heaps, pp. 1-16, AGU, Washington,D.C., 1987.
Fairbridge, R. W. (Ed.), The Encyclopedia 01 Oceanography,vol. 1, pp. 994-998, Reinhold, New York, 1966.
Hsueh, Y., Recent current observations in the Eastern Yel-low Sea, J. Geophy,. ReI., 93, 6875-6884, 1988.
Hsueh, Y., and D. Yuan, A numerical study of currents, heatadvection, and sea-level fluctuations in the Yellow Sea inwinter 1986, J. Phy,. Oceanogr., 27, 2313-2326, 1997.
Hsueh, Y., H. J. Lie, and H. Ichakawa, On the branchingof the Kuroshio west of Kyushu, J. Geophy,. Re,., 101,3851-3857, 1996.
Kantha, L. H., and C. A. Clayson, An improved mixed layermodel for geophysical applications, J. Geophy', Rei., 99,25,235-25,266, 1994.
A. C. Mask and J. J. O'Brien, Center for Ocan-Atmosphere Prediction Studies, Florida State University,Tallahassee, FL 32306-2840. (amaskQcoaps.fsu.edu)
R. Preller, Naval Research Laboratory, Code 7322, Sten-nis Space Center, MS 39529.
(Received August 27, 1997; revised August 12, 1998;accepted August 31, 1998.)