wind energy for rural economic development study: prowers county, colorado “converting the wind...
TRANSCRIPT

Suzanne Tegen, NRELIndiana Wind Working Group
April 18, 2007
Wind Energy for Rural Economic Development

Overview
• Case studies from rural America
• Jobs and Economic Development Impacts (JEDI)
• Indiana wind power benefits
• Wind vs. coal
• 20% wind scenario

The Ag Opportunity
Economic security and prosperity for rural America through local production of energy

Rural Economic Challenges
• Low commodity prices
• Fuel price uncertainty
• High fertilizer prices• Migration to cities• Eroding local tax
bases• Water shortages

Drivers for Wind Power
• Declining wind costs• Fuel price uncertainty• Federal and state
policies• Economic development• Environmental issues• Energy security

Case Study: Texas 912-MW in Pecos County, TX resulted in:
•2,500 quality jobs with a payroll of $75M
• $13.3M in tax revenues for schools and counties
•$2.5M in 2002 royalty income to landowners
•Another 2,900 indirect jobs as a result of the multiplier effect
•$4.6M increase in Pecos County property tax revenue in 2002

Case Study: Minnesota
107-MW Minnesota wind project
• $500,000/yr in lease payments to farmers
• $611,000 in property taxes in 2000 = 13% of total county taxes
• 31 long-term local jobs• $909,000 in income from
O&M (includes multiplier effect)

Case Study: Iowa
240-MW Iowa wind project
• $640,000/yr in lease payments to farmers ($2,000/turbine/yr)
• $2M/yr in property taxes• $5.5M/yr in O&M
income• 40 long-term O&M
jobs• 200 short-term
construction jobs• Doesn’t include
multiplier effect

Case Study: New Mexico
204-MW wind project built in 2003 in DeBaca and Quay counties for PNM
• 150 construction jobs• 12 permanent jobs and
$550,000/yr in salaries for operation and maintenance
• $550,000/year in lease payments to landowners
• $450,000/year in payments in lieu of taxes to county and school districts
• Over $40M in economic benefits for area over 25 years
Source: PNM, New Mexico Wind Energy Center Quick Facts, 2003

Case Study: Hyde County, South Dakota
40-MW wind project in South Dakota creates $400,000 -$450,000/yr for Hyde County, including:• More than $100,000/yr in annual
lease payments to farmers ($3,000 - $4,000/turbine/yr)
• $250,000/yr in property taxes (25% of Highmore’s education budget)
• 75 -100 construction jobs for 6 months
• 5 permanent O&M jobs• Doesn’t include multiplier effect

Case Study: Prowers County, Colorado
“Converting the wind into a much-needed commodity while providing good jobs, the Colorado Green Wind Farm is a boost to our local economy and tax base.”
John Stulp, County Commissioner, Prowers County, Colorado
162-MW Colorado Green Wind Farm $200M+ investment
• 400 construction workers
• 14-20 full-time jobs
• Land lease payments $3000-$6000 per turbine
• Prowers County 2002 assessed value $94M; 2004 assessed value +33% (+$32M)
• Local district will receive tax reduction

Major Rural Economic Impacts
• Job creation• Landowner
revenues• Property
taxes (schools, roads, county services)

• Necessary inputs:– Year and location of project construction– Construction cost ($/kW)– O&M cost ($/kW)
• More information: www.windpoweringamerica.gov
The better the inputs, the better the outputs!
The JEDI modelJobs and Economic Development Impacts

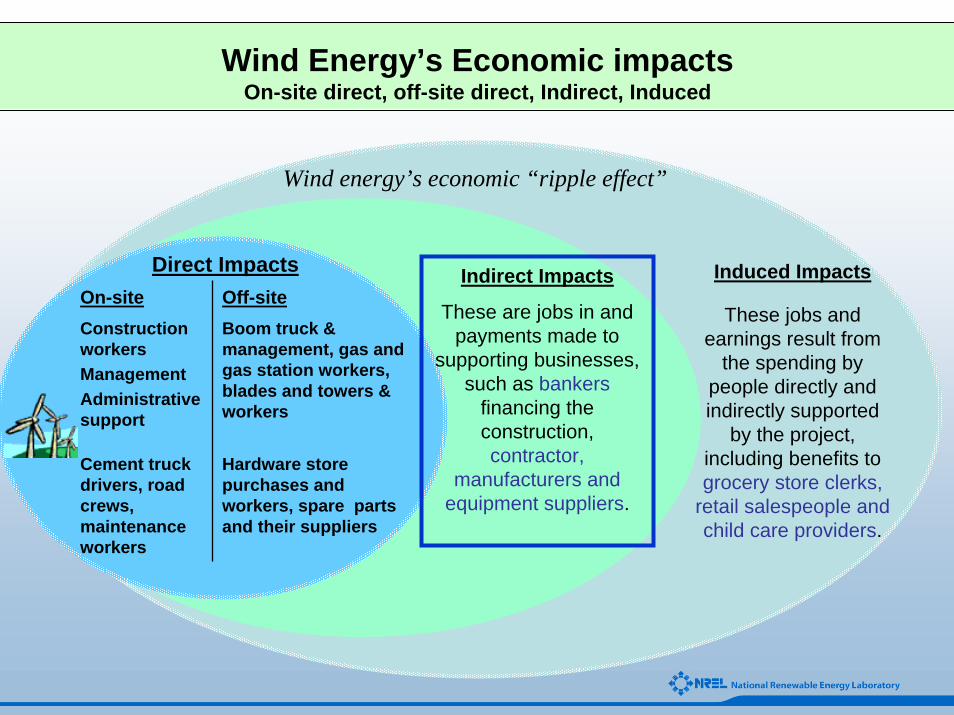
Wind Energy’s Economic impactsOn-site direct, off-site direct, Indirect, Induced
Indirect Impacts
These are jobs in and payments made to
supporting businesses, such as bankers
financing the construction,contractor,
manufacturers and equipment suppliers.
Induced Impacts
These jobs and earnings result from
the spending by people directly and indirectly supported
by the project, including benefits to grocery store clerks,
retail salespeople and child care providers.
Wind energy’s economic “ripple effect”
On-site Off-siteConstruction workersManagementAdministrative support
Boom truck & management, gas and gas station workers, blades and towers & workers
Cement truck drivers, road crews, maintenance workers
Hardware store purchases and workers, spare parts and their suppliers
Direct Impacts

Direct on-site jobs and parts during construction
ConstructionManagement and support
Earth moving, cement pouringTruck drivers, crane operators

Direct wind project jobsduring operations
Landowner royaltiesOperations and maintenance, management
Parts and materials purchased
Utility services and subcontractors
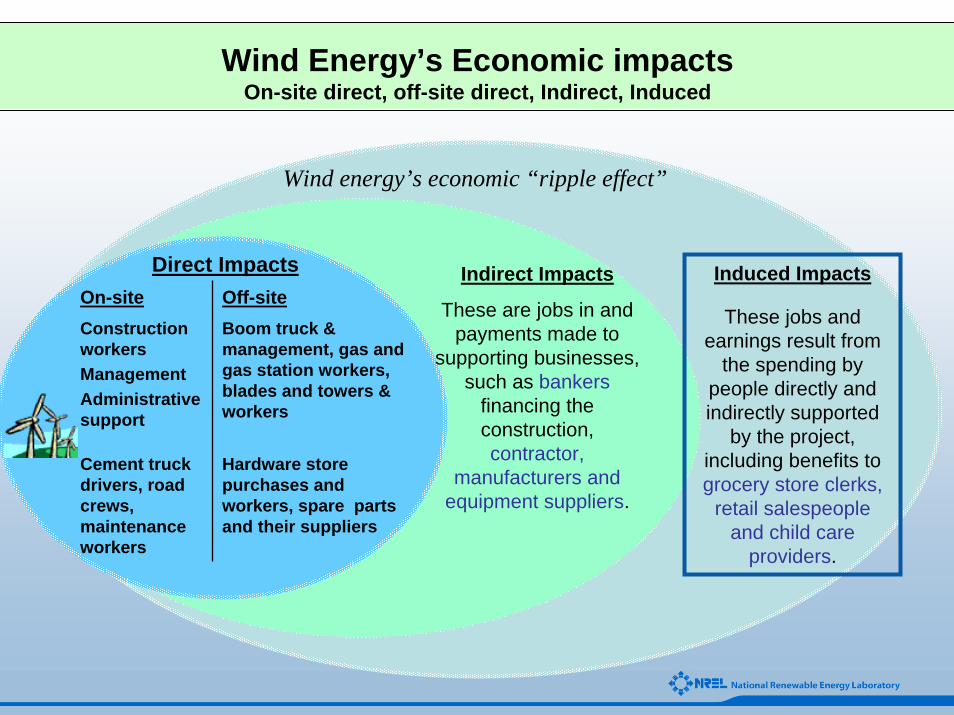
Wind Energy’s Economic impactsOn-site direct, off-site direct, Indirect, Induced
Indirect Impacts
These are jobs in and payments made to
supporting businesses, such as bankers
financing the construction,contractor,
manufacturers and equipment suppliers.
Induced Impacts
These jobs and earnings result from
the spending by people directly and indirectly supported
by the project, including benefits to grocery store clerks,
retail salespeople and child care providers.
Wind energy’s economic “ripple effect”
On-site Off-siteConstruction workersManagementAdministrative support
Boom truck & management, gas and gas station workers, blades and towers & workers
Cement truck drivers, road crews, maintenance workers
Hardware store purchases and workers, spare parts and their suppliers
Direct Impacts

Indirect jobs, services, materials
Steel mill jobs, parts, servicesPhotos: E.C.Levy, Inc, Detroit, MI
Financing, banking, accounting
Equipment manufacturing and sales
Property taxes
Wind Energy’s Economic impactsOn-site direct, off-site direct, Indirect, Induced
Indirect Impacts
These are jobs in and payments made to
supporting businesses, such as bankers
financing the construction,contractor,
manufacturers and equipment suppliers.
Induced Impacts
These jobs and earnings result from
the spending by people directly and indirectly supported
by the project, including benefits to grocery store clerks,
retail salespeople and child care
providers.
Wind energy’s economic “ripple effect”
On-site Off-siteConstruction workersManagementAdministrative support
Boom truck & management, gas and gas station workers, blades and towers & workers
Cement truck drivers, road crews, maintenance workers
Hardware store purchases and workers, spare parts and their suppliers
Direct Impacts
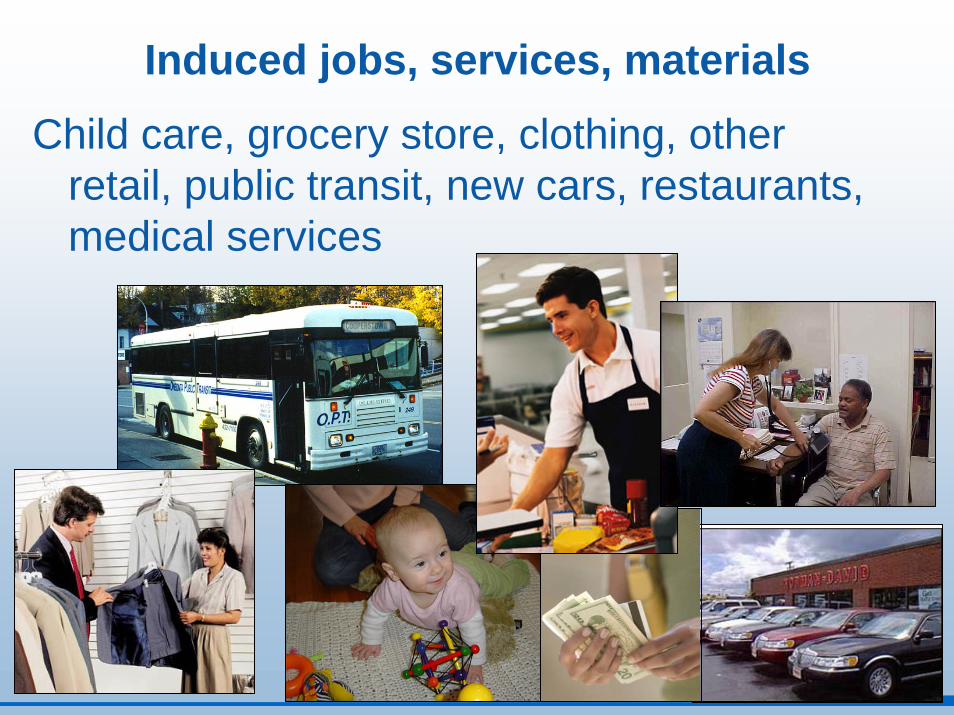
Induced jobs, services, materials
Child care, grocery store, clothing, other retail, public transit, new cars, restaurants, medical services

Indiana wind resource map
"Our state energy plan calls for maximizing Indiana's wind power potential, so news that Indiana Michigan Power is pursuing this clean source of energy is a welcome development."
- Governor Mitch Daniels

Jobs from new wind in IndianaLocal Economic Impacts – Job creation from 100 MW of new wind
JobsDuring construction period
On- and off-site direct jobs 156
Construction workers, management and support only 151Indirect jobs 64
Induced jobs 84
Total Jobs (Direct, Indirect, Induced) 304
During operating years (annual) : Permanent jobs for the life of the plantDirect jobs 27
On-site Plant Workers Only 9Indirect Impacts 6
Induced Impacts 13
Total Impacts (Direct, Indirect, Induced) 47

Wind Energy’s Economic impacts in Indianafrom 100 MW of new wind development (50 2MW turbines)
Direct Impacts1
Landowner Payments: • $400,000/yrConstruction Phase:• 150 construction jobs• $18.5M to local economiesOperational Phase:• 9 O&M jobs/yr• $2.3M/yr to local economies
Indirect Impacts2
Local Property Tax Benefits:• $450,000/yrConstruction Phase:• 64 jobs• $5.3M to local economiesOperational Phase:• 6 jobs/yr• $610,000/yr to local economies
Induced Impacts3
Construction Phase:• 84 jobs• $7.4M to local economiesOperational Phase:• 13 jobs/yr• $1.2M/yr to local economies
Wind energy’s economic “ripple effect”
Construction Phase = 1-2 yearsOperational Phase = 20+ years
TotalsOver 220 jobs during construction25-30 permanent jobs$113+ million over 20 –yr life of plant

Wind vs. Coal

Indiana coalPennsylvanian system coal – greenUnderground coal mines – blueSurface coal mines – brown
• Indiana uses ~45-49% Indiana coal• Bituminous coal• Out-of-state coal used for emissions concerns• Some state agencies (universities) must burn Indiana coal

Job creation in Colorado
Direct jobs for Coloradoans from new wind vs new coal
0
200
400
600
800
1000
1200
Wind (600 MW) Coal (250 MW)
Jobs
(FT
Construction jobsO&M jobs (20 yrs)

Economic benefits to Colorado
Economic impacts of wind vs. coal in Colorado (construction + 20 yrs of operation)
$-
$100
$200
$300
$400
$500
$600
$700
$800
Wind (607 MW) Coal (250 MW fromPRB)
Coal (40% in-state)
Dol
lars
in M
illio
ns
Landowner revenue
Property taxes
Coal mining & transport
Operations
Construction

• Construction• O&M• Property tax revenues• Landowner revenues• Manufacturing• Multiplier effect• Net economic
development impacts of wind vs. fossil fuels
Economic Development Impacts

It’s not just our idea…The 20% scenario from DOE and industry has the
goal of producing 20% of the nation’s energy from wind by 2030.
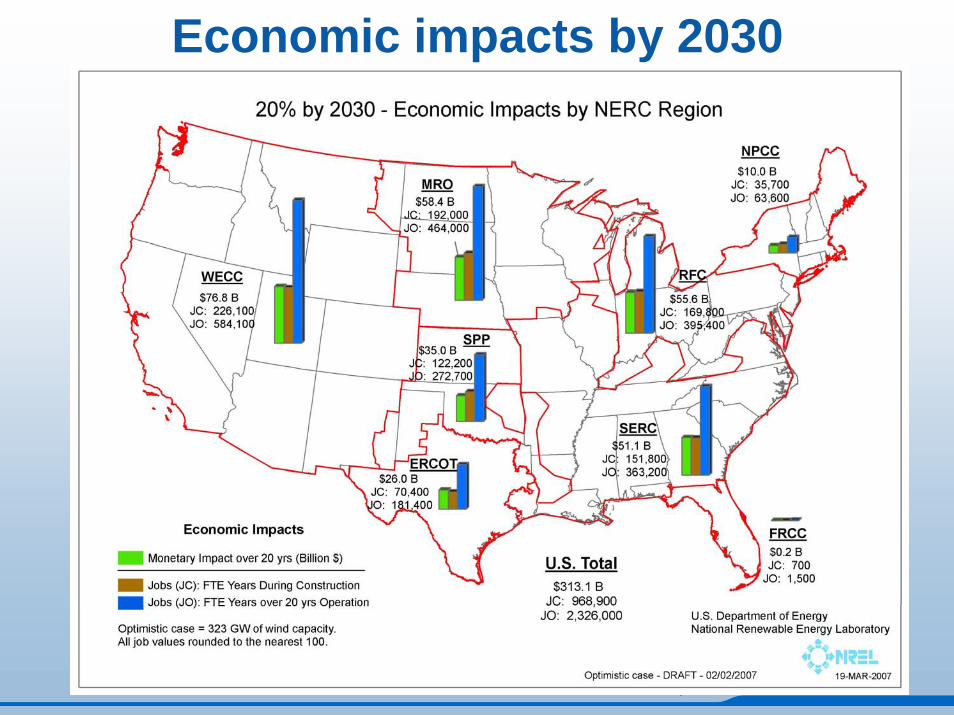
Economic impacts by 2030

• 15,000 MW by 2030• Over 45,000 new construction jobs• Over 6,000 permanent jobs (20+yrs)• $4.8 billion in economic output
during construction• $10 billion in economic output over
20 years
20% Scenario for Indiana

• Over $1.4 billion in property tax payments to counties (for roads, schools, county services)
• $8 million In landowner royalties
• Manufacturing in Indiana??
20% Scenario for Indiana(20 years of operation)

“Wind is a homegrown energy that we can harvest right along side our corn or soybeans or other crops. We can use the energy in our local communities or we can export it to other markets. We need to look carefully at wind energy as a source of economic growth for our region”
David Benson, Farmer and County Commissioner, Nobles County, Minnesota
Carpe VentemE-I-E-I-O
www.windpoweringamerica.gov


Water rights, air quality, emissions, domestic production

“It seems only natural for rural utilities to do everything they can to advance both farm-based renewable energy development and rural economic development in a cost-effective way. In my opinion, wind energy is the next great chapter in the rural electrification story.”
Aaron Jones, Washington Rural Electric Cooperative Association; Olympia, WA

2
4
6
8
10
12
1990
CO
E (¢
/kW
h [c
onst
ant 2
000
$])
Low wind speed sites
1995 2000 2005 2010 2015 2020
High windspeed sites
New Bulk Power Competitive Price Band
2006: New Wind
Depreciated CoalDepreciated Wind
Natural Gas (fuel only)
Wind Cost of Energy
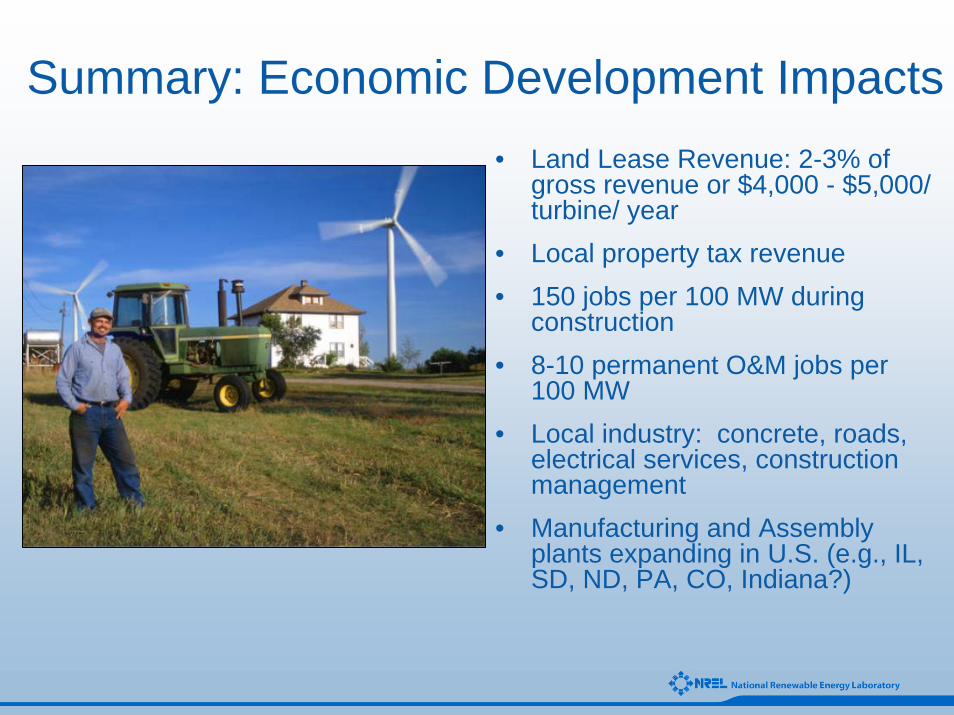
Summary: Economic Development Impacts• Land Lease Revenue: 2-3% of
gross revenue or $4,000 - $5,000/ turbine/ year
• Local property tax revenue• 150 jobs per 100 MW during
construction• 8-10 permanent O&M jobs per
100 MW• Local industry: concrete, roads,
electrical services, construction management
• Manufacturing and Assembly plants expanding in U.S. (e.g., IL, SD, ND, PA, CO, Indiana?)

Direct, Indirect, and Induced Activity1. Examples of direct jobs include construction and others who
work on construction, such as cement truck operators and road crews.
2. Indirect refers to the increase in economic activity that occurs when a contractor, vendor or manufacturer receives payment for goods or services and is able to pay others who support their business, e.g., a banker financing the construction contractor, the manufacturers and other suppliers that meet their material and equipment needs.
3. Induced jobs and earnings result from the spending by people directly and indirectly supported by the project, including benefits to grocery store clerks, retail salespeople and child care providers.

The JEDI modelJobs and Economic Development Impacts
• Traces linkages in the economy: what are economic impacts from dollars spent on the wind project?
• Economic development impacts include jobs created, wages and salaries earned, and increases in overall economic activity.
• JEDI uses data from MIG’s IMPLAN (Impact Analysis for Planning) based on state spending patterns.