wind forum 2016
TRANSCRIPT


Wind Power Plant Frequency Control to Support the Penetration of High Levels of Renewable Sources
[17 March 2016, Antonio Martinez, Kouroush Nayebi, Manoj Gupta, Yi Zhou, Vestas Wind Systems A/S]
Wind Industry Forum, 17 March 2016
PUBLIC

Agenda
Wind Power Plant Frequency Control to Support the Penetration of High Levels of Renewable Sources 2
Overview of Frequency Control and Regulation
Frequency Control Challenges with High Levels of Renewables
Frequency Control Support from Wind Power Plants
Inertia Emulation Control (FUTURE)
Active Power Control
Frequency Control
Fast Power De-rating
Conclusions and Recommendations

Overview of Frequency Control and Regulation
Wind Power Plant Frequency Control to Support the Penetration of High Levels of Renewable Sources 3
Frequency Response
• Balancing supply and demand
Fre
qu
en
cy
(Hz)
Time (Seconds)
Primary Frequency Control
Inertial Response
Secondary Frequency Control
Recover frequency to 50 Hz:
· WPP fre
quency control
· WPP active power control
· 5 m
inute contingency FCAS
· Automatic Generation Control (A
GC)
· Manual dispatch commands
50 Hz
0 secs
Typically5-10 secs
Typically20-60 secs
Typically5-10 mins
Stabilize fre
quency:
· WPP fa
st power control
· WPP fa
st frequency control
· 60 second contingency FCAS
· Governor re
sponse
Stabilize df/d
t and df:
· WPP Inertia Emulation Control (F
UTURE)
· 6 second contingency FCAS
· Generator in
ertial response
fnadia
Frequency Regulation
Control
Frequency Regulation to 50 Hz:
· WPP active power control
· Regulation FCAS

Frequency Control Challenges with High Levels of Renewables
Displacement of synchronous generators
Reduced system inertia
Rapid changes in frequency (larger df/dt)
Synchronous generator
tripping on df/dt
Larger frequency deviations (larger df)
Increased risk of UFLS
Power forecasting for Wind and PV
generation
Supply and demand
balancing
Wind Power Plant Frequency Control to Support the Penetration of High Levels of Renewable Sources 4

Frequency Control Support from Wind Power Plants
Inertia Emulation Control (FUTURE) Potential Benefits
Increased system inertia for raise
services
Slower changes in frequency (reduces
df/dt)
Reduced Synchronous
generator tripping on df/dt
Smaller frequency deviations (smaller
df)
reduced risk of UFLS
Allows time for governors to
respond
ROCOF and Frequency Withstand
Capability Benefits (typ. 1-4 Hz/sec)
WPP ROCOF withstand-reduced
tripping (1-4 Hz/sec)
WPP frequency withstand-reduced tripping (47-53Hz
continuous)
No added contribution from
WPP to frequency deviation
Fast Frequency Control and Fast Power De-rating
Benefits
Raise and lower contingency FCAS services (6s, 60s)
Slower changes in frequency (reduces
df/dt)
Reduced Synchronous
generator tripping on df/dt
Smaller frequency deviations (smaller
df)
reduced risk of OFGS, UFLS
Allows time for governors to
respond
Fault Ride Through Capability Benefits
No WPP tripping-no added contribution
to frequency deviation
Fast post-fault active power
recovery-contribute to stabilising
frequency
Frequency Control Benefits
Raise and lower contingency FCAS
services (60s, 5mins)
Active Power Control Benefits
Raise and lower Regulation FCAS
Wind Power Plant Frequency Control to Support the Penetration of High Levels of Renewable Sources 5
Benefits
Fre
qu
en
cy
(Hz)
Time (Seconds)
Primary Frequency Control
Inertial Response
Secondary Frequency Control
Recover frequency to 50 Hz:
· WPP fre
quency control
· WPP active power control
· 5 m
inute contingency FCAS
· Automatic Generation Control (A
GC)
· Manual dispatch commands
50 Hz
0 secs
Typically5-10 secs
Typically20-60 secs
Typically5-10 mins
Stabilize fre
quency:
· WPP fa
st power control
· WPP fa
st frequency control
· 60 second contingency FCAS
· Governor re
sponse
Stabilize df/d
t and df:
· WPP Inertia Emulation Control (F
UTURE)
· 6 second contingency FCAS
· Generator in
ertial response
fnadia
Frequency Regulation
Control
Frequency Regulation to 50 Hz:
· WPP active power control
· Regulation FCAS

6
Inertia Emulation Control (FUTURE)
• Kinetic energy is extracted from all the WTG rotating masses (blades, rotor, gearbox, etc) to produce
active power
• Controlled active power production is possible beyond the available power from the wind
• Trigger: ROCOF threshold, ferror threshold or both
• ∆Pinertia: Requested power change in % of Prated for a predefined duration in seconds.
Concept Description
Wind Power Plant Frequency Control to Support the Penetration of High Levels of Renewable Sources
• Allows time for the governors to respond to stabilise
frequency
• Further research into the benefits of emulated inertia
control from WPP is required
Frequency Monitoring
&Conditioning
Rate of change of frequency
(ROCOF)Estimator
Delta Powercalculator
Inertial responce trigger
ferrorROCOF
ferrorfmeas
Trigger
+DPinertia
P actual
Power output

7
Inertia Emulation Control (FUTURE)
Tdelay: Adjustable initial delay.
Trise: The time it takes to reach the needed boost level. The rate of power change is adjustable.
Tsustain: Adjustable maximum boosting time.
Conceptual Response
Wind Power Plant Frequency Control to Support the Penetration of High Levels of Renewable Sources

8
Active Power and Frequency Control Power Plant Controller® (PPC) Architecture
Wind Power Plant Frequency Control to Support the Penetration of High Levels of Renewable Sources
Frequency
Controller
Option 1
-
Set-Point Frequency
Measured Frequency
Frequency Controller (I)
Active
Power
Dispatcher
Active Power
Reference
WTGs
& or
Pause / Stop
Dispatcher
Power
Controller
Power Control
Curtailed Power
WTGs power
production
Frequency
Controller
Option 2
Available Power
FRT Mode
FRT Mode
Inner Control Loop
Outer Control Loop
Signal
Conditioning
Power Setpoint
Power limit
Power limit
FRT Mode
Power limit
-
Fast Run-back
High Frequency limit
Fast run-back
FRB set by TSO
Power set point for FRB by TSO
Trip commands to
Feeder CBs
Options or Modes
Frequency Controller (II)
Power reference
Active Power loop
Operation Mode
Measured/Calculated Power
Measured/Calculated Power
Measured/Calculated Power
Measured/Calculated Power
Set-Point Frequency
Measured Frequency
Curtailed Power
Measured Frequency
Available Power

Active Power Controller
The active power controller controls the active power output of the wind power plant (WPP).
The active power reference can be provided by different sources.
• Fixed external/internal level
• Frequency Controllers
• Fast Runback Controller
The controller determines active power set-points for the individual turbines in its dispatcher.
The controller includes the following functions:
• Curtailment by a fix value below available
• Curtailment by % of available below available
• Curtailment Ramp rate limiter
• Power Increase Power Ramp rate limiter
• Pausing and releasing WTGs
• Tripping Feeders for fast power reduction
Wind Power Plant Frequency Control to Support the Penetration of High Levels of Renewable Sources 9
Primary, Secondary Frequency Control and Frequency Regulation

55
57
59
61
63
65
67
69
71
73
75
0 10 20 30 40 50 60
Time [s]
Po
wer
[MW
]
Pref
Pmeas
Ppossible
-2
-1
0
1
2
3
4
5
6
0 10 20 30 40 50 60
Time [s]
Po
wer
red
ucti
on
[M
W b
elo
w P
po
ssib
le]
45
47
49
51
53
55
57
59
61
63
65
0 10 20 30 40 50 60
Time [s]
Po
wer
[MW
]
Pref
Pmeas
Ppossible
88
89
90
91
92
93
94
95
96
0 10 20 30 40 50 60
Time [s]
Po
wer
Pro
du
cti
on
[%
of
Pp
ossib
le]
Onsite Active Power Control Performance
Wind Power Plant Frequency Control to Support the Penetration of High Levels of Renewable Sources 10
De-rated operation for raise and lower frequency control services
• Power Reference is set to 92% of possible power
• Power Reference is set to 4 MW below possible power

Over Frequency Support
Under Frequency Support
Frequency Control Option 1
• Support to stabilize frequency and to recover frequency to 50 Hz.
• Droop control focuses on changing (Raise or Lower) the active power (dP) proportional to the grid frequency deviation (df).
• The frequency deviation (df) is the difference between the grid and reference frequency.
Wind Power Plant Frequency Control to Support the Penetration of High Levels of Renewable Sources 11
Primary and Secondary Frequency Control

70
71
72
73
74
75
76
77
78
79
80
0 5 10 15 20 25 30 35
Time [s]
Po
wer
[MW
]
Pref
Pmeas
1,002
1,003
1,004
1,005
1,006
1,007
1,008
1,009
0 5 10 15 20 25 30 35
Time [s]
Fre
qu
en
cy
[p
.u.]
Fmeas
68
70
72
74
76
78
80
82
0 10 20 30 40 50
Time [s]
Po
we
r [M
W]
Pref
Pmeas
0,998
1
1,002
1,004
1,006
1,008
1,01
1,012
0 10 20 30 40 50
Time [s]
Fre
qu
en
cy
[p
.u.]
Fmeas
Onsite Frequency Control Option 1 Performance
Wind Power Plant Frequency Control to Support the Penetration of High Levels of Renewable Sources 12
• Simulated Open-loop frequency offset by 0.01 pu
• Tested with curtailed WPP at 80 MW in FSM mode
• Simulated open-loop frequency step from 1.0083 pu to 1.003 pu
• Tested with curtailed WPP at 80 MW in FSM mode

Frequency Control Option 2
• This type of frequency control follows available power in the wind at all times by an offset in MW of in % of available to allow for raise services.
• Controller uses the available power at time of frequency error observation to lower or raise the power during frequency contingency.
Wind Power Plant Frequency Control to Support the Penetration of High Levels of Renewable Sources 13
Primary and Secondary Frequency Control
Under
Frequency
Support
Over
Frequency
Support

Onsite Frequency Control Option 2 Performance
• Simulated Open-loop frequency
• Comparing the measured power and the measured control settings
Wind Power Plant Frequency Control to Support the Penetration of High Levels of Renewable Sources 14
Primary and Secondary Frequency Control

Fast Power De-rating
Wind Power Plant Frequency Control to Support the Penetration of High Levels of Renewable Sources 15
Primary Over Frequency Control
• Fast Power reduction to a predefined level by TSO.
• Fast Power reduction by monitoring
frequency
P Dispatcher
FRB power commandFRB flag
Measured Active Power
FRB Reference Calculation
Pref_FRB FRB_Flag
Pref
Psetpoint_WTG
TRIP Selector
TRIP_Feeder
Fast Runback Controller
WTG power
Feeder WTG list
Psetpoint_PPC
DP
P DispatcherMeasured Frequency
Measured Active Power
Psetpoint_WTG
TRIP Selector
TRIP_Feeder
Fast Frequency Controller
WTG power
Feeder WTG list
Psetpoint_PPC
DP
0
20
40
60
80
100
120
46 48 50 52 54
Po
we
r [%
o
f n
om
inal]
Frequency [Hz]
frequency/Power Curve

Conclusions and Recommendations
Conclusions:
• WPP can provide important contingency and regulation FCAS services to manage the system frequency.
• Today WPPs can provide primary frequency control, secondary frequency control and frequency regulation, in a similar way (or better) to synchronous generators.
• In the future WPPs may have emulated inertia control capability, however, the benefits are yet to be understood for various types of grids and operational issues
Recommendations for the future:
• Consider market side solutions to manage the system frequency with high levels of renewables. For example:
• Introduce incentives for WPP to enter the FCAS markets
• Network upgrades (e.g. new lines or interconnectors)
• Review of the system frequency operating standards
• Procuring more FCAS during low inertia operation or other high risk operational scenario (high risk of large supply and
demand imbalance)
• Improve the power forecasting and the dispatching of WPP
• Reduce/eliminate non-scheduled generation
• Further research into the benefits of emulated inertia control from WPP is required
Wind Power Plant Frequency Control to Support the Penetration of High Levels of Renewable Sources 16

© Vestas Wind Systems A/S. All rights reserved.
This document was created by Vestas Wind Systems A/S on behalf of the Vestas Group and contains copyrighted material, trademarks and other proprietary information. This document or parts thereof may not be reproduced, altered or
copied in any form or by any means - such as graphic, electronic, or mechanical, including photocopying, taping, or information storage and retrieval systems without the prior written permission of Vestas Wind Systems A/S. All
specifications are for information only and are subject to change without notice. The use of this document by you, or anyone else authorized by you, is prohibited unless specifically permitted by Vestas Wind Systems A/S. You may not alter
or remove any trademark, copyright or other notice from the documents. The document is provided “as is” and Vestas Wind Systems A/S shall not have any responsibility or liability whatsoever for the results of use of the document by you.
Vestas Wind Systems A/S does not make any representations or extend any warranties, expressed or implied, as to the adequacy or accuracy of this information. Certain technical options, services and wind turbine models may not be
available in all locations/countries.
Thank you for your attention
PUBLIC

IMPROVING THE ACCURACY OF NOISE COMPLIANCE MONITORING
Chris Turnbull
Sonus Pty Ltd

•Wind farm noise often less than ambient noise
•Makes compliance monitoring difficult
•No single definitive objective method of monitoring
•Has recently become controversial
•Most common method is:
– Long term logging
– Line of best fit
– Use of LA90
Context

Typical Correlation

Typical Correlation

Typical Correlation

Compliance test plan can:
•Simplify conditions of approval
•Define data requirements
•Allow frequency spectrum analysis
•Allow consideration of upwind v downwind
•Allow measurement at intermediate location
•Define tonality
•Define on/off test (last resort)
To improve accuracy

Importance of lots of data

Importance of lots of data

Removal of High Frequency Noise

Upwind v Downwind
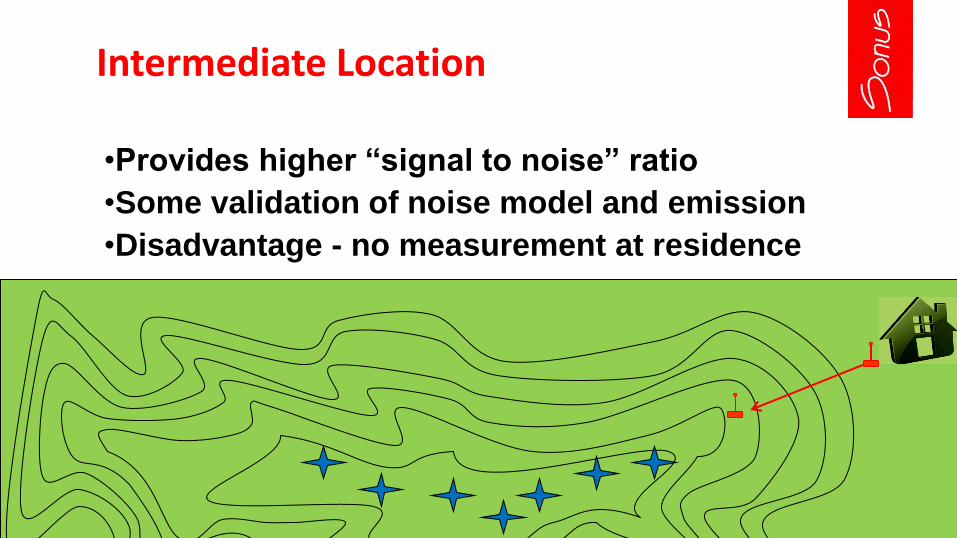
Intermediate Location
•Provides higher “signal to noise” ratio
•Some validation of noise model and emission
•Disadvantage - no measurement at residence

Tonality

On/Off Testing

• Compliance monitoring is difficult
• Significant risk of false conclusions
• Consideration should begin at application stage to minimise unworkable conditions
• Methodologies are available to minimise risks
Summary


Content of typical planning conditions
Applicable noise standard
Noise limits at receptor locations
Relevant receptor locations
Potential penalties for SACs at receptor locations
2

Purpose of noise specification
Compliance with the planning conditions
Quantify allowable noise and character from the supplied turbine
Methodology and location for quantifying noise and character
3

Contractual terms commensurate with the risk associated with noise for a given project
4

Risk assessment
Risk of non-compliance with planning conditions
• Operator credibility
• Community impact
• Operator vs. supplier liability
Risk of lost energy yield
5

Factors influencing risk
Wind farm size
Distance to dwellings
Topography
Background noise environment
Turbine sound power data
Prediction software and methodology implementation
6

Factors influencing risk
Turbine sound power data
• Estimated values
• Test report values with or without uncertainties (IEC 61400-11)
• Guaranteed values
• Declared values (IEC 61400-14)
Octave band spectral content
7

Factors influencing risk
Prediction method
• ISO 9613-2:1996 (International Standard)
• CONCAWE (1980s UK research study)
• Nord2000
Method implementation
• Acoustic prediction software (SoundPlan, CadnaA, etc.)
• Wind farm design software (windPRO, WindFarm, etc.)
8

Assessment options
Sound power level
+ High signal/noise ratio
+ Well defined methodology (high repeatability)
+ Early evaluation
+ Within the wind farm site
- Not representative of receptor location
- Only representative of the tested turbine(s)
9

Assessment options
Receptor location
+ Community involvement
+ Readily comparable with noise limits
- Generally low signal/noise ratio
- Background noise influence
- Potential access issues
10

Assessment options
Intermediate location
+ High signal/noise ratio
+ Accounts for influence of multiple turbines
+ Can be within the wind farm site
+ Established method for general environmental noise
- Requires extrapolation to receptor location
11

Quantification of A-weighted noise levels
Avoid procedural ambiguities
• Compliance with regulation vs. compliance with defined values
Define measurement methodology
Consideration of uncertainty
• Measured level + uncertainty vs. guaranteed level
• IEC 61400-11 vs. IEC 61400-14
Specification of octave band value
12

Quantification of noise character
Definition of relevant characteristics
Avoid procedural ambiguities
• Subjective vs. objective (NZS 6808:1998)
• Presence vs. prominence
Define the relevant assessment methodologies
• Absence of reliable methods for certain characteristics
• C-weighted noise levels (NSW / QLD)
13

Thank you
14

Date
Wind Industry Forum 2016
Oscillating Constraints
Scheduling Error
17 March 2016

• Outline of the error
• Outline of AWEFS and UIGF calculation
• Determining Constraint Status of the Wind
Farm
• Market Impact – Example of Lake Bonney
• Market Impact – NEM Wide
• Proposed Solutions
2
Presenters:
Claudia Williams OCC Team Lead
ABOUT INFIGEN
Infigen Energy (Infigen) is a developer, owner and
operator of renewable energy generation in Australia.
We own six wind farms and a solar farm with a
combined installed capacity of 557 megawatts
operating in New South Wales, South Australia and
Western Australia.
Infigen’s operating assets generate enough power to
meet the needs of over 250,000 homes saving over a
million tonnes of carbon dioxide emissions each year.
Infigen’s development pipeline comprises
approximately 1,100 megawatts of large-scale wind and
solar projects spread across five states in Australia.
For further information please visit our website:
www.infigenenergy.com

3
AWEFS and the UIGF
Wind farm
NEMDE AWEFS
Wind farm SCADA
Data
Price data
Network
Constraint Data
UIGF
Dispatch
targets

Dependent on passing the following through checks:
1. Is the wind farm control system setpoint < registered capacity of the wind farm?
2. Is the Wind farm control system setpoint < active power + 5% of registered capacity?
3. Is the wind farm control system setpoint < potential power?
Definitions:
Control System Setpoint (MW): The lowest current set point active on the wind farm at
the time AEMO takes its readings.
Active Power (MW): The current output of the wind farm when AEMO takes its readings.
Potential Power (MW): Possible production of the wind farm AEMO takes its readings.
Determining Constraint Status of Wind Farm
4
3 Validation Checks

5
Market Impact
Lake Bonney 2 Example

6
Market Impact
Lake Bonney 2 Example

Market Impacts
4
Table from AEMO’s scheduling error report, February 2016.
NEM Wide

Market Impacts
4
From AEMO’s scheduling error report, February 2016.
• Assessment Period: 14 March 2012 and 21 November 2015
• 35,589 affected intervals during the assessment period across
at least 19 wind farms
• 54,076 MWh lower due to this scheduling error
NEM Wide

9
Proposed Solutions
• Increase buffer from 5% to higher value
• Buffer value adjusted based on
historical analysis of the wind farm
• Implemented on 3rd February 2016
• Expected to reduce but not eliminate
oscillating constraints
Interim Resolution Permanent Resolution
• Proposed solution to be fully implemented by
June 2016, with changes made by April .
• Introduce link between AEMO Market
Systems and AWEFS on the dispatch time
frame to directly communicate the SDF status
of wind farm to AWEFS
• Introduce semi-dispatch flag into AWEFS to
determine if the wind farm is constrained
• If the park is unconstrained, take the max of
the active power generation and the wind
speed forecast method to produce UIGF

10
QUESTIONS

Disclaimer This publication is issued by Infigen Energy Limited (“IEL”), Infigen Energy (Bermuda) Limited (“IEBL”) and Infigen Energy Trust (“IET”), with Infigen
Energy RE Limited (“IERL”) as responsible entity of IET (collectively “Infigen”). Infigen and its related entities, directors, officers and employees
(collectively “Infigen Entities”) do not accept, and expressly disclaim, any liability whatsoever (including for negligence) for any loss howsoever arising from
any use of this publication or its contents. This publication is not intended to constitute legal, tax or accounting advice or opinion. No representation or
warranty, expressed or implied, is made as to the accuracy, completeness or thoroughness of the content of the information. The recipient should consult
with its own legal, tax or accounting advisers as to the accuracy and application of the information contained herein and should conduct its own due
diligence and other enquiries in relation to such information.
The information in this presentation has not been independently verified by the Infigen Entities. The Infigen Entities disclaim any responsibility for any
errors or omissions in such information, including the financial calculations, projections and forecasts. No representation or warranty is made by or on
behalf of the Infigen Entities that any projection, forecast, calculation, forward-looking statement, assumption or estimate contained in this presentation
should or will be achieved. None of the Infigen Entities guarantee the performance of Infigen, the repayment of capital or a particular rate of return on
Infigen Stapled Securities.
IEL and IEBL are not licensed to provide financial product advice. This publication is for general information only and does not constitute financial product
advice, including personal financial product advice, or an offer, invitation or recommendation in respect of securities, by IEL, IEBL or any other Infigen
Entities. Please note that, in providing this presentation, the Infigen Entities have not considered the objectives, financial position or needs of the recipient.
The recipient should obtain and rely on its own professional advice from its tax, legal, accounting and other professional advisers in respect of the
recipient’s objectives, financial position or needs.
This presentation does not carry any right of publication. Neither this presentation nor any of its contents may be reproduced or used for any other
purpose without the prior written consent of the Infigen Entities.
IMPORTANT NOTICE
Nothing in this presentation should be construed as either an offer to sell or a solicitation of an offer to buy Infigen securities in the United States or any
other jurisdiction.
Securities may not be offered or sold in the United States or to, or for the account or benefit of, US persons (as such term is defined in Regulation S under
the US Securities Act of 1933) unless they are registered under the Securities Act or exempt from registration.

DNV GL © 2016 SAFER, SMARTER, GREENER DNV GL © 2016
Operational issues affecting wind farm energy capture – Case studies
1
Heather Hurree, Engineer, Renewables Advisory
March 2016

DNV GL © 2016
DNV GL - 150 years of legacy

DNV GL © 2016
Policy Production Transmission
& Distribution
Use
Global service portfolio
Power testing, inspections and
certification
Renewables advisory services
Renewables certification
Electricity transmission and distribution
Smart grids and smart cities
Energy market and policy design
Energy management and operations
services
Energy efficiency services
Software
Policy Production Transmission & distribution Use

DNV GL © 2016
Asset Operation and Management Services (AO&M)
Wind farm analysis team comprises of over 40 professionals worldwide
Services provided include:
1. Long-term energy forecasts
2. Wind farm extension analyses
3. End of Warranty inspection analyses
4. O&M advice
5. Reliability profiling and benchmarking
6. Full wind farm management, via the control room
Over 2.5 GW of wind farms assessed in Australia,
64 % of the installed capacity
More than 50 GW assessed globally

DNV GL © 2016
Wind farm availability vs Operating Efficiency
Turbine stopped for 3 % of the time
How efficient are the turbines for the rest of the time?
Partially-available data Output curtailment Poor performance

DNV GL © 2016
Wind Farm Operational data
SCADA – Supervisory Control and Data
Acquisition system
Huge amount of data recorded by operating
wind turbines at a site
Many uses of the operational records,
including:
1. Turbine power curve performance
2. Changes in operation
3. Availability reviews
4. Monitoring of operating health of turbine
main components
Energy loss

DNV GL © 2016
Case Study 1: Incorrect turbine settings
Located in North America
Generating capacity over 100 MW
79 turbines installed
18 months of SCADA data available
Extensive periods of output curtailment
85 % of rated power
Energy loss estimated at 2-4 % per turbine
Over 2000 MWh of lost production

DNV GL © 2016
Also observed at an Australian Wind Farm
Detailed review of operational data recorded
at a wind farm in Australia
Turbine output curtailment strategies
implemented in the early years
2 turbines still curtailed after the strategies
were no longer needed
1 turbine experienced an additional loss of
3.4 % due to the output curtailment

DNV GL © 2016
Case Study 2: Incorrect Revenue meter settings
Wind Farm located in Europe
15 MW of generating capacity
Based on 2.4 years of operational data
Detailed review of wind farm performance Electrical Efficiency of 89.5 %
Further investigation revealed an
error in the set-up of the wind farm
revenue meter
Similar occurrence at an Australian
wind farm!
Intermittent error in the revenue meter.

DNV GL © 2016
Case Study 3: Gearbox failure
Wind Farm in Australia
Assessment of operating health of turbine main components using temperature
signals recorded by the SCADA system
Ability to plan change-out of failing component.
Decrease lost energy
Start of deviation from model
Gearbox failure with 18 months of advance
notice

DNV GL © 2016
Case Study 4: Change in operation settings
Observed at some Australian Wind Farms
Generating Capacity over 50 MW each
Multiple channel change-point analyses
Observed shift in the power curve and pitch to
power relationship
Corresponding to a change in control settings at
the site
New power curve can be 3 % less energetic

DNV GL © 2016
Case Study 5: Availability Review
Assessment of turbine availability and allocation of downtime
Operational data recorded by the wind farm SCADA system
Downtime attributed to the Operator
Downtime attributed to the Owner
Periods of missing SCADA data
Periods of downtime during
component failures attributed to the
Owner
Turb
ine
num
ber
10 minute records

DNV GL © 2016
Concluding remarks
A wealth of information at your disposal – the operational SCADA data
Use it to optimise the performance of your wind farm
Things can and do go wrong… Regular monitoring enables you to rectify the issues
as soon as they occur.
Erroneous curtailment
Revenue meter errors
Advanced detection of component failure
Changes to controller settings
Yaw misalignment
Be an engaged owner – Keep an eye on your wind farm to make sure it
performs as well as it should be.

DNV GL © 2016
SAFER, SMARTER, GREENER
www.dnvgl.com
Thank you
Heather Hurree,
Engineer, Renewables Advisory, Pacific
Tel +61 3 9600 1993

DNV GL © 2016 17/03/2016 SAFER, SMARTER, GREENER DNV GL © 2016
17 March 2016 Jessica McMahon
ENERGY
Remote sensing: the potential value of remote sensing devices in the development and financing of wind farm projects
1

DNV GL © 2016 17/03/2016
Global reach – local competence
2
400 offices
100 countries
16,000 employees
150 years

DNV GL © 2016 17/03/2016
Industry consolidation
3

DNV GL © 2016 17/03/2016
1. Introduction - What is the scope of our discussion
2. Remote Sensing device basics – How does RS work?
3. RS for resource assessment – How can RS add value?
4. DNV GL classification of RS devices
5. Summary

DNV GL © 2016 17/03/2016
1. Introduction – What is the scope of our discussion
• Focus of the presentation: Vertical profiling Remote Sensing (RS) devices
– Ground based, fixed scan geometry, vertically-profiling wind remote sensing
for on-shore wind resource assessment.
– Nacelle-mounted
– Forward-looking LIDAR
– Offshore remote sensing on fixed or floating platforms
– LIDAR that use variable scan geometries to probe volumes not directly above
the device
– Scanning LIDAR
5

DNV GL © 2016 17/03/2016
2. RS device basics – How does RS work?
6

DNV GL © 2016 17/03/2016
2 – What is remote sensing?
A remote sensing device takes measurements at points that are not at the sensor
location (typically at a distance of 20-200 m for ground-based SODAR/LIDAR).
Doppler effect

DNV GL © 2016 17/03/2016
= SOund Detection And Ranging
Advantages
– Low power requirements;
– Inexpensive;
– Portable and easy to dispatch without permits.
Disadvantages
– Potential for echo interactions with trees/structures;
– Possible insect or background noise interference;
– Cannot obtain accurate measurements when precipitation
is present;
– Limitations associated with volume versus point averaging;
– Turbulence and gust wind speed measurements;
– Cannot site SODAR directly next to a met mast.
= LIght Detection And Ranging
Advantages
– Measures valid data in light to moderate precipitation
events;
– High data recovery, even at upper heights;
– Portable and easy to dispatch without permits.
Disadvantages
– Systems contain delicate components;
– Relatively high initial cost (currently);
– May require a special power system for remote
applications;
– Limitations associated with volume versus point averaging;
– Turbulence and gust wind speed measurements.
8
SODAR – Acoustic based remote sensor LIDAR – Laser based remote sensor
2 - Introduction to RS devices

DNV GL © 2016 17/03/2016
3. RS for resource assessment – How can RS add value?
9

DNV GL © 2016 17/03/2016
3 – RS for wind resource assessment
Siting RS Devices RS devices are subject to similar siting considerations as for met masts:
Wind Direction
• Avoid installing adjacent to steep banks or cliffs
• Do not install on the bottom or top of a hill
• Install reasonable distance from any obstacle such as buildings

DNV GL © 2016 17/03/2016
In addition, for SODARs:
• Trees are a both an obstacle and source of noise. Install at least 3x tree height
away from the tree line. However, this set-back depends on tree density and
type. For example, a small group of deciduous trees may require a further set-
back due the noise from the foliage.
• Avoid any source of echoes including met masts.
• Minimum distance of 1.5x to a maximum of 2.0x the tower height (unless
otherwise specified by the manufacturer).
3 – RS for wind resource assessment
Siting RS Devices

DNV GL © 2016 17/03/2016
• Installation report (as complete as possible) – much like a mast
• Log of visits, maintenance and updates to software or firmware
(very important for consistency)
• Raw data with all available parameters
• Data processing software
• Validation paper for device (if available)
What information is important for a RS device?
3 – RS for wind resource assessment

DNV GL © 2016 17/03/2016
• Remote sensing devices should be validated against a nearby met mast
(typically 100-200 m away).
• Mast and RS device should share common measurement heights and
concurrent measurements over several months.
• If possible, base elevation and exposure should be similar at the two
locations.
• After successful validation, the RS device should be deployed to locations
which resemble the validated location – in terms of terrain type and
exposure.
RS verification/validation
3 – RS for wind resource assessment

DNV GL © 2016 17/03/2016
• Undergo initial filtering of RS data using quality signals
– e.g. Signal to Noise Ratio (SNR) for SODAR devices
• Clean the data against itself (i.e. to avoid skewing validation results)
RS verification/validation
3 – RS for wind resource assessment

DNV GL © 2016 17/03/2016
• Aiming for agreement between mean wind speed measured by mast and RS device to within
the anemometer uncertainty (IEC First Class MEASNET calibrated – 2%)
• Other things to check:
– Accuracy and precision
– Sector wise scatter
– Data recovery rate
– Shape of:
– Frequency distribution
– Wind rose
– Shear profile
RS verification/validation
3 – RS for wind resource assessment

DNV GL © 2016 17/03/2016
3 – RS for wind resource assessment
Example 1
16
Mast 1, 60 m,
4 years of valid data Project 1
Hub height 100 m
High vertical
extrapolation
uncertainty !
Co-located remote sensing device
(stage 3 and validated)

DNV GL © 2016 17/03/2016
3 – RS for wind resource assessment
Example 2
17
Mast 1, 60 m,
4 years of valid data Project 1
Remote sensing device
(stage 3 and validated)
Site reconstitution (synthesis)
Concurrent period with Mast 1
Project 2
4 km from Project 1
(similar terrain/exposure)
High horizontal
extrapolation
uncertainty !

DNV GL © 2016 17/03/2016
4. DNV GL classification of RS devices
18

DNV GL © 2016 17/03/2016
4. Classification of RS devices
DNV GL has a Position Statement regarding some of the different LIDAR or SODAR devices on the
market (not scanning or nacelle-based LIDAR yet).
Position Statement indicates the amount of validation required in order to be able to rely on data from
the given device in an energy assessment.
Set tests of measurement performance and associated benchmarks for each milestone.
Each device has an allocated ‘DNV GL expert’.
Work is currently underway to validate additional RS devices such as SpiDAR and scanning LIDAR at the
DNV GL test site in Germany, in order to provide position statements on these devices.
19
DNV GL Position Statements

DNV GL © 2016 17/03/2016 20
Milestone 1
Successfully tested at suitable test locations
Similar accuracy achieved to conventional data
Results published
Milestone 2 Extensive use at range of sites
High data capture levels
Numerous validations demonstrate close agreement with
conventional data
Quantification of precision and accuracy
Can be used qualitatively but not quantitatively
Can be used quantitatively to support
conventional measurements, if subject to
appropriate site specific validation
Can be used quantitatively with
reduced validation requirements
and improved uncertainty
Stage 1
•Commercially available
•Can routinely provide measurements of wind speed and direction with height
•Limited validation with conventional data sources or higher error bars than conventional data sources.
Stage 2
•Increasingly used on range of sites
•More operational experience gained
•Confidence in data increases, conditions where data not reliable are well-understood
Stage 3
•Device considered proven for use
4. Classification of RS devices

DNV GL © 2016 17/03/2016
Device Type Benign conditions
Non-benign conditions
AQ500 Sodar Stage 2
Triton Sodar Stage 2
Fulcrum 3D Sodar Stage 2
WindCube V1 Lidar Stage 3 Stage 2
WindCube V2 Lidar Stage 3 Stage 2
WindCube V2 with FCR Lidar Stage 3 Stage 2
ZephIR 300 Lidar Stage 3 Stage 2
ZephIR 150/175 Firmware 2.8 or later & software V4 or later
Lidar Stage 3 Stage 2
ZephIR 150/175 prior to Firmware 2.8 or software V4 Lidar Stage 3 Stage 2
21
4. Classification of RS devices

DNV GL © 2016 17/03/2016
1. Summary
• DNV GL has included RS data in wind, energy and uncertainty assessments.
• How RS data is used depends on the type of device and how it is deployed and
validated.
• RS may reduce resource assessment uncertainty by verifying met mast
measurements and providing additional information about new locations.
• DNV GL has developed a classification scheme to assess the accuracy and
applicability of common RS devices.

DNV GL © 2016 17/03/2016
SAFER, SMARTER, GREENER
www.dnvgl.com
Thank you
23
Jessica McMahon

Co-locating wind and solar: Combining powers Joep Vaessen Principal Engineer, Renewable Energy
©

Overview
Wind and solar co-location
1. The idea
2. Benefits and challenges
3. Complementary nature wind and solar resource
4. System sizing and curtailment
5. Heat map and wind farm ranking
6. Summary

1. The idea Co-location of solar PV at existing wind farms

2. Benefits and challenges Benefits
Benefits
Development cost
Land
Grid connection
PPA
Construction time
O&M facilities
Administration
Additional savings can be
obtained when developing
wind and solar power
plants at the same time as
a greenfield development.

2. Benefits and challenges Challenges
Challenges
Land use
Sizing & Curtailment
Agreements (GCA, PPA, LPA, O&M)
O&M activities
Community
Selected 10 wind farms for analysis
State Wind Farm Capacity
(MW) Yrs of data available
1 NSW Capital 140 4
2 NSW Gunning 47 3
3 SA Waterloo 111 4
4 SA Snowtown 99 4
5 SA Hallett 1 95 4
6 VIC Waubra 192 4
7 VIC Oaklands Hill 67 3
8 WA Collgar 206 3
9 WA Alinta 89 4
10 WA Emu Downs 80 4

3. Complementary nature of solar and wind Time of day analysis
Alinta, WA Snowtown, SA
Average annual profile of two wind farms (2011 – 2014)
Conclusions from the
10 wind farms
analysed:
• 6 showed reasonable
anti-correlation
• Strongest anti-
correlation results in
WA
• Large differences
between and also
within states

3. Complementary nature of solar and wind Time of day analysis
Waubra, VIC Collgar, WA
Average seasonal profile of two wind farms (2011 – 2014)
Conclusions from the
10 wind farms
analysed :
• 6 generated more in
Spring
• 2 generated more in
Summer but showed
dips during daylight
hours
• 2 generated more in
Winter (both in WA)

4. System sizing and curtailment Curtailment analysis
Solar PV curtailment versus additional solar capacity on each analysed wind farm (2011 – 2014)
100%
25 – 50%
27% curtailment at Snowtown
Conclusions from the 10 wind
farms analysed :
- Snowtown and Hallett wind
farm show high curtailment
mainly due to its high
generation during the day time
- Suitable penetration with 25%-
50% of solar @5% curtailment
- Curtailment did not exceed
30% when adding 100% of
solar PV.

4. System sizing and curtailment Overview
(2) Capacity factors are analysed over the years and
are not altered for maintenance or downtime
+11%

5. Heat map and wind farm ranking Solar and Wind capacity factor map
Filters:
- Wind capacity factor
>35%
- Solar capacity factor
>16%
- Solar farm at 35% of
the capacity of the
wind farm

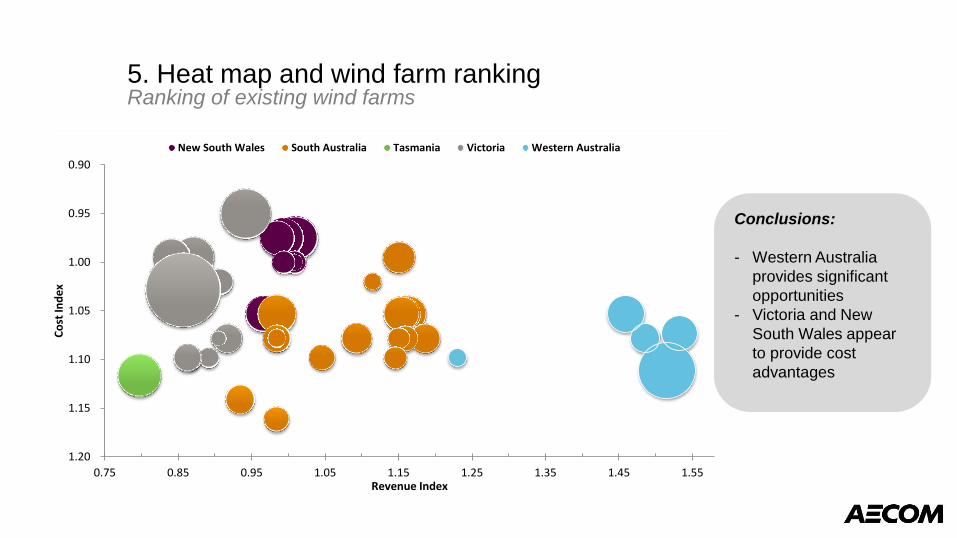
5. Heat map and wind farm ranking Ranking of existing wind farms
0.90
0.95
1.00
1.05
1.10
1.15
1.20
0.75 0.85 0.95 1.05 1.15 1.25 1.35 1.45 1.55
Co
st In
dex
Revenue Index
New South Wales South Australia Tasmania Victoria Western Australia
Conclusions:
- Western Australia
provides significant
opportunities
- Victoria and New
South Wales appear
to provide cost
advantages

Availability of wind and solar resource
Complementary profile of wind and
solar generation
Cost savings
Revenue opportunities
Agreements and regulations
6. Summary Success factors and conclusion
• Our study demonstrates that co-location is
worth the consideration of developers and
existing wind farm owners/operators.
• We encourage developers to consider
both wind and solar for their respective
sites (operational or in development)
• The report is made available on:
http://arena.gov.au/resources/wind-solar-co-
location-study/


Co-locating wind and solar: Combining powers Joep Vaessen Principal Engineer, Renewable Energy
©

Overview
Wind and solar co-location
1. The idea
2. Benefits and challenges
3. Complementary nature wind and solar resource
4. System sizing and curtailment
5. Heat map and wind farm ranking
6. Summary

1. The idea Co-location of solar PV at existing wind farms

2. Benefits and challenges Benefits
Benefits
Development cost
Land
Grid connection
PPA
Construction time
O&M facilities
Administration
Additional savings can be
obtained when developing
wind and solar power
plants at the same time as
a greenfield development.

2. Benefits and challenges Challenges
Challenges
Land use
Sizing & Curtailment
Agreements (GCA, PPA, LPA, O&M)
O&M activities
Community
Selected 10 wind farms for analysis
State Wind Farm Capacity
(MW) Yrs of data available
1 NSW Capital 140 4
2 NSW Gunning 47 3
3 SA Waterloo 111 4
4 SA Snowtown 99 4
5 SA Hallett 1 95 4
6 VIC Waubra 192 4
7 VIC Oaklands Hill 67 3
8 WA Collgar 206 3
9 WA Alinta 89 4
10 WA Emu Downs 80 4

3. Complementary nature of solar and wind Time of day analysis
Alinta, WA Snowtown, SA
Average annual profile of two wind farms (2011 – 2014)
Conclusions from the
10 wind farms
analysed:
• 6 showed reasonable
anti-correlation
• Strongest anti-
correlation results in
WA
• Large differences
between and also
within states

3. Complementary nature of solar and wind Time of day analysis
Waubra, VIC Collgar, WA
Average seasonal profile of two wind farms (2011 – 2014)
Conclusions from the
10 wind farms
analysed :
• 6 generated more in
Spring
• 2 generated more in
Summer but showed
dips during daylight
hours
• 2 generated more in
Winter (both in WA)

4. System sizing and curtailment Curtailment analysis
Solar PV curtailment versus additional solar capacity on each analysed wind farm (2011 – 2014)
100%
25 – 50%
27% curtailment at Snowtown
Conclusions from the 10 wind
farms analysed :
- Snowtown and Hallett wind
farm show high curtailment
mainly due to its high
generation during the day time
- Suitable penetration with 25%-
50% of solar @5% curtailment
- Curtailment did not exceed
30% when adding 100% of
solar PV.

4. System sizing and curtailment Overview
(2) Capacity factors are analysed over the years and
are not altered for maintenance or downtime
+11%

5. Heat map and wind farm ranking Solar and Wind capacity factor map
Filters:
- Wind capacity factor
>35%
- Solar capacity factor
>16%
- Solar farm at 35% of
the capacity of the
wind farm
5. Heat map and wind farm ranking Ranking of existing wind farms
0.90
0.95
1.00
1.05
1.10
1.15
1.20
0.75 0.85 0.95 1.05 1.15 1.25 1.35 1.45 1.55
Co
st In
dex
Revenue Index
New South Wales South Australia Tasmania Victoria Western Australia
Conclusions:
- Western Australia
provides significant
opportunities
- Victoria and New
South Wales appear
to provide cost
advantages

Availability of wind and solar resource
Complementary profile of wind and
solar generation
Cost savings
Revenue opportunities
Agreements and regulations
6. Summary Success factors and conclusion
• Our study demonstrates that co-location is
worth the consideration of developers and
existing wind farm owners/operators.
• We encourage developers to consider
both wind and solar for their respective
sites (operational or in development)
• The report is made available on:
http://arena.gov.au/resources/wind-solar-co-
location-study/


Nacelle mounted LiDAR Optimization of the wind farms performance
Melbourne – 17/03/2016 – Wind Industry Forum 2016 Julien Léon DEWI / UL
Technical Due Diligence – Team Leader France

Introduction of UL/DEWI A Global Service Provider serving the Wind Energy Industry
Global Wind Energy Services
Combining technical expertise with many
years of in-depth industry experience, the
DEWI Group (a UL company) offers global,
one-stop wind energy services to turbine manufacturers, component manufacturers,
All-in-One Service Provider project developers, utilities and other
companies within the sector. The UL/DEWI
Group currently operates two wind test sites
in Wilhelmshaven, Germany and at the West Texas AM University, USA.

Introduction of UL/DEWI A Global Service Provider serving the Wind Energy Industry
DEWI and
DEWI-OCC belong
to the UL family
of companies.
The DEWI Group
comprises:
DEWI:
One of the leading international
performance, measurement,
efficiency, research and
education providers in the field
of wind energy for about 25
years.
UL (Underwriters
Laboratories):
A premier global independent
safety and performance
science company, with more
than 120 years of history.
DEWI-OCC:
Recognised worldwide as
a leading independent
certification body of on-
/offshore wind turbines and
their components.

Introduction of UL/DEWI A Global Service Provider serving the Wind Energy Industry
25 years experience
1,500 clients in 53 countries
636 clients from abroad
180 employees world-wide
ULHeadquarter/Branches (extract)
DEWI Headquarter/Branches

DEWI helps stakeholders – developers, investors and operators – to identify the critical
aspects related to wind farm projects through comprehensive one-stop services,
individually tailored and flexibly delivered.
Services Portfolio Over Windfarm Life
5

Wind Farm Performance

Wind Farm Performance
• Wind farms performance: a key challenge for wind farm operators
• During Operation of the wind farm:
Follow-up and check production and performance of the wind turbines.
• Main aspects to monitor:
• Power performance
• Turbine settings (Yaw alignment, blade angle adjustment, rotor imbalance, etc.)
• Availability and main down times
Reach performance as planned before construction

Wind Farm Performance Analysis
Standard approach
Data analysis
On site measurements
SCADA
data
Error logs
Yaw
alignment
Rotor
Imbalance
Power
curve
Optimized WF performance

0%
10%
20%
30%
40%
50%
60%
70%
80%
90%
100%
Sep
.11
Oct
.11
No
v.1
1
De
c.1
1
Jan
.12
Feb
.12
Mar
.12
Ap
r.1
2
May
.12
Jun
.12
Jul.1
2
Au
g.1
2
Sep
.12
Oct
.12
No
v.1
2
De
c.1
2
Jan
.13
Feb
.13
Mar
.13
Ap
r.1
3
May
.13
Jun
.13
Jul.1
3
Au
g.1
3
Sep
.13
Oct
.13
No
v.1
3
De
c.1
3
Jan
.14
Feb
.14
Mar
.14
Ap
r.1
4
May
.14
Tech
nic
al A
vail
abil
ity
Energetic Availability
E01
E02
E03
E04
E05
E06
E07
E08
E09
E10
E11
E12
E13
E14
E15
E16
E17
E18
Wind Farm Performance Analysis
Data analysis • Standard data source = 10-min SCADA data and error logs:
Main Drawback: Low accuracy of nacelle sensors

Wind Farm Performance
Standard Analysis Major drawback is low accuracy of nacelle sensors
Solutions (among others):
Need of more accurate measurement
Met mast Spinner
anemometer
Nacelle
Mounted LiDAR Ground
Based LiDAR

Nacelle Mounted LiDAR A solution for Wind Farm Performance Analysis

Nacelle Mounted LiDAR
Measurement
Principle Technologies Objectives Data analysis
Measurement principle
• Measures remotely the free flowing wind before it passes through the rotor
Installation
• Installation on the nacelle roof
• Alignment with rotor axis and setting of tilt and roll
• Remote connection and synchronization with SCADA
Measurement Campaign
• Need of sufficient data set depending on final goal
• Usuall requested measurement duration
• Yaw alignment: 10-15 days
• Nacelle transfer function: 3 to 6 weeks
• Operational power curve: 3 to 6 weeks
Disturbed
flow
Free flow

Nacelle Mounted LiDAR
Measurement
Principle Technologies Objectives Data analysis
Various Manufacturers and technologies
• Leosphère: Wind Iris (2 beams LiDAR)
• ZephIR: ZephIR DM (scanning LiDAR)
• Windar Photonics: WindEye
• Other manufacturers
Applications
• Accuracy and potential applications depends on the technology of the device.
• For example ZephIR DM and Wind Iris LiDARs allow the applications mentioned hereafter.
Terrain complexity
• Standard use: for simple terrain
• Complex terrain: so far no industrial solution in the market

Nacelle Mounted LiDAR
Measurement
Principle Technologies Objectives Data analysis
Yaw alignment
• Measure the difference between the wind direction and the turbine rotor axis
• Correct Yaw misalignment (if identified)
• Avoid important production losses and undesired loads
Nacelle transfer function
• Measure the nacelle transfer function
• Application to the nacelle anemometer for further data analysis and performance analysis
Operational Power Curve
• Check the Operational Power Curve during the campaign
• Identify where gain of energy production is possible
The operational power curve and nacelle transfer function
verifications according to IEC 61400-12-1 and IEC 61400-
12-2 requirements do not consider LiDAR measurement
α

Nacelle Mounted LiDAR
Measurement
Principle Technologies Objectives Data analysis
Main input data for analysis
•LiDAR measured data (10 minutes average): • Wind-speed in front of the rotor (m/s)
• Relative wind direction (°)
•10 minutes SCADA data: • Ambient temperature (°C)
• Nacelle Position (°)
• Wind-speed nacelle (m/s)
• Power output (kW)
Data filtering
• Filtering according to nacelle position (unperturbed sectors)
• Filtering of some transitory events
Specific analysis
• Each application is related to specific analysis and data filtering (see next slides)

Outcomes of Measurement

Nacelle Mounted LiDAR
Yaw alignment
Aim
• Measurement of the difference between the wind direction and its measurement axis, aligned with the turbine rotor axis
Data analysis
• Filtering of transitory events and extreme values
• Flow homogeneity and data availability
• Measurement until convergence of misalignment value
Corrective measures
• Adjustment of the yaw angle setting
Outcome
• Reduction of undesired loads
• Optimize the extraction of energy from the wind flow

Nacelle Mounted LiDAR
Nacelle transfer function
Aim
• Measure the nacelle transfer function to be applied to the nacelle wind speed to calculate the theoretical free wind speed.
Data analysis
• Selection of sector (out of wake from neighboring turbines and obstacles)
Outcome
• Nacelle transfer function
• Application to the nacelle anemometer wind speed for further data analysis and performance analysis
The operational power curve and nacelle transfer
function verifications according to IEC 61400-12-1
and IEC 61400-12-2 requirements do not consider
LiDAR measurement

Nacelle Mounted LiDAR
Operational Power Curve
Aim
• Measurement of the wind-speed in front of the rotor in order to check the Operational Power Curve
Data analysis
• Selection of sector (out of wake from neighbouring turbines and obstacles)
• Air density correction
• Comparison with power curve from SCADA data
Corrective measures
• In case of underperformance identified: investigation of root cause and actions
Outcome
• Identify range of wind speed where gain of energy production is possible.
The operational power curve and nacelle transfer
function verifications according to IEC 61400-12-1
and IEC 61400-12-2 requirements do not consider
LiDAR measurement

Conclusion

Conclusion
• Nacelle mounted LiDAR allows to gather more accurate data to perform more reliable
analysis of wind turbines performance.
• The 3 mains goals of a nacelle mounted LiDAR measurement campaign are checking of:
• Yaw alignment,
• Nacelle transfer function,
• Operational power curve.
• If underperformance or unacurate settings are identified, correction can be applied in order to :
• Improve performance and production,
• Avoid undesired loads.
• Other applications of Nacelle mounted LiDAR
• Offshore Power Curve Verification

Thank you.

Grid Integration, FCAS and Market Systems.
Kate Summers
Manager, Electrical Engineering Pacific Hydro
WIF
March 2016

Focus • Challenges in the NEM - Frequency Control
• Unpick the stories
• Fact check on the performance of wind farms
• Future aims
K Summers - WIF 2016 2

South Australia – RE Integration • Lots of Integration Reports:
• 2011, 2013, 10/2014, 10/2015, 2/2016
• Withdrawal of NPS / Playford, concern over rate of change of frequency.
• Wind Farms make up ~28% of SA generation1 (without retirements)
• Wind Farms are allocated ~ 65% of CPF generator costs
• Frequency control and the excessive cost of frequency control
• Market Systems must integrate with the power system – not redirect it.
• Provision of Ancillary Services requires scrutiny
• Do we get what we are paying for?
K Summers - WIF 2016 3

Wind Function Information Flow
Wind Farm
SCADA
EMS AWEFS
NEMDE Dispatch Targets
Dispatch Assessment
CPF Assessment
CPF Allocation
There is no doubt about it – its complex!!
ADE
Regulation
Requirements

K Summers - WIF 2016 5

Using Public Data only …
K Summers - WIF 2016 6
• Oakland Hill Wind
Farm across 9th/10th
May 2015
• Oakland oscillating
• Oscillated
completely off for
the entire weekend

K Summers - WIF 2016 7

K Summers - WIF 2016 8

K Summers - WIF 2016 9

K Summers - WIF 2016 10

Conclusion A lot of work is required to return to basic power system control – the fundamentals are being lost
– FCAS specification of Contingency services needs correcting
– Re-establish control hierarchy – Frequency services must control frequency.
– The push for inertia markets and more interconnector constraints needs to back off until we
correct the errors in the dispatch of FCAS services.
– The FCAS markets needs to be reviewed and barriers to RE participation removed
Renewable Energy
– Forecasts must be accurate
– The wind industry has to improve SCADA data feeds to AEMO
– AEMO need to improve forecast logic and NEMDE integration of forecasts
– Wind turbines can easily provide L6, and L60 services and should look into doing that.
K Summers - WIF 2016 11

References:
AER: FCAS prices above $5000 MW - 1 November 2015 (SA)
AEMO: Load shedding in South Australia on Sunday 1 November 2015
AWEFS UIGF Scheduling error_2012 to 2016_FINAL
K Summers - WIF 2016 12

Keith Ayotte Chief Scientist
Windlab Limited
Understanding and Predicting
Topographic Wake Turbulence
Emma Howard Wind Engineer
Windlab Limited

The next fourteen minutes/slides:
A few words about atmospheric boundary layer turbulence
The IEC and turbulence in wind turbine design
A description of topographic wake turbulence
Show that topographic wake turbulence can be described by a simple production-transport-
dissipation model
Describe two ways of modelling topographic wake turbulence.
Show two ways of modelling topographic wake turbulence
An introduction to some open source CFD tools
Show some progress in how we model topographic wake turbulence

IEC Turbine Design Curves
Mean wind speed and turbulence probability distributions in wind turbine design.
TI u
2v
2w
2
U
Turbulent Intensity
TI u
U
Sometimes used

Site measurements from a promising site Site measurements from a problematic site

l ~ m’s – 100’s m l ~ mm
In the lee of topography In the free atmosphere

High pressure Low pressure High pressure
Pressure gradient Pressure gradient
How can we model topographic wake turbulence?
Hills are in many ways like a ( stalled ) aircraft wing.

Two Types of CFD Modelling
RANS
Reynolds Average Navier Stokes (RANS)
- can be done commercially
- many assumptions about length scales
- simple boundary conditions
- treats turbulence cascade in a very simple way
that does not account for all of the length scales
associated with geometry of the hill

LES
Large Eddy Simulation (LES)
- prohibitively expensive computationally
- makes far fewer assumptions about length scales
- idealised flows and boundary conditions
- quite naturally reproduces all of the length scales
associated with generation, transport and dissipation
Can we learn some things about the length scales in the flow that allow us to modify our RANS model in a
physically sensible way, to include externally imposed length scales?
We think so. Here’s how.
Two Types of CFD Modelling

Start with turbulence kinetic energy and dissipation equations
k
tU j
k
x j
x l
t
k
k
x l
P
tU j
x j
x l
t
x l
C1
P
kC 2
2
k
dk
t P
d
t c1
P
kC 2
2
k
Apply in homogeneous turbulence to get two
ordinary differential equations
k(t) k0
t
t0
n
(t) 0
t
t0
(n1)
t0 nk
0
C 2 n 1
n
k
tU j
k
x j
x l
t
k
k
x l
P(1 ckp
p
xn
)
tU j
x j
x l
t
x l
C1
P
kC 2(1 cp
p
xn
) 2
k
Pope, S.B., 2000, Turbulent Flows, Cambridge
University Press, Cambridge
cpp
xn
ckp
p
xn

Turbulence generated in lee of the hill is directly
dependent upon the strength of the adverse
pressure gradient and the shear at the top of the
hill.
Turbulence is generated in much larger quantities
at larger length scales.
This allows the turbulence to be transported
downwind in the mean flow for much greater
distances before it is dissipated.
What really happens

0.6S
0.4R
0.4S
0.3R
0.3S
0.2R
0.2S
Prediction of wind tunnel wake turbulence

Open source Field Operation And Manipulation

Pressure at 10m ( 240 deg )

An example of turbulence prediction
across a coastal area.

240 deg 270 deg 300 deg
Thanks for your
attention.

CEC Wind Industry Forum 2016
Innovation in Turbine Tower Design Concrete Towers
Kieren Lewis – Senior Manager, Construction

2
Concrete Towers - is there are place for them in the Australian Market?
Latest wind turbine technology is around bigger rotors and tall towers. Taller towers
present challenges and opportunities. There is demonstrable evidence internationally
that concrete towers can play a significant part of meeting local content requirements,
assist in achieving a social licence to operate, and be economically superior for both
project proponents and the local community. Whilst high costs in Australia (by global
standards) means that further assessment is required, initial modelling undertaken by
Acciona in Australia suggests that, for the right project and market conditions, concrete
towers may have a positive project impact. Certainly there is a case for maintaining
flexibility during project permitting to allow the option for concrete towers.

3
Safety Moment
What – 12kV UG circuit trip
How – a fencing contractor engaged by a landowner drilled through a live cable with a tractor mounted auger
Consequences – moderate (actual) and catastrophic (potential – near miss)
Why – did not DIAL BEFORE YOU DIG, misinterpreted warning signs, no JSEA
Outcomes – landowner engagement, site risk assessment, contractor procedures, replace/additional signs

4
Overview
ACCIONA – leaders in the wind value chain
Trends – constraints, bigger rotors, taller towers, permits catching up
Why concrete towers?
ACCIONA’s concrete tower solution
Project Comparison – Mt Gellibrand Wind Farm
Conclusions – leave the option open

5
ACCIONA
Leaders in the renewable energy
8,500MW
Present in whole wind value chain

6
Trends
Aviation
Policy – RET / State (VIC)
DA’s with ~150m
Tip Height
120m 137.5m
116/125/132m Rotors
125/132m Rotors
87.5m Tower
125m Rotor

7
Why Concrete?
Concrete Towers
Technical challenges at 100m+
Well known,
historically proven
Local content, social licence
Project economics,
price stability
1,000MW+ installed by ACCIONA
Key markets include Brazil & Mexico
Project schedule as per steel
Local/project constraints
Proven economic and social benefit
BUT…Australia is different
How does concrete compare locally? http://www.acciona-windpower.com/pressroom/video-gallery

8
ACCIONA’s Concrete Tower
Patented design
with 20m pre-cast
“keystones”
Keystones are
joined vertically into
sections
Entire tower is post-
tensioned with 6
cable bunches into
the foundation
Small steel adapter
connection on top
section

9
ACCIONA’s Concrete Tower

10
Australian Analysis
Steel Concrete
Footing
Assembly
Manufacturing
Transport
Economics driven by 4
key inputs
Analysis focused on on-
site (or near site) casting
Off-site casting at
existing facilities has the
potential to significantly
improve concrete
Site track network can
reduce transport
V

11
Australian Analysis
Below 100m, steel is more economical unless other project factors prevail
Concrete tower costs converge with steel as quantity increases, more rapidly at higher tower heights
Other factors may come into play
• Government schemes / Local Content (ACT / VIC Auctions)
• Site characteristics
• Manufacturing capacity
• Community support

12
Project Comparison
Mt Gellibrand Wind Farm
Maximum tip height of 150m in DA
Original configuration of 115 x AW1500/82
3 x modifications to 44 x AW3000/125 (87.5m tower)
10% more energy from the same number of WTGs
Positive NPV impact for both 120/140m tower
Tower MW GWh CF Tower Cost
NPV
87.5m 132 435 38% - -
120m 132 460 40% 23% 16%
140m 132 477 41% 39% 28%

13
What does it mean?
The market is moving beyond 150m tip heights
Concrete towers show economic and social project benefits internationally
Local analysis confirms improved project economics at 120/140m+
Specific project characteristics (location, size etc.) and/or proximity to established casting facility impacts steel v concrete equation
Concrete provides direct local content and community benefit supporting bid requirements and contributing to a social licence to operate
There is a case for maintaining flexibility in DAs to allow concrete towers

TransGrid’s Renewable Energy Hub
Mal Coble, Group Manager, Business Diversification
17 March 2016
More than a network
#WIF2016

TransGrid's Renewable Energy Hub
About us Operator and manager of the NSW transmission network, we connect generators, distributors and major end users
64,200 GWh moved in 2014/15
12,900 km transmission lines
99 substations
2,300 km optical fibre
We’re more than a network
2 / Grid innovation: the role of transmission in the evolving energy ecosystem TransGrid’s Renewable Energy Hub 2 /
Legend
Sydney

TransGrid's Renewable Energy Hub
New England region
NSW
Renewable Energy Hub
A Renewable Energy Hub could bring more than 700MW in additional connections
3 /

TransGrid's Renewable Energy Hub
Title goes here
Stage 1: Feasibility study & knowledge sharing report
Proof of Concept – New England
Identify & implement potential future
renewable hubs
First customer
connection request
Stage 2:
Construction of
Renewable Energy
Hub
4 /

TransGrid's Renewable Energy Hub
Investigation streams
Technical Commercial Community Regulatory
5 /

TransGrid's Renewable Energy Hub
Network configuration – without a hub
330kV Transmission line
Connection point
Proposed transmission line
Proposed substation
Glen Innes substation
132 kV
Transmission
line
6 /

TransGrid's Renewable Energy Hub
Network configuration – with a hub
330kV Transmission line
Connection point
Proposed transmission line
Proposed substation
Glen Innes substation
132 kV
Transmission
line
7 /

TransGrid's Renewable Energy Hub
Commercial considerations
Standalone
connection costs
Hub connection
costs
Overall
cost
saving
Overall
connection
cost for hub
arrangement
Commercial considerations
Cost savings
Risk sharing
Investment returns
Replication
The New England Renewable Hub brings economic benefits
8 /

TransGrid's Renewable Energy Hub
Regulatory considerations
There are potential hurdles to
commercial development/funding
of a SENE or a hub concept study
that need to be addressed.
Incentives for a commercial party
to fund for such a study need to
be considered.
Is it a SENE?
9 /

TransGrid's Renewable Energy Hub
Community engagement
There is overwhelming broad
community support for these types
of development in the region.
Benefits
New England community:
“We are different”
10 /

TransGrid's Renewable Energy Hub
Next steps
> Balranald
> Buronga
> Broken Hill
> Darlington Point
> Griffith
> Parkes
> Tamworth
> Wellington
Visit our stand to find out more
Other possible hub locations
11 /

Connection hubs may prove to be an important
ingredient in addressing challenges associated with
increasingly decentralised electricity supply from
renewable sources

Title Sub-heading
21/03/2016
Updates on Victorian Planning from the inside and
guidance for applicants
Michael Juttner - DELWP

Overview
2
DECISION MAKER – MINISTER FOR PLANNING
The Minister for Planning is the responsible authority (decision maker) for all new wind farm applications in Victoria. This includes planning permits for transmission infrastructure
DELWP - PLANNING
• administers all applications and briefs the Minister for him to determine applications.
• Planning will consult with and work with the local council regarding all applications

Changes to planning controls
3
VC124 – 2 April 2015
Recent change to the planning controls in 2015-16 are:
VC107 – 26 November 2015
• Minister for Planning to decide transmission infrastructure planning permit applications (including vegetation removal) .
• -Reduced the 2km rule to 1km. • Minister for Planning to decide all new wind farm planning permit applications.
• allows amendments to existing ‘called in’ planning permits to be considered without the need for a panel hearing.
VC126 – 28 January 2016
What does it mean? Do I need to know this?
No, the planning scheme provisions are most relevant to your application

What should be in my application?
4
Your application for a new wind farm must include:
• An application form and the prescribed fee • Copies of title for all land • Written consent of all house owners within 1 kilometre of a
turbine • A planning report that considers the proposal against the
requirements of the planning scheme and the Wind Energy Facility Guidelines
• Plus – anything else relevant to assessing the impact of your proposal
• Include peer reviews of key reports: noise, avifauna, visual impact
Your planning consultant can do this for you

What should be in the planning report?
5
Your planning report must demonstrate how your proposal meets the planning scheme requirements, including:
• State and Local Planning Policy • Zones and Overlays affecting the land • Permit triggers for use and development • Particular provisions in particular
• Clause 52.32 wind energy facilities • Clause 52.17 native vegetation removal
• Decision guidelines for each permit trigger • General provisions including:
• Referral authorities
Your planning consultant can do this for you

The application process
Lodge application
• If further information is required it will be requested
Referral and Notice
• Referrals to authorities identified in planning scheme and CASA
• Views of DELWP environment is sought on avifauna impacts
• The department will work closely with council to ensure council’s input, particularly on local issues.
• Application is advertised by mail, signs, notice in paper
Decision
•Submissions considered
•DELWP Staff make recommendation to the Minister who then determines the application
•Decision can be reviewed at VCAT by objectors
6

What about ‘called in’ applications?
7
Some applicants may request that the Minister ‘call in’ an application under Section 97 of the Planning and Environment Act 1987 Victoria’s Regional Statement identifies that applications of state or regional significance may be called in to fast track decision making Submissions received following advertising are referred to a panel hearing After the panel hearing and receipt of the panel report the Minister determines the planning permit application Decisions made on called in applications are exempt from 3rd party review (VCAT)

How to amend an existing permit?
8
First check if the permit was issued by council or the Minister and if it was called in
If issued by council: apply to council to amend the permit (S72)
If issued by Minister following a call in: apply to the Minister to amend the permit (S97)
Note: if the number of turbines is not increased, and no turbine is moved closer to a house then: a) You do not require the written consent of house owners within 1km b) There are no third party appeal rights (VCAT) c) The amendment to a called in permit is exempt from being considered at a panel hearing

What should be in my application to amend a permit?
9
Your application to amend a permit should include:
• An application form and fee • Copies of title for all land • Written consent of all house owners within 1
kilometre of a turbine (if required) • Detailed reports that assess the impact of the
changes. Concentrate on the change, don’t reinvestigate the whole thing.
• Include peer reviews of key reports such as noise, flora and fauna impacts, visual impact.
• Plus – anything else relevant to assessing the impact of your proposal
Before you lodge, consult with: referral authorities CASA DELWP environment
(avifauna and veg removal)
Council and the local community

Tips for applicants?
10
• Consult before you lodge • Identify referral authorities and engage with them early (before you lodge).
Also engage with CASA, DELWP environment (avifauna impacts) • Engage with council and community (no surprises) • Have an on-site quarry to limit traffic impacts • Go to every effort to limit vegetation removal • Consider the Brolga Guidelines and design accordingly • Deal with issues before you lodge, don’t just ask for them to be permit
conditions • Make sure all your consultant reports include an executive summary that
clearly spells out the findings, and is focussed for planning consumption
Use a planning consultant

More tips When submitting documents for endorsement under permit conditions:
• Always use the permit as a checklist
• The planners will be assessing your plans / documents against the permit conditions
• Check that you have met each part of each condition before you lodge them
• Include a covering letter or report that spells out how you meet the requirements of each condition, and where to locate that specific item in the plan / document
• It saves time if you do these things
11
Your planning consultant can do this for you

What else?
12
The current state government has repeatedly expressed its commitment to renewable energy and the wind industry.
Read Victoria’s Renewable Energy Action Plan August 2015 and follow developments leading from it.
The target is for 20% of Victoria’s energy to come from renewables by 2020.
There is political support, but you must still prepare a solid, thorough and justified application to obtain a permit.
And…. Use a planning consultant.
Questions?

SLIDE 1
GRID INTEGRATION
March 2016
PRESENTED BY NICOLA FALCON
GROUP MANAGER, PLANNING
The changing role of transmission in Australia’s energy future

SLIDE 2
AGENDA SLIDE
1. About AEMO
2. Network Development
3. Risk of Local Congestion
4. AEMO’s Planning Process
5. Investment Triggers and Risks
6. 2016 Victorian Annual Planning Report (VAPR)
7. Integrating Renewables in the VAPR
8. Questions

SLIDE 3
ABOUT AEMO
• Australian Energy Market Operator (AEMO).
• Our vision “Energy security for all Australians.”
• AEMO is fuel and technology neutral.
o Generation expansion plan will consider how Australia may cut carbon emissions by at least 26 per cent of 2005 levels by 2030.
• Guided by the National Electricity / Gas Objectives:
o To promote efficient investment in, and efficient operation and use of, electricity services for the long term interests of consumers

SLIDE 4
Changing
technologies
Facilitating
competition
Regulatory and
policy factors
e.g. Climate
commitments
NETWORK DEVELOPMENT

SLIDE 5
IMPORTANCE OF GENERATION LOCATION
Biomass Large-scale PV Wind Open Cycle Gas Turbine
Additional generation location by 2024-25 – Gradual Evolution scenario (left) and sensitivity
• Widespread wind and solar resources could enable new generation to
connect where there is spare network capacity
• But concentration of generation can lead to local network limitations

SLIDE 6
RISK OF LOCAL CONGESTION
North-west Victoria (case study)
• Wind farm developers interested in
connecting to the Ballarat-Waubra-
Horsham 220 kV transmission line (BATS-
WBTS-HOTS). • this line currently connects Waubra Wind
Farm (190MW) and Ararat wind farm
(240MW) will be commissioned in 2017.
• additional wind farms connecting will
increase the risk of exceeding the thermal
limit of the line between BATS and WBTS.
• increasing non-synchronous generation will
increase the potential of instability in the
region.

SLIDE 7
CHALLENGES CAUSED BY LOCAL
CONGESTION
Load = 200MWGeneration cost = $0/MWh
200MW capacity
150MW dispatched
Generation cost = $10/MWh
200MW capacity
50MW dispatched
100% loaded
Short Circuit Ratio

SLIDE 8
RISK OF GETTING CONSTRAINED
• The generator that will be constrained depends on:
o Variable operational conditions
o Economic considerations
o The location of each wind farm relative to the
constraint
• Will network capacity be augmented?
o Augmentation is only justified if net market benefits
are sufficient
• Generators are not entitled to reserved network capacity

SLIDE 9
PLANNING PROCESS
Phase 1 – Exploratory (covered in 2016 VAPR)
• Screening studies to identify potential limitations and their timing (based on
MW connected).
• Scenario studies on future triggers that will worsen limitation.
• Market modelling to identify potential market impact and potential benefits for
alleviating these limitations.
Phase 2 – Scoping (limited coverage in 2016 VAPR)
• High-level studies to assess each solution’s technical effectiveness, cost
estimate, and potential benefits across a range of scenarios.
Phase 1 - Exploratory
Phase 2 - Scoping
Phase 3 – Pre-
feasibility
Phase 4 – Feasibility

SLIDE 10
INVESTMENT TRIGGERS AND RISKS Average fuel costs in the NEM from 2016-2025
Changing generation mix – Rapid Transformation (2015 NTNDP)
0
10,000
20,000
30,000
40,000
50,000
60,000
70,000
80,000
90,000
2015-16 2020-21 2025-26 2030-31 2034-35
Inst
alle
d C
apac
ity
(MW
)
Black Coal Brown Coal Hydro Liquid Fuel Natural Gas
Large Scale PV Wind Biomass Rooftop PV
0
2
4
6
8
10
12
Brown Coal Black Coal Coal SeamMethane
Natural GasPipeline
Diesel
$/G
J

SLIDE 11
2016 VICTORIAN ANNUAL PLANNING
REPORT
• The Victorian Annual Planning Report will be published
in June 2016
• Will explore wind + potential augmentation options as
part of a case study in North-West Victoria
• Interactive map that illustrates the hotspot area of future
renewable generation and other information (limits,
possible connection capacity)

SLIDE 12
APPROXIMATING GRID ACCESS
*MOCK RESULTS *


WIND TURBINE NOISE
– THE PERENNIAL QUESTION
by
Dr Norm Broner

SO WHERE ARE WE AT ??
So are Wind Turbines a Health Problem or not?
There have been at 24 reviews that have shown that there is no
evidence of direct health effects
The NHMRC investigated this question and concluded:
After careful consideration and deliberation of the body of
evidence, NHMRC concludes that there is currently no consistent
evidence that wind farms cause adverse health effects in humans.
BUT
Given the poor quality of current direct evidence and the concern
expressed by some members of the community, high quality
research into possible health effects of wind farms, particularly
within 1,500 m is warranted.
.

HEALTH CANADA STUDY The objectives of the study were to:
Investigate the prevalence of health effects or health indicators among a
sample of Canadians exposed to WTN using both self-reported and objectively
measured health outcomes;
Investigate the contribution of LFN and infrasound from wind turbines as a
potential contributing factor towards adverse community reaction.
The following were not found to be associated with WTN exposure:
self-reported sleep (e.g., general disturbance, use of sleep medication,
diagnosed sleep disorders);
self-reported illnesses (e.g., dizziness, tinnitus, prevalence of frequent
migraines and headaches) and chronic health conditions (e.g., heart disease,
high blood pressure and diabetes); and
self-reported perceived stress and quality of life.

ENERGY AND POLICY INSTITUTE REVIEW OF
COURT CASES
Since 1998, 49 hearings have been held under rules of legal evidence
in at least five English-speaking countries and four types of courts
regarding wind energy, noise, and health.
Forty-eight assessed the evidence and found no potential for harm to
human health.
There was one outlier –Falmouth!
Courts in Denmark, Germany and the Netherlands have also found no
connection between wind turbines and health issues per reports, but
the records are not in English.

REVIEW OF COURT CASES
Court cases jumped dramatically after Dr. Nina Pierpont’s self-
published a book alleging health risks from wind turbines based on
phone interviews with a self-selected and very small number of
people who blamed them for commonly experienced symptoms.
Canada is the centre of wind farm health-related court challenges,
with 17 separate hearings
Mainly in Ontario, with 14 Environmental Review Tribunals (ERT)
testing the evidence and the relative experts, as well as two higher
court cases.
All Canadian courts found that wind farms would not and do not
cause health impacts with proper setbacks in place

CASES IN AUSTRALIA
Australia with 10 cases.
Victoria with seven civil suits.
South Australia and New South Wales saw three cases in
their environment and resource courts.
All Australian cases found that wind farms would not
cause health impacts with proper setbacks in place.

.

CASES IN THE USA
The United States saw eight court.
Seven cases found no harm from wind energy with the proper setbacks
currently in place
The USA has the only case where a wind farm was considered to have
caused harm.
This case was brought by a single family near a pair of wind farms
erected on the municipal wastewater treatment plant by the town of
Falmouth, Massachusetts. The judgment includes the statement that
dental harm occurred, along with other types of medical ailments.
This single small wind farm is referenced worldwide by anti-wind
advocacy groups as if it is representative of wind health court cases
instead of a unique outlier

CASES IN NEW ZEALAND
New Zealand had five environmental and civil hearings over wind
energy, noise and health
Only one case in New Zealand went against a wind farm, the Te Rere
Hau wind project, and that was only because noise was greater than
anticipated, not because the wind noise was above standards or
harmful to human health.
This case is widely misrepresented and selectively quoted by anti-
wind campaigning organizations such as the Waubra Foundation and
National Wind Watch

European Platform Against Windfarms
961 Member organizations from 30 European countries
AUSTRALIA 1
MEXICO 3
EU 3
NORWAY 4
CANADA 10
USA 13
SWITZERLAND 16
DENMARK 18
IRELAND 27
BELGIUM 29
UK 120
GERMANY 173
FRANCE 381
BUT eg Belgium 29 listed, only 8 were working and of those, 3
were inactive, making 5 still active (Simon Chapman 2016)

AUSTRALIA’S WIND FARM COMMISSIONER
The Wind Farm Commissioner is an independent role reporting
directly to the Minister for the Environment.
There are no formal powers and the WFC does not displace the
responsibilities of state jurisdictions.
The WFC is meant to operate “based on the effectiveness of my
relationships with a wide and diverse range of stakeholders from all
levels of government, industry and the community”.
Currently, the WFC has a chief of staff, an administrative assistant on
loan from the department. He intends to hire a complaint-handling
manager and a research officer.
So far, 42 complaints about 12 WF’s. 5 Operational, 7 in development.
For the wind farms that have been constructed, typically issues are
again around noise, health effects, turbine configurations, turbine
height and economic loss.

ENGAGEMENT and COMPLAINT HANDLING
In his recent evidence, Mr Dyer stated:
One of the improvement opportunities that I have seen from
anecdotal discussions is to help those agencies and stakeholders
you have just described to improve their complaint handling
processes. It is not just a matter of capturing a complaint; you
need to do something with it.
I think many of the players in the industry and supporting the
industry could further improve their complaint handling
processes, which would then take a load off us
.
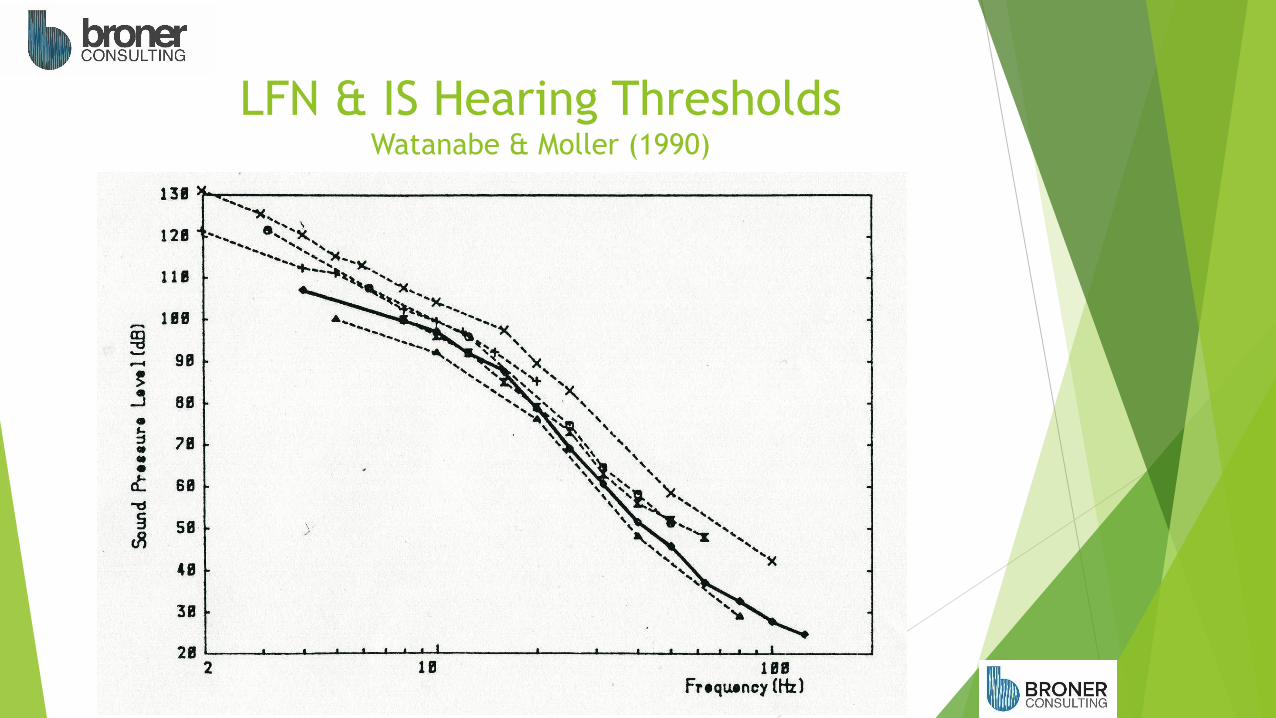
LFN & IS Hearing Thresholds Watanabe & Moller (1990)

IS & LFN COMPARISON URBAN SA EPA/Resonate (2013)

SENATE SELECT COMMITTEE ON WIND TURBINES
Broner in evidence
“So to summarize, I believe that IS is not the source of
any complaints due to wind turbine noise.
I believe that LF audible noise may be a possible source
and that the current recent research shows that wind
turbine noise does not cause health impacts when A
weighted criteria are met.
I believe that A-weighted noise level criteria are therefore
adequate to describe wind turbine noise. And I note that
both the Canadian and Japanese work found that the use
of A weighting was validated”.
.

ANNOYANCE RESPONSE
Activities Disturbed
Eg Reading,
TV viewing
Situational
Eg Season, time of day
Acoustical
Eg Intensity, frequency
Demographic,
biographic
and sociological
Eg Age, sex,
income
Other
Eg Expectation,
previous experience
Psychological
Eg Personality, sensitivity

How Important is the Acoustic Stimulus Alone?
For a community, % Variance in response explained
20 – 30% .
For an individual, % Variance in response explained
10 – 15%

ATTITUDE

ONTARIO TO GET ANOTHER STUDY!
More Ontario wind-health investigation: "The Huron County Health
Unit (HCHU) will be conducting an investigation into the reported
health effects from wind turbines. This investigation is in response to
feedback from numerous Huron County residents reporting negative
health impacts resulting from living in close proximity to the massive
apparatuses designed to capture energy from wind.
The study will consist of two phases:
The first phase will include a launch of an online survey in May to
collect information in regard to the number of complaints and/or
concerns of residents.
The second phase of the investigation, according to Ryan, may involve
acoustic testing both outside and inside affected homes."
.

Thank you

www.ehpartners.com.au www.ehpartners.com.au
Wind Industry Forum 2016 Richard Sharp Senior Consultant Environment & Infrastructure
What is best practice environmental management during wind farm construction?

www.ehpartners.com.au
Wind Farm Implementation Guidelines
• Construction Environmental Management Plan
– Identify the risks
– List the actions to be taken
– Capture conditions of approval / commitments
– Appoint a person responsible for implementation
2

www.ehpartners.com.au
Wind Farm Development Guidelines
• Construction Environmental Management Plan
– Must be prepared
– Must be endorsed by the relevant authority
– Must identify person to whom incidents, non-conformances and complaints should be made
3

www.ehpartners.com.au
Wind Farm Development Guidelines
• Construction Environmental Management Plan
– Should be ‘signed off’
– Should include monitoring
– Should include a compliance regime
– Should identify a person from the company who is responsible for implementation
4

www.ehpartners.com.au
Guidelines for Wind Farm
• Construction Environmental Management Plan
– State how any adverse impacts will be managed
– Expert advice
– Best practice techniques
– Project staging and phasing
5

www.ehpartners.com.au
Wind Farm State Code
• Construction Environmental Management Plan
– Construction Erosion and Sediment Control Plan
• Certified by a RPEQ
– Construction Traffic Management Plan
• Certified by a RPEQ
6

www.ehpartners.com.au
Wind Farm Approval Conditions
• Environmental Representative
– Suitably qualified and experienced person
– Independent of design, construction & operations
– Oversee the implementation of the CEMP
– Report on any non-compliances against the CEMP
7

www.ehpartners.com.au
What is Best Practice?
• Satisfactory CEMP
– Start of the project
• CEMP revision
– During the project
• CEMP implementation
– Independent compliance monitoring and auditing
8

www.ehpartners.com.au
Achieving Best Practice
Have the CEMP prepared by a Registered Professional / Certified Practitioner.
Have the CEMP reviewed by a Registered Professional / Certified Practitioner. Have the implementation of the CEMP monitored by a Registered Professional / Certified Practitioner who is not an employee of the design, construction or operational entities.
9

www.ehpartners.com.au
Registered Environmental Professional
• Completed a degree, higher degree or graduate diploma and have at least two years’ experience in an area of environmental practice.
• At least five years’ experience in an area of environmental practice.
10
www.ehpartners.com.au
Certified Environmental Practitioner
• An environment-related degree.
• Five years of full time equivalent experience in the functional areas of environmental practice during the last ten years.
• Ongoing commitment to training and professional improvement.
• Respected, competent, ethical and an active member of the profession.
11
www.ehpartners.com.au
Final Words
“Try to evolve to become better as improvements are discovered and don’t let your wind farm
project cage you in.”
12

Low-Wind
Turbine Technology
Steve Crowe Head of Sales Australian, N.Z., Indonesia
Wind Industry Forum 2016

Introduction
Who is Gamesa?
Low wind site analysis
5 Challenges for low wind success
I. Maintain low power density
II. Cost efficient low-wind rotors
III. Cost efficient tall towers
IV. Cost efficient manufacturing platforms
V. Efficient BOP and Logistics
What to remember

1994 commenced making turbines
Home base in Pamplona, Spain
Total installed worldwide 35 GW
Turbines under O & M 21 GW
Projects developed 7.5 GW
Development pipeline 12.5 GW
Installed turbines in 53 countries
Top 5 in worldwide sales in 2015
Top 5 total installed in world
Commenced G80 2MW in 2002
Over 22 GW of 2MW platform installed
G114 rated best turbine 2015 (2-3MW class: Wind Power Monthly)

Low wind sites expected to be close to 50% worldwide from 2016 to 2020
The shift into auction schemes will make tougher for these sites to compete Vs. other renewable technologies
New technological approach needed to reduce this site’s Cost of Energy

Hub height relevant in high shear sites
Clear trend towards low power density
Best energy gain from rotor diameter
MW relevant in high speed sites
Rotor Dia. Swept Area Area Increase
90m 6,362m2
110m 7,854m2 49%
130m 13,273m2 109%
0
5000
10000
15000
20000
25000
30 40 50 60 70 80 90 100 110 120 130 140 150 160

Increasing power while maintaining power density should lead to an increase cost of energy, but…
New technology developments and control strategies are leading to loads control shifting this trend
Rotor Dia. Output Power Density
90m 2MW 314 W/m2
114m 2MW 196 W/m2
126m 2.5MW 200 W/m2
132m 3.3MW 241 W/m2

106m
114m
126m
At 8m/s around 500kW, or 40%, extra power is produced from 10m more blade length
Rotor dia. (m)
Power density (W/m2)
Rotor size
decrease
Power density
decrease
126 200 0% 0%
114 245 -10% -22%
106 283 -16% -41%

114m 80m
97m
-120%
-100%
-80%
-60%
-40%
-20%
0%
11
4
11
1
10
8
10
5
10
2
99
96
93
90
87
84
81
Rotor size
Power Density
Rotor dia. (m)
Power density (W/m2)
Rotor size
decrease
Power density
decrease
114 196 0% 0%
97 271 -15% -38%
80 398 -30% -103%

Infusion technology: fiberglass reinforced with epoxy resin
Low noise airfoils and adjusted gearbox ratio to get reduced sound emission level
High absolute thickness at root sections to achieve the minimum mass/cost blade
Mid-sections chord alleviation to reduce maximum loads
Maximum airfoil glide ratio at mid/outer sections
Shear Webs Caps


Over 120 m site-to-site solutions
Standard steel towers
Sectional Tubular Steel
Hybrid #1: Pre-cast concrete + steel
Hybrid #2: Pedestal + steel
Hybrid #3: Cast-in-place concrete + steel
Up to 120 m: Tubular steel towers are usually cost efficient worldwide… currently

High commonalities between Class II, Class III & Class IV:
Common main components
Optimized load path adapted to each site
Blade
Pitch system
Main shaft
Gearbox
Yawing system
Tower
Foundation

New foundation concepts optimized site by site for low wind
New efficient on-site pedestals optimizing production in low wind sites
New logistics for long blades to reduce roads and platforms
Innovative crane solutions
Continuous improvement through experience


Low power density is required to maximise cost effective energy production from low wind sites
Optimisation of all components, including BOP, is necessary to ensure the cost of energy is low
Seek planning permits with no rotor restrictions to allow for maximum benefit from overall tip height

16
Muchas gracias

Wind turbine sound power testing
Wind Industry Forum, 17 March 2016
Tom Evans Associate Director
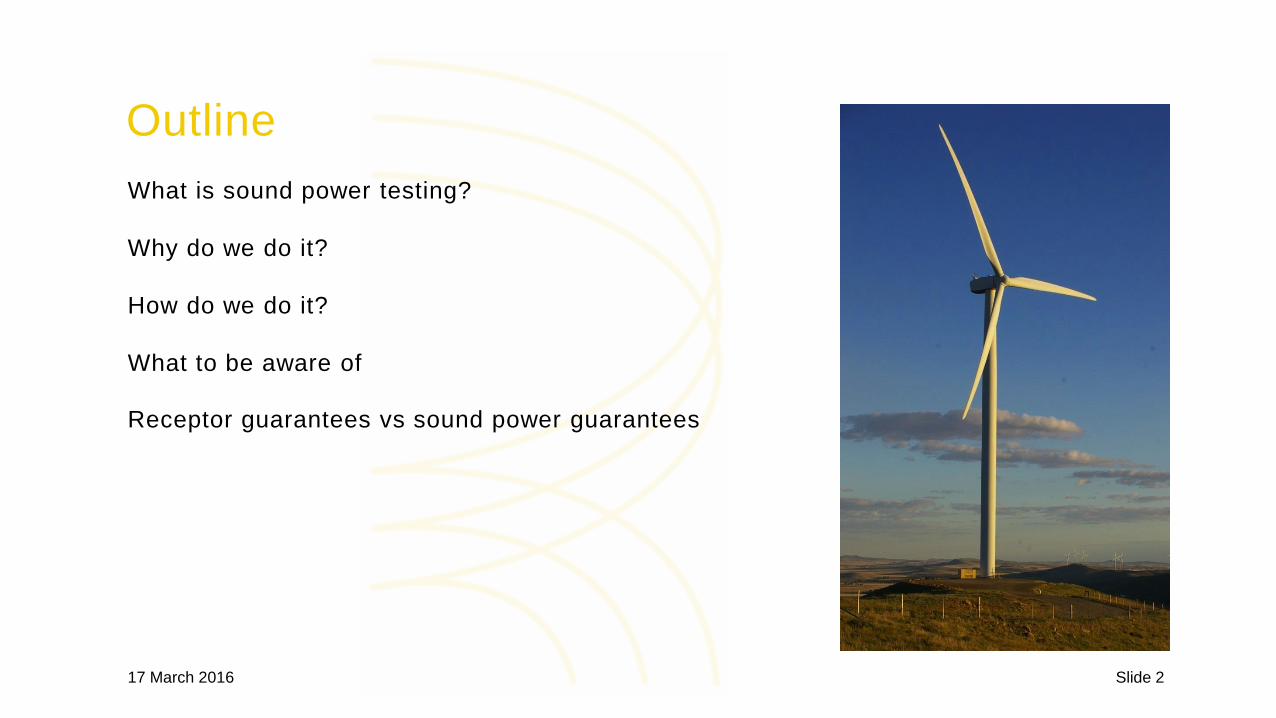
Outline
What is sound power testing?
Why do we do it?
How do we do it?
What to be aware of
Receptor guarantees vs sound power guarantees
17 March 2016 Slide 2

Sound power testing
• Measurements to determine the sound power level
of an individual turbine
• Sound power level is distance/site independent
measure of sound output of a turbine
• Measure downwind at approx. 130 m from turbine
across suitable range of wind speeds
• Analyse measured levels (controlling for known
factors) to determine sound power level
• May also include tonality, amplitude modulation and
impulsivity tests
17 March 2016 Slide 3

Sound power vs sound pressure
• Sound power level is a measure of the sound emitted by a source that is
independent of distance. Units: dB re 10 -12 W.
• Sound pressure level is the actual sound level at a particular distance/position
from a source. Units: dB re 20 𝜇Pa.
• Sound pressure level is dependent on sound power (and other factors).
• From a sound power level for turbines at a site, the sound pressure level can be
predicted considering other relevant factors such as site layout, distance and
topography.
• Therefore, sound power can be determined from sound pressure measurements
near to the source if we can control other factors – sound power testing.
17 March 2016 Slide 4

Why do sound power testing?
• Provides a non site dependent (and therefore transferable) measure of the noise
produced by a particular turbine model.
• Assess compliance with contractual guarantees provided by OEM.
• Assessing site compliance based on sound power – not currently done in Australia
but is in parts of Europe.
• Investigate Special Audible Characteristics – normally tonality.
17 March 2016 Slide 5

How do we do it?
• Relevant standard is IEC 61400-11 Wind turbines – Acoustic noise measurement
techniques. Current version is Edition 3 (2012) although many Australian
contracts will still refer to Edition 2.1 (2006).
• Measure downwind of turbine at hub height + ½ diameter using a microphone laid
flat on an acoustically reflective board:
• The ground board is used to provide a consistent reflection from the ground
between sites.
17 March 2016 Slide 6

What does the Standard require?
• Wind speeds of 0.8-1.3x the speed at 85% rated power (2012).
• Measurements in 10-second intervals with at least 10 data points
required for each half-integer wind speed.
• Noise with turbine ON to be at least 3 dB higher than with it OFF
across frequency range – normally have to switch off nearest
turbine.
• Same amount of data points required with turbine OFF as with
turbine ON.
• Downwind ±15º only. Optional crosswind and upwind positions
provided but rarely used.
• Allowable measurement angle to turbine hub of 25 to 40º.
17 March 2016 Slide 7
UPWIND
DOWNWIND

What does the Standard require?
Measured sound pressure levels are binned for each half -integer wind speed with the
turbine ON and turbine OFF.
The turbine ON measurements (corrected for turbine OFF) are used to calculate
sound power levels for the wind turbine at each half -integer speed considering:
• the measured sound pressure levels
• the measurement distance and angle
• frequency content of the sound.
Uncertainty for the sound power level reported at each wind speed to address
variation in noise levels and possible equipment/measurement errors.
The tonal audibility of potential tones is determined at each half -integer wind speed
and reported if audibility exceeds -3.0 dB.
17 March 2016 Slide 8

What changed in IEC 61400-2012 version?
In terms of end result not a lot actually changed between 2006 and 2012…
Which is good – you should still get the same sound power level at the end of the day.
17 March 2016 Slide 9
Item IEC 61400-11:2006 IEC 61400-11:2012 Comment
Wind speed
height Standardised 10 m Hub height
No significant difference as 2006 used standardised 10
m related to hub height by a fixed amount.
Wind speed bins Results reported for
integer wind speeds
Results reported for
half-integer speeds
Provides additional information but overall sound power
unlikely to change significantly with half-integer steps.
Measurement
period Minimum 1-minute 10-second
More data points required in 2012 but lower overall
measurement duration required.
Determining
average
Polynomial trendline
fitted across speeds
preferred
Binned at each half-
integer speed
2012 provides a better result. Bin method was already
employed in many cases as a deviation to 2006.
Tonality Two periods nearest to
each integer speed
Average over all data
in each bin
Likely to get a more representative result with 2012 but
still limited to same wind conditions

What to be aware of with IEC 61400-11
Wind conditions
Testing can be labour-intensive, so selecting appropriate wind conditions to eliminate
return visits is important. Desire winds from a steady direction over a wide range of
speeds.
Background data
Data with the turbine OFF is almost more important than that with it ON. Need good
background data for all speeds to produce accurate results.
Secondary windshields
Standard allows for optional secondary windshields. Unlikely to be necessary for the A-
weighted sound power level but could provide more accuracy of lower frequency sound
power levels.
17 March 2016 Slide 10

What to be aware of with IEC 61400-11
Variability
IEC sound power tests are typically highly repeatable. Sound power levels over repeated
tests are unlikely to differ by more than 1 dB at any wind speed.
However, some factors can influence the calculated sound power level:
• Measurement distance – distance correction methodology in Standard is not perfect
• Measurement angle – very important that the angle of incidence is above 25º
• Groundboard – poor contact between the groundboard and ground increases measured
noise levels
• Tonality – while downwind is worst case for overall sound, this is unlikely to be the case
for tonality
17 March 2016 Slide 11

Receptor vs sound power guarantees
Until recently, OEMs were required to provide sound power guarantees for their turbines
which applied at the turbine only.
Nowadays, almost all contracts include a request for a receptor guarantee where the OEM
guarantees compliance with State/National guidelines at receptors.
With respect to sound power testing:
• Receptor guarantees mean that there is unlikely to be a requirement for it on Australian
sites in the future.
• Even if this is the case, however, an understanding of the process is still important to
enable interpretation of data provided for turbines during the planning stage of a site.
17 March 2016 Slide 12

Receptor vs sound power guarantees
A brief survey of OEMs raised the following concerns about receptor guarantees:
• While OEMs can control turbine sound power, they typically have little or no control over
other factors that influence compliance at receptors (e.g. distance, layout, wind
conditions, landowner agreements etc). Therefore increased risk for the OEMs.
• May have a price premium, and potentially capacity reduction, as a result of the above.
• Where a receptor guarantee is provided, it is unlikely that any guarantee would be
provided regarding sound power.
• Australia is almost unique in requiring receptor guarantees, although requests have
started to arise in the UK.
And finally an interesting comment:
• A sound power test at a turbine provides a very clear pass or fail.
• However it can be very difficult to establish compliance or non-compliance clearly at a
receptor due to the influence of background noise.
• Even if non-compliance is established, it may not be a result of turbines being louder
than stated.
17 March 2016 Slide 13

Conclusion
• Sound power testing is important to assess the sound
output independent of other factors that influence noise at
receptors.
• Accurate sound power data is critical for accurate noise
modelling of a site.
• The IEC 61400-11 Standard is applied globally for this
purpose and provides repeatable test results for turbines.
• However, there are items to be aware of that can introduce
variability to the results.
• With the emergence of receptor guarantees, does sound
power testing have a future in Australia?
17 March 2016 Slide 14
