wind power intermittency - powerworld.com · 2 june 14-15, 2006 2006 power world client conference:...
TRANSCRIPT
1
Scott R. Dahman, [email protected]://www.powerworld.com
2001 South First StreetChampaign, Illinois 61820+1 (217) 384.6330
Wind Power Intermittency
2006 PowerWorld Client ConferenceJune 14-15
Chattanooga, Tennessee
2006 Power World Client Conference: Wind Power Intermittency 2June 14-15, 2006
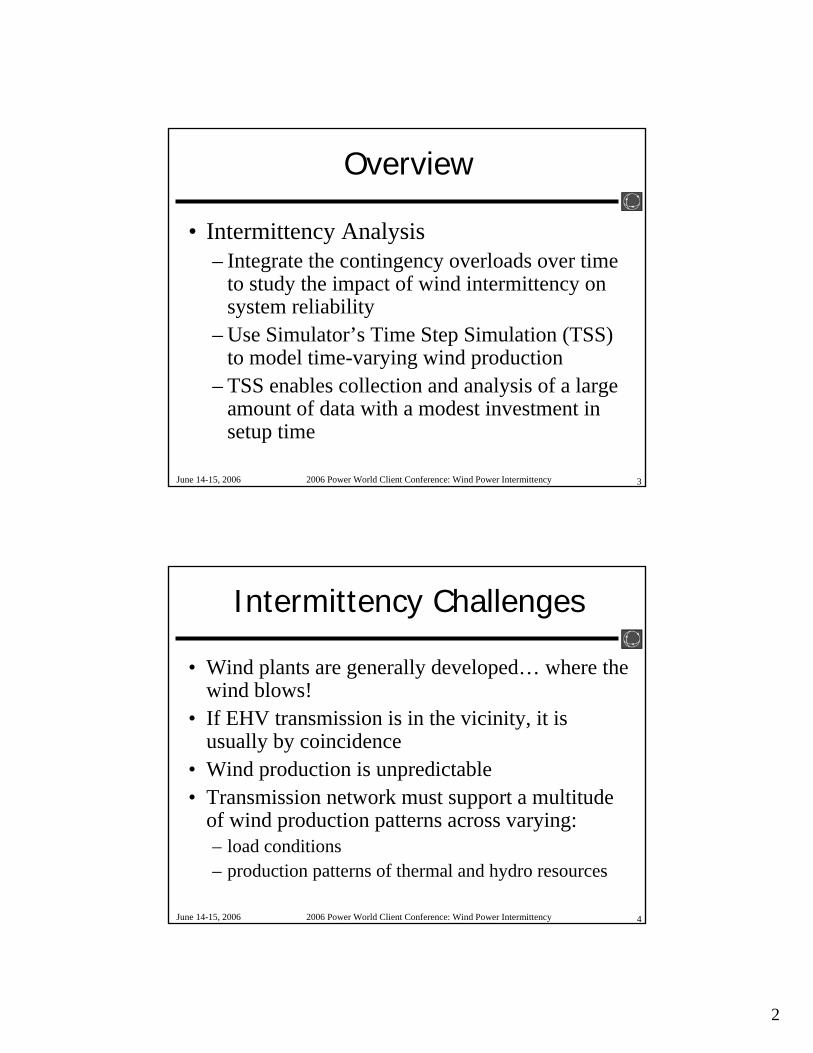
Overview
• Extension of work with Davis Power Consultants and the California Energy Commission
• Prior Analysis– Examine magnitude and frequency of
contingency overloads as a simple measure of system reliability
– Compare base cases to those with different penetrations of distributed renewable resources
2
2006 Power World Client Conference: Wind Power Intermittency 3June 14-15, 2006
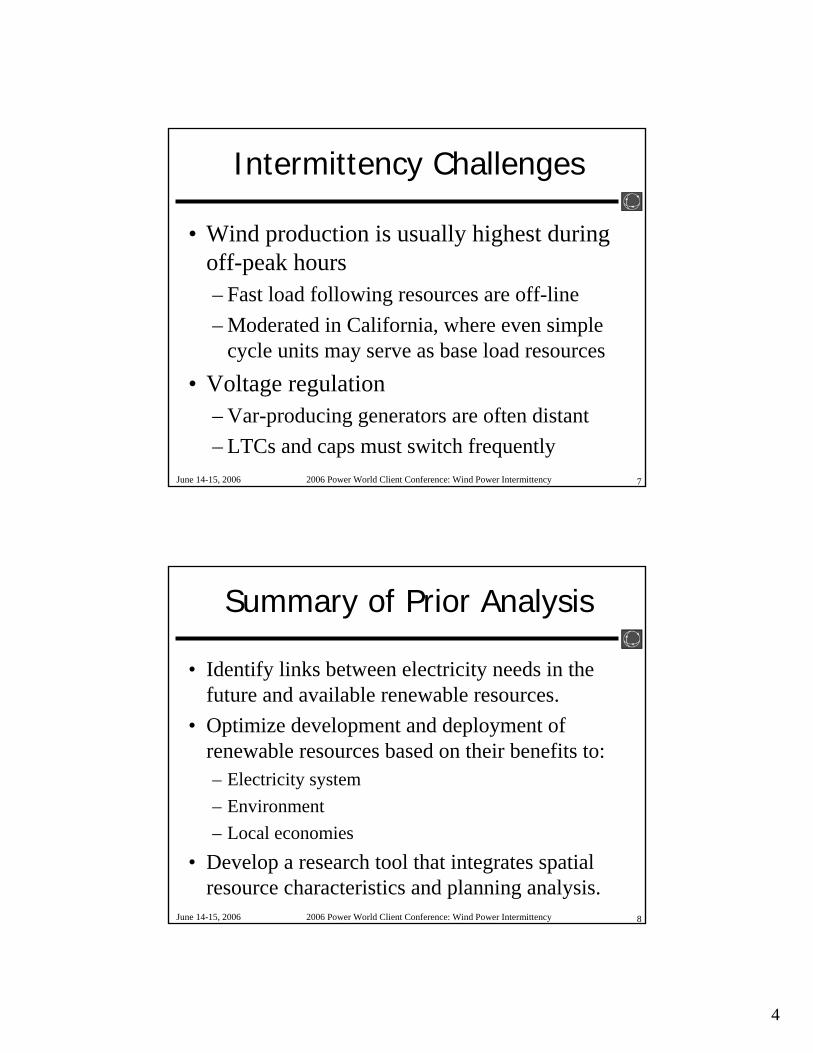
Overview
• Intermittency Analysis– Integrate the contingency overloads over time
to study the impact of wind intermittency on system reliability
– Use Simulator’s Time Step Simulation (TSS) to model time-varying wind production
– TSS enables collection and analysis of a large amount of data with a modest investment in setup time
2006 Power World Client Conference: Wind Power Intermittency 4June 14-15, 2006
Intermittency Challenges
• Wind plants are generally developed… where the wind blows!
• If EHV transmission is in the vicinity, it is usually by coincidence
• Wind production is unpredictable• Transmission network must support a multitude
of wind production patterns across varying:– load conditions – production patterns of thermal and hydro resources

3
2006 Power World Client Conference: Wind Power Intermittency 5June 14-15, 2006
Wind Turbine String
2006 Power World Client Conference: Wind Power Intermittency 6June 14-15, 2006
Typical Wind “Transmission”
4
2006 Power World Client Conference: Wind Power Intermittency 7June 14-15, 2006
Intermittency Challenges
• Wind production is usually highest during off-peak hours– Fast load following resources are off-line– Moderated in California, where even simple
cycle units may serve as base load resources• Voltage regulation
– Var-producing generators are often distant– LTCs and caps must switch frequently
2006 Power World Client Conference: Wind Power Intermittency 8June 14-15, 2006
Summary of Prior Analysis
• Identify links between electricity needs in the future and available renewable resources.
• Optimize development and deployment of renewable resources based on their benefits to:– Electricity system– Environment– Local economies
• Develop a research tool that integrates spatial resource characteristics and planning analysis.

5
2006 Power World Client Conference: Wind Power Intermittency 9June 14-15, 2006
Objectives
• Investigate the extent to which renewable distributed electricity generation can help address transmission constraints
• Determine performance characteristics for generation, transmission and renewable technology
• Identify locations within system where sufficient renewable generation can effectively address transmission problems
2006 Power World Client Conference: Wind Power Intermittency 10June 14-15, 2006
Objectives
• Determine the impact of large-scale distributed projects on grid security.
• We need to:– Identify weak transmission elements and
define metrics that assess system security.– Find locations where new generation would
enhance the security of the grid.– Combine maps of beneficial locations with
maps of energy resources.

6
2006 Power World Client Conference: Wind Power Intermittency 11June 14-15, 2006
Normal Operation Example
100 MW
50 MW
280 MW 187 MW
110 MW 40 Mvar
80 MW 30 Mvar
130 MW 40 Mvar
40 MW 20 Mvar
1.0
1.01 pu
1.04 pu1.04 pu
1.04 pu
0.9930 pu1.05 pu
A
MVA
A
MVA
A
MVA
A
MVA
A
MVAA
MVA
A
MVA
A
MVA
67 MW
67 MW
33 MW 32 MW
57 MW 58 MW
21 MW
21 MW
66 MW 65 MW
11 MW
11 MW
23 MW
42 MW
43 MW 28 MW 29 MW
23 MW
23 MW
1
200 MW 0 Mvar
200 MW 0 Mvar
A
MVA
29 MW 28 MW
OneThree
Fo
Two
Five
Six Seven
23 MW
87%
A
MVA
82%
A
MVA
System does not have normal operation thermal violations
2006 Power World Client Conference: Wind Power Intermittency 12June 14-15, 2006
Contingency Example
100 MW
50 MW
280 MW 188 MW
110 MW 40 Mvar
80 MW 30 Mvar
130 MW 40 Mvar
40 MW 20 Mvar
1.00 pu
1.01 pu
1.04 pu1.04 pu
1.04 pu
0.9675 pu1.05 pu
A
MVA
A
MVA
A
MVA
A
MVAA
MVA
A
MVA 45 MW
45 MW
55 MW 53 MW
0 MW 0 MW
58 MW
56 MW
52 MW 51 MW
26 MW
25 MW
43 MW
36 MW
37 MW 24 MW 25 MW
30 MW
30 MW
150 MW
200 MW 0 Mvar
200 MW 0 Mvar
A
MVA
25 MW 24 MW
OneThree
Four
Two
Five
Six Seven
44 MW
83%A
MV A
83%A
MV A
95%A
MV A
156%A
MVA
Suppose there is a fault and this line is disconnected
Planning Solutions:New line to bus 3
OR New generation
at bus 3
Then this line getsoverloaded
(is a weak element)This is a serious problem for the
system

7
2006 Power World Client Conference: Wind Power Intermittency 13June 14-15, 2006
Contingency Analysis
• Security is determined by the ability of the system to withstand equipment failure.
• Define weak elements as those that become overloaded during contingency conditions (congestion).
• Perform N-1 contingency analysis simulation.• Apply ranking to help prioritize transmission
planning: Aggregate MW Contingency Overload (AMWCO)
2006 Power World Client Conference: Wind Power Intermittency 14June 14-15, 2006
Results Organized by Lines, then Contingencies
Sum each value-100 to find the Aggregate Percentage ContingencyOverload (APCO)
Then multiplyby limit to getthe Aggregate MW ContingencyOverload (AMWCO)

8
2006 Power World Client Conference: Wind Power Intermittency 15June 14-15, 2006
100 M W
50 M W
280 M W 187 M W
110 M W 40 M v ar
80 M W 30 M v ar
130 M W 40 M v ar
40 M W 20 M v ar
1 .00 p u
1.01 pu
1.04 pu1.04 pu
1.04 pu
0.9930 p u1 .05 pu
A
MV A
A
MVA
A
MVA
A
MV A
A
MV AA
MV A
A
MVA
A
MV A
67 M W
67 M W
33 M W 32 M W
57 M W 58 M W
21 M W
21 M W
66 M W 65 M W
11 M W
11 M W
23 M W
42 M W
43 M W 28 M W 29 M W
23 M W
23 M W
150 M W
200 M W 0 M v ar
200 M W 0 M v ar
A
MVA
29 M W 28 M W
O neTh re e
Fo ur
Tw o
Fiv e
S ix Se v e n
23 M W
8 7 %A
M V A
8 2 %A
M V A
28211470
AMWCO
Weak Element Visualization
2006 Power World Client Conference: Wind Power Intermittency 16June 14-15, 2006
Weak Element Visualization

9
2006 Power World Client Conference: Wind Power Intermittency 17June 14-15, 2006
Intermittency Analysis:Time-Step Simulation
• 2100 MW wind capacity across five regions• Historic hourly wind production capacity factors are
known for each region • Apply known capacity factors to existing and planned
capacity to create simulation inputs• Match production patterns to characteristic power flow
cases– Apply summer peak pattern to summer peak case, winter peak
pattern to winter peak case, etc.– Hold load constant within each case
• Follow the wind production with natural gas resources
2006 Power World Client Conference: Wind Power Intermittency 18June 14-15, 2006
Intermittency Analysis:Time-Step Simulation
• Run contingency analysis at each step• Store results for each line and transformer at each
hourly time step– AMWCO for contingencies– % of limit used for each base case (non-contingent
operation)• Extend AMWCO metric over time: Aggregate
MWh Contingency Overload• Examine variability of results• Identify potentially vulnerable transmission paths
10
2006 Power World Client Conference: Wind Power Intermittency 19June 14-15, 2006
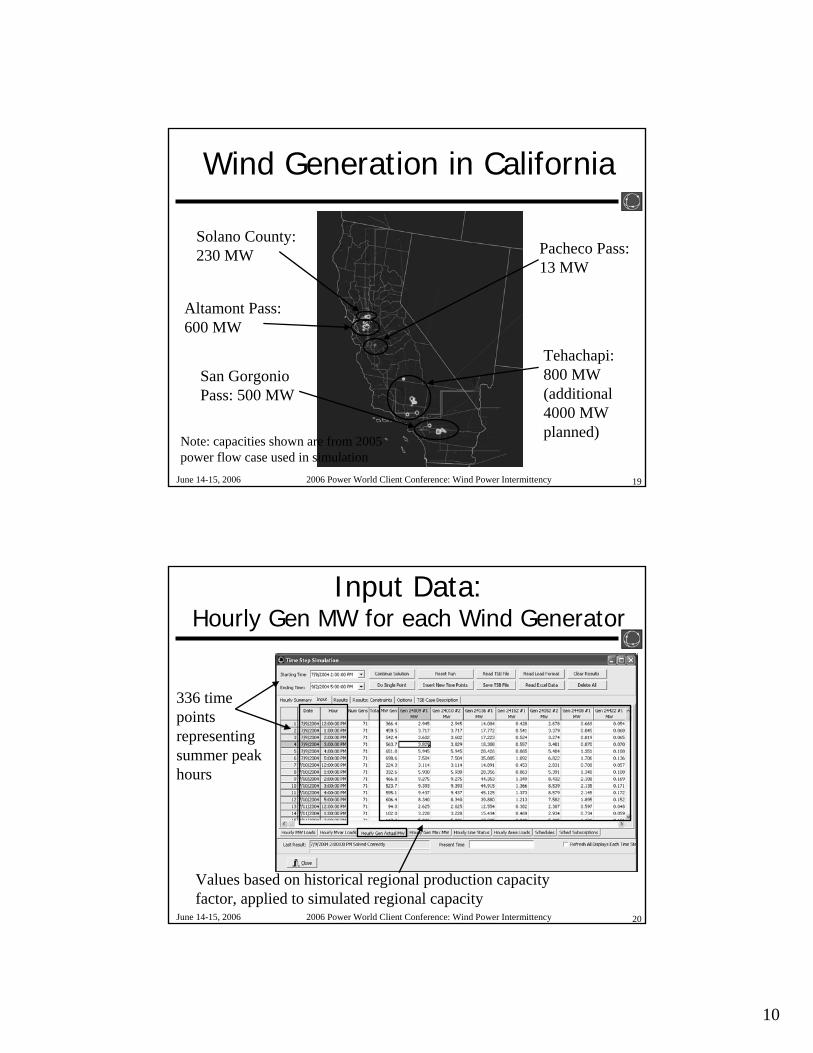
Wind Generation in California
San GorgonioPass: 500 MW
Altamont Pass: 600 MW
Solano County: 230 MW Pacheco Pass:
13 MW
Tehachapi: 800 MW (additional 4000 MW planned)Note: capacities shown are from 2005
power flow case used in simulation
2006 Power World Client Conference: Wind Power Intermittency 20June 14-15, 2006
Input Data:Hourly Gen MW for each Wind Generator
336 time points representing summer peak hours
Values based on historical regional production capacity factor, applied to simulated regional capacity
11
2006 Power World Client Conference: Wind Power Intermittency 21June 14-15, 2006
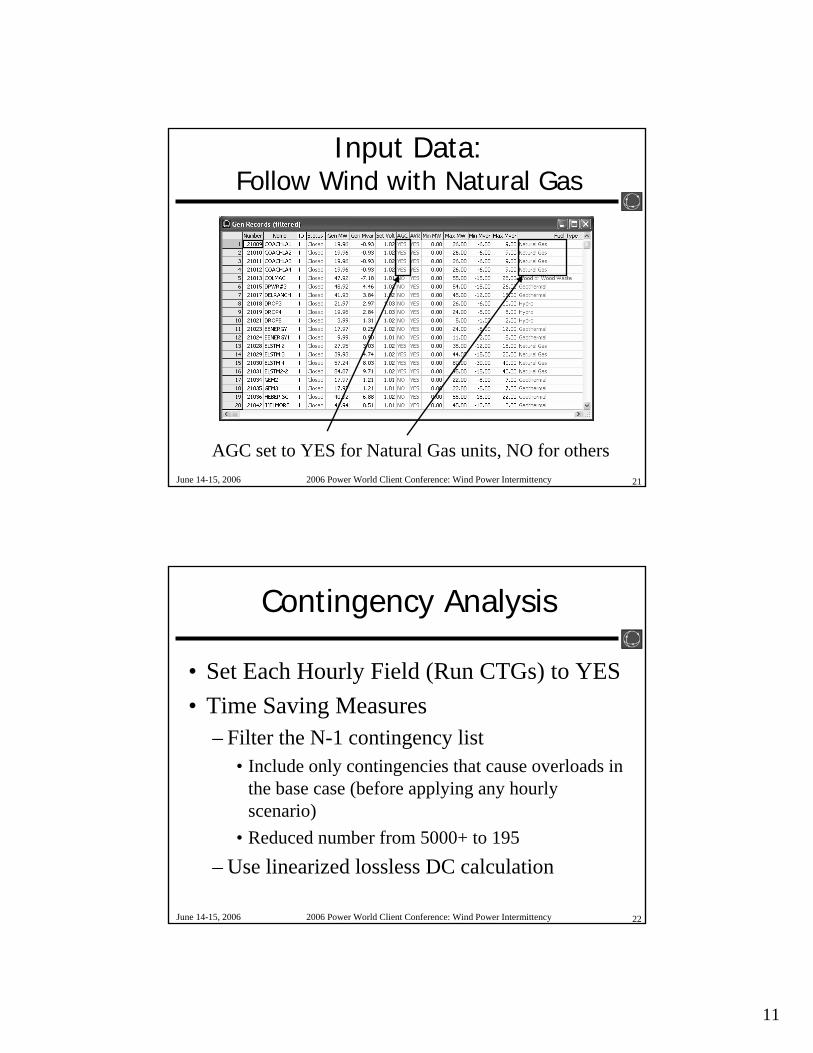
Input Data:Follow Wind with Natural Gas
AGC set to YES for Natural Gas units, NO for others
2006 Power World Client Conference: Wind Power Intermittency 22June 14-15, 2006
Contingency Analysis
• Set Each Hourly Field (Run CTGs) to YES• Time Saving Measures
– Filter the N-1 contingency list • Include only contingencies that cause overloads in
the base case (before applying any hourly scenario)
• Reduced number from 5000+ to 195– Use linearized lossless DC calculation
12
2006 Power World Client Conference: Wind Power Intermittency 23June 14-15, 2006
Results Grid
Contingency analysis shown in process
2006 Power World Client Conference: Wind Power Intermittency 24June 14-15, 2006
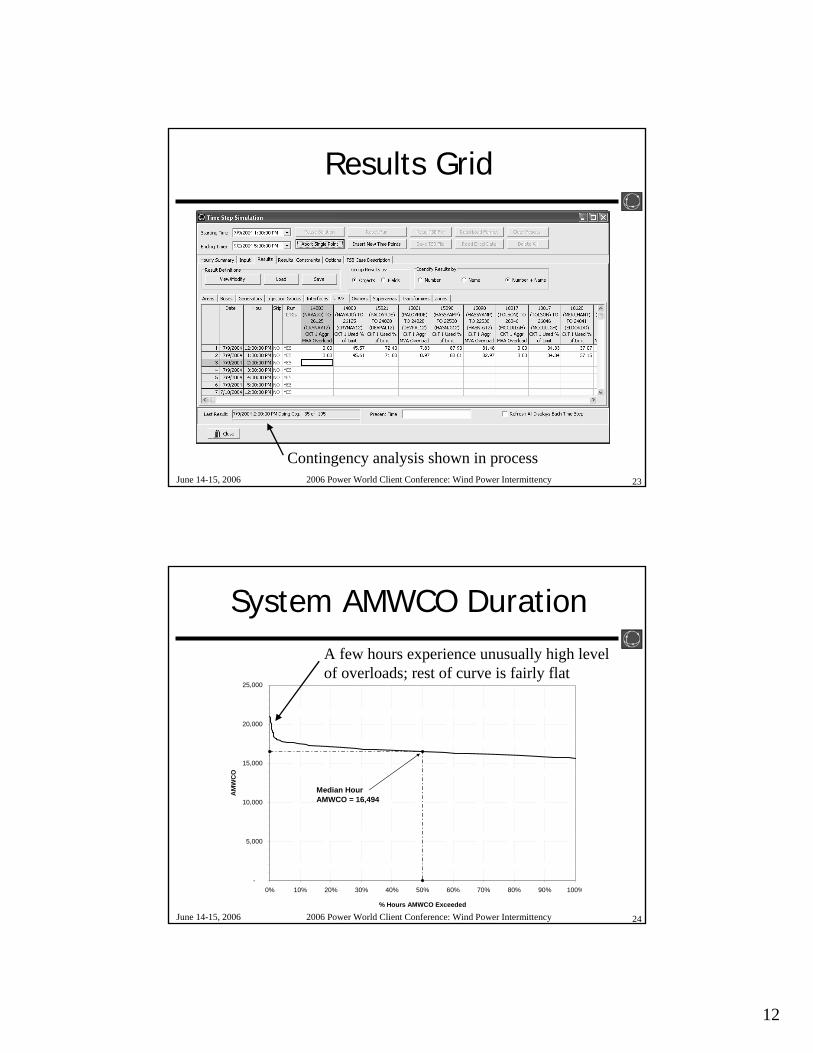
System AMWCO Duration
-
5,000
10,000
15,000
20,000
25,000
0% 10% 20% 30% 40% 50% 60% 70% 80% 90% 100%
% Hours AMWCO Exceeded
AM
WC
O
Median Hour AMWCO = 16,494
A few hours experience unusually high level of overloads; rest of curve is fairly flat

13
2006 Power World Client Conference: Wind Power Intermittency 25June 14-15, 2006
Hourly Line Loadings
Line Timepoint Custom Results Variables
24402 (ANTELOPE) TO 24466 (TAP 81) CKT 1 Used % of Limit 25642 (TAP819) TO 25625 (TAP809) CKT 1 Used % of Limit35202 (USWP-WKR) TO 33776 (SOUTH BY) CKT 2 Used % of Limit
DateTime8/28/20048/21/20048/14/20048/7/20047/31/20047/24/20047/17/20047/10/2004
Valu
es
110
105
100
95
90
85
80
75
70
65
60
55
50
45
40
35
30
25
20
15
10
These three lines show very different loading patterns:• Red: high average
loading, low variability
• Green: low avg loading, high variability
• Blue: low avg loading, low variability overall, but heavily impacted during certain conditions
2006 Power World Client Conference: Wind Power Intermittency 26June 14-15, 2006
Line Loading Duration Curve
Transmission Line Loading Duration
10%
20%
30%
40%
50%
60%
70%
80%
90%
100%
110%
0% 10% 20% 30% 40% 50% 60% 70% 80% 90% 100%
% Hours Loading Equals or Exceeds L%
Line
Loa
ding
L (%
of M
VA L
imit)
24402 (ANTELOPE) TO 24466 (TAP 81) CKT 1
25642 (TAP819) TO 25625 (TAP809) CKT 1
35202 (USWP-WKR) TO 33776 (SOUTH BY) CKT 2
Shown are the same three lines from prior slide

14
2006 Power World Client Conference: Wind Power Intermittency 27June 14-15, 2006
Aggregate MWh Contingency Overload (AMWhCO)
Red indicates lines most severely overloaded over time
2006 Power World Client Conference: Wind Power Intermittency 28June 14-15, 2006
Overload Variability
• Shows AMWhCO relative to a reference (median hour)
• Many overloaded lines experience consistent levels at nearly every hour – wind intermittency is not a big factor
• Red indicates lines most adversely affected by intermittency
• Green indicates lines favorably affected by intermittency

15
2006 Power World Client Conference: Wind Power Intermittency 29June 14-15, 2006
Time-Step Simulation
• TIP: It is helpful to use an external database for managing TSS inputs and results– Perform calculations to determine inputs– Paste inputs into TSS grid– Query and filter based on statistical criteria– Create time-integrated graphs– Paste time-integrated results into Simulator’s
custom float fields for contouring
2006 Power World Client Conference: Wind Power Intermittency 30June 14-15, 2006
Database:Manage Inputs and Results
Query can be transferred to Excel, then pasted directly into Simulator TSS grid
16
2006 Power World Client Conference: Wind Power Intermittency 31June 14-15, 2006
Conclusions
• As integration of wind power on the grid increases, intermittency issues will become more significant
• Simulator’s TSS offers a robust and efficient environment for studying time-scale phenomenon such as wind intermittency– Easy to set up, especially for a modest number of
input variables– Many results can be stored and accessed within the
Simulator TSB file without having to catalog multiple power flow cases
2006 Power World Client Conference: Wind Power Intermittency 32June 14-15, 2006
Conclusions
• An external database may be very helpful for preparing inputs, screening results, and integrating results over time
• Some plots are available in Simulator for viewing inputs and results
• Complex plots may be readily produced from a good external database