wind turbine feasibility study - debenham energy study_r1.pdf · installing a public information...
TRANSCRIPT

WWiinndd TTuurrbbiinnee FFeeaassiibbiilliittyy SSttuuddyy Prepared For:
The Cities of Fairfield and Vacaville North Bay Regional
Water Treatment Plant
April 16, 2007
Prepared By:
Scott Debenham
President Debenham Energy, LLC
11317 Valle Vista Road
Lakeside, CA 92040
Phone: (619) 334-9541 | Fax: (801) 665-5768
[email protected] | www.debenhamenergy.com

Cit ies of Fair f ield and Vacavi l le NBR Wind Turbine Feasibi l i ty Study
Debenham Energy, LLC 2
CONFIDENTIAL INFORMATION SUBJECT TO A NONDISCLOSURE AGREEMENT
Notice This Feasibility Study and its contents are subject to an agreement dated January 22, 2007 restricting disclosure to any person or entity other than Debenham Energy, LLC; MWH Americas; NBR; and their respective agents and authorized representatives.
Debenham Energy, LLC
World Wide Web: WEB SITE: www.debenhamenergy.com
EMAIL: [email protected]
Location:
11317 Valle Vista Road Lakeside, CA 92040
PHONE: (619) 334-9541

Cit ies of Fair f ield and Vacavi l le NBR Wind Turbine Feasibi l i ty Study
Debenham Energy, LLC 3
CONFIDENTIAL INFORMATION SUBJECT TO A NONDISCLOSURE AGREEMENT
Contents
Executive Summary .....................................................................................................................4
Feasibility Study ........................................................................................................................10
1. Site Evaluation................................................................................................................ 10 2. Electrical Interconnection ............................................................................................. 16 3. Facility Consumption and Energy Cost Analysis ..................................................... 19 4. Wind Resource Estimate ............................................................................................... 26 5. Annual Energy Production and Utility Cost Savings............................................... 31 6. Permitting Requirements and Special Applications................................................. 34 7. Turbine Model Recommendations .............................................................................. 37 8. Comprehensive Economic Model................................................................................ 41 9. Beneficial Public Relations............................................................................................ 55 10. Recommendations and Next Steps.............................................................................. 58
List of Attachments....................................................................................................................60

Cit ies of Fair f ield and Vacavi l le NBR Wind Turbine Feasibi l i ty Study
Debenham Energy, LLC 4
CONFIDENTIAL INFORMATION SUBJECT TO A NONDISCLOSURE AGREEMENT
Executive Summary Modern wind turbine generators that are traditionally used in wind farms are now finding increased use in on-site power generation at facilities like schools, factories, and municipal water treatment plants. Determining the suitability of one or more wind turbine generators at a given facility requires the evaluation of a number of criteria. The proposed site must be suitable for the construction of the foundation and tower, permits for the installation must be obtainable, and the impacts of the wind turbine on the facility and its neighbors must be minimized. Most importantly, the wind turbine installation must be economically viable and result in facility energy savings. If the machine is not economical, then there must be other compelling reasons to proceed with its installation. In this study, we examine the above criteria and present our findings.
The North Bay Regional Water Treatment Plant has a superb wind resource, a substantial electrical load, and high energy costs. These are the key ingredients for a successful wind turbine project. A one-megawatt wind turbine will provide about 10% of the facility’s electrical energy needs based on the site’s estimated energy usage. A 2.5 MW wind turbine will provide about 35% of the estimated annual energy usage.
Wind turbines in this class are erected on towers over 200 feet tall and will stand over 300 feet to the tip of the blade. The specific location will be determined based on consultations but should consider the following:
Offsets from residential areas
Ease of electrical interconnection
Access for installation, maintenance and repairs
Avoiding land that might be used for future expansion
The optimal size and quantity of turbines for NBR depends on FAA height restrictions, City/County allowable heights and turbine availability. The project economics are contingent on the price displaced electricity at the time the turbine commences operation and how energy prices will vary over the year design-life of the wind turbine. Additionally, the savings depend on the Net Metering tariff treatment for turbine(s) above 1 MW combined nameplate capacity (per utility meter). The current size limit of 1 MW was based on solar (PV) technology and does not account for the recent trend towards larger turbines. Overall, the economics strongly favor large wind turbines.
NBR appears to have sufficient space for turbines to provide close to 100% of the annual energy (kWh) needs of the facility. Assuming a 40% Capacity Factor then 5 MW of wind turbines would provide about 2 MW on average over the year. The NBR load is close to 2 MW on average. The Capacity Factor will likely be 20-35% depending on turbine size and design.

Cit ies of Fair f ield and Vacavi l le NBR Wind Turbine Feasibi l i ty Study
Debenham Energy, LLC 5
CONFIDENTIAL INFORMATION SUBJECT TO A NONDISCLOSURE AGREEMENT
The table below demonstrates the physical equipment sizes for 5 different turbines. To demonstrate the range of tower heights two tower heights for three turbines are shown. The economics of these 3 turbines were analyzed in this study. Calculations for additional annual production and energy cost savings for the larger towers are included in Section X.
The table below summarizes the economics of 5 wind turbines based on purchase of the equipment and installation of the turbine by NBR.
1. Energy costs estimate based on PG&E E20 Primary Firm rate tariff. For turbines over 1 MW of nameplate capacity (Net Metering limit) the energy rate has been reduced by 1 cent per kWh to account for Departing Load charge.
2. The preliminary wind resource estimate is based on two sources. One is the California Energy Commission (CEC) predicted wind data certified by the National Renewable Energy Laboratory (NREL). This source estimates an average wind speed of 6.32 meters/second. Rich Simon, a Professional Meteorologist with 25 years of experience in California estimates 6.5 – 7.0 meters/second. An average wind speed of 6.5 meter/second (50 meter hub height) has been used at this stage of the analysis.
3. Annual energy production based on manufacturers turbine power curves reduced by 1% for density (30 meters) and 8% for electrical (I2R) and blade turbulence losses. Refer to Section 5 for details.
4. Installed costs based on manufacturers’ price quotes where available otherwise industry accepted rules of thumb. Installation, Balance of Plant (BOP), project management and contingency estimates are discussed in Section 8.
This report analyses the feasibility of installing 3 different single turbines ranging in size from 600 kW to 2,500 kW. These turbine combinations cover between about 10% and 35%of the estimated annual energy requirements at the facility. The actual values will depend on the tower heights and rotor diameters that will be determined based on site measured wind data and manufacturers recommendations. The turbine will offset the electricity provided by Pacific Gas & Electric (PG&E). Using wind data collected at the site and from nearby long-term sources, we can estimate how much electricity can be generated.

Cit ies of Fair f ield and Vacavi l le NBR Wind Turbine Feasibi l i ty Study
Debenham Energy, LLC 6
CONFIDENTIAL INFORMATION SUBJECT TO A NONDISCLOSURE AGREEMENT
This project benefits tremendously from the following California programs that encourage distributed generation with renewable resources:
Net Energy Metering (NEM). Provides credit at the full retail rate for any exported wind generated electricity.
Self Generation Incentive Program (SGIP). Provides for a cash payment of $1,500 per kW up to a total of $1,500,000.
Turbine Location and Wind Resource Estimate
In our financial analysis we have focused on the scenario where Fairfield and Vacaville purchase, own and operate the wind turbine equipment.

Cit ies of Fair f ield and Vacavi l le NBR Wind Turbine Feasibi l i ty Study
Debenham Energy, LLC 7
CONFIDENTIAL INFORMATION SUBJECT TO A NONDISCLOSURE AGREEMENT
Annual Cash Flow – 3 Turbines
There are two other ownership options which will likely provide a better internal rate of return. See Section 8 Comprehensive Economic Model - Ownership Options for details.
The economics of this project are highly dependent on funding from the California Self Generation Incentive (SGIP) Program. As we evaluate this proposal and discuss the next steps, the key milestones are submitting the SGIP application, ordering the turbine(s) and submitting the SGIP Proof of Project Advancement (PPA) documentation.
Options for Promotion Renewable energy projects are excellent opportunities for public promotion and educational programs. You can consider options such as:
Installing a public information kiosk
Choosing a different turbine color scheme.
Hosting a real time website
Help is available from select organizations with a history of supporting projects like this. The 4-6 day turbine installation has the potential to attract a substantial crowd [see video link]. See Section 9 for additional information on promotion options.

Cit ies of Fair f ield and Vacavi l le NBR Wind Turbine Feasibi l i ty Study
Debenham Energy, LLC 8
CONFIDENTIAL INFORMATION SUBJECT TO A NONDISCLOSURE AGREEMENT
Simulated Site Aerial View
Results of Financial Analysis Analyzing, evaluating and choosing between competing options is a complex endeavor. It should be clear that Net Present Value is the preferred method for comparing competing alternatives. Factors such as the range of uncertainty of the assumptions (sensitivity analysis), the strength of the turbine manufacturer’s guarantee, their service capabilities and the financing alternatives are keys to making a good decision. Since a range of turbine sizes will be evaluated we have discovered that providing an intuitive interactive spreadsheet model is substantially more effective than providing numerous tables and graphs. A sample interactive spreadsheet model will be provided with the final report. This model will be updated based on on-site measured wind data and installed cost estimates based on specific turbine models. The table below summarizes the results of our financial analysis that we present in detail in Section 8.

Cit ies of Fair f ield and Vacavi l le NBR Wind Turbine Feasibi l i ty Study
Debenham Energy, LLC 9
CONFIDENTIAL INFORMATION SUBJECT TO A NONDISCLOSURE AGREEMENT
Economic Summary
Recommendations We recommend you commence discussions with Travis AFB and then install or lease a 50 meter wind measurement tower. In parallel with these efforts we recommend discussions with PG&E to confirm the economic assumptions and to understand the SGIP program current and anticipated future funding levels. NBR should take aerial photographs and superimpose different turbine sizes and locations.
1. Discussions with Travis AFB. Do not expect an immediate response.
2. Install a measurement tower. Wind data sources such as the Vacaville Airport and the Nut Tree Airport should be evaluated as long term sources for correlation.
3. Discussions with PG&E on tariff treatment (bill reduction) for different size turbines.
4. Aerial photographs to facilitate the required tradeoffs between economic and environmental benefits and potential aesthetic concerns of “neighborhood appropriate”.
5. Coordinate presentations by turbine suppliers to assess their product offerings and interest in small quantity orders.
The Next Steps are listed at the end of this report.
Cit ies of Fair f ield and Vacavi l le NBR Wind Turbine Feasibi l i ty Study
Debenham Energy, LLC 10
CONFIDENTIAL INFORMATION SUBJECT TO A NONDISCLOSURE AGREEMENT
Feasibility Study 1. Site Evaluation Evaluate the proposed site(s) concerning the general suitability for on-site wind energy generation with respect to the impacts of one or more wind turbine generators on the physical plant, daily operations, and the surrounding neighborhood. Determine the optimal turbine location given the wind regime, electrical interconnection and road access for turbine assembly.
When siting a wind turbine, we must consider a number of criteria to provide the most benefit to the facility and to minimize the potential negative impacts of a wind turbine on your neighbors.
The proposed wind turbine site should:
Provide the wind turbine with exposure to the best wind and the least turbulence
Maximize the positive visual impacts and minimize the negative on the facility and the surrounding area
Minimize noise impacts on the facility and the adjoining property owners
Not interfere with future facility expansion
Minimize interconnection and wire run costs
Provide proper setbacks from the highways and overhead utility lines
Provide a good spot for public viewing and public information on the WTG system
Provide adequate access for a crane and a suitable lay-down area for staging the tower, blades, and other WTG components for ease of construction and maintenance
The proposed wind turbine location will be selected based on NBR preferences, industry accepted siting criteria, and the wind turbine’s construction and interconnection requirements. Plant electrical drawings are included in Attachment A. Transportation and road limitations leading up to the site are also important considerations. The layout plan and the transportation dimensions of the wind turbine shown below do not require any special provisions.

Cit ies of Fair f ield and Vacavi l le NBR Wind Turbine Feasibi l i ty Study
Debenham Energy, LLC 11
CONFIDENTIAL INFORMATION SUBJECT TO A NONDISCLOSURE AGREEMENT
Diagram of proposed turbine location showing electrical runs and turbine rotor lay down site.
This site is best suited for locating the wind turbine for the following reasons:
Site Exposure to the Wind Resource and the Potential for Excessive Turbulence The facility is located on relatively flat ground. The proposed wind turbine site is well away from high buildings, trees and higher terrain that would reduce the exposure to the wind. The height of the turbine blades relative to the height of buildings and trees minimizes their impact on the wind speed and turbulence. Changing the location to another spot at the facility will not likely affect a prospective wind turbine’s performance.
Visual Impacts The proposed wind turbine site will be visible from Peabody Road and some residential neighborhoods. Since the site is industrial, opposition to the location by the community should be minimal but you must address it because community opposition can become a fatal flaw that can stop your project. Discussions with nearby property owners should be initiated as early as possible to discuss the pros and cons of different locations and the beneficial impact on their long-term water rates. We recommend creating realistic renderings of what the installed turbines will look like using digital models superimposed on aerial photographs.

Cit ies of Fair f ield and Vacavi l le NBR Wind Turbine Feasibi l i ty Study
Debenham Energy, LLC 12
CONFIDENTIAL INFORMATION SUBJECT TO A NONDISCLOSURE AGREEMENT
Simulated view of turbines
Noise Impacts Utility class wind turbines generate noise from the blades rotating in the air stream (a swishing noise) and from the drive train and generator (a light machinery noise). While this noise is quite evident to someone standing at the base of the wind turbine’s tower, it quickly diminishes in sound intensity as they walk away from the tower. Sound intensity in decibels decreases by 50% for every 100 meters (330 feet) away from its source. That means that for a reference sound intensity of 60 dB(A) at the base of the tower, 500 feet away the sound intensity is less than 40 decibels (a quiet speaking voice).
You can stand at the base of the tower and have a normal conversation without raising your voice. 35dB is a quiet bedroom, a library is about 40dB, and 45dB is a quiet office. A one megawatt wind turbine creates about 100 dB at the hub (center of the rotor) and 45 dB at 100m. For a 70 meter tower the sound level is about 45 dB at 70 meters from the rotor. The table below equates dB(A) levels to familiar sources.

Cit ies of Fair f ield and Vacavi l le NBR Wind Turbine Feasibi l i ty Study
Debenham Energy, LLC 13
CONFIDENTIAL INFORMATION SUBJECT TO A NONDISCLOSURE AGREEMENT
Comparison of Sound Pressure Level and Sound Pressure
The Danish Wind Industry Association website provides a good description of sound from modern large wind turbines. A succinct summary of this complex issue is:
“…at winds speeds around 4-7 m/s and up the noise from the wind in leaves, shrubs, trees, masts etc. will gradually mask (drown out) any potential sound from wind turbines.”
For a good summary of this issue, visit the Danish Wind Industry Association website at:
http://www.windpower.org/en/tour/env/sound.htm
Provide for Future Facility Expansion Wind turbines are large structures with massive foundations. They are expensive to relocate. When siting a wind turbine, we must give every consideration to the possibility of future facility expansion and the addition of more wind turbines on the site as the facility energy requirements grow. The proposed site does not interfere with plant expansion. The area used for assembly of the turbine should remain relatively clear to allow crane access if needed for repairs over the 20+ year design life of the wind turbine.
Interconnection and Wire Run Costs The wire run costs are a relatively small percentage of the total project cost, so locating the wind turbine right next to the door of the electrical utility room is not necessary. Minimizing the cable length runs (and costs) to the facility is less important than other siting criteria. The proposed sites provide easy access to the electrical interface at a reasonable cost. The cable run does not require additional transformers to increase the voltage to overcome wire losses.

Cit ies of Fair f ield and Vacavi l le NBR Wind Turbine Feasibi l i ty Study
Debenham Energy, LLC 14
CONFIDENTIAL INFORMATION SUBJECT TO A NONDISCLOSURE AGREEMENT
Setbacks from the Roads, Property Boundaries and Overhead Utility Lines Wind turbine siting requires proper setbacks from roads, property boundaries and utility lines. The proposed site may require a height variance (depending on city codes) and possibly a setback variance from the property line.
Adequate Area for Crane Access and Wind Turbine Component Lay Down and Staging Wind turbines are large structures and require site preparations to insure crane access and a suitable area for tower, rotor and nacelle lay down and staging. The area is level and requires minimum preparation for crane access, and component lay down. The road may require improvements to allow transportation of the crane and wind turbine components to the erection area. The size of the crane needed to erect the turbine determines the extent of required road improvements. Improvements to the existing road for the turbine installation are achievable with standard and readily available equipment.
Typical Crane for Turbine Construction

Cit ies of Fair f ield and Vacavi l le NBR Wind Turbine Feasibi l i ty Study
Debenham Energy, LLC 15
CONFIDENTIAL INFORMATION SUBJECT TO A NONDISCLOSURE AGREEMENT
Equipment Staging Layout
Climatic Conditions The amount of energy that a wind turbine can extract from the air depends on how fast the air is moving (wind speed) and to a lesser extent, how much it weighs (air density). The prospective wind speed at the proposed site is described in Section 4. The air density at the site depends on the altitude, temperature, and moisture content of the air. Air is denser at sea level than in the mountains. As elevation increases, the density of the air decreases by about 9% for every 1000 meters of elevation above sea level.
Other conditions that may affect wind turbine performance are airborne dust, insects, and ice formation. Dust and insects can cause a dirty film to build up on the blades effecting performance. Dust and insects do not typically require any additional maintenance as nature usually washes them off in periodic rain showers.
Any ice build up on the wind turbine blades changes the shape of the airfoils and causes degradation in performance. An automatic safety shutdown of the wind turbine occurs as soon as the controller detects an icing condition. This fault condition is transmitted to the wind turbine operator. The controller does not allow the turbine to restart until the operator has visually inspected the blades to make sure they are free of ice and has manually inserted a restart key. Icing is not expected to be a normal occurrence at this location.

Cit ies of Fair f ield and Vacavi l le NBR Wind Turbine Feasibi l i ty Study
Debenham Energy, LLC 16
CONFIDENTIAL INFORMATION SUBJECT TO A NONDISCLOSURE AGREEMENT
2. Electrical Interconnection Review the electrical drawings and inspect the existing electrical system to determine the most suitable point of interconnection of wind generator(s). Determine the scope and estimated cost of any additional electrical equipment that may be required to connect one or more wind turbines to the electrical system.
Wind turbines in the class we are considering for this project utilize an electrical generator that produces three phase AC current at 690 volts AC. To be eligible for the California Self Generation Incentive Program, the wind turbine cable runs must be connected to the facility “behind the meter” which means at the facility distribution panel. For this installation, we would connect the wind turbine to the facility through underground conduit which would be trenched and buried between the wind turbine site and the utility room. The majority of the plant load drives large pumps at 4160 kV. The 690 volt AC current provided by the wind turbine(s) will pass through a pad mounted transformer to step it up to 4160 kV. Next, the wind turbine current passes through a utility accessible disconnect switch and a utility grade kilowatt hour meter before being connected directly to the facility distribution panel in the utility room. The installation requirements and the wire runs for this project are not challenging and should not cause any disruption to regular operations.
Site electrical drawings are included in Attachment A.
1500 KVA Transformer

Cit ies of Fair f ield and Vacavi l le NBR Wind Turbine Feasibi l i ty Study
Debenham Energy, LLC 17
CONFIDENTIAL INFORMATION SUBJECT TO A NONDISCLOSURE AGREEMENT
Typical Simplified Wiring Schematic

Cit ies of Fair f ield and Vacavi l le NBR Wind Turbine Feasibi l i ty Study
Debenham Energy, LLC 18
CONFIDENTIAL INFORMATION SUBJECT TO A NONDISCLOSURE AGREEMENT
Interconnect Application (Rule 21) California is one of the first states to adopt a standard practice for the interconnection of distributed generation devices to the electric grid. Onsite generators must comply with the interconnection requirements set forth in Rule 21 of the utility tariff. Rule 21 says:
“To remove unnecessary barriers to distributed generation deployment, the Commission adopted simplified and standardized interconnection requirements and associated fees governing interconnection of distributed generation facilities.”
www.energy.ca.gov/distgen/interconnection/CPUC_SECTION-2827.PDF
The interconnect application requirements are on the California Energy Commission website:
www.energy.ca.gov/distgen/interconnection/application.html
Rule 21 specifies standard interconnection, operating, and metering requirements for distributed generation. For more information on Rule 21, visit the California Energy Commission website.
www.energy.ca.gov/distgen/interconnection/california_requirements.html
An interconnect application will be submitted after an electrical engineer designs the system and creates a single line diagram.

Cit ies of Fair f ield and Vacavi l le NBR Wind Turbine Feasibi l i ty Study
Debenham Energy, LLC 19
CONFIDENTIAL INFORMATION SUBJECT TO A NONDISCLOSURE AGREEMENT
3. Facility Consumption and Energy Cost Analysis Collect and analyze the electrical usage to determine the yearly energy consumption, and the electrical load profile and the cost of energy ($/kWh).
The average facility load is approximately 2 MW. When on-line access to the PG&E system is provided hourly energy usage data will show how the hourly energy usage aligns with the hourly wind profiles. This will be useful for evaluating turbine sizes above the current Net Metering limit (5 MW). It will provide estimates of the amount of exported power (wholesale) versus offsetting of the NBR usage (retail). The turbine size has 2 impacts on the overall project economics. A larger turbine is substantially more economical all else equal. However, for a 2 MW load the larger turbine(s) will export more power. These offsetting impacts can be evaluated precisely once the hourly wind data and the hourly facility energy usage are available. Sample graphs of facility energy usage for a 700 kW (peak) casino are shown below.
Year
Annual Consumption
(kWh/yr)Average Power
Level (kW)Maximum
Demand (kW)Date & Time of Peak Demand
2003 TBD TBD TBD TBD
2004 TBD TBD TBD TBD
2005 TBD TBD TBD TBD
Typical load versus time curve

Cit ies of Fair f ield and Vacavi l le NBR Wind Turbine Feasibi l i ty Study
Debenham Energy, LLC 20
CONFIDENTIAL INFORMATION SUBJECT TO A NONDISCLOSURE AGREEMENT
The ‘relevant’ cost of electricity depends on several items. It is complex and it must be explained properly. The relevant cost of electricity depends primarily on the time that the electricity is purchased. Utility provided electricity is more expensive in the middle of the day during the summer than it is at night due to Time-of-Use (TOU) pricing.
The ‘average’ cost of electricity used in an economic analysis depends on how the average is ‘weighted’. Imagine that we have wind that is constant all year long. The electricity generated by a wind turbine would then also be constant all year long. It would then make sense to average the cost of electricity over the number of hours in the year and multiply this by the constant energy production. In reality, we are faced with both the cost of electricity and the production of electricity that vary over the year. It becomes more complicated but the calculation is very mechanical. The concept is best explained graphically:
PG&E (E-20 Primary) Time of Use (TOU) Pricing

Cit ies of Fair f ield and Vacavi l le NBR Wind Turbine Feasibi l i ty Study
Debenham Energy, LLC 21
CONFIDENTIAL INFORMATION SUBJECT TO A NONDISCLOSURE AGREEMENT
PG&E (E-20) Tariff
The state of California exempts renewable generators of one megawatt or less from “Exit Fees” (also called “Departing Load Charges). The Exit Fee is about 1-1.5 cents/kWh and this fee is exempted because of the Net Energy Metering (NEM) legislation passed in 2001. In effect, this means that the electricity displaced by a one megawatt wind turbine has a higher value than a 1.5 or 2.5 megawatt wind turbine. This 1 MW limit was based exclusively on solar photovoltaic (PV) technology. The wind turbine industry has moved to wind turbines of 2+MW as the standard which has the unintended and detrimental consequence of preventing the growth of the Distributed Generation (DG) wind energy market. Efforts are underway to rectify this situation but they are dependent on acceptance by elected representatives, the regulated monopoly utilities and the California Public Utilities Commission (CPUC).
In general, electricity generated and consumed on site (retail) is more valuable than electricity exported to the utility (wholesale). These seemingly complex and inter-related issues are best explained individually and, where possible displayed graphically as follows:
Attachment B shows PG&E E20 Primary Firm rate tariffs and average energy cost calculations.

Cit ies of Fair f ield and Vacavi l le NBR Wind Turbine Feasibi l i ty Study
Debenham Energy, LLC 22
CONFIDENTIAL INFORMATION SUBJECT TO A NONDISCLOSURE AGREEMENT
Net Metering / Exit Fees Net Energy Metering (NEM) exempts renewable generators of one megawatt or less from the following non-bypassable departing load or ‘Exit Fees’:
NDC - Nuclear Decommissioning Charge
PPPC - Public Purpose Programs Charge
CTC - Competition Transition Charge
DWRBC - Department of Water Resources Bond Charge
We estimate these charges to be 1.00 cents/kWh. Under Net Energy Metering these charges are exempt. For the purposes of this study the one megawatt wind turbine will displace electricity valued at 1 cent per kWh higher than the avoided (bill reduction) cost of electricity for turbine(s) with nameplate installed capacities above 1 MW.
Diurnal (daily) wind patterns If the wind consistently blows during times of higher energy prices we must ‘weight’ the average energy price to account for this wind pattern.
Typical Diurnal Wind Pattern and PG&E E20 Primary Firm Pricing
The professional meteorologist will provide a Typical Meteorological Year (TMY) consisting 8,760 wind speeds at the center of the turbine rotor. The hourly wind data is then combined with the PG&E Time-of-Use Time Periods (winter/summer, On-peak/Mid-peak/Off-peak, weekdays/weekends/holidays) to estimate the annual dollar savings more accurately.

Cit ies of Fair f ield and Vacavi l le NBR Wind Turbine Feasibi l i ty Study
Debenham Energy, LLC 23
CONFIDENTIAL INFORMATION SUBJECT TO A NONDISCLOSURE AGREEMENT
Debenham Energy LLC recommends that we use an energy rate of 7.5-9.5 cents per kWh as a reasonable estimate of the current average energy rate. PG&E should confirm this rate and the treatment of Departing Load in writing on PG&E letter head. The wind diurnal (daily) pattern has an impact on the average price of electricity and this will be confirmed by a professional meteorologist. Estimates of 8.5 cents per kWh is for turbines of 1 MW and below and 7.5 cents per kWh for turbines greater than 1 MW have been used in this analysis.
Energy Production vs. Energy Consumption If a wind turbine of over 2 MW is used then it will potentially export substantial amounts of energy to the electrical grid. The frequency and magnitude of this occurrence depends on the relationship between the turbine power output and the facility load at each PG&E 15 minute metered reading. This includes turbine system performance adjustments for elevation (density), electrical I2R losses and blade turbulence losses. If a turbine of 1 MW or less is installed then NBR will benefit from the Net Metering rule and it is not necessary to calculate the amount of exported power. The Net Metering program essentially “stores” (credits) the exported power and provides a credit on the next months bill at the retail rate applicable at the time of export.
If a turbine with a nameplate capacity of greater than the minimum facility load is installed then it will be necessary to calculate the amount of exported electricity since under current rules the exported energy has little economic value. We can analyze this in more detail once the professional meteorologist provides the long term wind resource estimate and we have assembled a more detailed current and future facility load profile.
The curve below shows the amount of energy produced by the wind turbine relative to the facility load on a monthly basis for a mining operation. When access to the PG&E on line system is provided similar graphs for different turbine sizes can be provided.

Cit ies of Fair f ield and Vacavi l le NBR Wind Turbine Feasibi l i ty Study
Debenham Energy, LLC 24
CONFIDENTIAL INFORMATION SUBJECT TO A NONDISCLOSURE AGREEMENT
Representative Load Duration Curve
Eligibility for Net Energy Metering (NEM) treatment NBR has sufficient load to be a candidate for 5 MW of installed nameplate capacity. In other words, 5 MW of wind turbine installed capacity would create less energy that is used by NBR on an annual basis. Another way of looking at it is that on an annual basis NBR would be a net importer of energy from PG&E. However, current policy limits Net Metering tariff treatment to projects of 1 MW of installed capacity regardless of facility load. This has the practical consequence of forcing a tradeoff between the benefits of economies of scale or large turbines versus the lower value of energy created by a larger wind turbine. Refer to Attachment C for additional details on Net Metering.

Cit ies of Fair f ield and Vacavi l le NBR Wind Turbine Feasibi l i ty Study
Debenham Energy, LLC 25
CONFIDENTIAL INFORMATION SUBJECT TO A NONDISCLOSURE AGREEMENT
The graph below shows average monthly energy usage and turbine power production for a water treatment plant (500 kW peak load) with two 600 kW turbines and a 1 MW wind turbine (6.0 m/s average wind speed).
Usage vs. Wind Turbine ProductionCombined Meters vs. 2 X FL600
0
50,000
100,000
150,000
200,000
250,000
300,000
350,000
400,000
450,000
Jan Feb Mar Apr May Jun Jul Aug Sep Oct Nov Dec
Mon
thly
kW
h
Usage
Production
Typical energy usage vs. production

Cit ies of Fair f ield and Vacavi l le NBR Wind Turbine Feasibi l i ty Study
Debenham Energy, LLC 26
CONFIDENTIAL INFORMATION SUBJECT TO A NONDISCLOSURE AGREEMENT
4. Wind Resource Estimate Estimate the wind resource based on available wind data. Locate nearby sources of long-term wind data that will provide an estimate of the long-tem expected wind energy at the site. This estimate will also include a review and comparison to known wind resources by a professional meteorologist with over 20 year of experience in California who has access to local wind data.
Accurately predicting the energy yield of one or more wind turbines at a proposed site is dependant upon knowing the local wind resource. Wind energy experts can provide this information with a high level of confidence using wind resource data available near and at the site.
The following types of information help to identify good sites for wind energy harvesting:
Site characteristics such as wind flagged vegetation
State and federally sponsored wind map models that help locate the windy areas of the state
Nearby sources of wind data from airports, agricultural stations, or air quality monitoring stations
Meteorological monitoring towers that provide wind data for a location at or near the site
This site is promising based on two factors.
1. Data from the wind maps produced by the California Energy Commission (CEC) and verified by the National Renewable Energy Laboratory shows a good wind resource.
2. The facility is 10-15 miles from some of the largest wind farms in the United States.
The wind maps show the wind resource at the proposed site as Wind Class 3 which is considered “good”. The wind class is based on the wind power density (watts/meter2). For this location the wind power density is 305 watts/meter2. This indicates a good wind resource. We expect the on-site wind measurement to confirm this.
If hourly wind data for the proposed location is not available, we require four variables to accurately predict the wind resource. We combine these four variables with the wind turbine ‘power curve’ to estimate annual energy production (kWh/year). The four variables are:
1. Air Density. Power output is linearly proportional to air density. Air density is calculated based on elevation. At the site elevation of 30 meters the air density is estimated to be 1 % lower than at sea level.

Cit ies of Fair f ield and Vacavi l le NBR Wind Turbine Feasibi l i ty Study
Debenham Energy, LLC 27
CONFIDENTIAL INFORMATION SUBJECT TO A NONDISCLOSURE AGREEMENT
2. Average Wind Speed. For the selected location the average wind speed is 6.5 meters/second at 50 meters above the ground.
3. Weibull Wind Distribution Factor. This factor defines the shape of the curve around the average wind speed as shown below. It defines the percentage of time that the wind speeds are in wind speed “bins” (1 meter/second). The AWS Truewind predicted Weibull value is 1.9.
Weibull Wind Distribution Factor
4. Wind Shear Exponent. Wind speed varies with height. The predicted wind speed is at 50 meters. The wind shear exponent is used to ‘project’ the wind speed from a known or predicted level to the height of the turbine.
The wind at any height can theoretically be determined by measuring the wind speed at a lower height and applying a wind shear coefficient “∞” using the following formula”
Vu = V1 x (Hu/H1)∞
Vu = Estimated upper height wind velocity V1 = Measured wind speed at the lower height H1 = Lower height where V1 is measured Hu = Upper height (typically turbine hub height) ∞ = Wind shear exponent
If site specific wind data has not been collected we use the ‘default’ wind shear exponent of 1/7 (.143) which is accepted in the industry as the default. The measurement tower that will be installed at the facility will have wind speed measurement anemometers at 10, 30 and 50 meters. This data will be used to calculate the actual site-specific wind shear exponent.

Cit ies of Fair f ield and Vacavi l le NBR Wind Turbine Feasibi l i ty Study
Debenham Energy, LLC 28
CONFIDENTIAL INFORMATION SUBJECT TO A NONDISCLOSURE AGREEMENT
The following graph shows how wind speed varies with height over a range of wind shear exponents that may be encountered. The effects on power output is more pronounced that it might see since power is proportional to wind speed raised to the third power due to what are called the “fan laws”. For example an increase in wind speed from 20 to 22 MPH (10%) provides over 30% more power.
Wind Speed Versus Height
15
20
25
30
35
10 20 30 40 50 60 70 80
22.4 44.8 67.2 89.6 112 134.4 156.8 179.2
Height Above Ground (meters/feet)
Win
d Sp
eed
(MPH
)
0.20.170.1430.12
Wind Resource Map The State of California Wind Map Model clearly indicates the wind resource for this area. This sophisticated computer model helps wind plant developers find the locations in the state with the best wind resources. The model uses data from hundreds of wind monitoring locations such as airports, agricultural stations, power plants and coast guard stations, as well as terrain elevation data, vegetation type and cover, and upper level wind data collected for more than forty years. The mesomapping model uses this information to predict the wind velocity and direction at different heights above the ground for every square quarter mile in the state. The California Energy Commission and the US Department of Energy funded the development of the model, and local meteorologists have validated its predictions. For more information on mesomapping, see: www.awstruewind.com/inner/services/windmapping/mesomap/mesomap.htm

Cit ies of Fair f ield and Vacavi l le NBR Wind Turbine Feasibi l i ty Study
Debenham Energy, LLC 29
CONFIDENTIAL INFORMATION SUBJECT TO A NONDISCLOSURE AGREEMENT
Wind Resource Map
The lower estimate of the expected long-term average wind speed from the Professional Meteorologist is 6.5 meters per second (14.53 MPH) at 50 meters (164 feet) above ground level for this location. We use this wind speed in the financial projections.
Hourly Wind Data The most accurate method of determining the wind resource is on site wind measurement. This is normally accomplished by installing a Meteorological Tower (MET) with wind speed anemometers typically at 10, 30 and 50 meters. Three levels of anemometers determine the wind shear exponent used to predict wind speeds at different elevations. To reduce the impact of seasonal or annual variations during the period of measurement the wind data is “correlated” to a nearby source of long-term wind data (3-5+ years). This correlation is done by a professional meteorologist to provide the expected long-term average estimate . This is referred to as a Typical Meteorological Year (TMY) that represents the average over the 20 year design life of the wind turbine. The TMY consists of 8,760 (365 x 24) wind speeds typically referenced to 50 meters above ground level

Cit ies of Fair f ield and Vacavi l le NBR Wind Turbine Feasibi l i ty Study
Debenham Energy, LLC 30
CONFIDENTIAL INFORMATION SUBJECT TO A NONDISCLOSURE AGREEMENT
Meteorological Tower (MET) Installation
We calculate the annual expected energy production from the power output (kW) for each hourly wind speed (at the center of the turbine rotor) based on the wind turbine manufacturers power curve. We sum the turbine power output for each of the 8,760 wind speeds to give the annual energy production (kWh/year). We make reductions for air density (based on elevation), electrical losses, turbulence losses, availability (% of time operational) and expected long term degradation due to blade fouling. We then use this number in the financial projections based on the cost of electricity as described in the next section.
It is important to understand that even with 10 or 20 years of on site wind data, this is only a prediction of the expected wind. A detailed discussion of the statistical methods is beyond the scope of this study. It is crucial to work with an experience professional meteorologist with a proven record of accomplishment in the local area.

Cit ies of Fair f ield and Vacavi l le NBR Wind Turbine Feasibi l i ty Study
Debenham Energy, LLC 31
CONFIDENTIAL INFORMATION SUBJECT TO A NONDISCLOSURE AGREEMENT
5. Annual Energy Production and Utility Cost Savings Predict annual energy production (kWh) and expected utility cost savings for the appropriately sized wind turbine(s).
We calculate annual energy production using the wind resource estimate combined with the turbine power curve. We can use one or both of the following methods to quantify the wind resource estimate.
1. Average wind speed and Weibull distribution from the wind resource maps
2. A Typical Meteorological Year (TMY) consisting of a wind speed for each of the 8,760 hours of the year.
Regardless of which method we use the concept is the same. The previous section discusses the wind resource estimate. This section describes the mechanics of combining a wind resource estimate with the turbine power curve to estimate the annual energy production (kWh/year). On site hourly measurement is preferable because it is usually more accurate and it provides an estimate of when the energy is produced. Knowing when the energy is produced is important since energy prices are usually based on the time of day and the season. Data from the wind maps provides no information about wind speed variation over the time of day or season. Performance calculations for 3 turbines are provided as Attachment D.
Turbine Manufacturers Power Curve. The power curve shows power output for different wind speeds assuming clean blades, sea level air density, non-turbulent flow and no electrical loses. To estimate the long-term electricity cost savings, we must adjust the data for these factors plus the percentage of time the turbine is operable.
Power Curves
0
500
1000
1500
2000
2500
3000
1 2 3 4 5 6 7 8 9 10 11 12 13 14 15 16 17 18 19 20
Meters/second
kW
Fuhrlander FL600
AWE900
Fuhrlander FL2.5
Cit ies of Fair f ield and Vacavi l le NBR Wind Turbine Feasibi l i ty Study
Debenham Energy, LLC 32
CONFIDENTIAL INFORMATION SUBJECT TO A NONDISCLOSURE AGREEMENT
The manufacturers rated turbine performance has been adjusted for:
1% for Density (elevation)
2% for long term Performance Degradation due to blade fouling from dirt, bugs etc
96% for Turbine Availability
8% Derating for turbulence, wire run losses and other performance influencing factors.
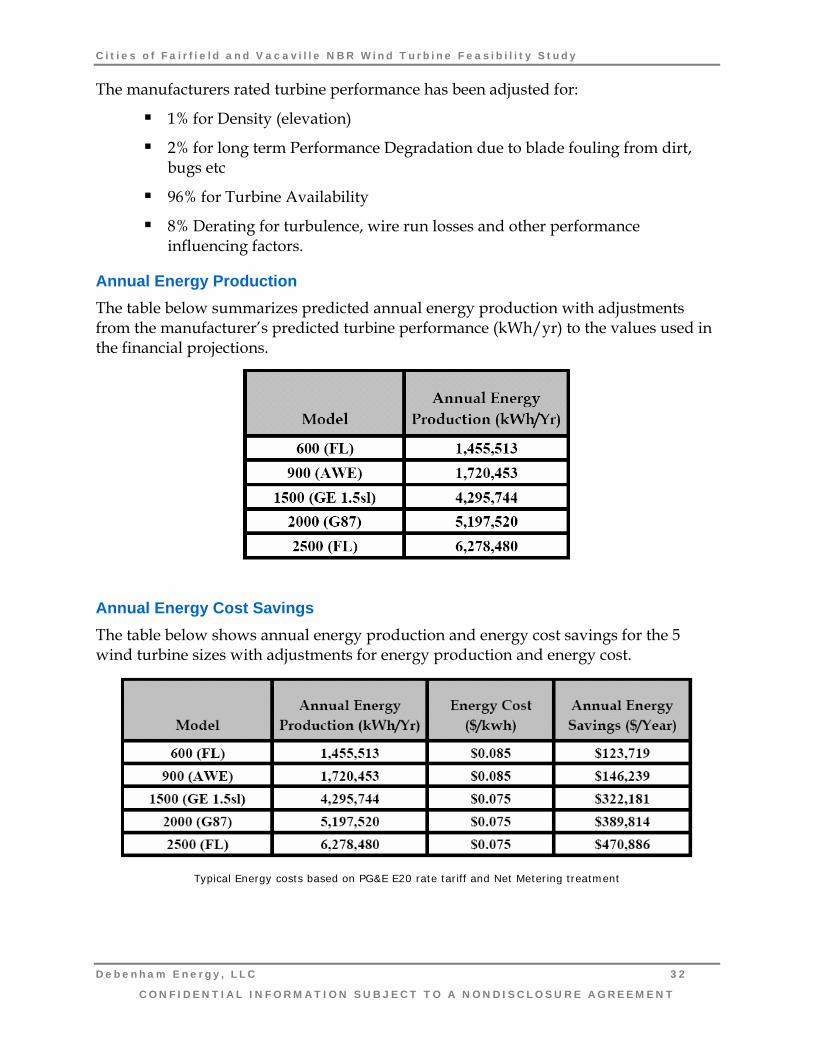
Annual Energy Production The table below summarizes predicted annual energy production with adjustments from the manufacturer’s predicted turbine performance (kWh/yr) to the values used in the financial projections.
Annual Energy Cost Savings The table below shows annual energy production and energy cost savings for the 5 wind turbine sizes with adjustments for energy production and energy cost.
Typical Energy costs based on PG&E E20 rate tariff and Net Metering treatment

Cit ies of Fair f ield and Vacavi l le NBR Wind Turbine Feasibi l i ty Study
Debenham Energy, LLC 33
CONFIDENTIAL INFORMATION SUBJECT TO A NONDISCLOSURE AGREEMENT
Sample Performance Calculation The table below shows a sample of the performance calculation using one day of wind data and the power curve of the FL 900. We will provide data for the entire year in an interactive spreadsheet format once we have agreed upon the Typical Meteorological Year (TMY) of wind data.
Sample Performance Calculation Below is a calculation for the Fuhrlander FL600 wind turbine based on an average wind speed of 6.5 meters per second.

Cit ies of Fair f ield and Vacavi l le NBR Wind Turbine Feasibi l i ty Study
Debenham Energy, LLC 34
CONFIDENTIAL INFORMATION SUBJECT TO A NONDISCLOSURE AGREEMENT
6. Permitting Requirements and Special Applications Determine applicable local, State and Federal permitting requirements and identify the agencies with jurisdiction. Assist with the height variance, set-back variance and/or special use permit application(s) (as required) for the local controlling agency(s). Complete the following for NBR to submit:
• FAA Form 7460-1 so that the FAA can perform an Obstruction Evaluation / Airport Airspace Analysis.
• Self Generation Incentive Program (“SGIP”) application toPG&E (currently $1,500/kW for up to 1 megawatt). The application will be completed and Debenham Energy will advise on when to submit the application.
This project is subject to city and/or county permitting requirements potentially including a height/use variance and special use permit. In addition, habitat/environmental related permits are required. All other permit requirements will be determined before a building permit application is filed. In general, obtaining a building permit depends on local, county, state and federal regulations.
Federal Aviation Administration obstruction height and lighting
State building and electrical codes
Town or county zoning regulations
State coastal regulations within the coastal zone
State Dept. of Environmental Management regulations
Wetlands, landfills or Wildlife areas
Local historic district regulations
State historic or cultural resource commissions
Designated historic area
Areas with archeological significance
Designated view shed area
Federal Land (BLM) or National Historic Register designation
US Fish and Wildlife (in areas of designated critical habitat, endangered species or migratory birds)
US Coast Guard (if wind turbine obstructs aids to navigation lighting)
US DOD if wind turbine may interfere with radar or border listening post
For additional information refer to Attachment E. Information on wind avian interactions can be provided if requested.

Cit ies of Fair f ield and Vacavi l le NBR Wind Turbine Feasibi l i ty Study
Debenham Energy, LLC 35
CONFIDENTIAL INFORMATION SUBJECT TO A NONDISCLOSURE AGREEMENT
FAA form 7460-1 The Federal Aviation Administration obstruction evaluation application (FAA Form 7460-1) was submitted for a height of 335 feet. The FAA and/or Travis AFB has rejected any turbine height within 5 miles based on an initial review. The FAA response is provided as Attachment F and summarized below.
Initial findings of this study indicated that the structure as described exceeds obstruction standards and/or would have an adverse physical or electromagnetic interference effect upon navigable airspace or air navigation facilities. Pending resolution of the issues described below, the structure is presumed to be a hazard to air navigation.
If the structure were reduced in height so as not to exceed 0 feet above ground level (90 feet above mean sea level), it would not exceed obstruction standards and a favorable determination could subsequently be issued.
This initial decision should be appealed to a higher authority expeditiously. The issue is likely related to radar Doppler interference which has been a subject of ongoing debate between the wind industry and the Department of Defense and Homeland Security. It is not uncommon for initial findings to be revised.
Notice of Actual Construction (FAA Form 7460-2) must be submitted 10 days prior to construction (Part I) and within 5 days after reaching the maximum height.
Self Generation Incentive Program (SGIP) Application On March 27, 2001 the California Public Utilities Commission (CPUC) ordered the state’s investor owned utilities to develop and implement a self-generation incentive program. To date the SGIP program has provided over $450,000,000 in support of on site generation projects. Program administration varies by utility. In San Diego Gas and Electric territory, an independent non-profit corporation administers the SGIP program. However, in PG&E territory, PG&E administers the program.
PG&E will provide a check for $1,500.00 per kW of nameplate capacity ($1,500,000 for 1 megawatt) about 30 days after the electrical interconnection requirements have been met. The incentive amount is limited to 1 megawatt although it applies to systems of up to 5 megawatts.
The SGIP application consists of the following forms.
1. Completed Reservation Request Application Checklist
2. Completed Reservation Request Application w/ Original Signatures See Draft Attachment G.
3. Proof of Utility Service
4. Electrical System Sizing Documentation
5. System Description Worksheet

Cit ies of Fair f ield and Vacavi l le NBR Wind Turbine Feasibi l i ty Study
Debenham Energy, LLC 36
CONFIDENTIAL INFORMATION SUBJECT TO A NONDISCLOSURE AGREEMENT
6. Incentive Calculation Worksheet
The current incentive level of the SGIP program for wind technology is $1,500,000 per megawatt. This incentive level will be reduced in the future, as California’s goal is to reduce subsidies over time. We cannot predict when it will be reduced or by how much since this depends on a combination of factors. As of February 2007 the PG&E SGIP program had $16,200,000 for wind technology (Level 2). If the Level 2 funds are depleted the utility has some discretion to transfer money between levels. California Assembly Bill AB 2778 was approved in 2006. This bill extends the sunset date for the SGIP program from January 1, 2008 to January 1, 2010.
The PG&E contact for the SGIP program is:
Mailing Address:
Sarah Birmingham
Pacific Gas and Electric Company Self-Generation Incentive Program P.O. Box 770000 Mail Code B27P San Francisco, CA 94177
Street Address (for overnight deliveries):
Pacific Gas and Electric Company Attn: Self-Generation Program 77 Beale Street, B27P San Francisco, CA 94105-1814
Phone Number: (415) 973-6436 Fax Number: (415) 973-2510 e-mail: [email protected]

Cit ies of Fair f ield and Vacavi l le NBR Wind Turbine Feasibi l i ty Study
Debenham Energy, LLC 37
CONFIDENTIAL INFORMATION SUBJECT TO A NONDISCLOSURE AGREEMENT
7. Turbine Model Recommendations Determine the appropriate turbine model for the facility electrical load, allowable height and wind resource profile.
We recommend that the Cities of Fairfield and Vacaville evaluate a single wind turbine sized between 1 and 2.5 MW. If the Net Metering law is changed to allow 5 MW of installed nameplate capacity then NBR should evaluate up to 5 MW of installed capacity consisting of 2-3 turbines of 1.5 – 2.5 MW each.
The trend in the wind turbine industry has been to build larger wind turbines and develop larger wind farms. Some wind turbines are now well over 500 feet tall and wind farms of 100-200 or more are becoming the norm. The need for increased economies of scale in both cost and performance is driving this trend. As a result, many turbine manufacturers have discontinued the manufacture of “mid-sized” wind turbines, including 1 MW models. In addition, many turbine suppliers are not interested in selling a single turbine because it takes internal resources away from pursuing larger “wind farm” projects.
Matching an appropriately sized wind turbine to a given facility depends on the following factors:
Facility electricity loads
State Net Metering and Self Generation Incentive Program requirements which limit the allowable wind turbine size
Proximity of sensitive neighborhoods to the proposed wind turbine site

Cit ies of Fair f ield and Vacavi l le NBR Wind Turbine Feasibi l i ty Study
Debenham Energy, LLC 38
CONFIDENTIAL INFORMATION SUBJECT TO A NONDISCLOSURE AGREEMENT
Availability of specific wind turbine models which fit the above criteria
On windy days when a one-MW wind turbine generates more power than the facility uses, the State of California Net Metering rule allows the facility to get full retail value for energy exported to the utility. Without the State Net Metering Rule, this project would be much less economically viable.
Wind Turbines up to1 MW Eligible for California Net Metering Program Make Model(s) Capacity Rotor Size Web US Office Available
Fuhrlander FL 600 600 50 www.lorax-energy.com Block Island, RI Yes
FL 1000 FL 1000 B
1000 54, 62 Yes
AWE AWE 900 900 52/54 www.awe-wind.com Toronto, ON Canada
Yes
Gamesa Eolica G52, G58 850 52, 58 www.gamesa.es Philadelphia, PA No Small Projects
Mitsubishi MWT 600 600 45, 47 www.mpshq.com El Dorado Hills, CA No Small Projects
MWT 1000 1000 57, 61.4
Suzlon 950 950 64 www.suzlon.com Chicago, IL No Small Projects
S.60, S.62 S.64
1000 60, 62, 64
Vestas V47 660 47 www.vestas.com Portland, OR Discontinued V47

Cit ies of Fair f ield and Vacavi l le NBR Wind Turbine Feasibi l i ty Study
Debenham Energy, LLC 39
CONFIDENTIAL INFORMATION SUBJECT TO A NONDISCLOSURE AGREEMENT
Fuhrländer AG. Fuhrländer, a German wind turbine manufacturer, is the 7th largest turbine manufacturer in Europe. They offer 1.0, 1.5 and 2.5 MW wind turbines. They are interested in selling single turbines. Although Fuhrländer does not yet have a large installed base in the US, they do have a strong service organization and they are interested in expanding in the US. Refer to Attachment H and the link below for details on Fuhrländer AG.
http://www.fuhrlaender.de/
For the Fuhrländer annual report from 2004, see: http://www.debenhamenergy.com/Links/Fuhrlander_Annual_Report_2004.pdf
Americas Wind Energy. (AWE). AWE is the North American Distributor for Emergya Wind Technologies (EWT). EWT acquired the Intellectual Property of Lagerway International B.V. of the Netherlands. Lagerway developed the direct drive (no gearbox) technology used on a 750 kW wind turbine which they have uprated to 900 kW. Refer to Attachment I for details on this 900 kW turbine manufactured in North American by America’s Wind Energy (AWE: www.awe-wind.com ).
Clipper Windpower, Inc. is a rapidly growing wind energy technology company which manufactures the 2.5 MW Liberty turbine and actively develops wind power generating projects in the Americas and Europe. They have offices in California, Colorado, Maryland, Mexico and the U.K., and a ISO9001:2000 QMS Certified, 200,000 square foot manufacturing and assembly facility located in Cedar Rapids, Iowa
www.clipperwind.com
Of the larger manufacturers of one-megawatt and smaller wind turbines, only Fuhrländer, and Americas Wind Energy (AWE), General Electric and Clipper have been responsive to the single wind turbine on-site generation market. The other manufacturers are focused on larger multiple turbine projects.

Cit ies of Fair f ield and Vacavi l le NBR Wind Turbine Feasibi l i ty Study
Debenham Energy, LLC 40
CONFIDENTIAL INFORMATION SUBJECT TO A NONDISCLOSURE AGREEMENT
In addition to the turbine manufacturers listed above, we can pursue the acquisition of a single turbine from a wind farm developer willing to sell one from his inventory for a large wind farm project. We can pursue this option once we have completed the wind assessment and the project is approved. Wind turbine models that should be pursued through developers include Mitsubishi (Japan) and Gamesa (Spain).
Cit ies of Fair f ield and Vacavi l le NBR Wind Turbine Feasibi l i ty Study
Debenham Energy, LLC 41
CONFIDENTIAL INFORMATION SUBJECT TO A NONDISCLOSURE AGREEMENT
8. Comprehensive Economic Model Provide a comprehensive economic model for the installation and operation of one or more wind turbines that will utilize the information compiled to provide a concise picture of the economic benefits that the project will generate.
In this section, we analyze the economic viability of installing turbines of 1-2.5 MW. First we describe the analytical methodology and the main economic drivers that impact the analysis. Then we identify the assumptions that define the base case (wind resource, electricity rate, installed cost, maintenance cost etc) used in the analysis. We then vary each assumption over a reasonable expected range (while keeping the other assumptions the same) and present scenarios that are variations of the base case. We graphically show the sensitivity to various input assumptions in order to provide a realistic view of the net benefits of a wind turbine installation.
Financial Analysis Methodology There are many techniques for financial and economic modeling. Some analysts use payback because it is easy to understand. However, it is also the least accurate. Payback ignores the benefits of later cash flows which are substantial for a product with a 20-year design life. Internal rate of return (IRR) is another common technique that we will use for the case of equipment purchase. NPV, sometimes referred to as discount cash flow, is less intuitive than payback or IRR, but it is the preferred method academically. The concept is simple – discount future cash flows at a rate that reflects inflation and risk and then sum them together to calculate the present value. Deduct the initial investment amount to calculate the ‘net’ present value. Another way to understand NPV is to think of it as the amount of money you would need to have today in order to make the future payments. Even when there is no initial investment, as in the case of purchasing power, the NPV works just fine. You can also think of NPV as the amount of money in today’s dollars that represents the (risk adjusted) future cash flows. This is the appropriate way to compare the cash flows of the two ownership options.
Next we perform a sensitivity analysis by varying the key parameters that affect the economics and calculating their effect on the bottom line, the NPV and IRR. The following sensitivities are analyzed:
1. Wind Speed (e.g. electricity production)
2. Installed Cost
3. Operations and Maintenance Cost ($/kWh)
4. Utility Energy Rate – Year 1 ($/kWh)
5. Utility Energy Escalation Rate (%/year)

Cit ies of Fair f ield and Vacavi l le NBR Wind Turbine Feasibi l i ty Study
Debenham Energy, LLC 42
CONFIDENTIAL INFORMATION SUBJECT TO A NONDISCLOSURE AGREEMENT
Summary of Economic Results
To evaluate a project and perform sensitivity analysis we must start with a set of assumptions to define a base case. The base case assumptions for the Fuhrlander 2.5 MW wind turbine are shown below. A separately provided interactive spreadsheet allows comparison of the 3 different wind turbines (600 kW, 900 kW and 2500 kW).

Cit ies of Fair f ield and Vacavi l le NBR Wind Turbine Feasibi l i ty Study
Debenham Energy, LLC 43
CONFIDENTIAL INFORMATION SUBJECT TO A NONDISCLOSURE AGREEMENT
A variety of factors determines the costs of installing, operating and maintaining a wind turbine. These factors are described below in general terms.
Installation Costs Major categories of installed equipment costs include:
Turbine
Turbine and Tower
Freight
FAA Lighting
Balance of Plant
Site Development
Pad Mount Transformer
Concrete and Rebar
Foundation Labor
Tower Imbeds / Bolts
Cranes, Crane & Erection Labor
Construction Supervision
Monitoring and Control System
Interconnection
Electrical Wiring (turbine to facility)
Interconnection and Metering
Electrical Labor
Soft Costs
Legal
Permitting
Development & Engineering
Insurance
Meteorological Tower (if required) and Feasibility Study
Contingency

Cit ies of Fair f ield and Vacavi l le NBR Wind Turbine Feasibi l i ty Study
Debenham Energy, LLC 44
CONFIDENTIAL INFORMATION SUBJECT TO A NONDISCLOSURE AGREEMENT
A contingency typically includes the cost items that are subject to change. By having several items in the contingency we can to get the benefits of diversification since some items will be higher than projected and some lower. This diversification eliminates the need to add the worst case estimates together. This number is useful if you understand its probability of occurring. A contingency should include the following cost elements:
Exchange Rate. Most suppliers of wind turbines are European. International sourcing includes a risk of exchange rate fluctuations. As the time of sale approaches, you can purchase a contract at a fixed cost for the Euros required to buy the wind turbine. You can mitigate this risk by obtaining a turbine quote that is valid for 30 days or possibly longer.
Cost of Steel and Copper. Commodity prices have been high and volatile recently. This includes steel and copper which are large cost elements of a wind turbine project. A practical approach to mitigate this risk is to obtain quotes valid for 30 days or possibly longer.
Turbine Prices. The high demand for wind turbines in the U.S. and internationally has caused a price rise of almost 30% over the last year.
Miscellaneous. This could include foundation and electrical trenching costs (e.g. hitting rock), inclement weather requiring more time for the crane and crew to be at site, and a general adder for unforeseen occurrences.
Operating Costs While there are no fuel costs for a wind turbine, there are ongoing operating costs associated with maintenance and other aspects. Cost elements include:
Operations and Maintenance
Warranty
Equipment Repair and Replacement Fund
Property Taxes
Equipment Insurance
Management / Administrative
Land Lease (only relevant if a third party owns the wind turbine)
Miscellaneous
Estimating Electric Bill Reduction The electric bill from an electric utility contains four types of charges:
Customer Charges
Demand (kW) Charges
Cit ies of Fair f ield and Vacavi l le NBR Wind Turbine Feasibi l i ty Study
Debenham Energy, LLC 45
CONFIDENTIAL INFORMATION SUBJECT TO A NONDISCLOSURE AGREEMENT
Energy (kWh) Charges
Other (e.g., metering, interconnection study)
Customer, demand, and other charges all are pure utility wire charges. The energy charges are a mixture of wire and generation charges. While generation charges are more or less a function of the cost of fuel inputs (e.g., natural gas, oil, gas) the utility sets wire charges via regulation and they are static, but somewhat arbitrary. Unless a customer can disconnect completely from the grid they must pay monthly customer charges and demand (kW) charges.
The charges that you can avoid (in part) by the installation of a wind turbine are energy charges. Energy charges constitute a very large share of an electric bill. We calculate the yearly savings in energy charges by calculating the annual turbine electricity production on site and multiply the kWhs by the energy charge that would have been paid for the same electricity purchased from the utility.
PG&E Electric Rate In Section 3 we calculated the applicable electric rate to be 8.5 cents per kWh pending PG&E clarification of assumptions used in their review and the interaction of the diurnal (daily) wind profile and the 2007 PG&E E20 Primary Firm rate tariff.
Estimating Turbine Energy Production We use the manufacturers rated turbine performance (at site elevation) then adjust it for:
1% Density (elevation)
2% Performance Degradation
96% Turbine Availability
8% Derating for turbulence, wire run losses and other performance influencing factors.
We use the estimated wind resource of 6.5 meter/second to calculate the annual turbine electricity production for the 2 turbines resulting in the following:
FL600 1,455,000 kWh/year
AWE-900 1,720,000 kWh/year
FL2500 5,908,000 kWh/year
These values are the Base Case.
Cit ies of Fair f ield and Vacavi l le NBR Wind Turbine Feasibi l i ty Study
Debenham Energy, LLC 46
CONFIDENTIAL INFORMATION SUBJECT TO A NONDISCLOSURE AGREEMENT
Projecting Financial Impacts to Future Years A wind turbine has an expected equipment life of over 20 years. For futures years we assume that the wind resource will be the same as the base case. The base case is based on 12 complete months of wind data from 2005-2006. Future years will be different than 2005-2006. However, the sensitivity analysis covers a variation that certainly encompasses the range that is expected. The professional meteorologist will confirm that the wind resource estimate used in this analysis reasonably represents the expected long term resource.
Additionally we make explicit assumptions about the cost of the wind turbine installation, O&M costs, percentage of time the wind turbine is available (i.e., not undergoing repair or maintenance), electrical line losses, state incentives and inflation rates. We combine all this information to provide costs and benefits of a wind turbine for each of the 20 years of expected operation. From these results we compute cash flow, internal rate of return (IRR), and net present value (NPV).
Sensitivity Analysis Sensitivity analysis requires picking the most important cost elements of the project and varying those costs over a range of expected variation. We performed a sensitivity analysis of the major factors that may affect the economics of a wind turbine project.
The costs that we varied separately in this sensitivity analysis are:
6. Wind Speed (e.g. electricity production)
7. Installed Cost
8. Operations and Maintenance Cost ($/kWh)
9. Utility Energy Rate – Year 1 ($/kWh)
10. Utility Energy Escalation Rate (%/year)
Note: More sophisticated sensitivity analyses use a Monte Carlo simulation which determines the probability of variation of each cost driver (i.e. normal distribution). A computer simulation program models the expected range of variation of each item to see the expected range of variation in the bottom line (NPV, IRR, payback, etc). This is calculated for all variables simultaneously. The Monte Carlo method is beyond the scope of this analysis. Instead, for this analysis, we varied each cost item while holding all other variable constant (base case).
Sensitivity Analysis – Turbine Owned by the Cities of Fairfield and Vacaville The graphs shown below are for a single 2.5 MW wind turbine on an 80 meter tower.

Cit ies of Fair f ield and Vacavi l le NBR Wind Turbine Feasibi l i ty Study
Debenham Energy, LLC 47
CONFIDENTIAL INFORMATION SUBJECT TO A NONDISCLOSURE AGREEMENT
1. Wind Resource / Energy Production As expected the IRR and the NPV increase as the average wind speed increases:
NPV vs. Wind Speed
$0
$1,000,000
$2,000,000
$3,000,000
$4,000,000
$5,000,000
$6,000,000
7.00 6.75 6.50 6.25 6.00
Wind Speed (meters/second)
NPV
NPV-20 year
NPV-10 year
IRR vs. Wind Speed
0.0%
5.0%
10.0%
15.0%
20.0%
25.0%
30.0%
35.0%
40.0%
7.00 6.75 6.50 6.25 6.00
Wind Speed (meters/second)
IRR
IRR - 20 year
IRR - 10 year
Cit ies of Fair f ield and Vacavi l le NBR Wind Turbine Feasibi l i ty Study
Debenham Energy, LLC 48
CONFIDENTIAL INFORMATION SUBJECT TO A NONDISCLOSURE AGREEMENT
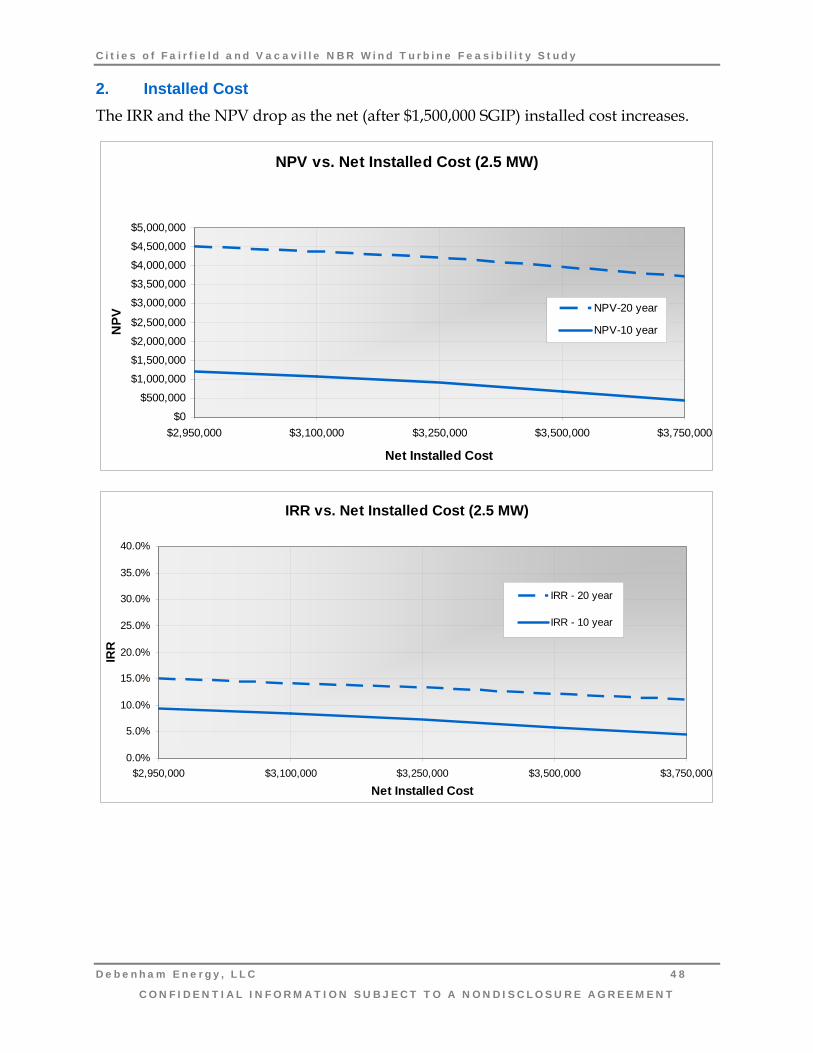
2. Installed Cost The IRR and the NPV drop as the net (after $1,500,000 SGIP) installed cost increases.
NPV vs. Net Installed Cost (2.5 MW)
$0
$500,000
$1,000,000
$1,500,000
$2,000,000
$2,500,000
$3,000,000
$3,500,000
$4,000,000
$4,500,000
$5,000,000
$2,950,000 $3,100,000 $3,250,000 $3,500,000 $3,750,000
Net Installed Cost
NPV
NPV-20 year
NPV-10 year
IRR vs. Net Installed Cost (2.5 MW)
0.0%
5.0%
10.0%
15.0%
20.0%
25.0%
30.0%
35.0%
40.0%
$2,950,000 $3,100,000 $3,250,000 $3,500,000 $3,750,000
Net Installed Cost
IRR
IRR - 20 year
IRR - 10 year

Cit ies of Fair f ield and Vacavi l le NBR Wind Turbine Feasibi l i ty Study
Debenham Energy, LLC 49
CONFIDENTIAL INFORMATION SUBJECT TO A NONDISCLOSURE AGREEMENT
3. Operations and Maintenance The IRR and the NPV drop as the operation and maintenance cost increases.
NPV vs. Operations and Maintenance Cost
$0
$500,000
$1,000,000
$1,500,000
$2,000,000
$2,500,000
$3,000,000
$3,500,000
$4,000,000
$4,500,000
$5,000,000
$0.006 $0.008 $0.010 $0.012 $0.014
O&M Cost ($/kWh)
NPV
NPV-20 year
NPV-10 year
IRR vs. Year 1 Electric Rate
0.0%
5.0%
10.0%
15.0%
20.0%
25.0%
30.0%
35.0%
40.0%
45.0%
$0.006 $0.008 $0.010 $0.012 $0.014
O&M Cost ($/kWh)
IRR
IRR - 20 year
IRR - 10 year

Cit ies of Fair f ield and Vacavi l le NBR Wind Turbine Feasibi l i ty Study
Debenham Energy, LLC 50
CONFIDENTIAL INFORMATION SUBJECT TO A NONDISCLOSURE AGREEMENT
4. Utility Energy Rate – Year 1
The NPV and the IRR increase as the cost of utility purchased electricity increases.
NPV vs. Year 1 Electric Rate
$0
$1,000,000
$2,000,000
$3,000,000
$4,000,000
$5,000,000
$6,000,000
$0.070 $0.075 $0.080 $0.085 $0.090
Electric Rate - Year 1
NPV
NPV-20 year
NPV-10 year
IRR vs. Year 1 Electric Rate
0.0%
5.0%
10.0%
15.0%
20.0%
25.0%
30.0%
35.0%
40.0%
45.0%
$0.070 $0.075 $0.080 $0.085 $0.090
Electric Rate - Year 1
IRR
IRR - 20 year
IRR - 10 year

Cit ies of Fair f ield and Vacavi l le NBR Wind Turbine Feasibi l i ty Study
Debenham Energy, LLC 51
CONFIDENTIAL INFORMATION SUBJECT TO A NONDISCLOSURE AGREEMENT
5. Utility Energy Escalation Rate The NPV and IRR increase as the utility electric escalation rate increases.
NPV vs. Annual Energy Escalation
$0
$1,000,000
$2,000,000
$3,000,000
$4,000,000
$5,000,000
$6,000,000
$7,000,000
$8,000,000
0% 1% 2% 3% 4%
Percentage per Year
NPV
NPV-20 year
NPV-10 year
IRR vs. Annual Energy Escalation
0.0%
5.0%
10.0%
15.0%
20.0%
25.0%
30.0%
35.0%
40.0%
0% 1% 2% 3% 4%
Percentage per Year
IRR
IRR - 20 year
IRR - 10 year

Cit ies of Fair f ield and Vacavi l le NBR Wind Turbine Feasibi l i ty Study
Debenham Energy, LLC 52
CONFIDENTIAL INFORMATION SUBJECT TO A NONDISCLOSURE AGREEMENT
Ownership Options
Cities of Fairfield and Vacaville Ownership In the case of the Cities of Fairfield and Vacaville ownership, we assume that either:
The Cities of Fairfield and Vacaville purchase the turbine and a qualified project manager coordinates the subcontractor and turbine manufacturer efforts
A general contractor of the Cities of Fairfield and Vacaville’s choosing purchases the turbine and manages and pays the subcontractors in a turnkey arrangement. Ownership transfers to the Cities of Fairfield and Vacaville after electrical installation.
The financial benefits of a wind turbine as described above are a combination of avoided utility costs and Renewable Energy Credit (REC) sales revenue. The financial projections do not include REC sales.
Third-Party Ownership – Power Purchase Agreement (PPA) Though not considered in detail in this study, third-party ownership and operation is also a viable option. Under third-party ownership we assume that the Cities of Fairfield and Vacaville procure electricity generated from the wind turbine at a savings compared to retail utility rates. We assumed that the Cities of Fairfield and Vacaville purchase all of the electricity produced. Electricity is sold at an agreed upon annual energy rate ($/kWh) and annual escalation rate (%). The rate is independent of utility rate changes and the time of day that the electricity is generated.
See Attachment J for a description of the pros and cons of these ownership options.
State Incentives Pursuant to California Assembly Bill 970, the California Public Utilities Commission (CPUC) approved the Self-Generation Incentive Program (SGIP) on March 27, 2001. SGIP provides financial incentives for business and residential customers who install up to 5.0 MW of clean distributed generation equipment onsite.
Qualifying self-generation equipment must be certified to operate in parallel with the electrical grid and meet other criteria established by the CPUC. The program runs through December 31, 2007.
For wind turbine projects, the incentive offered is $1.50/watt up to a maximum of $1.5 million.

Cit ies of Fair f ield and Vacavi l le NBR Wind Turbine Feasibi l i ty Study
Debenham Energy, LLC 53
CONFIDENTIAL INFORMATION SUBJECT TO A NONDISCLOSURE AGREEMENT
Sale of Renewable Certificates Renewable Energy Credits (RECs) represent the environmental attributes of electricity generated from renewable fuels, which you can sell separately from the electricity. The financial projections do not include sale of REC’s. We assume that the Cities of Fairfield and Vacaville will use them for other purposes. See Attachment K for more information about the very recent debate in California regarding RECs. Ownership of REC’s for wind project such as this is currently unclear. Recent REC prices in California are a little over .5 cents per kWh. Ownership is permanent so they would provide a permanent revenue stream. In Massachusetts REC prices are over 4 cents. The consensus view in California is that REC prices will likely go up and possibly substantially.
For more information about REC sales, consult companies such as Evolution Markets: www.evomarkets.com/.
Cit ies of Fair f ield and Vacavi l le NBR Wind Turbine Feasibi l i ty Study
Debenham Energy, LLC 54
CONFIDENTIAL INFORMATION SUBJECT TO A NONDISCLOSURE AGREEMENT
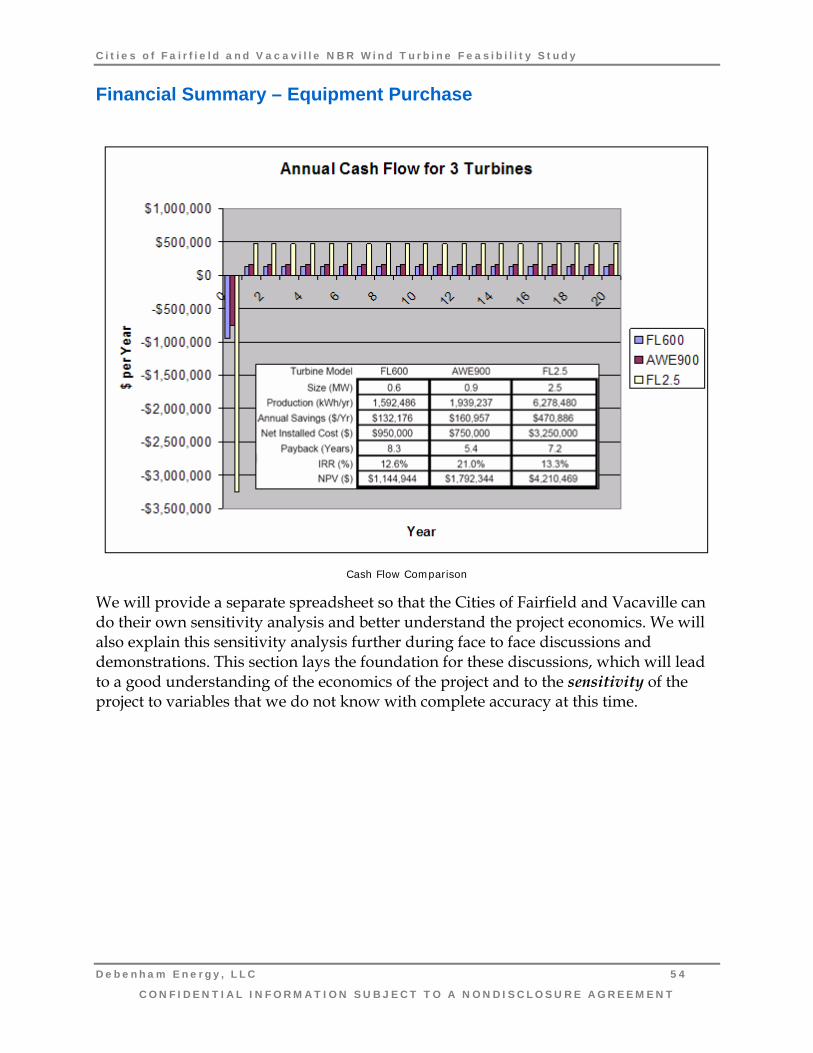
Financial Summary – Equipment Purchase
Cash Flow Comparison
We will provide a separate spreadsheet so that the Cities of Fairfield and Vacaville can do their own sensitivity analysis and better understand the project economics. We will also explain this sensitivity analysis further during face to face discussions and demonstrations. This section lays the foundation for these discussions, which will lead to a good understanding of the economics of the project and to the sensitivity of the project to variables that we do not know with complete accuracy at this time.

Cit ies of Fair f ield and Vacavi l le NBR Wind Turbine Feasibi l i ty Study
Debenham Energy, LLC 55
CONFIDENTIAL INFORMATION SUBJECT TO A NONDISCLOSURE AGREEMENT
9. Beneficial Public Relations Propose and discuss options for beneficial public relations including an educational kiosk, flat screen display, website with real time and historical energy production data and options for tower and blade color schemes.
There are many options for public relations, depending on your goals and budget. We list several below:
Kiosks Kiosks can vary from the simple one show below to something quite elaborate. A kiosk can be interactive and very educational. We can provide information on other kiosk options upon request.

Cit ies of Fair f ield and Vacavi l le NBR Wind Turbine Feasibi l i ty Study
Debenham Energy, LLC 56
CONFIDENTIAL INFORMATION SUBJECT TO A NONDISCLOSURE AGREEMENT
Considerations for Public Viewing and Public Information for the Wind Turbine Siting a utility scale wind turbine in a public setting presents an opportunity to provide an enhanced visitor experience. Wind turbines are fascinating to watch and can provide a significant positive promotional benefit. The proposed site has plenty of room for visitor parking, wind turbine viewing, and for an informative display showcasing the Cities of Fairfield and Vacaville’s commitment to renewable, sustainable, clean sources of energy. A simple kiosk and a few picnic tables can meet all of these goals economically. Debenham Energy, LLC can provide examples of successful wind turbine public information displays.
Aerial Photography and Turbine Rendering Professional displays inside the facility building will draw the attention of the public. This can include artistic rendering:
Photography - From the air or on the ground.
Photo Simulation - From a photo of your existing site, build a 3D model, then composite the model or use a second photo to create photo-realistic renderings of your project.
3D Animation & Modeling - 3D computer objects that bring the design into real world space
One local provider of these services is Morgan Tech: www.Morgantech.com (see Attachment L).

Cit ies of Fair f ield and Vacavi l le NBR Wind Turbine Feasibi l i ty Study
Debenham Energy, LLC 57
CONFIDENTIAL INFORMATION SUBJECT TO A NONDISCLOSURE AGREEMENT
Color Schemes
As the photo shows, you can customize the design of the wind turbine. The standard color for the towers and blades is white, however, you have the option create designs and color schemes that either blend in with the colors of the local landscape, or stand out and become part of the architecture and cultural heritage of your facility. The price for painting the turbine is about $20,000. Not all manufacturers provide this option. The blades should be a lighter color to minimize the impact of ultraviolet light on the paint and blades.
Press Releases For many people, wind turbines are new and interesting and this project will attract the attention of many people, local and beyond. There is curiosity and interest in wind turbines now that they are more accepted. The Cities of Fairfield and Vacaville can use this opportunity to bring additional recognition by inviting people to come out and watch the turbine installation [video link] (from a safe distance, of course).
Interactive Informational/Educational Flat Screen Display With the recent cost reduction for flat screens and communications technologies, a high quality display in a prominent location such as the City Hall entryway is very viable. This display could show real time and summary data including equivalent tons of CO2 generation avoided, cars not driven or trees planted. This is also an opportunity to involve local groups or schools in the development of this display as the software development tools are the same as a website. A real time video of the turbine and other options are viable and increasingly economical. We can provide additional information upon request.

Cit ies of Fair f ield and Vacavi l le NBR Wind Turbine Feasibi l i ty Study
Debenham Energy, LLC 58
CONFIDENTIAL INFORMATION SUBJECT TO A NONDISCLOSURE AGREEMENT
10. Recommendations and Next Steps Provide recommendations and a list of next steps
Recommendations The Cities of Fairfield and Vacaville should decide on the financial criteria needed to proceed with this project and promptly provide a Letter of Intent to the preferred turbine supplier. A conference call with the meteorologist should be held to better understand the accuracy of the long term wind resource estimate and the overall economics. This should be followed by submitting a signed contract to the preferred turbine supplier.
Next Steps There appear to be no major technical or environmental constraints preventing the installation and operation of this project. Itemized list of next steps:
1. Meeting. Meeting(s) to discuss Feasibility Study Report
2. FAA/DOD Height Issue. Start dialogue with Travis AFB to understand their constraints and decision making process and to explain NRB turbine height, rotor diameter and location options. The FAA initial finding of Hazard to Navigation is provided as Attachment F
3. Wind Measurement Tower. Installation of Meteorological Tower (MET) for wind measurement.
4. PG&E. Obtain access to PG&E on-line facility usage data to obtain hourly consumption data. Review of tariff analysis by the utility to confirm energy rate used in the financial projections. Discuss SGIP wind funding expectations over the next 6-12 month.
5. Net Energy Metering (NEM) size limit. Provide support for a change to the Net Metering size limit from 1 MW to 5 MW to account for the realities in the current wind turbine market, the size of your load and the benefits to the ratepayers and society.
6. Aerial Photographs. Aerial photographs with superimposed wind turbines of different sizes and locations. See Attachment L for additional details.
7. Economic Analysis/Justification. Cities of Fairfield and Vacaville to agree on economic assumptions and determine economic criteria required for the project to be viable

Cit ies of Fair f ield and Vacavi l le NBR Wind Turbine Feasibi l i ty Study
Debenham Energy, LLC 59
CONFIDENTIAL INFORMATION SUBJECT TO A NONDISCLOSURE AGREEMENT
8. Wind Resource. Complete wind resource assessment including conference call with the meteorologist.
9. Turbine Supply. Evaluate potential turbine suppliers and discuss turbine availability.
10. Permits. File building permit application after determination authorities with jurisdiction. and all permit requirements.
11. State Incentive Application. Submit the Self Generation Incentive Program (SGIP) application to PG&E including the electrical design. The turbine must be installed within 24 months of application acceptance.
12. Contract Method. Decide on Contracting method, either
i. Turnkey EPC Contract.
ii. Project Management by Cities of Fairfield and Vacaville
13. Financing. Evaluate ownership and financing options including:
i. Lease type financing (minimum of 5 years to obtain tax benefits of 5 year accelerated depreciation)
ii. Power Purchase Agreement (See Attachment J)
iii. Renewable Energy Credit Sales (See Section 8)
14. State Incentive Documentation. Submit SGIP Proof of Project Advancement documentation (required 240 days after initial application acceptance).
15. Implementation. Proceed with design, engineering and construction following consultation with civil and electrical engineers and crane operators on final site selection. Evaluate and select maintenance provider.
16. Commencement of Operations. Installation, commissioning and verification. After electrical interconnection (per Rule 21) submit SGIP Incentive Claim application.
17. Receive SGIP Check (about 30 days after verification)

Cit ies of Fair f ield and Vacavi l le NBR Wind Turbine Feasibi l i ty Study
Debenham Energy, LLC 60
CONFIDENTIAL INFORMATION SUBJECT TO A NONDISCLOSURE AGREEMENT
List of Attachments Attachment A: Facility Electrical Drawings
Attachment B: PG&E E20 Rate Tariffs and Average Energy Cost Calculations
Attachment C: Understanding Net Metering
Attachment D: Predicted Turbine Performance
Attachment E: Permitting for Success
Attachment F: FAA 7460-1 (Notice of Hazard to Navigation
Attachment G: Draft SGIP 2007 Reservation Form
Attachment H: Fuhrländer Technical Data & Installation Summary
Attachment I: AWE Direct Wind 900 KW Turbine Brochure
Attachment J: Contracting and Ownership Options
Attachment K: California Debates RECs
Attachment L: MorganTech Aerial Photography
Attachment M: Scott Debenham Curriculum Vitae
Attachment N: Meteorologist Resume

Attachment A Page 1Attachment A

Attachment A Page 2
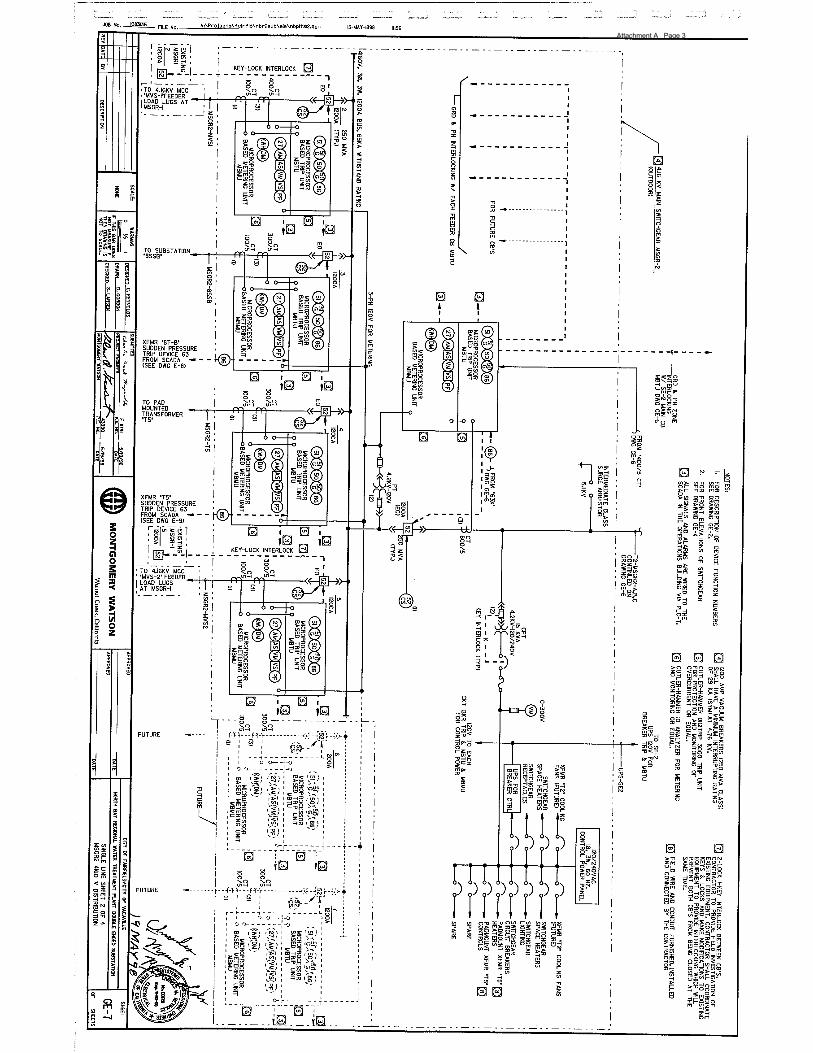
Attachment A Page 3

Attachment A Page 4
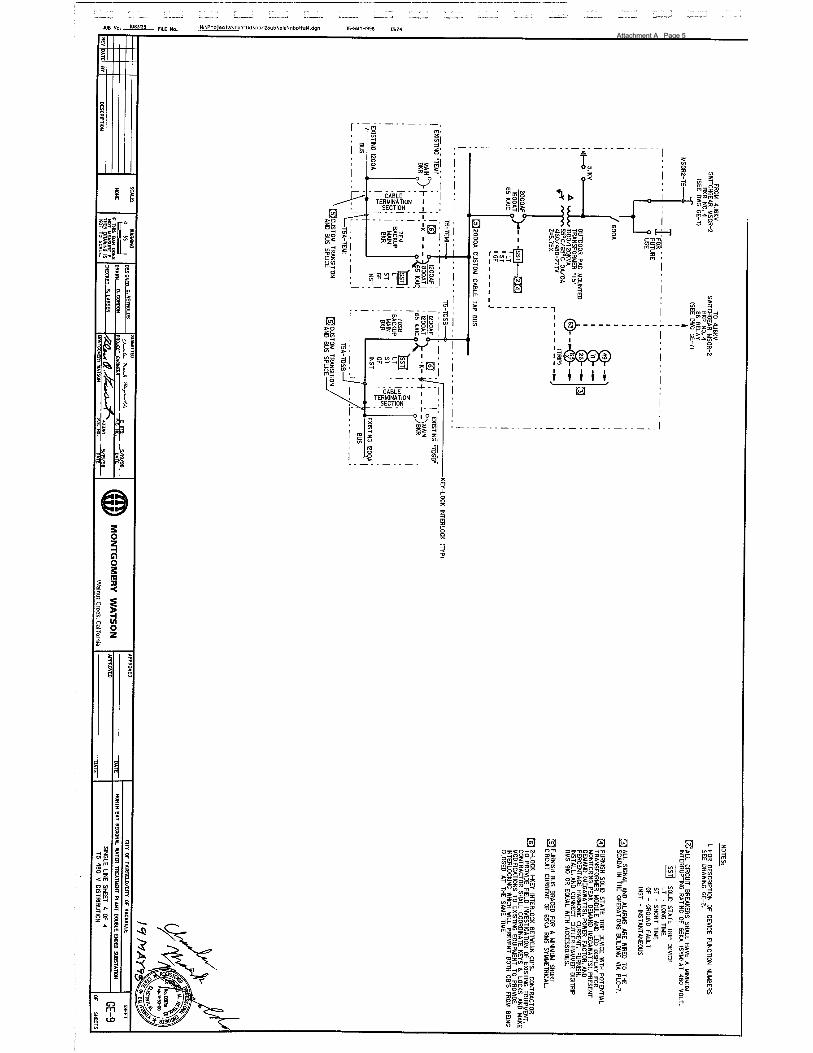
Attachment A Page 5

Pacific Gas and Electric C
ompany
Industrial/General Service Electric R
ates at a Glance (E20 S, P, and T and E-N
F Nonfirm
)For Services > 1,000 kW
Dem
and
Rates E
ffective: January 1, 2007, to P
resent
Rate Schedule
Custom
erC
hargeSeason
Time-of-U
sePeriod
Dem
and Charges
(per kW)
Energy Charges
(per kWh)
Average R
ate Lim
iter 4/
(per kWh)
UFR
Credit 1/
(per kWh)
"Average"
Total Rate
2/
(per kWh)
Max P
eak$15.49
$0.13266P
art-Peak
$3.51 $0.09556
Off-P
eak-
$0.06740M
aximum
$6.88 -
Part-P
eak$2.14
$0.08763 O
ff-Peak
-$0.07080
--
Maxim
um$6.88
-M
ax Peak
$11.98 $0.12430
Part-P
eak$2.75
$0.09216 O
ff-Peak
-$0.06559
Maxim
um$4.57
-P
art-Peak
$0.83 $0.08300
Off-P
eak-
$0.06865 -
-M
aximum
$4.57 -
Max P
eak$9.70
$0.08134 P
art-Peak
$2.11 $0.07380
Off-P
eak-
$0.05632 M
aximum
$2.63 -
Part-P
eak$0.00
$0.07064 O
ff-Peak
-$0.05890
--
Maxim
um$2.63
-
Rate Schedule
Non-Firm
Custom
erC
hargeSeason
Time-of-U
sePeriod
Non-Firm
Dem
and C
harge Credits
(per kW)
Non-Firm
Energy C
harge Credits
(per kWh)
UFR
Credit 1/
(per kWh)
Max P
eak$7.50
$0.01247 ($0.00091)
Part-P
eak$0.50
$0.00132 ($0.00091)
Off-P
eak-
$0.00132 ($0.00091)
Maxim
um-
-P
art-Peak
$0.50 $0.00132
($0.00091)O
ff-Peak
-$0.00132
($0.00091)M
aximum
--
-
1/Applicable only to Interruptible service, see tariff for full description of C
urtailable and Interruptible service option. To obtain Curtailable service rates, rem
ove the UFR
credit from the
'Energy C
harges' column.
2/Based on estim
ated forecast. Average rates provided only for general reference, and individual custom
er's average rate will depend on its applicable kW
, kWh, and TO
U data.
3/Noncom
pliance Penalty (per kW
h per event) = $8.40 and for customers w
ho fully complied w
ith previous year's operations = $4.20. Nonfirm
enrollment is closed to existing
customers, but open to qualifying new
customers and new
load for existing customers. S
ee tariff for further details.4/E
ffective May 1, 2006, the sum
mer peak rate lim
iter was elim
inated, and the summ
er average rate limiter applies to total dem
and and energy charges, excluding customer charges,
rather than only the "frozen" portion of energy charges. In addition, the power factor adjustm
ent is revised from 0.06 percent of billed revenues based on "frozen" energy charges
to a rate per kWh of $0.00005 for every one percentage point deviation from
an 85 percent power factor.
Note:Sum
mer S
eason: May-O
ctoberW
inter Season: N
ovember-A
prilThis table provided for com
parative purposes only. See current tariffs for full information regarding rates, application, eligibility and additional options.
E20Secondary
Firm
E20Prim
aryFirm
$19.71253 per day
$26.28337 per day
$35.26768 per day
$6.24230 per
meter per day;
$6.57084 per
meter per day w
ith U
FR
$0.08047
Summ
er-
Summ
er
$0.12628
$0.10694
Winter
Summ
er
Winter
Summ
er
Winter
E20Transm
issionFirm
E-NF
Non-Firm
Service3/
-
$0.20614
$0.20614
--
--
Winter
Attachment B Page 1Attachment B
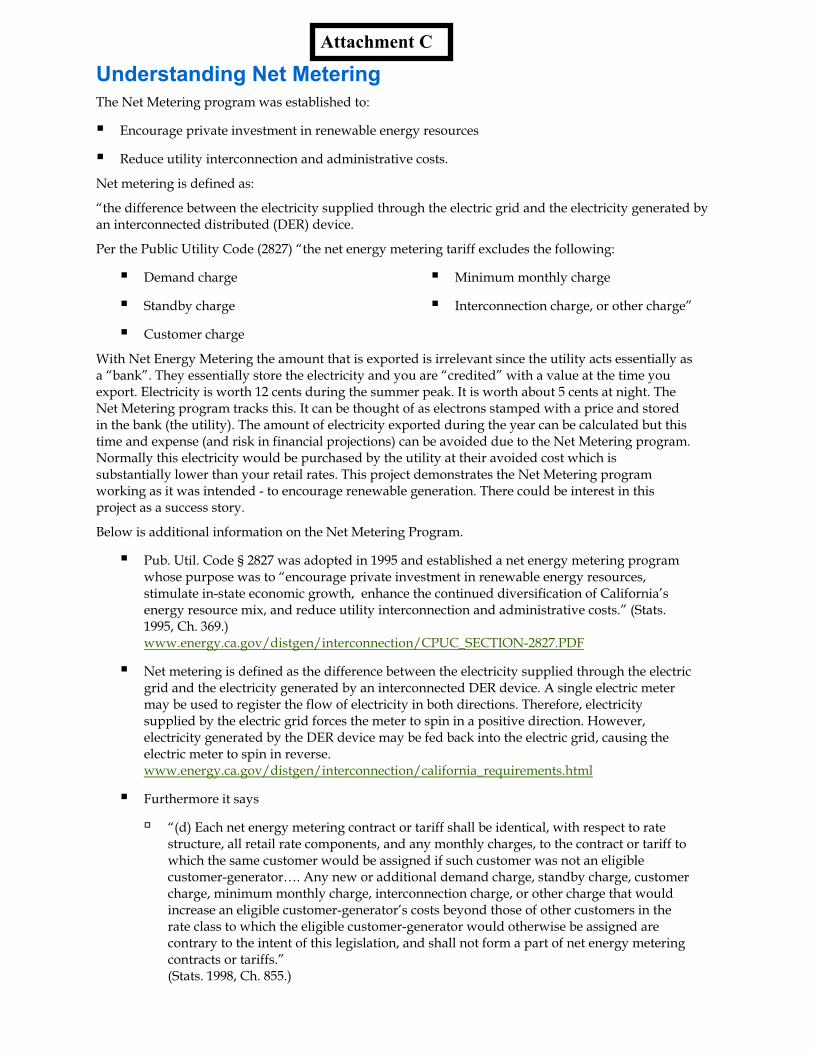
Understanding Net Metering The Net Metering program was established to:
Encourage private investment in renewable energy resources
Reduce utility interconnection and administrative costs.
Net metering is defined as:
“the difference between the electricity supplied through the electric grid and the electricity generated by an interconnected distributed (DER) device.
Per the Public Utility Code (2827) “the net energy metering tariff excludes the following:
Demand charge
Standby charge
Customer charge
Minimum monthly charge
Interconnection charge, or other charge”
With Net Energy Metering the amount that is exported is irrelevant since the utility acts essentially as a “bank”. They essentially store the electricity and you are “credited” with a value at the time you export. Electricity is worth 12 cents during the summer peak. It is worth about 5 cents at night. The Net Metering program tracks this. It can be thought of as electrons stamped with a price and stored in the bank (the utility). The amount of electricity exported during the year can be calculated but this time and expense (and risk in financial projections) can be avoided due to the Net Metering program. Normally this electricity would be purchased by the utility at their avoided cost which is substantially lower than your retail rates. This project demonstrates the Net Metering program working as it was intended - to encourage renewable generation. There could be interest in this project as a success story.
Below is additional information on the Net Metering Program.
Pub. Util. Code § 2827 was adopted in 1995 and established a net energy metering program whose purpose was to “encourage private investment in renewable energy resources, stimulate in-state economic growth, enhance the continued diversification of California’s energy resource mix, and reduce utility interconnection and administrative costs.” (Stats. 1995, Ch. 369.) www.energy.ca.gov/distgen/interconnection/CPUC_SECTION-2827.PDF
Net metering is defined as the difference between the electricity supplied through the electric grid and the electricity generated by an interconnected DER device. A single electric meter may be used to register the flow of electricity in both directions. Therefore, electricity supplied by the electric grid forces the meter to spin in a positive direction. However, electricity generated by the DER device may be fed back into the electric grid, causing the electric meter to spin in reverse. www.energy.ca.gov/distgen/interconnection/california_requirements.html
Furthermore it says
“(d) Each net energy metering contract or tariff shall be identical, with respect to rate structure, all retail rate components, and any monthly charges, to the contract or tariff to which the same customer would be assigned if such customer was not an eligible customer-generator…. Any new or additional demand charge, standby charge, customer charge, minimum monthly charge, interconnection charge, or other charge that would increase an eligible customer-generator’s costs beyond those of other customers in the rate class to which the eligible customer-generator would otherwise be assigned are contrary to the intent of this legislation, and shall not form a part of net energy metering contracts or tariffs.” (Stats. 1998, Ch. 855.)
Attachment C

Prepared For: North Bay Regional Water TreatmentSite Location: Fairfield, CAData Source: AWS True Wind
Inputs: Results:Ave. Wind (m/s) = 6.50 Hub Average Wind Speed (m/s) = 6.50
Weibull K = 2 Air Density Factor = 0.0%Site Altitude (m) = 0 Average Output Power (kW) = 193.20Wind Shear Exp. = 0.143 Daily Energy Output (kWh) = 4636.9
Anem. Height (m) = 50 Annual Energy Output (kWh) = 1,692,457Tower Height (m) = 50 Monthly Energy Output = 141,038
Turbulence Factor = 0.0% Percent Operating Time = 79.5%
Weibull Performance CalculationsWind Speed Bin (m/s) Power (kW) Wind Probability (f) Net kW @ V
1 0.00 3.68% 0.0002 0.00 6.96% 0.0003 7.00 9.50% 0.6654 14.00 11.11% 1.5565 55.60 11.73% 6.5236 107.40 11.46% 12.3037 176.10 10.47% 18.4458 268.60 9.04% 24.2719 380.80 7.39% 28.146
10 481.10 5.75% 27.67011 550.60 4.27% 23.49712 590.00 3.02% 17.84613 610.00 2.05% 12.50914 615.00 1.33% 8.18715 615.00 0.83% 5.09316 615.00 0.49% 3.03817 615.00 0.28% 1.73918 615.00 0.16% 0.95519 615.00 0.08% 0.50420 615.00 0.04% 0.255
©2005 Lorax Energy Ltd Totals: 99.65% 193.203
InputsAverage Wind Speed: Use annual or monthly average wind speeds.Weibull K Factor: K=2 is used for inland sites, K=3 for coastal sites, K=4 for island sites and trade wind regimes.Site Altitude: In meters above sea Level.Wind Shear Exponent 1/7 or 0.143 is used for normal terrain, 0.167 for rough terrain, 0.110 for open water.Anemometer Height Is the sensor height at which the average wind speed was measured.Tower Height Is nominal hub height.Turbulence Factor: Is for derating for turbulence, wire run losses and other performance influencing factors.
ResultsHub Ave. Wind Speed Is corrected for wind shear and used to calculate the Weibull wind speed probability. Air Density Factor Is the reduction from sea level performance.Average Power Output Is the average 24-hour power produced, without the performance safety margin adjustment.Daily Energy Output Includes all deratings and is the primary performance parameter.Monthly Energy Output Is calculated from Daily Energy Output.Annual Energy Output Is calculated from Daily Energy Output.Percent Operating Time Is the time the wind turbine should be producing some power.
Use only with annual or monthly averages wind speeds to get proper long term Weibull distribution curve calculations.
WindCad Turbine Performance ModelFuhrlaender FL 600 Wind Turbine, 50 m rotor diameter
600 kW
WeibullCurve
PowerCurve
Annual output accounting for electrical and turbulence losses and lower density due to higher
elevation
Attachment D

WindCad Turbine Performance Model
Prepared For: North Bay Regional Water TreatmentSite Location: Fairfield, CAData Source: AWS True Wind
Inputs: Results:Ave. Wind (m/s) = 6.50 Hub Average Wind Speed (m/s) = 6.50
Weibull K = 2 Air Density Factor = 0%Site Altitude (m) = 0 Average Output Power (kW) = 228.37Wind Shear Exp. = 0.143 Daily Energy Output (kWh) = 5480.9
Anem. Height (m) = 50 Annual Energy Output (kWh) = 2,000,527Tower Height (m) = 50 Monthly Energy Output = 166,711
Turbulence Factor = 0% Percent Operating Time = 79.5%
Weibull Performance CalculationsWind Speed Bin (m/s) Power (kW) Wind Probability (f) Net kW @ V
1 0.00 3.68% 0.0002 0.00 6.96% 0.0003 8.00 9.50% 0.7604 29.00 11.11% 3.2225 65.00 11.73% 7.6266 118.00 11.46% 13.5187 190.00 10.47% 19.9018 283.00 9.04% 25.5729 398.00 7.39% 29.417
10 522.00 5.75% 30.02211 682.00 4.27% 29.10512 775.00 3.02% 23.44213 840.00 2.05% 17.22614 875.00 1.33% 11.64815 895.00 0.83% 7.41216 900.00 0.49% 4.44617 900.00 0.28% 2.54418 900.00 0.16% 1.39819 900.00 0.08% 0.73720 900.00 0.04% 0.374
©2004 Lorax Energy Ltd Totals: 99.65% 228.371
InputsAverage Wind Speed: Use annual or monthly average wind speeds.Weibull K Factor: K=2 is used for inland sites, K=3 for coastal sites, K=4 for island sites and trade wind regimes.Site Altitude: In meters above sea Level.Wind Shear Exponent 1/7 or 0.143 is used for normal terrain, 0.167 for rough terrain, 0.110 for open water.Anemometer Height Is the sensor height at which the average wind speed was measured.Tower Height Is nominal hub height.Turbulence Factor: Is for derating for turbulence, wire run losses and other performance influencing factors.
ResultsHub Ave. Wind Speed Is corrected for wind shear and used to calculate the Weibull wind speed probability. Air Density Factor Is the reduction from sea level performance.Average Power Output Is the average 24-hour power produced, without the performance safety margin adjustment.Daily Energy Output Includes all deratings and is the primary performance parameter.Monthly Energy Output Is calculated from Daily Energy Output.Annual Energy Output Is calculated from Daily Energy Output.Percent Operating Time Is the time the wind turbine should be producing some power.
Use only with annual or monthly averages wind speeds to get proper long term Weibull distribution curve calculations.
AWE 900 Wind Turbine, 54 m rotor diameter
Weibull Calculations:Wind speed probability is calculated as a Weibull curve defined by the average wind speed and a shape factor, K. To facilitate piece-wise integration, the wind speed range is broken down into "bins" of 1 m/s in width (Column 1). For each wind speed bin, instantaneous wind turbine power (W, Column 2)) is multiplied by the Weibull wind speed probability (f, Column 3). This cross product (Net W, Column 4) is the contribution to average turbine power output contributed by wind speeds in that bin. The sum of these contributions is the average power output of the turbine on a continuous, 24 hour, basis.Best results are achieved using annual or monthly average wind speeds. Use of daily or hourly average speeds is not recommended.
900 kW

WindCad Turbine Performance ModelFuhrlaender FL 2.5 Wind Turbine, 90 m rotor diameter
Prepared For: North Bay Regional Water TreatmentSite Location: Fairfield, CAData Source: AWS True Wind
Inputs: Results:Ave. Wind (m/s) = 6.50 Hub Average Wind Speed (m/s) = 6.95
Weibull K = 2 Air Density Factor = 0%Site Altitude (m) = 0 Average Output Power (kW) = 784.25Wind Shear Exp. = 0.143 Daily Energy Output (kWh) = 18822.1
Anem. Height (m) = 50 Annual Energy Output (kWh) = 6,870,071Tower Height (m) = 80 Monthly Energy Output = 572,506
Turbulence Factor = 0% Percent Operating Time = 81.8%
Weibull Performance CalculationsWind Speed Bin (m/s) Power (kW) Wind Probability (f) Net kW @ V
1 0.00 3.22% 0.0002 0.00 6.14% 0.0003 0.00 8.49% 0.0004 37.60 10.09% 3.7935 160.40 10.88% 17.4516 333.30 10.90% 36.3367 559.20 10.28% 57.4768 869.40 9.19% 79.8669 1260.00 7.82% 98.550
10 1678.30 6.37% 106.82511 2113.80 4.96% 104.90112 2411.80 3.71% 89.56413 2500.00 2.67% 66.76414 2500.00 1.85% 46.18915 2500.00 1.23% 30.76716 2500.00 0.79% 19.74517 2500.00 0.49% 12.21518 2500.00 0.29% 7.28719 2500.00 0.17% 4.19520 2500.00 0.09% 2.330
©2004 Lorax Energy Ltd Totals: 99.63% 784.255
InputsAverage Wind Speed: Use annual or monthly average wind speeds.Weibull K Factor: K=2 is used for inland sites, K=3 for coastal sites, K=4 for island sites and trade wind regimes.Site Altitude: In meters above sea Level.Wind Shear Exponent 1/7 or 0.143 is used for normal terrain, 0.167 for rough terrain, 0.110 for open water.Anemometer Height Is the sensor height at which the average wind speed was measured.Tower Height Is nominal hub height.Turbulence Factor: Is for derating for turbulence, wire run losses and other performance influencing factors.
ResultsHub Ave. Wind Speed Is corrected for wind shear and used to calculate the Weibull wind speed probability. Air Density Factor Is the reduction from sea level performance.Average Power Output Is the average 24-hour power produced, without the performance safety margin adjustment.Daily Energy Output Includes all deratings and is the primary performance parameter.Monthly Energy Output Is calculated from Daily Energy Output.Annual Energy Output Is calculated from Daily Energy Output.Percent Operating Time Is the time the wind turbine should be producing some power.
Use only with annual or monthly averages wind speeds to get proper long term Weibull distribution curve calculations.
Weibull Calculations:Wind speed probability is calculated as a Weibull curve defined by the average wind speed and a shape factor, K. To facilitate piece-wise integration, the wind speed range is broken down into "bins" of 1 m/s in width (Column 1). For each wind speed bin, instantaneous wind turbine power (W, Column 2)) is multiplied by the Weibull wind speed probability (f, Column 3). This cross product (Net W, Column 4) is the contribution to average turbine power output contributed by wind speeds in that bin. The sum of these contributions is the average power output of the turbine on a continuous, 24 hour, basis.Best results are achieved using annual or monthly average wind speeds. Use of daily or hourly average speeds is not recommended.
2.5 MW

Permitting for Success
Level of Opposition It will be hard to judge the potential level of opposition or your opponent’s effectiveness until you get close to the hearing date, and learn what they have prepared to introduce into the record. This will be evident from the letters of objection sent to the Zoning Board of Appeals. Therefore it is fundamental that you properly prepare for the hearings to insure for the best success. Even though many conservationists and environmentalists support wind power in general, they are sometimes quick to abandon their position when they find one or more very large wind turbines will be located in their back yard. As a veteran of many on-site wind turbine projects, I have had a chance to study the opposition to these projects. A presentation titled “Getting Past NIMBY; Wind Power: Translating Lessons Learned into Success Stories" can be helpful.
Perceived Project Impacts We all know what the impacts are: visual, noise, health and public safety, wildlife… The challenge will be for you to come up with benefits to the community which will outweigh the impacts of one or two 240’ towers which will be quite literally be “in the face” of people who will not perceive any benefit…
This would be a bit easier if the wind turbines were a “Community Project” at a local water treatment plant or the local high school because the energy cost savings would accrue directly to all the local tax payers and have a measurable benefit to all… For private for-profit corporations, the direct benefits of putting one or more wind turbines at a facility will go to the company… finding measurable benefits to the community will be difficult unless you are willing to come up with something real you can offer to the community which will offset this project’s significant impact.
Taking Command of the Process Successful projects don’t just happen. To get your permits, you have to have community support. To get a successful outcome, on-site wind power advocates need to be proactive about getting the community support required for a successful outcome. Here are a few steps required to take command of this process:
In siting the wind turbines, identify sensitive neighborhoods and site the machines to provide at least 1000’ buffer from residential neighbors for visual, noise and safety impacts.
Once the wind turbines have been sited, and the affected neighbors are identified, you must be proactive about contacting the abutters and inviting these people to informal meetings to discuss the project.
Invite supporters (especially abutters) as well at these meetings… they are more likely than you to convince their neighbors that they can live with this wind turbine.
1
Attachment E

Permitting for Success
Have good materials to hand out which accurately and positively describes the project. Nice photos, drawings, a carefully prepared fact sheet as a guide can all help describe the project in a positive light.
Be sensitive to their concerns. They will not be as enthusiastic about this as you are, especially if they do not perceive any benefits. Demonstrate your concern, you may have to move the wind turbines if it becomes clear that the proposed site will generate real opposition.
You must take command of the information which is printed in the local press. A negative headline can be devastating to the project at this point…. Send out a positive press release; invite reporters to visit the site. Offer interviews. Give them the names of supporters to interview.
Get supporters of the project to start writing positive letters about the project to the editor. You can’t get enough of these…. You may want to hand out a fact sheet with some bullet points which the writers can convey to the editor in their own words.
Start a project Web page. Put information on the wind turbine there, helpful links to other sites which will give the viewer additional positive information. Publish your facts and photos in a concise accurate form.
Gather intelligence on the project opposition. Move quickly to debunk myths and misinformation which will be disseminated by others about this project…. (like a rumor, which may already be out there, that you want to add 10 more wind turbines if the first are successful……)
Remember there are people who are going to oppose this project no matter what you do….
With respect to the public hearing You have to come well prepared and be ready to offer expert testimony to answer any questions which may be asked by either the members of the board or any other interested party. In addition to a facility manager providing the introduction to the project and the reasons you want to pursue it, at the minimum I recommend that you engage:
1. A Land Use Expert to testify that the variance and special use permit application meets the criteria for the granting of these. This person will testify that the wind turbine is an appropriate use for this zone and that it will not impact neighboring property values. Use a respected local professional
2. A Structural Engineer who will review the plans, do the load calculations and testify that the wind turbine is SAFE and is not a health and public safety risk. Any Structural Engineer who will speak positively about this will be fine…. Make sure ahead of time that they will say the right words with enough conviction…. this is important…
2

Permitting for Success
3. A Wind Turbine Operations Expert who will be able to answer questions about the general operation of the wind turbine. This will cover maintenance, noise, general questions about the operation of this machine including ice shedding, distraction to drivers etc. This witness can also place into the record the noise measurements expected at the property lines based on the measured noise emission curves from the wind turbine. Include some good exhibits on wind turbine noise, ice shedding, and blade shadow flicker.
4. A Biologist or wild life expert who can testify that this wind turbine will not have significant impact on the local flora or fauna. This is important…the opposition will try to draw on the horror stories in the press, and it is important that you have an expert on board to answer their questions.
Community Support I do not have to tell you that you need as much community support as possible…. You have to pull out all the stops to get the mayor, city manager, and individual county board members or city council members on board. Other ways to get additional community support include:
Offer to share the wind turbine operating data with nearby local high school so they can get some ownership in this project. You may want to contact their science or environmental science departments and offer this in exchange for support at the hearing.
Offer to give the local community the value of the excess energy you generate for community improvement. If there is a significant opposition to this project, you may have to offer something tangible like this to mitigate the impacts and negate the opposition.
Community Pride One angle which has been helpful for other projects is to emphasize the facility’s environmental awareness by having your employees stage an “EARTH DAY” type celebration at the prospective wind turbine site with a cookout and local music. Even though Earth Day is in April, you can come up with a slogan like “Every day will be Earth Day at our facility”. Other on-site wind turbine projects were able to get community awareness by inviting local school kids do “earth day” paintings of wind turbines which will grace their class rooms at the local schools and maybe win a prize at your Earth Day Celebration. We did this at one of our hearings and even got the local bank to give out savings bonds as prizes. It really worked well.
3

Permitting for Success
Zoning Board Letters to the Zoning Board in support of this project are essential! When it gets close to the time for the public hearing, your company must get your abutters and anyone else to write a letter in support of this project. I guarantee that there will be letters in opposition… you MUST counter these 10 to 1 with letters of support if you are to prevail. Additional letters of support from the various RI Sustainable Energy, or Clean Energy organizations (especially from the State Energy Office) will be a big help.
Hearing Date On the date of the hearing you must pack the room with supporters. Even if your supporters do not choose to speak in favor of the project, the board will watch the reaction of the public present at the hearing, to the testimony provided, and can read their body language… If the room is full of supporters it will really help the board make its decision. The bottom line is that at the hearings, the Zoning Board Members will have to weigh the benefits versus the impacts of this project and ask: Why have you picked this facility to install this (huge) wind system? Can it be put at another facility? Exactly what are the benefits to the community in placing it here? You will not only need good answers to these questions but a significant block of support from your abutters and the rest of the community at large to get a favorable decision from the board, especially in the face of serious opposition.
Hopefully this process will go well, and other wind turbines recently erected in the area may help to break the ice. If a group decides to oppose this project and they come to the hearing with their own experts to testify against the project, it will make the Board’s job much more difficult.
Remember, variances and special use permits are not a RIGHT… they do not have to grant you this permit, and especially if there is significant opposition to the project they may decide not to. Our job is to design a public outreach program to get the necessary community support to insure that this prospective application a winner.
Permitting for Success by Henry du Pont of Lorax Energy Systems
http://www.lorax-energy.com
4


Page 1
11317 Valle Vista RdDebenham Energy LLCScott Debenham
** NOTICE OF PRESUMED HAZARD **
The Federal Aviation Administration has conducted an aeronautical study underthe provisions of 49 U.S.C., Section 44718 and if applicable Title 14 of theCode of Federal Regulations, part 77, concerning:
Structure:Location:Latitude:Longitude:Heights:
Aeronautical Study No.Federal Aviation Administration2007-AWP-297-OEAir Traffic Airspace Branch, ASW-520
Fort Worth, TX 76137-0520
lakeside, CA 92040
2601 Meacham Blvd.
Issued Date: 02/27/2007
Initial findings of this study indicated that the structure as described exceedsobstruction standards and/or would have an adverse physical or electromagneticinterference effect upon navigable airspace or air navigation facilities.Pending resolution of the issues described below, the structure is presumed tobe a hazard to air navigation.
NOTE: PENDING RESOLUTION OF THE ISSUE(S) DESCRIBED ABOVE, THE STRUCTURE ISPRESUMED TO BE A HAZARD TO AIR NAVIGATION. THIS LETTER DOES NOT AUTHORIZECONSTRUCTION OF THE STRUCTURE EVEN AT A REDUCED HEIGHT. ANY RESOLUTION OF THEISSUE(S) DESCRIBED ABOVE MUST BE COMMUNICATED TO THE FAA SO THAT A FAVORABLEDETERMINATION CAN SUBSEQUENTLY BE ISSUED.
If the structure were reduced in height so as not to exceed 0 feet aboveground level (90 feet above mean sea level), it would not exceed obstructionstandards and a favorable determination could subsequently be issued.
Any height exceeding 0 feet above ground level (90 feet above mean sealevel), will result in a substantial adverse effect and would warrant aDetermination of Hazard to Air Navigation.
See attachment for additional information.
The study revealed that the potential for electromagnetic interferenceexists. See attached page(s) for further information.
IF MORE THAN 60 DAYS FROM THE DATE OF THIS LETTER HAS ELAPSED WITHOUT ATTEMPTEDRESOLUTION, IT WILL BE NECESSARY FOR YOU TO REACTIVATE THE STUDY BY FILING A NEWFAA FORM 7460-1, NOTICE OF PROPOSED CONSTRUCTION OR ALTERATION.
Fairfield, CA
121-57-55.83 W335 feet above ground level (AGL)
38-17-58.64 N NAD 83
Wind Turbine #1
425 feet above mean sea level (AMSL)
Attachment F

Reservation Number:
1. Host Customer Information 2. Applicant (if not Host Customer)
Gov't/Company NameContact Name
Tax Payer IDMailing Address
Parent CompanyPhoneEmail
System OwnerIf not Host Customer
YesNo
3. Project Site InformationSite Address kW
County -
Utility Information Name Meter #Electric PG&E +
Gas PG&E =
4. Proposed Self-Generation System InformationTechnology Type
SGIP Level 2 $/watt $1.50 Yes
Generating System Information Wind Systems Only (if applicable)Manufacturer Inverter Manufacturer
Model Number Inverter Model NumberPower Rating watts/unit Number of Units
Number of Units Inverter Efficiency %Total System Output (AC) watts
5. Project Incentive Calculation and Cost InformationAttach completed 2007 SGIP Incentive Calculation Worksheet and transfer amounts to spaces below.
Total Eligible Project CostEligible Project Cost, $/watt $/watt
Other Funding Source(s): $ Amount $/watt1.2.
Total Other Incentives:
Unadjusted SGIP Incentive $/watt SGIP $/watt incentive amount -- see SGIP website for current amount.Total Other Incentives $/watt From section a) aboveAdjusted SGIP Incentive $/watt From Line 6e of Incentive Calculation Worksheet
Is this Host Customer a Public Entity, as defined by the SGIP Program Handbook (check one)?
Solano
5110 Waterworks Lane
DRO Program Name
Rick WoodWill Follow5110 Waterworks Lane Fairfield, California 94533
(707) 428-7481
Interruptible/Demand Reduction Obligation (DRO)
North Bay Regional Water Treatment Plant
Self-Generation Incentive Program
Instructions: Please confirm you are using the most recent Reservation Request Form by verifying the revision date above, and going to your Program Administrator's website to verify . Please refer to your SGIP Program Handbook for instructions, and please include all required attachments with your submittal. Incomplete Reservation Requests will be returned to the sender.
January 4, 2007 / Revision 1(Administrator Use Only)
2007 Reservation Request Form (Appendix A)
Estimated Future Added Demand Net Site Electric Load
Wind
Requested SGIP Incentive =
Hybrid
$1.50
$1.50
Fuel Type
$1,500,000
a) Other Incentives Information (only if applicable -- if none, leave blank )
b) Requested Self-Generation Incentive Program Incentive Amount
North Bay Regional Water Treatment Plant
Incentive Name
Maximum Site Electric Load
Account Number
Printed 4/9/2007 1 of 2 2007_sgip_resreqform-r1_070104
Attachment G

Reservation Number:
Self-Generation Incentive Program
January 4, 2007 / Revision 1(Administrator Use Only)
2007 Reservation Request Form (Appendix A)
HOST CUSTOMER & SYSTEM OWNER AGREEMENT
[HOST CUSTOMER] [SYSTEM OWNER] (IF DIFFERENT THAN HOST CUSTOMER)
Signature: Signature:
Name Printed: Name Printed:
Title: Title:
Date: Date:
Overnight Mail Address Pacific Gas and Electric CompanySelf-Generation Incentive ProgramP.O. Box 770000Mail Code B27P
Regular Mail Address Pacific Gas and Electric CompanySelf-Generation Incentive Program77 Beale Street, B27PSan Francisco, CA 94105-1814
The undersigned agree that -A. Host Customer and System Ow ner agree to release the Program Administrator, its aff iliates, subsidiaries, current and future parent company, off icers, managers, directors, agents, and employees from all claims, demands, losses, damages, costs, expenses, and liability (legal, contractual, or otherw ise), w hich arise from or are in any w ay connected w ith any: (1) injury to or death of persons, including but not limited to employees of the Program Administrator, Host Customer, System Ow ner, or any third party; (2) injury to property or other interests of the Program Administrator, Host Customer, System Ow ner, or any third party; (3) violation of local, state, or federal common law , statute, or regulation, including but not limited to environmental law s or regulations; (4) generation system performance shortfall; so long as such injury, violation, or shortfall (as set forth in (1) - (4) above) arises from or is in any w ay connected w ith the Project, including Host Customer’s, System Ow ner's, or any third party’s performance or failure to perform w ith respect to the Project, how ever caused, regardless of any strict liability or negligence of the Program Administrator, its off icers, managers, or employees.B. Host Customer and System Ow ner understand that the Program Administrator’s review of the project described herein (Project) and authorization for SGIP funding shall not be construed as confirming or endorsing the qualif ications of the Applicant or any person(s) involved w ith the Project, including but not limited to the Project installer(s), designer(s), or manufacturer(s); endorsing the Project design; or as w arranting the economic value, safety, durability or reliability of the Project. The Host Customer is solely responsible for the Project, including selection of any designer(s), manufacturer(s), contractor(s), or installer(s). Host Customer and System Ow ner understand that they, and any third parties involved w ith the Project, are independent contractors and are not authorized to make any representations on behalf of the Program Administrator.C. The Host Customer and System Ow ner agree that either of them may w ithdraw from the Project for any reason by providing w ritten notice of such w ithdraw al to Program Administrator. In the event the Host Customer or System Ow ner so w ithdraw s, this Agreement w ill be cancelled and the Host Customer alone w ill retain sole rights to the incentive reservation and corresponding incentive reservation number assigned to this Reservation Request Form. To preserve such incentive reservation and corresponding reservation number, Host Customer must submit a new Reservation Request Form at the same time w ritten notif ication of w ithdraw al from the Project is provided to Program Administrator.. Host Customer understands that if all available funds are reserved for other Projects, the Host Customer cannot increase the originally reserved incentive amount. Host Customer also understands that submitting a new Reservation Request Form w ill not move or alter the Proof of Project Advancement Milestone Date provided by Program Administrator, if any. Host Customer further understands that if Host Customer fails to re-submit a Reservation Request Form at the time of Project w ithdraw al, this Application w ill be terminated in its entirety by Program Administrator and any previously reserved incentive funding w ill be released. In that instance, Host Customer must apply for a new incentive reservation should Host Customer still w ish to participate in the Program. D. The Host Customer and System Ow ner agree that the Program Administrator w ill have no role in resolving any disputes betw een them or any of the parties involved in the Project including but not limited to the Applicant, system designer, equipment supplier and/or installer.E. The Host Customer and System Ow ner have the authority to install the generating system at the Project Site, or have obtained the permission of the legal ow ner of the Project Site, to install the generating system.F. The Host Customer and System Ow ner understand that the Program Administrator requires inspections and measurements of the performance of the proposed generating system. The Host Customer and System Ow ner shall permit Program Administrator, its employees, contractors, and agents, during normal business hours, to: (a) install all necessary performance measurement equipment on the Project in order to enable Program Administrator to accomplish performance evaluations; and (b) demonstrate, inspect, monitor, and photograph the Project. This data and f ield measurement documentationis not for purposes of enforcement and shall not be released to outside parties, except as may be required by the California Public Utilities Commission (CPUC). The Host Customer and System Ow ner shall use their best efforts to accommodate the scheduling requirements of Program Administrator and its agents for all f ield measurements. G. The Host Customer and System Ow ner shall agree to allow all information provided as part of the reservation claim process to be entered into a statew ide database that w ill permit tracking of application for this and other incentive programs. Access to this database w ill be limited to Program Administrators and the CEC. H. The Host Customer and System Ow ner understand that other program rebates, grants, forgiven loans, f inancial incentives, post-installation agreements, Renew able Energy Credits (aka RECs, Green Credits, etc.), and performance payments are “other incentives” and must be disclosed in Section 5 of this application.I. The undersigned declare under penalty of perjury under the law s of the State of California that 1) the information provided in this form is true, accurate and complete, 2) the above described generating system is new and intended to offset part or all of the Host Customer’s electrical needs at the site of installation, 3) the Site of installation is located w ithin the Program Administrator’s service territory, 4) the self generating equipment is not intended to be used as a backup generator, and 5) the Host Customer and System Ow ner have received a copy of this completed form.
Total System Output: __________________ w attsInverter Rated Output (Wind Turbines only): __________________ w attsRequested Incentive Amount: $______________________________
The Host Customer and System Ow ner are committed to completing this Project, and by signing below , are stating their intent to contract w ith individual(s) necessary for completion of the Project.. The Host Customer is the reservation holder and reserves the right to submit new project specifications, including a new Applicant designation, upon w ithdraw al from the Project and cancellation of this Agreement, in accordance w ith Section C above.
Printed 4/9/2007 2 of 2 2007_sgip_resreqform-r1_070104
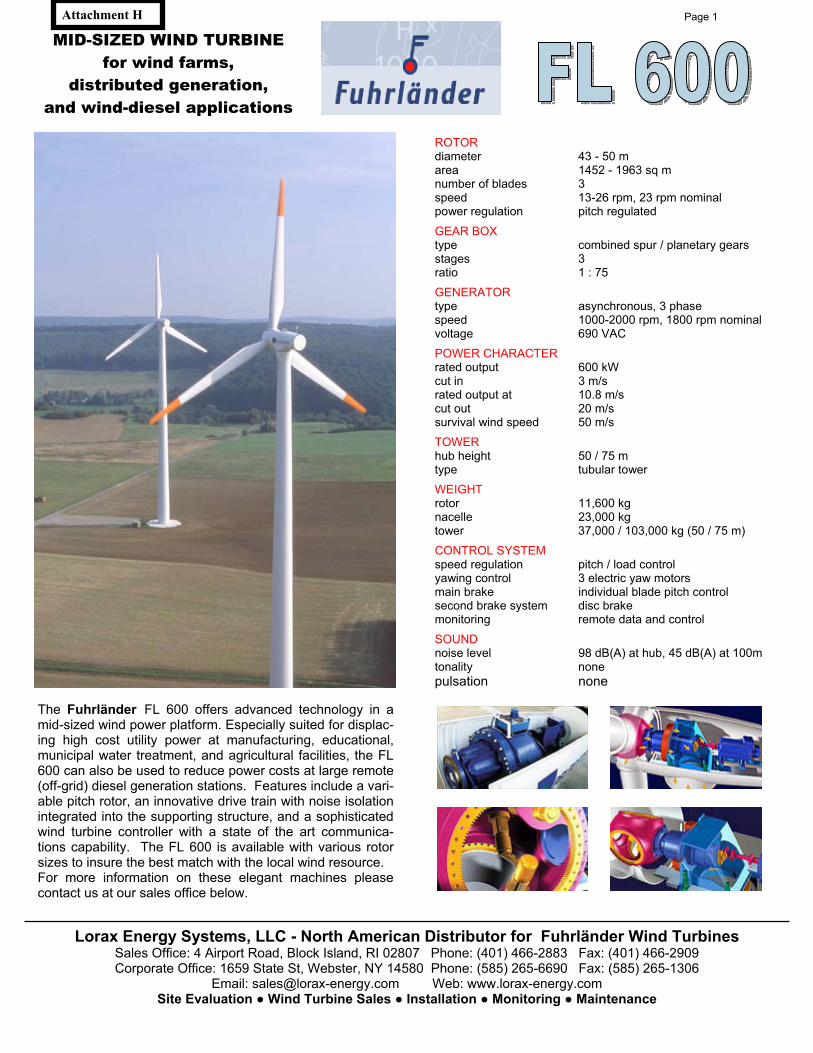
ROTORdiameter 43 - 50 m area 1452 - 1963 sq m number of blades 3 speed 13-26 rpm, 23 rpm nominal power regulation pitch regulated
GEAR BOX type combined spur / planetary gears stages 3 ratio 1 : 75 GENERATOR type asynchronous, 3 phase speed 1000-2000 rpm, 1800 rpm nominal voltage 690 VAC POWER CHARACTER rated output 600 kW cut in 3 m/s rated output at 10.8 m/s cut out 20 m/s survival wind speed 50 m/s TOWERhub height 50 / 75 m type tubular tower WEIGHT rotor 11,600 kg nacelle 23,000 kg tower 37,000 / 103,000 kg (50 / 75 m) CONTROL SYSTEM speed regulation pitch / load control yawing control 3 electric yaw motors main brake individual blade pitch control second brake system disc brake monitoring remote data and control
SOUNDnoise level 98 dB(A) at hub, 45 dB(A) at 100m tonality none pulsation none
The Fuhrländer FL 600 offers advanced technology in a mid-sized wind power platform. Especially suited for displac-ing high cost utility power at manufacturing, educational, municipal water treatment, and agricultural facilities, the FL 600 can also be used to reduce power costs at large remote (off-grid) diesel generation stations. Features include a vari-able pitch rotor, an innovative drive train with noise isolation integrated into the supporting structure, and a sophisticated wind turbine controller with a state of the art communica-tions capability. The FL 600 is available with various rotor sizes to insure the best match with the local wind resource. For more information on these elegant machines please contact us at our sales office below.
Lorax Energy Systems, LLC - North American Distributor for Fuhrländer Wind Turbines Sales Office: 4 Airport Road, Block Island, RI 02807 Phone: (401) 466-2883 Fax: (401) 466-2909 Corporate Office: 1659 State St, Webster, NY 14580 Phone: (585) 265-6690 Fax: (585) 265-1306
Email: [email protected] Web: www.lorax-energy.com Site Evaluation Wind Turbine Sales Installation Monitoring Maintenance
MID-SIZED WIND TURBINE for wind farms,
distributed generation, and wind-diesel applications
Attachment F Page 1Attachment H
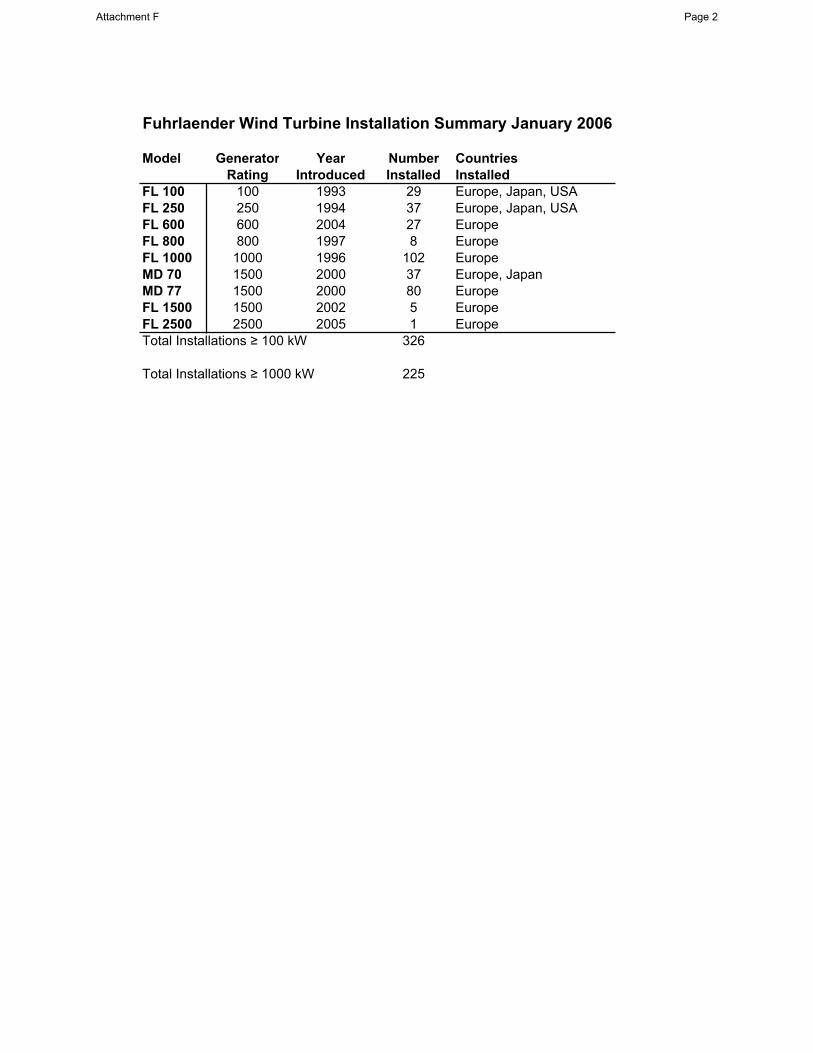
Fuhrlaender Wind Turbine Installation Summary January 2006
Model Generator Year Number CountriesRating Introduced Installed Installed
FL 100 100 1993 29 Europe, Japan, USAFL 250 250 1994 37 Europe, Japan, USAFL 600 600 2004 27 EuropeFL 800 800 1997 8 EuropeFL 1000 1000 1996 102 EuropeMD 70 1500 2000 37 Europe, JapanMD 77 1500 2000 80 EuropeFL 1500 1500 2002 5 EuropeFL 2500 2500 2005 1 EuropeTotal Installations 100 kW 326
Total Installations 1000 kW 225
Attachment F Page 2

Americas Wind Energy Inc. 24 Palace Arch Drive, Toronto, ON, M9A 2S1
Direct Wind 900 KW Turbine
Direct Wind 900 KW
Meet the newest member of our Direct Windturbines family. The Direct Wind 900 is our latest offering in a mid-size direct drivemachine. It comes from a rich heritage ofinnovative proven technology.
The Direct Wind 900’s elegant high techenergy conversion system produces electricpower of an excellent quality with its slow running ring generator.
In direct drive turbines, the number ofcomponents has been reducedtremendously. The result is a less vulnerable machine. The rotor and generator rotate as one integrated unit,supported by a designed single bearingsystem.
The absence of a gearbox simplifies maintenance procedures. The use of amonocoque nacelle also allows “all weather”access to essential systems and controls due to internal access.
The Direct Wind 900 KW turbine is availablein two configurations. A 52 meter rotordiameter machine for Class II wind conditions and a 54 meter rotor diametermachine for Class III lower wind conditions.
Power Quality
Optimised grid properties allow for betterutilisation of existing infrastructure and may save grid connection costs.
The variable speed 900 KW turbines are ready for present and future requirementsdue to its sophisticated inverter systemand advanced control electronics.
An important programmable function is the power factor, which can be adjusted ondemand.
Americas Wind Energy Inc.
Americas Wind Energy Inc. is a Canadian Company with the exclusivemanufacturing and marketing rightsfor North America for the productsdeveloped by Lagerwey WindturbineB.V. of the Netherlands.
The Direct Drive 900 is an upgradedversion of the LW 52 , 750 kW directdrive Wind turbine installed in manylocations around the world including the machine on Toronto’s waterfront.
AWE‘s strategy is to manufacture in North America and provide strongmarket, service, and parts support towind turbine customers in North America
Attachment G Page 1
Attachment I

Direct Wind 900 KW Turbine
Technical Specifications
Rotor GeneratorType 3-Bladed Type Synchronous Horizontal axis Normal power 900 KWPosition Up wind Voltage 690 VoltDiameter 51.5/54 meters Field excitation Active wound rotor Swept area 2082/2290 m2 Protection IP 54Rotor Speed Variable Insulation class F Normal 26 rpmPower regulation Pitch control Service BrakeRotor tilt angle 5˚ Type Maintenance Position At hub flangeBlade set Callipers Hydraulic one pieceType RB 51/54Blade Length 24.5/25.75 Yaw systemTip chord 0,723/0.542 m Type Active Root chord 2.402 Yaw bearing 4point ball bearing Yaw drive Electric motorsAerodynamic profile DU 91, DU 98 and Yaw Brake Passive friction brake NACA 646Material Glass reinforced Tower Epoxy Type Tapered tubularSurface colour Light grey RAL 7035 tower Hub Height 40 meters 50 metersInverter system 75 metersType Voltage source Surface colour Light Grey RAL 7035 inverter Control Micro processor Safety systemCooling Water cooled Type Independent pitchingGrid coupling AC_DC_AC blades Output voltage 600 Volt Activation Redundant electrical mechanicalTransmission systemType Direct driveCouplings flange connection only
ControllerType PLC Remote monitoring LWMS
“Specifications are subject to change. Specifica ions shown are not binding”t
Americas Wind Energy Inc.24 Palace Arch Drive, Phone 416.233.5670Toronto ON Canada, Fax 416.233.6493M9A 2S1 Web www.awe-wind.com AWE 900 6-2004
Attachment G Page 2

Explanation of Contracting Options
There are generally three ways to implement a Distributed Generation Wind project. They are:
1. General Contractor (GC). This usually requires hiring an engineering firm to do the development work (wind measurement, permits etc), put together bid documents and issue an RFP to General Contractors. You select the General contractor and they purchase and install the equipment on a ‘turnkey’ basis and transfer title to you after acceptance testing. They perform O&M or hire someone to do it.
2. Project Manager (PM). You hire a PM to do the development work and manage the Engineering, Procurement and Construction (EPC) and O&M. This is less expensive than a GC since you are purchasing and insuring the equipment. Although it costs less it takes more of your time.
3. Power Purchase Agreement (PPA). A ‘third party’ does the EPC and O&M and sells you power as part of a long term contract. This is not a decision you have to make until later in the process although some utilities may attempt to insist that the decision be made early. There are basically 2 advantages to this approach versus option 1 and 2. They are
a. Core Competency. Most companies do not have expertise in wind turbine installations or O&M and some risks can only be mitigated based on previous bad experiences.
b. Tax Benefits. The federal government provides incentives for wind generation in the form of a Production Tax Credit (PTC). This is 1.9 cents per kWh for 10 years. This subsidy is only applicable for the sale of electricity via an ‘arms length transaction’ (e.g. ‘market rate’) between ‘unrelated parties’. In other words you cannot own the turbine and sell electricity to yourself.
c. Available time and resources. Most companies do not have the time or resources to dedicate to something that is not related to their main business.
If electricity is purchased via a long term Power Purchase Agreement the savings depend on the following factors.
1. Wind Resource. The more energy produced the higher the savings to the purchaser all else equal. In addition, if more energy is produced during times of higher electricity rates the higher the savings. It is prudent to have the wind resource confirmed by an experienced Professional Meteorologist because a PPA contract that accounts for Time of Use energy production to account for current utility tariff is complex and usually cost prohibitive especially for small projects.
Attachment I Page 1
Attachment J
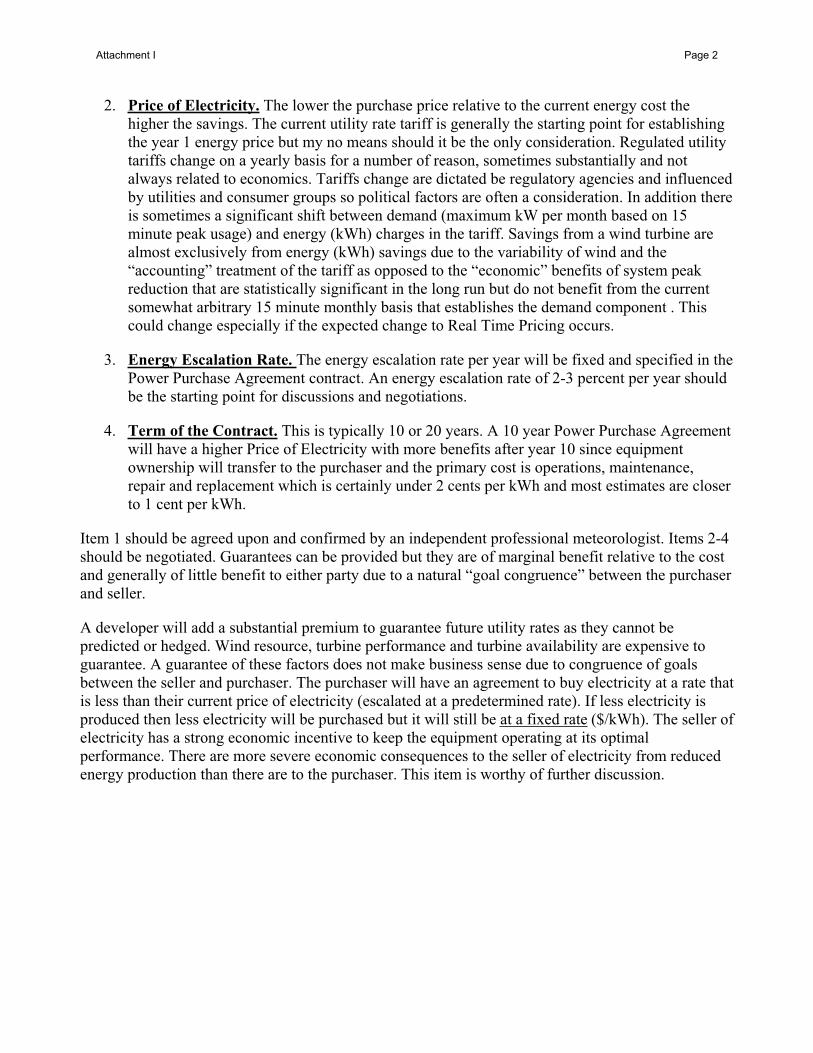
2. Price of Electricity. The lower the purchase price relative to the current energy cost the higher the savings. The current utility rate tariff is generally the starting point for establishing the year 1 energy price but my no means should it be the only consideration. Regulated utility tariffs change on a yearly basis for a number of reason, sometimes substantially and not always related to economics. Tariffs change are dictated be regulatory agencies and influenced by utilities and consumer groups so political factors are often a consideration. In addition there is sometimes a significant shift between demand (maximum kW per month based on 15 minute peak usage) and energy (kWh) charges in the tariff. Savings from a wind turbine are almost exclusively from energy (kWh) savings due to the variability of wind and the “accounting” treatment of the tariff as opposed to the “economic” benefits of system peak reduction that are statistically significant in the long run but do not benefit from the current somewhat arbitrary 15 minute monthly basis that establishes the demand component . This could change especially if the expected change to Real Time Pricing occurs.
3. Energy Escalation Rate. The energy escalation rate per year will be fixed and specified in the Power Purchase Agreement contract. An energy escalation rate of 2-3 percent per year should be the starting point for discussions and negotiations.
4. Term of the Contract. This is typically 10 or 20 years. A 10 year Power Purchase Agreement will have a higher Price of Electricity with more benefits after year 10 since equipment ownership will transfer to the purchaser and the primary cost is operations, maintenance, repair and replacement which is certainly under 2 cents per kWh and most estimates are closer to 1 cent per kWh.
Item 1 should be agreed upon and confirmed by an independent professional meteorologist. Items 2-4 should be negotiated. Guarantees can be provided but they are of marginal benefit relative to the cost and generally of little benefit to either party due to a natural “goal congruence” between the purchaser and seller.
A developer will add a substantial premium to guarantee future utility rates as they cannot be predicted or hedged. Wind resource, turbine performance and turbine availability are expensive to guarantee. A guarantee of these factors does not make business sense due to congruence of goals between the seller and purchaser. The purchaser will have an agreement to buy electricity at a rate that is less than their current price of electricity (escalated at a predetermined rate). If less electricity is produced then less electricity will be purchased but it will still be at a fixed rate ($/kWh). The seller of electricity has a strong economic incentive to keep the equipment operating at its optimal performance. There are more severe economic consequences to the seller of electricity from reduced energy production than there are to the purchaser. This item is worthy of further discussion.
Attachment I Page 2

California Debates Ownership of Solar Renewable Energy Certificates
2006-11-12
California Debates Ownership of Solar Renewable Energy Certificates
by Stephen Lacey, RenewableEnergyAccess.com San Franciso, California [RenewableEnergyAccess.com]
A California Public Utilities Commission (CPUC) proposed decision to grant 100% ownership of solar renewable energy certificates (SRECs) to utilities from solar system owners could hamper the California Solar Initiative (CSI) and slow down the state's burgeoning solar market, according to solar advocacy groups.
But California utilities disagree, saying that it will encourage more utility participation in the solar program if they own SRECs and RECs from other renewable distributed generation (DG) facilities. The difference of opinion between solar groups and utilities is just one of many issues that need to be sorted out before implementation of the CSI on January 1, 2007.
David Hochschild, Executive Director of PV Now, said that utilities have no right to take 100% of SRECs from their customers. "If RECs go to the utilities, it is going to eliminate a very important revenue stream that can help make more projects possible," he said. "If they go to customers it's going to grow the solar market and everyone is going to benefit."
PV Now has partnered with the Vote Solar Initiative and the California Solar Energy Industries Association (CALSEIA) to oppose any ruling that takes RECs from solar system owners. According to these three organizations, there are many reasons for keeping RECs in the hands of the customer.
Firstly, ratepayers will benefit as more solar installations reduce load, therefore reducing the renewable energy procurement obligations of the utilities. According to Hochschild in a letter to CPUC President Michael Peevey, "every MWh of load reduction reduces RPS [renewable portfolio standard] procurement obligations by 33%." The goal of the California RPS is to get 20% of electricity from renewable resources by 2010.
Also, if only 30% of a solar system's cost is paid for by the state through rebates, utilities should not be able to claim 100% ownership of the energy generated. The government doesn't claim it owns the energy and neither should the utilities, the three parties said.
And finally, system owners will not be able to legally say they are solar powered if utilities claim ownership of the energy. RECs are the value of generated clean energy, so if they are not the property of the system owner, it can't be said that a building is solar powered. If companies cannot use this claim for their public image, it could affect their decision to invest in solar.
http://www.renewableenergyaccess.com/rea/news/printstory?id=46534 (1 of 2)12/2/2006 1:33:28 AM
Attachment J Page 1Attachment K

California Debates Ownership of Solar Renewable Energy Certificates
But the utilities have argued that they are helping out ratepayers who subsidize the solar and renewable DG programs by contributing SRECs toward the RPS procurement target. If the utilities have to buy the SRECs, they said, then ratepayers will be paying twice for the renewable energy output for the RPS requirements.
"Due to their substantial funding of renewable DG, it is appropriate that those ratepayers be permitted to count the output of those renewable generators toward meeting the utility RPS requirements," said Pacific Gas and Electric in a written statement to the CPUC.
But because the RPS and the CSI were created separately from each other, the SRECs should not automatically go toward the utilities' contribution to the RPS, said Hochschild. Lumping the two programs together will result in less offsets of CO2 emissions.
"The PV industry has been very consistently advocating that the RECs belong to the purchaser of a system and not to the utility, and that's our position as well," said Les Nelson, Executive Director for CALSEIA. "However, I can see the other position. If there's nothing in it for the utilities, there's going to be less of an incentive for them to become involved."
CPUC Administrative Law Judge Maryam Ebke will issue a proposed decision on who owns SRECs on November 14th. There will be a 30-day comment period after the ruling. Hochschild and other solar advocates are encouraging anyone interested in the proposed decision to become an intervener and file comments to the CPUC during this period.
For further Information
● » CPUC● » PV Now
Please Note: RenewableEnergyAccess.com does not endorse the sites behind these links. We offer them for your additional research. Following these links will open a new browser window.
http://www.renewableenergyaccess.com/rea/news/printstory?id=46534 (2 of 2)12/2/2006 1:33:28 AM
Attachment J Page 2

CPUC Proposed REC Decision Delayed
2006-11-17
CPUC Proposed REC Decision Delayed
by Stephen Lacey, RenewableEnergyAccess.com
A California Public Utilities Commission (CPUC) proposed decision to grant solar renewable energy certificates (SRECs) to utilities was delayed on Tuesday, November 14, because of the overwhelming response from the solar industry against such a decision.
David Hochschild, Executive Director of PV Now, said that the California solar industry sent a clear message to the CPUC.
"We've had a number of companies including Google basically convey the message that they would not invest in solar if the RECs went to the utilities. Companies like California Sun Edison have said they will leave the California market if utilities get the RECs. And the California Building Industry Association has joined the CSI proceedings, so all the new home builders are advocating for customer ownership of RECs. This could be huge," he said.
It is unclear how long it will take for the CPUC to issue a proposed decision. In the meantime, Hochschild and other solar advocates are encouraging interested parties to write to the CPUC with comments or concerns on the issue.
For further Information
● » Related Story on CPUC Proposed REC Decision● » CPUC Website
Please Note: RenewableEnergyAccess.com does not endorse the sites behind these links. We offer them for your additional research. Following these links will open a new browser window.
http://www.renewableenergyaccess.com/rea/news/printstory;jsessionid=CAD4B8BACBA2918EB426B1E22A4B2054?id=4659912/2/2006 1:31:11 AM
Attachment J Page 3

162 MODEL AIRPLANE NEWS
BY JAIME LAGOR
Many of us would like to earn a living flying RCplanes, and Mike Morgan of San Diego, CA, hasfound a way to do just that! Mike has been able toincorporate his passion for flying re m o t e - c o n t ro l
planes into his work as a land surv e y o r. He uses a 1/4-scaleWorld Models Piper Cub to take aerial photos—all by re m o t ec o n t rol. The highly modified Cub weighs 15 pounds withoutthe camera equipment and 22 pounds all decked out and re a d yfor work. Powered by a Kohler Actro 40-5 brushless motor with a30-cell 2600mAh NiMH battery, the Cub can stay aloft for 10minutes—long enough to photograph one square mile of land.
The Cub’s payload includes a Pentax 645 medium-form a tcamera for high-quality prints with a 35mm-wide-angle lensmounted on the bottom of the plane. The Cub can photographa large area of land at an altitude of 400 to 1,000 ft. Mike alsomounted two video cameras in the plane that send re a l - t i m et e l e m e t ry to a Sony digital re c o rder with a 5-inch LCD scre e n .One of the video cameras is pointed out the front window,which enables Mike to fly the plane by just looking at thes c reen. The other video camera is attached to the Pentax’sviewfinder and shows what the camera sees. Switching back andf o rth between the video cameras only re q u i res a flip of a switchon the transmitter. Stuffed in between all of the camera equip-ment is a Garmin GPS receiver that gives an overlay readout onthe video screen, showing the current latitude, longitude, air-
speed and altitude (in meters)—e x t remely important inform a t i o nneeded for land surveying. Astout roll bar in the cowl pro t e c t sall of this equipment from ro u g hlandings, which is a nice featurebecause many of the fields
h a v e n ’t yet been graded when aerial photos are needed. A typical assignment goes like this: Mike straps on his back-
pack containing the equipment that receives all of the videot e l e m e t ry from the plane. After he checks to make sure thateverything is working properly, the plane takes off. The electricmotor is very quiet, so this flying plane will not disturb theenvironment. Once the plane reaches an altitude of about1,000 feet, Mike hands the video screen to the client, and theyare able to see the view through the Pentax camera. The clientcan now tell Mike in which direction to fly so that the proper-ty to be surveyed can be lined up in the viewfinder. When theplane is directly over the area, Mike flips the switch to the for-ward video view and then back to the viewfinder video cam-era. This does two things: the Pentax camera snaps a photo,and the telemetry from the GPS receiver is re c o rded on thevideo continuously. When the video view is changed from thef ront to the viewfinder camera, the GPS information on thes c reen shows the plane’s precise location at the time of thephoto. The GPS data is transferred to a file called metadatawhich links the aerial image with real world coordinates. For thefinal product the clients data is merged onto the aerial image.
Mike turned his love of flying electric radio-control aircraft into a business. He formed a company where he also builds and repairs R/C aircraft called MorganTech.com ·
Radio control flightFrom hobby to career
FINAL APPROACHAttachment K Page 1
Attachment L

Scott Debenham CEM 11317 Valle Vista Rd Lakeside, CA 92040
Phone 619-334-9541 Email – [email protected]
Qualifications
Education, Licenses, and Achievements MBA-Finance, University of Michigan, Ann Arbor MI BS-Aeronautical Engineering, California Polytechnic State University, SLO. Tau Beta Pi Certified Energy Manager (CEM) Nuclear Submarine Electrical Officer - Certified Power Plant Engineer by Naval Reactors/DOE Solar Turbines – Performance Analysis, Applications Engr. Project Manager, and Product Management President, Association of Energy Engineers – San Diego Chapter Co-Chair, Energy Services Coalition (ESC) – California Chapter Co-Chair, Renewable/Energy Efficiency Subcommittee – Border Air Workgroup Proficient in Spanish Language – Have given technical presentations in Latin America in Spanish Have traveled to 35 countries
Experience – In Chronological Order
President, Debenham Energy, LLC Lead development efforts for Distributed Generation wind projects in California including prospecting, feasibility studies, project management and arranging financing. Business Development consulting work for AeroVironment’s new “Building Integrated wind system”. Product Development consulting work for a Compressed Air Energy Storage System (CAES) for a California based wind developer
Senior Project Developer – NORESCO LLC (2.5 years) Responsible for leading the project team, setting project milestones and budgets, preparing the proposals, establishing customer relationships and managing all of the project resources. Responsible for project profitability and schedule.Experience with DOE Super ESPC/IDIQ Contracts. Navy, BOP, USMC, Air Force.Successfully developed the Victorville Federal prison hybrid renewable energy efficiency project. This $5.5 million ESPC project included a 750 kW wind turbine and 70 kW photovoltaic covered parking array as well as an HVAC/Controls upgrade.
o Lowest capacity factor financed utility scale wind turbine in the United States. o First utility scale wind turbine under the California Self Generation Program o Have given presentations at the Silicon Valley Manuf. Assn. and Energy 2004 o Assisted in writing article that was published in AWEA. o Appealed and reversed the Utility/PUC Working Group decision on the eligible
cost basis of the project which yielded an addition $180,000 for my customer.
Attachment M Page 1

2
Senior Project Manager – Planergy/EMI (1.5 years) Led implementation of Demand Side Management (DSM) energy efficiency projects with various municipal customers. Determined work priorities in accordance with project plans, project schedules and changing work demands. Managed relationships with client, contractors and equipment suppliers. Led development of an Energy Information System for sale to customers for analyzing and managing energy systems.
Software Development Project Manager – Epic Cycle Interactive (1 Year) Managed team of 5 software developers at client (Asera) site in San Francisco. Determined work priorities in accordance with project plans, schedules and changing work demands. Managed client relationship. Developed customer solutions at Asera, a venture capital (Kleiner-Perkins) funded startup to provide B2B e-commerce sell-side implementations via the internet.
Solar Turbines – Program, Product and Project Manager (11 years) Technical and commercial review of client specifications and preparation of proposals to meet design, code, quality and safety standards. Responsibilities also included client presentations and negotiations. Managed internal and external resources to design, install and test aftermarket turbomachinery equipment including managing change orders and approving invoices. 3 years experience in predicting and analyzing gas turbine, centrifugal compressor and steam system performance. Conducted field performance tests of turbine generator and compressor packages in order to verify contractual requirements. Led seminars on gas turbine and centrifugal compressor performance for major Oil and Gas clients (Pertamina, Unocal, Shell, Arco, Vico, Esso) in 4 Southeast Asian countries (Malaysia, Thailand, Brunei and Indonesia)Developed Oracle application for automating the design and costing/pricing of centrifugal compressor refurbishments. System is still in use today. Completed 20 days of Oracle training covering database design and application development. As Principal Application Engineer supported Latin America for 2 years. Gave presentations to PEMEX in Spanish. Numerous trips to Brazil (Petrobras) and Venezuela (Maraven/Lagoven/Corpoven) for power/cogeneration project development efforts.
United States Navy – Nuclear Submarine Officer (5 years) Completed extensive 3 year Navy Nuclear Engineering training covering power plant design, thermo/fluid dynamics, chemistry, electrical engineering and controls. As Electrical Officer on fast-attack nuclear submarine USS Permit (SSN 594) responsible for managing overhaul, repair and acceptance testing of turbine generator, switchgear and related electrical equipment. Managed 15 highly trained electricians. As Submarine Engineering Officer of the Watch (EOOW) supervised operation, maintenance and casualty drills of complex integrated engineering systems including reactor, steam/condensate systems and power generation and distribution systems.
Attachment M Page 2

CURRICULUM VITAE
Richard Louis Simon
10 Tartan Road Mill Valley, California 94941 USA
Tel: 415-381-2245 Fax: 415-381-2248
e-mail: [email protected]
GENERAL
Mr. Simon is a consulting meteorologist with 27 years professional experience. He has a wide background, with emphases in wind energy, air pollution, climatology, managing field programs, basic and applied research, and expert testimony for litigation.
EDUCATION
BA in Geography, University of California at Berkeley, 1973
MS in Meteorology, San Jose State University, 1976. Dissertation topic: the summertime stratus over the eastern Pacific Ocean. GPA: 4.0/4.0
PROFESSIONAL EMPLOYMENT
1975-1976 Research Associate, San Jose State University. I collected and processed wind data for NASA/Ames in connection with expansion of their wind tunnel and analyzed data for several NSF grants.
1976 Meteorologist, National Environmental Satellite Service (now part of the National Weather Service), Redwood City, California. I prepared graphics from satellite imagery to support marine fishermen.
1976 Laboratory instructor in synoptic meteorology, San Jose State University.
1977-1978 Instructor, Metropolitan Adult Education Program, San Jose, California. I taught aviation weather to pilots.
1977-1980 Co-founder and co-owner, Global Weather Consultants, Inc., Palo Alto, California (president 1978-1980). The company specialized in air pollution, wind energy, and customized weather forecasting for the media and agriculture. We prepared several reports for the Bureau of Land Management on air pollution in the California desert.
1980-1982 Meteorologist, Pacific Gas and Electric Company, San Francisco, California. My areas of responsibility included wind energy (field measurements, computer programming, data analysis), geothermal
1
Attachment N Page 1

(pollutant dispersion studies), and nuclear (emergency response planning for Diablo Canyon Power Plant).
1982-1983 Senior Meteorologist, American Energy Projects, Palo Alto, California. This was one of the original private developers of wind energy projects. I was responsible for property acquisition, siting of wind turbines, and evaluation of turbine performance.
1983-2002 Sole proprietor of meteorological consultancy to the public and private sector, with primary emphasis on wind energy development across the world.
1986 Lecturer in upper-division climatology course, Department of Meteorology, San Jose Sate University.
2003-present Managing director, Windots, LLC. This is an extension of my sole proprietorship from 1983-2002, but now as an LLC.
ORGANIZATIONS
American Meteorological Society, member since 1979. Officer of Northern California Chapter, 1981-1984.
American Wind Energy Association, member since 1988. Received special award in 1998 for “critical contributions to the development of wind energy in the United States and around the world.”
Who’s Who in the West, listed since 1992.
PROJECTS / ACTIVITIES
1977 – Present Consultant to the wind energy industry. I have worked with developers, government agencies, turbine manufacturers, and members of the financial and insurance communities. I have directly participated in the siting of more than 7000 commercial-scale wind turbines across the world. I have helped pioneer many techniques for wind resource assessment and siting.
1978-1980 Subcontractor to Pacific Gas and Electric Company in their initial wind energy assessment programs. I was responsible for meteorological tower installations, data collection and data processing.
1978 – Present Meteorological research and expert witness for the legal community on approximately 150 cases. Cases have involved weather conditions during accidents (airplane, highway, marine, flood, wind), solar and lunar positions (ambient light levels), due diligence, misrepresentation, and climate evaluation. In 1989, I published an article for the American Jurisprudence Proof of Facts, 3rd Series, discussing meteorology and the law.
2
Attachment N Page 2

1978 – present Consultant to Hodges & Shutt, an airport planning group. I helped them evaluate the merits of new airports or modifications to existing ones.
1979 Consultant to the U. S. Bureau of Reclamation wind resource study in northern and central California for potential wind farm development.
1981 Subcontractor to Sonoma County, investigated impact of a new waste water treatment plant on fog formation at the Santa Rosa airport.
1984 Gave seminar on meteorology to the East Bay Regional Park District, Berkeley, California.
1984, 1988 Participant in the Career Planning and Placement program, San Jose State University.
1985 – 1986 Consultant to Pacific Gas and Electric Company. Planned and conducted the first field study of wake losses at an operating wind farm.
1986 Subcontractor to United Industries Corporation, Bellevue, Washington, on study funded by the Electric Power Research Institute called “Wind turbine micrositing status and requirements assessment.” I reviewed state-of-the-art techniques.
1986 – 1990 Subcontractor to United Industries Corporation, Bellevue, Washington, on a study funded by the U. S. Department of Energy, called “A numerical model for predicting wind turbine array performance in complex terrain.” My responsibility was to plan and conduct various field programs, analyze historical wind farm production data, and help develop the computer model itself.
1987 – 1988 Consultant to the Delta Diablo Sanitation District, Antioch, California. I monitored background conditions for a proposed new landfill in eastern Contra Costa County.
1988 – 1989 Consultant to Systems Applications, Inc., and Sonoma Technology, Inc., in helping to plan air pollution field studies in the Sacramento and San Joaquin Valleys, sponsored by the California Air Resources Board.
1988 – 2001 Consultant to Waste Management, Inc. I collected and analyzed meteorological data to support air quality permits for proposed new landfills and operational planning at existing landfills.
1989 Consultant, Lawrence Livermore National Laboratory, on a meteoro-logical instrument package for testing a new type of wide field-of-view camera.
3
Attachment N Page 3

1989 – 2000 Consultant to Florida Power and Light on various alternative energy projects. In 1992 I prepared a wind energy resource assessment for the state of Florida.
1989 – 1992 Collected and processed wind data for the Golden Gate Bridge District’s study of wave erosion near the Larkspur Ferry Terminal.
1990 – 1994 Consultant to the Contra Costa Water District, Concord, California. I developed plans for meteorological monitoring at the proposed new Las Vaqueros Reservoir site and served as an in-house technical contract monitor on three research projects.
1990 – 2000 Collected wind data for Fernau & Hartman, architects, to help plan homes for optimal energy efficiency.
1990 – 1991 Worked with Bill Graham Productions to evaluate wind conditions at proposed new outdoor ampitheatre locations in the San Francisco Bay Area.
1991 Assisted in the design of a meteorological monitoring program for Lawrence Berkeley Laboratory (University of California).
1992 Worked with Pacific Gas and Electric legal staff regarding meteorological conditions associated with the Oakland fire of October 1991, which burned several thousand homes.
1992 – 1994 Performed solar and wind energy feasibility study for the Livermore family in Napa and Lake Counties, California.
1994 Collected weather data at two locations in San Francisco to support the planning of the Pac Bell baseball park for the San Francisco Giants.
MAJOR PUBLICATIONS
1977 The summertime stratus over the eastern Pacific Ocean. MonthlyWeather Review, October 1977.
1978 (with A. Miller) Wind resource potential in California. California Energy Commission report P500-80-052.
1980 Location of sites in northeastern California for wind power development. Published by the California Energy Commission, April 1980.
1980 The air quality impact of future development at Stapleton International Airport, Denver, Colorado. Submitted to Peat, Marwick & Co.
1980 Wind energy resource assessment—southwest region. Battelle Pacific Northwest Laboratories report PNL-3195 WERA-9, Richland, Washington.
4
Attachment N Page 4

1981 Potential errors in using only one anemometer to characterize the wind power over an entire rotor disk. Proceedings of the Large Horizontal Axis Wind Turbines workshop, Cleveland, Ohio. NASA Conference publication 2230, pp. 427-445.
1982 Wind energy monitoring systems. Presented at the workshop “Wind as an energy alternative for the Caribbean,” sponsored by the Caribbean Association of Universities and Research Institutes, Bridgetown, Barbados.
1982 Wind energy site evaluations, Solano County and Altamont Pass. Pacific Gas and Electric Company.
1983 (with J. Eckland) Siting and wind farm development. Presented to the Wind Energy Committee of the ASME Petroleum Division at the Energy Sources Technology Conference, Houston, Texas.
1984 Eisenhower’s meteorological support for the D-Day invasion. Chapter 3 of the proceedings for the symposium “Some meteorological aspects of the D-Day invasion in Europe,” published by the American Meteorological Society. Paper presented at conference, Fort Ord, California.
1986 Wind farm array effects. Submitted to Pacific Gas and Electric Company, San Ramon, California. First field-based study of wake losses in energy production at an operating wind farm.
1987 (with P. Lester) Typical meteorological conditions between the Alton Coal Project Area and Bryce Canyon National Park, Utah. Submitted to Utah International, San Francisco, California.
1987 Wake effects in a Fayette 95-IIS wind turbine array. Solar Energy Research Institute report WERI/STR-217-3186, Golden, Colorado.
1988 Results of a detailed field program to evaluate micrositing tools. Proceedings of the American Wind Energy Association’s Windpower ’88 conference, Honolulu, Hawaii, pp. 541-559.
1989 Twelve years of wind resource assessment in California—how can the world benefit from what has been learned? Proceedings of the European Wind Energy Conference and Exhibition, Glasgow, Scotland, pp. 858-862.
1989 Meteorological conditions at a particular time and place. Volume 5 of Am Jur Proof of Facts 3d, pp. 191-321, published by Bancroft-Whitney. Monograph on meteorology and the law.
5
Attachment N Page 5
1990 (with S. Veenhuizen) A numerical model for predicting wind turbine array performance in complex terrain—Phase II. Final technical report under U. S. Department of Energy’s Small Business Innovative Research program, project No. 4386-86-II.
1991 (with R. Gates) Long-term interannual wind resource variations in California. Proceedings of the American Wind Energy Association’s Windpower ’91 conference, Palm Springs, California.
1992 Two examples of successful wind energy resource assessment. Presented at the American Wind Energy Association’s Windpower ’92 conference, Seattle, Washington.
1994 (with J. Schroeter) The CSW system wind energy resource assessment and long-range wind farm development strategy. Proceedings of the American Wind Energy Association’s Windpower ’94 conference, Minneapolis, Minnesota, pp. 131-139.
1996 (with M. Brower and P. Hurley) A GIS-assisted approach to wide-area wind resource assessment and site selection for the state of Colorado. Presented at the American Wind Energy Association’s Windpower ’96 conference, Denver, Colorado.
1997 Potential wind energy monitoring sites in New Mexico: results of a field trip to inspect prospective sites. Published by the State of New Mexico Energy, Minerals and Natural Resources Division, Santa Fe, New Mexico, under contract No. 96-521.03-198.
PERSONAL
Born Oakland, California, 1950. Married 1985, two children. Interests include music (composition and performance), travel, linguistics and outdoor sports. Moderate fluency in the Russian and Italian languages.
December 2004
6
Attachment N Page 6