windpower 2013 in chicago, the department of energy, in ... · at windpower 2013 in chicago, the...
TRANSCRIPT

At Windpower 2013 in Chicago, the Department of Energy, in coordination with key industry players, announced an initiative to develop a long‐term vision for the future of wind power in the US. At Windpower 2014 in Las Vegas, DOE Wind and Water Power Technologies Office Director Jose Zayas provided an industry preview of the Wind Vision’s findings. The following presentation is a summary of the materials presented on May 6, 2014 at the Windpower conference. All findings are preliminary and subject to peer review.


Wind in 2014 is already a significant portion of our US energy mix. Currently, wind represents over 4% of all electricity demand, with 61GW installed across 39 states. Wind is a mainstream energy source and its benefits are spread across the Nation. As a clean energy source, wind has already helped the nation reduce its greenhouse gas, water, and air pollution footprint from the power sector. The 96 Million metric tons of avoided CO2 in 2013 are equivalent to taking nearly 17 Million cars off the road. And in 2013 wind displaced SO2 and NO2 emissions achieving approximately a 2% and 4% reduction respectively.

The economic impacts of wind are also broadly spread across the country. The wind industry supports 50,500 jobs with a supply chain of >560 facilities spread across 43 states. These jobs are in states both with and without actual wind deployment.
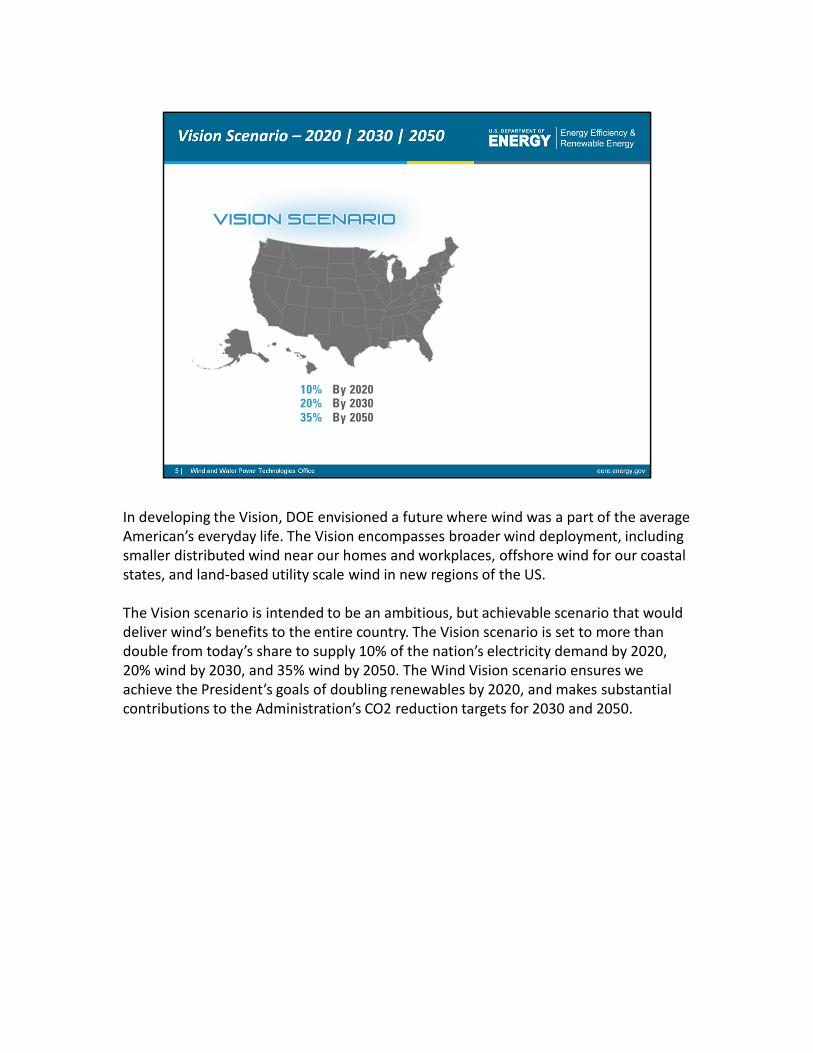
In developing the Vision, DOE envisioned a future where wind was a part of the average American’s everyday life. The Vision encompasses broader wind deployment, including smaller distributed wind near our homes and workplaces, offshore wind for our coastal states, and land‐based utility scale wind in new regions of the US.
The Vision scenario is intended to be an ambitious, but achievable scenario that would deliver wind’s benefits to the entire country. The Vision scenario is set to more than double from today’s share to supply 10% of the nation’s electricity demand by 2020, 20% wind by 2030, and 35% wind by 2050. The Wind Vision scenario ensures we achieve the President’s goals of doubling renewables by 2020, and makes substantial contributions to the Administration’s CO2 reduction targets for 2030 and 2050.

Executing the Vision will sustain the US domestic wind industry and supply chain, with approximately 10 GW/year demand in the near term. Significant growth potential in the out‐years occurs as repowering opportunities emerge post‐2030.

This vision roughly doubles wind generation (relative to year‐end 2013) by 2020.

By 2030 the Vision scenario has wind deployed in all 50 states with more than 30 states in the 1 GW+ club.

By 2050 wind is supplying the nation with 35% of its energy requirements, and is the #1 power generation source for the nation.

When it comes to greenhouse gas emissions reductions, wind is an essential player for meeting our Nation’s goals. The Wind Vision could reduce electric‐sector CO2 emissions by roughly 9% in 2020.

The Wind Vision could reduce electric‐sector CO2 emissions by 23% in 2030.

By 2050, the Wind Vision scenario could achieve a 26% reduction in CO2 emissions.

The Wind Vision analysis team used the Interagency Working Group’s ‘Social Cost of Carbon’ methodology in order to monetize the benefits of carbon reductions [see http://www.whitehouse.gov/sites/default/files/omb/inforeg/social_cost_of_carbon_for_ria_2013_update.pdf for more information]. By 2050, the 550 Million metric tons of CO2 reductions is equivalent to an estimated $520 Billion in avoided damages by 2050.These cumulative savings are roughly equivalent to 4.2 c/kWh benefit provided in the Wind Vision scenario.

Greenhouse gases is a global benefit wind power delivers, whereas water is typically a much more local and regional issue. Wind is much less water intensive than conventional power generation sources like nuclear, coal, and natural gas. Water scarcity varies by region, but regardless of location, wind’s water footprint delivers savings to Americans. The Wind Vision could reduce electric‐sector water consumption by approximately 6% in 2020.

The Wind Vision could reduce electric‐sector water consumption by approximately 16% in 2030.

The Wind Vision could reduce electric‐sector water consumption by approximately 28% in 2050, saving up to 336 Billion gallons by 2050. That’s equivalent to the volume in roughly half a million Olympic‐size swimming pools. The water savings will be valued differently in different regions, but may be of particular interest in water‐stressed regions of the Southwest and West.

SO2, NO2, mercury, and other conventional power plant air pollution have created various unintended consequences in our environment – ranging from increased incidences of children with asthma to fish with unhealthy levels of mercury. The Wind Vision analysis team studied the public health and environmental impacts of the Wind Vision scenario. Monetizing of the SO2, NO2, and PM2.5 emissions impacts resulted in potential savings of between $16‐$103 billion in avoided damages by 2050. These savings are equivalent to a 0.1 to 0.8 cents/kWh emissions benefit from the Wind Vision scenario.

Jobs in the Wind Vision are spread across the nation; and that economic impact ripples through those communities creating jobs at restaurants, gas stations, and grocery stores too. By 2020 the Wind Vision scenario could accomplish more than a doubling from today to 139,000 wind‐related jobs and 106,000 induced jobs in the communities where wind manufacturing and deployment occur. These job estimates are ‘gross.’

By 2030 the Vision scenario results in more than 230,000 wind‐related jobs and 175,000 induced jobs from the economic impacts of wind development.

In 2050 the Wind Vision scenario creates an estimated 400,000 wind‐related jobs and 295,000 induced jobs in communities with wind manufacturing and deployment.

Pursuing the Wind Vision scenario does come at a cost in the near‐ to mid‐term. Electricity prices increase by <1% in 2020, to reach 10% wind energy.

In 2030 the Vision costs approximately a 1% increase in electricity prices.

But by 2050 the DOE analysis finds that 35% wind could yield price savings of roughly 3%, or a $4/MWh decline in prices. These findings are dependent on future fossil fuel prices, so a range of scenarios were included in the analysis.

System costs estimate cumulative costs from 2013‐2050 for capital expenditures, operations & maintenance, and fuel costs across the entire power sector. Our nation will need to make investments to meet future energy demands with or without wind on the grid. Renewables like wind do entail significant upfront costs, but the long term, savings in reduced fuel consumption may justify the near term investment. The DOE study found that the Wind Vision does not make significant changes incrementally in system costs between 2014 and 2050. In fact, the Wind Vision achieves about 3%, or $150 Billion savings, primarily due to reduced fossil fuel consumption.

All findings shared in this presentation are preliminary and subject to peer review. For more information on the project, see the website wind.energy.gov/windvision. The final report is scheduled for publication in Fall 2014.