winners and losers from globalization: why both european ...ehes.org/persson_sharp.pdf · winners...
TRANSCRIPT

1
Winners and Losers from Globalization: Why Both European and US Farmers Were Angry in
the Grain Invasion Era, 1870-19001
Karl Gunnar Persson, University of Copenhagen
Paul Sharp, University of Southern Denmark
Abstract: We demonstrate that the agrarian unrest in the United States between 1870 and
1900 can be given an economic explanation, despite its association with increases in the real
price of agricultural produce – it was not the result of nominal illusions as other scholars have
suggested. Falling transportation costs allowed for the extension of the frontier and for more
farmers to enter the international grain market. These farmers received, however, the world
price minus the transaction costs involved in getting their produce to market. Many considered
these costs to be unfairly large, owing to the perceived market power of rail firms and the
discriminatory practices of middlemen, and farmers closer to the frontier were clearly more
exposed to such market imperfections. Recognizing this, they protested. Using the vote shares
for James B. Weaver, the People’s Party (Populist) candidate in the 1892 Presidential elections,
as a measure of the extent of the protest, we demonstrate that this is negatively related with
state wheat prices relative to East Coast prices, even when we control for other factors often
also considered relevant.
JEL codes: F6, N5, N7
Keywords: Agriculture, Grain Invasion, populism, United States
1 Paul Sharp would like to thank the Institute of Governmental Affairs at UC Davis for financing Paul Sharp’s visit to California, where he received inspiration for this study, and the European Commission for financial support through the Marie Curie Research Training Network “Unifying the European Experience”. Thanks are also due to Karol Boroweicki, Gregory Clark, James Fearon, Giovanni Federico, Cormac Ó Gráda, Alex Klein, Alan Olmstead, Kevin O’Rourke, and Peter Sandholt, as well as to seminar and conference participants for their comments and suggestions. Thank you also to Andreea-Alexandra Maerean and Mekdim Regassa for very conscientious research assistance.
2
1. Introduction
For the historian of European agriculture, the last decades of the nineteenth century are
perhaps principally associated with the American ‘Grain Invasion’ when, in the wake of rapidly
falling transportation costs, the United States began exporting unprecedented quantities of
cheap wheat to Europe (Williamson 1980, O’Rourke 1997, O’Rourke and Williamson 1999). This
episode inspired the economic historian Eli Hecksher to speculate about the role of resource
endowments for trade patterns and thereby provided the foundation for the Hecksher-Ohlin
theorem. Following the elaboration of Stolper-Samuelson one would expect owners of the
scarce resource, land, in Europe to lose, and landowners in the Americas to gain. The resultant
agricultural distress and protest in the Old World was therefore both predictable and
understandable (see also Rogowski 1989). Countries either chose to shield themselves through
protectionism, as in the cases of Sweden, Germany and France, or allowed their economies to
adjust. The UK saw a large decline in cereal production (Ejrnæs, Persson & Rich 2007) whereas
Denmark - a particularly interesting case – changed from being a net exporter of grain in the
1850s and 1860s to become a net importer in the 1880s of wheat as well as fodder for an
agricultural sector switching to bacon and dairy products (Henriksen 1993).
Somewhat paradoxically, however, the historian of American agriculture would also associate
this period with agrarian discontent. A succession of protest movements flourished throughout
this period, culminating with the Presidential campaign of the Populist William Jennings Bryan.
Shortly before securing the Democratic nomination for the 1896 election he delivered a famous
address highlighting the importance of the rural economy:
‘Burn down your cities and leave our farms, and your cities will spring up again as if by magic,
but destroy our farms and the grass will grow in the streets of every city in the country.’
However, it has been difficult to find a wholly convincing argument as to why farmers were
angry. The problem rests on evidence that the real incomes of farm households (usually proxied
by the real prices of farm output) actually rose over this period. This explanation ignores,
however, both the geographical pattern of the protests and that of agricultural prices across
the country. In fact, wheat prices were lower the further west the farmer was located. This was
3
due to the fact that local prices were as a first approximation equal to the world (UK) price
minus transaction costs, as follows from the Law of One Price, which states that p = p* + t,
where p is the price in the importing market, p* is the price in the exporting market, and t are
the transaction costs involved in shipping the product between the markets. The further west
the farmer household was located, the higher was t, and the lower was the price received, p*.
The local prices and the prices in the US export hubs were widely published in the local press
and a constant reminder of the high transportation and transaction costs, and a look through
the contemporary press reveals the anger felt about this. For example, as a local resident in
Omaha, Nebraska, told the Omaha Daily Bee (May 15, 1891): ‘There is something radically
wrong when it takes half of the farmer’s output to get the other half to market’. The agrarian
reform movements singled out price discrimination on the part of the rail corporations as a
major problem and the People’s Party made the public ownership of railways and other natural
monopolies such as the telegraph a cornerstone of their political program. Many of the protests
concerned the supposed monopoly power of railroads, and the discriminatory practices of
middlemen2. Using the voting share for the People’s Party (Populist) candidate in the 1892
Presidential election, we demonstrate that this was lower (higher) where the prices received by
farmers relative to East Coast prices were higher (lower).
The remainder of this paper is as follows. Section 2 reviews and critically examines previous
attempts at providing an explanation for the agricultural distress. Section 3 explores how the
geographical pattern of agricultural unrest is linked to the extent of exposure to high
transportation and transaction costs, limited access to alternative means of transportation, and
high borrowing costs in settler areas. Section 4 provides empirical evidence for our conjecture.
Section 5 concludes.
2 Particularly in terms of their products being graded inappropriately for their quality.
4
2. The Agrarian Protest in the United States
The history of the agrarian protest in the United States during the latter part of the nineteenth
century is well known. A succession of protest movements emerged starting with Oliver Kelly’s
‘National Grange of the Patrons of Husbandry’ in 1867, followed by the Greenback party, the
Farmers’ Alliance, and finally the Peoples’ Party of the 1890s, which was the backbone of the
Populists in the late nineteenth century. The farmers’ concerns have been summarized as
‘falling commodity prices, increased entry costs to farming, rising tenancy, farm foreclosure,
and uncertainties generated by harvests in another hemisphere and reliance upon markets an
ocean away’ (Atack, Bateman & Parker 2000).
However, the reasons for the discontent have long been disputed and putting it into the
context of the emergence of the United States as the leading agricultural exporter can only
appear to add to the confusion. Indeed, the reaction of American farmers was sharply at odds
with the standard interpretation of the Grain Invasion as first suggested by Harley (1980, 1986).
He demonstrated within a simple theoretical framework that the gains from falling
transportation costs should have been shared by producers in the US and consumers in Europe
with the establishment of a transatlantic grain market. The lower transportation costs caused
the price gap between American and European grain to narrow, resulting in a price decrease in
Europe (good for consumers) and a price increase in the United States (good for producers).
The Harley hypothesis fitted well into earlier research by North (1974), who argued that the
real price of farm products increased and transportation costs fell. However, this made it
difficult to relate the agrarian protest movement to deteriorating economic conditions. The
consensus view3 was therefore that the economic plight of farmers seemed to have been
exaggerated or misrepresented in earlier research which took farmers at their own word. As
Frieden (1997, p. 372) points out, ‘there is a puzzling weakness of evidence’ for a relationship
between economic conditions and farm protest.
3 This was shared for example by W. Parker and R. Higgs.
5
Accepting this, other researchers have looked elsewhere. One line of argument suggests that
income uncertainty increased or was particularly high in regions with strong farm reform
movements. The logic here is that there were welfare losses associated with price volatility if
farmers were risk averse (McGuire 1981). Another line of argument looks at the particular
problems of indebted farmers in a period of deflation. Since the general price level fell by half
or more in the Grain Invasion period, debt as a proportion of current income might increase
when nominal prices fall because the nominal debt for a farmer remains unaffected by the fall
in prices. The risk of foreclosures increased and fuelled unrest (Stock 1983). The problem with
this interpretation is that foreclosures were not very frequent, but Stock argues that even so
most farmers would have known someone who was affected which fuelled a fear of being the
next victim. States with a higher frequency of foreclosures were fertile ground for the protest
movement.
Interesting as these explanations are they do not seem to have convinced the profession of
economic historians. As Mayhew (1972, p. 466) points out, it is ‘puzzling that farmers began
complaining about railroad rates, interest rates, and problems of obtaining credit in a period
when freight rates and interest rates were falling rapidly and when… credit was easily
available’. She continues that it ‘is also puzzling that earlier fluctuations in prices did not
provoke farmer protest’. Thus, in a recent survey, Whaples (1995) reports that only 22 percent
of economists in the Economic History Association agreed with the proposition that ‘The
Agrarian protest movement in the Middle West from 1870 to 1900 was a reaction to the
deteriorating economic status of farmers’. 52 percent disagreed. Did farmers suffer from
money illusion, mistaking a nominal fall in income for a real fall? This seems unlikely given that
if farmers were aware of the prices of their own produce they must surely also have been
informed about the prices of the goods they purchased.4
In fact, we ought to be concerned about any argument that implies that people protest for the
wrong reasons, especially since European farmers are usually considered to have reacted in
accordance with economic theory. Economists usually believe that man acts fairly rationally on
4 Although see Friedman (1990, p. 1171) for a dissenting view.

6
the basis of knowledge that is accurate or at least not systematically misleading or biased.
Indeed, Cooley and DeCanio (1977) convincingly argued that American farmers responded
rationally to price signals during the period of discontent. However, in the dominant
explanation for the unrest farmers were simply wrong or seriously misinformed.5
In fact, the favored explanation for the unrest according to Whaples’ survey is almost
aggressively non-economic. Mayhew (1972) argued that farmers were simply upset by
‘commercialization’, ‘the increasing importance of prices’ and their being forced into an
economic system in which money was all important. Although we will attempt to reveal an
economic basis for the farmers’ concerns, our explanation is in fact compatible in a sense with
Mayhew’s. From a study of the contemporary political debate there is no doubt that farmers
themselves were clearly under the impression that their economic condition was deteriorating.
And there is also no doubt that the objects of their frustration were those identified by
Mayhew: the owners of railroads, moneylenders, manufacturers, banks etc. All these were
perhaps representative of the increasing commercialization of agriculture but more generally
they were just one aspect of the increasing internationalization of agriculture, and indeed
economic life in general, which occurred in the second half of the nineteenth century.
What the farmers were then really experiencing was their submergence in the new Atlantic
Economy. This gave rise to concerns which were entirely economic in nature. Exposure to
distant export markets had differential effects on producers in America. The farmers’ concerns
were thus entirely consistent with those of rational economic agents.
3. A Simple Model for Understanding the Populist Protests
Our explanation for the protests thus rests on the perceived ‘unfairness’ of the transaction
costs endured by farmers wishing to get their produce to market, and that these were greater
5 This idea was also apparent in the statements of contemporaries, for example the President of the Boston Manufacturers’ Mutual Fire Insurance Company in evidence before the British Royal Commission on Agriculture in 1879 (1881, C. 7400): “You do not think that the [agrarian protest] movement then has any real economic basis?--No…”

7
for farmers further west. In fact, rail services in the US were dominated by price-fixing cartels6
which were remarkably stable because they were good at deterring new entrants and at
penalizing defectors. In many areas, they faced little competition, with the greatest exception
being area with access to water, and in particular in terms of the export trade through New
York from transportation over the Great Lakes. Lake transport was more competitive because it
was serviced by a large number of independent vessel owners7.
Populist agitators thus frequently singled out grain traders and railroad companies as culprits.
These alleged or real distortions related to railroad companies exploiting their monopoly power
and middlemen downgrading the grain delivered to market thereby lowering the farm gate
price. The founding convention of the People’s (Populist) Party set out the basic political line in
the Omaha Platform adopted on July 4, 1892. Tight regulation of railways, and in fact
government ownership of rail and telegraph, was advocated, or as it was polemically
formulated: ‘…the time has come when the railroad corporations will either own the people or
the people must own the railroads.’8
Much of the farmers’ protest was thus related to alleged or real price distortions which made
price gaps too big. As referred to above and following the Law of One Price, price differentials
will reflect transportation and other transaction costs between markets, and we thus argue that
cartel pricing was more of a concern the more farmers were exposed to larger transportation
costs. For states further west this was even more of a concern because they were land-locked,
6 Legislators and public opinion had their eyes on the cartels and the Interstate Commerce Act in 1897 was a first attempt to regulate the cartels, which however continued as ‘voluntary associations’ and seemed not to lose their grip on price-fixing. Freight rate changes were announced by these associations and were duly noted and commented upon by the local press. The Sherman Antitrust Act (1890) was supposed to be a more effective way of tackling this collusion, but it was not until the Trans-Missouri decision of the Supreme Court in 1897 that the cooperation of rail operators was considered a violation of the Sherman Act. There is no consensus on whether the Sherman Act in the end was effective. There were significant rate reductions after the Trans-Missouri decisions on some roads and antitrust legislation triggered off a merger movement which seems to have counteracted the effect of this on rail equity (Kolko 1965, Binder 1988). Anyway, most of these developments are from after the period analyzed in the present paper. 7 This is illustrated nicely by the fact that rail prices regularly followed a seasonal pattern of increasing when transport over the lakes was stopped by ice only to fall again in the spring. 8 They also advanced the idea of government supported granaries, the so-called ‘sub treasury plan’, where farmers could store their grain until prices had recovered after the post-harvest fall. These granaries, which never materialized, were supposed to advance temporary cash to farmers to evade loan-sharks while waiting for higher prices.
8
that is they had no direct access to the Great Lakes which, as noted above, had a more
competitive transport sector.
Moreover, it is also well known from behavioral economics that people are particularly
concerned by what they consider to be unfair outcomes. For example, in a pioneering article,
Kahneman et al (1986) singled out the exploitation of the market power of firms or employers
as particularly objectionable. This sentiment is of course the background for much of the
popular support for anti-trust legislation which was a cornerstone of Populist politics. In this
sense, a ‘fair’ price would be that which would be set in the absence of the monopolistic
practices of rail companies and the monopsonistic power of grain merchants and credit
institutions.
Evidence to support our theory would be that the Populist vote rose with the exposure to high
transportation costs and other transactions costs as revealed by the size of the gap between
the export hub price and the local price. However, to the extent that the price gap is due to
railroad operators exploiting their market power, it should be smaller in states with access to
alternative means of transportation, and thus the Populist vote should also be smaller.
This framework does not directly address the timing of the discomfort and protest of US
farmers, however. This we believe had to do with the increasing globalization of the grain
markets in the last third of the nineteenth century, due largely to declining transportation
costs, which both made farmers knowledgeable about prices in export hubs and in Europe, and
brought new land into world agricultural markets. Furthermore, thanks to rapid biological
innovation, in this period the frontier was being extended westwards (Olmstead and Rhode
2002, 2008, 2011). Falling domestic transportation costs and the creation of new biological
technologies thus provided the mechanism whereby frontier farmers were invited into the
world market for grain. Over the nineteenth century the center of wheat production moved
from New York State, Virginia and Pennsylvania to the Midwest states which dominated around
the Civil War with states such as Illinois, Iowa, Michigan and Wisconsin. But by the end of the
nineteenth century the major new wheat producing states were Nebraska, Kansas and North
and South Dakota (Olmstead and Rhode 2007).
9
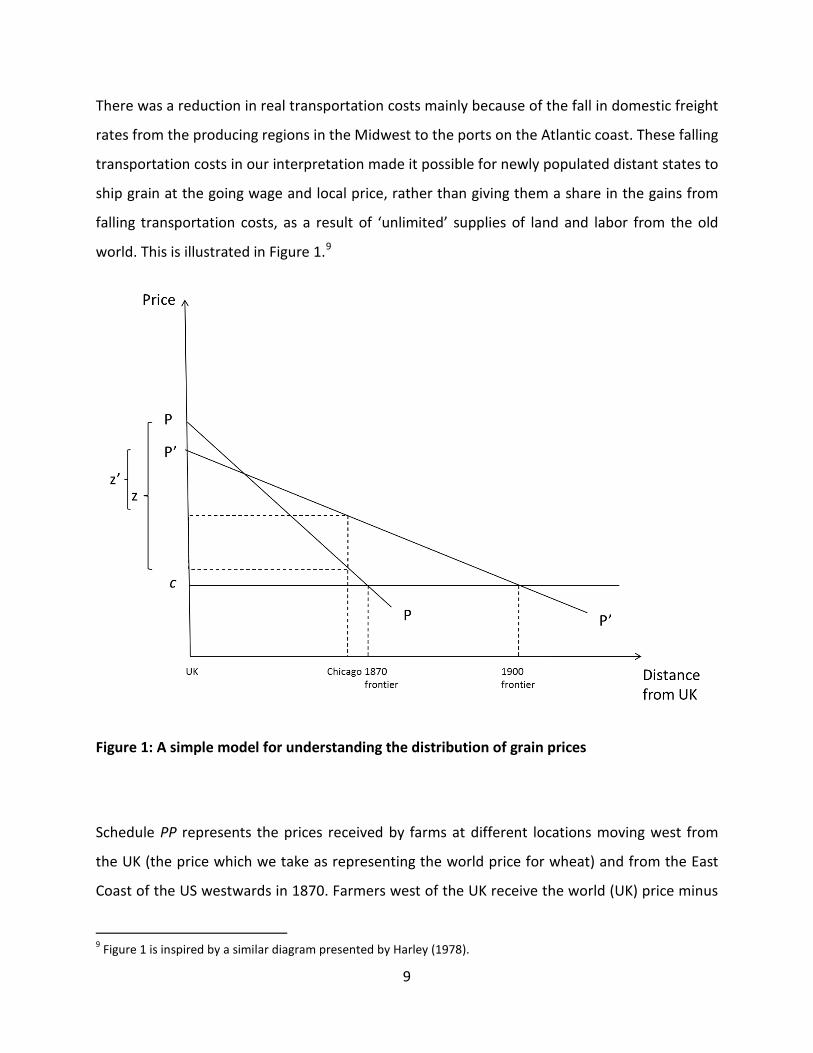
There was a reduction in real transportation costs mainly because of the fall in domestic freight
rates from the producing regions in the Midwest to the ports on the Atlantic coast. These falling
transportation costs in our interpretation made it possible for newly populated distant states to
ship grain at the going wage and local price, rather than giving them a share in the gains from
falling transportation costs, as a result of ‘unlimited’ supplies of land and labor from the old
world. This is illustrated in Figure 1.9
Figure 1: A simple model for understanding the distribution of grain prices
Schedule PP represents the prices received by farms at different locations moving west from
the UK (the price which we take as representing the world price for wheat) and from the East
Coast of the US westwards in 1870. Farmers west of the UK receive the world (UK) price minus
9 Figure 1 is inspired by a similar diagram presented by Harley (1978).
10
the transportation and other transaction costs, following the Law of One Price. The location of
the frontier is given where farmers can just cover their costs, i.e. where p = c.10 Note that this
model assumes that land and labor supply is very elastic, which is also true for this period, given
the availability of land in the West, and the immigration from especially Europe.
z represents the transaction costs involved in shipping wheat from a fixed location to the UK.
We call this location ‘Chicago’, since this is where the prices typically used to analyze this period
come from. By the end of the nineteenth century, technological advances in transportation
have resulted in transaction costs falling at all locations, and z falls to z’. This causes the slope of
the PP schedule to flatten, giving the new schedule PP’. Clearly, in Chicago farmers enjoy higher
prices, and lower shipping costs to the UK, where consumers thus pay lower prices. Everyone’s
a winner. Or are they?
Most statements of what happened to the real price of, say, wheat, refer either to the price at a
specific location or to some average price including several locations, but usually this average is
unweighted. This practice has important repercussions if the geographical concentration of
production changes. In the present case, wheat production moved away from states with high
prices to states with lower prices. In fact, the location and output share weighted real price of
US wheat actually stagnated, albeit with large swings, between 1870 and 1900. In 1892 the
price of wheat was approaching a trough, at just 79 percent of its 1890 level or 82 percent of its
1880 level.
This aside, from our model it can be seen that whether farmers gained or lost from
globalization depended on their location. Those furthest east (to the left of where the PP and
P’P’ schedules intersect) receive a lower price for their produce, while farmers west of this
point and up to the old frontier receive a higher price. Beyond the 1870 frontier, new farmers
are being brought into the world economy, and whether they receive higher or lower prices
depends on the previous local demand and supply conditions. Note, however, that frontier
farmers always receive only c for their produce, and thus just cover their costs. Note also, that 10 The assumption of constant costs across states is not important. Allowing for a Ricardian extensive margin with increasing costs further west would, however, imply even lower markups for these farmers. This if anything strengthens our argument.

11
productivity improvements in agriculture will simply cause c to fall, thus causing prices to fall at
all locations.
The implication from this in terms of the farm protest is quite simple. If the transaction costs
were considered ‘unfair’ (i.e. due to e.g. the monopoly power of railroads) then the protest
should have been louder in the recently settled areas of the frontier, where the price received
was considerably lower than the East Coast price (for example than in New York). We will
demonstrate in the next section that farm gate prices were indeed lower the further west the
producer was, and that this matched the pattern of protest.
As Figure 1 illustrates, however, producers close to export harbors on the East Coast would
actually face lower prices as transportation costs fell. So why did they not react in the same way
as Western farmers? To understand this it is helpful to apply Hirschman’s exit-voice dichotomy
(Hirschman 1970). This idea essentially acknowledges two types of reactions to a deteriorating
economic situation: you either exit the market (or the condition) or you voice your concerns.
Eastern famers were able successfully to follow the ‘exit’ strategy by diversifying out of grain to
other agricultural products: vegetables, meat, dairy products, poultry etc., or by a movement
into other sectors of the economy. This strategy was possible because these farmers worked
close to large urban centers with a diversified demand for goods relying on fairly swift
transportation. Farmers in the Western settler states did not have the opportunity to exit, and
thus voiced their concerns politically. We test for both the ‘voice’ in protest at price
differentials, and the ‘exit’ from wheat production in the following.
4. An Empirical Investigation of the Reasons for the Populist Protest
We test whether the burden of transportation costs as revealed by price differentials explains
the pattern of protest by regressing the level of protest by state on the price of wheat by state
relative to an export hub price, New York. However, as noted above, the cartel power that
railroad corporations held was challenged in those states which had access to sea transport
over the Great Lakes. We therefore expect voting preferences for the People’s Party to be

12
negatively correlated to location on the Great Lakes. Geographical location also has other
effects. In the areas of recent settlement the financial infrastructure was less developed and
less competitive. This might explain (part of) the interest rate premium paid in those states.
When perceived as a discriminatory practice it can be expected to increase voting preferences
for the populists.
We quantify the extent of political protest by state using the percentage share of votes for the
People’s Party candidate in the 1892 Presidential election, which we term 𝑣𝑜𝑡𝑒𝑖. Although 1896
perhaps marked the height of the protests, the Populist candidate in that year stood for the
Democratic Party. The advantage with the 1892 election is thus that the Populist vote is
recorded separately. Figure 3 illustrates this: clearly, Midwestern states were those with the
highest voting shares. Note that AK, AZ, HI, NM, OK, and UT (six present day states) had not yet
achieved statehood, thus giving 44 observations in total.
Figure 3: Percentage of votes for the People’s Party candidate in the Presidential election of
1892
Source: www.uselectionatlas.org
13
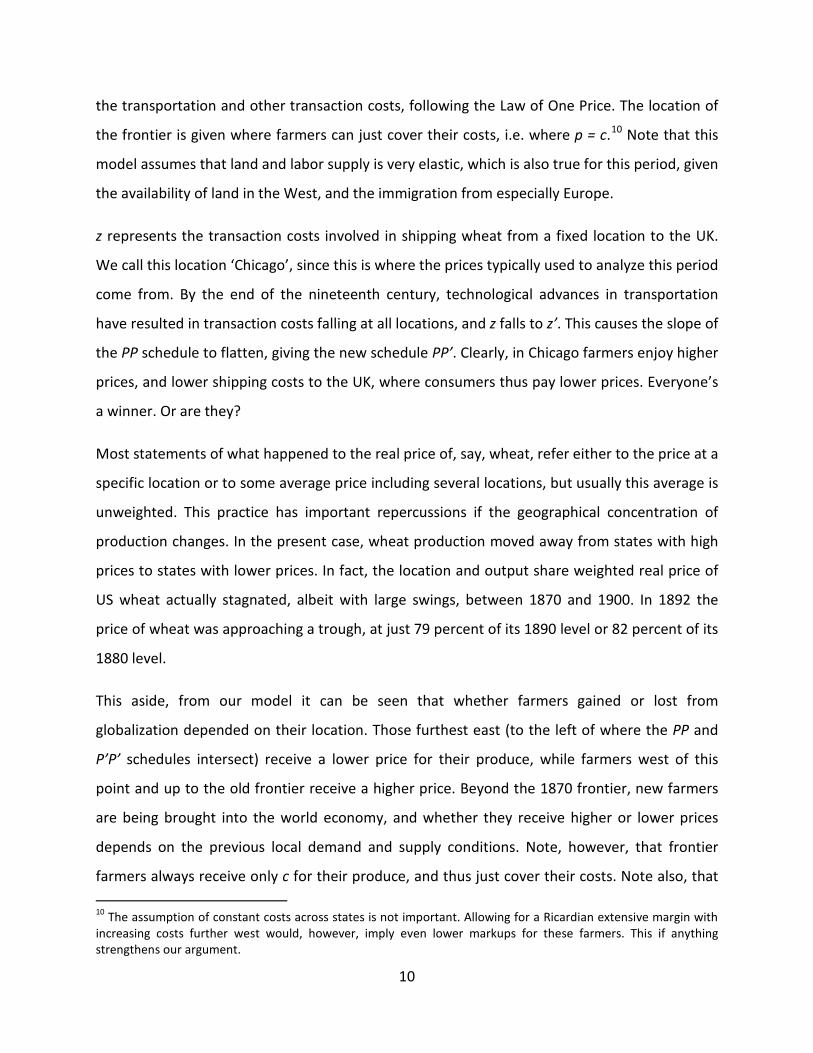
For prices, we use the ATICS dataset, collected and described in detail by Cooley et al (1977)11,
for the prices of wheat by state in 1890. The database refers to farm gate prices (recorded on
December 1) and thus measures directly the prices relevant for the welfare of farmers. Our use
of relative wheat prices alone might seem odd, but wheat was both the most ubiquitous crop
and the most important in terms of exports. Figure 4 gives some price series relative to the
price in New York: note the pattern of prices – high in the East, low in the West. This seems to
fit our model very well.12 States which received particularly high prices were most likely not
exporting, and were rather paying a premium for imports from New York.
Figure 4: Farm gate prices of wheat relative to New York on December 1, 1890
Source: ATICS, see Cooley et al (1977).
11 ATICS was kindly made available to us by Stephen J. DeCanio. 12 A possible objection is that the price differences were simply due to quality differences between the states. Of course, this is a possibility, but in fact there are theoretical reasons to believe that the wheat furthest from the East Coast should have had the highest quality, and thus the highest price ceteris paribus. A.A. Alchian and W.R. Allen (1967) noted long ago that there is good reason to ‘ship the best apples out’ since transportation costs do not differ for good and bad apples making the low quality apple relatively more expensive in foreign markets. Transportation is thus simply a specific price increase which lowers the relative price of the higher-quality produce in the distant market. East Coast and European demand will therefore shift to the high quality variety of the commodity. Producers might have been expected to meet that demand by improving the quality of the product.
0.6
0.7
0.8
0.9
1
1.1
1.2
Nort
h Da
kota
Sout
h Da
kota
Ore
gon
Calif
orni
aNe
bras
kaW
ashi
ngto
nKa
nsas
Idah
oIo
wa
Mon
tana
Wyo
min
gCo
lora
doM
ichi
gan
Min
neso
taW
iscon
sinNe
vada
Illin
ois
Indi
ana
Miss
issip
piO
hio
Kent
ucky
Mar
ylan
dLo
uisia
naTe
xas
Wes
t Virg
inia
Dela
war
eVi
rgin
iaTe
nnes
see
Arka
nsas
Penn
sylv
ania
Mas
sach
uset
tsNe
w Je
rsey
New
Yor
kNo
rth
Caro
lina
Sout
h Ca
rolin
aAl
abam
aCo
nnec
ticut
Flor
ida
Geor
gia
Miss
ouri
Rhod
e Isl
and
Verm
ont
Mai
neNe
w H
amps
hire
14
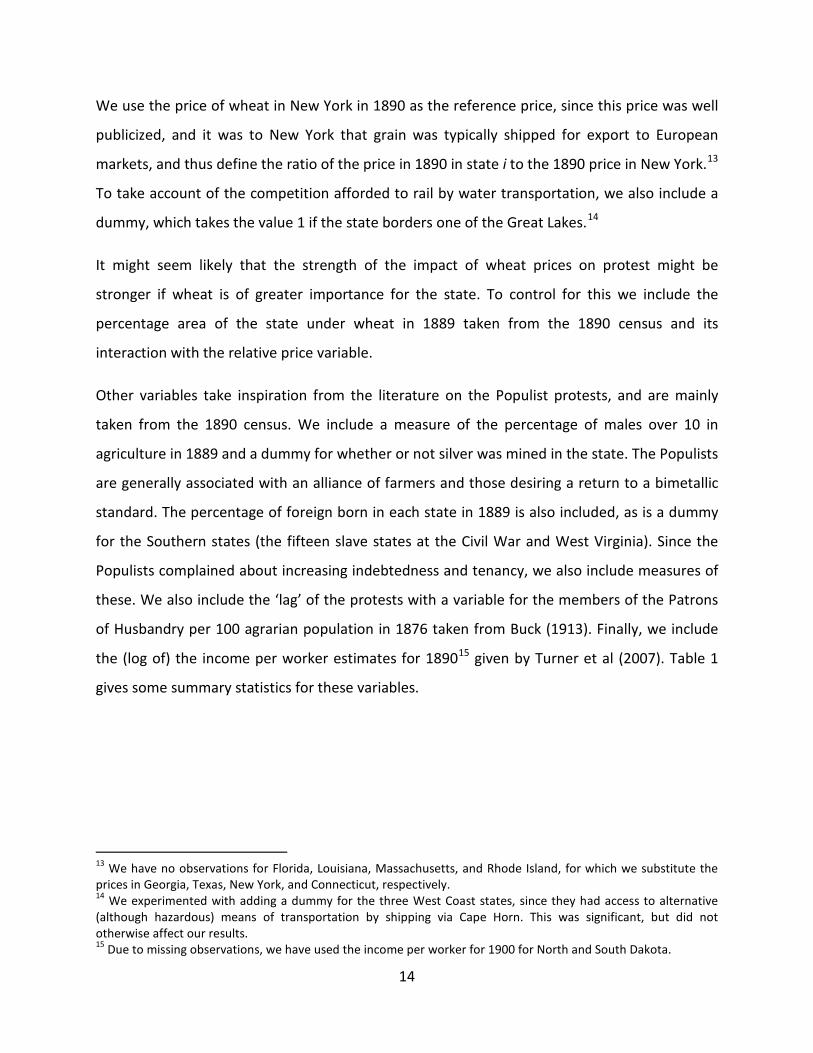
We use the price of wheat in New York in 1890 as the reference price, since this price was well
publicized, and it was to New York that grain was typically shipped for export to European
markets, and thus define the ratio of the price in 1890 in state i to the 1890 price in New York.13
To take account of the competition afforded to rail by water transportation, we also include a
dummy, which takes the value 1 if the state borders one of the Great Lakes.14
It might seem likely that the strength of the impact of wheat prices on protest might be
stronger if wheat is of greater importance for the state. To control for this we include the
percentage area of the state under wheat in 1889 taken from the 1890 census and its
interaction with the relative price variable.
Other variables take inspiration from the literature on the Populist protests, and are mainly
taken from the 1890 census. We include a measure of the percentage of males over 10 in
agriculture in 1889 and a dummy for whether or not silver was mined in the state. The Populists
are generally associated with an alliance of farmers and those desiring a return to a bimetallic
standard. The percentage of foreign born in each state in 1889 is also included, as is a dummy
for the Southern states (the fifteen slave states at the Civil War and West Virginia). Since the
Populists complained about increasing indebtedness and tenancy, we also include measures of
these. We also include the ‘lag’ of the protests with a variable for the members of the Patrons
of Husbandry per 100 agrarian population in 1876 taken from Buck (1913). Finally, we include
the (log of) the income per worker estimates for 189015 given by Turner et al (2007). Table 1
gives some summary statistics for these variables.
13 We have no observations for Florida, Louisiana, Massachusetts, and Rhode Island, for which we substitute the prices in Georgia, Texas, New York, and Connecticut, respectively. 14 We experimented with adding a dummy for the three West Coast states, since they had access to alternative (although hazardous) means of transportation by shipping via Cape Horn. This was significant, but did not otherwise affect our results. 15 Due to missing observations, we have used the income per worker for 1900 for North and South Dakota.

15
Table 1: Summary statistics
Mean Std.Dev Min Max % votes for Populists 15.72 19.00407 0 66.780 State price / NY price of wheat (A) 0.92 0.130089 0.700 1.150 Access to the Great Lakes 0.18 0.390154 0 1 Acres wheat / person 1.05 2.643296 0.000 16.200 % males over 10 in agriculture 48.02 18.805 10.500 80.110 Silver producing 0.30 0.461522 0 1 % Members of Patrons of Husbandry 1876 26.11 19.6467 0.000 88.500 % foreign born 0.16 0.119387 0.002 0.446 South 0.36 0.486607 0 1 Real Income 10526.69 4325.311 2870.047 19330.09
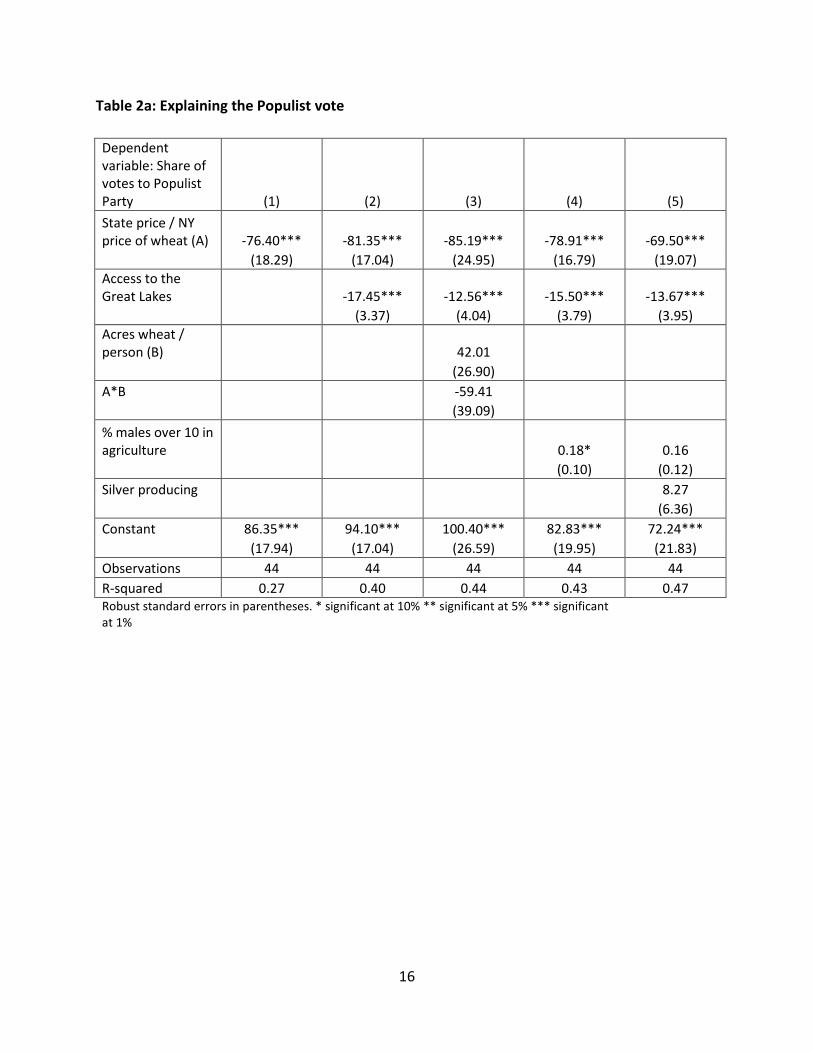
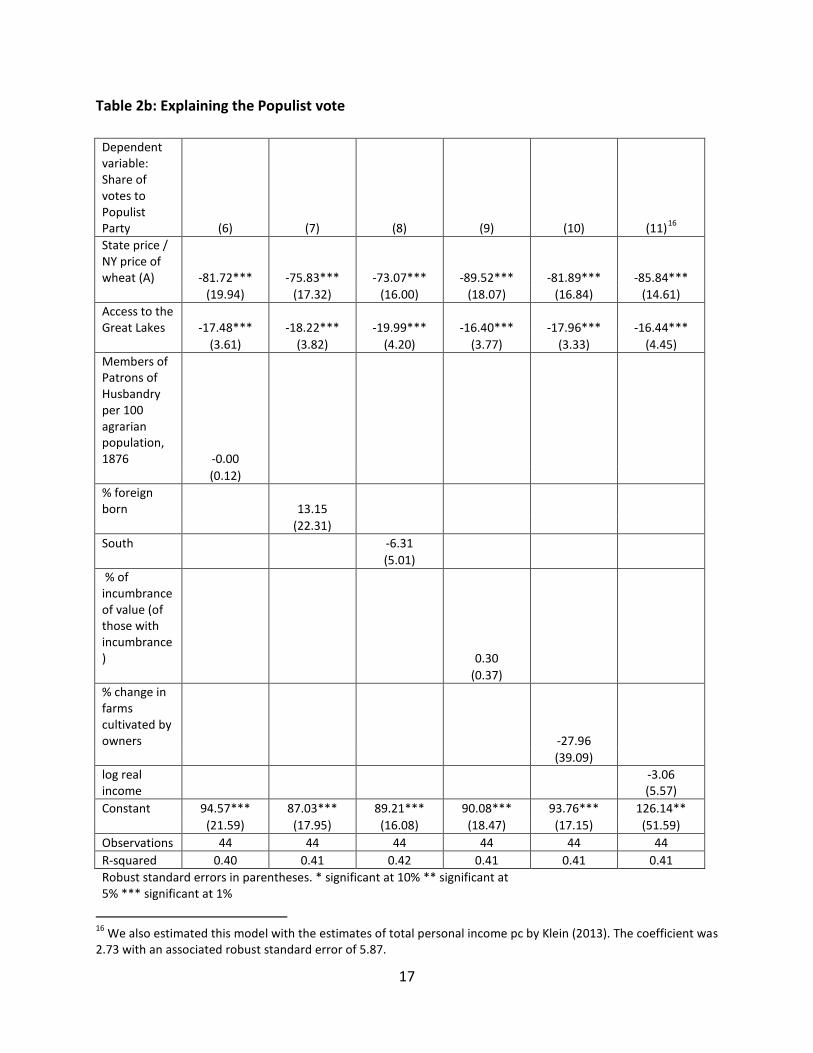
Tables 2a-b illustrate the strong correlation between the price ratio and the protests, and the
importance of access to the Great Lakes. None of the other variables, which we introduce one
at a time due to the limited degrees of freedom, have much explanatory power at all.
16
Table 2a: Explaining the Populist vote
Dependent variable: Share of votes to Populist Party (1) (2) (3) (4) (5) State price / NY price of wheat (A) -76.40*** -81.35*** -85.19*** -78.91*** -69.50*** (18.29) (17.04) (24.95) (16.79) (19.07) Access to the Great Lakes -17.45*** -12.56*** -15.50*** -13.67*** (3.37) (4.04) (3.79) (3.95) Acres wheat / person (B) 42.01 (26.90) A*B -59.41 (39.09) % males over 10 in agriculture 0.18* 0.16 (0.10) (0.12) Silver producing 8.27 (6.36) Constant 86.35*** 94.10*** 100.40*** 82.83*** 72.24*** (17.94) (17.04) (26.59) (19.95) (21.83) Observations 44 44 44 44 44 R-squared 0.27 0.40 0.44 0.43 0.47 Robust standard errors in parentheses. * significant at 10% ** significant at 5% *** significant at 1%
17
Table 2b: Explaining the Populist vote
Dependent variable: Share of votes to Populist Party (6) (7) (8) (9) (10) (11)16 State price / NY price of wheat (A) -81.72*** -75.83*** -73.07*** -89.52*** -81.89*** -85.84*** (19.94) (17.32) (16.00) (18.07) (16.84) (14.61) Access to the Great Lakes -17.48*** -18.22*** -19.99*** -16.40*** -17.96*** -16.44*** (3.61) (3.82) (4.20) (3.77) (3.33) (4.45) Members of Patrons of Husbandry per 100 agrarian population, 1876 -0.00 (0.12) % foreign born 13.15 (22.31) South -6.31 (5.01) % of incumbrance of value (of those with incumbrance) 0.30 (0.37) % change in farms cultivated by owners -27.96 (39.09) log real income
-3.06 (5.57)
Constant 94.57*** 87.03*** 89.21*** 90.08*** 93.76*** 126.14** (21.59) (17.95) (16.08) (18.47) (17.15) (51.59) Observations 44 44 44 44 44 44 R-squared 0.40 0.41 0.42 0.41 0.41 0.41 Robust standard errors in parentheses. * significant at 10% ** significant at 5% *** significant at 1%
16 We also estimated this model with the estimates of total personal income pc by Klein (2013). The coefficient was 2.73 with an associated robust standard error of 5.87.

18
We then experiment with another variable which has been considered to be of importance, the
interest rate premium calculated by Eichengreen (1984, PREM1), i.e. the markup on the interest
rate required to be paid further west, which implied higher costs for debtor farmers, and then a
measure of ‘exit’ as described above: the change in the wheat production between 1880 and
1890 (from the ATICS dataset). Summary statistics are given in Table 3, and the regression
results in Table 4.
Table 3: Summary statistics
Mean Std.Dev Min Max Log interest risk premium 3.93 1.44 1.29 7.59 Change in wheat production 0.88 4.33 -1.00 23.67
Table 4: Explaining the Populist vote
Dependent variable: Share of votes to Populist Party (11) (12)
State price / NY price of wheat -47.04*** -36.65* (16.98) (19.81) Access to the Great Lakes -9.39** -8.14* (4.40) (4.50) Log interest risk premium 21.86*** 22.14*** (6.45) (6.41) % change in wheat production 1880-1890 0.63* (0.35) Constant 32.67 21.92 (21.63) (23.71) Observations 44 44 R-squared 0.56 0.57 Robust standard errors in parentheses. * significant at 10% ** significant at 5% *** significant at 1%
19
The coefficient to the relative prices changes with the new variables, but the qualitative result
is robust. It seems that a substantial proportion of the variation in the Populist voting share can
be explained by our price and water variables, although the risk premium was also important.
This might have reflected the true risk of lending in frontier regions, but it seems likely that
there was also a role for monopoly markups in areas where bank depth was minimal. Whatever
the case, it is likely that farmers interpreted high interest rates as a demonstration of the
market power of the banks, clearly a story compatible with what we argue in the case of
transportation costs. The ‘exit’ variable also has the right sign – if wheat production fell, as it
might if farmers had the possibility to diversify out of grain as an exit strategy, then farmers
were less likely to protest. We take this as strong evidence in favor of our hypothesis.
5. Conclusion
We have argued that US farmers producing for foreign markets were right in identifying
economic stress in the Grain Invasion period. The traditional argument that wheat prices
increased relative to the general price level is not disputed, but we argue that the impact of the
fall in transportation costs on the grain producing sector differed according to location. Farm
protest was most intense in the regions near or at the grain producing frontier. Farmers in
these regions, we argue, were permitted by falling transportation costs to access foreign
markets, but only at the pre-determined farm income. These farmers received the world price
minus the transaction costs involved in getting their produce to market. Many considered these
costs to be unfairly large, owing to the monopoly power of rail firms and the discriminatory
practices of middlemen. Recognizing the gap between what they received and the price in
export hubs, the burden of transport and other transaction costs became apparent, and the
farmers most affected protested. It was only after this period that farmers found ways to do
something about this, first with the establishment of cooperative grain elevators, particularly in
the north-central United States (Kenkel 1922, p. 16), and later with the introduction of the
regulation of freight rates (Federico and Sharp 2013).

20
References
Alchian, A.A. & W.R. Allen (1977). University Economics. Belmont: Wadsworth Publishing Co.
Atack, J., F. Bateman and W.N. Parker (2000). ‘The Farm, the Farmer, and the Market’ in
Engerman, S.L & R.E. Gallman (eds.) (2000). The Cambridge Economic History of the United
States, Volume II. Cambridge University Press.
Binder, J.J. (1988). ‘The Sherman Antitrust Act and the Railroad Carterls’. Journal of Law and
Economics 31, pp. 443-468.
Cooley, T.F. & S.J. DeCanio (1977). ‘Rational Expectations in American Agriculture, 1867-1914’.
Review of Economics and Statistics 59:1, pp. 9-17.
Cooley, T.F., S.J. DeCanio and M.S. Matthews (1977). ATICS: An Agricultural Time Series-Cross
Section Dataset. NBER Working Paper No. 197.
Eichengreen, B. (1984). ‘Mortgage interest rates in the populist era.’ American Economic Review
74:5, pp. 995-1015.
Ejrnæs, M, K.G. Persson and S. Rich (2007). ‘Feeding the British: convergence and market
efficiency in the nineteenth-century grain trade’. Economic History Review 61:S1, pp. 140-171.
Federico, G. and Sharp, P. (2013). ‘The Cost of Railroad Regulation: The Disintegration of
American Agricultural Markets in the Interwar Period’. Economic History Review forthcoming.
Frieden, J.A. (1997). ‘Monetary Populism in Nineteenth-Century America: An Open Economy
Interpretation’. Journal of Economic History 57:2, pp. 367-395.
Friedman, M. (1990). ‘The Crime of 1873’. Journal of Political Economy 98:6, pp. 1159-1194.
Harley, C.K. (1978). ‘Western Settlement and the Price of Wheat, 1872-1913’. Journal of
Economic History 38:4, pp. 865-879.
Harley, C.K. (1980). ‘Transportation, the World Wheat Trade, and the Kuznets Cycle, 1850-
1913’. Explorations in Economic History 17, pp. 218-250.

21
Harley, C.K. (1986). ‘Late Nineteenth Century Transportation, Trade and Settlement’ in W.
Fisher et al (eds.) The Emergence of a World Economy 1500-1914, Part II: 1850-1914.
Weisbaden, West Germany: Franz Steiner Verlag.
Henriksen, I. (1993). ‘The Transformation of Danish Agriculture 1870-1914’ in K.G. Persson (ed.)
The Economic Development of Denmark and Norway since 1870. Cheltenham: Edward Elgar.
Hirschman, A.O. (1970). Exit, Voice and Loyalty. Cambridge, MA: Harvard University Press.
Kahneman, D., J.L. Knetsch and R. Thaler (1986). ‘Fairness as a Constraint on Profit Seeking:
Entitlements in the Market’. American Economic Review 76, pp. 719- 741.
Kenkel, J.B. (1922). The Cooperative Elevator Movement: A Study in Grain Marketing at Country
Points in the North Central States. Washington, DC: Catholic University of America.
Klein, A. (2013). ‘New State-Level Estimates of Personal Income in the United States, 1880-
1910.’ Research in Economic History 29, pp. 191-255.
Kolko, G. (1965). Railroads and Regulation 1877-1916.
Mayhew, A. (1972). ‘A Reappraisal of the Causes of Farm Protest in the United States, 1870-
1900’. Journal of Economic History 32:2, pp. 464-475.
McGuire, R. (1981). ‘Economic Causes of Late Nineteenth Century Agrarian Unrest: New
Evidence’. Journal of Economic History 41, pp. 835-52.
North, D.C. (1974). Growth and Welfare in the American Past. Englewood Cliffs.
Olmstead, A. L. and P.W. Rhode (2002). ‘The red queen and the hard reds: Productivity growth
in American wheat, 1800–1940.’ Journal of Economic History 62:4, pp. 929-966.
Olmstead, A. L. and P.W. Rhode (2007). ‘Biological Globalization: The Other Grain Invasion.’
Chapter 5 In The New Comparative Economic History: Essays in Honor of Jeffrey G. Williamson.
Cambridge, MA: MIT Press.

22
Olmstead, A. L. and P.W. Rhode (2008). Creating Abundance: Biological Innovation and
American Agricultural Development. Cambridge: Cambridge University Press.
Olmstead, A. L. and P.W. Rhode (2011). ‘Adapting North American wheat production to climatic
challenges, 1839–2009.’ Proceedings of the National Academy of Sciences 108:2, pp. 480-485.
O’Rourke, K.H. (1997). ‘The European Grain Invasion 1870-1913’. Journal of Economic History
57, pp.775-801.
O’Rourke, K.H. and J.G. Williamson (1999). Globalization and History. London: The MIT Press.
Rogowski, R. (1989). Commerce and Coalitions: How Trade Affects Domestic Political
Alignments. Princeton, NJ: Princeton University Press.
Stock, J.H. (1983). ‘Real Estate Mortgages, Foreclosures and Midwestern Agrarian Unrest, 1865-
1920’. Journal of Economic History 44, pp. 89-105.
Turner, C., R. Tamura, S.E. Mulholland and S. Baier (2007). ‘Education and income of the states
of the United States: 1840–2000.’ Journal of Economic Growth 12:2, pp. 101-158.
Whaples, R. (1995). ‘Where Is There Consensus Among American Economic Historians? The
Results of a Survey on Forty Propositions’. Journal of Economic History 55, pp. 139-54.
Williamson, J.G. (1980). ‘Greasing the Wheels of Sputtering Export Engines: Midwestern Grains
and American Growth.’ Explorations in Economic History 17, pp. 189-217.