winners and losers in the massachusetts housing market · 4 winners and losers in the massachusetts...
TRANSCRIPT

Winners and Losersin the MassachusettsHousing Market
A Study for Citizens’ Housing and Planning Association and the Massachusetts Housing Partnership
Prepared byMichael D. Goodman, Ph.D.Director of Economic and Public Policy ResearchUniversity of Massachusetts Donahue Institute
James Palma, MRP, AICPResearch ManagerUniversity of Massachusetts Donahue Institute
WithLali KipshidzeRobert LaceyRebecca LovelandAlexandra Proshina
Recent Changes in Housing Demand, Supply, and Affordability
Donahue Institute

Winners and Losersin the Massachusetts
Housing Market
Recent Changes inHousing Demand, Supply, and Affordability
A Study forCitizens’ Housing and Planning Association
and the Massachusetts Housing Partnership
Prepared byMichael Goodman, Ph.D.James Palma, MRP, AICP
WithLali KipshidzeRobert Lacey
Rebecca LovelandAlexandra Proshina
Office of the PresidentUMass Donahue Institute
January 2004

Citizens’ Housing and Planning Association, Inc.18 Tremont Street, Suite 401Boston, MA 02108(617) 742-0820www.chapa.org
Massachusetts Housing Partnership2 Oliver StreetBoston, MA 02108(617) 388-7868www.mhp.net
Office of the PresidentUMass Donahue Institute220 Middlesex HouseUniversity of MassachusettsAmherst, Massachusetts 01003(413) 545-0001
© 2004 Citizens’ Housing and Planning Association, Inc. and Massachusetts HousingPartnership. All rights reserved.

iii
Contents
Executive Summary . . . . . . . . . . . . . . . . . . . . . . . . . . . . . . . . . . . . . . . . . . . .1
Introduction . . . . . . . . . . . . . . . . . . . . . . . . . . . . . . . . . . . . . . . . . . . . . . . . .3
1 Changes in Housing Affordability, 1980–2003 . . . . . . . . . . . . . . . . . . .4
2 Changes in Housing Supply . . . . . . . . . . . . . . . . . . . . . . . . . . . . . . . .10
3 Affordability Problems . . . . . . . . . . . . . . . . . . . . . . . . . . . . . . . . . . . .15
4 Reasons for the Lack of Housing Construction . . . . . . . . . . . . . . . . . .20
5 Household Outcomes in the Massachusetts Housing Market . . . . . . . .25
Findings and Conclusions . . . . . . . . . . . . . . . . . . . . . . . . . . . . . . . . . . . . . .27
Notes . . . . . . . . . . . . . . . . . . . . . . . . . . . . . . . . . . . . . . . . . . . . . . . . . . . .29
Appendix . . . . . . . . . . . . . . . . . . . . . . . . . . . . . . . . . . . . . . . . . . . . . . . . . .31

iv
List of Figures and Tables
Figure 1 House Price History for Massachusetts and United States. . . . . . . .4Figure 2 Single-Family Home Average Sales Price in 2002 . . . . . . . . . . . . . . .5Figure 3 Fair Market Rent Values for Massachusetts MSAs, FY 1985–2004 . .6Figure 4 Median Income for Four-Person Families, 1975–2000 . . . . . . . . . . .8Figure 5 Change in Number of Households by Size, 1980–2000. . . . . . . . .11Figure 6 Rates of Ownership in Structures of More Than Five Units,
1950–2000. . . . . . . . . . . . . . . . . . . . . . . . . . . . . . . . . . . . . . . . .13Figure 7 Developable Land by Region, 2001. . . . . . . . . . . . . . . . . . . . . . .21Figure 8 Job–Housing Balance, 2000, with Numerical Change
in Housing Units, 1990–2000 . . . . . . . . . . . . . . . . . . . . . . . . . . . .24Figure 9 Median Income vs. Median Home Price, 2001 . . . . . . . . . . . . . . . .26
Table 1 2003 Housing Wage Data for Massachusetts and Its MSAs . . . . . . .7Table 2 Change in Occupancy Status (Tenure) by Units in Structure,
1990–2000 . . . . . . . . . . . . . . . . . . . . . . . . . . . . . . . . . . . . . . . . .12Table 3 Affordability for Owners, 1990–2000 . . . . . . . . . . . . . . . . . . . . . . .15Table 4 Owner-Occupied Households Paying 30 Percent or More
for Housing by Mortgage-Interest Rate, 2000 . . . . . . . . . . . . . . . . .16Table 5 Household Income by Selected Monthly Owner Costs
as a Percentage of Household Income, 1999 . . . . . . . . . . . . . . . . .17Table 6 Affordability Level by Year Moved into Home, 2000
(Owner-Occupied Householders Ages 25–64) . . . . . . . . . . . . . . . . .17Table 7 Affordability for Renters, 1990 and 2000 . . . . . . . . . . . . . . . . . . .18Table 8 Renters Paying More Than 30 Percent of Household Income, 2000 . .18Table 9 Monthly Renter Costs as a Percentage of Household Income
in 1999, by Income Level . . . . . . . . . . . . . . . . . . . . . . . . . . . . . . .19Table 10 Affordability Level by Year Moved into Home, 2000
(Renter Householders Ages 25–64) . . . . . . . . . . . . . . . . . . . . . . . .19Table 11 Acreage Used 1971–1999 and Occupied Housing Units Built
1970–2000 . . . . . . . . . . . . . . . . . . . . . . . . . . . . . . . . . . . . . . . . .21

1
Executive Summary
A COMPREHENSIVE EXAMINATION of 2000 Census housing data underscoresthe depth of the housing challenge facing the Commonwealth, and reveals that the hous-ing market in Massachusetts has created clear winners and losers.
While many lower and middle-income families struggle to find and afford housing,others who entered the housing market earlier have benefited substantially and innumerous instances have gained substantial additional equity in their homes.
Many people have been left behind in the current system. Among them are the verypoor and low-income families and young middle-income families just starting out, whoincreasingly cannot afford to establish deep roots in Massachusetts. In a sense, all ofMassachusetts loses, because the increasing costs of living here drives many talentedpeople away and makes companies think twice about locating (or remaining) here.
Key Findings:
Housing Costs and Affordability
• According to the Office of Federal Housing Enterprise Oversight, between 1980and 2003, the nation’s largest overall percentage increase in housing pricesoccurred in Massachusetts . The cost of rental housing has grown similarly. A recentstudy by the National Low Income Housing Coalition rated Massachusetts as beingthe least affordable state in which to rent an apartment in 2003 .
• Over 260,000 Massachusetts owner-occupied households and over 330,000 house-holds that rent spend more than 30% of income on housing costs. Many of thesehouseholds earn middle-class incomes.
• The hardest hit by these price increases are younger people and lower-incomehouseholds. New job seekers are increasingly affected by the lack of supply andhigh cost of housing in Massachusetts. Young, first-time homebuyers are essentiallylocked out of the housing market in eastern Massachusetts and must be content torent increasingly expensive apartments, move further and further from their jobs,or even migrate out of Massachusetts entirely .
• Of the homeowners in Massachusetts with household incomes of between $35,000and $50,000, almost 37 percent, or more than one-third of households, pay morethan 30 percent of their income for housing costs. Of those making from $50,000to $75,000, 20 percent, or one in five households, spend more than 30 percent oftheir income on housing.

2 WINNERS AND LOSERS IN THE MASSACHUSETTS HOUSING MARKET
• In 2000, nearly 339,000 Massachusetts households that pay rent spent over 30percent of their income doing so. In 2000, 39 percent of all renters paid 30 percentor more of their household income in rent, and 18 percent paid 50 percent ormore.
Housing Supply
• The failure of the supply of housing in the Commonwealth to keep up with expand-ing demand explains much of these price increases. Between 1990 and 2000 inMassachusetts, the number of new households increased 8.7 percent, whereas thenumber of new housing units increased by only 6.0 percent. As a result, it hasbecome increasingly difficult to find available housing. To have kept pace withdemand, the Commonwealth would have needed to produce approximately 70,000more housing units than it did.
• From 1990 to 2000, while there was some creation of new three and four familyhomes and developments of 50 or more units, there was a significant loss of two-family, five-to-nine-family, and ten-to-nineteen-family structures. During the 1990s,37,563 new multifamily units were created but 20,236 existing units were lost(demolished or uninhabitable).
• In 2000, Massachusetts had the lowest vacancy rate for owner-occupied housing ofall 50 states and the District of Columbia (0.7 percent, vs. 1.7 percent for thenation) and was tied for the lowest vacancy rate for renter-occupied housing units(3.5 percent, vs. 6.8 percent for the nation). For Massachusetts to have kept thesame vacancy rates in 2000 that it had in 1990, more than 47,000 additional hous-ing units would have needed to be constructed during the 1990s, and 33,000 ofthose would have needed to be multifamily units. In fact, there was a 55 percentdecline in new housing construction in the decade of the 1990s as compared to the1980s.
Hidden Homeless
• The lack of affordable housing is resulting in increasing numbers of Massachusettsfamilies doubling up with family members, as a solution to their housing needs.The Census Bureau refers to these families as “subfamilies” and, from 1980 to 2000,their number increased from 26,000 to 52,000. In that period, the number of chil-dren living in subfamilies in Massachusetts rose 488 percent. Many people living insubfamilies could be thought of as the “hidden homeless,” people who, withoutfamily support, could be living on the street. The growing numbers of people andfamilies sharing living quarters represent huge adjustments that more and moreMassachusetts residents and their children have been forced to make to find a placeto live in the Commonwealth.
3
Introduction
THE AVAILABILITY of affordable housing in Massachusetts is the largest problemfacing the Commonwealth, according to respondents to a recent poll on the quality oflife in Massachusetts. Statewide, 54 percent of respondents felt that affordable housingwas an area in need of major improvement in the state.1 In the Greater Boston region,even more respondents (60 percent) identified affordable housing as a major issue.Since the mid-1990s, housing prices in Massachusetts have been steadily increasing.Although this increase has been most visible in the Greater Boston region, every regionof the Commonwealth has seen prices rise. While the price increase since 1995 has beendramatic, it is not unique. Massachusetts has seen this level of price increase before—andquite recently.
In 1980, Massachusetts was a relatively affordable place in which to buy or rent ahouse for most families, ranking twenty-sixth out of the fifty states in the affordability ofowner-occupied housing. But this situation changed significantly during the 1980s, so by1990 Massachusetts had become the third most expensive state to buy a house, a positionit retained in 2000.2 According to the Office of Federal Housing Enterprise Oversight,between 1980 and 2003, the nation’s largest overall percentage increase in housingprices occurred in Massachusetts.3 The cost of rental housing has grown similarly. In a2003 study, Massachusetts was rated the least affordable state in which to rent anapartment.4
It is important to recognize that these trends in home prices and housing affordabil-ity have not had a uniform effect on working families throughout Massachusetts. Thestory of the Massachusetts housing market contains both winners and losers. The clearwinners are those who entered the market early enough to benefit directly from thedramatic rise in home values, while those left behind include renters and low- andmiddle-income working families who cannot gain entry to the market and who have nothad the opportunity to benefit from the increases in property values (or the goodfortune to have been the recipients of financial assistance from relatives).

4 WINNERS AND LOSERS IN THE MASSACHUSETTS HOUSING MARKET
Housing Price Trends for Owner-Occupied Homes
MUCH OF THE NATION has experienced significant increases in housing pricessince 1980, but home prices in Massachusetts have consistently grown at a faster rate thanin the nation as a whole. An analysis of the Office of Federal Housing Enterprise Over-sight’s quarterly Housing Price Index (HPI) reveals that between 1980 and 2003, homeprices in the United States increased by 291 percent, significantly above the total infla-tion rate of 224 percent (see Figure 1).5 Strikingly, during this same period, housingprices in Massachusetts rose 573 percent. While it is clear that the decrease in home-mortgage interest rates has influenced the increase in home prices across the nation, it isalso apparent that the rapid price appreciation in Massachusetts6 is only partiallyexplained by this factor.
Figure 1. House Price History for Massachusetts and United States. Time period 1Q 1975–2Q 2003; HPIis normalized to 1980 = 100. Source: Office of Federal Housing Enterprise Oversight, House Price Index, 2Q2003.
1 Changes in Housing Affordability, 1980–2003

1 • CHANGES IN HOUSING AFFORDABILITY, 1980–2003 5
Despite the recent state recession, housing prices have continued to increase in everyregion of Massachusetts. The Greater Boston region has seen the greatest increase insingle-family home price overall. By 2002 the average value of a home in Greater Bostonwas $427,600, a rise in one year of $36,000 (see Figure 2).
Figure 2. Single-Family Home Average Sales Price in 2002. By Region, with 2001–2002 Price-ChangePercentage. Source: The Warren Group, 2001–2002
Housing Price Trends for Renter-Occupied Homes
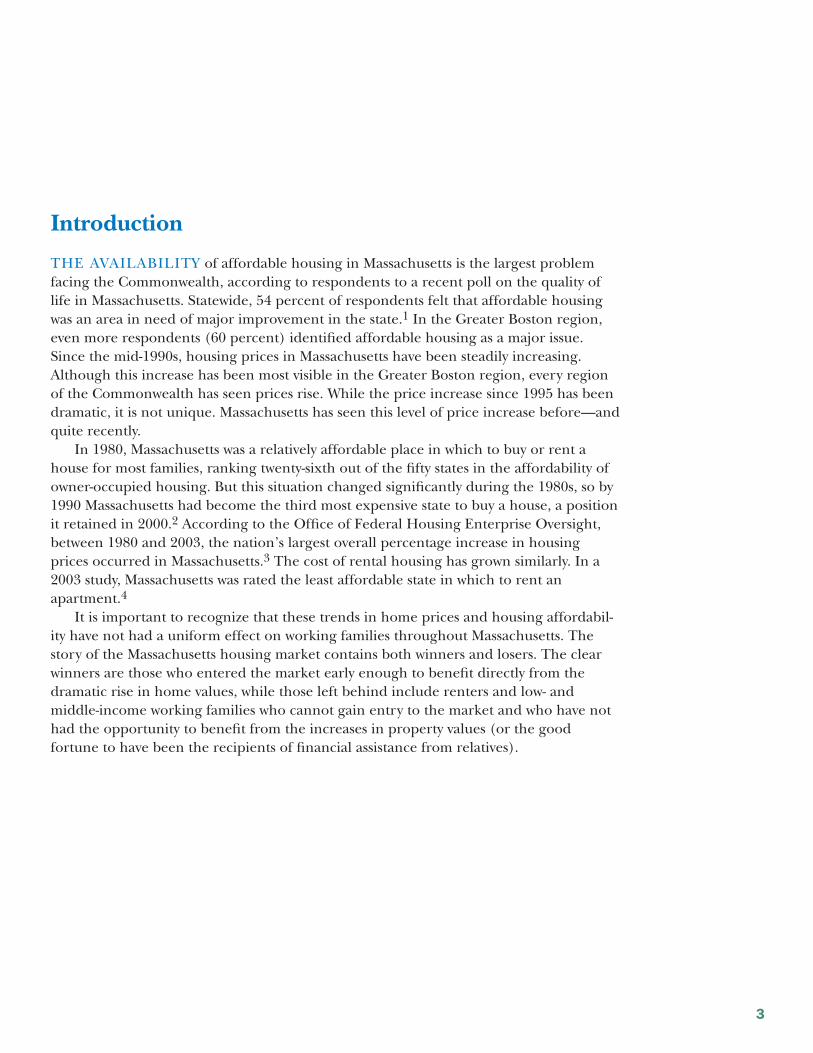
Over the past two decades, renting a home has also become more expensive in Massachu-setts. An analysis of “fair market rent” data from the U.S. Department of Housing andUrban Development documents a dramatic increase in rent in most Massachusetts metro-politan statistical areas (MSAs and PMSAs) between 1995 and 2004 (see Figure 3, page6). In the Greater Boston PMSA, the fair market rent calculated by HUD has nearlydoubled since 2001, rising from $775 to $1,419 per month, an increase of 45 percent.Similar but less dramatic price increases were experienced in most other areas of theCommonwealth with the exception of Western Massachusetts, which experienced verymodest increases in rental costs. It is important to note that a large portion of thisincrease occurred after the U.S. Census Bureau measured the incomes earned and rentspaid by households for the 2000 Census, so the data available on housing affordabilitylikely undercounts those paying over 30 percent of their income towards housing.
6 WINNERS AND LOSERS IN THE MASSACHUSETTS HOUSING MARKET
Figure 3. Fair Market Rent Values for Massachusetts MSAs, FY 1985–2004. Source: U. S. Dept. ofHousing and Urban Development, Fair Market Rent Data.
Using another measure of affordability for renters, the “housing wage,” in 2003 61percent of all renters in Massachusetts could not afford to rent a two-bedroom apartmentat the HUD fair market rent. The housing-wage calculation considers both the cost ofrent and the cost of items necessary to live, such as food, clothing, and transportation.The end result is an estimate of the cost of living for a household that is converteddirectly into the minimum salary that would be required to meet those costs. This

1 • CHANGES IN HOUSING AFFORDABILITY, 1980–2003 7
method is employed by the National Low Income Housing Coalition in an annual reportthat reports housing-wage calculations for the nation, the fifty states, and other selectedgeographic areas. The group’s 2003 report identified Massachusetts as the most expen-sive state in the nation in which to rent a home. They estimated that, given the prevailingcost of living, renting a two-bedroom apartment at the fair market rent calculated byHUD would require a single full-time worker to earn $22.40 per hour, or to work 133hours per week at the federal minimum wage. Table 1 shows the NLIHC data by Massa-chusetts MSAs.
Table 1. 2003 Housing Wage Data for Massachusetts and Its MSAs
Income needed Percentto afford 2BR FMR of renters Housing
Median renter as percent of unable to wage forState and MSA annual income median renter income afford 2BR FMR 2 BR FMR
Massachusetts Total $36,194 129 61 $22.40
Barnstable–Yarmouth, MA $31,440 123 59 $18.60
Boston, MA–NH $41,148 138 64 $27.29
Brockton, MA $32,574 128 61 $20.12
Fitchburg–Leominster, MA $31,214 103 50 $15.48
Lawrence, MA–NH $33,312 117 57 $18.67
Lowell, MA–NH $37,175 115 54 $20.48
New Bedford, MA $23,066 143 67 $15.83
Pittsfield, MA $25,902 95 46 $11.87
Providence–Fall River—Warwick, RI–MA $26,382 103 50 $13.04
Springfield, MA $25,716 107 52 $13.19
Worcester, MA–CT $32,229 103 50 $15.90
Source: National Low Income Housing Coalition, Out of Reach 2003 (Washington, DC: National Low IncomeHousing Coalition).
Income and Home Price Growth
One of the factors that has allowed housing prices to increase as significantly as they havein Massachusetts over the last two decades is the increase in household income over thattime. The median household income in 1999 in Massachusetts, as reported by the 2000decennial census, was $50,502 per year, significantly higher than the $41,994 of thenation as a whole. There was an even greater difference between the median family7
incomes of the Commonwealth and the United States, which in 1999 were $61,664 and$50,046, respectively.
This relatively large income gap between Massachusetts and the nation is a fairlyrecent development. After adjusting for inflation using 1999 dollars, the 1979 householdincome as reported by the Census Bureau was $39,568 for Massachusetts and $37,915 forthe nation, a relatively small difference. Another standard measure, the income of a four-person family, shows that there has been a yearly divergence in incomes that roughlytracks increases in home prices (see Figure 4, page 8). Significantly, the decline in

8 WINNERS AND LOSERS IN THE MASSACHUSETTS HOUSING MARKET
income in the early 1990s roughly parallels the declining housing prices in Massachusettsduring that time. Research by Randy Albelda and Marlene Kim at UMass/Boston hasshown that the earnings of married-couple households both with and without childrenconsistently increased from 1979 to 1999, while other household types have seen lessconsistent increases, with many showing decreases from 1988 to 1999.8
Figure 4. Median Income for Four-Person Families, 1975–2000. Adjusted for inflation, $ = 2001. Source:U.S. Bureau of the Census, Current Population Survey 1974–2000
As housing prices increased, so did median incomes—in part because of more wageearners in each family, and more hours worked by wage earners. Significant changes haveoccurred in the income distribution in Massachusetts in recent years, including changesin the number of income earners and hours of work that are required of many Massachu-setts families in order to earn these higher incomes.
According to a recent study, household income inequality increased between 1979and 1999 for every household income level.9 In addition, the share of the total amountof household income going to the highest quintile of households increased from 45percent to almost 50 percent, with every other quintile losing share. Massachusetts nowranks in the top ten states for income inequality in all income levels.10
This is shown in the number of households that make less than the median familyincome. The median family income for all family types in 1999 was $61,664, a very smallincrease over the inflation-adjusted 1989 value of $59,609. However, the number ofhouseholds making less than or equal to 80 percent of this value increased by 122,811, or72 percent of all new households formed in the last decade as measured by the Compre-

1 • CHANGES IN HOUSING AFFORDABILITY, 1980–2003 9
hensive Housing Affordability Strategy Data collected by HUD. This brought the numberof low-income households in Massachusetts up to over 962,000. Of these, almost 365,000such households have elderly members.
One of the reasons for the disparity in income growth between households and fami-lies is the increase in the number of families with two wage earners. According to theAmerican Dream report, the number of married-couple families with both spousesemployed in the labor force increased from 63.7 percent in 1979 to 75 percent to 1999.The median number of hours the wives in these families worked increased during thattime from 728 per year (14 hours per week) to 1,560 per year (30 hours per week). By1999, wives in families with no children worked a median of 1,924 hours per year, or 37hours per week, the equivalent of a full-time job, while wives in families with childrenworked 1,248 hours per year (24 hours per week), a 200 percent increase over 1979.11
The total number of hours worked in married-couple families increases in proportionto their increase in income, with families in the top quintile of earners working morethan four times as many total hours as families in the bottom quintile. So while, overall,income in Massachusetts appears to have risen in concert with home prices, it is clearthat families with higher incomes have had to work harder and harder to keep up withrising costs, while lower-income families have continued to fall further and furtherbehind.
10 WINNERS AND LOSERS IN THE MASSACHUSETTS HOUSING MARKET
THE INTERPLAY BETWEEN population and household growth and the increase inactual numbers of housing units explains much of the growth in housing prices duringthe 1990s. According to the U.S. Bureau of the Census, the population of the Common-wealth grew only 6 percent between 1990 and 2000, compared to 13 percent for thenation as a whole. The number of households in Massachusetts increased a little less than9 percent, versus 15 percent nationally. However, in that time period, the number ofhousing units in Massachusetts increased only 6 percent, whereas the nation saw growthof more than 13 percent, roughly equal to the national rate of population growth. If hous-ing-unit growth in Massachusetts had matched new-household growth from 1990 to 2000,the Commonwealth would have added approximately 70,000 more housing units than itdid. Changes in the composition of the average Massachusetts household have had anindirect effect on the availability and affordability of housing across the Commonwealth.
Changing Household Sizes and Composition
The population of Massachusetts has increased over the last twenty-plus years, albeitmore slowly than that of the United States as a whole. But the average size of a householdin Massachusetts is shrinking: Fewer people are housed per housing unit, and thedemand for new housing is less and less related to raw population growth. Since 1980,Massachusetts has added about 612,000 people (11 percent) to its population (6 percentsince 1990). During this same time, however, Massachusetts added over 412,000 house-holds, or more than 20 percent (9 percent since 1990).
By far the largest increase in household type has been the single-person household,followed closely by the two-person household. All larger household sizes have eitherincreased very slowly or have decreased (see Figure 5, page 11). While the two-personhousehold remains the most prevalent household in Massachusetts, the growth in single-person households suggests that this situation may change in the future, furtherincreasing the demand for housing across the Commonwealth.
As this trend would suggest, over the past two decades the percentage of householdswith children in Massachusetts has steadily declined. In 1980, over 35 percent of allhouseholds contained a householder (either a married couple, male head, or femalehead) who resided with their own children. By 2000, this had decreased to 31 percent.However, this figure somewhat understates the presence of children and their families inMassachusetts’s households.
2 Changes in Housing Supply

2 • CHANGES IN HOUSING SUPPLY 11
Figure 5. Change in Number of Households by Size, 1980–2000. Source: U.S. Bureau of the Census,Decennial Census 1980–2000
Increase in Families Doubling Up
Over the past two decades, there has been a marked increase in the number ofreported subfamilies living in Massachusetts, or multiple families residing in a singlehousing unit. Most dramatic are the figures about children living in subfamilies: in 1980,there were only 8,885, but in 2000 there were 52,203, an increase of 488 percent.
In 1980, there were 26,685 subfamilies in Massachusetts, representing 1.8 percent ofall family households. By 1990 there were 46,028 subfamilies (3 percent of all familyhouseholds). By 2000, this number had increased again, to 52,008 subfamilies (3.3percent). The number of people living in subfamilies also increased substantially, from66,000 in 1980 to 125,000 in 2000. While many families do choose to live together underone roof for reasons other than monetary ones, the major increases in subfamily livingarrangements over the last twenty years both in Massachusetts and nationally occurred intandem with increases in home prices. Many people living in subfamilies could bethought of as the “hidden homeless,” people who, without family support, could be livingon the street. The growing numbers of people and families sharing living quarters repre-sent huge adjustments that more and more Massachusetts residents and their childrenhave been forced to make to find a place to live in the Commonwealth.
A Lack of New Housing Construction
Between the 1980 and 1990 decennial census, the Commonwealth added 331,000 hous-ing units. From 1990 to 2000, however, the number of housing units increased by only149,000, the majority of which were single-family, detached housing units. In other words,the number of additional housing units added to the supply in the 1990s was 55 percentless than the number added in the 1980s.

12 WINNERS AND LOSERS IN THE MASSACHUSETTS HOUSING MARKET
The number of single-family, detached housing units grew much faster in the 1990sthan in the 1980s. In the 1980s, 98,734 single-family housing units were added, as meas-ured by the 1990 decennial census. In the 1990s another 142,291 housing units wereadded.12 This increase of almost 44,000 units reflected the only increase in housing-unittype from 1990 to 2000. Single-family attached units and units in multifamily buildingswere added at a much lower rate from 1990 to 2000. This lack of multifamily and single-family, attached housing can be seen in occupancy statistics. While there were only149,278 additional housing units from 1990 to 2000, there were 196,470 additionalhouseholds, meaning that there was a deficit of over 47,000 housing units.
Most of this mismatch occurred in multifamily housing. In total, there were 167,000new households occupying 157,000 new single-family housing units, which reduced thesupply of vacant single-family detached and attached housing by only 10,000 units.However, there were almost 51,000 new multifamily households occupying only 17,000additional multifamily units, a deficit of over 33,000 multifamily housing units. Unfortu-nately, this deficit in multifamily units was not just because there was a lack of newconstruction.
From 1990 to 2000, while there was some creation of new multifamily units for three-to-four families and developments for fifty or more families, there was a significant loss oftwo-family, five-to-nine-family, and ten-to-nineteen-family structures. In other words,37,563 new multifamily units were created in the 1990s, but 20,236 existing units werelost. Table 2 shows the details of these changes by tenure and housing-unit type.
Table 2. Change in Occupancy Status (Tenure) by Units in Structure, 1990–2000
Owner-Occupied Renter-OccupiedUnits in Structure Change Change Total Change Change in Units
1 (Detached) 141,812 7,268 149,080 142,291
1 (Attached) 15,064 3,020 18,084 14,585
2 3,382 (1,939) 1,443 (1,983)
3 or 4 6,082 5,845 11,927 5,352
5–9 5,995 (3,274) 2,721 (3,640)
10–19 1,863 (7,677) (5,814) (13,725)
20–49 3,097 1,897 4,994 (888)
50 or more 8,002 27,268 35,270 32,211
Mobile home 83 677 760 1
Other (1990)
Boat/RV (2000) (8,665)* (13,330)* (21,995)* (24,926)*
Multifamily 28,421 22,120 50,541 17,327
Total 176,715 19,755 196,470 149,278
*A definition change from 1990 to 2000 makes real comparison impossible.Source: U.S. Bureau of the Census, Decennial Census 1990–2000
Table 2 also shows the homeownership levels of all types of housing units in 1990 and2000. There were significant losses in the number of certain sizes of rented multifamilyunits from 1990 to 2000, as compared to modest increases in owner-occupied units. Thisillustrates a recent trend in Massachusetts homeownership. While overall most

2 • CHANGES IN HOUSING SUPPLY 13
multifamily units are rented, in Massachusetts an increasing percentage of multifamilyunits are owner occupied.
In 2000, Massachusetts had the sixth highest level of owner occupancy of units instructures of five or more units, with a 14.4 percent owner-occupancy rate, higher thanthe national average of 11.1 percent. This reflects both the prevalence and growingpopularity of condominiums in the Commonwealth with homeowners—as well as thelack of housing alternatives for persons who wish to purchase their own homes. Becauseof the low construction rate for new multifamily properties, some of these condominiumunits are actually conversions from rental housing, which further decreases the supply ofrental housing for those who need it. The striking increase in condominiums as a type ofhousing—in the nation, and especially in Massachusetts—is shown in Figure 6.
Figure 6. Rates of Ownership in Structures of More Than Five Units, 1950–2000. Source: U.S. Bureau ofthe Census, Decennial Census 1950–2000
One of the reasons for this increase in multifamily homeownership is the relativeaffordability of these units as compared to single-family detached housing. In Massachu-setts in 2000, the average value of an owner-occupied housing unit in a building of five ormore units was, on average, almost 20 percent less than the average value of a single-family detached housing unit. Regional differences are even more pronounced; in theBoston Metro region the difference was more than 25 percent less.13

14 WINNERS AND LOSERS IN THE MASSACHUSETTS HOUSING MARKET
Decreasing Vacancy Rates
Not surprisingly, the failure of housing units to grow at the same rate as new householdformation resulted in a declining number of vacant housing units. Between 1990 and2000, the number of vacant housing units in Massachusetts declined by nearly 48,000. Ofthe 178,000 vacant units in 2000, only 51,000, or 29 percent, of these units were availablefor sale or rent. The large drop in vacant rental units is particularly troubling, as theseunits tend to house lower-income households. The significant decline of vacant housingunits available for rent during the 1990s likely contributed to the rise in the number offamilies sharing living quarters during this same period.
Certain types of housing units have seen larger declines in vacancy rates than othertypes. Overall, there were many fewer vacant multifamily properties in 2000 than in 1990.While the number of vacant single-family detached housing units fell by 6 percentbetween 1990 and 2000, the number of vacant units in buildings with five or more unitsfell by more than 43 percent. This is partly due to the lack of construction in multifamilyhousing from 1990 to 2000. While almost 157,000 new single-family homes were built inthis time period, only 17,327 new multifamily units were added. To have kept the numberof vacant multifamily housing units the same from 1990 to 2000, we estimate that over33,000 additional units would have been needed.

15
The Burdens of Housing Costs: 1990–2000
THERE HAS BEEN virtually no improvement in housing-unit affordability from 1990to 2000. Generally, a household that pays more than 30 percent of its income in housingcosts is considered to be paying a burdensome amount of their income for housing. In2000, 22 percent of all homeowners in Massachusetts had housing costs that were overthis threshold. While there was little variation between the state average and the BostonMetro region, this was due mostly to the higher incomes in that region as compared tothe Commonwealth as a whole.
Table 3. Affordability for Owners, 1990–2000
Percentage of income 1990 2000Region spent on housing Number Percent Number Percent
Boston Metro Less than 20 187,419 53 207,033 52
20–24 46,260 13 57,981 15
25–29 35,384 10 40,038 10
30–34 24,238 7 25,571 6
35 or more 59,116 17 67,249 17
Massachusetts Less than 20 524,548 52 611,252 52
20–24 138,197 14 178,705 15
25–29 106,943 11 121,955 10
30–34 72,368 7 76,471 6
35 or more 166,747 17 192,836 16
Source: U.S. Bureau of the Census, 1990 and 2000 Decennial Census
All told, almost 93,000 households in the Boston Metro area and more than 269,000households in the Commonwealth pay over 30 percent of their income for housing, anincrease from 1990 of 10,000 and 30,000 households, respectively. Tables 3 and 4 (above,and on page 16) show the overall affordability breakdown for homeowners in Massachu-setts and in the Boston Metro area.
Affordability Problems 3

16 WINNERS AND LOSERS IN THE MASSACHUSETTS HOUSING MARKET
Table 4. Owner-Occupied Households Paying 30 Percent or More for Housing by Mortgage-Interest Rate, 2000
Percent ofincome spent With mortgage No mortgage Total
Region on housing Number Percent Number Percent Number Percent
Boston Metro 30–34 21,773 8 3,798 3 25,571 6
35–39 13,365 5 2,777 2 16,142 4
40–49 14,405 5 3,048 3 17,453 4
50 or more 26,676 9 6,978 6 33,654 8
30 or more 76,219 27 16,601 14 92,820 22
All Households 283,583 N/A 114,289 N/A 397,872 N/A
Massachusetts 30–34 65,364 8 11,107 3 76,471 6
35–39 40,351 5 8,144 2 48,495 4
40–49 43,090 5 9,516 3 52,606 4
50 or more 73,488 9 18,247 5 91,735 8
30 or more 222,293 24 47,014 13 269,307 22
All Households 847,499 N/A 333,720 N/A 1,181,219 N/A
Source: U.S. Bureau of the Census, 2000 Decennial Census
Not surprisingly, the home-owning households that pay the highest percentage oftheir incomes for housing make the least money. More surprisingly, a large percentage ofhomeowners who made around the median household income paid over 30 percent oftheir income for their housing. As Table 5 (page 17) shows, the vast majority of low- andvery low-income homeowners (almost 132,000 households, marked in black in the table)pay more than 30 percent of their income on housing, and most of those pay more than35 percent. Many middle-income households (green in the table) pay a burdensomeamount for their housing, and even a fair amount of upper-income households spendover 30 percent of their income on housing.
In the Boston Metro area, more than 41 percent of all homeowner householdsmaking just below the median household income of $50,515 per year pay over 30 percentfor housing (marked in yellow), as do almost 28 percent of those who make just over themedian income. In Massachusetts as a whole, these numbers are 37 percent and 20percent, respectively. Statewide, this represents almost 111,000 households who makearound the median household income but pay a burdensome amount for their housing.In total, more than 269,000 owner-occupied households pay a burdensome amount fortheir housing.
Households that have recently purchased their housing also have more affordabilityproblems than those that have been owners for even a few years longer. Data from the2000 U.S. Census Bureau show that homeowners in Massachusetts who purchased theirhome between January 1999 and March 2000 were more likely to spend over 30 percentof their household income on housing. The longer a household has owned its home, theless housing-cost burden was reported. There are many reasons for this, includingincreased income of older householders, but the initial price paid for the home is also amajor factor (see Table 6, page 17).

3 • AFFORDABILITY PROBLEMS 17
Table 5. Household Income by Selected Monthly Owner Costs as a Percentage of Household Income, 1999
Percent of income Boston Metro MassachusettsIncome per year spent on housing percent percent
Less than $10,000 30–34 1.0 3.4
35 or more 97.4 92.8
$10,000–$19,999 30–34 11.6 10.9
35 or more 63.8 52.8
$20,000– $34,999 30–34 6.7 7.1
35 or more 38.4 35.6
$35,000–$49,999 30–34 9.7 11.4
35 or more 31.7 25.1
$50,000–$74,999 30–34 11.9 9.5
35 or more 15.8 10.5
$75,000–$99,999 30–34 6.1 4.6
35 or more 6.1 3.8
$100,000–$149,999 30–34 3.2 2.3
35 or more 3.2 2.1
$150,000 or more 30–34 1.0 0.8
35 or more 0.9 0.6
Source: U.S. Bureau of the Census, 1990 and 2000 Decennial Census.
Table 6. Affordability Level by Year Moved into Home, 2000 (Owner-Occupied Householders Ages 25–64)
Percent of IncomeSpent on Housing 1999–2000 1995–1998 1990–1994 1989 or earlier Total
30 or more 8.3 7.1 7.3 5.6 6.7
35 or more 12.1 9.5 9.4 7.6 9.0
50 or more 10.4 7.5 7.1 7.7 7.8
Total 30.7 24.1 23.7 20.9 23.5
Source: U.S. Bureau of the Census, 2000 Decennial Census, Public Use Microdata Sample, 1 Percent Sample
Renter-Occupied Housing Affordability, 1990–2000
A much higher percentage of renters than owners pay a burdensome amount for theirhousing in Massachusetts. In 2000, 39 percent of all renters paid 30 percent or more oftheir household income in rent, and 18 percent paid 50 percent or more. These percent-ages were slightly higher in the Boston Metro area. In all, there were almost 339,000rental households that paid over 30 percent of their income for their housing in 2000.This is an improvement over 1990, when 358,000 renter households paid over 30 percentfor their housing, though most of the drop in overpaying households occurred outsidethe Boston Metro area. Unfortunately, these statistics do not take into account themassive jump in rental costs that has occurred in some parts of the Commonwealth since2000, as shown in Figure 3 (above, page 6). Table 7 (page 18) shows the affordabilitybreakdown for all renters for 1990 and 2000, and Table 8 (page 18) shows data on thosepaying extreme amounts on their rental housing in 2000.

18 WINNERS AND LOSERS IN THE MASSACHUSETTS HOUSING MARKET
Table 7. Affordability for Renters, 1990 and 2000
Percent of income 1990 2000Region spent on housing Number Percent Number Percent
Boston Metro Less than 20 126,499 30 148,303 34
20–24 67,891 16 58,302 13
25–29 56,996 13 55,038 13
30–34 39,116 9 36,659 8
35 or more 137,775 32 135,972 31
Total 428,277 100 434,274 100
Massachusetts Less than 20 253,078 29 309,118 35
20–24 139,809 16 116,690 13
25–29 116,494 13 109,861 13
30–34 76,843 9 71,917 8
35 or more 281,117 32 266,864 31
Total 867,341 100 874,450 100
Source: U.S. Bureau of the Census, 1990 and 2000 Decennial Census.
Table 8. Renters Paying More Than 30 Percent of Household Income, 2000
Percent of income Number of renterRegion spent on housing households Percent
Boston Metro 30–34 36,659 8
35–39 24,142 6
40–49 30,724 7
50 or more 81,106 19
30 or more 172,631 40
Total 434,274 100
Massachusetts 30–34 71,917 8
35–39 46,615 5
40–49 60,076 7
50 or more 160,173 18
30 or more 338,781 39
Total 874,450 100
Source: U.S. Bureau of the Census, 1990 and 2000 Decennial Census
Renting a home in 2000 was somewhat more affordable for middle- and upper-income households, however. As Table 9 (page 19) shows, only about 18 percent ofrenter households earning slightly less than the median income ($35 to $50 thousand) inMassachusetts as a whole paid a burdensome amount for their housing, as compared to37 percent of homeowners in the same income bracket (as shown in Table 5, page 17).Only 6 percent of those earning just over the median household income (from $50 to 75thousand) paid over 30 percent, as compared to 20 percent of homeowners. Again, thevast majority of low- and very low-income households paid over 30 percent for their hous-ing, but here also there is a difference between renters and homeowners: 78 percent ofrenters earning under $10,000 per year paid over 30 percent for their housing vs. 96percent of homeowners. This is likely due to the existence of subsidized rental housing.Even so, this represents the vast majority of renter households.

3 • AFFORDABILITY PROBLEMS 19
Table 9. Monthly Renter Costs as a Percentage of Household Income in 1999, by Income Level
Percent of income Boston Metro MassachusettsIncome per year spent on housing percent percent
Less than $10,000 30–34 7.7 7.7
35 or more 70.6 70.7
$10,000–$19,999 30–34 8.3 9.7
35 or more 62.0 59.8
$20,000– $34,999 30–34 15.4 15.5
35 or more 47.8 33.6
$35,000–$49,999 30–34 12.7 8.5
35 or more 15.6 9.3
$50,000–$74,999 30–34 5.2 3.4
35 or more 4.5 2.8
$75,000–$99,999 30–34 1.4 1.0
35 or more 1.1 0.8
$150,000 and over 30–34 0.7 0.5
35 or more 0.4 0.3
Source: U.S. Bureau of the Census, 2000 Decennial Census.
Like owner-occupied households, renters who have recently moved have more afford-ability problems than those who have been in place for a longer period of time. The datashow that renters in Massachusetts who moved between January 1999 and March 2000were more likely to pay over the accepted limit of 30 percent of household income forhousing costs, but that the trend is not as linear for renters as it is for homeowners, espe-cially for households paying 35 and 50 percent of their incomes. Overall, the longer ahousehold has rented the same home, the less housing-cost burden was reported. Likehomeowners, renters may have increased their income with age and experience, but rentcosts are also a major factor (see Table 10).
Table 10. Affordability Level by Year Moved into Home, 2000 (Renter Householders Ages 25–64)
Percent of IncomeSpent on Housing 1999–2000 1995–1998 1990–1994 1989 or earlier Total
30% or more 8.0 6.8 5.3 5.1 6.7
35% or more 10.8 9.8 10.2 8.2 10.0
50% or more 16.4 13.1 14.5 15.9 14.6
Total 35.3 29.7 29.9 29.2 31.3
Source: U.S. Bureau of the Census, 2000 Decennial Census, Public Use Microdata Sample, 1 PercentSample

20 WINNERS AND LOSERS IN THE MASSACHUSETTS HOUSING MARKET
THERE ARE TWO MAJOR REASONS for the increase in housing prices in Massa-chusetts over the last twenty years. The first is the lack of new housing-unit construction,and the second is the lack of land that is available and suitable for residential develop-ment. A real shortage of land in the Greater Boston and surrounding regions forces newhousing to be built further and further away from major job centers. This land shortageis exacerbated by zoning and subdivision regulations imposed by municipalities thatserve to further limit the amount of land available for construction of new housing.
A Diminishing Supply of Land in Eastern Massachusetts
From 1971 to 1999 the Commonwealth lost over 302,000 acres of forested land, 81,000acres of agricultural land, and 3,400 acres of open space. Most of this land, over 309,000acres, was used to build housing. A simple estimate of the number of new units per acreshows that, from 1971 to 1985, every acre of land on which new, occupied, single-familydetached or attached housing units sat contained about 2.2 units.14 In other words, eachoccupied unit built during that time used up an average of almost half an acre of land.Multifamily housing units (any unit in a structure holding two or more units) were builtat an average density of 8.3 units per acre, or 0.12 acres per unit.
From 1985 to 2000, these ratios changed significantly. Single-family housing was builtat a density of 1.3 units per acre of land used, while an acre of land used for new multi-family housing contained 18.2 housing units. While these estimates are rough, theydemonstrate that more acreage is being used to build less single-family housing, and thatmultifamily housing is generally being built at much higher densities. This is likelybecause more of the single-family housing built in the 1985–2000 period was notattached (i.e., town-house or row-house style) and that most of the multifamily units builtfrom the late 1980s to today have been in structures of fifty or more units. These data areshown in Table 11 (page 21).
Land-use statistics show that the eastern part of the Commonwealth is becoming builtout. The Executive Office of Environmental Affairs has created build-out analyses for eachcity and town in Massachusetts to assist in planning under the Community Preservation Act.Data for each town was aggregated into special EOEA regions whose definitions are differ-ent than those used in the rest of this report. These built-out analyses show that, of theremaining undeveloped land in the Boston Metropolitan region, only about 12 percent issuitable for development. The surrounding Northeast and Interstate 495 regions haveonly 23 and 29 percent developable land left, respectively (see Figure 7, page 21).
4 Reasons for the Lack of Housing Construction

4 • REASONS FOR THE LACK OF HOUSING CONSTRUCTION 21
Table 11. Acreage Used 1971–1999 and Occupied Housing Units Built 1970–2000
Land used forLand used for medium- to
multifamily or high- low-density housingdensity housing (single-family units) Total
Land used for new housing, 1971-85 12,355 118,074 130,428
New housing built, 1970–84 (est.) 102,965 255,023 357,988
New units built per acre used, 1971–85 (est.) 8.3 2.2 2.7
Land used for new housing, 1985–99 10,240 168,395 178,635
New housing built, 1985–2000 (est.) 186,170 226,857 413,027
New units built per acre used, 1985–99 (est.) 18.2 1.3 2.3
Total land used for new housing, 1971–99 22,595 286,468 309,063
Total new housing built, 1970–00 (est.) 289,135 481,880 771,015
New units built per acre used, 1971–99 (est.) 12.8 1.7 2.5
Source: Mass. GIS Land Use Summary Statistics, U.S. Census Bureau 2000 Decennial Census
Figure 7. Developable Land by Region, 2001. Source: Executive Office of Environmental -Affairs
With the exception of the Cape Cod Region, the further one moves from Boston, themore developable land is available. Comparing the map in Figure 7 with the map inFigure 2 (page 5) shows that the towns where housing has become more expensive thanthe median family income can afford are mostly located in areas where there is the leastavailable land.

22 WINNERS AND LOSERS IN THE MASSACHUSETTS HOUSING MARKET
Impact of Local Regulations
Many federal and state policies aim to assist first-time homebuyers and low- and moder-ate-income families. These policies affect both sides of the market, supply and demand,and attempt to achieve equilibrium between them. Demand-side policies subsidize low-income renters and underwrite mortgage instruments that would not be available in theprivate market, while supply-side policies may offer subsidies for the construction orrenovation of low-income housing. However, the level of government that has perhapsthe greatest effect on housing construction is the local level.
Many local government policies restrict the amount of available developable land.These kinds of policies can severely affect housing development. A detailed analysis bythe Executive Office of Environmental Affairs of sixteen communities in the Common-wealth indicates that the density allowed for new residential development by currentzoning regulations is on average half of the existing residential density.15 Many munici-palities have adopted zoning ordinances and bylaws, such as large minimum lot sizes andlow-density building requirements that require much less efficient use of existing, expen-sive land for new development, which drives up the cost of new housing units. The statedreasons for local governments’ reduction of allowed density levels are often that newhousing may change the character of a city or town; generate increased traffic congestionand pollution, or alter the value of existing property. There are also fears that new resi-dential development may translate into additional municipal costs: for new roads, sewers,public safety, and especially education.
Traditional fiscal-impact analysis tools tell municipalities that the property-taxrevenues generated by new development cannot cover its costs. However, a study by theUMass Donahue Institute for CHAPA in early 2003 suggests that traditional methodsused to calculate fiscal impacts are not very reliable, and that growth does not alwayshave a negative impact on municipal budgets.16 However, it also showed that municipali-ties obtain the vast majority of their revenues from property taxes and state aid, and thatthe largest single expense that most municipalities face is education, suggesting thatlimiting the number of children that can move into a city or town is often the motivatingfactor in many new local land-use regulations.
An example of this is the emphasis on “over-55” development that can be found inmany municipalities—housing that is age restricted to people who are 55 years or older.This is touted as a way of creating housing with a “significant positive impact” on munici-pal finances.17 Over-55 development is seen as having a “positive impact” specificallybecause it is guaranteed not to bring more children into the school system, and isexpected to generate a “tax surplus” on each over-55 restricted home.18 Overall, thisfiscal engineering of land use has resulted in what one legislator has called “vasectomyzoning” that excludes children from new development.19 Unfortunately, the inconsistentlevels of state aid to communities since the passage of Proposition 2½ (as well as Proposi-tion 2½ itself) has added to municipal anxiety about where the long-term funding foreducation and other services is going to come from.20
Another recent study suggests that restrictive building codes and environmental regu-lations created and enforced by local governments may be restricting housingdevelopment. Examples of such codes include septic-system standards that are stricterthan the already strict state regulations, local building inspectors who use local standardsinstead of uniform codes, and local regulations limiting the number of building permits

4 • REASONS FOR THE LACK OF HOUSING CONSTRUCTION 23
that can be issued in a certain time frame to control growth. In addition, many regula-tions issued by the Commonwealth itself can be contradictory and are issued byoverlapping authorities who have little contact with one another. These restrictions cancontribute to the high cost of housing by raising the cost of development and can add tothe restrictions on housing supply by controlling its timing. While there are legitimatereasons for most local decisions on permit issuance, building codes and environmentalregulation, their overuse—and occasionally their misuse—can generate higher develop-ment costs for new housing.
With today’s level of government intervention, the current housing market is notproducing new housing for the very poor, but it is producing some housing that is afford-able to people with low to moderate incomes. However, much low- and moderate-incomehousing comes not from new construction but from the existing housing stock, which isfreed as owners trade up to new houses. When this equation breaks down because nonew stock is added, the consequence is that the existing stock does not depreciate and isnot left vacant for new residents. Unfortunately, current land-use and building regula-tions are contributing to this breakdown, as is the over-reliance on certain types ofrevenue by municipal governments.
Where the New Houses Are Being Built
One of the problems that has been noted in Massachusetts is suburban sprawl, or thespread of low-density development away from urban areas. Statistics on the developmentof land show that more land is being used to build fewer houses. Research suggests thatthis is due to land-use regulations designed to reduce municipal fiscal burdens. Onemajor factor in sprawl is the creation of bedroom communities where workers live andfrom where they then commute to jobs in other communities. A measure of this behaviorcan be seen in the jobs–housing balance, the ratio of jobs to households in a community.Communities with fewer jobs than housing units are considered to be net exporters ofworkers, while those with more jobs than housing units are considered to be importers.While the reality of commuting and working is more complex than this calculation canshow, it is a useful measure for indicating general patterns of development.
To measure the extent of sprawl in Massachusetts, we used a simple calculation toidentify the cities and towns that were the net importers and exporters of employment.Dividing the number of jobs in a community by the number of housing units yields thejobs–housing ratio for that community. In the past, a jobs–housing ratio of 1.0 wasconsidered to be in balance, but many researchers now feel that attributing only one jobto a household undercounts the local job market due to the large amount of two-earnerhouseholds. A better ratio to use may be the average jobs–housing ratio for the Common-wealth as a whole, which in 2000 was 1.29 jobs per housing unit.
To make the results more clear, we subtracted the average ratio from each commu-nity’s value to create a comparison to the norm, where a negative number on the map(see Figure 8, p. 24) means that local residents travel to other communities to work, apositive number means that people travel to that community to work, and zero meansthat the number of jobs and number of housing units in that community are in balance.This result was then mapped along with the change in year-round housing units from1990 to 2000, shown as red dots that are scaled to illustrate the number of housing unitsbuilt in that community.

24 WINNERS AND LOSERS IN THE MASSACHUSETTS HOUSING MARKET
Figure 8. Job–Housing Balance, 2000, with Numerical Change in Housing Units, 1990–2000.Source: ES-202 Data, Massachusetts Department of Employment and Training, 2000; U.S. Bureau of theCensus, Decennial Census 1990–2000
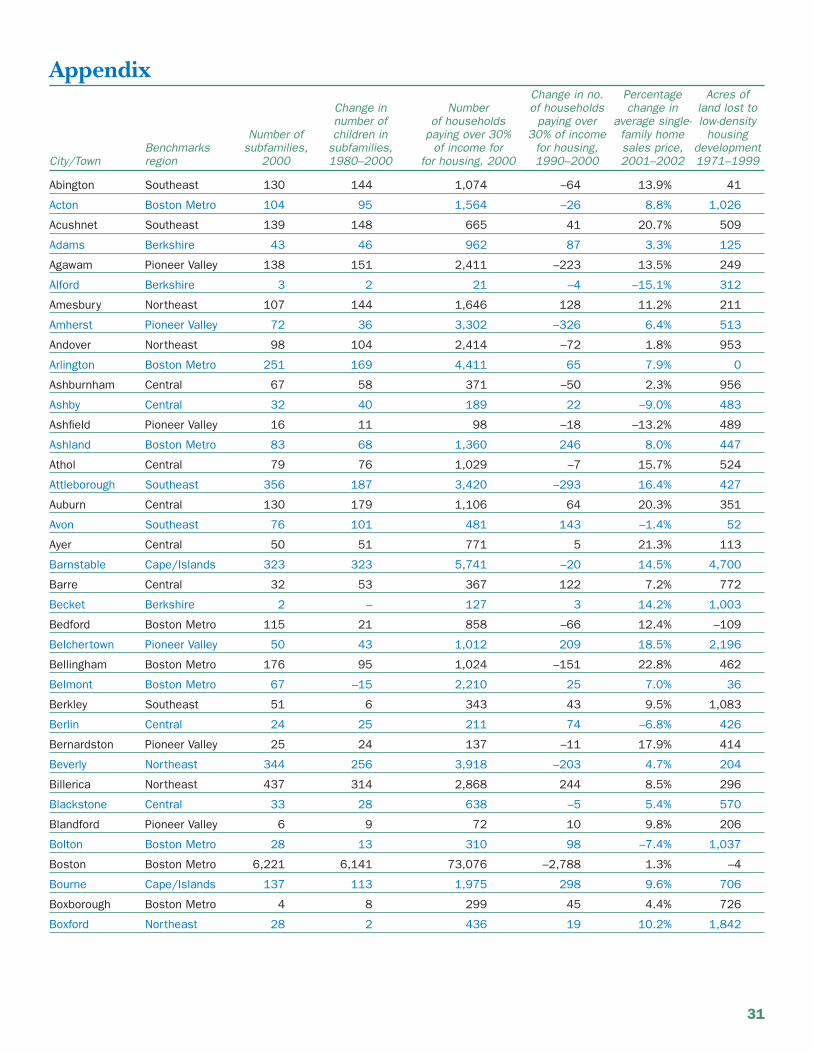
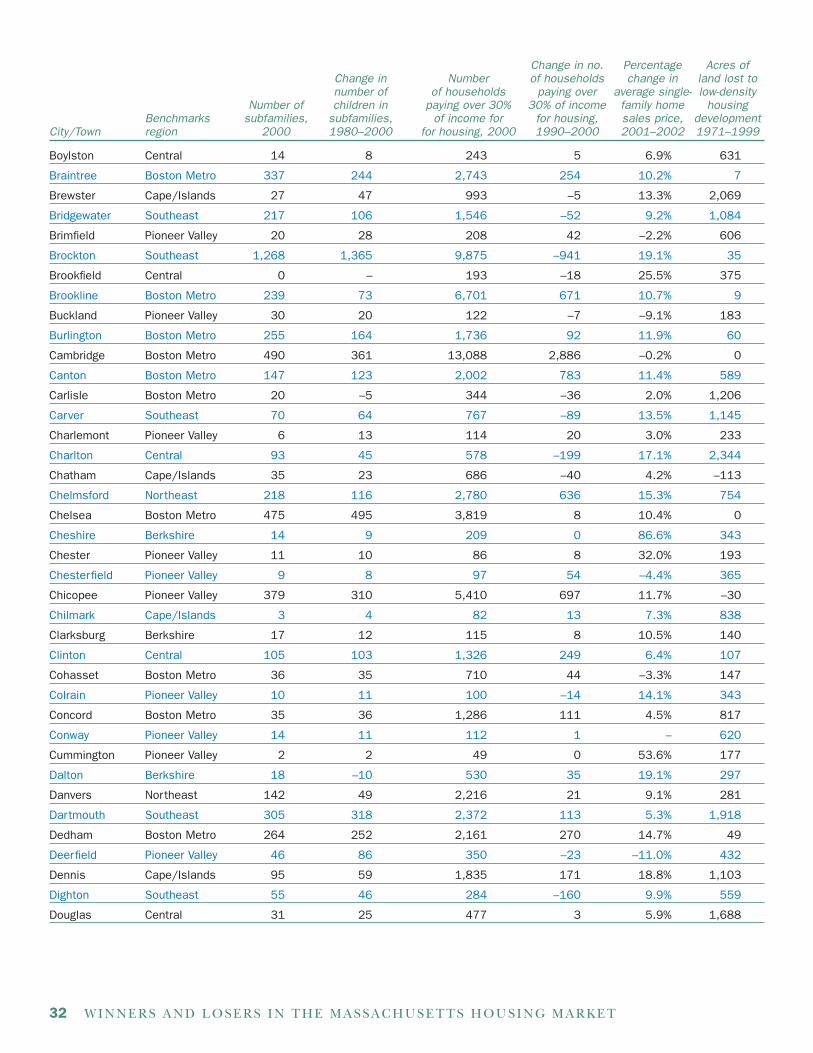
This analysis shows that there was some balance between the location of jobs and thelocation of new housing, but that there were also many communities that seemed to bethe bedroom communities of other job centers. The large number of large red dots intowns that are further from Boston shows that housing units are being built where land ismore plentiful and further away from expensive Boston Metro communities. Job–housingimbalances are often largely self-correcting, and this can be seen in the amount of hous-ing growth in towns with positive jobs–housing balances. Overall, however, this mapshows that there was a great deal of housing development in many communities that arefar from the job centers that likely employ their inhabitants. The score of each town onthis measure can be found in the appendix to this report.

25
THE INFORMATION IN THIS REPORT shows that there are certain types ofhouseholds who are doing very well in Massachusetts. Households that purchased theirhomes before the recent price spiral have seen the value of their homes increase and areless likely to carry a high housing-cost burden. Even renters who had been renting thesame home for more than two or three years in 2000 had a lower rent burden. Generally,higher-income renters and owners are much more likely to have housing-cost burdenslower than the 30 percent threshold that denotes a high cost burden.
But there are hundreds of thousands of households who do not fit into these cate-gories, who either waited too long to buy a home and are now priced out of the marketor who make too little money to ever consider homeownership and who must rely on therental market and its ever-increasing rents. While the path to family wealth for all but thehighest-income families is considered to be homeownership, for many lower- and middle-income and households in Massachusetts, that path is blocked.
The greatest affordability burden falls on the low-income or first-time homebuyer.Without an existing house to sell, which may have enough equity in it to fund the largedown payment required to purchase a house at today’s Massachusetts prices, first-timehomebuyers must either use special programs that limit the cost of a new house, searchfor relatives who can lend or give the down payment, or wait to save enough money whilepaying ever-increasing rent costs and watching as home prices continue to spiral upwards,continuously out of reach. Even low-income households who own their own home maynot make enough money to qualify for a mortgage, despite the equity in their currenthome.
As for renters, some rent because that is their preferred living situation, but of courseothers would rather buy but cannot afford to do so. In a recent national survey of renterswho are in the market for purchased housing, done by the Mortgage Insurance Compa-nies of America, more than half reported that the greatest obstacle to purchasing a homewas saving enough money for the down payment. This is true even though the vast major-ity of respondents (84 percent) expected to make a down payment that was less than thetraditional 20 percent of the value of the new home. While some households receivedown-payment assistance from family or other sources, around 80 percent of all first-timehome-buying households obtain their down payment solely from their own savings. So,those that do wish to own in Massachusetts have to both save enough money for a downpayment and be able to afford a monthly mortgage payment that today could be quitehigh.
Household Outcomes in the Massachusetts Housing Market 5
26 WINNERS AND LOSERS IN THE MASSACHUSETTS HOUSING MARKET
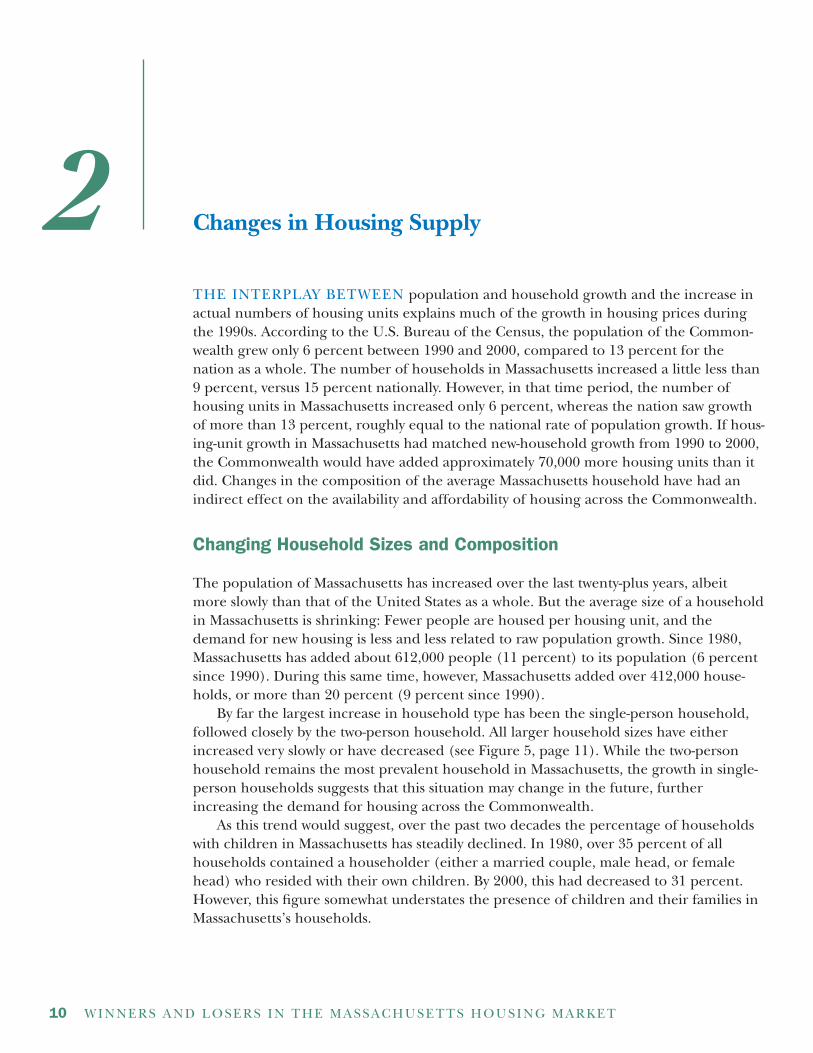
Citizens’ Housing and Planning Association (CHAPA) and the Massachusetts Hous-ing Partnership (MHP), the sponsors of this report, have calculated an affordabilityindex that compares the median income of a community to the median home price ofthat community (see Figure 9). Most housing experts feel that a household that earns themedian income should be able to afford a home that is priced at the median home value.However, in Massachusetts this is not possible in many communities. Figure 9 maps thecommunities where a family earning the median income will not be able to afford ahome priced at the median home sales price. With a few exceptions, the towns with theworst affordability problems are in Eastern Massachusetts.
Figure 9. Median Income vs. Median Home Price, 2001. Source: Citizens’ Housing and PlanningAssociation, 2001.
The high cost of a home forces first-time homebuyers in Eastern Massachusetts tomake hard choices, such as paying more than they should for a home and placing stresson their household finances, moving farther from the Boston Metro area and possiblyhaving a long commute to and from work, or not purchasing a home at all.

27
Findings and Conclusions
THE CURRENT HOUSING MARKET in Massachusetts has created both winnersand losers. The winners are the middle-income and upper-income households whoentered the Eastern Massachusetts market previous to the recent cost run-up in the pastthree or four years, as they have generally seen the value of their homes increase substan-tially, gaining them additional equity in their homes. These winners have also been ableto refinance their homes at lower interest rates, further lowering their cost of ownership.Households in the western part of the state could also be considered “winners” in asense, because they have not been exposed to the same level of price increase and there-fore do not generally have the same types of housing affordability problems.
Many people have been left behind in the current system. Among them are the verypoor and low-income families who cannot ever expect to afford a home in Massachusettsand whose rent burden keeps increasing, even in places like Brockton and Lowell thathave traditionally been affordable places for low-income families to live. Others leftbehind include young families just starting out, who cannot afford to start a new life inMassachusetts by purchasing a starter home and who must either rent expensive apart-ments in the few cities and towns that allow them, or migrate to other parts of thecountry where living expenses are lower. In Eastern Massachusetts, there are many morefamilies left behind, because even earning the median income does not allow a house-hold to purchase a median-priced house, locking more than half of all households out ofthe housing market.
Still others left behind are families who, to be able to afford a home, move to townsthat are further and further away from job centers, raising their commuting times andreducing their time at home with their families. The high cost of housing requires theproliferation of families with two wage earners just to pay the bills, further affectingfamily life. And, ever-increasing home and land costs close to Boston force developmentfurther and further out, increasing automobile traffic, forcing more roads to be built andmaintained, destroying more forests and farmland, and changing the character of manytowns from rural hamlets to bedroom communities. In essence, the housing problems ofthe east are being exported west. And, in a sense, all of Massachusetts loses, because theincreasing costs of living here drives many talented people away and makes companiesthink twice about locating (or remaining) here.
The lack of housing construction, especially multifamily and high density housing,has driven the cost of an existing house to unmanageable levels. Local restrictions oncertain types of development have contributed to this, as has the lack of developable landin the eastern part of the state. The reasons behind the adoption of more restrictive landuse policies are complex, but the end result is that there is not enough housing to meetdemand. This “breaks” the housing market’s pricing mechanism, as the new units that

28 WINNERS AND LOSERS IN THE MASSACHUSETTS HOUSING MARKET
often attract many buyers do not exist, and therefore the price of existing units is bid upto a higher-than-normal level. The construction of more multifamily and/or moredensely built single-family units would use less expensive land and make each unitcheaper to buy. However, the fear that many municipalities have about the effect that thisdevelopment will have on their finances causes it to be strongly resisted.

29
Notes1. MassINC and Princeton Survey Research Associates, Pursuit of Happiness.
2. Andrew Sum, Ishwar Khatiwada, and Mykhaylo Trub’skyy, Home Ownership in Massachusetts: A NewAssessment (Boston: MassINC, 2000), www.massinc.org/publications/reports/Policy Brief3/policy_brief3.html.
3. Office of Federal Housing Enterprise Oversight, State index data, Second Quarter 2003.
4. National Low Income Housing Coalition, Out of Reach 2003: America’s Growing Wage–Rent Disparity(Washington, D.C.: National Low Income Housing Coalition, 2003).
5. Calculated using the Current Price Index, All Urban Consumers, U.S., All items, 1982–84 = 100.
6. Today’s low mortgage rates have created a situation where the same monthly payment will pay for ahigher-priced house. A household that can afford to spend $1,000 per month on a mortgage could borrow$74,500 with a 30-year fixed mortgage at 16 percent interest (or 1981 rates), or $167,000 at 6 percent interest(or today’s rates). In other words, excluding the down payment (which would be higher on a more expensivehouse) the real (inflation-adjusted) price of a home today could be 2.24 times higher than in 1981 withoutaffecting the ability of a family to pay for it.
7. According to the technical documentation for the 2000 Census of Population and Housing publishedby the U.S. Census Bureau, a household includes all of the people who occupy a housing unit, whether theyare related or not, whereas a family is made up of a householder and one or more other people living withthat person who is or are related by birth, marriage, or adoption. In other words, a family is a type of house-hold, but not all households are families
8. A Tale of Two Decades: Changes in Work and Family in Massachusetts, 1979–1999 (Boston: University ofMassachusetts Donahue Institute, 2002).
9. Andrew Sum, Paul Harrington, Neeta Fogg, Ishwar Khatiwada, Mykhaylo Trub’skyy, and Sheila Palma,The State of the American Dream in Massachusetts, 2002 (Boston: Center for Labor Market Studies/MassachusettsInstitute for a New Commonwealth, 2002), 125.
10. Ibid., 126.
11. Ibid., 115–17.
12. From 1990 to 2000, there was a definition change that may affect the number of housing units meas-ured in different categories. In 1990, there was a catch-all “other” category that contained 22,303 housingunits. In 2000, this category was narrowed by adding a specific category labeled “Boat, RV, Van, etc.” thatcounted only 308 units. Clearly, the units counted as “other” in 1990 did not disappear, but were reclassifiedin 2000 as other types of units. Unfortunately, it is not possible to know what types of units those were.
13. It should be noted that two-thirds of all multifamily housing is in the Boston Metro region, whichraises the value of the overall state average for this type of housing, due to that region’s high costs.
14. Data for year structure built by unit type was taken from Census Summary File 3, Table HCT6, whichonly tracks occupied housing units. Therefore, adding vacant housing units would change the numberssomewhat, but would likely not change the ratios between single-family and multifamily land consumption.As the census only reports homes built in the 1980s as being built from 1980 to 1989, this data was derived bycalculating the percentage of all housing built from 1980 to 1984 from the 1990 decennial census (which was40 percent) and applying it to the data in Census 2000 SF3 Table HCT6.
15. Ken Ardon, Carlo DeSantis, Pamela MacLeod, Rebecca Rissman, and John Simon, Bringing Down theBarriers: Changing Housing Supply Dynamics in Massachusetts (Boston: Massachusetts Executive Office of Admin-istration and Finance, Policy Report Series, no. 4, October 2000).

30 WINNERS AND LOSERS IN THE MASSACHUSETTS HOUSING MARKET
16. Robert Nakosteen and James Palma, The Fiscal Impact of New Housing Development in Massachusetts: ACritical Analysis (Boston: Citizens’ Housing and Planning Association, 2003).
17. Sensible Growth for Wells, January 2002. www.sensiblegrowthwells.com/faq.html.
18. Ibid.
19. Michael Jonas, “Anti-family values,” CommonWealth Magazine, Spring 2002.
20. Donahue Institute, Fiscal Impact of New Housing Development.
21. Charles Euchner and Elizabeth G. Frieze, Getting Home: Overcoming Barriers to Housing in GreaterBoston (Boston: Pioneer Institute for Public Policy Research, 2003).
22. Ibid.
23. 2003. Existing Conditions Report (Milestone 1), WRCOG-OCCOG Interregional PartnershipJobs–Housing Balance Project, 12. (Orange/Riverside County, California: Western Riverside Council ofGovernments (WRCOG) and the Orange County Council of Governments (OCCOG), 2003)wrcog02.wrcog.cog.ca.us/irp91/existing condition report/draft/Chapter 2 Assessment of Jobs-HousingBalance.pdf.
24. Ibid., 13.
25. www.micanews.com/press/fact_sheets/consumerSurvey.cfm
26. Gary Engelhardt, “Consumption, down payments, and liquidity constraints,” Journal of Money, Creditand Banking 28, no. 2 (May 1996): 259.
27. See Robert Nakosteen, Michael Goodman, and Dana Ansel, Mass. Migration (Boston, Massachusetts:Institute for a New Commonwealth, 2003).
31
AppendixChange in no. Percentage Acres of
Change in Number of households change in land lost tonumber of of households paying over average single- low-density
Number of children in paying over 30% 30% of income family home housingBenchmarks subfamilies, subfamilies, of income for for housing, sales price, development
City/Town region 2000 1980–2000 for housing, 2000 1990–2000 2001–2002 1971–1999
Abington Southeast 130 144 1,074 –64 13.9% 41
Acton Boston Metro 104 95 1,564 –26 8.8% 1,026
Acushnet Southeast 139 148 665 41 20.7% 509
Adams Berkshire 43 46 962 87 3.3% 125
Agawam Pioneer Valley 138 151 2,411 –223 13.5% 249
Alford Berkshire 3 2 21 –4 –15.1% 312
Amesbury Northeast 107 144 1,646 128 11.2% 211
Amherst Pioneer Valley 72 36 3,302 –326 6.4% 513
Andover Northeast 98 104 2,414 –72 1.8% 953
Arlington Boston Metro 251 169 4,411 65 7.9% 0
Ashburnham Central 67 58 371 –50 2.3% 956
Ashby Central 32 40 189 22 –9.0% 483
Ashfield Pioneer Valley 16 11 98 –18 –13.2% 489
Ashland Boston Metro 83 68 1,360 246 8.0% 447
Athol Central 79 76 1,029 –7 15.7% 524
Attleborough Southeast 356 187 3,420 –293 16.4% 427
Auburn Central 130 179 1,106 64 20.3% 351
Avon Southeast 76 101 481 143 –1.4% 52
Ayer Central 50 51 771 5 21.3% 113
Barnstable Cape/Islands 323 323 5,741 –20 14.5% 4,700
Barre Central 32 53 367 122 7.2% 772
Becket Berkshire 2 – 127 3 14.2% 1,003
Bedford Boston Metro 115 21 858 –66 12.4% –109
Belchertown Pioneer Valley 50 43 1,012 209 18.5% 2,196
Bellingham Boston Metro 176 95 1,024 –151 22.8% 462
Belmont Boston Metro 67 –15 2,210 25 7.0% 36
Berkley Southeast 51 6 343 43 9.5% 1,083
Berlin Central 24 25 211 74 –6.8% 426
Bernardston Pioneer Valley 25 24 137 –11 17.9% 414
Beverly Northeast 344 256 3,918 –203 4.7% 204
Billerica Northeast 437 314 2,868 244 8.5% 296
Blackstone Central 33 28 638 –5 5.4% 570
Blandford Pioneer Valley 6 9 72 10 9.8% 206
Bolton Boston Metro 28 13 310 98 –7.4% 1,037
Boston Boston Metro 6,221 6,141 73,076 –2,788 1.3% –4
Bourne Cape/Islands 137 113 1,975 298 9.6% 706
Boxborough Boston Metro 4 8 299 45 4.4% 726
Boxford Northeast 28 2 436 19 10.2% 1,842
32 WINNERS AND LOSERS IN THE MASSACHUSETTS HOUSING MARKET
Change in no. Percentage Acres ofChange in Number of households change in land lost tonumber of of households paying over average single- low-density
Number of children in paying over 30% 30% of income family home housingBenchmarks subfamilies, subfamilies, of income for for housing, sales price, development
City/Town region 2000 1980–2000 for housing, 2000 1990–2000 2001–2002 1971–1999
Boylston Central 14 8 243 5 6.9% 631
Braintree Boston Metro 337 244 2,743 254 10.2% 7
Brewster Cape/Islands 27 47 993 –5 13.3% 2,069
Bridgewater Southeast 217 106 1,546 –52 9.2% 1,084
Brimfield Pioneer Valley 20 28 208 42 –2.2% 606
Brockton Southeast 1,268 1,365 9,875 –941 19.1% 35
Brookfield Central 0 – 193 –18 25.5% 375
Brookline Boston Metro 239 73 6,701 671 10.7% 9
Buckland Pioneer Valley 30 20 122 –7 –9.1% 183
Burlington Boston Metro 255 164 1,736 92 11.9% 60
Cambridge Boston Metro 490 361 13,088 2,886 –0.2% 0
Canton Boston Metro 147 123 2,002 783 11.4% 589
Carlisle Boston Metro 20 –5 344 –36 2.0% 1,206
Carver Southeast 70 64 767 –89 13.5% 1,145
Charlemont Pioneer Valley 6 13 114 20 3.0% 233
Charlton Central 93 45 578 –199 17.1% 2,344
Chatham Cape/Islands 35 23 686 –40 4.2% –113
Chelmsford Northeast 218 116 2,780 636 15.3% 754
Chelsea Boston Metro 475 495 3,819 8 10.4% 0
Cheshire Berkshire 14 9 209 0 86.6% 343
Chester Pioneer Valley 11 10 86 8 32.0% 193
Chesterfield Pioneer Valley 9 8 97 54 –4.4% 365
Chicopee Pioneer Valley 379 310 5,410 697 11.7% –30
Chilmark Cape/Islands 3 4 82 13 7.3% 838
Clarksburg Berkshire 17 12 115 8 10.5% 140
Clinton Central 105 103 1,326 249 6.4% 107
Cohasset Boston Metro 36 35 710 44 –3.3% 147
Colrain Pioneer Valley 10 11 100 –14 14.1% 343
Concord Boston Metro 35 36 1,286 111 4.5% 817
Conway Pioneer Valley 14 11 112 1 – 620
Cummington Pioneer Valley 2 2 49 0 53.6% 177
Dalton Berkshire 18 –10 530 35 19.1% 297
Danvers Northeast 142 49 2,216 21 9.1% 281
Dartmouth Southeast 305 318 2,372 113 5.3% 1,918
Dedham Boston Metro 264 252 2,161 270 14.7% 49
Deerfield Pioneer Valley 46 86 350 –23 –11.0% 432
Dennis Cape/Islands 95 59 1,835 171 18.8% 1,103
Dighton Southeast 55 46 284 –160 9.9% 559
Douglas Central 31 25 477 3 5.9% 1,688

APPENDIX 33
Change in no. Percentage Acres ofChange in Number of households change in land lost tonumber of of households paying over average single- low-density
Number of children in paying over 30% 30% of income family home housingBenchmarks subfamilies, subfamilies, of income for for housing, sales price, development
City/Town region 2000 1980–2000 for housing, 2000 1990–2000 2001–2002 1971–1999
Dover Boston Metro 29 21 369 81 –0.8% 380
Dracut Northeast 372 311 2,040 23 11.1% 1,376
Dudley Central 82 76 796 74 32.1% 697
Dunstable Northeast 19 17 200 79 –4.4% 981
Duxbury Southeast 84 78 1,104 –112 7.5% 1,555
East Bridgewater Southeast 151 102 1,010 58 9.7% 381
East Brookfield Central 23 29 127 5 47.9% 204
East Pioneer Valley 73 77 1,157 261 3.8% 95Longmeadow
Eastham Cape/Islands 13 21 485 12 26.7% 292
Easthampton Pioneer Valley 99 70 1,536 335 19.7% 150
Easton Southeast 182 151 1,521 57 14.3% 866
Edgartown Cape/Islands 49 34 467 46 –14.9% 1,722
Egremont Berkshire 13 9 126 27 52.2% 331
Erving Pioneer Valley 9 11 86 –6 9.0% 159
Essex Northeast 5 14 347 –5 29.1% 255
Everett Boston Metro 292 247 4,032 3 21.3% 0
Fairhaven Southeast 141 126 1,632 –35 12.8% 130
Fall River Southeast 724 473 9,764 –649 14.6% 146
Falmouth Cape/Islands 220 227 3,469 –15 18.0% 1,933
Fitchburg Central 345 376 3,823 –698 13.8% 205
Florida Berkshire 2 –1 32 2 526.7% 138
Foxborough Boston Metro 59 51 1,366 83 19.1% 874
Framingham Boston Metro 496 360 7,142 346 10.9% 531
Franklin Boston Metro 160 119 2,303 449 2.5% 866
Freetown Southeast 50 20 534 –35 18.7% 978
Gardner Central 116 104 1,947 45 20.5% 179
Gay Head Cape/Islands 5 5 30 9 38.2% 224
Georgetown Northeast 60 23 602 43 4.7% 680
Gill Pioneer Valley 2 3 78 8 9.2% 318
Gloucester Northeast 213 169 3,425 –84 9.9% 446
Goshen Pioneer Valley 5 8 51 8 –18.9% 302
Gosnold Cape/Islands 0 – 8 8 – 10
Grafton Central 84 61 1,254 306 6.3% 657
Granby Pioneer Valley 52 4 442 92 16.9% 839
Granville Pioneer Valley 21 19 91 0 3.6% 222
Great Barrington Berkshire 35 70 735 –32 – 848
Greenfield Pioneer Valley 140 135 2,204 –46 14.0% 175
Groton Central 22 22 646 20 6.9% 2,204

34 WINNERS AND LOSERS IN THE MASSACHUSETTS HOUSING MARKET
Change in no. Percentage Acres ofChange in Number of households change in land lost tonumber of of households paying over average single- low-density
Number of children in paying over 30% 30% of income family home housingBenchmarks subfamilies, subfamilies, of income for for housing, sales price, development
City/Town region 2000 1980–2000 for housing, 2000 1990–2000 2001–2002 1971–1999
Groveland Northeast 34 14 478 57 –5.9% 471
Hadley Pioneer Valley 18 14 396 17 38.9% 341
Halifax Southeast 99 113 516 –24 21.9% 544
Hamilton Northeast 48 33 579 –57 16.9% 414
Hampden Pioneer Valley 30 33 278 19 –11.1% 536
Hancock Berkshire 2 4 40 –8 – 132
Hanover Southeast 90 93 1,185 199 26.7% 653
Hanson Southeast 104 85 725 41 26.1% 551
Hardwick Central 17 17 183 19 8.7% 507
Harvard Central 5 – 353 –108 –12.4% 1,443
Harwich Cape/Islands 49 41 1,316 –29 27.1% 1,322
Hatfield Pioneer Valley 24 8 201 48 –0.8% 404
Haverhill Northeast 431 351 5,690 105 15.8% 545
Hawley Pioneer Valley 3 3 20 2 97.1% 92
Heath Pioneer Valley 10 14 39 1 –9.8% 136
Hingham Boston Metro 88 74 1,660 92 15.3% 366
Hinsdale Berkshire 14 2 127 –8 5.8% 237
Holbrook Boston Metro 165 128 956 –204 16.0% 45
Holden Central 92 40 1,158 119 10.4% 393
Holland Pioneer Valley 19 20 193 –25 18.5% 332
Holliston Boston Metro 63 64 1,094 20 2.7% 821
Holyoke Pioneer Valley 354 447 4,531 –525 7.3% 174
Hopedale Central 26 –4 459 –53 –4.1% 156
Hopkinton Boston Metro 57 70 904 91 19.5% 2,241
Hubbardston Central 25 15 139 –59 –4.0% 997
Hudson Boston Metro 210 185 1,314 –290 16.5% 461
Hull Boston Metro 141 132 1,403 238 17.6% 1
Huntington Pioneer Valley 10 13 141 –15 54.6% 260
Ipswich Northeast 88 25 1,353 155 6.8% 542
Kingston Southeast 47 59 1,140 283 9.2% 1,129
Lakeville Southeast 92 95 694 154 16.5% 1,299
Lancaster Central 66 27 448 69 9.1% 362
Lanesborough Berkshire 28 24 204 –16 –3.3% 487
Lawrence Northeast 1,034 1,213 8,154 –1,412 23.4% 0
Lee Berkshire 9 –25 539 91 14.0% 196
Leicester Central 95 67 698 41 20.9% 686
Lenox Berkshire 10 –5 607 133 21.0% 415
Leominster Central 360 280 3,684 287 13.3% 391
Leverett Pioneer Valley 2 – 129 21 –5.6% 338

APPENDIX 35
Change in no. Percentage Acres ofChange in Number of households change in land lost tonumber of of households paying over average single- low-density
Number of children in paying over 30% 30% of income family home housingBenchmarks subfamilies, subfamilies, of income for for housing, sales price, development
City/Town region 2000 1980–2000 for housing, 2000 1990–2000 2001–2002 1971–1999
Lexington Boston Metro 148 115 2,586 117 13.4% 74
Leyden Pioneer Valley 6 7 26 –6 8.5% 266
Lincoln Boston Metro 17 21 456 –13 8.1% 430
Littleton Boston Metro 94 107 551 –8 5.5% 802
Longmeadow Pioneer Valley 65 66 1,311 307 5.6% 10
Lowell Northeast 1,211 1,089 10,264 –1,305 14.9% –24
Ludlow Pioneer Valley 140 125 1,518 104 2.3% 681
Lunenburg Central 69 60 648 –35 21.4% 1,329
Lynn Boston Metro 1,154 961 9,789 –904 20.5% 22
Lynnfield Northeast 103 55 874 –4 17.5% 414
Malden Boston Metro 572 354 6,433 83 18.7% 0
Manchester Northeast 26 19 533 85 –27.6% 183
Mansfield Southeast 126 190 1,903 412 6.1% 1,165
Marblehead Northeast 103 40 1,929 –33 –1.6% 26
Marion Southeast 27 30 463 162 19.9% 487
Marlborough Boston Metro 296 138 3,331 289 10.6% 994
Marshfield Southeast 217 205 2,361 218 11.3% 941
Mashpee Cape/Islands 62 40 1,299 10 16.8% 832
Mattapoisett Southeast 28 59 479 –120 29.9% 414
Maynard Boston Metro 63 28 1,119 140 12.0% 32
Medfield Boston Metro 18 4 788 65 5.1% 44
Medford Boston Metro 502 378 5,186 –331 14.4% 2
Medway Boston Metro 74 45 848 52 3.7% 1,023
Melrose Boston Metro 208 201 2,374 –171 8.3% 9
Mendon Central 49 20 457 185 4.2% 1,222
Merrimack Northeast 31 31 416 –11 9.2% 494
Methuen Northeast 408 279 3,868 11 13.7% 586
Middleborough Southeast 252 275 1,669 213 12.7% 2,352
Middlefield Pioneer Valley 0 – 29 13 53.8% 207
Middleton Northeast 16 – 489 91 14.4% 367
Milford Boston Metro 185 184 2,707 273 13.2% 364
Millbury Central 103 74 1,036 69 12.9% 315
Millis Boston Metro 16 6 645 –25 1.3% 468
Millville Central 18 –6 179 –11 10.7% 411
Milton Boston Metro 126 90 2,158 48 11.7% 334
Monroe Pioneer Valley 0 – 6 1 – 3
Monson Pioneer Valley 39 16 664 174 21.3% 1,249
Montague Pioneer Valley 71 47 865 –4 3.2% 298
Monterey Berkshire 5 0 76 15 –14.9% 330

36 WINNERS AND LOSERS IN THE MASSACHUSETTS HOUSING MARKET
Change in no. Percentage Acres ofChange in Number of households change in land lost tonumber of of households paying over average single- low-density
Number of children in paying over 30% 30% of income family home housingBenchmarks subfamilies, subfamilies, of income for for housing, sales price, development
City/Town region 2000 1980–2000 for housing, 2000 1990–2000 2001–2002 1971–1999
Montgomery Pioneer Valley 2 4 42 –12 49.2% 237
Mount Berkshire 2 6 14 7 6.9% 52Washington
Nahant Boston Metro 32 38 377 –58 32.3% 1
Nantucket Cape/Islands 36 16 1,296 343 –7.3% 1,428
Natick Boston Metro 225 164 2,663 –157 6.3% 197
Needham Boston Metro 81 –3 2,487 443 5.2% 149
New Ashford Berkshire 0 – 4 –4 – 61
New Bedford Southeast 794 530 10,840 –822 18.5% 15
New Braintree Central 11 4 58 35 –26.4% 334
New Berkshire 9 6 105 11 102.6% 526Marlborough
New Salem Pioneer Valley 5 9 46 –6 13.2% 151
Newbury Northeast 94 95 590 34 4.2% 698
Newburyport Northeast 104 76 1,777 –204 0.4% 73
Newton Boston Metro 400 107 6,499 –301 0.1% 16
Norfolk Boston Metro 67 63 507 –100 8.3% 667
North Adams Berkshire 24 9 1,568 –88 8.4% 88
North Andover Northeast 133 82 2,086 131 5.5% 1,190
North Southeast 159 143 1,880 –153 11.5% 436Attleborough
North Brookfield Central 28 20 335 9 4.7% 479
North Reading Northeast 116 117 1,084 201 13.6% 1,096
Northampton Pioneer Valley 121 134 2,955 147 22.3% 750
Northborough Central 105 63 1,049 202 9.0% 952
Northbridge Central 96 72 1,006 –154 17.7% 660
Northfield Pioneer Valley 17 7 168 –12 –6.4% 436
Norton Southeast 157 129 1,238 284 9.1% 783
Norwell Southeast 53 66 667 24 7.5% 903
Norwood Boston Metro 194 78 2,721 165 14.5% 15
Oak Bluffs Cape/Islands 12 11 492 78 19.6% 816
Oakham Central 10 12 70 –23 –4.5% 559
Orange Pioneer Valley 70 104 528 –112 7.2% 451
Orleans Cape/Islands 45 30 748 44 17.4% 1,335
Otis Berkshire 5 12 105 36 51.3% 562
Oxford Central 85 69 1,131 118 – 642
Palmer Pioneer Valley 39 32 1,010 59 26.5% 545
Paxton Central 37 5 293 6 10.9% 525
Peabody Northeast 538 443 3,997 –331 16.5% –2
Pelham Pioneer Valley 9 12 97 6 –39.3% 279
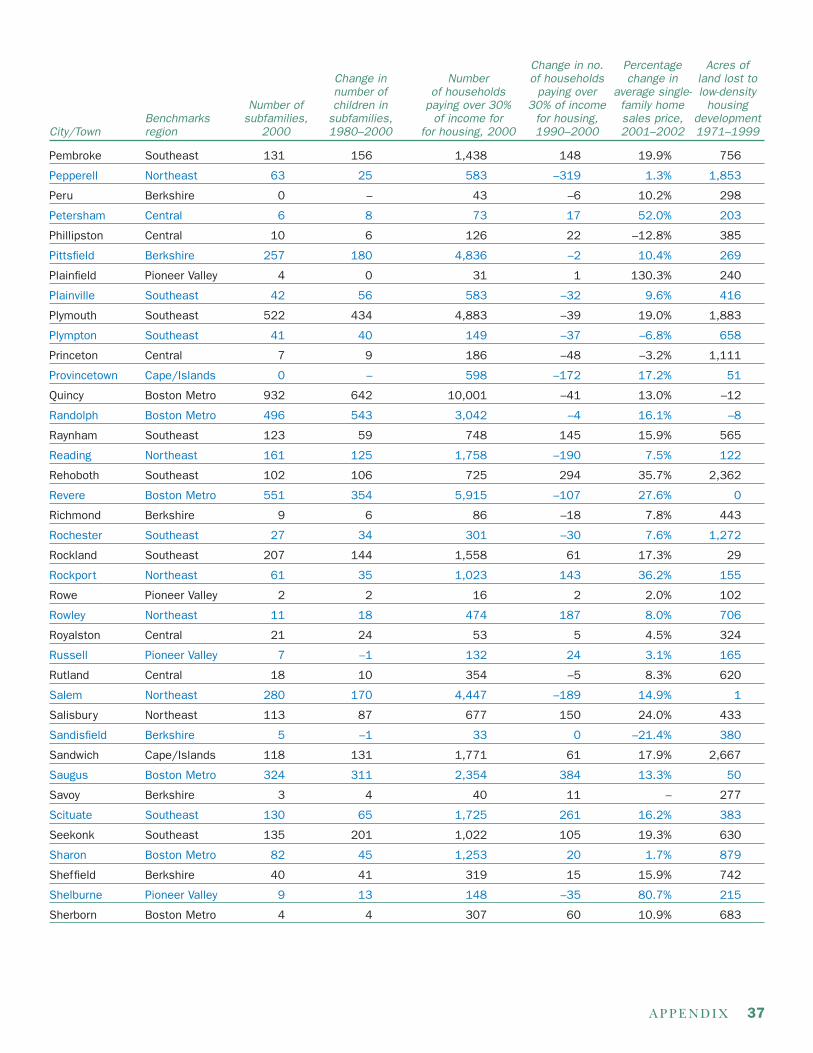
APPENDIX 37
Change in no. Percentage Acres ofChange in Number of households change in land lost tonumber of of households paying over average single- low-density
Number of children in paying over 30% 30% of income family home housingBenchmarks subfamilies, subfamilies, of income for for housing, sales price, development
City/Town region 2000 1980–2000 for housing, 2000 1990–2000 2001–2002 1971–1999
Pembroke Southeast 131 156 1,438 148 19.9% 756
Pepperell Northeast 63 25 583 –319 1.3% 1,853
Peru Berkshire 0 – 43 –6 10.2% 298
Petersham Central 6 8 73 17 52.0% 203
Phillipston Central 10 6 126 22 –12.8% 385
Pittsfield Berkshire 257 180 4,836 –2 10.4% 269
Plainfield Pioneer Valley 4 0 31 1 130.3% 240
Plainville Southeast 42 56 583 –32 9.6% 416
Plymouth Southeast 522 434 4,883 –39 19.0% 1,883
Plympton Southeast 41 40 149 –37 –6.8% 658
Princeton Central 7 9 186 –48 –3.2% 1,111
Provincetown Cape/Islands 0 – 598 –172 17.2% 51
Quincy Boston Metro 932 642 10,001 –41 13.0% –12
Randolph Boston Metro 496 543 3,042 –4 16.1% –8
Raynham Southeast 123 59 748 145 15.9% 565
Reading Northeast 161 125 1,758 –190 7.5% 122
Rehoboth Southeast 102 106 725 294 35.7% 2,362
Revere Boston Metro 551 354 5,915 –107 27.6% 0
Richmond Berkshire 9 6 86 –18 7.8% 443
Rochester Southeast 27 34 301 –30 7.6% 1,272
Rockland Southeast 207 144 1,558 61 17.3% 29
Rockport Northeast 61 35 1,023 143 36.2% 155
Rowe Pioneer Valley 2 2 16 2 2.0% 102
Rowley Northeast 11 18 474 187 8.0% 706
Royalston Central 21 24 53 5 4.5% 324
Russell Pioneer Valley 7 –1 132 24 3.1% 165
Rutland Central 18 10 354 –5 8.3% 620
Salem Northeast 280 170 4,447 –189 14.9% 1
Salisbury Northeast 113 87 677 150 24.0% 433
Sandisfield Berkshire 5 –1 33 0 –21.4% 380
Sandwich Cape/Islands 118 131 1,771 61 17.9% 2,667
Saugus Boston Metro 324 311 2,354 384 13.3% 50
Savoy Berkshire 3 4 40 11 – 277
Scituate Southeast 130 65 1,725 261 16.2% 383
Seekonk Southeast 135 201 1,022 105 19.3% 630
Sharon Boston Metro 82 45 1,253 20 1.7% 879
Sheffield Berkshire 40 41 319 15 15.9% 742
Shelburne Pioneer Valley 9 13 148 –35 80.7% 215
Sherborn Boston Metro 4 4 307 60 10.9% 683

38 WINNERS AND LOSERS IN THE MASSACHUSETTS HOUSING MARKET
Change in no. Percentage Acres ofChange in Number of households change in land lost tonumber of of households paying over average single- low-density
Number of children in paying over 30% 30% of income family home housingBenchmarks subfamilies, subfamilies, of income for for housing, sales price, development
City/Town region 2000 1980–2000 for housing, 2000 1990–2000 2001–2002 1971–1999
Shirley Central 49 11 394 –117 13.2% 441
Shrewsbury Central 221 124 3,003 746 16.4% 167
Shutesbury Pioneer Valley 1 – 142 –7 –21.9% 436
Somerset Southeast 258 213 1,376 213 10.3% 48
Somerville Boston Metro 757 695 8,806 –516 20.1% 0
South Hadley Pioneer Valley 126 85 1,341 352 11.0% 162
Southampton Pioneer Valley 27 32 346 57 15.7% 565
Southborough Boston Metro 56 33 629 215 2.6% 857
Southbridge Central 84 57 2,004 99 26.2% 366
Southwick Pioneer Valley 72 100 769 133 –4.1% 1,294
Spencer Central 105 60 959 –72 15.6% 974
Springfield Pioneer Valley 1,773 1,791 17,350 –550 11.9% –8
Sterling Central 49 61 484 35 18.1% 1,106
Stockbridge Berkshire 12 8 169 –31 5.0% 270
Stoneham Boston Metro 214 136 2,175 –192 8.5% –4
Stoughton Southeast 312 261 2,652 381 8.5% 249
Stow Boston Metro 58 50 460 109 0.7% 596
Sturbridge Central 38 12 583 –19 9.7% 954
Sudbury Boston Metro 36 20 1,260 180 0.1% –1,551
Sunderland Pioneer Valley 23 16 607 49 4.7% 280
Sutton Central 69 34 511 105 10.5% 1,119
Swampscott Boston Metro 59 16 1,220 –8 13.5% –2
Swansea Southeast 180 123 1,285 410 29.4% 462
Taunton Southeast 586 449 4,885 262 17.2% 1,813
Templeton Central 62 35 485 126 –6.5% 753
Tewksbury Northeast 324 243 2,373 411 9.7% 578
Tisbury Cape/Islands 30 19 502 76 –42.2% 590
Tolland Pioneer Valley 4 6 29 10 40.7% 261
Topsfield Northeast 17 – 374 –16 19.2% 473
Townsend Central 71 41 669 –26 5.8% 810
Truro Cape/Islands 8 2 236 50 1.9% 675
Tyngsborough Northeast 141 145 895 38 14.6% 1,913
Tyringham Berkshire 0 – 9 –9 79.0% 202
Upton Central 21 32 394 18 0.5% 1,272
Uxbridge Central 69 50 763 –39 6.9% 1,722
Wakefield Boston Metro 220 167 2,034 –308 10.5% 148
Wales Pioneer Valley 9 1 120 –29 4.1% 267
Walpole Boston Metro 221 156 1,707 38 10.3% 683
Waltham Boston Metro 452 384 6,426 788 8.1% –8

APPENDIX 39
Change in no. Percentage Acres ofChange in Number of households change in land lost tonumber of of households paying over average single- low-density
Number of children in paying over 30% 30% of income family home housingBenchmarks subfamilies, subfamilies, of income for for housing, sales price, development
City/Town region 2000 1980–2000 for housing, 2000 1990–2000 2001–2002 1971–1999
Ware Pioneer Valley 31 25 1,011 141 12.6% 874
Wareham Southeast 232 233 2,243 153 21.1% 331
Warren Central 25 36 419 114 12.7% 540
Warwick Pioneer Valley 12 10 38 4 51.2% 171
Washington Berkshire 6 7 13 –17 39.4% 255
Watertown Boston Metro 212 215 3,050 74 2.0% 0
Wayland Boston Metro 67 24 1,254 508 4.2% 289
Webster Central 45 29 1,678 59 16.1% 222
Wellesley Boston Metro 104 6 1,720 –72 –3.9% 53
Wellfleet Cape/Islands 16 16 306 –48 28.1% 686
Wendell Pioneer Valley 5 9 51 4 40.8% 243
Wenham Northeast 31 47 290 49 1.4% 173
West Boylston Central 28 44 528 76 –6.2% 280
West Bridgewater Southeast 42 37 534 56 9.1% 158
West Brookfield Central 13 6 290 100 21.7% 685
West Newbury Northeast 51 50 298 105 –10.8% 839
West Springfield Pioneer Valley 192 159 2,952 355 3.1% 177
West Stockbridge Berkshire 2 2 113 –24 33.0% 577
West Tisbury Cape/Islands 3 – 235 –8 16.8% 2,135
Westborough Central 90 72 1,386 –47 5.0% 545
Westfield Pioneer Valley 304 184 3,350 –245 8.8% 924
Westford Northeast 80 69 1,198 173 8.7% 2,446
Westhampton Pioneer Valley 13 5 63 3 –15.5% 460
Westminster Central 31 46 469 65 0.8% 905
Weston Boston Metro 31 –1 815 45 –2.0% 196
Westport Southeast 133 63 1,070 42 16.0% 1,494
Westwood Boston Metro 102 100 1,183 130 –0.3% 465
Weymouth Boston Metro 466 357 5,449 301 16.4% 22
Whately Pioneer Valley 0 –5 139 43 –3.4% 232
Whitman Southeast 170 118 1,227 108 12.0% 22
Wilbraham Pioneer Valley 20 19 1,049 317 19.0% 227
Williamsburg Pioneer Valley 23 17 199 63 32.4% 495
Williamstown Berkshire 26 55 430 –117 14.1% 280
Wilmington Northeast 320 194 1,678 500 10.1% 513
Winchendon Central 89 71 660 –145 12.6% 1,284
Winchester Boston Metro 125 79 1,717 235 10.4% 153
Windsor Berkshire 6 7 54 20 –25.2% 345
Winthrop Boston Metro 136 91 1,650 –155 0.3% 0
Woburn Boston Metro 368 212 3,917 634 20.2% 33

40 WINNERS AND LOSERS IN THE MASSACHUSETTS HOUSING MARKET
Change in no. Percentage Acres ofChange in Number of households change in land lost tonumber of of households paying over average single- low-density
Number of children in paying over 30% 30% of income family home housingBenchmarks subfamilies, subfamilies, of income for for housing, sales price, development
City/Town region 2000 1980–2000 for housing, 2000 1990–2000 2001–2002 1971–1999
Worcester Central 1,571 1,244 18,568 206 19.6% –31
Worthington Pioneer Valley 6 8 59 1 4.7% 355
Wrentham Boston Metro 56 47 637 –159 8.9% 1,452
Yarmouth Cape/Islands 159 93 3,024 53 19.0% 773
State Total –52,008 3,806 608,088 11,013 11.4% 191,504

Donahue Institute
Office of the PresidentUMass Donahue Institute
220 Middlesex HouseUniversity of Massachusetts
Amherst, Massachusetts 01003(413) 545-0001
Citizens’ Housing and Planning Association, Inc.
18 Tremont Street, Suite 401Boston, MA 02108
(617) 742-0820www.chapa.org
Massachuetts Housing Partnership2 Oliver Street, Boston MA 02109
(617) 338-7868www.mhp.net