wipro investor presentation fy-18
TRANSCRIPT

© 2017 Wipro wipro.com confidential 1
Wipro Limited
Presentation to Investors
April - June 2018

© 2017 Wipro wipro.com confidential 2
Safe Harbor
This presentation may contain certain “forward looking” statements, which involve a
number of risks, uncertainties and other factors that could cause actual results to
differ materially from those that may be projected by these forward looking
statements. These uncertainties have been detailed in the reports filed by Wipro
with the Securities and Exchange Commission and these filings are available at
www.sec.gov. This presentation also contains references to findings of various
reports available in the public domain. Wipro makes no representation as to their
accuracy or that the company subscribes to those findings.

© 2017 Wipro wipro.com confidential 33
Our track record on performance1
Agenda
Overall Market Opportunity2
Our Strategy3

© 2017 Wipro wipro.com confidential 4
Track record on performance

© 2017 Wipro wipro.com confidential 5
$3,647 $4,323 $4,390
$5,221 $5,921 $6,218 $6,618 $7,082 $7,346 $7,705 $8,060
2007-2008 2008-2009 2009-2010 2010-2011 2011-2012 2012-2013 2013-2014 2014-2015 2015-2016 2016-2017 2017-2018
Growth of IT services business
Other Highlights
IT Services Revenue ($ Million)
• 1200+ active global clients
• Eight $100M relationships
• 27% revenues from Digital
• Part of NYSE TMT Index
• Present in six continents
• 50%+ Revenues from America
• Over 160,000 employees
• 100+ nationalities represented
• 33%+ women employees
Partner to Industry Global footprint Diverse talent pool
IT Services Business has grown at a CAGR of over 8% in the last 10 years

© 2017 Wipro wipro.com confidential 6
Q4’18 Revenue distribution – Well diversifiedRevenue Distribution Business Unit-wise share
Revenue contribution^
Top customer
Top 5 customers
Top 10 customers
Customers >$100 MN
Customers >$1 MN
3.5%
11.9%
18.4%
8
631A Trailing Twelve month basis
Customer Metrics
BFSI - Banking, Financial Services
and Insurance
HLS - Healthcare and Life Sciences
CBU – Consumer BU
ENU - Energy, Natural Resources
and Utilities
COMM – Communications BU
MNT - Manufacturing and
Technology
Service Line distribution
GIS-Global Infrastructure Services
PES-Product Engineering Services
BPS-Business Process Services
Scale in developed markets & increasing presence in emerging markets
Revenue well-diversified across verticals, service line & geographiesThe distribution percentages have been calculated based on Q4FY18 USD revenues for the Business Unit/ Service line/ Geography
Geographical Distribution
I&ME-India & Middle-East
APAC-Asia Pacific
OEM-Other Emerging Markets
COMM6%
BFSI29%
MNT23%
HLS14%
CBU16%
ENU12%
Americas53%Europe
27%
I&ME 9%
APAC and OEM 11%GIS
29%
Analytics7%
BPS12%
PES7%
Application Services
45%

© 2017 Wipro wipro.com confidential 7
FY’18 Revenue distribution – Well diversifiedRevenue Distribution Business Unit-wise share
Revenue contribution^
Top customer
Top 5 customers
Top 10 customers
Customers >$100 MN
Customers >$1 MN
3.1%
11.1%
17.8%
8
631A Trailing Twelve month basis
Customer Metrics
BFSI - Banking, Financial Services
and Insurance
HLS - Healthcare and Life Sciences
CBU – Consumer BU
ENU - Energy, Natural Resources
and Utilities
COMM – Communications BU
MNT - Manufacturing and
Technology
Service Line distribution
GIS-Global Infrastructure Services
PES-Product Engineering Services
BPS-Business Process Services
Scale in developed & presence in emerging markets
Revenue well-diversified across verticals, service line & geographiesThe distribution percentages have been calculated based on FY18 USD revenues for the Business Unit/ Service line/ Geography
Geographical Distribution
I&ME-India & Middle-East
APAC-Asia Pacific
OEM-Other Emerging Markets
COMM6%
BFSI28%
MNT23%
HLS14%
CBU16%
ENU13%
GIS29%
Analytics7%
BPS12%
PES7%
Application Services
45%
Americas53%
Europe 26%
I&ME 10%
APAC and OEM 11%

© 2017 Wipro wipro.com confidential 8
Overall market opportunity

© 2017 Wipro wipro.com confidential 9
Global market size
India’s offshore IT and BPO exports ($ Billion)~ 350-400
~200-225
23.6
617.7
31.440.3
59.1
47.149.7
CAGR 16%
FY12
68.8
FY13FY07FY06FY05 FY08 FY09 FY10 FY11 FY14
76.187.7
FY20
98.5
FY15 FY25
117
FY16
Digital technologies
FY17
108
• Long Term Fundamentals of the India offshoring story remain intact
• Offshoring market is expected to grow at a 15% CAGR for the next eight years
• Revenues from Digital technologies are expected to represent 23% and 38% share by 2020 and 2025
Source: NASSCOM The IT - BPO Sector in India – Strategic Review 2017
FY18
126

© 2017 Wipro wipro.com confidential 10
Our strategy
© 2017 Wipro wipro.com confidential 11
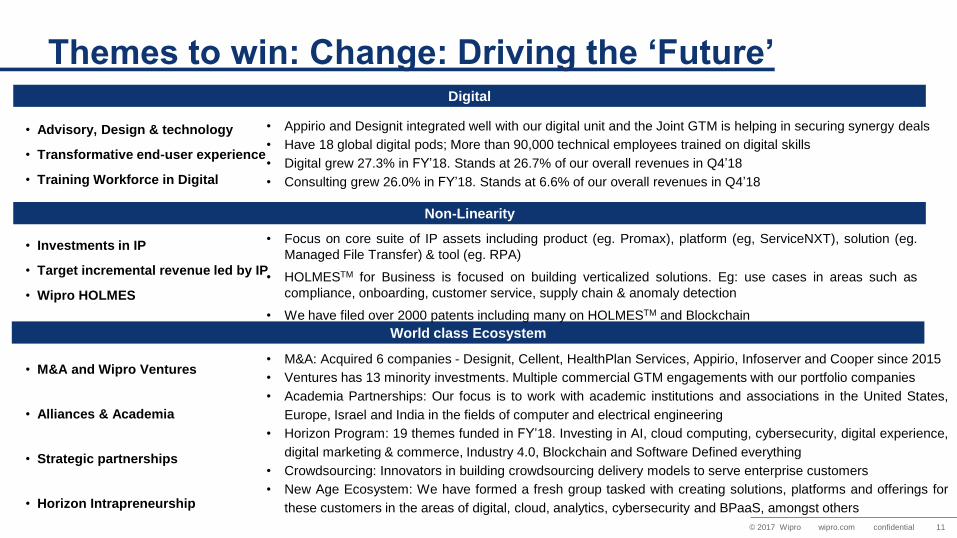
Themes to win: Change: Driving the ‘Future’
World class Ecosystem
Digital
Non-Linearity
• Appirio and Designit integrated well with our digital unit and the Joint GTM is helping in securing synergy deals
• Have 18 global digital pods; More than 90,000 technical employees trained on digital skills
• Digital grew 27.3% in FY’18. Stands at 26.7% of our overall revenues in Q4’18
• Consulting grew 26.0% in FY’18. Stands at 6.6% of our overall revenues in Q4’18
• M&A: Acquired 6 companies - Designit, Cellent, HealthPlan Services, Appirio, Infoserver and Cooper since 2015
• Ventures has 13 minority investments. Multiple commercial GTM engagements with our portfolio companies
• Academia Partnerships: Our focus is to work with academic institutions and associations in the United States,
Europe, Israel and India in the fields of computer and electrical engineering
• Horizon Program: 19 themes funded in FY’18. Investing in AI, cloud computing, cybersecurity, digital experience,
digital marketing & commerce, Industry 4.0, Blockchain and Software Defined everything
• Crowdsourcing: Innovators in building crowdsourcing delivery models to serve enterprise customers
• New Age Ecosystem: We have formed a fresh group tasked with creating solutions, platforms and offerings for
these customers in the areas of digital, cloud, analytics, cybersecurity and BPaaS, amongst others
• Advisory, Design & technology
• Transformative end-user experience
• Training Workforce in Digital
• Investments in IP
• Target incremental revenue led by IP
• Wipro HOLMES
• Focus on core suite of IP assets including product (eg. Promax), platform (eg, ServiceNXT), solution (eg.
Managed File Transfer) & tool (eg. RPA)
• HOLMESTM for Business is focused on building verticalized solutions. Eg: use cases in areas such as
compliance, onboarding, customer service, supply chain & anomaly detection
• We have filed over 2000 patents including many on HOLMESTM and Blockchain
• M&A and Wipro Ventures
• Alliances & Academia
• Strategic partnerships
• Horizon Intrapreneurship

© 2017 Wipro wipro.com confidential 12
Themes to win: Run: Modernize the ‘Core’
Integrated Services
Hyper Automation
Localization
• Traction with integrated services offerings to synergize domain knowledge with end-to-end solutions from
multiple services like Apps, Infra & Analytics to solve customer problems and enhance client mining
• An example is a KYC process hosted within Wipro environment with client data, client onboarding platform
and HOLMESTM eKYC solution being hosted in Wipro data center with BPS delivery from multiple locations
• Hyper automation is initiative to drive robotic process automation (RPA) and Cognitive Intelligence
drastically changing traditional IT delivery model
• Dedicated integrated unit – Wipro HOLMESTM to drive hyper-automation across IT & Business operations
• In FY18, generated productivity worth 8,000 persons from automation-led productivity gains. Released
employees are being trained & redeployed into newer technologies
• Wipro has been chosen by a leading North American healthcare technology company as their strategic
partner. We are leveraging our Wipro HOLMESTM platform to implement digital solutions harnessing the
power of cognitive computing, machine learning and hyper-automation
• More than 55% of U.S. workforce is local
• More than 75% of our APAC employees are local. In Latin America, almost all our employees are local
• Focus on key markets such as Continental Europe, Latin America and Middle-East
• Solve business problem as-a-service
rather than offer à la carte services
• Increase Automation; de-skill task
• Focus on automation
• Robotic Process Automation
• Cognitive Intelligence
• Setting up local delivery centers
• Acquisitions
• Diversification of Workforce

© 2017 Wipro wipro.com confidential 13
Winning together with strategic alliances
Joint Value Thought Leadership Executive Commitment
Wipro's WINNING TOGETHER approach is all about driving joint Go to Market initiatives in partnership with Strategic
Alliances and help customers Do Business Better
Wipro Strategic Alliances community helps in creating winning partnerships which offers mutual business growth
opportunities, joint value driven by collaboration, executive commitment and thought leadership around future
technologies
All product names, logos, and brands are property of their respective owners.

© 2017 Wipro wipro.com confidential 14
Recognitions on sustainability front

© 2017 Wipro wipro.com confidential 15
Annexure – key highlights

© 2017 Wipro wipro.com confidential 16
Financial summary for the quarter ended March 31, 2018
All figures based on IFRS Q4’18 (₹ crores) QoQ Growth
IT Services Revenue 13,412 1.3%
Results from Operating Activities (EBIT)1 1,803 -6.9%
₹1 crore = ₹10 million
• Our Gross cash at March 31, 2018 was at ₹29,402 crores.
• IT Services Revenues in dollar terms were $2,062.0 million, which grew 2.4% QoQ and 5.5% YoY.
• Effective Tax Rate for FY’18 was at 21.8% vs 22.8% for FY’17.
• IT Services Margin for the quarter was 14.4%, impacted by provisions of ₹2,080 million made with
respect to insolvency of a customer and an impairment loss booked for one of our acquisitions.
Adjusted for these events, IT Services Margin for the quarter was 16.0%.
• IT Services Revenues in Non-GAAP constant currency increased by 1.1% QoQ and 2.5% YoY.

© 2017 Wipro wipro.com confidential 17
Financial summary for the year ended March 31, 2018
All figures based on IFRS FY’18 (₹ crores) YoY Growth
IT Services Revenue 52,841 0.0%
Results from Operating Activities (EBIT)1 8,008 -5.7%
• IT Services Revenues in dollar terms were $8,060.2 million, an increase of 4.6% YoY.
• IT Services Revenues in Non-GAAP constant currency increased by 2.9% YoY.
• IT Services Margin was 15.8%, impacted by the provisions of ₹4,612 million made with respect to
the insolvency of two customers during the year. Adjusted for these events, IT Services Margin for
the year was 16.8%.
₹1 crore = ₹10 million

© 2017 Wipro wipro.com confidential 18
Highlights for the quarter and year ended March 31, 2018
We surpassed the $8 Billion mark in IT services revenue this year.
In Q4, our Top 10 accounts grew 5.5% QoQ and 14.8% YoY.
Added 3 more accounts over $75Mn this quarter.
Two of our accounts crossed $250Mn mark on a run rate basis in Q4.
Consulting grew 26.0% during the year.
FPP mix at an all time-high of 58.7%.
In the last one year, net head count reduced 1.0% while our revenues increased 5.5%.

© 2017 Wipro wipro.com confidential 19
Thank you

© 2017 Wipro wipro.com confidential 20
Reconciliation of Selected GAAP measures to Non-GAAP measures
WIPRO LIMITED AND SUBSIDIARIES
(Amounts in ₹ crores)
As of
March 31, 2018
Computation of Gross cash position
Cash and cash equivalents 4,493
Investments - Current 24,909
Total 29,402
Reconciliation of Non-GAAP Constant Currency IT Services Revenue to IT Services Revenue as per IFRS ($ Million)
Three months ended March 31, 2018 Three months ended March 31, 2018
IT Services Revenue as per IFRS $2062.0 IT Services Revenue as per IFRS $2,062.0
Effect of Foreign currency exchange movement $26.6 Effect of Foreign currency exchange movement $58.0
Non-GAAP Constant Currency IT Services Revenue
based on previous quarter exchange rates$ 2,035.4
Non-GAAP Constant Currency IT Services Revenue
based on exchange rates of comparable period in
previous year$2,004.0
Reconciliation of Non-GAAP constant currency Revenue
Reconciliation of Gross Cash
Reconciliation of Non-GAAP Constant Currency IT Services Revenue
to IT Services Revenue as per IFRS ($ Million)
Year ended March 31, 2018
IT Services Revenue as per IFRS $8060.2
Effect of Foreign currency exchange movement $131.0
Non-GAAP Constant Currency IT Services Revenue based
on previous year exchange rates$ 7,929.2
Reconciliation of Non-GAAP constant currency Revenue

© 2017 Wipro wipro.com confidential 21
Reconciliation of Adjusted Segment Result and Net Income
Reconciliation of Adjusted Segment Result for the quarter and year ended March 31,
2018 (₹ Million)
IT Services Segment Results for the
quarter ended March 31, 2018 19,322
IT Services Segment Results for the
year ended March 31, 2018 83,613
Impact of customer insolvency2,080
Impact of customer insolvency5,255
Adjusted IT Services Segment Results
for the quarter ended March 31, 201821,403
Adjusted IT Services Segment
Results for the year ended March
31, 2018
88,868
Adjusted IT Services Segment Margin 16.0%Adjusted IT Services Segment
Margin16.8%