wisconsin statewide waste characterization...
TRANSCRIPT

Wisconsin Statewide Waste Characterization Study
Final Report May 2003
Prepared by:
Cascadia Consulting Group, Inc.
With assistance from:
R.W. Beck GRG Analysis

Acknowledgments The consultant team would like to recognize all participating landfills and associated staff who contributed to the successful completion of this study. The following 14 landfills provided space and equipment for waste sorting activities, and detailed information for the planning and analysis phases of this study.
1. WMWI – Timberline Trail 2. BFI Waste Systems of North America, Inc. 3. Outagamie County SW Division 4. WMWI – Valley Trail RDF 5. WMWI – Ridgeview RDF 6. Superior Hickory Meadows LLC 7. Superior Glacier Ridge 8. Dane County #2 Rodefeld 9. WMWI – Deer Track Park, Inc. 10. WMWI – Metro Recycling & Disposal Facility 11. Superior Emerald Park LLC 12. WMWI – Orchard Ridge Recycling & Disposal 13. Superior Cranberry Creek 14. Superior Seven Mile Creek Inc., SEC2
In addition, the Wisconsin Department of Natural Resources (WDNR) provided information such as annual disposal tonnages that were used for analytical purposes, as well as technical support throughout the course of the study.

Table of Contents
1. EXECUTIVE SUMMARY 1
1.1. INTRODUCTION AND PURPOSE OF STUDY 1 1.2. OVERVIEW OF METHODOLOGY 1 1.3. SUMMARY OF RESULTS 2 1.3.1. Statewide Composition 2 1.3.2. Disposed Quantities 3
2. OVERVIEW 5
2.1. INTRODUCTION 5 2.2. DEFINING THE WASTE STREAM 6 2.3. SUMMARY OF METHODOLOGY 7 2.3.1. Sample Allocation 7 2.3.2. Sampling Plan 8 2.3.3. Data Collection Procedures 8 2.3.4. Calculation Procedures 8
3. SUMMARY OF SAMPLING RESULTS 9
3.1. OVERALL COMPOSITION 10 3.2. COMPOSITION BY SUBSTREAM 13 3.2.1. Residential 13 3.2.2. Industrial/Commercial/Institutional 16 3.2.3. Construction & Demolition 18 3.3. COMPOSITION BY HAULER TYPE 21 3.3.1. Self-Haul 21 3.3.2. Commercially Hauled 24 3.4. COMPARISONS AMONG SAMPLING GROUPS 26 3.5. PREVALENCE OF SHARPS, MERCURY-CONTAINING ITEMS, AND REUSABLES 29 3.5.1. Sharps 30 3.5.2. Mercury-Containing Items 30 3.5.3. Reusables 31
Appendix A: Waste Component Definitions Appendix B: Regional Composition Profiles Appendix C: Sampling Methodology Appendix D: Calculation Methods Appendix E: Field Forms


Cascadia Consulting Group, Inc. 1 Wisconsin Waste Characterization Study Final Report
1. EXECUTIVE SUMMARY
1.1. INTRODUCTION AND PURPOSE OF STUDY
Effective solid waste planning and service delivery begins with an understanding of the types and quantities of materials being discarded, the source of these wastes, and the amount that is potentially recoverable. These data inform sound solid waste management policy and program implementation, from designing new waste reduction programs and planning new facilities, to evaluating the effectiveness of current recovery efforts. To satisfy these information needs, the WDNR commissioned a Statewide Waste Characterization Study in 2002. The objectives of the study were to:
1. Estimate composition and quantities of in-state waste disposed in Wisconsin’s municipal solid waste (MSW) landfills;
2. Provide composition and quantity estimates for in-state waste generated in five WDNR-defined geographic regions;
3. Estimate the composition and quantities of waste disposed by residents, industrial, commercial and institutional (ICI) generators, and construction and demolition (C&D) activities within the state; and,
4. Establish a baseline for measuring the impact of future waste reduction and recycling programs, including the new Recycling Pilot Program.
This executive summary presents an overview of the study methodology in Section 1.2, and highlights the principal findings in Section 1.3 below.
1.2. OVERVIEW OF METHODOLOGY
The study methodology consisted of five main steps, which are summarized below.
1. Select Landfills and Schedule Sampling – A total of 14 of Wisconsin’s largest landfills, comprising approximately 78% of all MSW disposed in the state, were selected for participation in this study. One-half of the landfills were scheduled during the summer, and the other half during the winter. Two days were planned at each facility to gather a sufficient number of randomly selected waste loads for sampling.
2. Apportion Samples – Samples were apportioned among waste loads from residents, ICI generators, and C&D activities. The samples were further divided between commercially collected (including both private and municipal haulers) and self-hauled waste loads.
3. Sort Waste Samples – A total of 400 waste samples, weighing 200-300 pounds each, were taken from the selected loads, and sorted into 64 distinct material categories.
4. Collect Waste Tonnages – Following sampling activities, waste tonnages were collected from individual landfills, with the assurance that no landfill-specific information would be made available. Instead, all tonnage and composition results were reported in aggregate form for this study.
5. Perform Characterization Analysis – Composition estimates were calculated at a 90% confidence level, at the Statewide and regional levels, for residential, ICI, and C&D generators, and for self-hauled and commercially collected wastes.

Cascadia Consulting Group, Inc. 2 Wisconsin Waste Characterization Study Final Report
1.3. SUMMARY OF RESULTS
Composition and quantity estimates were developed for in-state MSW, both at the statewide level, and separately for residential, ICI, and C&D generators. Results were also calculated for self-hauled and commercially collected wastes. These estimates are touched on below. 1.3.1. STATEWIDE COMPOSITION
As shown in Figure 1-1, C&D, paper, and organic materials accounted for the largest portions of Wisconsin’s disposed waste. When combined, they equaled nearly 70% of the total in-state waste disposed in Wisconsin’s MSW landfills. This is equivalent to about 3.2 million tons per year.
Figure 1-1 – Overview of Composition, Statewide
(Calendar Year 2001)
Other Wastes5.2%
Paper20.8%
Problem Wastes
7.7%
C&D28.7%
Organics18.0%
Glass2.3%
Metal6.3%
Plastics10.5%
Household Hazardous
0.6%

Cascadia Consulting Group, Inc. 3 Wisconsin Waste Characterization Study Final Report
Untreated wood and food were the two largest single materials disposed in Wisconsin’s MSW landfills, both accounting for over 10% by weight. Approximately 13%, or over 600,000 tons per year was untreated wood, while roughly 10%, or nearly 490,000 tons, was food. It should be noted that with the exception of recyclable cardboard, all materials banned from disposal in Wisconsin’s landfills were not top ten components at the statewide level.
Table 1-1 – Top Ten Components, Statewide1
(Calendar Year 2001)
Component Mean Cum. % Tons Cum. TonsWood - untreated 12.8% 12.8% 607,650 607,650Food 10.2% 23.0% 486,619 1,094,269Roofing Shingles 6.0% 29.0% 284,752 1,379,021Compostable Paper 4.8% 33.8% 228,310 1,607,331Mixed Recyclable Paper 4.2% 38.1% 201,715 1,809,046Plastic Film 4.0% 42.0% 188,990 1,998,036Cardboard - recyclable 4.0% 46.0% 188,176 2,186,212R/C Plastic 3.7% 49.7% 174,597 2,360,809Ferrous Metals 3.6% 53.3% 171,086 2,531,895Rock/Concrete/Brick 3.5% 56.8% 165,727 2,697,622
Total 56.8% 2,697,622
1.3.2. DISPOSED QUANTITIES
Residents disposed approximately 32% of Wisconsin’s in-state MSW (roughly 1.5 million tons per year), while ICI generators produced about 44% of the state’s total (approximately 2.1 million tons per year). C&D activities contributed the remaining 1.1 million tons per year, or 24% by weight. Wisconsin’s in-state MSW was predominantly hauled by commercial collectors (including both private and municipal haulers); a total of 4.2 million tons per year or nearly 90% of all disposed wastes were commercially collected. The remaining 11% of all in-state MSW was self-hauled.
Table 1-2 – Annual Tonnage, by Substream and Hauler Type
(Calendar Year 2001)
Substream(Tons/year) (Pct) (Tons/year) (Pct) (Tons/year) (Pct)
Residential 189,755 37% 1,345,924 32% 1,535,680 32%Industrial/Commercial/Institutional 124,398 24% 1,975,800 47% 2,100,198 44%Construction & Demolition 205,077 39% 911,263 22% 1,116,341 23%
Total 519,230 11% 4,232,988 89% 4,752,219 100%
Self-haulCommercially
Collected Total
1 Compostable paper includes items such as paper towels and tissues; mixed recyclable paper includes items such as envelopes, phone books, and junk mail; and R/C Plastic means remainder/composite plastic, and includes items such as molded toys, clothes hangers, and disposable razors.

Cascadia Consulting Group, Inc. 4 Wisconsin Waste Characterization Study Final Report
RESIDENTIAL
Organic (26%, or 400,000 tons per year) and paper (also 26%, or 400,000 tons per year) materials accounted for over half of the residential disposed waste, by weight. More specifically, food, untreated wood, mixed recyclable paper, and compostable paper were the largest individual components (making up just over 30%, or 520,000 tons per year).
INDUSTRIAL, COMMERCIAL, AND INSTITUTIONAL (ICI)
MSW generated by ICI sources was primarily comprised of paper (26%, or 540,000 tons per year) and organic (20%, or 440,000 tons per year) materials. Food and untreated wood were the two single largest components of this waste by weight. Food accounted for about 13%, or 280,000 tons per year, while untreated wood made up roughly 10%, or 490,000 tons per year.
CONSTRUCTION AND DEMOLITION (C&D)
When combined, untreated wood, roofing shingles, rock/concrete/brick, and other C&D materials (such as linoleum and some plumbing fixtures) accounted for nearly 70%, or 780,000 tons per year, of wastes generated by C&D activities.
COMPARISONS
The compositions of residential and ICI waste were strikingly similar. The primary difference was that the amount of organics in residential waste was slightly higher than found in the ICI waste. However, the composition of C&D waste was markedly different from both the residential and ICI wastes. Not surprisingly, over 75% of this waste was made up of construction materials such as roofing shingles, drywall, and rock/concrete/brick.

Cascadia Consulting Group, Inc. 5 Wisconsin Waste Characterization Study Final Report
2. OVERVIEW
2.1. INTRODUCTION
To better understand the types and quantities of waste materials disposed in Wisconsin, the Wisconsin Department of Natural Resources (WDNR) commissioned a waste characterization study in 2002. The objectives of the study were:
1. to estimate the composition of that is waste generated by Wisconsin residents and businesses, and that is also disposed in municipal solid waste (MSW) landfills located within the state2
2. to provide composition estimates specific to each of five regions within the state
3. to provide composition estimates specific to the source of the waste and to the method by which it is transported to disposal facilities
4. to establish a baseline for measuring the effects of future waste reduction and recycling programs, including the new Recycling Pilot Program.
To accomplish these objectives, Cascadia Consulting Group, Inc., with the assistance of R.W. Beck, conducted a study to provide statistically valid data reflecting the composition and quantity of Wisconsin’s statewide disposal, while also developing waste composition profiles for five geographic areas (view map to right), three waste sources, and two types of haulers. The results are based on waste samples taken from August to December 2002. GRG Analysis performed the waste sorting services for this study. This report presents the results of the study, and is organized into three major sections.
1. Study Overview – consists of a general introduction, definitions of sampling groups, and a brief summary of the study’s methodology.
2. Summary of Sampling Results – presents the study findings, including composition and quantity estimates for Wisconsin’s overall waste stream, wastes from three sources (residential, industrial/commercial/institutional, and construction/demolition), and wastes hauled by commercial garbage companies and by self-haulers (including both residential and commercial self-haulers).
3. Appendices – provide study details, such as a list of sort material categories, a complete study methodology, copies of field forms used, and additional composition results by geographic region.
2 All composition estimates for this study were calculated at a 90% confidence level (please see Appendix D for more detail).

Cascadia Consulting Group, Inc. 6 Wisconsin Waste Characterization Study Final Report
2.2. DEFINING THE WASTE STREAM
The solid waste that is the focus of this study includes all MSW that is generated by residents and businesses within the State of Wisconsin and that is also disposed in MSW landfills located within the state. Special industrial wastes, such as foundry sand and paper mill sludge, as well as out-of-state wastes were not included in the study.
To facilitate a more accurate analysis, Wisconsin’s waste stream was divided into substreams according to the source of the waste. There were three distinct substreams identified for this study.
1. Residential – MSW disposed by single-family and two- to four-unit residences.3 This waste is primarily collected in packer trucks (e.g., commercially- or municipally- operated collection vehicles that compact the residential waste as it is collected), but some residential waste is “self-hauled” to disposal facilities by residents.
2. Industrial/commercial/institutional (ICI) – MSW disposed by industrial facilities, and by businesses, institutions, and multi-family dwellings consisting of five or more units. This waste is collected in a variety of vehicles including loose drop boxes, compactor drop boxes and packer trucks. Some of this waste is self-hauled by the businesses that generated it.4
3. Construction/demolition (C&D) – MSW disposed during construction or demolition activities. This waste typically is collected in vehicles such as dump trucks, loose roll-off boxes, and end-dump vehicles. It may be transported either by a municipality, commercial hauler, or by the business or resident that generated the waste.
Within each substream, there are two different hauler types: commercial and self-haul.
1. Commercially collected waste is collected and transported to the disposal facility by municipalities or companies whose primary business is to haul waste.
2. Self-hauled waste is collected and transported to the disposal facility by the individual, business, or government agency that generated the waste.
3 This definition of “residential” is consistent with regulatory language identifying waste generated from the residential sector. 4 Special industrial wastes such as foundry sand and paper mill sludge were not included in this study. Wisconsin MSW landfills track and report these wastes separate from MSW.

Cascadia Consulting Group, Inc. 7 Wisconsin Waste Characterization Study Final Report
Figure 2-1 depicts the sampling groups defined for this study. There are six total groupings, based on three substreams and two hauler types. Data was collected to represent the quantity and composition of waste associated with each sampling group. Those data were combined to develop composition and quantity estimates for all disposed waste within a region and for all disposed waste throughout the state.
Figure 2-1 – Sampling Groups, by Substream and Hauler Type
2.3. SUMMARY OF METHODOLOGY
This section presents a summary of the data collection methods and calculation procedures used in this study. The complete sampling methodology can be found in Appendix C.
2.3.1. SAMPLE ALLOCATION
A total of 400 waste samples were collected and sorted from the three identified waste substreams – 115 samples of residential waste, 170 samples of ICI waste, and 115 samples of C&D waste. To ensure that samples were representative of Wisconsin’s total waste stream, waste was sampled at 14 of the State’s largest landfills, which lie in each of five distinct geographic regions identified by WDNR. The landfills and regions are listed in Table 2-1, below.
Table 2-1 – Sampling Sites and Regions
Facility Name RegionW M W I - TIMBERLINE TRAIL RDF NorthBFI WASTE SYSTEMS OF NORTH AMERICA INC North OUTAGAMIE COUNTY SW DIV LF NortheastW M W I - VALLEY TRAIL RDF NortheastW M W I - RIDGEVIEW RDF NortheastSUPERIOR HICKORY MEADOWS LANDFILL LLC NortheastSUPERIOR GLACIER RIDGE LANDFILL South centralDANE COUNTY LF #2 RODEFELD South centralW M W I - DEER TRACK PARK INC South centralW M W I - METRO RECYCLING & DISPOSAL FACILITY SoutheastSUPERIOR EMERALD PARK LF LLC SoutheastW M W I - ORCHARD RIDGE RECYCLING & DISPOSAL SoutheastSUPERIOR CRANBERRY CREEK West centralSUPERIOR SEVEN MILE CREEK LANDFILL INC-SEC 2 West central
Substream (Residential) (ICI) (C&D)
Residential Self-hauled
ICI
Self-hauled
C&D
Self-hauled
Hau
ler
Typ
e (C
omm
)
(Se
lf)
Residential
Comm-hauled
ICI
Comm-hauled
C&D
Comm-hauled

Cascadia Consulting Group, Inc. 8 Wisconsin Waste Characterization Study Final Report
Samples also were allocated evenly between two seasons – summer and winter. Each landfill was visited once, and samples were collected and sorted over a period of two consecutive days at each landfill.
2.3.2. SAMPLING PLAN
Cascadia contacted each of the 14 selected landfills to determine the mixture of vehicles that arrive from each waste substream and each hauler type on each day of the week. From this information, Cascadia constructed a sampling plan for the random selection of vehicles from a predetermined number of sampling groups at each landfill. Please note that only in-state municipal solid waste (MSW) was included in this study. Waste generated outside of Wisconsin, and special wastes such as foundry sand and paper mill sludge were not included as part of this study.
2.3.3. DATA COLLECTION PROCEDURES
Scalehouse personnel employed a random selection procedure to select targeted vehicle types entering the landfill on each sampling day. Selected vehicles were sent to the sorting crew, and the Field Supervisor verified information about the load and verified that the load was needed to meet each day’s sampling quotas. The waste loads were then tipped, and samples of waste were selected from within each load using a process that ensured random selection of a portion of the tipped pile. Samples consisting of 200 to 300 pounds of waste were sorted into 64 material categories, and each category was weighed. The material weights and other information associated with each sample were recorded on paper field forms.
Data also was collected from each facility to estimate the tonnage associated with each combination of substream and hauler type. Two landfills were unable to provide this information, and vehicle surveys were conducted at those landfills to construct estimates based on the vehicle traffic observed over the course of two survey days at each landfill.
2.3.4. CALCULATION PROCEDURES
The general approach to developing the waste composition estimates included in this report was to calculate the percent composition of each material in the MSW waste stream for each combination of substream and hauler type within each region. Results from those regional estimates were then aggregated using a weighted averaging technique to develop estimates for all waste associated with each substream, each hauler type, and each region, and to develop an estimate for the composition of all waste disposed throughout the state. All composition estimates for this study were calculated at a 90% confidence level (please see Appendix D for more detail).

Cascadia Consulting Group, Inc. 9 Wisconsin Waste Characterization Study Final Report
Tonnage data from participating landfills and from the vehicle surveys mentioned above were used to “weight” composition data among the different substreams and hauler types.5 Annual tonnage data maintained by WDNR were used to “weight” composition data among regions of the state. These tonnage data included in-state MSW disposed at all Wisconsin MSW landfills during 2001, and excluded out-of-state and special industrial wastes, such as foundry sand and paper mill sludge. Appendix D contains a detailed description of these calculations.
3. SUMMARY OF SAMPLING RESULTS A total of 400 waste samples were captured and sorted between August and December 2002 for this study. Table 3-1 summarizes the sample information for each of the study’s six sampling groups. The average sample weight for the 400 samples was about 250 pounds, while the total amount of waste sorted was approximately 50 tons, or 100,700 pounds.
Table 3-1 – Description of Samples, by Sampling Group
(August – December 2002)
Sampling Groups Sample Total Sample Wt. Mean Sample Wt.Count (pounds)
Residential 116 27,347.5 235.8Commercially hauled 86 20,120.2 234.0Self-haul 30 7,227.3 240.9
Industrial/Commercial/Institutional 166 41,620.3 250.7Commercially hauled 151 37,798.3 250.3Self-haul 15 3,822.0 254.8
Construction & Demolition 118 31,728.5 268.9Commercially hauled 59 16,253.6 275.5Self-haul 59 15,474.9 262.3
Total 400 100,696.3 251.7
In the following sections, composition and quantity profiles are presented for Wisconsin’s statewide disposal, as well as the three waste substreams and two hauler types (commercially hauled and self-haul). Each profile is presented in three ways:
1. First, a pie chart depicts the composition by nine broad waste categories: paper, plastics, metal, glass, organics, construction and demolition (C&D), problem wastes, household hazardous, and other;
2. Then, a table lists the ten largest components, by weight; and, 3. Finally, a more comprehensive table details the full composition results for 62 of the
64 distinct sorting categories (sharps and reusables were excluded from these tables as they are reported separately in Section 3.5).6
5 To protect each participating landfill’s privacy, all facility-specific composition and waste quantity information was kept confidential by the consultant team. This information was not published or shared with the Wisconsin DNR. These data were instead aggregated at the statewide, substream, and regional levels. 6 Due to rounding, composition estimates may not add to 100% in tables and graphs throughout this report.

Cascadia Consulting Group, Inc. 10 Wisconsin Waste Characterization Study Final Report
Though all sampling took place during 2002, composition percentages were applied to calendar year 2001 tonnages (as 2002 tonnages were unavailable). Therefore, tables and figures throughout this report are labeled as calendar year 2001 instead of 2002. Also, composition estimates presented in this report were calculated at a 90% confidence level, meaning that we are 90% confident each material is between the low and high percentages shown in the comprehensive tables for each profile. For example, we are 90% confident that food waste made up between 9.0% and 11.4% of the overall municipal solid waste stream, by weight.
3.1. OVERALL COMPOSITION
Figure 3-1 shows the percentage, by weight, of each of the nine broad material categories for Wisconsin’s statewide disposal. As depicted, construction and demolition (C&D), paper, and organic materials made up the largest portion of the state’s overall waste stream.7 When combined, these three materials accounted for almost 70% of the total, by weight.
Figure 3-1 – Overview of Composition, Statewide
(Calendar Year 2001)
Other Wastes5.2%
Paper20.8%
Problem Wastes
7.7%
C&D28.7%
Organics18.0%
Glass2.3%
Metal6.3%
Plastics10.5%
Household Hazardous
0.6%
7 Organics include items such as yard and food wastes, but does not include paper materials, which are categorized separately in the paper broad material category (see Appendix A for more details on material categories).

Cascadia Consulting Group, Inc. 11 Wisconsin Waste Characterization Study Final Report
Table 3-2 lists the top ten waste components found in Wisconsin’s overall waste stream. When totaled, they equal over 50% of the total, by weight. Untreated wood and food each made up over 10% (12.8% and 10.2%, respectively), and roofing shingles, about 6%, was the third largest component. R/C plastic, or remainder/composite plastic, is among the top ten components, and consists of items, such as molded toys and plastic hoses, that do not fit into other plastic categories.
Table 3-2 – Top Ten Components, Statewide
(Calendar Year 2001)
Component Mean Cum. % Tons Cum. TonsWood - untreated 12.8% 12.8% 607,650 607,650Food 10.2% 23.0% 486,619 1,094,269Roofing Shingles 6.0% 29.0% 284,752 1,379,021Compostable Paper 4.8% 33.8% 228,310 1,607,331Mixed Recyclable Paper 4.2% 38.1% 201,715 1,809,046Plastic Film 4.0% 42.0% 188,990 1,998,036Cardboard - recyclable 4.0% 46.0% 188,176 2,186,212R/C Plastic 3.7% 49.7% 174,597 2,360,809Ferrous Metals 3.6% 53.3% 171,086 2,531,895Rock/Concrete/Brick 3.5% 56.8% 165,727 2,697,622
Total 56.8% 2,697,622

Cascadia Consulting Group, Inc. 12 Wisconsin Waste Characterization Study Final Report
Please see Table 3-3 below for a detailed profile of Wisconsin’s overall waste stream, including mean percents and annual tonnage estimates for the 62 of the 64 waste categories defined for this study (sharps and reusables were excluded from these tables as they are reported separately in Section 3.5). For each material listed in this table, there are three percentages shown: mean, low, and high. The mean (highlighted in grey) is the best estimate of the material’s relative percent by weight, while the low and high reflect the confidence interval around the mean and were calculated at a 90% confidence level.
Table 3-3 – Detailed Composition Profile, Statewide
(Calendar Year 2001)
Calculated at a 90% confidence level
Conf. Interval Conf. IntervalTons Mean Low High Tons Mean Low High
Paper 987,646 20.8% C&D 1,364,053 28.7%Newsprint 92,270 1.9% 1.7% 2.2% Wood - treated 44,459 0.9% 0.4% 1.4%High Grade Paper 65,585 1.4% 1.1% 1.7% Wood - untreated 607,650 12.8% 10.7% 14.9%Magazines/Catalogs 47,381 1.0% 0.8% 1.1% Rock/Concrete/Brick 165,727 3.5% 2.2% 4.8%Cardboard - recyclable 188,176 4.0% 3.0% 4.9% Drywall 80,164 1.7% 1.1% 2.2%Cardboard - coated 11,123 0.2% 0.1% 0.4% Roofing Shingles 284,752 6.0% 4.0% 8.0%Boxboard 34,835 0.7% 0.7% 0.8% PVC 2,261 0.0% 0.0% 0.1%Mixed Recyclable Paper 201,715 4.2% 3.9% 4.6% Ceramics/Porcelain 15,640 0.3% 0.2% 0.5%Compostable Paper 228,310 4.8% 4.3% 5.3% Other C&D 163,399 3.4% 2.1% 4.7%R/C Paper 118,250 2.5% 1.8% 3.2% Problem Wastes 367,230 7.7%
Plastics 499,313 10.5% Televisions 23,915 0.5% 0.2% 0.8%PET Bottles 19,610 0.4% 0.4% 0.5% Computer Monitors 10,052 0.2% 0.0% 0.4%HDPE Bottles - natural 8,382 0.2% 0.1% 0.2% Computer Equipment 2,779 0.1% 0.0% 0.1%HDPE Bottles - colored 10,373 0.2% 0.2% 0.3% Electronic Equipment 64,472 1.4% 1.0% 1.7%#3-#7 Other Plastic Bottles 809 0.0% 0.0% 0.0% White Goods - refrigerated 13,816 0.3% 0.0% 0.5%Polystyrene 22,435 0.5% 0.4% 0.5% White Goods - non-refrigerated 12,132 0.3% 0.0% 0.5%Other Rigid Plastic Containers 74,119 1.6% 1.1% 2.0% Lead-Acid Batteries 6,985 0.1% 0.0% 0.3%Plastic Film 188,990 4.0% 3.6% 4.4% Other Household Batteries 2,832 0.1% 0.0% 0.1%R/C Plastic 174,597 3.7% 2.9% 4.4% Tires 27,701 0.6% 0.2% 1.0%
Metal 299,245 6.3% Bulky Items 124,612 2.6% 1.8% 3.4%Aluminum Cans 16,291 0.3% 0.3% 0.4% Fluorescent Lights 242 0.0% 0.0% 0.0%Other Aluminum 15,025 0.3% 0.2% 0.4% Ballasts 767 0.0% 0.0% 0.0%Tin Cans 25,715 0.5% 0.4% 0.6% Pallets 76,926 1.6% 1.0% 2.3%Ferrous Metals 171,086 3.6% 2.6% 4.6% Household Hazardous 26,155 0.6%Non-Ferrous Metals 5,965 0.1% 0.1% 0.2% Latex Paint 6,988 0.1% 0.0% 0.3%R/C Metal 65,163 1.4% 0.9% 1.8% Oil Paint 1,095 0.0% 0.0% 0.0%
Glass 107,862 2.3% Pesticides/Fertilizers 0 0.0% 0.0% 0.0%Glass - recyclable 42,721 0.9% 0.8% 1.0% Auto Used Oil Filters 1,874 0.0% 0.0% 0.1%R/C Glass 65,141 1.4% 0.6% 2.2% Mercury 6 0.0% 0.0% 0.0%
Organics 853,914 18.0% Other Hazardous 16,191 0.3% 0.0% 0.7%Yard Waste - <6" 56,562 1.2% 0.8% 1.6% Other Wastes 246,800 5.2%Yard Waste - >6" 5,359 0.1% 0.0% 0.2% Textiles 115,867 2.4% 1.9% 3.0%Food 486,619 10.2% 9.0% 11.4% Carpet 116,160 2.4% 1.4% 3.5%Diapers 85,006 1.8% 1.5% 2.1% Carpet Padding 14,773 0.3% 0.2% 0.5%Animal Waste/Kitty Litter 45,260 1.0% 0.7% 1.2%Bottom Fines/Dirt 79,296 1.7% 1.4% 1.9%R/C Organic 95,812 2.0% 1.5% 2.5%
Total Tons 4,752,218Sample Count 400

Cascadia Consulting Group, Inc. 13 Wisconsin Waste Characterization Study Final Report
3.2. COMPOSITION BY SUBSTREAM
Approximately 32% of Wisconsin’s in-state MSW was disposed by residents (roughly 1.5 million tons per year), while ICI generators produced about 44% of the state’s total (approximately 2.1 million tons per year). C&D activities contributed the remaining 1.1 million tons per year, or 24% by weight. Wisconsin’s in-state MSW was predominantly hauled by commercial collectors, with a total of 4.2 million tons per year or nearly 90% of all disposal being commercially collected. The remaining 11% of all in-state MSW was self-hauled.
Table 3-4 – Annual Tonnage, by Substream and Hauler Type
(Calendar Year 2001)
Substream(Tons/year) (Pct) (Tons/year) (Pct) (Tons/year) (Pct)
Residential 189,755 37% 1,345,924 32% 1,535,680 32%Industrial/Commercial/Institutional 124,398 24% 1,975,800 47% 2,100,198 44%Construction & Demolition 205,077 39% 911,263 22% 1,116,341 23%
Total 519,230 11% 4,232,988 89% 4,752,219 100%
Self-haulCommercially
Collected Total
Please see sections 3.2.1, 3.2.2, and 3.2.3 below for composition and quantity profiles for the residential, industrial/commercial/institutional (ICI), and construction and demolition (C&D) substreams. 3.2.1. RESIDENTIAL
Of the 400 samples sorted during this study, 116 were from the residential substream. Organic and paper materials accounted for the largest portion of Wisconsin’s residential waste, each about 26%, by weight. C&D and plastic materials also made up large portions of the total (12.3% and 10.9%, respectively).
Figure 3-2 – Overview of Composition, Residential
(Calendar Year 2001)
Other Wastes7.1%
Paper26.1%
Problem Wastes
8.8%
C&D12.3%
Organics26.3%
Glass2.5%
Metal5.8%
Plastics10.9%
Household Hazardous
0.2%

Cascadia Consulting Group, Inc. 14 Wisconsin Waste Characterization Study Final Report
As shown in Table 3-5, a total of four individual waste components each accounted for 5% or more of the state’s residential waste. These components are food (13.4%), untreated wood (7.5%), mixed recyclable paper (6.7%), and compostable paper (6.2%). R/C plastic, or remainder/composite plastic, is among the top ten components and consists of items such as molded toys and plastic hoses, which do not fit into other plastic categories.
Table 3-5 – Top Ten Components, Residential
(Calendar Year 2001)
Component Mean Cum. % Tons Cum. TonsFood 13.4% 13.4% 206,363 206,363Wood - untreated 7.5% 21.0% 115,732 322,095Mixed Recyclable Paper 6.7% 27.7% 103,462 425,557Compostable Paper 6.2% 33.9% 95,567 521,124Plastic Film 4.4% 38.4% 67,876 589,001Bulky Items 3.9% 42.2% 59,157 648,158Newsprint 3.8% 46.0% 58,027 706,185Diapers 3.7% 49.6% 56,054 762,239Textiles 3.6% 53.2% 54,826 817,066R/C Plastic 3.3% 56.5% 50,388 867,454
Total 56.5% 867,454

Cascadia Consulting Group, Inc. 15 Wisconsin Waste Characterization Study Final Report
For a complete breakdown of Wisconsin’s residential substream, please see Table 3-6. In this table, composition and quantity information is listed for each individual waste component.
Table 3-6 – Detailed Composition Profile, Residential
(Calendar Year 2001)
Calculated at a 90% confidence level
Conf. Interval Conf. IntervalTons Mean Low High Tons Mean Low High
Paper 400,448 26.1% C&D 189,201 12.3%Newsprint 58,027 3.8% 3.2% 4.3% Wood - treated 3,988 0.3% 0.0% 0.5%High Grade Paper 25,327 1.6% 1.3% 2.0% Wood - untreated 115,732 7.5% 5.4% 9.6%Magazines/Catalogs 29,144 1.9% 1.6% 2.2% Rock/Concrete/Brick 8,870 0.6% 0.2% 0.9%Cardboard - recyclable 37,352 2.4% 1.5% 3.3% Drywall 14,316 0.9% 0.0% 1.8%Cardboard - coated 1,188 0.1% 0.0% 0.2% Roofing Shingles 32,078 2.1% 0.0% 4.9%Boxboard 21,136 1.4% 1.2% 1.5% PVC 625 0.0% 0.0% 0.1%Mixed Recyclable Paper 103,462 6.7% 6.0% 7.5% Ceramics/Porcelain 4,940 0.3% 0.1% 0.6%Compostable Paper 95,567 6.2% 5.6% 6.8% Other C&D 8,653 0.6% 0.3% 0.8%R/C Paper 29,244 1.9% 1.2% 2.6% Problem Wastes 134,825 8.8%
Plastics 167,989 10.9% Televisions 11,179 0.7% 0.2% 1.2%PET Bottles 8,818 0.6% 0.5% 0.7% Computer Monitors 0 0.0% 0.0% 0.0%HDPE Bottles - natural 3,896 0.3% 0.2% 0.3% Computer Equipment 1,206 0.1% 0.0% 0.2%HDPE Bottles - colored 5,808 0.4% 0.3% 0.5% Electronic Equipment 41,183 2.7% 1.9% 3.5%#3-#7 Other Plastic Bottles 461 0.0% 0.0% 0.0% White Goods - refrigerated 0 0.0% 0.0% 0.0%Polystyrene 7,479 0.5% 0.4% 0.6% White Goods - non-refrigerated 9,656 0.6% 0.0% 1.4%Other Rigid Plastic Containers 23,263 1.5% 1.3% 1.7% Lead-Acid Batteries 0 0.0% 0.0% 0.0%Plastic Film 67,876 4.4% 3.9% 4.9% Other Household Batteries 2,268 0.1% 0.1% 0.2%R/C Plastic 50,388 3.3% 2.5% 4.0% Tires 9,190 0.6% 0.0% 1.5%
Metal 89,161 5.8% Bulky Items 59,157 3.9% 2.4% 5.4%Aluminum Cans 7,949 0.5% 0.4% 0.7% Fluorescent Lights 218 0.0% 0.0% 0.0%Other Aluminum 8,360 0.5% 0.3% 0.8% Ballasts 767 0.0% 0.0% 0.1%Tin Cans 13,453 0.9% 0.7% 1.0% Pallets 0 0.0% 0.0% 0.0%Ferrous Metals 37,584 2.4% 1.7% 3.2% Household Hazardous 3,286 0.2%Non-Ferrous Metals 1,589 0.1% 0.1% 0.1% Latex Paint 293 0.0% 0.0% 0.0%R/C Metal 20,227 1.3% 0.8% 1.8% Oil Paint 49 0.0% 0.0% 0.0%
Glass 39,148 2.5% Pesticides/Fertilizers 0 0.0% 0.0% 0.0%Glass - recyclable 22,951 1.5% 1.2% 1.8% Auto Used Oil Filters 1,196 0.1% 0.0% 0.1%R/C Glass 16,196 1.1% 0.4% 1.7% Mercury 6 0.0% 0.0% 0.0%
Organics 403,320 26.3% Other Hazardous 1,742 0.1% 0.1% 0.2%Yard Waste - <6" 28,576 1.9% 1.3% 2.4% Other Wastes 108,301 7.1%Yard Waste - >6" 1,249 0.1% 0.0% 0.2% Textiles 54,826 3.6% 3.0% 4.1%Food 206,363 13.4% 12.0% 14.9% Carpet 45,942 3.0% 1.9% 4.1%Diapers 56,054 3.7% 2.9% 4.4% Carpet Padding 7,533 0.5% 0.2% 0.8%Animal Waste/Kitty Litter 32,616 2.1% 1.6% 2.7%Bottom Fines/Dirt 43,024 2.8% 2.2% 3.4%R/C Organic 35,437 2.3% 1.8% 2.8%
Total Tons 1,535,679Sample Count 116

Cascadia Consulting Group, Inc. 16 Wisconsin Waste Characterization Study Final Report
Component Mean Cum. % Tons Cum. TonsFood 13.2% 13.2% 277,650 277,650Wood - untreated 10.1% 23.4% 213,143 490,793Compostable Paper 6.3% 29.6% 131,327 622,120Cardboard - recyclable 5.7% 35.3% 119,358 741,478Plastic Film 5.5% 40.8% 115,426 856,904R/C Plastic 5.3% 46.1% 112,161 969,066Mixed Recyclable Paper 4.4% 50.5% 92,036 1,061,102Ferrous Metals 4.3% 54.8% 90,240 1,151,342R/C Paper 4.1% 58.9% 86,024 1,237,365Carpet 2.9% 61.8% 60,772 1,298,138
Total 61.8% 1,298,138
3.2.2. INDUSTRIAL/COMMERCIAL/INSTITUTIONAL
A total of 166 samples were captured and sorted from Wisconsin’s ICI substream. ICI composition estimates for the nine broad material categories are pictured in Figure 3-3. According to the figure, paper, organics, and C&D represent the largest portions of this waste at 25.8%, 20.9%, and 15.5%, respectively. Plastics made up a sizable portion also (14.6%, by weight).
Figure 3-3 – Overview of Composition, ICI
(Calendar Year 2001)
Other Wastes5.3%
Paper25.8%
Problem Wastes8.0%
C&D15.5%
Organics20.9%
Glass2.4%
Metal6.8%
Plastics14.6%
Household Hazardous
0.7%
The top ten waste components of the ICI substream accounted for over 60%, or nearly 1.3 million tons, of the total (see Table 3-7). Food and untreated wood were the two largest components of this substream (13.2% and 10.1%, respectively). Compostable paper, recyclable cardboard, plastic film, and R/C plastic were the next largest components, each accounting for over 5% of the total, by weight. R/C plastic, or remainder/composite plastic, consists of items such as molded toys and plastic hoses, which do not fit into other plastic categories.
Table 3-7 – Top Ten Components, ICI
(Calendar Year 2001)
Cascadia Consulting Group, Inc. 17 Wisconsin Waste Characterization Study Final Report
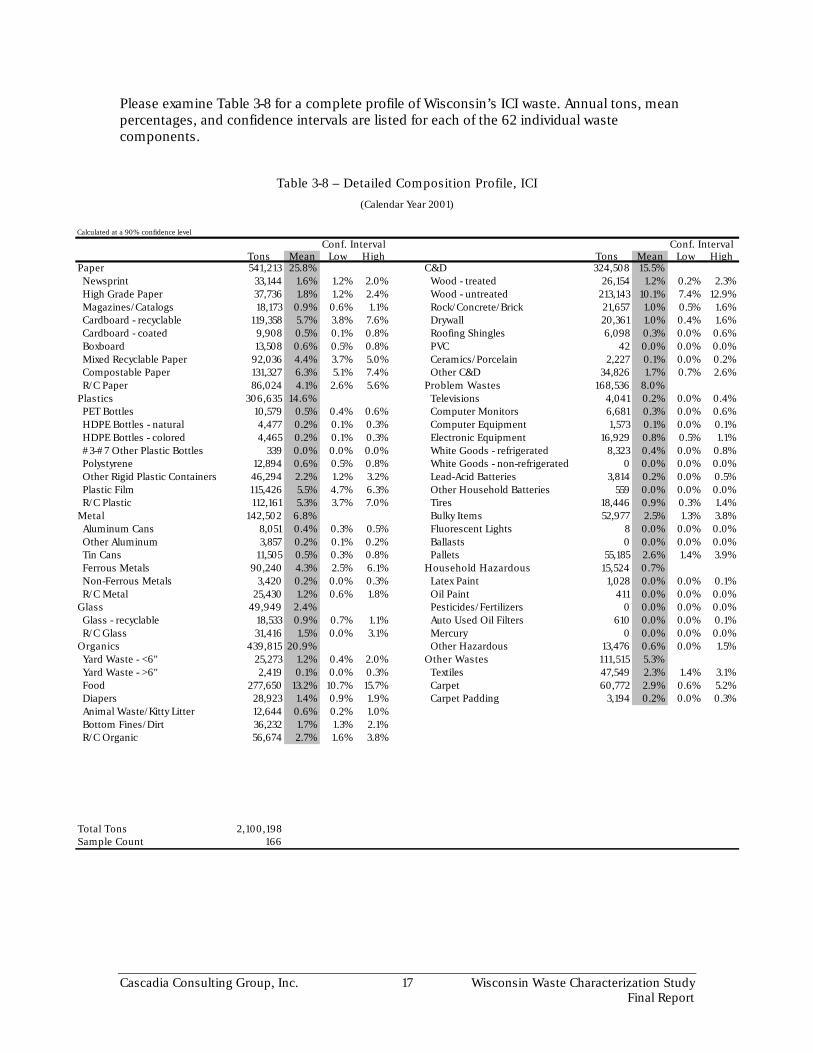
Please examine Table 3-8 for a complete profile of Wisconsin’s ICI waste. Annual tons, mean percentages, and confidence intervals are listed for each of the 62 individual waste components.
Table 3-8 – Detailed Composition Profile, ICI
(Calendar Year 2001)
Calculated at a 90% confidence level
Conf. Interval Conf. IntervalTons Mean Low High Tons Mean Low High
Paper 541,213 25.8% C&D 324,508 15.5%Newsprint 33,144 1.6% 1.2% 2.0% Wood - treated 26,154 1.2% 0.2% 2.3%High Grade Paper 37,736 1.8% 1.2% 2.4% Wood - untreated 213,143 10.1% 7.4% 12.9%Magazines/Catalogs 18,173 0.9% 0.6% 1.1% Rock/Concrete/Brick 21,657 1.0% 0.5% 1.6%Cardboard - recyclable 119,358 5.7% 3.8% 7.6% Drywall 20,361 1.0% 0.4% 1.6%Cardboard - coated 9,908 0.5% 0.1% 0.8% Roofing Shingles 6,098 0.3% 0.0% 0.6%Boxboard 13,508 0.6% 0.5% 0.8% PVC 42 0.0% 0.0% 0.0%Mixed Recyclable Paper 92,036 4.4% 3.7% 5.0% Ceramics/Porcelain 2,227 0.1% 0.0% 0.2%Compostable Paper 131,327 6.3% 5.1% 7.4% Other C&D 34,826 1.7% 0.7% 2.6%R/C Paper 86,024 4.1% 2.6% 5.6% Problem Wastes 168,536 8.0%
Plastics 306,635 14.6% Televisions 4,041 0.2% 0.0% 0.4%PET Bottles 10,579 0.5% 0.4% 0.6% Computer Monitors 6,681 0.3% 0.0% 0.6%HDPE Bottles - natural 4,477 0.2% 0.1% 0.3% Computer Equipment 1,573 0.1% 0.0% 0.1%HDPE Bottles - colored 4,465 0.2% 0.1% 0.3% Electronic Equipment 16,929 0.8% 0.5% 1.1%#3-#7 Other Plastic Bottles 339 0.0% 0.0% 0.0% White Goods - refrigerated 8,323 0.4% 0.0% 0.8%Polystyrene 12,894 0.6% 0.5% 0.8% White Goods - non-refrigerated 0 0.0% 0.0% 0.0%Other Rigid Plastic Containers 46,294 2.2% 1.2% 3.2% Lead-Acid Batteries 3,814 0.2% 0.0% 0.5%Plastic Film 115,426 5.5% 4.7% 6.3% Other Household Batteries 559 0.0% 0.0% 0.0%R/C Plastic 112,161 5.3% 3.7% 7.0% Tires 18,446 0.9% 0.3% 1.4%
Metal 142,502 6.8% Bulky Items 52,977 2.5% 1.3% 3.8%Aluminum Cans 8,051 0.4% 0.3% 0.5% Fluorescent Lights 8 0.0% 0.0% 0.0%Other Aluminum 3,857 0.2% 0.1% 0.2% Ballasts 0 0.0% 0.0% 0.0%Tin Cans 11,505 0.5% 0.3% 0.8% Pallets 55,185 2.6% 1.4% 3.9%Ferrous Metals 90,240 4.3% 2.5% 6.1% Household Hazardous 15,524 0.7%Non-Ferrous Metals 3,420 0.2% 0.0% 0.3% Latex Paint 1,028 0.0% 0.0% 0.1%R/C Metal 25,430 1.2% 0.6% 1.8% Oil Paint 411 0.0% 0.0% 0.0%
Glass 49,949 2.4% Pesticides/Fertilizers 0 0.0% 0.0% 0.0%Glass - recyclable 18,533 0.9% 0.7% 1.1% Auto Used Oil Filters 610 0.0% 0.0% 0.1%R/C Glass 31,416 1.5% 0.0% 3.1% Mercury 0 0.0% 0.0% 0.0%
Organics 439,815 20.9% Other Hazardous 13,476 0.6% 0.0% 1.5%Yard Waste - <6" 25,273 1.2% 0.4% 2.0% Other Wastes 111,515 5.3%Yard Waste - >6" 2,419 0.1% 0.0% 0.3% Textiles 47,549 2.3% 1.4% 3.1%Food 277,650 13.2% 10.7% 15.7% Carpet 60,772 2.9% 0.6% 5.2%Diapers 28,923 1.4% 0.9% 1.9% Carpet Padding 3,194 0.2% 0.0% 0.3%Animal Waste/Kitty Litter 12,644 0.6% 0.2% 1.0%Bottom Fines/Dirt 36,232 1.7% 1.3% 2.1%R/C Organic 56,674 2.7% 1.6% 3.8%
Total Tons 2,100,198Sample Count 166
Cascadia Consulting Group, Inc. 18 Wisconsin Waste Characterization Study Final Report
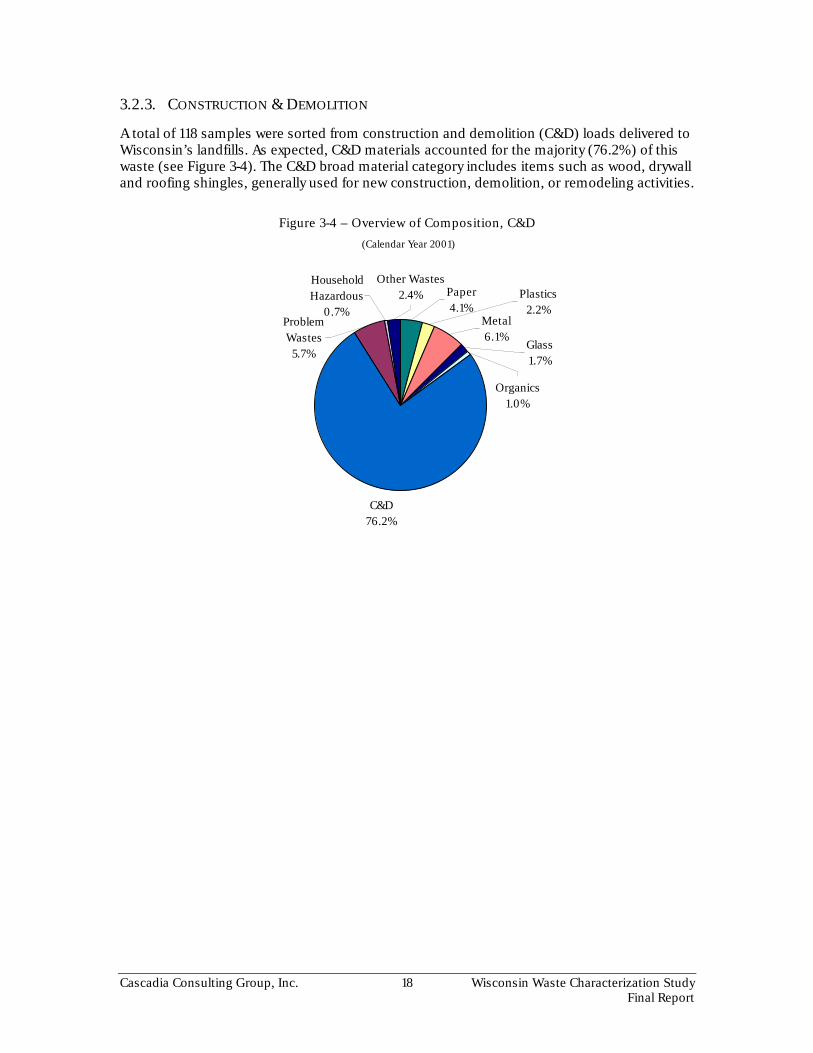
3.2.3. CONSTRUCTION & DEMOLITION
A total of 118 samples were sorted from construction and demolition (C&D) loads delivered to Wisconsin’s landfills. As expected, C&D materials accounted for the majority (76.2%) of this waste (see Figure 3-4). The C&D broad material category includes items such as wood, drywall and roofing shingles, generally used for new construction, demolition, or remodeling activities.
Figure 3-4 – Overview of Composition, C&D
(Calendar Year 2001)
Household Hazardous
0.7%
Plastics2.2%
Metal6.1%
Glass1.7%
Organics1.0%
C&D76.2%
Problem Wastes5.7%
Paper4.1%
Other Wastes2.4%

Cascadia Consulting Group, Inc. 19 Wisconsin Waste Characterization Study Final Report
Table 3-9 lists the top ten components of Wisconsin’s C&D substream. As shown, untreated wood and roofing shingles comprised the largest portion of the total at nearly 50%, when combined. Also, rock/concrete/brick and other C&D made up more than 10% each. Other C&D consists of items such as linoleum and bathroom fixtures, which do not fit into other C&D categories. R/C metal, or remainder/composite metal, consists of items such as insulated wire, which do not fit into other metal categories. R/C glass, or remainder/composite glass, consists of items such as mirrors and Pyrex, which do not fit into other glass categories.
Table 3-9 – Top Ten Components, C&D
(Calendar Year 2001)
Component Mean Cum. % Tons Cum. TonsWood - untreated 25.0% 25.0% 278,776 278,776Roofing Shingles 22.1% 47.1% 246,575 525,351Rock/Concrete/Brick 12.1% 59.2% 135,200 660,551Other C&D 10.7% 69.9% 119,920 780,471Drywall 4.1% 74.0% 45,487 825,959Ferrous Metals 3.9% 77.9% 43,262 869,221Cardboard - recyclable 2.8% 80.7% 31,466 900,687Pallets 1.9% 82.6% 21,741 922,428R/C Metal 1.7% 84.4% 19,506 941,934R/C Glass 1.6% 85.9% 17,528 959,461
Total 85.9% 959,461

Cascadia Consulting Group, Inc. 20 Wisconsin Waste Characterization Study Final Report
Table 3-10 lists the full composition and quantity results for the C&D substream.
Table 3-10 – Detailed Composition Profile, C&D
(Calendar Year 2001)
Calculated at a 90% confidence level
Conf. Interval Conf. IntervalTons Mean Low High Tons Mean Low High
Paper 45,985 4.1% C&D 850,344 76.2%Newsprint 1,099 0.1% 0.0% 0.2% Wood - treated 14,317 1.3% 0.5% 2.0%High Grade Paper 2,523 0.2% 0.0% 0.5% Wood - untreated 278,776 25.0% 18.4% 31.5%Magazines/Catalogs 63 0.0% 0.0% 0.0% Rock/Concrete/Brick 135,200 12.1% 6.6% 17.6%Cardboard - recyclable 31,466 2.8% 1.7% 3.9% Drywall 45,487 4.1% 2.4% 5.8%Cardboard - coated 28 0.0% 0.0% 0.0% Roofing Shingles 246,575 22.1% 14.5% 29.7%Boxboard 192 0.0% 0.0% 0.0% PVC 1,595 0.1% 0.0% 0.3%Mixed Recyclable Paper 6,217 0.6% 0.2% 0.9% Ceramics/Porcelain 8,473 0.8% 0.2% 1.3%Compostable Paper 1,416 0.1% 0.0% 0.3% Other C&D 119,920 10.7% 5.6% 15.9%R/C Paper 2,982 0.3% 0.1% 0.4% Problem Wastes 63,869 5.7%
Plastics 24,689 2.2% Televisions 8,695 0.8% 0.0% 1.7%PET Bottles 213 0.0% 0.0% 0.0% Computer Monitors 3,372 0.3% 0.0% 0.8%HDPE Bottles - natural 9 0.0% 0.0% 0.0% Computer Equipment 0 0.0% 0.0% 0.0%HDPE Bottles - colored 100 0.0% 0.0% 0.0% Electronic Equipment 6,360 0.6% 0.0% 1.2%#3-#7 Other Plastic Bottles 9 0.0% 0.0% 0.0% White Goods - refrigerated 5,493 0.5% 0.0% 1.2%Polystyrene 2,062 0.2% 0.0% 0.3% White Goods - non-refrigerated 2,476 0.2% 0.0% 0.6%Other Rigid Plastic Containers 4,562 0.4% 0.1% 0.7% Lead-Acid Batteries 3,171 0.3% 0.0% 0.8%Plastic Film 5,687 0.5% 0.2% 0.8% Other Household Batteries 5 0.0% 0.0% 0.0%R/C Plastic 12,047 1.1% 0.5% 1.7% Tires 65 0.0% 0.0% 0.0%
Metal 67,581 6.1% Bulky Items 12,478 1.1% 0.1% 2.1%Aluminum Cans 292 0.0% 0.0% 0.0% Fluorescent Lights 15 0.0% 0.0% 0.0%Other Aluminum 2,808 0.3% 0.0% 0.6% Ballasts 0 0.0% 0.0% 0.0%Tin Cans 758 0.1% 0.0% 0.1% Pallets 21,741 1.9% 0.7% 3.2%Ferrous Metals 43,262 3.9% 1.7% 6.1% Household Hazardous 7,345 0.7%Non-Ferrous Metals 956 0.1% 0.0% 0.2% Latex Paint 5,667 0.5% 0.0% 1.1%R/C Metal 19,506 1.7% 0.4% 3.1% Oil Paint 635 0.1% 0.0% 0.2%
Glass 18,765 1.7% Pesticides/Fertilizers 0 0.0% 0.0% 0.0%Glass - recyclable 1,237 0.1% 0.0% 0.2% Auto Used Oil Filters 69 0.0% 0.0% 0.0%Miscellaneous Glass 17,528 1.6% 0.4% 2.8% Mercury 0 0.0% 0.0% 0.0%
Organics 10,779 1.0% Other Hazardous 974 0.1% 0.0% 0.2%Yard Waste - <6" 2,713 0.2% 0.0% 0.5% Other Wastes 26,983 2.4%Yard Waste - >6" 1,691 0.2% 0.0% 0.4% Textiles 13,491 1.2% 0.0% 2.6%Food 2,606 0.2% 0.0% 0.4% Carpet 9,446 0.8% 0.2% 1.5%Diapers 29 0.0% 0.0% 0.0% Carpet Padding 4,047 0.4% 0.0% 0.7%Animal Waste/Kitty Litter 0 0.0% 0.0% 0.0%Bottom Fines/Dirt 40 0.0% 0.0% 0.0%R/C Organic 3,701 0.3% 0.1% 0.6%
Total Tons 1,116,341Sample Count 118

Cascadia Consulting Group, Inc. 21 Wisconsin Waste Characterization Study Final Report
3.3. COMPOSITION BY HAULER TYPE
Sections 3.3.1 and 3.3.2 present composition and quantity profiles for Wisconsin’s self-haul and commercially hauled wastes. 3.3.1. SELF-HAUL
During this study, a total of 104 samples were taken from self-haul loads. As depicted in Figure 3-5, about one-half of this waste was characterized under the C&D broad material category. An additional 15% was comprised of problem wastes. Problem wastes consists of items such as white goods, tires, and pallets.
Figure 3-5 – Overview of Composition, Self-haul
(Calendar Year 2001)
Other Wastes4.6%
Paper8.5%
Problem Wastes14.9%
C&D50.6%
Organics5.4%
Glass3.2%
Metal7.6%
Plastics4.8%
Household Hazardous
0.4%

Cascadia Consulting Group, Inc. 22 Wisconsin Waste Characterization Study Final Report
Table 3-11 shows the average percent and corresponding tons for each of the top ten components in Wisconsin’s self-haul waste. Together, these 10 materials made up almost 70% of all self-haul wastes. Untreated wood stood out as the largest single component, accounting for about 18% of the total, by weight. Roofing shingles, bulky items, drywall, other C&D, and ferrous metals each made up over 5% of the total, by weight. Other C&D consists of items such as linoleum and bathroom fixtures, which do not fit into other C&D categories. Please view Table 3-12 for the a detailed profile of Wisconsin’s self-haul wastes, including composition and quantity estimates for each of the 62 waste categories defined for the study.
Table 3-11 – Top Ten Components, Self-haul
(Calendar Year 2001)
Component Mean Cum. % Tons Cum. TonsWood - untreated 18.1% 18.1% 93,928 93,928Roofing Shingles 11.5% 29.6% 59,554 153,482Bulky Items 8.1% 37.7% 42,073 195,555Drywall 8.0% 45.6% 41,395 236,950Other C&D 5.2% 50.8% 27,016 263,966Ferrous Metals 5.0% 55.9% 26,068 290,034Rock/Concrete/Brick 4.3% 60.2% 22,395 312,429Cardboard - recyclable 3.1% 63.2% 15,891 328,320Electronic Equipment 3.0% 66.2% 15,552 343,872Carpet 2.6% 68.8% 13,421 357,293
Total 68.8% 357,293

Cascadia Consulting Group, Inc. 23 Wisconsin Waste Characterization Study Final Report
Table 3-12 – Detailed Composition Profile, Self-haul
(Calendar Year 2001)
Calculated at a 90% confidence level
Conf. Interval Conf. IntervalTons Mean Low High Tons Mean Low High
Paper 44,219 8.5% C&D 262,596 50.6%Newsprint 5,789 1.1% 0.5% 1.7% Wood - treated 12,996 2.5% 0.8% 4.2%High Grade Paper 2,391 0.5% 0.2% 0.8% Wood - untreated 93,928 18.1% 13.6% 22.6%Magazines/Catalogs 1,665 0.3% 0.1% 0.5% Rock/Concrete/Brick 22,395 4.3% 2.1% 6.6%Cardboard - recyclable 15,891 3.1% 1.7% 4.5% Drywall 41,395 8.0% 4.2% 11.8%Cardboard - coated 2,148 0.4% 0.0% 1.1% Roofing Shingles 59,554 11.5% 7.5% 15.4%Boxboard 1,145 0.2% 0.1% 0.3% PVC 1,181 0.2% 0.0% 0.5%Mixed Recyclable Paper 7,489 1.4% 0.9% 2.0% Ceramics/Porcelain 4,130 0.8% 0.0% 1.6%Compostable Paper 4,258 0.8% 0.2% 1.5% Other C&D 27,016 5.2% 2.7% 7.7%R/C Paper 3,443 0.7% 0.2% 1.2% Problem Wastes 77,437 14.9%
Plastics 24,983 4.8% Televisions 6,944 1.3% 0.2% 2.5%PET Bottles 798 0.2% 0.1% 0.2% Computer Monitors 336 0.1% 0.0% 0.2%HDPE Bottles - natural 376 0.1% 0.0% 0.1% Computer Equipment 0 0.0% 0.0% 0.0%HDPE Bottles - colored 534 0.1% 0.1% 0.1% Electronic Equipment 15,552 3.0% 1.4% 4.5%#3-#7 Other Plastic Bottles 41 0.0% 0.0% 0.0% White Goods - refrigerated 0 0.0% 0.0% 0.0%Polystyrene 777 0.1% 0.1% 0.2% White Goods - non-refrigerated 9,656 1.9% 0.0% 4.2%Other Rigid Plastic Containers 2,935 0.6% 0.3% 0.8% Lead-Acid Batteries 0 0.0% 0.0% 0.0%Plastic Film 8,796 1.7% 0.9% 2.5% Other Household Batteries 74 0.0% 0.0% 0.0%R/C Plastic 10,727 2.1% 0.9% 3.2% Tires 83 0.0% 0.0% 0.0%
Metal 39,572 7.6% Bulky Items 42,073 8.1% 4.0% 12.2%Aluminum Cans 2,410 0.5% 0.1% 0.9% Fluorescent Lights 1 0.0% 0.0% 0.0%Other Aluminum 1,521 0.3% 0.1% 0.5% Ballasts 0 0.0% 0.0% 0.0%Tin Cans 1,071 0.2% 0.1% 0.3% Pallets 2,718 0.5% 0.0% 1.1%Ferrous Metals 26,068 5.0% 3.4% 6.6% Household Hazardous 1,934 0.4%Non-Ferrous Metals 776 0.1% 0.0% 0.3% Latex Paint 1,291 0.2% 0.0% 0.5%R/C Metal 7,727 1.5% 0.9% 2.1% Oil Paint 38 0.0% 0.0% 0.0%
Glass 16,700 3.2% Pesticides/Fertilizers 0 0.0% 0.0% 0.0%Glass - recyclable 5,071 1.0% 0.4% 1.5% Auto Used Oil Filters 264 0.1% 0.0% 0.1%R/C Glass 11,629 2.2% 0.9% 3.6% Mercury 6 0.0% 0.0% 0.0%
Organics 28,066 5.4% Other Hazardous 334 0.1% 0.0% 0.1%Yard Waste - <6" 1,983 0.4% 0.0% 0.8% Other Wastes 23,723 4.6%Yard Waste - >6" 1,249 0.2% 0.0% 0.5% Textiles 7,415 1.4% 0.7% 2.2%Food 10,366 2.0% 1.1% 2.9% Carpet 13,421 2.6% 1.5% 3.7%Diapers 2,568 0.5% 0.1% 0.9% Carpet Padding 2,887 0.6% 0.0% 1.2%Animal Waste/Kitty Litter 3,066 0.6% 0.0% 1.2%Bottom Fines/Dirt 2,691 0.5% 0.1% 0.9%R/C Organic 6,144 1.2% 0.7% 1.7%
Total Tons 519,230Sample Count 104

Cascadia Consulting Group, Inc. 24 Wisconsin Waste Characterization Study Final Report
3.3.2. COMMERCIALLY HAULED
A total of 296 samples were taken from commercially hauled waste loads for this study. As shown in Figure 3-6, paper and C&D materials each accounted for about 25% of this waste. Organics made up another 20% of the total, by weight.
Figure 3-6 – Overview of Composition, Commercially Hauled
(Calendar Year 2001)
Other Wastes5.3%
Paper22.3%
Problem Wastes6.8%
C&D26.0%
Organics19.5%
Glass2.2%
Metal6.1%
Plastics11.2%
Household Hazardous
0.6%
The top ten components of Wisconsin’s commercially hauled waste are listed in Table 3-13. They made up nearly 60%, or about 2.4 million tons, of all commercially hauled waste. Untreated wood and food each accounted for over 10% of the total, by weight. Roofing shingles and compostable paper comprised an equal share of the total (5.3% each). R/C plastic, or remainder/composite plastic, is among the top ten components and consists of items such as molded toys and plastic hoses, which do not fit into other plastic categories.
Table 3-13 – Top Ten Components, Commercially Hauled
(Calendar Year 2001)
Component Mean Cum. % Tons Cum. TonsWood - untreated 12.1% 12.1% 513,722 513,722Food 11.3% 23.4% 476,253 989,975Roofing Shingles 5.3% 28.7% 225,197 1,215,173Compostable Paper 5.3% 34.0% 224,052 1,439,225Mixed Recyclable Paper 4.6% 38.6% 194,226 1,633,451Plastic Film 4.3% 42.8% 180,194 1,813,645Cardboard - recyclable 4.1% 46.9% 172,285 1,985,930R/C Plastic 3.9% 50.8% 163,870 2,149,800Ferrous Metals 3.4% 54.2% 145,018 2,294,818Rock/Concrete/Brick 3.4% 57.6% 143,332 2,438,151
Total 57.6% 2,438,151

Cascadia Consulting Group, Inc. 25 Wisconsin Waste Characterization Study Final Report
For more detail on Wisconsin’s commercially hauled waste, please see Table 3-14. Annual tons, mean percents, and confidence intervals are listed for each individual waste component.
Table 3-14 – Detailed Composition Profile, Commercially Hauled
(Calendar Year 2001)
Calculated at a 90% confidence level
Conf. Interval Conf. IntervalTons Mean Low High Tons Mean Low High
Paper 943,427 22.3% C&D 1,101,457 26.0%Newsprint 86,480 2.0% 1.8% 2.3% Wood - treated 31,463 0.7% 0.2% 1.3%High Grade Paper 63,195 1.5% 1.2% 1.8% Wood - untreated 513,722 12.1% 9.9% 14.4%Magazines/Catalogs 45,716 1.1% 0.9% 1.2% Rock/Concrete/Brick 143,332 3.4% 1.9% 4.8%Cardboard - recyclable 172,285 4.1% 3.1% 5.1% Drywall 38,769 0.9% 0.5% 1.3%Cardboard - coated 8,976 0.2% 0.1% 0.4% Roofing Shingles 225,197 5.3% 3.1% 7.5%Boxboard 33,690 0.8% 0.7% 0.9% PVC 1,080 0.0% 0.0% 0.0%Mixed Recyclable Paper 194,226 4.6% 4.2% 5.0% Ceramics/Porcelain 11,510 0.3% 0.1% 0.4%Compostable Paper 224,052 5.3% 4.7% 5.9% Other C&D 136,383 3.2% 1.8% 4.6%R/C Paper 114,807 2.7% 1.9% 3.5% Problem Wastes 289,793 6.8%
Plastics 474,330 11.2% Televisions 16,971 0.4% 0.1% 0.7%PET Bottles 18,812 0.4% 0.4% 0.5% Computer Monitors 9,717 0.2% 0.0% 0.4%HDPE Bottles - natural 8,006 0.2% 0.2% 0.2% Computer Equipment 2,779 0.1% 0.0% 0.1%HDPE Bottles - colored 9,838 0.2% 0.2% 0.3% Electronic Equipment 48,920 1.2% 0.8% 1.5%#3-#7 Other Plastic Bottles 768 0.0% 0.0% 0.0% White Goods - refrigerated 13,816 0.3% 0.1% 0.6%Polystyrene 21,658 0.5% 0.4% 0.6% White Goods - non-refrigerated 2,476 0.1% 0.0% 0.2%Other Rigid Plastic Containers 71,184 1.7% 1.2% 2.2% Lead-Acid Batteries 6,985 0.2% 0.0% 0.4%Plastic Film 180,194 4.3% 3.8% 4.7% Other Household Batteries 2,758 0.1% 0.0% 0.1%R/C Plastic 163,870 3.9% 3.0% 4.7% Tires 27,618 0.7% 0.2% 1.1%
Metal 259,673 6.1% Bulky Items 82,539 1.9% 1.2% 2.7%Aluminum Cans 13,881 0.3% 0.3% 0.4% Fluorescent Lights 241 0.0% 0.0% 0.0%Other Aluminum 13,504 0.3% 0.2% 0.4% Ballasts 767 0.0% 0.0% 0.0%Tin Cans 24,644 0.6% 0.5% 0.7% Pallets 74,208 1.8% 1.0% 2.5%Ferrous Metals 145,018 3.4% 2.4% 4.5% Household Hazardous 24,222 0.6%Non-Ferrous Metals 5,189 0.1% 0.0% 0.2% Latex Paint 5,697 0.1% 0.0% 0.3%R/C Metal 57,436 1.4% 0.9% 1.8% Oil Paint 1,057 0.0% 0.0% 0.1%
Glass 91,161 2.2% Pesticides/Fertilizers 0 0.0% 0.0% 0.0%Glass - recyclable 37,650 0.9% 0.8% 1.0% Auto Used Oil Filters 1,610 0.0% 0.0% 0.1%R/C Glass 53,511 1.3% 0.4% 2.1% Mercury 0 0.0% 0.0% 0.0%
Organics 825,848 19.5% Other Hazardous 15,857 0.4% 0.0% 0.8%Yard Waste - <6" 54,580 1.3% 0.8% 1.8% Other Wastes 223,077 5.3%Yard Waste - >6" 4,110 0.1% 0.0% 0.2% Textiles 108,451 2.6% 2.0% 3.1%Food 476,253 11.3% 9.9% 12.6% Carpet 102,740 2.4% 1.2% 3.6%Diapers 82,438 1.9% 1.6% 2.3% Carpet Padding 11,886 0.3% 0.1% 0.4%Animal Waste/Kitty Litter 42,194 1.0% 0.7% 1.3%Bottom Fines/Dirt 76,605 1.8% 1.5% 2.1%R/C Organic 89,668 2.1% 1.5% 2.7%
Total Tons 4,232,988Sample Count 296

Cascadia Consulting Group, Inc. 26 Wisconsin Waste Characterization Study Final Report
3.4. COMPARISONS AMONG SAMPLING GROUPS
Table 3-15 compares composition profiles across the three substreams: residential, ICI, and C&D. Composition estimates are also shown for the two hauler types: commercially collected and self-hauled wastes. Residential and ICI wastes were markedly similar in their composition, though residential wastes contained a slightly higher amount of organics and plastics accounted for slightly more of the ICI wastes. C&D wastes were unique as compared with residential and ICI wastes, with over 75% made up of construction materials such as drywall and untreated wood. When compared, self-hauled and commercially collected wastes were quite different. C&D wastes made up a larger percentage of the self-haul wastes, while paper and organics accounted for more of the commercially collected wastes.
Table 3-15 – Composition Comparisons, by Sampling Group
(Calendar Year 2001)
Substream Hauler Type
Material Residential ICI C&D Self-haulCommercial
hauledPaper 26.1% 25.8% 4.1% 8.5% 22.3%
Newsprint 3.8% 1.6% 0.1% 1.1% 2.0%High Grade Paper 1.6% 1.8% 0.2% 0.5% 1.5%Magazines/Catalogs 1.9% 0.9% 0.0% 0.3% 1.1%Cardboard - recyclable 2.4% 5.7% 2.8% 3.1% 4.1%Cardboard - coated 0.1% 0.5% 0.0% 0.4% 0.2%Boxboard 1.4% 0.6% 0.0% 0.2% 0.8%Mixed Recyclable Paper 6.7% 4.4% 0.6% 1.4% 4.6%Compostable Paper 6.2% 6.3% 0.1% 0.8% 5.3%R/C Paper 1.9% 4.1% 0.3% 0.7% 2.7%
Plastics 10.9% 14.6% 2.2% 4.8% 11.2%PET Bottles 0.6% 0.5% 0.0% 0.2% 0.4%HDPE Bottles - natural 0.3% 0.2% 0.0% 0.1% 0.2%HDPE Bottles - colored 0.4% 0.2% 0.0% 0.1% 0.2%#3-#7 Other Plastic Bottles 0.0% 0.0% 0.0% 0.0% 0.0%Polystyrene 0.5% 0.6% 0.2% 0.1% 0.5%Other Rigid Plastic Containers 1.5% 2.2% 0.4% 0.6% 1.7%Plastic Film 4.4% 5.5% 0.5% 1.7% 4.3%R/C Plastic 3.3% 5.3% 1.1% 2.1% 3.9%
Metal 5.8% 6.8% 6.1% 7.6% 6.1%Aluminum Cans 0.5% 0.4% 0.0% 0.5% 0.3%Other Aluminum 0.5% 0.2% 0.3% 0.3% 0.3%Tin Cans 0.9% 0.5% 0.1% 0.2% 0.6%Ferrous Metals 2.4% 4.3% 3.9% 5.0% 3.4%Non-Ferrous Metals 0.1% 0.2% 0.1% 0.1% 0.1%R/C Metal 1.3% 1.2% 1.7% 1.5% 1.4%
Glass 2.5% 2.4% 1.7% 3.2% 2.2%Glass - recyclable 1.5% 0.9% 0.1% 1.0% 0.9%R/C Glass 1.1% 1.5% 1.6% 2.2% 1.3%
Organics 26.3% 20.9% 1.0% 5.4% 19.5%Yard Waste - <6" 1.9% 1.2% 0.2% 0.4% 1.3%Yard Waste - >6" 0.1% 0.1% 0.2% 0.2% 0.1%Food 13.4% 13.2% 0.2% 2.0% 11.3%Diapers 3.7% 1.4% 0.0% 0.5% 1.9%Animal Waste/Kitty Litter 2.1% 0.6% 0.0% 0.6% 1.0%Bottom Fines/Dirt 2.8% 1.7% 0.0% 0.5% 1.8%R/C Organic 2.3% 2.7% 0.3% 1.2% 2.1%

Cascadia Consulting Group, Inc. 27 Wisconsin Waste Characterization Study Final Report
Table 3-15 – Composition Comparisons, by Sampling Group, Contd.
(Calendar Year 2001)
Substream Hauler Type
Material Residential ICI C&D Self-haulCommercial
hauledC&D 12.3% 15.5% 76.2% 50.6% 26.0%
Wood - treated 0.3% 1.2% 1.3% 2.5% 0.7%Wood - untreated 7.5% 10.1% 25.0% 18.1% 12.1%Rock/Concrete/Brick 0.6% 1.0% 12.1% 4.3% 3.4%Drywall 0.9% 1.0% 4.1% 8.0% 0.9%Roofing Shingles 2.1% 0.3% 22.1% 11.5% 5.3%PVC 0.0% 0.0% 0.1% 0.2% 0.0%Ceramics/Porcelain 0.3% 0.1% 0.8% 0.8% 0.3%Other C&D 0.6% 1.7% 10.7% 5.2% 3.2%
Problem Wastes 8.8% 8.0% 5.7% 14.9% 6.8%Televisions 0.7% 0.2% 0.8% 1.3% 0.4%Computer Monitors 0.0% 0.3% 0.3% 0.1% 0.2%Computer Equipment 0.1% 0.1% 0.0% 0.0% 0.1%Electronic Equipment 2.7% 0.8% 0.6% 3.0% 1.2%White Goods - refrigerated 0.0% 0.4% 0.5% 0.0% 0.3%White Goods - non-refrigerated 0.6% 0.0% 0.2% 1.9% 0.1%Lead-Acid Batteries 0.0% 0.2% 0.3% 0.0% 0.2%Other Household Batteries 0.1% 0.0% 0.0% 0.0% 0.1%Tires 0.6% 0.9% 0.0% 0.0% 0.7%Bulky Items 3.9% 2.5% 1.1% 8.1% 1.9%Fluorescent Lights 0.0% 0.0% 0.0% 0.0% 0.0%Ballasts 0.0% 0.0% 0.0% 0.0% 0.0%Pallets 0.0% 2.6% 1.9% 0.5% 1.8%
Household Hazardous 0.2% 0.7% 0.7% 0.4% 0.6%Latex Paint 0.0% 0.0% 0.5% 0.2% 0.1%Oil Paint 0.0% 0.0% 0.1% 0.0% 0.0%Pesticides/Fertilizers 0.0% 0.0% 0.0% 0.0% 0.0%Auto Used Oil Filters 0.1% 0.0% 0.0% 0.1% 0.0%Mercury 0.0% 0.0% 0.0% 0.0% 0.0%Other Hazardous 0.1% 0.6% 0.1% 0.1% 0.4%
Other Wastes 7.1% 5.3% 2.4% 4.6% 5.3%Textiles 3.6% 2.3% 1.2% 1.4% 2.6%Carpet 3.0% 2.9% 0.8% 2.6% 2.4%Carpet Padding 0.5% 0.2% 0.4% 0.6% 0.3%
Total 100% 100% 100% 100% 100%

Cascadia Consulting Group, Inc. 28 Wisconsin Waste Characterization Study Final Report
Table 3-16 – Tonnage Comparisons, by Sampling Groups
(Calendar Year 2001)
Substream Hauler Type
Material Residential ICI C&D Self-haulCommercial
hauledPaper 400,448 541,213 45,985 44,219 943,427
Newsprint 58,027 33,144 1,099 5,789 86,480High Grade Paper 25,327 37,736 2,523 2,391 63,195Magazines/Catalogs 29,144 18,173 63 1,665 45,716Cardboard - recyclable 37,352 119,358 31,466 15,891 172,285Cardboard - coated 1,188 9,908 28 2,148 8,976Boxboard 21,136 13,508 192 1,145 33,690Mixed Recyclable Paper 103,462 92,036 6,217 7,489 194,226Compostable Paper 95,567 131,327 1,416 4,258 224,052R/C Paper 29,244 86,024 2,982 3,443 114,807
Plastics 167,989 306,635 24,689 24,983 474,330PET Bottles 8,818 10,579 213 798 18,812HDPE Bottles - natural 3,896 4,477 9 376 8,006HDPE Bottles - colored 5,808 4,465 100 534 9,838#3-#7 Other Plastic Bottles 461 339 9 41 768Polystyrene 7,479 12,894 2,062 777 21,658Other Rigid Plastic Containers 23,263 46,294 4,562 2,935 71,184Plastic Film 67,876 115,426 5,687 8,796 180,194R/C Plastic 50,388 112,161 12,047 10,727 163,870
Metal 89,161 142,502 67,581 39,572 259,673Aluminum Cans 7,949 8,051 292 2,410 13,881Other Aluminum 8,360 3,857 2,808 1,521 13,504Tin Cans 13,453 11,505 758 1,071 24,644Ferrous Metals 37,584 90,240 43,262 26,068 145,018Non-Ferrous Metals 1,589 3,420 956 776 5,189R/C Metal 20,227 25,430 19,506 7,727 57,436
Glass 39,148 49,949 18,765 16,700 91,161Glass - recyclable 22,951 18,533 1,237 5,071 37,650R/C Glass 16,196 31,416 17,528 11,629 53,511
Organics 403,320 439,815 10,779 28,066 825,848Yard Waste - <6" 28,576 25,273 2,713 1,983 54,580Yard Waste - >6" 1,249 2,419 1,691 1,249 4,110Food 206,363 277,650 2,606 10,366 476,253Diapers 56,054 28,923 29 2,568 82,438Animal Waste/Kitty Litter 32,616 12,644 0 3,066 42,194Bottom Fines/Dirt 43,024 36,232 40 2,691 76,605R/C Organic 35,437 56,674 3,701 6,144 89,668

Cascadia Consulting Group, Inc. 29 Wisconsin Waste Characterization Study Final Report
Table 3 – 16 –Tonnage Comparisons, by Sampling Groups, Contd.
(Calendar Year 2001)
3.5. PREVALENCE OF SHARPS, MERCURY-CONTAINING ITEMS, AND REUSABLES
In addition to capturing and sorting samples, the Field Supervisor noted loads that contained sharps, mercury-containing items (e.g., thermometers), and reusable materials. Sharps (hypodermic needles) were measured in terms of incidence, while the total number of mercury-containing items was recorded for each sample. Mercury-containing items included barometers, thermostat switches, laboratory and fever thermometers, car switches, some silent switches, blood pressure cuffs, and bulk mercury bottles.
Substream Hauler Type
Material Residential ICI C&D Self-haulCommercial
hauledC&D 189,201 324,508 850,344 262,596 1,101,457
Wood - treated 3,988 26,154 14,317 12,996 31,463Wood - untreated 115,732 213,143 278,776 93,928 513,722Rock/Concrete/Brick 8,870 21,657 135,200 22,395 143,332Drywall 14,316 20,361 45,487 41,395 38,769Roofing Shingles 32,078 6,098 246,575 59,554 225,197PVC 625 42 1,595 1,181 1,080Ceramics/Porcelain 4,940 2,227 8,473 4,130 11,510Other C&D 8,653 34,826 119,920 27,016 136,383
Problem Wastes 134,825 168,536 63,869 77,437 289,793Televisions 11,179 4,041 8,695 6,944 16,971Computer Monitors 0 6,681 3,372 336 9,717Computer Equipment 1,206 1,573 0 0 2,779Electronic Equipment 41,183 16,929 6,360 15,552 48,920White Goods - refrigerated 0 8,323 5,493 0 13,816White Goods - non-refrigerated 9,656 0 2,476 9,656 2,476Lead-Acid Batteries 0 3,814 3,171 0 6,985Other Household Batteries 2,268 559 5 74 2,758Tires 9,190 18,446 65 83 27,618Bulky Items 59,157 52,977 12,478 42,073 82,539Fluorescent Lights 218 8 15 1 241Ballasts 767 0 0 0 767Pallets 0 55,185 21,741 2,718 74,208
Household Hazardous 3,286 15,524 7,345 1,934 24,222Latex Paint 293 1,028 5,667 1,291 5,697Oil Paint 49 411 635 38 1,057Pesticides/Fertilizers 0 0 0 0 0Auto Used Oil Filters 1,196 610 69 264 1,610Mercury 6 0 0 6 0Other Hazardous 1,742 13,476 974 334 15,857
Other Wastes 108,301 111,515 26,983 23,723 223,077Textiles 54,826 47,549 13,491 7,415 108,451Carpet 45,942 60,772 9,446 13,421 102,740Carpet Padding 7,533 3,194 4,047 2,887 11,886
Total 1,535,679 2,100,198 1,116,341 519,230 4,232,988

Cascadia Consulting Group, Inc. 30 Wisconsin Waste Characterization Study Final Report
Any incidence of reusable items was also noted; these items were included in the weight of the sample. Reusables were defined as C&D materials in reusable condition based on two factors: (1) in quantity, if small, or (2) individually, if large. For example, a door in good condition would count as reusable, however a couple of hinges in good condition would not, yet a box of hinges would count as reusable. The next three sections present information on the prevalence of each of these three materials found in Wisconsin’s disposed waste stream. Results are presented by each of the six sampling groups and for the five regions. 3.5.1. SHARPS
As shown in Table 3-17, there were a total of 36 incidences of sharps throughout the study period. Nearly all (29, or 80%) of those detected were from residential sources, and delivered by commercial hauling companies. The remaining seven incidences occurred in ICI loads brought by commercial hauling companies. No sharps were found in C&D samples. When comparing the incidence of sharps by region, Northern regions showed the greatest number, while the Southeast and West central regions showed the least number of sharps.
Table 3-17 – Incidence of Sharps, by Sampling Groups and Regions
Residential
Industrial/ Commercial/ Institutional
Construction & Demolition Total
Region Commercial Self-haul Commercial Self-haul Commercial Self-haulNortheast 10 0 0 0 0 0 10North 15 0 0 0 0 0 15Southcentral 2 0 6 0 0 0 8Southeast 2 0 0 0 0 0 2Westcentral 0 0 1 0 0 0 1
Total 29 0 7 0 0 0 36 3.5.2. MERCURY-CONTAINING ITEMS
There were no mercury-containing items found in samples captured and sorted during this study.

Cascadia Consulting Group, Inc. 31 Wisconsin Waste Characterization Study Final Report
3.5.3. REUSABLES
Reusable items were found most often in self-haul loads (16 of 22, or 73%). Residential and C&D loads had a high incidence of reusable items compared with ICI loads. In fact, when combined, about 86% of the incidences were observed in residential and C&D self-haul loads.
Table 3-18 – Incidence of Reusable items, by Sampling Groups and Regions
Residential
Industrial/ Commercial/ Institutional
Construction & Demolition Total
Region Commercial Self-haul Commercial Self-haul Commercial Self-haulNortheast 0 3 0 0 3 3 9North 0 2 1 0 0 2 5Southcentral 0 1 1 1 0 0 3Southeast 1 0 0 0 0 2 3Westcentral 0 1 0 0 0 1 2
Total 1 7 2 1 3 8 22 The most common reusable items noted were windows and doors. Windows were found in samples from each region, and in residential, ICI, and C&D loads. Doors (including metal, glass, storm, and garage doors) were observed in residential and C&D samples from all regions, except in the Southeast and West central. Additional reusables found included furniture such as desks and coffee tables, as well as new construction materials such as bundles of roofing shingles and plywood.


Cascadia Consulting Group, Inc. A-1 Wisconsin Waste Characterization Study Appendices
Appendix A: WASTE COMPONENTS
PAPER
1. Newsprint (ONP) - printed groundwood newsprint, including glossy advertisements
and inserts typically found in newspapers.
2. High grade office paper - high-grade continuous form computer paper, white paper including bond, photocopy and notebook paper, and colored ledger paper primarily found in offices.
Key points: ??Kraft envelopes go into Other Paper – recyclable. ??If high-grade paper is wet, it should still go into this category because it is
assumed to have become wet after being discarded. ??If paper is brighter than pastel, it belongs in Mixed paper – recyclable. Examples: ??Bond computer paper, index cards, computer cards, notebook paper, xerographic
and typing paper, tablets (yellow and with clear glue binding), manila folders, white register receipts, non-glossy fax paper.
3. Magazines/Catalogs - magazines, catalogs, promotional materials printed on glossy
paper; does not include telephone directories or books. Key points: ??Glossy business brochures and folder inserts belong in Mixed paper – recyclable.
4. Uncoated OCC - recyclable - uncoated cardboard with a wavy core and not
contaminated with other materials such as wax or plastic coating. Key points:
??OCC with Styrofoam attached to it that cannot be removed belongs in R/C paper category.
5. Coated OCC - cardboard coated with wax or plastic. 6. Boxboard - chipboard boxes not coated with wax, plastic or metal.
Examples: ??Cereal boxes, other chipboard food containers, and shirt boxes. ??Wet-strength papers used to package items such as ice cream and cases of soda
pop and beer belong in Mixed paper – recyclable.
7. Mixed paper - recyclable - paper that would be included in residential "mixed mail" or commercial "office pack" recycling programs, not including the grades identified above.
Examples: ??Paper bags (including kraft), envelopes, egg cartons, tissue roll cores, telephone
directories, books, brightly colored paper, calendars, "junk" mail, tablets with colored glue bindings, wet-strength papers used to package items such as ice cream and cases of soda pop and beer.
8. Compostable paper—tissues and paper including OCC that are soiled with food,
such as paper plates, paper cups, pizza boxes, popcorn bags, and paper towels.

Cascadia Consulting Group, Inc. A-2 Wisconsin Waste Characterization Study Appendices
9. R/C paper- all paper that doesn't fit into the categories specified above and items that
are primarily paper but include other materials such as plastic or metal. Key points:
??If the sorter is 99% sure that the generator intended to reuse the paper in such a way that it became contaminated for recycling, put that paper into this category (e.g., paper used to dispose of chewing gum, paper sprayed with paint).
??If it would take an effort to make the paper recyclable, put it into this category. Example: ??Paper or boxboard coated with wax, plastic or metal, photographs, laminated
paper. PLASTIC
10. PET bottles - plastic bottles and necked jars composed of polyethylene terephthalate.
Key points: ??Look for the label "1" on the bottom. ??PET and PVC can be differentiated because PET containers have a nub or 'belly
button' while PVC containers have a seam or 'smile.' ??Items not clearly identified as PET, narrowing down to a neck, go into Other Rigid
Plastic Packaging. Examples: ??Beverage bottles, some bottles for detergent, liquor, toiletries and honey, jars for
peanut butter and mayonnaise.
11. HDPE bottles - natural - natural, or unpigmented, high-density polyethylene bottles with necks.
Key points: ??Look for the label "2" on the bottom. ??Opaque or translucent matte finish. ??Must narrow down to a neck, otherwise it goes in Other Rigid Plastic Packaging. Examples: ??Clear or uncolored bottles for dairy products, detergent, windshield fluid, eye
drops, rubbing alcohol, vinegar, motor oil, and some shampoo, fabric softener, antifreeze, bleach.
12. HDPE bottles - colored - colored high-density polyethylene bottles with necks.
Key points: ??Look for the label "2" on the bottom. ??Must narrow down to a neck, otherwise it goes in Other Rigid Plastic Packaging. Examples: ??Colored bottles for orange juice, detergent, windshield fluid, motor oil, and some
shampoo, fabric softener, antifreeze, bleach.
13. Other bottles – all other plastic “3” – “7” bottles that narrow down to a neck.

Cascadia Consulting Group, Inc. A-3 Wisconsin Waste Characterization Study Appendices
14. Foam Polystyrene –packaging made primarily from foam polystyrene that satisfies
one of the following criteria: (a) Is designed for serving food or beverages. (b) Consists of loose particles intended to fill space and cushion the packaged article in a shipping container. (c) Consists of rigid materials shaped to hold and cushion the packaged article in a shipping container.
15. Other rigid plastic containers — all other non-film packaging that does not fit into the above categories including tubs, jars, clamshells, caps, closures, and other miscellaneous items.
Key points: ??Items in this category should fulfill the following criteria:
1. Stand up when placed on a flat surface; and, 2. Contain liquid.
16. Film - all flexible plastic film, including material that is contaminated.
Examples: ??Garbage bags, bread bags, snack bags, plastic grocery bags, agricultural bags, food
wrappings, shower curtains, and sheet film.
17. R/C plastic - all plastic that doesn't fit into the categories specified above and items that are primarily plastic but include other materials such as paper or metal.
Examples: ??Molded toys, plastic clothes hangers, disposable razors, plastic hoses, drinking
straws, credit cards, and writing pens.
METALS
18. Aluminum beverage containers - Aluminum beverage containers.
19. Other aluminum - All aluminum except beverage containers. Key points:
??If the material is not recognizable as aluminum and it as not attracted to a magnet, it belongs in Other Non-Ferrous.
Examples: ??Aluminum foil, aluminum pie plates, aluminum siding, and aluminum lawn chairs.
20. Ferrous containers - steel food and beverage containers, including steel soft drink,
beer and other beverage containers, and steel pet food cans.
21. Other ferrous - Ferrous and alloyed ferrous scrap, to which a magnet is attracted (includes household, commercial and industrial materials).
Examples: ??Metal clothes hangers, sheet metal products, pipes, steel drums, aerosol cans, and
metal scraps.
22. Other non-ferrous - all other non-magnetic metal, such as brass and copper, which are not recognized as aluminum.

Cascadia Consulting Group, Inc. A-4 Wisconsin Waste Characterization Study Appendices
23. R/C metal - all metal that doesn't fit into the categories specified above and items that are primarily metal but include other materials such as plastic or paper.
Examples: ??Auto motors, insulated wire, office stapler, lamps, and toys.
GLASS
24. Recyclable glass – bottles and jars only, excluding medicine or chemical bottles. Key points: ??Includes cobalt blue bottles.
25. R/C glass - all glass that doesn't fit into the category specified above and items that
are primarily glass but include other materials such as plastic or metal. Key points:
??If the glass is broken and not 100% identifiable as food or beverage glass, it belongs in R/C Glass.
Examples: ??Plate glass, drinking glass, cooking utensils, ashtrays, mirrors, Pyrex, dinner plates,
medicine and chemical bottles, and fragments. ORGANIC MATERIALS
26. Yard waste - banned - leaves, grass clippings, yard and garden debris and brush, including clean woody vegetative material no greater than 6 inches in diameter. Key Points: ??This material does not include stumps, roots or shrubs with intact root balls.
27. Yard waste - other - woody vegetative material greater than 6 inches in diameter,
stumps, roots or shrubs with intact root balls.
28. Food waste - Material capable of being decomposed by microorganisms with sufficient rapidity as to cause nuisances from odors and gases; putrescibles.
Examples: ??Food preparation waste, food scraps, spoiled food, kitchen wastes, waste parts
from butchered animals.
29. Diapers - infant and adult disposable diapers.
30. Animal waste/cat litter – animal wastes and kitty litter. Key points:
??Animal carcasses belong in R/C Organic.
31. Bottom fines and dirt – small fragments that pass through the ¼” sort screen, and miscellaneous fines and dirt.
32. R/C organics - all organic material that doesn't fit into the category specified above
and items that are primarily organic but include other materials such as plastic or metal. Examples: ??Cotton balls, feminine hygiene products, hair, rubber products, and animal
carcasses.

Cascadia Consulting Group, Inc. A-5 Wisconsin Waste Characterization Study Appendices
CONSTRUCTION AND DEMOLITION
33. Treated wood - lumber that is either green or brown treated. Examples: ??Railroad ties, some wood fencing and siding, and playground equipment.
34. Untreated wood - lumber that is not treated.
35. Rock, concrete, brick – Rock gravel, Portland cement mixtures (set or unset), and fire-
clay bricks.
36. Gypsum wallboard – new or used gypsum wallboard scrap.
37. Roofing shingles – asphalt shingles and tarpaper of built-up roofing.
38. PVC – construction and demolition materials made of polyvinyl chloride; primarily piping.
39. Ceramics/Porcelain – Finished ceramic or porcelain household fixtures such as
toilets, tiling, and sinks.
40. Other C&D - all construction and demolition material that doesn't fit into the categories specified above.
Examples: ??Insulation, linoleum, nails, adhesives, tubs, showers, and cabinets.
PROBLEM MATERIALS
41. Televisions – televisions and video monitors.
42. Computer monitors – self-defined.
43. Computer equipment/peripherals - computer processing units, keyboards, modems, printers, mice.
44. Electronic equipment - small products or appliances with an electrical cord or battery
power source. Examples: Small kitchen and bathroom appliances (toasters, hair dryers, etc.), radios, audio or video equipment, handheld video games, lamps, and vacuum cleaners.
45. White goods - refrigerated - major appliances that are primarily encased in metal,
and are designed to contain refrigerants. Examples:
??Refrigerators, freezers, and dehumidifiers.
46. White goods – non-refrigerated - major appliances that are primarily encased in metal, and are not designed to contain refrigerants. Examples: ??Stoves, water heaters, washers, dryers, and microwaves.

Cascadia Consulting Group, Inc. A-6 Wisconsin Waste Characterization Study Appendices
47. Lead-acid batteries - automotive, tractor, motorcycle, and boat batteries.
48. Other household batteries - all household batteries.
Examples: ??Household (rechargeable and non-rechargeable) and button.
49. Tires - Automobile, truck, tractor, motorcycle, bicycle, and trailer tires.
50. Household bulky items – furniture and mattresses.
51. Fluorescent lights – fluorescent light tubes.
52. Ballasts - Electrical components at the end of fluorescent light fixtures under a metal
overplate.
53. Wood pallets – Wood pallets and crating materials commonly used for industrial and commercial packaging and shipping.
HOUSEHOLD HAZARDOUS WASTE
54. Latex paint - latex paint that is not dried.
55. Oil paint - oil base paint, wet and dry.
56. Pesticides/Fungicides/Herbicides/Fertilizers - household and commercial products used to destroy or control organisms/pests or enhance plant growth.
57. Automotive - used oil/filters - automotive oil and oil filters
58. Mercury – (Item count) Mercury-containing items.
Key Points: ??Count even if containment is broken and mercury is no longer present.
Examples: ?? Barometers, thermostat switches, laboratory and fever thermometers, and car
switches, some silent switches, blood pressure cuffs, and bulk mercury bottles.
59. Sharps and infectious waste – (Incidence) hypodermic needles and any "red bag" material.
Examples: ??Laboratory waste, items covered in blood, research animal waste, regulated human
body fluids, syringes with needles, scalpel blades, and pipettes.
60. Other HHW/HW – all household or commercial products characterized as "toxic", "corrosive", "flammable", "ignitable", "radioactive", "poisonous", and "reactive."
Examples: ??Cleaners, solvents, antifreeze, acids, and bases.
OTHER WASTE
61. Textiles - clothing, bedding, curtains, blankets, stuffed animals, other cloth material, and leather goods.

Cascadia Consulting Group, Inc. A-7 Wisconsin Waste Characterization Study Appendices
62. Carpet – general category of flooring applications consisting of various natural or
synthetic fibers bonded to some type of backing material.
63. Carpet padding – polyurethane padding used as a carpet underlay.
64. Top Fines – material fragments that are 2” sq. or less, and do not pass through the sort screen. These materials will be visually categorized into their respective component categories.
Any incidence of reusable items was also noted. These items are defined as C&D materials in reusable condition, and either 1) in quantity, if small, or 2) individually, if large. For example, a door in good reusable condition would count. A couple of hinges in good condition would not, but a box of hinges would count.


Cascadia Consulting Group, Inc. B-1 Wisconsin Waste Characterization Study Appendices
Appendix B: REGIONAL COMPOSITION PROFILES This appendix presents composition and quantity profiles for each of the five regions: Northeast, North, South central, Southeast, and West central. Within each region, profiles are also presented for residential, ICI, and C&D wastes. Each profile is presented in three ways:
1. first, a pie chart depicts the composition by nine broad waste categories: paper, plastics, metal, glass, organics, construction and demolition (C&D), problem wastes, household hazardous, and other;
2. then, a table lists the ten largest components, by weight, and, 3. finally, a more comprehensive table details the full composition results for the 62
distinct sorting categories.8 There are also comparison tables included for each region, within which detailed composition profiles for each substream and hauler type are listed. At the end of this appendix, a similar table compares the five regional composition profiles in detail. Though all sampling took place during 2002, composition percentages were applied to calendar year 2001 tonnages (as 2002 tonnages were unavailable). Therefore, tables and figures throughout this report are labeled as calendar year 2001 instead of 2002. Also, composition estimates presented in this report were calculated at a 90% confidence interval, meaning that we are 90% confident each material is between the low and high percentages shown in the comprehensive tables for each profile. For example, we are 90% confident that newsprint made up between 0.9 % and 1.4% of the MSW disposed in the Northeast region, by weight.
8 Due to rounding, composition estimates may not add to 100% in tables and graphs throughout this report.

Cascadia Consulting Group, Inc. B-2 Wisconsin Waste Characterization Study Appendices
NORTHEAST REGION
Overall
Figure B - 1 – Overview of Composition, Northeast
(Calendar Year 2001)
Other Wastes4.8% Paper
17.2%
Problem Wastes7.9%
C&D31.5%
Organics19.6%
Glass2.1%
Metal7.7%
Plastics9.0%
Household Hazardous
0.3%
Table B - 1 – Top Ten Components, Northeast
(Calendar Year 2001)
Component Mean Cum. % Tons Cum. TonsWood - untreated 15.4% 15.4% 181,771 181,771Food 11.3% 26.7% 134,304 316,075Other C&D 6.9% 33.6% 81,312 397,387Ferrous Metals 5.0% 38.5% 58,871 456,258Compostable Paper 4.4% 43.0% 52,244 508,502Plastic Film 3.8% 46.7% 44,751 553,253Mixed Recyclable Paper 3.5% 50.3% 41,796 595,048Roofing Shingles 3.5% 53.8% 41,578 636,626Rock/Concrete/Brick 3.3% 57.1% 39,135 675,760R/C Plastic 3.3% 60.4% 38,609 714,369
Total 60.4% 714,369

Cascadia Consulting Group, Inc. B-3 Wisconsin Waste Characterization Study Appendices
Table B - 2 – Detailed Composition Profile, Northeast
(Calendar Year 2001)
Calculated at a 90% confidence level
Conf. Interval Conf. IntervalTons Mean Low High Tons Mean Low High
Paper 203,704 17.2% C&D 372,751 31.5%Newsprint 13,769 1.2% 0.9% 1.4% Wood - treated 4,556 0.4% 0.0% 0.7%High Grade Paper 11,595 1.0% 0.7% 1.3% Wood - untreated 181,771 15.4% 11.6% 19.1%Magazines/Catalogs 9,957 0.8% 0.6% 1.1% Rock/Concrete/Brick 39,135 3.3% 1.1% 5.5%Cardboard - recyclable 37,475 3.2% 1.7% 4.6% Drywall 22,272 1.9% 1.0% 2.8%Cardboard - coated 1,359 0.1% 0.0% 0.3% Roofing Shingles 41,578 3.5% 1.1% 6.0%Boxboard 7,989 0.7% 0.5% 0.8% PVC 446 0.0% 0.0% 0.1%Mixed Recyclable Paper 41,796 3.5% 2.9% 4.1% Ceramics/Porcelain 1,681 0.1% 0.1% 0.2%Compostable Paper 52,244 4.4% 3.3% 5.5% Other C&D 81,312 6.9% 3.3% 10.5%R/C Paper 27,520 2.3% 1.3% 3.4% Problem Wastes 92,939 7.9%
Plastics 106,092 9.0% Televisions 6,317 0.5% 0.0% 1.0%PET Bottles 3,470 0.3% 0.2% 0.4% Computer Monitors 7,016 0.6% 0.0% 1.2%HDPE Bottles - natural 1,588 0.1% 0.1% 0.2% Computer Equipment 1,723 0.1% 0.0% 0.3%HDPE Bottles - colored 2,301 0.2% 0.1% 0.3% Electronic Equipment 11,209 0.9% 0.6% 1.3%#3-#7 Other Plastic Bottles 98 0.0% 0.0% 0.0% White Goods - refrigerated 3,171 0.3% 0.0% 0.7%Polystyrene 3,993 0.3% 0.2% 0.5% White Goods - non-refrigerated 2,522 0.2% 0.0% 0.4%Other Rigid Plastic Containers 11,282 1.0% 0.8% 1.1% Lead-Acid Batteries 0 0.0% 0.0% 0.0%Plastic Film 44,751 3.8% 3.0% 4.6% Other Household Batteries 929 0.1% 0.1% 0.1%R/C Plastic 38,609 3.3% 1.9% 4.7% Tires 1,540 0.1% 0.0% 0.3%
Metal 91,458 7.7% Bulky Items 37,409 3.2% 1.4% 4.9%Aluminum Cans 2,673 0.2% 0.2% 0.3% Fluorescent Lights 5 0.0% 0.0% 0.0%Other Aluminum 4,455 0.4% 0.1% 0.7% Ballasts 0 0.0% 0.0% 0.0%Tin Cans 6,718 0.6% 0.2% 0.9% Pallets 21,099 1.8% 0.0% 3.5%Ferrous Metals 58,871 5.0% 2.5% 7.4% Household Hazardous 3,414 0.3%Non-Ferrous Metals 1,148 0.1% 0.0% 0.2% Latex Paint 984 0.1% 0.0% 0.2%R/C Metal 17,592 1.5% 0.5% 2.5% Oil Paint 654 0.1% 0.0% 0.1%
Glass 24,351 2.1% Pesticides/Fertilizers 0 0.0% 0.0% 0.0%Glass - recyclable 6,515 0.6% 0.4% 0.7% Auto Used Oil Filters 991 0.1% 0.0% 0.1%R/C Glass 17,836 1.5% 0.4% 2.6% Mercury 0 0.0% 0.0% 0.0%
Organics 232,350 19.6% Other Hazardous 785 0.1% 0.0% 0.1%Yard Waste - <6" 14,830 1.3% 0.5% 2.0% Other Wastes 56,551 4.8%Yard Waste - >6" 2,236 0.2% 0.0% 0.4% Textiles 34,322 2.9% 1.8% 4.0%Food 134,304 11.3% 9.0% 13.7% Carpet 21,715 1.8% 0.8% 2.9%Diapers 21,719 1.8% 1.4% 2.2% Carpet Padding 515 0.0% 0.0% 0.1%Animal Waste/Kitty Litter 11,085 0.9% 0.6% 1.3%Bottom Fines/Dirt 15,833 1.3% 1.0% 1.7%R/C Organic 32,343 2.7% 1.8% 3.7%
Total Tons 1,183,610Sample Count 115

Cascadia Consulting Group, Inc. B-4 Wisconsin Waste Characterization Study Appendices
Residential
Figure B - 2 – Overview of Composition, Northeast Residential
(Calendar Year 2001)
Other Wastes5.5%
Paper22.3%
Problem Wastes9.5%
C&D13.7%
Organics30.7%
Glass1.6%
Metal5.7%
Plastics10.7%
Household Hazardous
0.3%
Table B - 3 – Top Ten Components, Northeast Residential
(Calendar Year 2001)
Component Mean Cum. % Tons Cum. TonsFood 16.1% 16.1% 56,441 56,441Wood - untreated 10.1% 26.2% 35,528 91,969Compostable Paper 6.6% 32.9% 23,301 115,270Mixed Recyclable Paper 5.4% 38.2% 18,935 134,206Diapers 4.5% 42.8% 15,869 150,074Plastic Film 4.4% 47.2% 15,435 165,510Bulky Items 4.3% 51.4% 14,921 180,430Textiles 3.8% 55.2% 13,400 193,831R/C Plastic 3.2% 58.4% 11,245 205,076R/C Organic 3.2% 61.6% 11,178 216,254
Total 61.6% 216,254

Cascadia Consulting Group, Inc. B-5 Wisconsin Waste Characterization Study Appendices
Table B - 4 – Detailed Composition Profile, Northeast Residential
(Calendar Year 2001)
Calculated at a 90% confidence level
Conf. Interval Conf. IntervalTons Mean Low High Tons Mean Low High
Paper 78,419 22.3% C&D 47,932 13.7%Newsprint 8,490 2.4% 1.8% 3.0% Wood - treated 253 0.1% 0.0% 0.2%High Grade Paper 5,904 1.7% 1.0% 2.4% Wood - untreated 35,528 10.1% 4.9% 15.4%Magazines/Catalogs 6,088 1.7% 1.2% 2.2% Rock/Concrete/Brick 4,591 1.3% 0.0% 2.6%Cardboard - recyclable 4,713 1.3% 0.9% 1.8% Drywall 3,526 1.0% 0.1% 1.9%Cardboard - coated 1,072 0.3% 0.0% 0.8% Roofing Shingles 0 0.0% 0.0% 0.0%Boxboard 4,124 1.2% 1.0% 1.4% PVC 155 0.0% 0.0% 0.1%Mixed Recyclable Paper 18,935 5.4% 4.4% 6.4% Ceramics/Porcelain 1,021 0.3% 0.0% 0.6%Compostable Paper 23,301 6.6% 5.5% 7.8% Other C&D 2,858 0.8% 0.1% 1.5%R/C Paper 5,793 1.7% 1.3% 2.0% Problem Wastes 33,344 9.5%
Plastics 37,561 10.7% Televisions 5,607 1.6% 0.0% 3.2%PET Bottles 1,713 0.5% 0.4% 0.6% Computer Monitors 0 0.0% 0.0% 0.0%HDPE Bottles - natural 718 0.2% 0.1% 0.3% Computer Equipment 1,206 0.3% 0.0% 0.7%HDPE Bottles - colored 1,239 0.4% 0.3% 0.4% Electronic Equipment 8,307 2.4% 1.3% 3.5%#3-#7 Other Plastic Bottles 71 0.0% 0.0% 0.0% White Goods - refrigerated 0 0.0% 0.0% 0.0%Polystyrene 1,615 0.5% 0.4% 0.5% White Goods - non-refrigerated 2,522 0.7% 0.0% 1.5%Other Rigid Plastic Containers 5,524 1.6% 1.3% 1.9% Lead-Acid Batteries 0 0.0% 0.0% 0.0%Plastic Film 15,435 4.4% 3.7% 5.1% Other Household Batteries 777 0.2% 0.1% 0.3%R/C Plastic 11,245 3.2% 2.1% 4.3% Tires 0 0.0% 0.0% 0.0%
Metal 19,864 5.7% Bulky Items 14,921 4.3% 1.1% 7.4%Aluminum Cans 1,269 0.4% 0.3% 0.5% Fluorescent Lights 5 0.0% 0.0% 0.0%Other Aluminum 1,412 0.4% 0.2% 0.6% Ballasts 0 0.0% 0.0% 0.0%Tin Cans 3,306 0.9% 0.7% 1.2% Pallets 0 0.0% 0.0% 0.0%Ferrous Metals 9,748 2.8% 1.4% 4.2% Household Hazardous 1,046 0.3%Non-Ferrous Metals 438 0.1% 0.0% 0.2% Latex Paint 76 0.0% 0.0% 0.1%R/C Metal 3,692 1.1% 0.3% 1.8% Oil Paint 19 0.0% 0.0% 0.0%
Glass 5,597 1.6% Pesticides/Fertilizers 0 0.0% 0.0% 0.0%Glass - recyclable 3,443 1.0% 0.7% 1.3% Auto Used Oil Filters 643 0.2% 0.0% 0.3%R/C Glass 2,154 0.6% 0.3% 0.9% Mercury 0 0.0% 0.0% 0.0%
Organics 107,727 30.7% Other Hazardous 308 0.1% 0.0% 0.1%Yard Waste - <6" 6,733 1.9% 0.3% 3.6% Other Wastes 19,380 5.5%Yard Waste - >6" 1,249 0.4% 0.0% 0.8% Textiles 13,400 3.8% 2.9% 4.8%Food 56,441 16.1% 13.4% 18.7% Carpet 5,465 1.6% 0.3% 2.8%Diapers 15,869 4.5% 3.5% 5.6% Carpet Padding 515 0.1% 0.0% 0.4%Animal Waste/Kitty Litter 6,771 1.9% 1.3% 2.6%Bottom Fines/Dirt 9,486 2.7% 1.9% 3.5%R/C Organic 11,178 3.2% 1.9% 4.5%
Total Tons 350,871Sample Count 35

Cascadia Consulting Group, Inc. B-6 Wisconsin Waste Characterization Study Appendices
Industrial/Commercial/Institutional
Figure B - 3 – Overview of Composition, Northeast ICI
(Calendar Year 2001)
Other Wastes5.8%
Paper21.1%
Problem Wastes10.5%
C&D17.5%
Organics23.2%
Glass0.6%
Metal10.0%
Plastics11.2%
Household Hazardous
0.2%
Table B - 5 – Top Ten Components, Northeast ICI
(Calendar Year 2001)
Component Mean Cum. % Tons Cum. TonsFood 14.7% 14.7% 76,900 76,900Wood - untreated 11.3% 26.0% 58,768 135,669Ferrous Metals 7.6% 33.6% 39,821 175,490Compostable Paper 5.5% 39.1% 28,750 204,240Plastic Film 5.1% 44.2% 26,467 230,706Cardboard - recyclable 4.1% 48.3% 21,484 252,191R/C Paper 4.1% 52.4% 21,457 273,648R/C Plastic 4.1% 56.5% 21,454 295,101Pallets 4.0% 60.6% 21,099 316,200Mixed Recyclable Paper 3.8% 64.3% 19,740 335,940
Total 64.3% 335,940

Cascadia Consulting Group, Inc. B-7 Wisconsin Waste Characterization Study Appendices
Table B - 6 – Detailed Composition Profile, Northeast ICI
(Calendar Year 2001)
Calculated at a 90% confidence level
Conf. Interval Conf. IntervalTons Mean Low High Tons Mean Low High
Paper 109,960 21.1% C&D 91,452 17.5%Newsprint 4,985 1.0% 0.5% 1.4% Wood - treated 191 0.0% 0.0% 0.1%High Grade Paper 5,593 1.1% 0.5% 1.7% Wood - untreated 58,768 11.3% 6.8% 15.7%Magazines/Catalogs 3,862 0.7% 0.4% 1.1% Rock/Concrete/Brick 5,167 1.0% 0.2% 1.8%Cardboard - recyclable 21,484 4.1% 1.5% 6.8% Drywall 9,459 1.8% 0.5% 3.2%Cardboard - coated 287 0.1% 0.0% 0.1% Roofing Shingles 2,492 0.5% 0.0% 1.0%Boxboard 3,802 0.7% 0.4% 1.1% PVC 26 0.0% 0.0% 0.0%Mixed Recyclable Paper 19,740 3.8% 2.7% 4.8% Ceramics/Porcelain 644 0.1% 0.0% 0.2%Compostable Paper 28,750 5.5% 3.1% 7.9% Other C&D 14,705 2.8% 0.0% 6.0%R/C Paper 21,457 4.1% 1.7% 6.5% Problem Wastes 54,707 10.5%
Plastics 58,277 11.2% Televisions 710 0.1% 0.0% 0.4%PET Bottles 1,658 0.3% 0.2% 0.4% Computer Monitors 6,681 1.3% 0.0% 2.6%HDPE Bottles - natural 870 0.2% 0.1% 0.2% Computer Equipment 518 0.1% 0.0% 0.3%HDPE Bottles - colored 1,055 0.2% 0.1% 0.3% Electronic Equipment 2,746 0.5% 0.1% 1.0%#3-#7 Other Plastic Bottles 26 0.0% 0.0% 0.0% White Goods - refrigerated 3,171 0.6% 0.0% 1.6%Polystyrene 2,119 0.4% 0.2% 0.7% White Goods - non-refrigerated 0 0.0% 0.0% 0.0%Other Rigid Plastic Containers 4,629 0.9% 0.6% 1.2% Lead-Acid Batteries 0 0.0% 0.0% 0.0%Plastic Film 26,467 5.1% 3.3% 6.8% Other Household Batteries 152 0.0% 0.0% 0.1%R/C Plastic 21,454 4.1% 1.2% 7.0% Tires 1,540 0.3% 0.0% 0.8%
Metal 51,993 10.0% Bulky Items 18,091 3.5% 0.3% 6.6%Aluminum Cans 1,348 0.3% 0.1% 0.4% Fluorescent Lights 0 0.0% 0.0% 0.0%Other Aluminum 705 0.1% 0.1% 0.2% Ballasts 0 0.0% 0.0% 0.0%Tin Cans 3,363 0.6% 0.0% 1.4% Pallets 21,099 4.0% 0.1% 8.0%Ferrous Metals 39,821 7.6% 2.6% 12.7% Household Hazardous 818 0.2%Non-Ferrous Metals 191 0.0% 0.0% 0.1% Latex Paint 0 0.0% 0.0% 0.0%R/C Metal 6,564 1.3% 0.0% 2.5% Oil Paint 0 0.0% 0.0% 0.0%
Glass 3,193 0.6% Pesticides/Fertilizers 0 0.0% 0.0% 0.0%Glass - recyclable 2,103 0.4% 0.2% 0.6% Auto Used Oil Filters 348 0.1% 0.0% 0.2%R/C Glass 1,090 0.2% 0.0% 0.4% Mercury 0 0.0% 0.0% 0.0%
Organics 121,263 23.2% Other Hazardous 470 0.1% 0.0% 0.2%Yard Waste - <6" 7,362 1.4% 0.1% 2.7% Other Wastes 30,516 5.8%Yard Waste - >6" 987 0.2% 0.0% 0.5% Textiles 19,642 3.8% 1.3% 6.3%Food 76,900 14.7% 9.7% 19.8% Carpet 10,874 2.1% 0.2% 4.0%Diapers 5,850 1.1% 0.5% 1.7% Carpet Padding 0 0.0% 0.0% 0.0%Animal Waste/Kitty Litter 4,315 0.8% 0.1% 1.6%Bottom Fines/Dirt 6,347 1.2% 0.7% 1.7%R/C Organic 19,502 3.7% 1.9% 5.6%
Total Tons 522,179Sample Count 49

Cascadia Consulting Group, Inc. B-8 Wisconsin Waste Characterization Study Appendices
Construction & Demolition
Figure B - 4 – Overview of Composition, Northeast C&D
(Calendar Year 2001)
Other Wastes2.1%
Paper4.9%
Problem Wastes
1.6%
C&D75.1%
Organics1.1%
Glass5.0%
Metal6.3%
Plastics3.3%
Household Hazardous
0.5%
Table B - 7 – Top Ten Components, Northeast C&D
(Calendar Year 2001)
Component Mean Cum. % Tons Cum. TonsWood - untreated 28.2% 28.2% 87,475 87,475Other C&D 20.5% 48.7% 63,749 151,223Roofing Shingles 12.6% 61.3% 39,085 190,309Rock/Concrete/Brick 9.5% 70.7% 29,376 219,685R/C Glass 4.7% 75.4% 14,592 234,277Cardboard - recyclable 3.6% 79.1% 11,278 245,555Ferrous Metals 3.0% 82.1% 9,302 254,857Drywall 3.0% 85.1% 9,288 264,145R/C Metal 2.4% 87.4% 7,336 271,480R/C Plastic 1.9% 89.3% 5,910 277,390
Total 89.3% 277,390

Cascadia Consulting Group, Inc. B-9 Wisconsin Waste Characterization Study Appendices
Table B - 8 – Detailed Composition Profile, Northeast C&D
(Calendar Year 2001)
Calculated at a 90% confidence level
Conf. Interval Conf. IntervalTons Mean Low High Tons Mean Low High
Paper 15,325 4.9% C&D 233,367 75.1%Newsprint 294 0.1% 0.0% 0.2% Wood - treated 4,112 1.3% 0.0% 2.7%High Grade Paper 99 0.0% 0.0% 0.1% Wood - untreated 87,475 28.2% 17.5% 38.8%Magazines/Catalogs 7 0.0% 0.0% 0.0% Rock/Concrete/Brick 29,376 9.5% 1.3% 17.6%Cardboard - recyclable 11,278 3.6% 0.5% 6.8% Drywall 9,288 3.0% 0.8% 5.2%Cardboard - coated 0 0.0% 0.0% 0.0% Roofing Shingles 39,085 12.6% 3.3% 21.9%Boxboard 64 0.0% 0.0% 0.1% PVC 266 0.1% 0.0% 0.2%Mixed Recyclable Paper 3,121 1.0% 0.0% 2.1% Ceramics/Porcelain 16 0.0% 0.0% 0.0%Compostable Paper 193 0.1% 0.0% 0.1% Other C&D 63,749 20.5% 7.8% 33.2%R/C Paper 270 0.1% 0.0% 0.2% Problem Wastes 4,888 1.6%
Plastics 10,254 3.3% Televisions 0 0.0% 0.0% 0.0%PET Bottles 100 0.0% 0.0% 0.1% Computer Monitors 336 0.1% 0.0% 0.3%HDPE Bottles - natural 0 0.0% 0.0% 0.0% Computer Equipment 0 0.0% 0.0% 0.0%HDPE Bottles - colored 7 0.0% 0.0% 0.0% Electronic Equipment 155 0.0% 0.0% 0.1%#3-#7 Other Plastic Bottles 0 0.0% 0.0% 0.0% White Goods - refrigerated 0 0.0% 0.0% 0.0%Polystyrene 259 0.1% 0.0% 0.2% White Goods - non-refrigerated 0 0.0% 0.0% 0.0%Other Rigid Plastic Containers 1,129 0.4% 0.1% 0.6% Lead-Acid Batteries 0 0.0% 0.0% 0.0%Plastic Film 2,849 0.9% 0.1% 1.7% Other Household Batteries 0 0.0% 0.0% 0.0%R/C Plastic 5,910 1.9% 0.0% 3.8% Tires 0 0.0% 0.0% 0.0%
Metal 19,601 6.3% Bulky Items 4,397 1.4% 0.0% 3.7%Aluminum Cans 56 0.0% 0.0% 0.0% Fluorescent Lights 0 0.0% 0.0% 0.0%Other Aluminum 2,339 0.8% 0.0% 1.8% Ballasts 0 0.0% 0.0% 0.0%Tin Cans 49 0.0% 0.0% 0.0% Pallets 0 0.0% 0.0% 0.0%Ferrous Metals 9,302 3.0% 0.0% 6.5% Household Hazardous 1,550 0.5%Non-Ferrous Metals 519 0.2% 0.0% 0.4% Latex Paint 908 0.3% 0.0% 0.7%R/C Metal 7,336 2.4% 0.0% 5.6% Oil Paint 635 0.2% 0.0% 0.5%
Glass 15,561 5.0% Pesticides/Fertilizers 0 0.0% 0.0% 0.0%Glass - recyclable 969 0.3% 0.0% 0.8% Auto Used Oil Filters 0 0.0% 0.0% 0.0%R/C Glass 14,592 4.7% 0.6% 8.8% Mercury 0 0.0% 0.0% 0.0%
Organics 3,360 1.1% Other Hazardous 7 0.0% 0.0% 0.0%Yard Waste - <6" 735 0.2% 0.0% 0.5% Other Wastes 6,654 2.1%Yard Waste - >6" 0 0.0% 0.0% 0.0% Textiles 1,279 0.4% 0.1% 0.7%Food 962 0.3% 0.0% 0.8% Carpet 5,375 1.7% 0.0% 3.8%Diapers 0 0.0% 0.0% 0.0% Carpet Padding 0 0.0% 0.0% 0.0%Animal Waste/Kitty Litter 0 0.0% 0.0% 0.0%Bottom Fines/Dirt 0 0.0% 0.0% 0.0%R/C Organic 1,663 0.5% 0.0% 1.1%
Total Tons 310,560Sample Count 31

Cascadia Consulting Group, Inc. B-10 Wisconsin Waste Characterization Study Appendices
COMPARISONS AMONG SUBSTREAM TONNAGES IN NORTHEAST REGION
Table 3-19 – Composition Comparisons among Substreams, Northeast
(Calendar Year 2001)
(Mean Percentage) (Mean Percentage)Material Residential ICI C&D Material Residential ICI C&DPaper 22.3% 21.1% 4.9% C&D 13.7% 17.5% 75.1%
Newsprint 2.4% 1.0% 0.1% Wood - treated 0.1% 0.0% 1.3%High Grade Paper 1.7% 1.1% 0.0% Wood - untreated 10.1% 11.3% 28.2%Magazines/Catalogs 1.7% 0.7% 0.0% Rock/Concrete/Brick 1.3% 1.0% 9.5%Cardboard - recyclable 1.3% 4.1% 3.6% Drywall 1.0% 1.8% 3.0%Cardboard - coated 0.3% 0.1% 0.0% Roofing Shingles 0.0% 0.5% 12.6%Boxboard 1.2% 0.7% 0.0% PVC 0.0% 0.0% 0.1%Mixed Recyclable Paper 5.4% 3.8% 1.0% Ceramics/Porcelain 0.3% 0.1% 0.0%Compostable Paper 6.6% 5.5% 0.1% Other C&D 0.8% 2.8% 20.5%R/C Paper 1.7% 4.1% 0.1% Problem Wastes 9.5% 10.5% 1.6%
Plastics 10.7% 11.2% 3.3% Televisions 1.6% 0.1% 0.0%PET Bottles 0.5% 0.3% 0.0% Computer Monitors 0.0% 1.3% 0.1%HDPE Bottles - natural 0.2% 0.2% 0.0% Computer Equipment 0.3% 0.1% 0.0%HDPE Bottles - colored 0.4% 0.2% 0.0% Electronic Equipment 2.4% 0.5% 0.0%#3-#7 Other Plastic Bottles 0.0% 0.0% 0.0% White Goods - refrigerated 0.0% 0.6% 0.0%Polystyrene 0.5% 0.4% 0.1% White Goods - non-refrigerated 0.7% 0.0% 0.0%Other Rigid Plastic Containers 1.6% 0.9% 0.4% Lead-Acid Batteries 0.0% 0.0% 0.0%Plastic Film 4.4% 5.1% 0.9% Other Household Batteries 0.2% 0.0% 0.0%R/C Plastic 3.2% 4.1% 1.9% Tires 0.0% 0.3% 0.0%
Metal 5.7% 10.0% 6.3% Bulky Items 4.3% 3.5% 1.4%Aluminum Cans 0.4% 0.3% 0.0% Fluorescent Lights 0.0% 0.0% 0.0%Other Aluminum 0.4% 0.1% 0.8% Ballasts 0.0% 0.0% 0.0%Tin Cans 0.9% 0.6% 0.0% Pallets 0.0% 4.0% 0.0%Ferrous Metals 2.8% 7.6% 3.0% Household Hazardous 0.3% 0.2% 0.5%Non-Ferrous Metals 0.1% 0.0% 0.2% Latex Paint 0.0% 0.0% 0.3%R/C Metal 1.1% 1.3% 2.4% Oil Paint 0.0% 0.0% 0.2%
Glass 1.6% 0.6% 5.0% Pesticides/Fertilizers 0.0% 0.0% 0.0%Glass - recyclable 1.0% 0.4% 0.3% Auto Used Oil Filters 0.2% 0.1% 0.0%R/C Glass 0.6% 0.2% 4.7% Mercury 0.0% 0.0% 0.0%
Organics 30.7% 23.2% 1.1% Other Hazardous 0.1% 0.1% 0.0%Yard Waste - <6" 1.9% 1.4% 0.2% Other Wastes 5.5% 5.8% 2.1%Yard Waste - >6" 0.4% 0.2% 0.0% Textiles 3.8% 3.8% 0.4%Food 16.1% 14.7% 0.3% Carpet 1.6% 2.1% 1.7%Diapers 4.5% 1.1% 0.0% Carpet Padding 0.1% 0.0% 0.0%Animal Waste/Kitty Litter 1.9% 0.8% 0.0%Bottom Fines/Dirt 2.7% 1.2% 0.0%R/C Organic 3.2% 3.7% 0.5% Total 100.0% 100.0% 100.0%

Cascadia Consulting Group, Inc. B-11 Wisconsin Waste Characterization Study Appendices
NORTH REGION
Overall
Figure B - 5 – Overview of Composition, North
(Calendar Year 2001)
Other Wastes4.6%
Paper25.6%
Problem Wastes5.2%
C&D22.1%
Organics20.9% Glass
4.7%
Metal4.9%
Plastics11.7%
Household Hazardous
0.1%
Table B - 9 – Top Ten Components, North
(Calendar Year 2001)
Component Mean Cum. % Tons Cum. TonsFood 13.1% 13.1% 42,828 42,828Wood - untreated 11.8% 24.9% 38,841 81,669Mixed Recyclable Paper 5.0% 29.9% 16,357 98,026Plastic Film 5.0% 34.9% 16,353 114,379Newsprint 4.8% 39.7% 15,641 130,020Other C&D 4.3% 44.0% 14,204 144,224Compostable Paper 4.2% 48.2% 13,619 157,843R/C Paper 3.7% 51.9% 12,254 170,097R/C Plastic 3.6% 55.5% 11,912 182,010Cardboard - recyclable 2.9% 58.5% 9,622 191,631
Total 58.5% 191,631

Cascadia Consulting Group, Inc. B-12 Wisconsin Waste Characterization Study Appendices
Table B - 10 – Detailed Composition Profile, North
(Calendar Year 2001)
Calculated at a 90% confidence level
Conf. Interval Conf. IntervalTons Mean Low High Tons Mean Low High
Paper 83,904 25.6% C&D 72,556 22.1%Newsprint 15,641 4.8% 3.2% 6.4% Wood - treated 2,870 0.9% 0.0% 1.8%High Grade Paper 9,606 2.9% 0.0% 6.0% Wood - untreated 38,841 11.8% 8.2% 15.5%Magazines/Catalogs 3,963 1.2% 0.7% 1.7% Rock/Concrete/Brick 4,190 1.3% 0.7% 1.9%Cardboard - recyclable 9,622 2.9% 0.9% 4.9% Drywall 8,153 2.5% 0.7% 4.3%Cardboard - coated 209 0.1% 0.0% 0.2% Roofing Shingles 3,009 0.9% 0.3% 1.6%Boxboard 2,632 0.8% 0.6% 1.0% PVC 560 0.2% 0.1% 0.3%Mixed Recyclable Paper 16,357 5.0% 3.8% 6.2% Ceramics/Porcelain 728 0.2% 0.0% 0.5%Compostable Paper 13,619 4.2% 3.3% 5.0% Other C&D 14,204 4.3% 1.3% 7.4%R/C Paper 12,254 3.7% 0.0% 8.0% Problem Wastes 17,199 5.2%
Plastics 38,463 11.7% Televisions 2,552 0.8% 0.0% 1.8%PET Bottles 2,270 0.7% 0.5% 0.9% Computer Monitors 0 0.0% 0.0% 0.0%HDPE Bottles - natural 834 0.3% 0.2% 0.3% Computer Equipment 528 0.2% 0.0% 0.4%HDPE Bottles - colored 1,346 0.4% 0.3% 0.5% Electronic Equipment 4,284 1.3% 0.6% 2.0%#3-#7 Other Plastic Bottles 0 0.0% 0.0% 0.0% White Goods - refrigerated 0 0.0% 0.0% 0.0%Polystyrene 2,734 0.8% 0.3% 1.4% White Goods - non-refrigerated 0 0.0% 0.0% 0.0%Other Rigid Plastic Containers 3,014 0.9% 0.7% 1.1% Lead-Acid Batteries 7 0.0% 0.0% 0.0%Plastic Film 16,353 5.0% 2.1% 7.9% Other Household Batteries 231 0.1% 0.0% 0.1%R/C Plastic 11,912 3.6% 0.7% 6.5% Tires 291 0.1% 0.0% 0.2%
Metal 16,221 4.9% Bulky Items 5,247 1.6% 0.1% 3.1%Aluminum Cans 2,370 0.7% 0.5% 0.9% Fluorescent Lights 1 0.0% 0.0% 0.0%Other Aluminum 1,068 0.3% 0.1% 0.5% Ballasts 0 0.0% 0.0% 0.0%Tin Cans 3,473 1.1% 0.8% 1.3% Pallets 4,058 1.2% 0.3% 2.2%Ferrous Metals 6,139 1.9% 1.1% 2.6% Household Hazardous 261 0.1%Non-Ferrous Metals 231 0.1% 0.0% 0.2% Latex Paint 123 0.0% 0.0% 0.1%R/C Metal 2,939 0.9% 0.4% 1.4% Oil Paint 69 0.0% 0.0% 0.0%
Glass 15,363 4.7% Pesticides/Fertilizers 0 0.0% 0.0% 0.0%Glass - recyclable 6,770 2.1% 1.4% 2.8% Auto Used Oil Filters 48 0.0% 0.0% 0.0%R/C Glass 8,593 2.6% 0.0% 6.4% Mercury 0 0.0% 0.0% 0.0%
Organics 68,606 20.9% Other Hazardous 21 0.0% 0.0% 0.0%Yard Waste - <6" 864 0.3% 0.1% 0.4% Other Wastes 15,231 4.6%Yard Waste - >6" 0 0.0% 0.0% 0.0% Textiles 7,385 2.3% 1.6% 2.9%Food 42,828 13.1% 10.5% 15.6% Carpet 7,338 2.2% 0.5% 4.0%Diapers 7,596 2.3% 1.3% 3.3% Carpet Padding 509 0.2% 0.0% 0.3%Animal Waste/Kitty Litter 3,464 1.1% 0.3% 1.8%Bottom Fines/Dirt 7,845 2.4% 1.4% 3.4%R/C Organic 6,010 1.8% 0.9% 2.8%
Total Tons 327,802Sample Count 74

Cascadia Consulting Group, Inc. B-13 Wisconsin Waste Characterization Study Appendices
Residential
Figure B - 6 – Overview of Composition, North Residential
(Calendar Year 2001)
Household Hazardous
0.0%
Plastics12.1%
Metal6.4%Glass
3.4%
Organics35.1%
C&D2.9%
Problem Wastes4.1%
Paper28.3%
Other Wastes7.8%
Table B - 11 – Top Ten Components, North Residential
(Calendar Year 2001)
Component Mean Cum. % Tons Cum. TonsFood 22.6% 22.6% 31,261 31,261Newsprint 7.4% 30.0% 10,275 41,536Compostable Paper 6.9% 36.9% 9,495 51,031Mixed Recyclable Paper 6.7% 43.7% 9,329 60,359Plastic Film 5.3% 49.0% 7,375 67,734Bottom Fines/Dirt 4.2% 53.2% 5,820 73,554Textiles 4.1% 57.3% 5,649 79,203Carpet 3.7% 61.0% 5,125 84,328Diapers 3.1% 64.1% 4,329 88,657Glass - recyclable 2.9% 67.0% 4,003 92,660
Total 67.0% 92,660

Cascadia Consulting Group, Inc. B-14 Wisconsin Waste Characterization Study Appendices
Table B - 12 – Detailed Composition Profile, North Residential
(Calendar Year 2001)
Calculated at a 90% confidence level
Conf. Interval Conf. IntervalTons Mean Low High Tons Mean Low High
Paper 39,052 28.3% C&D 4,002 2.9%Newsprint 10,275 7.4% 4.7% 10.1% Wood - treated 120 0.1% 0.0% 0.2%High Grade Paper 1,506 1.1% 0.5% 1.7% Wood - untreated 1,630 1.2% 0.5% 1.8%Magazines/Catalogs 2,494 1.8% 1.1% 2.5% Rock/Concrete/Brick 237 0.2% 0.0% 0.4%Cardboard - recyclable 2,226 1.6% 0.5% 2.7% Drywall 28 0.0% 0.0% 0.1%Cardboard - coated 0 0.0% 0.0% 0.0% Roofing Shingles 74 0.1% 0.0% 0.1%Boxboard 2,014 1.5% 1.1% 1.8% PVC 63 0.0% 0.0% 0.1%Mixed Recyclable Paper 9,329 6.7% 5.3% 8.2% Ceramics/Porcelain 125 0.1% 0.0% 0.2%Compostable Paper 9,495 6.9% 5.5% 8.3% Other C&D 1,725 1.2% 0.0% 2.8%R/C Paper 1,715 1.2% 0.9% 1.6% Problem Wastes 5,622 4.1%
Plastics 16,733 12.1% Televisions 1,973 1.4% 0.0% 3.8%PET Bottles 1,588 1.1% 0.9% 1.4% Computer Monitors 0 0.0% 0.0% 0.0%HDPE Bottles - natural 650 0.5% 0.3% 0.6% Computer Equipment 0 0.0% 0.0% 0.0%HDPE Bottles - colored 987 0.7% 0.5% 0.9% Electronic Equipment 2,712 2.0% 0.5% 3.4%#3-#7 Other Plastic Bottles 0 0.0% 0.0% 0.0% White Goods - refrigerated 0 0.0% 0.0% 0.0%Polystyrene 828 0.6% 0.4% 0.8% White Goods - non-refrigerated 0 0.0% 0.0% 0.0%Other Rigid Plastic Containers 1,872 1.4% 1.1% 1.6% Lead-Acid Batteries 0 0.0% 0.0% 0.0%Plastic Film 7,375 5.3% 2.8% 7.9% Other Household Batteries 168 0.1% 0.0% 0.2%R/C Plastic 3,433 2.5% 1.6% 3.3% Tires 291 0.2% 0.0% 0.6%
Metal 8,821 6.4% Bulky Items 478 0.3% 0.0% 0.6%Aluminum Cans 1,633 1.2% 0.9% 1.5% Fluorescent Lights 1 0.0% 0.0% 0.0%Other Aluminum 475 0.3% 0.2% 0.5% Ballasts 0 0.0% 0.0% 0.0%Tin Cans 2,865 2.1% 1.6% 2.5% Pallets 0 0.0% 0.0% 0.0%Ferrous Metals 2,767 2.0% 0.6% 3.4% Household Hazardous 33 0.0%Non-Ferrous Metals 18 0.0% 0.0% 0.0% Latex Paint 0 0.0% 0.0% 0.0%R/C Metal 1,064 0.8% 0.2% 1.3% Oil Paint 30 0.0% 0.0% 0.1%
Glass 4,633 3.4% Pesticides/Fertilizers 0 0.0% 0.0% 0.0%Glass - recyclable 4,003 2.9% 1.9% 3.9% Auto Used Oil Filters 3 0.0% 0.0% 0.0%R/C Glass 630 0.5% 0.2% 0.7% Mercury 0 0.0% 0.0% 0.0%
Organics 48,505 35.1% Other Hazardous 0 0.0% 0.0% 0.0%Yard Waste - <6" 413 0.3% 0.0% 0.6% Other Wastes 10,822 7.8%Yard Waste - >6" 0 0.0% 0.0% 0.0% Textiles 5,649 4.1% 2.7% 5.4%Food 31,261 22.6% 18.1% 27.1% Carpet 5,125 3.7% 0.0% 7.7%Diapers 4,329 3.1% 1.4% 4.9% Carpet Padding 48 0.0% 0.0% 0.1%Animal Waste/Kitty Litter 2,747 2.0% 0.3% 3.7%Bottom Fines/Dirt 5,820 4.2% 2.0% 6.4%R/C Organic 3,936 2.8% 1.2% 4.5%
Total Tons 138,222Sample Count 22

Cascadia Consulting Group, Inc. B-15 Wisconsin Waste Characterization Study Appendices
Industrial/Commercial/Institutional
Figure B - 7 - Overview of Composition, North ICI
(Calendar Year 2001)
Household Hazardous
0.2%
Plastics15.9%Metal
4.2%
Glass8.2%
Organics15.3%
C&D15.7%
Problem Wastes
5.4%
Paper33.2%
Other Wastes2.0%
Table B - 13 – Top Ten Components, North ICI
(Calendar Year 2001)
Component Mean Cum. % Tons Cum. TonsFood 8.8% 8.8% 11,567 11,567Wood - untreated 8.2% 17.0% 10,755 22,322R/C Paper 7.9% 24.9% 10,353 32,675Plastic Film 6.8% 31.7% 8,857 41,532High Grade Paper 6.2% 37.9% 8,071 49,603Other C&D 6.2% 44.0% 8,067 57,670R/C Glass 6.1% 50.1% 7,964 65,633R/C Plastic 6.1% 56.2% 7,956 73,589Mixed Recyclable Paper 5.3% 61.4% 6,886 80,475Cardboard - recyclable 5.0% 66.4% 6,494 86,969
Total 66.4% 86,969

Cascadia Consulting Group, Inc. B-16 Wisconsin Waste Characterization Study Appendices
Table B - 14 – Detailed Composition Profile, North ICI
(Calendar Year 2001)
Calculated at a 90% confidence level
Conf. Interval Conf. IntervalTons Mean Low High Tons Mean Low High
Paper 43,528 33.2% C&D 20,577 15.7%Newsprint 5,354 4.1% 1.3% 6.9% Wood - treated 441 0.3% 0.0% 0.9%High Grade Paper 8,071 6.2% 0.0% 13.8% Wood - untreated 10,755 8.2% 0.7% 15.8%Magazines/Catalogs 1,470 1.1% 0.2% 2.1% Rock/Concrete/Brick 51 0.0% 0.0% 0.1%Cardboard - recyclable 6,494 5.0% 0.1% 9.8% Drywall 1,158 0.9% 0.0% 2.4%Cardboard - coated 209 0.2% 0.0% 0.4% Roofing Shingles 0 0.0% 0.0% 0.0%Boxboard 566 0.4% 0.2% 0.6% PVC 2 0.0% 0.0% 0.0%Mixed Recyclable Paper 6,886 5.3% 2.7% 7.8% Ceramics/Porcelain 103 0.1% 0.0% 0.2%Compostable Paper 4,124 3.1% 1.8% 4.5% Other C&D 8,067 6.2% 0.0% 13.5%R/C Paper 10,353 7.9% 0.0% 18.5% Problem Wastes 7,087 5.4%
Plastics 20,800 15.9% Televisions 579 0.4% 0.0% 1.2%PET Bottles 675 0.5% 0.2% 0.8% Computer Monitors 0 0.0% 0.0% 0.0%HDPE Bottles - natural 181 0.1% 0.1% 0.2% Computer Equipment 528 0.4% 0.0% 1.1%HDPE Bottles - colored 359 0.3% 0.0% 0.5% Electronic Equipment 1,434 1.1% 0.3% 1.9%#3-#7 Other Plastic Bottles 0 0.0% 0.0% 0.0% White Goods - refrigerated 0 0.0% 0.0% 0.0%Polystyrene 1,874 1.4% 0.0% 2.8% White Goods - non-refrigerated 0 0.0% 0.0% 0.0%Other Rigid Plastic Containers 898 0.7% 0.3% 1.0% Lead-Acid Batteries 7 0.0% 0.0% 0.0%Plastic Film 8,857 6.8% 0.0% 13.6% Other Household Batteries 64 0.0% 0.0% 0.1%R/C Plastic 7,956 6.1% 0.0% 13.2% Tires 0 0.0% 0.0% 0.0%
Metal 5,465 4.2% Bulky Items 1,238 0.9% 0.0% 2.2%Aluminum Cans 731 0.6% 0.2% 0.9% Fluorescent Lights 0 0.0% 0.0% 0.0%Other Aluminum 580 0.4% 0.0% 1.0% Ballasts 0 0.0% 0.0% 0.0%Tin Cans 608 0.5% 0.2% 0.7% Pallets 3,238 2.5% 0.2% 4.7%Ferrous Metals 1,711 1.3% 0.3% 2.3% Household Hazardous 227 0.2%Non-Ferrous Metals 214 0.2% 0.0% 0.4% Latex Paint 123 0.1% 0.0% 0.2%R/C Metal 1,620 1.2% 0.3% 2.2% Oil Paint 38 0.0% 0.0% 0.1%
Glass 10,696 8.2% Pesticides/Fertilizers 0 0.0% 0.0% 0.0%Glass - recyclable 2,732 2.1% 0.7% 3.5% Auto Used Oil Filters 46 0.0% 0.0% 0.1%R/C Glass 7,964 6.1% 0.0% 15.6% Mercury 0 0.0% 0.0% 0.0%
Organics 20,090 15.3% Other Hazardous 20 0.0% 0.0% 0.0%Yard Waste - <6" 451 0.3% 0.0% 0.7% Other Wastes 2,571 2.0%Yard Waste - >6" 0 0.0% 0.0% 0.0% Textiles 1,548 1.2% 0.5% 1.9%Food 11,567 8.8% 4.5% 13.2% Carpet 1,023 0.8% 0.0% 1.7%Diapers 3,256 2.5% 0.8% 4.2% Carpet Padding 0 0.0% 0.0% 0.0%Animal Waste/Kitty Litter 717 0.5% 0.0% 1.1%Bottom Fines/Dirt 2,025 1.5% 0.7% 2.4%R/C Organic 2,074 1.6% 0.0% 3.2%
Total Tons 131,041Sample Count 23

Cascadia Consulting Group, Inc. B-17 Wisconsin Waste Characterization Study Appendices
Construction & Demolition
Figure B - 8 – Overview of Composition, North C&D
(Calendar Year 2001)
Other Wastes3.1%
Paper2.3%
Problem Wastes7.7%
C&D82.0%
Organics0.0%
Glass0.1%
Metal3.3%
Plastics1.6%
Household Hazardous
0.0%
Table B - 15 – Top Ten Components, North C&D
(Calendar Year 2001)
Component Mean Cum. % Tons Cum. TonsWood - untreated 45.2% 45.2% 26,457 26,457Drywall 11.9% 57.1% 6,967 33,424Other C&D 7.5% 64.6% 4,412 37,836Rock/Concrete/Brick 6.7% 71.3% 3,902 41,738Bulky Items 6.0% 77.3% 3,532 45,269Roofing Shingles 5.0% 82.3% 2,935 48,204Wood - treated 3.9% 86.3% 2,308 50,512Ferrous Metals 2.8% 89.1% 1,660 52,173Carpet 2.0% 91.2% 1,190 53,362Cardboard - recyclable 1.5% 92.7% 902 54,264
Total 92.7% 54,264

Cascadia Consulting Group, Inc. B-18 Wisconsin Waste Characterization Study Appendices
Table B - 16 – Detailed Composition Profile, North C&D
(Calendar Year 2001)
Calculated at a 90% confidence level
Conf. Interval Conf. IntervalTons Mean Low High Tons Mean Low High
Paper 1,324 2.3% C&D 47,977 82.0%Newsprint 12 0.0% 0.0% 0.1% Wood - treated 2,308 3.9% 0.0% 9.2%High Grade Paper 30 0.1% 0.0% 0.1% Wood - untreated 26,457 45.2% 33.5% 56.9%Magazines/Catalogs 0 0.0% 0.0% 0.0% Rock/Concrete/Brick 3,902 6.7% 3.3% 10.0%Cardboard - recyclable 902 1.5% 0.5% 2.6% Drywall 6,967 11.9% 2.5% 21.3%Cardboard - coated 0 0.0% 0.0% 0.0% Roofing Shingles 2,935 5.0% 1.3% 8.7%Boxboard 52 0.1% 0.0% 0.2% PVC 495 0.8% 0.2% 1.5%Mixed Recyclable Paper 142 0.2% 0.0% 0.5% Ceramics/Porcelain 500 0.9% 0.0% 2.1%Compostable Paper 0 0.0% 0.0% 0.0% Other C&D 4,412 7.5% 4.5% 10.6%R/C Paper 186 0.3% 0.0% 0.7% Problem Wastes 4,490 7.7%
Plastics 930 1.6% Televisions 0 0.0% 0.0% 0.0%PET Bottles 7 0.0% 0.0% 0.0% Computer Monitors 0 0.0% 0.0% 0.0%HDPE Bottles - natural 3 0.0% 0.0% 0.0% Computer Equipment 0 0.0% 0.0% 0.0%HDPE Bottles - colored 0 0.0% 0.0% 0.0% Electronic Equipment 138 0.2% 0.0% 0.5%#3-#7 Other Plastic Bottles 0 0.0% 0.0% 0.0% White Goods - refrigerated 0 0.0% 0.0% 0.0%Polystyrene 32 0.1% 0.0% 0.1% White Goods - non-refrigerated 0 0.0% 0.0% 0.0%Other Rigid Plastic Containers 244 0.4% 0.0% 0.9% Lead-Acid Batteries 0 0.0% 0.0% 0.0%Plastic Film 122 0.2% 0.0% 0.4% Other Household Batteries 0 0.0% 0.0% 0.0%R/C Plastic 523 0.9% 0.0% 2.3% Tires 0 0.0% 0.0% 0.0%
Metal 1,935 3.3% Bulky Items 3,532 6.0% 0.0% 13.8%Aluminum Cans 7 0.0% 0.0% 0.0% Fluorescent Lights 0 0.0% 0.0% 0.0%Other Aluminum 13 0.0% 0.0% 0.1% Ballasts 0 0.0% 0.0% 0.0%Tin Cans 0 0.0% 0.0% 0.0% Pallets 820 1.4% 0.3% 2.5%Ferrous Metals 1,660 2.8% 1.2% 4.5% Household Hazardous 0 0.0%Non-Ferrous Metals 0 0.0% 0.0% 0.0% Latex Paint 0 0.0% 0.0% 0.0%R/C Metal 256 0.4% 0.0% 1.0% Oil Paint 0 0.0% 0.0% 0.0%
Glass 34 0.1% Pesticides/Fertilizers 0 0.0% 0.0% 0.0%Glass - recyclable 34 0.1% 0.0% 0.2% Auto Used Oil Filters 0 0.0% 0.0% 0.0%R/C Glass 0 0.0% 0.0% 0.0% Mercury 0 0.0% 0.0% 0.0%
Organics 11 0.0% Other Hazardous 0 0.0% 0.0% 0.0%Yard Waste - <6" 0 0.0% 0.0% 0.0% Other Wastes 1,838 3.1%Yard Waste - >6" 0 0.0% 0.0% 0.0% Textiles 188 0.3% 0.0% 0.8%Food 0 0.0% 0.0% 0.0% Carpet 1,190 2.0% 0.3% 3.7%Diapers 11 0.0% 0.0% 0.1% Carpet Padding 461 0.8% 0.0% 1.9%Animal Waste/Kitty Litter 0 0.0% 0.0% 0.0%Bottom Fines/Dirt 0 0.0% 0.0% 0.0%R/C Organic 0 0.0% 0.0% 0.0%
Total Tons 58,539Sample Count 29

Cascadia Consulting Group, Inc. B-19 Wisconsin Waste Characterization Study Appendices
COMPARISONS AMONG SUBSTREAM TONNAGES IN NORTH REGION
Table B-3-20 – Composition Comparisons among Substreams, North
(Calendar Year 2001)
(Mean Percentage) (Mean Percentage)Material Residential ICI C&D Material Residential ICI C&DPaper 28.3% 33.2% 2.3% C&D 2.9% 15.7% 82.0%
Newsprint 7.4% 4.1% 0.0% Wood - treated 0.1% 0.3% 3.9%High Grade Paper 1.1% 6.2% 0.1% Wood - untreated 1.2% 8.2% 45.2%Magazines/Catalogs 1.8% 1.1% 0.0% Rock/Concrete/Brick 0.2% 0.0% 6.7%Cardboard - recyclable 1.6% 5.0% 1.5% Drywall 0.0% 0.9% 11.9%Cardboard - coated 0.0% 0.2% 0.0% Roofing Shingles 0.1% 0.0% 5.0%Boxboard 1.5% 0.4% 0.1% PVC 0.0% 0.0% 0.8%Mixed Recyclable Paper 6.7% 5.3% 0.2% Ceramics/Porcelain 0.1% 0.1% 0.9%Compostable Paper 6.9% 3.1% 0.0% Other C&D 1.2% 6.2% 7.5%R/C Paper 1.2% 7.9% 0.3% Problem Wastes 4.1% 5.4% 7.7%
Plastics 12.1% 15.9% 1.6% Televisions 1.4% 0.4% 0.0%PET Bottles 1.1% 0.5% 0.0% Computer Monitors 0.0% 0.0% 0.0%HDPE Bottles - natural 0.5% 0.1% 0.0% Computer Equipment 0.0% 0.4% 0.0%HDPE Bottles - colored 0.7% 0.3% 0.0% Electronic Equipment 2.0% 1.1% 0.2%#3-#7 Other Plastic Bottles 0.0% 0.0% 0.0% White Goods - refrigerated 0.0% 0.0% 0.0%Polystyrene 0.6% 1.4% 0.1% White Goods - non-refrigerated 0.0% 0.0% 0.0%Other Rigid Plastic Containers 1.4% 0.7% 0.4% Lead-Acid Batteries 0.0% 0.0% 0.0%Plastic Film 5.3% 6.8% 0.2% Other Household Batteries 0.1% 0.0% 0.0%R/C Plastic 2.5% 6.1% 0.9% Tires 0.2% 0.0% 0.0%
Metal 6.4% 4.2% 3.3% Bulky Items 0.3% 0.9% 6.0%Aluminum Cans 1.2% 0.6% 0.0% Fluorescent Lights 0.0% 0.0% 0.0%Other Aluminum 0.3% 0.4% 0.0% Ballasts 0.0% 0.0% 0.0%Tin Cans 2.1% 0.5% 0.0% Pallets 0.0% 2.5% 1.4%Ferrous Metals 2.0% 1.3% 2.8% Household Hazardous 0.0% 0.2% 0.0%Non-Ferrous Metals 0.0% 0.2% 0.0% Latex Paint 0.0% 0.1% 0.0%R/C Metal 0.8% 1.2% 0.4% Oil Paint 0.0% 0.0% 0.0%
Glass 3.4% 8.2% 0.1% Pesticides/Fertilizers 0.0% 0.0% 0.0%Glass - recyclable 2.9% 2.1% 0.1% Auto Used Oil Filters 0.0% 0.0% 0.0%R/C Glass 0.5% 6.1% 0.0% Mercury 0.0% 0.0% 0.0%
Organics 35.1% 15.3% 0.0% Other Hazardous 0.0% 0.0% 0.0%Yard Waste - <6" 0.3% 0.3% 0.0% Other Wastes 7.8% 2.0% 3.1%Yard Waste - >6" 0.0% 0.0% 0.0% Textiles 4.1% 1.2% 0.3%Food 22.6% 8.8% 0.0% Carpet 3.7% 0.8% 2.0%Diapers 3.1% 2.5% 0.0% Carpet Padding 0.0% 0.0% 0.8%Animal Waste/Kitty Litter 2.0% 0.5% 0.0%Bottom Fines/Dirt 4.2% 1.5% 0.0%R/C Organic 2.8% 1.6% 0.0% Total 100.0% 100.0% 100.0%

Cascadia Consulting Group, Inc. B-20 Wisconsin Waste Characterization Study Appendices
SOUTH CENTRAL REGION
Overall
Figure B - 9 – Overview of Composition, South central
(Calendar Year 2001)
Household Hazardous
0.6%
Plastics10.9%
Metal4.6%
Glass1.2%Organics
18.4%
C&D31.3%
Problem Wastes7.7%
Paper22.2%
Other Wastes3.0%
Table B - 17 – Top Ten Components, South central
(Calendar Year 2001)
Component Mean Cum. % Tons Cum. TonsRoofing Shingles 11.7% 11.7% 109,258 109,258Food 11.3% 23.0% 105,369 214,627Wood - untreated 11.2% 34.2% 104,463 319,089Mixed Recyclable Paper 5.3% 39.5% 49,714 368,804Compostable Paper 5.3% 44.8% 49,538 418,341R/C Plastic 4.1% 48.8% 38,029 456,370Plastic Film 4.0% 52.9% 37,710 494,080Cardboard - recyclable 3.1% 56.0% 29,227 523,307Bulky Items 3.1% 59.1% 28,631 551,937Ferrous Metals 3.0% 62.0% 27,792 579,729
Total 62.0% 579,729
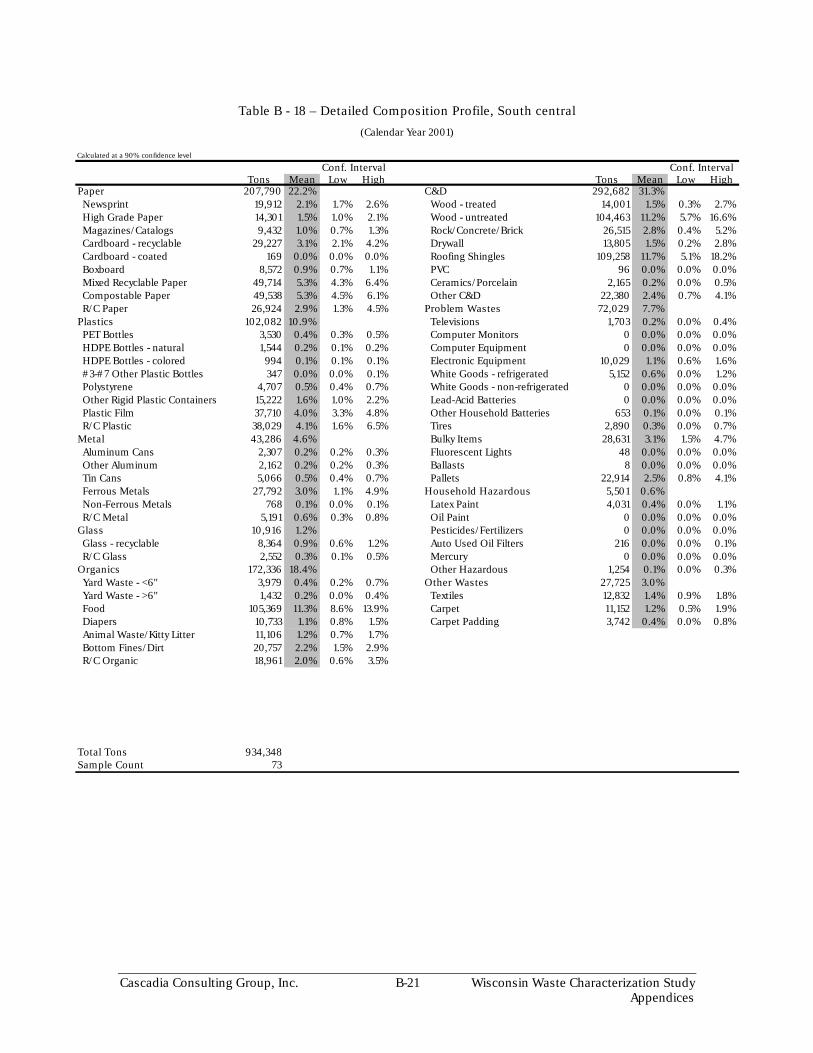
Cascadia Consulting Group, Inc. B-21 Wisconsin Waste Characterization Study Appendices
Table B - 18 – Detailed Composition Profile, South central
(Calendar Year 2001)
Calculated at a 90% confidence level
Conf. Interval Conf. IntervalTons Mean Low High Tons Mean Low High
Paper 207,790 22.2% C&D 292,682 31.3%Newsprint 19,912 2.1% 1.7% 2.6% Wood - treated 14,001 1.5% 0.3% 2.7%High Grade Paper 14,301 1.5% 1.0% 2.1% Wood - untreated 104,463 11.2% 5.7% 16.6%Magazines/Catalogs 9,432 1.0% 0.7% 1.3% Rock/Concrete/Brick 26,515 2.8% 0.4% 5.2%Cardboard - recyclable 29,227 3.1% 2.1% 4.2% Drywall 13,805 1.5% 0.2% 2.8%Cardboard - coated 169 0.0% 0.0% 0.0% Roofing Shingles 109,258 11.7% 5.1% 18.2%Boxboard 8,572 0.9% 0.7% 1.1% PVC 96 0.0% 0.0% 0.0%Mixed Recyclable Paper 49,714 5.3% 4.3% 6.4% Ceramics/Porcelain 2,165 0.2% 0.0% 0.5%Compostable Paper 49,538 5.3% 4.5% 6.1% Other C&D 22,380 2.4% 0.7% 4.1%R/C Paper 26,924 2.9% 1.3% 4.5% Problem Wastes 72,029 7.7%
Plastics 102,082 10.9% Televisions 1,703 0.2% 0.0% 0.4%PET Bottles 3,530 0.4% 0.3% 0.5% Computer Monitors 0 0.0% 0.0% 0.0%HDPE Bottles - natural 1,544 0.2% 0.1% 0.2% Computer Equipment 0 0.0% 0.0% 0.0%HDPE Bottles - colored 994 0.1% 0.1% 0.1% Electronic Equipment 10,029 1.1% 0.6% 1.6%#3-#7 Other Plastic Bottles 347 0.0% 0.0% 0.1% White Goods - refrigerated 5,152 0.6% 0.0% 1.2%Polystyrene 4,707 0.5% 0.4% 0.7% White Goods - non-refrigerated 0 0.0% 0.0% 0.0%Other Rigid Plastic Containers 15,222 1.6% 1.0% 2.2% Lead-Acid Batteries 0 0.0% 0.0% 0.0%Plastic Film 37,710 4.0% 3.3% 4.8% Other Household Batteries 653 0.1% 0.0% 0.1%R/C Plastic 38,029 4.1% 1.6% 6.5% Tires 2,890 0.3% 0.0% 0.7%
Metal 43,286 4.6% Bulky Items 28,631 3.1% 1.5% 4.7%Aluminum Cans 2,307 0.2% 0.2% 0.3% Fluorescent Lights 48 0.0% 0.0% 0.0%Other Aluminum 2,162 0.2% 0.2% 0.3% Ballasts 8 0.0% 0.0% 0.0%Tin Cans 5,066 0.5% 0.4% 0.7% Pallets 22,914 2.5% 0.8% 4.1%Ferrous Metals 27,792 3.0% 1.1% 4.9% Household Hazardous 5,501 0.6%Non-Ferrous Metals 768 0.1% 0.0% 0.1% Latex Paint 4,031 0.4% 0.0% 1.1%R/C Metal 5,191 0.6% 0.3% 0.8% Oil Paint 0 0.0% 0.0% 0.0%
Glass 10,916 1.2% Pesticides/Fertilizers 0 0.0% 0.0% 0.0%Glass - recyclable 8,364 0.9% 0.6% 1.2% Auto Used Oil Filters 216 0.0% 0.0% 0.1%R/C Glass 2,552 0.3% 0.1% 0.5% Mercury 0 0.0% 0.0% 0.0%
Organics 172,336 18.4% Other Hazardous 1,254 0.1% 0.0% 0.3%Yard Waste - <6" 3,979 0.4% 0.2% 0.7% Other Wastes 27,725 3.0%Yard Waste - >6" 1,432 0.2% 0.0% 0.4% Textiles 12,832 1.4% 0.9% 1.8%Food 105,369 11.3% 8.6% 13.9% Carpet 11,152 1.2% 0.5% 1.9%Diapers 10,733 1.1% 0.8% 1.5% Carpet Padding 3,742 0.4% 0.0% 0.8%Animal Waste/Kitty Litter 11,106 1.2% 0.7% 1.7%Bottom Fines/Dirt 20,757 2.2% 1.5% 2.9%R/C Organic 18,961 2.0% 0.6% 3.5%
Total Tons 934,348Sample Count 73

Cascadia Consulting Group, Inc. B-22 Wisconsin Waste Characterization Study Appendices
Residential
Figure B - 10 – Overview of Composition, South central Residential
(Calendar Year 2001)
Household Hazardous
0.1%
Plastics11.3%Metal
3.6%Glass2.2%
Organics27.7%
C&D6.2%
Problem Wastes
5.8%Paper36.1%
Other Wastes7.0%
Table B - 19 – Top Ten Components, South central Residential
(Calendar Year 2001)
Component Mean Cum. % Tons Cum. TonsFood 15.1% 15.1% 46,640 46,640Mixed Recyclable Paper 10.8% 25.9% 33,136 79,776Compostable Paper 8.8% 34.7% 26,955 106,731Newsprint 5.2% 39.9% 16,035 122,766Plastic Film 5.2% 45.1% 15,977 138,743Bottom Fines/Dirt 3.6% 48.7% 11,217 149,960Bulky Items 3.5% 52.2% 10,645 160,604Animal Waste/Kitty Litter 3.4% 55.5% 10,368 170,973Wood - untreated 3.3% 58.9% 10,211 181,184Carpet 3.2% 62.1% 9,868 191,051
Total 62.1% 191,051

Cascadia Consulting Group, Inc. B-23 Wisconsin Waste Characterization Study Appendices
Table B - 20 – Detailed Composition Profile, South central Residential
(Calendar Year 2001)
Calculated at a 90% confidence level
Conf. Interval Conf. IntervalTons Mean Low High Tons Mean Low High
Paper 110,989 36.1% C&D 19,050 6.2%Newsprint 16,035 5.2% 3.9% 6.5% Wood - treated 1,096 0.4% 0.0% 0.9%High Grade Paper 7,132 2.3% 1.1% 3.5% Wood - untreated 10,211 3.3% 0.1% 6.5%Magazines/Catalogs 7,275 2.4% 1.6% 3.1% Rock/Concrete/Brick 1,144 0.4% 0.0% 0.9%Cardboard - recyclable 7,021 2.3% 1.5% 3.1% Drywall 3,029 1.0% 0.0% 2.4%Cardboard - coated 0 0.0% 0.0% 0.0% Roofing Shingles 0 0.0% 0.0% 0.0%Boxboard 6,060 2.0% 1.6% 2.4% PVC 87 0.0% 0.0% 0.1%Mixed Recyclable Paper 33,136 10.8% 8.4% 13.1% Ceramics/Porcelain 1,779 0.6% 0.0% 1.5%Compostable Paper 26,955 8.8% 7.6% 9.9% Other C&D 1,703 0.6% 0.0% 1.3%R/C Paper 7,376 2.4% 1.6% 3.2% Problem Wastes 17,979 5.8%
Plastics 34,663 11.3% Televisions 1,703 0.6% 0.0% 1.2%PET Bottles 1,583 0.5% 0.4% 0.6% Computer Monitors 0 0.0% 0.0% 0.0%HDPE Bottles - natural 1,212 0.4% 0.2% 0.6% Computer Equipment 0 0.0% 0.0% 0.0%HDPE Bottles - colored 588 0.2% 0.1% 0.2% Electronic Equipment 5,043 1.6% 0.7% 2.5%#3-#7 Other Plastic Bottles 148 0.0% 0.0% 0.1% White Goods - refrigerated 0 0.0% 0.0% 0.0%Polystyrene 1,610 0.5% 0.4% 0.6% White Goods - non-refrigerated 0 0.0% 0.0% 0.0%Other Rigid Plastic Containers 6,203 2.0% 1.4% 2.6% Lead-Acid Batteries 0 0.0% 0.0% 0.0%Plastic Film 15,977 5.2% 4.5% 5.9% Other Household Batteries 540 0.2% 0.1% 0.3%R/C Plastic 7,342 2.4% 1.9% 2.8% Tires 0 0.0% 0.0% 0.0%
Metal 11,025 3.6% Bulky Items 10,645 3.5% 1.1% 5.8%Aluminum Cans 874 0.3% 0.2% 0.4% Fluorescent Lights 40 0.0% 0.0% 0.0%Other Aluminum 1,064 0.3% 0.3% 0.4% Ballasts 8 0.0% 0.0% 0.0%Tin Cans 2,843 0.9% 0.4% 1.4% Pallets 0 0.0% 0.0% 0.0%Ferrous Metals 3,085 1.0% 0.3% 1.7% Household Hazardous 358 0.1%Non-Ferrous Metals 484 0.2% 0.0% 0.3% Latex Paint 215 0.1% 0.0% 0.2%R/C Metal 2,674 0.9% 0.3% 1.4% Oil Paint 0 0.0% 0.0% 0.0%
Glass 6,881 2.2% Pesticides/Fertilizers 0 0.0% 0.0% 0.0%Glass - recyclable 5,467 1.8% 0.9% 2.7% Auto Used Oil Filters 0 0.0% 0.0% 0.0%R/C Glass 1,414 0.5% 0.0% 0.9% Mercury 0 0.0% 0.0% 0.0%
Organics 85,237 27.7% Other Hazardous 143 0.0% 0.0% 0.1%Yard Waste - <6" 3,010 1.0% 0.3% 1.7% Other Wastes 21,684 7.0%Yard Waste - >6" 0 0.0% 0.0% 0.0% Textiles 9,295 3.0% 2.0% 4.1%Food 46,640 15.1% 12.5% 17.8% Carpet 9,868 3.2% 1.1% 5.3%Diapers 8,601 2.8% 1.8% 3.8% Carpet Padding 2,521 0.8% 0.0% 1.9%Animal Waste/Kitty Litter 10,368 3.4% 1.9% 4.8%Bottom Fines/Dirt 11,217 3.6% 2.2% 5.1%R/C Organic 5,401 1.8% 1.0% 2.5%
Total Tons 307,865Sample Count 19

Cascadia Consulting Group, Inc. B-24 Wisconsin Waste Characterization Study Appendices
Industrial/Commercial/Institutional
Figure B - 11 – Overview of Composition, South central ICI
(Calendar Year 2001)
Household Hazardous
0.1%
Plastics17.2%
Metal7.2%Glass
1.1%
Organics23.5%
C&D14.0%
Problem Wastes11.9% Paper
23.5%
Other Wastes1.6%
Table B - 21 – Top Ten Components, South central ICI
(Calendar Year 2001)
Component Mean Cum. % Tons Cum. TonsFood 15.8% 15.8% 58,729 58,729R/C Plastic 8.1% 24.0% 30,248 88,977Wood - untreated 6.6% 30.5% 24,377 113,355Compostable Paper 5.8% 36.4% 21,643 134,998Plastic Film 5.8% 42.2% 21,498 156,496Ferrous Metals 5.3% 47.5% 19,855 176,351Bulky Items 4.8% 52.4% 17,986 194,337R/C Paper 4.8% 57.1% 17,657 211,994Mixed Recyclable Paper 4.4% 61.5% 16,222 228,216Cardboard - recyclable 4.3% 65.8% 16,012 244,228
Total 65.8% 244,228
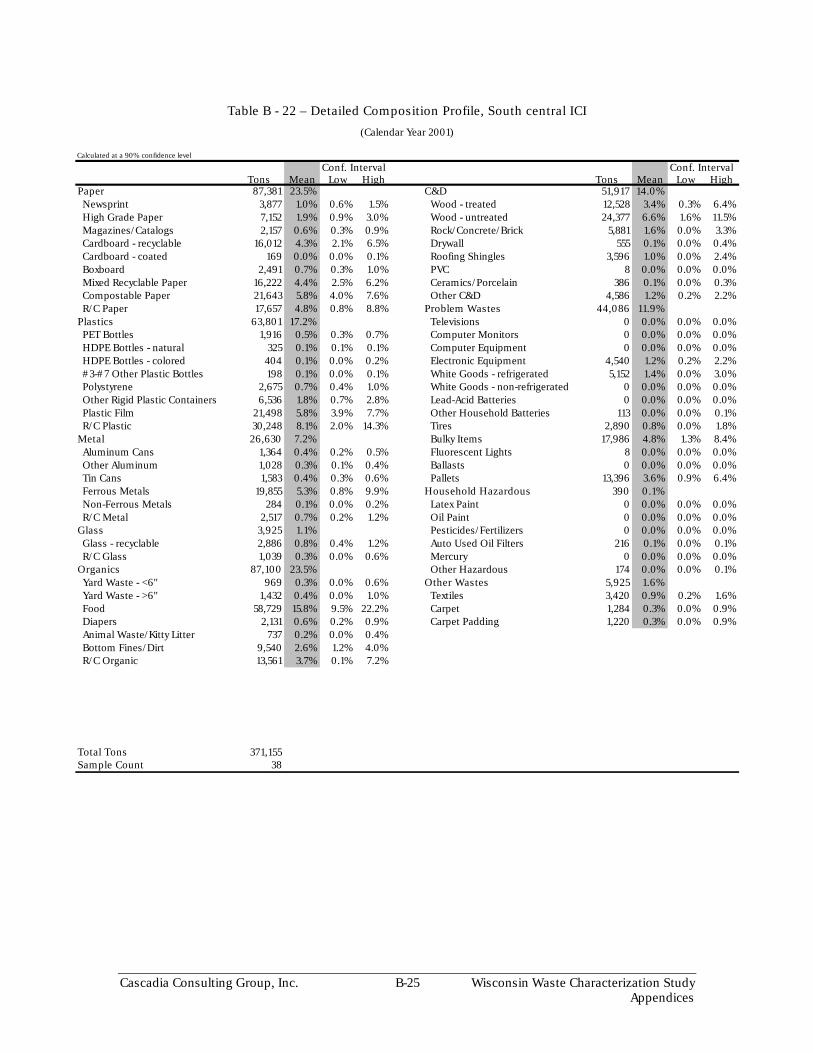
Cascadia Consulting Group, Inc. B-25 Wisconsin Waste Characterization Study Appendices
Table B - 22 – Detailed Composition Profile, South central ICI
(Calendar Year 2001)
Calculated at a 90% confidence level
Conf. Interval Conf. IntervalTons Mean Low High Tons Mean Low High
Paper 87,381 23.5% C&D 51,917 14.0%Newsprint 3,877 1.0% 0.6% 1.5% Wood - treated 12,528 3.4% 0.3% 6.4%High Grade Paper 7,152 1.9% 0.9% 3.0% Wood - untreated 24,377 6.6% 1.6% 11.5%Magazines/Catalogs 2,157 0.6% 0.3% 0.9% Rock/Concrete/Brick 5,881 1.6% 0.0% 3.3%Cardboard - recyclable 16,012 4.3% 2.1% 6.5% Drywall 555 0.1% 0.0% 0.4%Cardboard - coated 169 0.0% 0.0% 0.1% Roofing Shingles 3,596 1.0% 0.0% 2.4%Boxboard 2,491 0.7% 0.3% 1.0% PVC 8 0.0% 0.0% 0.0%Mixed Recyclable Paper 16,222 4.4% 2.5% 6.2% Ceramics/Porcelain 386 0.1% 0.0% 0.3%Compostable Paper 21,643 5.8% 4.0% 7.6% Other C&D 4,586 1.2% 0.2% 2.2%R/C Paper 17,657 4.8% 0.8% 8.8% Problem Wastes 44,086 11.9%
Plastics 63,801 17.2% Televisions 0 0.0% 0.0% 0.0%PET Bottles 1,916 0.5% 0.3% 0.7% Computer Monitors 0 0.0% 0.0% 0.0%HDPE Bottles - natural 325 0.1% 0.1% 0.1% Computer Equipment 0 0.0% 0.0% 0.0%HDPE Bottles - colored 404 0.1% 0.0% 0.2% Electronic Equipment 4,540 1.2% 0.2% 2.2%#3-#7 Other Plastic Bottles 198 0.1% 0.0% 0.1% White Goods - refrigerated 5,152 1.4% 0.0% 3.0%Polystyrene 2,675 0.7% 0.4% 1.0% White Goods - non-refrigerated 0 0.0% 0.0% 0.0%Other Rigid Plastic Containers 6,536 1.8% 0.7% 2.8% Lead-Acid Batteries 0 0.0% 0.0% 0.0%Plastic Film 21,498 5.8% 3.9% 7.7% Other Household Batteries 113 0.0% 0.0% 0.1%R/C Plastic 30,248 8.1% 2.0% 14.3% Tires 2,890 0.8% 0.0% 1.8%
Metal 26,630 7.2% Bulky Items 17,986 4.8% 1.3% 8.4%Aluminum Cans 1,364 0.4% 0.2% 0.5% Fluorescent Lights 8 0.0% 0.0% 0.0%Other Aluminum 1,028 0.3% 0.1% 0.4% Ballasts 0 0.0% 0.0% 0.0%Tin Cans 1,583 0.4% 0.3% 0.6% Pallets 13,396 3.6% 0.9% 6.4%Ferrous Metals 19,855 5.3% 0.8% 9.9% Household Hazardous 390 0.1%Non-Ferrous Metals 284 0.1% 0.0% 0.2% Latex Paint 0 0.0% 0.0% 0.0%R/C Metal 2,517 0.7% 0.2% 1.2% Oil Paint 0 0.0% 0.0% 0.0%
Glass 3,925 1.1% Pesticides/Fertilizers 0 0.0% 0.0% 0.0%Glass - recyclable 2,886 0.8% 0.4% 1.2% Auto Used Oil Filters 216 0.1% 0.0% 0.1%R/C Glass 1,039 0.3% 0.0% 0.6% Mercury 0 0.0% 0.0% 0.0%
Organics 87,100 23.5% Other Hazardous 174 0.0% 0.0% 0.1%Yard Waste - <6" 969 0.3% 0.0% 0.6% Other Wastes 5,925 1.6%Yard Waste - >6" 1,432 0.4% 0.0% 1.0% Textiles 3,420 0.9% 0.2% 1.6%Food 58,729 15.8% 9.5% 22.2% Carpet 1,284 0.3% 0.0% 0.9%Diapers 2,131 0.6% 0.2% 0.9% Carpet Padding 1,220 0.3% 0.0% 0.9%Animal Waste/Kitty Litter 737 0.2% 0.0% 0.4%Bottom Fines/Dirt 9,540 2.6% 1.2% 4.0%R/C Organic 13,561 3.7% 0.1% 7.2%
Total Tons 371,155Sample Count 38

Cascadia Consulting Group, Inc. B-26 Wisconsin Waste Characterization Study Appendices
Construction & Demolition
Figure B - 12 – Overview of Composition, South central C&D
(Calendar Year 2001)
Other Wastes0.0%
Paper3.7%
Problem Wastes
3.9%
C&D86.8%
Organics0.0%
Glass0.0%
Metal2.2%
Plastics1.4%
Household Hazardous
1.9%
Table B - 23 – Top Ten Components, South central C&D
(Calendar Year 2001)
Component Mean Cum. % Tons Cum. TonsRoofing Shingles 41.4% 41.4% 105,662 105,662Wood - untreated 27.4% 68.7% 69,874 175,537Rock/Concrete/Brick 7.6% 76.4% 19,489 195,026Other C&D 6.3% 82.7% 16,091 211,117Drywall 4.0% 86.7% 10,221 221,338Pallets 3.7% 90.4% 9,518 230,856Cardboard - recyclable 2.4% 92.8% 6,194 237,050Ferrous Metals 1.9% 94.7% 4,852 241,902Latex Paint 1.5% 96.2% 3,816 245,718Other Rigid Plastic Containers 1.0% 97.2% 2,484 248,202
Total 97.2% 248,202

Cascadia Consulting Group, Inc. B-27 Wisconsin Waste Characterization Study Appendices
Table B - 24 – Detailed Composition Profile, South central C&D
(Calendar Year 2001)
Calculated at a 90% confidence level
Conf. Interval Conf. IntervalTons Mean Low High Tons Mean Low High
Paper 9,420 3.7% C&D 221,715 86.8%Newsprint 0 0.0% 0.0% 0.0% Wood - treated 377 0.1% 0.0% 0.4%High Grade Paper 18 0.0% 0.0% 0.0% Wood - untreated 69,874 27.4% 9.2% 45.5%Magazines/Catalogs 0 0.0% 0.0% 0.0% Rock/Concrete/Brick 19,489 7.6% 0.0% 16.0%Cardboard - recyclable 6,194 2.4% 0.6% 4.2% Drywall 10,221 4.0% 0.0% 8.4%Cardboard - coated 0 0.0% 0.0% 0.0% Roofing Shingles 105,662 41.4% 17.5% 65.2%Boxboard 22 0.0% 0.0% 0.0% PVC 0 0.0% 0.0% 0.0%Mixed Recyclable Paper 356 0.1% 0.0% 0.3% Ceramics/Porcelain 0 0.0% 0.0% 0.0%Compostable Paper 939 0.4% 0.0% 1.0% Other C&D 16,091 6.3% 0.3% 12.3%R/C Paper 1,892 0.7% 0.0% 1.4% Problem Wastes 9,964 3.9%
Plastics 3,619 1.4% Televisions 0 0.0% 0.0% 0.0%PET Bottles 31 0.0% 0.0% 0.0% Computer Monitors 0 0.0% 0.0% 0.0%HDPE Bottles - natural 6 0.0% 0.0% 0.0% Computer Equipment 0 0.0% 0.0% 0.0%HDPE Bottles - colored 2 0.0% 0.0% 0.0% Electronic Equipment 446 0.2% 0.0% 0.5%#3-#7 Other Plastic Bottles 0 0.0% 0.0% 0.0% White Goods - refrigerated 0 0.0% 0.0% 0.0%Polystyrene 423 0.2% 0.0% 0.4% White Goods - non-refrigerated 0 0.0% 0.0% 0.0%Other Rigid Plastic Containers 2,484 1.0% 0.0% 2.3% Lead-Acid Batteries 0 0.0% 0.0% 0.0%Plastic Film 235 0.1% 0.0% 0.2% Other Household Batteries 0 0.0% 0.0% 0.0%R/C Plastic 438 0.2% 0.0% 0.4% Tires 0 0.0% 0.0% 0.0%
Metal 5,631 2.2% Bulky Items 0 0.0% 0.0% 0.0%Aluminum Cans 69 0.0% 0.0% 0.0% Fluorescent Lights 0 0.0% 0.0% 0.0%Other Aluminum 69 0.0% 0.0% 0.1% Ballasts 0 0.0% 0.0% 0.0%Tin Cans 640 0.3% 0.0% 0.5% Pallets 9,518 3.7% 0.0% 8.3%Ferrous Metals 4,852 1.9% 0.0% 4.0% Household Hazardous 4,753 1.9%Non-Ferrous Metals 0 0.0% 0.0% 0.0% Latex Paint 3,816 1.5% 0.0% 4.0%R/C Metal 0 0.0% 0.0% 0.0% Oil Paint 0 0.0% 0.0% 0.0%
Glass 110 0.0% Pesticides/Fertilizers 0 0.0% 0.0% 0.0%Glass - recyclable 10 0.0% 0.0% 0.0% Auto Used Oil Filters 0 0.0% 0.0% 0.0%R/C Glass 100 0.0% 0.0% 0.1% Mercury 0 0.0% 0.0% 0.0%
Organics 0 0.0% Other Hazardous 937 0.4% 0.0% 1.0%Yard Waste - <6" 0 0.0% 0.0% 0.0% Other Wastes 117 0.0%Yard Waste - >6" 0 0.0% 0.0% 0.0% Textiles 117 0.0% 0.0% 0.1%Food 0 0.0% 0.0% 0.0% Carpet 0 0.0% 0.0% 0.0%Diapers 0 0.0% 0.0% 0.0% Carpet Padding 0 0.0% 0.0% 0.0%Animal Waste/Kitty Litter 0 0.0% 0.0% 0.0%Bottom Fines/Dirt 0 0.0% 0.0% 0.0%R/C Organic 0 0.0% 0.0% 0.0%
Total Tons 255,328Sample Count 16

Cascadia Consulting Group, Inc. B-28 Wisconsin Waste Characterization Study Appendices
COMPARISONS AMONG SUBSTREAM TONNAGES IN SOUTH CENTRAL REGION
Table B-3-21 – Composition Comparisons among Substreams, South central
(Calendar Year 2001)
(Mean Percentage) (Mean Percentage)Material Residential ICI C&D Material Residential ICI C&DPaper 36.1% 23.5% 3.7% C&D 6.2% 14.0% 86.8%
Newsprint 5.2% 1.0% 0.0% Wood - treated 0.4% 3.4% 0.1%High Grade Paper 2.3% 1.9% 0.0% Wood - untreated 3.3% 6.6% 27.4%Magazines/Catalogs 2.4% 0.6% 0.0% Rock/Concrete/Brick 0.4% 1.6% 7.6%Cardboard - recyclable 2.3% 4.3% 2.4% Drywall 1.0% 0.1% 4.0%Cardboard - coated 0.0% 0.0% 0.0% Roofing Shingles 0.0% 1.0% 41.4%Boxboard 2.0% 0.7% 0.0% PVC 0.0% 0.0% 0.0%Mixed Recyclable Paper 10.8% 4.4% 0.1% Ceramics/Porcelain 0.6% 0.1% 0.0%Compostable Paper 8.8% 5.8% 0.4% Other C&D 0.6% 1.2% 6.3%R/C Paper 2.4% 4.8% 0.7% Problem Wastes 5.8% 11.9% 3.9%
Plastics 11.3% 17.2% 1.4% Televisions 0.6% 0.0% 0.0%PET Bottles 0.5% 0.5% 0.0% Computer Monitors 0.0% 0.0% 0.0%HDPE Bottles - natural 0.4% 0.1% 0.0% Computer Equipment 0.0% 0.0% 0.0%HDPE Bottles - colored 0.2% 0.1% 0.0% Electronic Equipment 1.6% 1.2% 0.2%#3-#7 Other Plastic Bottles 0.0% 0.1% 0.0% White Goods - refrigerated 0.0% 1.4% 0.0%Polystyrene 0.5% 0.7% 0.2% White Goods - non-refrigerated 0.0% 0.0% 0.0%Other Rigid Plastic Containers 2.0% 1.8% 1.0% Lead-Acid Batteries 0.0% 0.0% 0.0%Plastic Film 5.2% 5.8% 0.1% Other Household Batteries 0.2% 0.0% 0.0%R/C Plastic 2.4% 8.1% 0.2% Tires 0.0% 0.8% 0.0%
Metal 3.6% 7.2% 2.2% Bulky Items 3.5% 4.8% 0.0%Aluminum Cans 0.3% 0.4% 0.0% Fluorescent Lights 0.0% 0.0% 0.0%Other Aluminum 0.3% 0.3% 0.0% Ballasts 0.0% 0.0% 0.0%Tin Cans 0.9% 0.4% 0.3% Pallets 0.0% 3.6% 3.7%Ferrous Metals 1.0% 5.3% 1.9% Household Hazardous 0.1% 0.1% 1.9%Non-Ferrous Metals 0.2% 0.1% 0.0% Latex Paint 0.1% 0.0% 1.5%R/C Metal 0.9% 0.7% 0.0% Oil Paint 0.0% 0.0% 0.0%
Glass 2.2% 1.1% 0.0% Pesticides/Fertilizers 0.0% 0.0% 0.0%Glass - recyclable 1.8% 0.8% 0.0% Auto Used Oil Filters 0.0% 0.1% 0.0%R/C Glass 0.5% 0.3% 0.0% Mercury 0.0% 0.0% 0.0%
Organics 27.7% 23.5% 0.0% Other Hazardous 0.0% 0.0% 0.4%Yard Waste - <6" 1.0% 0.3% 0.0% Other Wastes 7.0% 1.6% 0.0%Yard Waste - >6" 0.0% 0.4% 0.0% Textiles 3.0% 0.9% 0.0%Food 15.1% 15.8% 0.0% Carpet 3.2% 0.3% 0.0%Diapers 2.8% 0.6% 0.0% Carpet Padding 0.8% 0.3% 0.0%Animal Waste/Kitty Litter 3.4% 0.2% 0.0%Bottom Fines/Dirt 3.6% 2.6% 0.0%R/C Organic 1.8% 3.7% 0.0% Total 100.0% 100.0% 100.0%
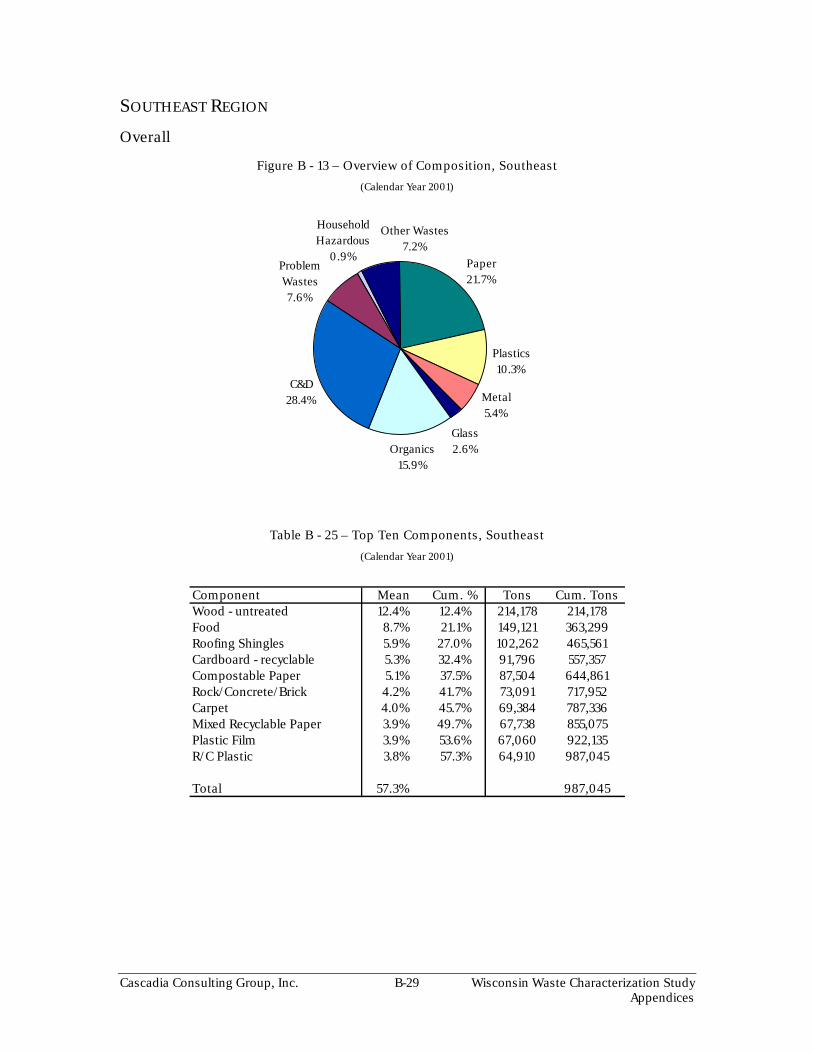
Cascadia Consulting Group, Inc. B-29 Wisconsin Waste Characterization Study Appendices
SOUTHEAST REGION
Overall
Figure B - 13 – Overview of Composition, Southeast
(Calendar Year 2001)
Other Wastes7.2%
Paper21.7%
Problem Wastes7.6%
C&D28.4%
Organics15.9%
Glass2.6%
Metal5.4%
Plastics10.3%
Household Hazardous
0.9%
Table B - 25 – Top Ten Components, Southeast
(Calendar Year 2001)
Component Mean Cum. % Tons Cum. TonsWood - untreated 12.4% 12.4% 214,178 214,178Food 8.7% 21.1% 149,121 363,299Roofing Shingles 5.9% 27.0% 102,262 465,561Cardboard - recyclable 5.3% 32.4% 91,796 557,357Compostable Paper 5.1% 37.5% 87,504 644,861Rock/Concrete/Brick 4.2% 41.7% 73,091 717,952Carpet 4.0% 45.7% 69,384 787,336Mixed Recyclable Paper 3.9% 49.7% 67,738 855,075Plastic Film 3.9% 53.6% 67,060 922,135R/C Plastic 3.8% 57.3% 64,910 987,045
Total 57.3% 987,045

Cascadia Consulting Group, Inc. B-30 Wisconsin Waste Characterization Study Appendices
Table B - 26 – Detailed Composition Profile, Southeast
(Calendar Year 2001)
Calculated at a 90% confidence level
Conf. Interval Conf. IntervalTons Mean Low High Tons Mean Low High
Paper 374,332 21.7% C&D 488,463 28.4%Newsprint 33,337 1.9% 1.4% 2.4% Wood - treated 23,032 1.3% 0.2% 2.5%High Grade Paper 23,509 1.4% 1.0% 1.8% Wood - untreated 214,178 12.4% 8.5% 16.4%Magazines/Catalogs 16,827 1.0% 0.7% 1.3% Rock/Concrete/Brick 73,091 4.2% 1.4% 7.1%Cardboard - recyclable 91,796 5.3% 3.1% 7.5% Drywall 29,955 1.7% 0.6% 2.9%Cardboard - coated 6,810 0.4% 0.0% 0.8% Roofing Shingles 102,262 5.9% 2.3% 9.6%Boxboard 10,685 0.6% 0.5% 0.7% PVC 1,111 0.1% 0.0% 0.1%Mixed Recyclable Paper 67,738 3.9% 3.3% 4.6% Ceramics/Porcelain 7,232 0.4% 0.1% 0.7%Compostable Paper 87,504 5.1% 4.0% 6.2% Other C&D 37,601 2.2% 0.0% 4.5%R/C Paper 36,126 2.1% 1.0% 3.2% Problem Wastes 131,260 7.6%
Plastics 177,206 10.3% Televisions 9,254 0.5% 0.0% 1.1%PET Bottles 7,202 0.4% 0.3% 0.5% Computer Monitors 3,036 0.2% 0.0% 0.5%HDPE Bottles - natural 2,697 0.2% 0.1% 0.2% Computer Equipment 528 0.0% 0.0% 0.1%HDPE Bottles - colored 3,526 0.2% 0.1% 0.3% Electronic Equipment 29,991 1.7% 1.0% 2.5%#3-#7 Other Plastic Bottles 155 0.0% 0.0% 0.0% White Goods - refrigerated 0 0.0% 0.0% 0.0%Polystyrene 7,238 0.4% 0.3% 0.5% White Goods - non-refrigerated 9,609 0.6% 0.0% 1.3%Other Rigid Plastic Containers 24,418 1.4% 1.0% 1.8% Lead-Acid Batteries 3,807 0.2% 0.0% 0.6%Plastic Film 67,060 3.9% 3.3% 4.5% Other Household Batteries 681 0.0% 0.0% 0.1%R/C Plastic 64,910 3.8% 2.6% 4.9% Tires 22,048 1.3% 0.2% 2.3%
Metal 93,066 5.4% Bulky Items 35,542 2.1% 0.9% 3.2%Aluminum Cans 4,477 0.3% 0.2% 0.3% Fluorescent Lights 0 0.0% 0.0% 0.0%Other Aluminum 5,867 0.3% 0.1% 0.6% Ballasts 759 0.0% 0.0% 0.1%Tin Cans 5,814 0.3% 0.3% 0.4% Pallets 16,005 0.9% 0.3% 1.6%Ferrous Metals 44,838 2.6% 1.3% 4.0% Household Hazardous 15,920 0.9%Non-Ferrous Metals 3,018 0.2% 0.0% 0.4% Latex Paint 1,170 0.1% 0.0% 0.1%R/C Metal 29,052 1.7% 0.7% 2.6% Oil Paint 372 0.0% 0.0% 0.1%
Glass 43,918 2.6% Pesticides/Fertilizers 0 0.0% 0.0% 0.0%Glass - recyclable 12,673 0.7% 0.5% 0.9% Auto Used Oil Filters 376 0.0% 0.0% 0.0%R/C Glass 31,245 1.8% 0.0% 3.7% Mercury 6 0.0% 0.0% 0.0%
Organics 273,199 15.9% Other Hazardous 13,995 0.8% 0.0% 1.9%Yard Waste - <6" 34,319 2.0% 1.0% 3.0% Other Wastes 123,997 7.2%Yard Waste - >6" 1,691 0.1% 0.0% 0.3% Textiles 45,637 2.7% 1.5% 3.8%Food 149,121 8.7% 6.4% 10.9% Carpet 69,384 4.0% 1.2% 6.9%Diapers 24,611 1.4% 0.8% 2.0% Carpet Padding 8,976 0.5% 0.2% 0.9%Animal Waste/Kitty Litter 10,651 0.6% 0.2% 1.1%Bottom Fines/Dirt 23,669 1.4% 1.0% 1.8%R/C Organic 29,138 1.7% 0.7% 2.7%
Total Tons 1,721,362Sample Count 82

Cascadia Consulting Group, Inc. B-31 Wisconsin Waste Characterization Study Appendices
Residential
Figure B - 14 – Overview of Composition, Southeast Residential
(Calendar Year 2001)
Household Hazardous
0.3%
Plastics10.0%
Metal6.5%
Glass2.7%Organics
20.4%
C&D17.0%
Problem Wastes12.0%
Paper22.9%
Other Wastes8.3%
Table B - 27 – Top Ten Components, Southeast Residential
(Calendar Year 2001)
Component Mean Cum. % Tons Cum. TonsFood 9.4% 9.4% 52,243 52,243Wood - untreated 8.3% 17.8% 46,125 98,368Roofing Shingles 5.8% 23.5% 32,005 130,373Mixed Recyclable Paper 5.6% 29.2% 31,210 161,583Bulky Items 4.6% 33.8% 25,759 187,342Compostable Paper 4.4% 38.2% 24,370 211,712Carpet 4.3% 42.5% 23,733 235,445R/C Plastic 4.0% 46.5% 22,257 257,703Electronic Equipment 3.8% 50.4% 21,266 278,968Plastic Film 3.5% 53.8% 19,300 298,268
Total 53.8% 298,268

Cascadia Consulting Group, Inc. B-32 Wisconsin Waste Characterization Study Appendices
Table B - 28 – Detailed Composition Profile, Southeast Residential
(Calendar Year 2001)
Calculated at a 90% confidence level
Conf. Interval Conf. IntervalTons Mean Low High Tons Mean Low High
Paper 127,084 22.9% C&D 94,044 17.0%Newsprint 18,132 3.3% 2.3% 4.2% Wood - treated 2,519 0.5% 0.0% 1.0%High Grade Paper 7,415 1.3% 0.8% 1.9% Wood - untreated 46,125 8.3% 4.6% 12.1%Magazines/Catalogs 10,057 1.8% 1.3% 2.4% Rock/Concrete/Brick 2,412 0.4% 0.1% 0.8%Cardboard - recyclable 18,400 3.3% 1.0% 5.7% Drywall 7,727 1.4% 0.0% 3.7%Cardboard - coated 0 0.0% 0.0% 0.0% Roofing Shingles 32,005 5.8% 0.0% 13.7%Boxboard 6,431 1.2% 0.9% 1.5% PVC 297 0.1% 0.0% 0.1%Mixed Recyclable Paper 31,210 5.6% 4.4% 6.8% Ceramics/Porcelain 1,790 0.3% 0.0% 0.7%Compostable Paper 24,370 4.4% 3.1% 5.7% Other C&D 1,170 0.2% 0.0% 0.4%R/C Paper 11,070 2.0% 0.2% 3.8% Problem Wastes 66,208 12.0%
Plastics 55,417 10.0% Televisions 1,896 0.3% 0.0% 0.9%PET Bottles 2,593 0.5% 0.3% 0.7% Computer Monitors 0 0.0% 0.0% 0.0%HDPE Bottles - natural 813 0.1% 0.1% 0.2% Computer Equipment 0 0.0% 0.0% 0.0%HDPE Bottles - colored 1,955 0.4% 0.1% 0.6% Electronic Equipment 21,266 3.8% 1.9% 5.8%#3-#7 Other Plastic Bottles 104 0.0% 0.0% 0.0% White Goods - refrigerated 0 0.0% 0.0% 0.0%Polystyrene 1,653 0.3% 0.2% 0.4% White Goods - non-refrigerated 7,134 1.3% 0.0% 3.4%Other Rigid Plastic Containers 6,742 1.2% 0.9% 1.5% Lead-Acid Batteries 0 0.0% 0.0% 0.0%Plastic Film 19,300 3.5% 2.5% 4.5% Other Household Batteries 587 0.1% 0.0% 0.2%R/C Plastic 22,257 4.0% 2.1% 6.0% Tires 8,807 1.6% 0.0% 4.2%
Metal 35,778 6.5% Bulky Items 25,759 4.6% 1.7% 7.6%Aluminum Cans 1,799 0.3% 0.2% 0.5% Fluorescent Lights 0 0.0% 0.0% 0.0%Other Aluminum 4,781 0.9% 0.1% 1.6% Ballasts 759 0.1% 0.0% 0.4%Tin Cans 2,515 0.5% 0.3% 0.6% Pallets 0 0.0% 0.0% 0.0%Ferrous Metals 17,034 3.1% 1.4% 4.7% Household Hazardous 1,581 0.3%Non-Ferrous Metals 439 0.1% 0.0% 0.1% Latex Paint 0 0.0% 0.0% 0.0%R/C Metal 9,210 1.7% 0.5% 2.9% Oil Paint 0 0.0% 0.0% 0.0%
Glass 14,721 2.7% Pesticides/Fertilizers 0 0.0% 0.0% 0.0%Glass - recyclable 4,975 0.9% 0.6% 1.2% Auto Used Oil Filters 376 0.1% 0.0% 0.1%R/C Glass 9,746 1.8% 0.0% 3.6% Mercury 6 0.0% 0.0% 0.0%
Organics 113,077 20.4% Other Hazardous 1,198 0.2% 0.1% 0.4%Yard Waste - <6" 16,592 3.0% 1.9% 4.1% Other Wastes 46,114 8.3%Yard Waste - >6" 0 0.0% 0.0% 0.0% Textiles 18,198 3.3% 2.1% 4.4%Food 52,243 9.4% 6.4% 12.5% Carpet 23,733 4.3% 1.8% 6.7%Diapers 16,689 3.0% 1.6% 4.5% Carpet Padding 4,183 0.8% 0.1% 1.4%Animal Waste/Kitty Litter 6,182 1.1% 0.3% 2.0%Bottom Fines/Dirt 11,896 2.1% 1.2% 3.0%R/C Organic 9,475 1.7% 0.9% 2.5%
Total Tons 554,024Sample Count 24

Cascadia Consulting Group, Inc. B-33 Wisconsin Waste Characterization Study Appendices
Industrial/Commercial/Institutional
Figure B - 15 – Overview of Composition, Southeast ICI
(Calendar Year 2001)
Household Hazardous
1.7%
Plastics14.2%
Metal4.7%
Glass3.5%
Organics18.9%
C&D15.9%
Problem Wastes4.6%
Paper29.0%
Other Wastes7.5%
Table B - 29 – Top Ten Components, Southeast ICI
(Calendar Year 2001)
Component Mean Cum. % Tons Cum. TonsWood - untreated 12.1% 12.1% 97,889 97,889Food 11.8% 23.9% 95,241 193,130Cardboard - recyclable 8.2% 32.1% 66,204 259,334Compostable Paper 7.8% 39.9% 62,854 322,188Plastic Film 5.8% 45.7% 46,466 368,654Carpet 5.4% 51.0% 43,459 412,113R/C Plastic 4.8% 55.8% 38,877 450,990Mixed Recyclable Paper 4.3% 60.1% 34,511 485,501R/C Paper 3.0% 63.2% 24,482 509,982R/C Glass 2.5% 65.7% 20,576 530,559
Total 65.7% 530,559

Cascadia Consulting Group, Inc. B-34 Wisconsin Waste Characterization Study Appendices
Table B - 30 – Detailed Composition Profile, Southeast ICI
(Calendar Year 2001)
Calculated at a 90% confidence level
Conf. Interval Conf. IntervalTons Mean Low High Tons Mean Low High
Paper 233,878 29.0% C&D 128,059 15.9%Newsprint 14,412 1.8% 1.0% 2.6% Wood - treated 12,993 1.6% 0.0% 3.9%High Grade Paper 13,717 1.7% 1.0% 2.4% Wood - untreated 97,889 12.1% 6.3% 18.0%Magazines/Catalogs 6,714 0.8% 0.3% 1.4% Rock/Concrete/Brick 5,028 0.6% 0.1% 1.2%Cardboard - recyclable 66,204 8.2% 3.8% 12.6% Drywall 8,301 1.0% 0.0% 2.2%Cardboard - coated 6,782 0.8% 0.0% 1.7% Roofing Shingles 10 0.0% 0.0% 0.0%Boxboard 4,202 0.5% 0.3% 0.7% PVC 0 0.0% 0.0% 0.0%Mixed Recyclable Paper 34,511 4.3% 3.2% 5.4% Ceramics/Porcelain 993 0.1% 0.0% 0.2%Compostable Paper 62,854 7.8% 5.5% 10.0% Other C&D 2,845 0.4% 0.0% 0.9%R/C Paper 24,482 3.0% 0.9% 5.1% Problem Wastes 37,292 4.6%
Plastics 114,928 14.2% Televisions 2,752 0.3% 0.0% 0.9%PET Bottles 4,542 0.6% 0.4% 0.7% Computer Monitors 0 0.0% 0.0% 0.0%HDPE Bottles - natural 1,884 0.2% 0.1% 0.3% Computer Equipment 528 0.1% 0.0% 0.2%HDPE Bottles - colored 1,551 0.2% 0.1% 0.3% Electronic Equipment 3,329 0.4% 0.1% 0.8%#3-#7 Other Plastic Bottles 41 0.0% 0.0% 0.0% White Goods - refrigerated 0 0.0% 0.0% 0.0%Polystyrene 4,441 0.5% 0.4% 0.7% White Goods - non-refrigerated 0 0.0% 0.0% 0.0%Other Rigid Plastic Containers 17,127 2.1% 1.3% 2.9% Lead-Acid Batteries 3,807 0.5% 0.0% 1.2%Plastic Film 46,466 5.8% 4.6% 6.9% Other Household Batteries 94 0.0% 0.0% 0.0%R/C Plastic 38,877 4.8% 2.8% 6.8% Tires 13,242 1.6% 0.3% 3.0%
Metal 38,078 4.7% Bulky Items 5,233 0.6% 0.0% 1.8%Aluminum Cans 2,606 0.3% 0.2% 0.5% Fluorescent Lights 0 0.0% 0.0% 0.0%Other Aluminum 1,086 0.1% 0.1% 0.2% Ballasts 0 0.0% 0.0% 0.0%Tin Cans 3,230 0.4% 0.2% 0.6% Pallets 8,307 1.0% 0.1% 2.0%Ferrous Metals 19,805 2.5% 0.1% 4.8% Household Hazardous 13,397 1.7%Non-Ferrous Metals 2,578 0.3% 0.0% 0.7% Latex Paint 228 0.0% 0.0% 0.1%R/C Metal 8,773 1.1% 0.0% 2.3% Oil Paint 372 0.0% 0.0% 0.1%
Glass 28,088 3.5% Pesticides/Fertilizers 0 0.0% 0.0% 0.0%Glass - recyclable 7,512 0.9% 0.6% 1.3% Auto Used Oil Filters 0 0.0% 0.0% 0.0%R/C Glass 20,576 2.5% 0.0% 6.4% Mercury 0 0.0% 0.0% 0.0%
Organics 152,965 18.9% Other Hazardous 12,797 1.6% 0.0% 3.9%Yard Waste - <6" 15,769 2.0% 0.0% 4.0% Other Wastes 60,828 7.5%Yard Waste - >6" 0 0.0% 0.0% 0.0% Textiles 15,662 1.9% 0.6% 3.3%Food 95,241 11.8% 7.4% 16.1% Carpet 43,459 5.4% 0.0% 11.2%Diapers 7,905 1.0% 0.2% 1.7% Carpet Padding 1,707 0.2% 0.0% 0.6%Animal Waste/Kitty Litter 4,469 0.6% 0.0% 1.3%Bottom Fines/Dirt 11,773 1.5% 0.8% 2.1%R/C Organic 17,809 2.2% 0.2% 4.2%
Total Tons 807,513Sample Count 32

Cascadia Consulting Group, Inc. B-35 Wisconsin Waste Characterization Study Appendices
Construction & Demolition
Figure B - 16 – Overview of Composition, Southeast C&D
(Calendar Year 2001)
Household Hazardous
0.3%
Plastics1.9%
Metal5.3%
Glass0.3%
Organics2.0%
C&D74.0%
Problem Wastes7.7%
Paper3.7%
Other Wastes4.7%
Table B - 31 – Top Ten Components, Southeast C&D
(Calendar Year 2001)
Component Mean Cum. % Tons Cum. TonsRoofing Shingles 19.5% 19.5% 70,248 70,248Wood - untreated 19.5% 39.0% 70,164 140,411Rock/Concrete/Brick 18.2% 57.3% 65,652 206,063Other C&D 9.3% 66.6% 33,587 239,649Drywall 3.9% 70.5% 13,927 253,576Textiles 3.3% 73.7% 11,777 265,354R/C Metal 3.1% 76.8% 11,069 276,423Ferrous Metals 2.2% 79.0% 7,999 284,422Pallets 2.1% 81.2% 7,698 292,120Wood - treated 2.1% 83.3% 7,520 299,639
Total 83.3% 299,639

Cascadia Consulting Group, Inc. B-36 Wisconsin Waste Characterization Study Appendices
Table B - 32 – Detailed Composition Profile, Southeast C&D
(Calendar Year 2001)
Calculated at a 90% confidence level
Conf. Interval Conf. IntervalTons Mean Low High Tons Mean Low High
Paper 13,370 3.7% C&D 266,359 74.0%Newsprint 793 0.2% 0.0% 0.4% Wood - treated 7,520 2.1% 0.3% 3.9%High Grade Paper 2,377 0.7% 0.0% 1.4% Wood - untreated 70,164 19.5% 7.1% 31.9%Magazines/Catalogs 56 0.0% 0.0% 0.0% Rock/Concrete/Brick 65,652 18.2% 4.8% 31.7%Cardboard - recyclable 7,193 2.0% 0.8% 3.2% Drywall 13,927 3.9% 0.7% 7.0%Cardboard - coated 28 0.0% 0.0% 0.0% Roofing Shingles 70,248 19.5% 6.9% 32.2%Boxboard 53 0.0% 0.0% 0.0% PVC 814 0.2% 0.0% 0.6%Mixed Recyclable Paper 2,018 0.6% 0.0% 1.3% Ceramics/Porcelain 4,449 1.2% 0.1% 2.4%Compostable Paper 279 0.1% 0.0% 0.2% Other C&D 33,587 9.3% 0.0% 20.2%R/C Paper 574 0.2% 0.0% 0.3% Problem Wastes 27,761 7.7%
Plastics 6,861 1.9% Televisions 4,606 1.3% 0.0% 3.4%PET Bottles 67 0.0% 0.0% 0.0% Computer Monitors 3,036 0.8% 0.0% 2.2%HDPE Bottles - natural 0 0.0% 0.0% 0.0% Computer Equipment 0 0.0% 0.0% 0.0%HDPE Bottles - colored 21 0.0% 0.0% 0.0% Electronic Equipment 5,396 1.5% 0.0% 3.4%#3-#7 Other Plastic Bottles 9 0.0% 0.0% 0.0% White Goods - refrigerated 0 0.0% 0.0% 0.0%Polystyrene 1,144 0.3% 0.0% 0.8% White Goods - non-refrigerated 2,476 0.7% 0.0% 1.8%Other Rigid Plastic Containers 549 0.2% 0.0% 0.3% Lead-Acid Batteries 0 0.0% 0.0% 0.0%Plastic Film 1,294 0.4% 0.1% 0.6% Other Household Batteries 0 0.0% 0.0% 0.0%R/C Plastic 3,776 1.0% 0.3% 1.8% Tires 0 0.0% 0.0% 0.0%
Metal 19,210 5.3% Bulky Items 4,549 1.3% 0.0% 3.4%Aluminum Cans 73 0.0% 0.0% 0.0% Fluorescent Lights 0 0.0% 0.0% 0.0%Other Aluminum 0 0.0% 0.0% 0.0% Ballasts 0 0.0% 0.0% 0.0%Tin Cans 69 0.0% 0.0% 0.0% Pallets 7,698 2.1% 0.0% 4.3%Ferrous Metals 7,999 2.2% 0.0% 4.8% Household Hazardous 943 0.3%Non-Ferrous Metals 0 0.0% 0.0% 0.0% Latex Paint 943 0.3% 0.0% 0.6%R/C Metal 11,069 3.1% 0.0% 6.2% Oil Paint 0 0.0% 0.0% 0.0%
Glass 1,110 0.3% Pesticides/Fertilizers 0 0.0% 0.0% 0.0%Glass - recyclable 187 0.1% 0.0% 0.1% Auto Used Oil Filters 0 0.0% 0.0% 0.0%R/C Glass 923 0.3% 0.0% 0.6% Mercury 0 0.0% 0.0% 0.0%
Organics 7,157 2.0% Other Hazardous 0 0.0% 0.0% 0.0%Yard Waste - <6" 1,958 0.5% 0.0% 1.1% Other Wastes 17,055 4.7%Yard Waste - >6" 1,691 0.5% 0.0% 1.2% Textiles 11,777 3.3% 0.0% 7.6%Food 1,637 0.5% 0.0% 1.0% Carpet 2,192 0.6% 0.0% 1.2%Diapers 18 0.0% 0.0% 0.0% Carpet Padding 3,087 0.9% 0.0% 1.8%Animal Waste/Kitty Litter 0 0.0% 0.0% 0.0%Bottom Fines/Dirt 0 0.0% 0.0% 0.0%R/C Organic 1,853 0.5% 0.0% 1.1%
Total Tons 359,825Sample Count 26

Cascadia Consulting Group, Inc. B-37 Wisconsin Waste Characterization Study Appendices
COMPARISONS AMONG SUBSTREAM TONNAGES IN SOUTHEAST REGION
Table B-3-22 – Composition Comparisons among Substreams, Southeast
(Calendar Year 2001)
(Mean Percentage) (Mean Percentage)Material Residential ICI C&D Material Residential ICI C&DPaper 22.9% 29.0% 3.7% C&D 17.0% 15.9% 74.0%
Newsprint 3.3% 1.8% 0.2% Wood - treated 0.5% 1.6% 2.1%High Grade Paper 1.3% 1.7% 0.7% Wood - untreated 8.3% 12.1% 19.5%Magazines/Catalogs 1.8% 0.8% 0.0% Rock/Concrete/Brick 0.4% 0.6% 18.2%Cardboard - recyclable 3.3% 8.2% 2.0% Drywall 1.4% 1.0% 3.9%Cardboard - coated 0.0% 0.8% 0.0% Roofing Shingles 5.8% 0.0% 19.5%Boxboard 1.2% 0.5% 0.0% PVC 0.1% 0.0% 0.2%Mixed Recyclable Paper 5.6% 4.3% 0.6% Ceramics/Porcelain 0.3% 0.1% 1.2%Compostable Paper 4.4% 7.8% 0.1% Other C&D 0.2% 0.4% 9.3%R/C Paper 2.0% 3.0% 0.2% Problem Wastes 12.0% 4.6% 7.7%
Plastics 10.0% 14.2% 1.9% Televisions 0.3% 0.3% 1.3%PET Bottles 0.5% 0.6% 0.0% Computer Monitors 0.0% 0.0% 0.8%HDPE Bottles - natural 0.1% 0.2% 0.0% Computer Equipment 0.0% 0.1% 0.0%HDPE Bottles - colored 0.4% 0.2% 0.0% Electronic Equipment 3.8% 0.4% 1.5%#3-#7 Other Plastic Bottles 0.0% 0.0% 0.0% White Goods - refrigerated 0.0% 0.0% 0.0%Polystyrene 0.3% 0.5% 0.3% White Goods - non-refrigerated 1.3% 0.0% 0.7%Other Rigid Plastic Containers 1.2% 2.1% 0.2% Lead-Acid Batteries 0.0% 0.5% 0.0%Plastic Film 3.5% 5.8% 0.4% Other Household Batteries 0.1% 0.0% 0.0%R/C Plastic 4.0% 4.8% 1.0% Tires 1.6% 1.6% 0.0%
Metal 6.5% 4.7% 5.3% Bulky Items 4.6% 0.6% 1.3%Aluminum Cans 0.3% 0.3% 0.0% Fluorescent Lights 0.0% 0.0% 0.0%Other Aluminum 0.9% 0.1% 0.0% Ballasts 0.1% 0.0% 0.0%Tin Cans 0.5% 0.4% 0.0% Pallets 0.0% 1.0% 2.1%Ferrous Metals 3.1% 2.5% 2.2% Household Hazardous 0.3% 1.7% 0.3%Non-Ferrous Metals 0.1% 0.3% 0.0% Latex Paint 0.0% 0.0% 0.3%R/C Metal 1.7% 1.1% 3.1% Oil Paint 0.0% 0.0% 0.0%
Glass 2.7% 3.5% 0.3% Pesticides/Fertilizers 0.0% 0.0% 0.0%Glass - recyclable 0.9% 0.9% 0.1% Auto Used Oil Filters 0.1% 0.0% 0.0%R/C Glass 1.8% 2.5% 0.3% Mercury 0.0% 0.0% 0.0%
Organics 20.4% 18.9% 2.0% Other Hazardous 0.2% 1.6% 0.0%Yard Waste - <6" 3.0% 2.0% 0.5% Other Wastes 8.3% 7.5% 4.7%Yard Waste - >6" 0.0% 0.0% 0.5% Textiles 3.3% 1.9% 3.3%Food 9.4% 11.8% 0.5% Carpet 4.3% 5.4% 0.6%Diapers 3.0% 1.0% 0.0% Carpet Padding 0.8% 0.2% 0.9%Animal Waste/Kitty Litter 1.1% 0.6% 0.0%Bottom Fines/Dirt 2.1% 1.5% 0.0%R/C Organic 1.7% 2.2% 0.5% Total 100.0% 100.0% 100.0%

Cascadia Consulting Group, Inc. B-38 Wisconsin Waste Characterization Study Appendices
WEST CENTRAL REGION
Overall
Figure B - 17 – Overview of Composition, West central
(Calendar Year 2001)
Other Wastes4.0% Paper
20.2%
Problem Wastes9.2%
C&D23.5%
Organics18.4%
Glass2.3%
Metal9.4%
Plastics12.9%
Household Hazardous
0.2%
Table B - 33 – Top Ten Components, West central
(Calendar Year 2001)
Component Mean Cum. % Tons Cum. TonsWood - untreated 11.7% 11.7% 68,398 68,398Food 9.4% 21.1% 54,997 123,395Ferrous Metals 5.7% 26.8% 33,446 156,841Roofing Shingles 4.9% 31.7% 28,645 185,486Mixed Recyclable Paper 4.5% 36.2% 26,110 211,597Compostable Paper 4.3% 40.5% 25,406 237,002Plastic Film 4.0% 44.5% 23,116 260,118Rock/Concrete/Brick 3.9% 48.4% 22,797 282,915R/C Plastic 3.6% 52.0% 21,137 304,052Diapers 3.5% 55.4% 20,348 324,399
Total 55.4% 324,399

Cascadia Consulting Group, Inc. B-39 Wisconsin Waste Characterization Study Appendices
Table B - 34 – Detailed Composition Profile, West central
(Calendar Year 2001)
Calculated at a 90% confidence level
Conf. Interval Conf. IntervalTons Mean Low High Tons Mean Low High
Paper 117,916 20.2% C&D 137,602 23.5%Newsprint 9,610 1.6% 1.2% 2.1% Wood - treated 0 0.0% 0.0% 0.0%High Grade Paper 6,574 1.1% 0.7% 1.5% Wood - untreated 68,398 11.7% 8.2% 15.2%Magazines/Catalogs 7,202 1.2% 0.8% 1.6% Rock/Concrete/Brick 22,797 3.9% 0.8% 7.0%Cardboard - recyclable 20,056 3.4% 2.3% 4.5% Drywall 5,979 1.0% 0.2% 1.8%Cardboard - coated 2,575 0.4% 0.1% 0.8% Roofing Shingles 28,645 4.9% 1.0% 8.8%Boxboard 4,956 0.8% 0.7% 1.0% PVC 48 0.0% 0.0% 0.0%Mixed Recyclable Paper 26,110 4.5% 3.5% 5.4% Ceramics/Porcelain 3,834 0.7% 0.0% 1.4%Compostable Paper 25,406 4.3% 3.5% 5.2% Other C&D 7,901 1.4% 0.6% 2.1%R/C Paper 15,427 2.6% 0.9% 4.4% Problem Wastes 53,803 9.2%
Plastics 75,470 12.9% Televisions 4,089 0.7% 0.0% 1.8%PET Bottles 3,137 0.5% 0.4% 0.7% Computer Monitors 0 0.0% 0.0% 0.0%HDPE Bottles - natural 1,720 0.3% 0.1% 0.5% Computer Equipment 0 0.0% 0.0% 0.0%HDPE Bottles - colored 2,205 0.4% 0.2% 0.6% Electronic Equipment 8,960 1.5% 0.6% 2.5%#3-#7 Other Plastic Bottles 210 0.0% 0.0% 0.0% White Goods - refrigerated 5,493 0.9% 0.0% 2.4%Polystyrene 3,763 0.6% 0.4% 0.8% White Goods - non-refrigerated 0 0.0% 0.0% 0.0%Other Rigid Plastic Containers 20,182 3.4% 0.1% 6.8% Lead-Acid Batteries 3,171 0.5% 0.0% 1.5%Plastic Film 23,116 4.0% 3.2% 4.7% Other Household Batteries 337 0.1% 0.0% 0.1%R/C Plastic 21,137 3.6% 2.3% 4.9% Tires 932 0.2% 0.0% 0.4%
Metal 55,214 9.4% Bulky Items 17,783 3.0% 0.3% 5.8%Aluminum Cans 4,463 0.8% 0.4% 1.1% Fluorescent Lights 188 0.0% 0.0% 0.1%Other Aluminum 1,473 0.3% 0.2% 0.3% Ballasts 0 0.0% 0.0% 0.0%Tin Cans 4,644 0.8% 0.6% 1.0% Pallets 12,850 2.2% 0.4% 4.0%Ferrous Metals 33,446 5.7% 2.3% 9.1% Household Hazardous 1,060 0.2%Non-Ferrous Metals 800 0.1% 0.0% 0.3% Latex Paint 680 0.1% 0.0% 0.3%R/C Metal 10,389 1.8% 1.0% 2.6% Oil Paint 0 0.0% 0.0% 0.0%
Glass 13,313 2.3% Pesticides/Fertilizers 0 0.0% 0.0% 0.0%Glass - recyclable 8,400 1.4% 1.0% 1.9% Auto Used Oil Filters 242 0.0% 0.0% 0.1%R/C Glass 4,914 0.8% 0.2% 1.5% Mercury 0 0.0% 0.0% 0.0%
Organics 107,423 18.4% Other Hazardous 137 0.0% 0.0% 0.0%Yard Waste - <6" 2,571 0.4% 0.1% 0.8% Other Wastes 23,296 4.0%Yard Waste - >6" 0 0.0% 0.0% 0.0% Textiles 15,692 2.7% 1.8% 3.5%Food 54,997 9.4% 6.8% 12.0% Carpet 6,572 1.1% 0.4% 1.9%Diapers 20,348 3.5% 2.0% 5.0% Carpet Padding 1,032 0.2% 0.0% 0.4%Animal Waste/Kitty Litter 8,954 1.5% 0.7% 2.4%Bottom Fines/Dirt 11,193 1.9% 1.1% 2.8%R/C Organic 9,359 1.6% 1.2% 2.0%
Total Tons 585,096Sample Count 56

Cascadia Consulting Group, Inc. B-40 Wisconsin Waste Characterization Study Appendices
Residential
Figure B - 18 – Overview of Composition, West central Residential
(Calendar Year 2001)
Household Hazardous
0.1%
Plastics12.8%
Metal7.4%Glass
4.0%
Organics26.4%
C&D13.1%
Problem Wastes6.3%
Paper24.3%
Other Wastes5.6%
Table B - 35 – Top Ten Components, West central Residential
(Calendar Year 2001)
Component Mean Cum. % Tons Cum. TonsWood - untreated 12.0% 12.0% 22,238 22,238Food 10.7% 22.7% 19,778 42,016Compostable Paper 6.2% 28.9% 11,446 53,462Mixed Recyclable Paper 5.9% 34.8% 10,853 64,314Diapers 5.7% 40.5% 10,567 74,881Plastic Film 5.3% 45.8% 9,789 84,670Textiles 4.5% 50.3% 8,284 92,954Bulky Items 4.0% 54.3% 7,355 100,309Animal Waste/Kitty Litter 3.5% 57.9% 6,548 106,857R/C Plastic 3.3% 61.2% 6,111 112,968
Total 61.2% 112,968

Cascadia Consulting Group, Inc. B-41 Wisconsin Waste Characterization Study Appendices
Table B - 36 – Detailed Composition Profile, West central Residential
(Calendar Year 2001)
Calculated at a 90% confidence level
Conf. Interval Conf. IntervalTons Mean Low High Tons Mean Low High
Paper 44,903 24.3% C&D 24,174 13.1%Newsprint 5,095 2.8% 1.7% 3.8% Wood - treated 0 0.0% 0.0% 0.0%High Grade Paper 3,371 1.8% 0.9% 2.8% Wood - untreated 22,238 12.0% 4.8% 19.3%Magazines/Catalogs 3,232 1.7% 1.1% 2.4% Rock/Concrete/Brick 485 0.3% 0.0% 0.6%Cardboard - recyclable 4,993 2.7% 1.0% 4.4% Drywall 6 0.0% 0.0% 0.0%Cardboard - coated 116 0.1% 0.0% 0.2% Roofing Shingles 0 0.0% 0.0% 0.0%Boxboard 2,507 1.4% 1.0% 1.7% PVC 23 0.0% 0.0% 0.0%Mixed Recyclable Paper 10,853 5.9% 4.3% 7.4% Ceramics/Porcelain 225 0.1% 0.0% 0.3%Compostable Paper 11,446 6.2% 4.5% 7.9% Other C&D 1,196 0.6% 0.1% 1.2%R/C Paper 3,291 1.8% 1.1% 2.4% Problem Wastes 11,672 6.3%
Plastics 23,614 12.8% Televisions 0 0.0% 0.0% 0.0%PET Bottles 1,341 0.7% 0.5% 0.9% Computer Monitors 0 0.0% 0.0% 0.0%HDPE Bottles - natural 503 0.3% 0.2% 0.4% Computer Equipment 0 0.0% 0.0% 0.0%HDPE Bottles - colored 1,040 0.6% 0.1% 1.1% Electronic Equipment 3,855 2.1% 0.4% 3.8%#3-#7 Other Plastic Bottles 137 0.1% 0.0% 0.1% White Goods - refrigerated 0 0.0% 0.0% 0.0%Polystyrene 1,772 1.0% 0.5% 1.4% White Goods - non-refrigerated 0 0.0% 0.0% 0.0%Other Rigid Plastic Containers 2,922 1.6% 1.2% 2.0% Lead-Acid Batteries 0 0.0% 0.0% 0.0%Plastic Film 9,789 5.3% 4.0% 6.6% Other Household Batteries 196 0.1% 0.0% 0.2%R/C Plastic 6,111 3.3% 2.1% 4.5% Tires 92 0.1% 0.0% 0.1%
Metal 13,673 7.4% Bulky Items 7,355 4.0% 0.0% 9.0%Aluminum Cans 2,375 1.3% 0.2% 2.4% Fluorescent Lights 173 0.1% 0.0% 0.2%Other Aluminum 628 0.3% 0.2% 0.5% Ballasts 0 0.0% 0.0% 0.0%Tin Cans 1,923 1.0% 0.8% 1.3% Pallets 0 0.0% 0.0% 0.0%Ferrous Metals 4,949 2.7% 1.1% 4.3% Household Hazardous 268 0.1%Non-Ferrous Metals 210 0.1% 0.0% 0.2% Latex Paint 2 0.0% 0.0% 0.0%R/C Metal 3,588 1.9% 0.4% 3.4% Oil Paint 0 0.0% 0.0% 0.0%
Glass 7,316 4.0% Pesticides/Fertilizers 0 0.0% 0.0% 0.0%Glass - recyclable 5,063 2.7% 1.5% 4.0% Auto Used Oil Filters 173 0.1% 0.0% 0.2%R/C Glass 2,253 1.2% 0.3% 2.2% Mercury 0 0.0% 0.0% 0.0%
Organics 48,775 26.4% Other Hazardous 92 0.1% 0.0% 0.1%Yard Waste - <6" 1,829 1.0% 0.0% 2.2% Other Wastes 10,301 5.6%Yard Waste - >6" 0 0.0% 0.0% 0.0% Textiles 8,284 4.5% 2.5% 6.5%Food 19,778 10.7% 8.7% 12.7% Carpet 1,751 0.9% 0.0% 2.5%Diapers 10,567 5.7% 2.6% 8.8% Carpet Padding 266 0.1% 0.0% 0.4%Animal Waste/Kitty Litter 6,548 3.5% 1.1% 6.0%Bottom Fines/Dirt 4,606 2.5% 0.3% 4.7%R/C Organic 5,447 2.9% 1.8% 4.1%
Total Tons 184,697Sample Count 16
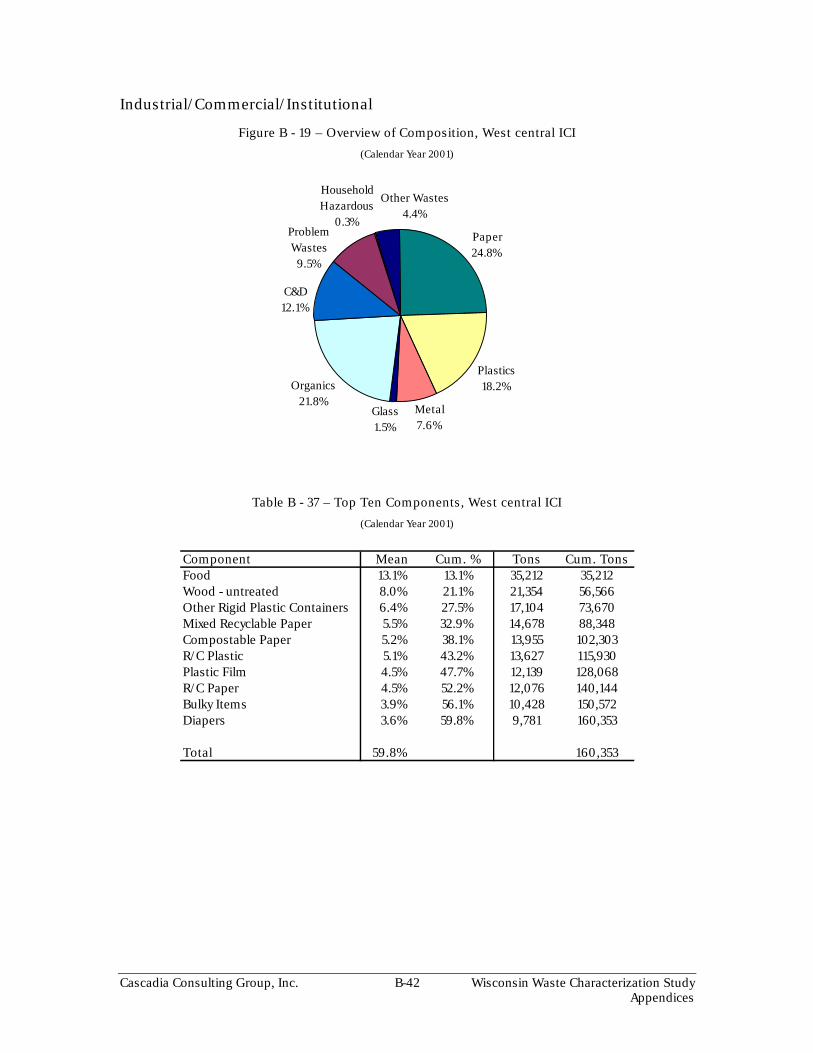
Cascadia Consulting Group, Inc. B-42 Wisconsin Waste Characterization Study Appendices
Industrial/Commercial/Institutional
Figure B - 19 – Overview of Composition, West central ICI
(Calendar Year 2001)
Household Hazardous
0.3%
Plastics18.2%
Metal7.6%
Glass1.5%
Organics21.8%
C&D12.1%
Problem Wastes9.5%
Paper24.8%
Other Wastes4.4%
Table B - 37 – Top Ten Components, West central ICI
(Calendar Year 2001)
Component Mean Cum. % Tons Cum. TonsFood 13.1% 13.1% 35,212 35,212Wood - untreated 8.0% 21.1% 21,354 56,566Other Rigid Plastic Containers 6.4% 27.5% 17,104 73,670Mixed Recyclable Paper 5.5% 32.9% 14,678 88,348Compostable Paper 5.2% 38.1% 13,955 102,303R/C Plastic 5.1% 43.2% 13,627 115,930Plastic Film 4.5% 47.7% 12,139 128,068R/C Paper 4.5% 52.2% 12,076 140,144Bulky Items 3.9% 56.1% 10,428 150,572Diapers 3.6% 59.8% 9,781 160,353
Total 59.8% 160,353

Cascadia Consulting Group, Inc. B-43 Wisconsin Waste Characterization Study Appendices
Table B - 38 – Detailed Composition Profile, West central ICI
(Calendar Year 2001)
Calculated at a 90% confidence level
Conf. Interval Conf. IntervalTons Mean Low High Tons Mean Low High
Paper 66,467 24.8% C&D 32,502 12.1%Newsprint 4,515 1.7% 1.0% 2.4% Wood - treated 0 0.0% 0.0% 0.0%High Grade Paper 3,203 1.2% 0.5% 1.8% Wood - untreated 21,354 8.0% 3.5% 12.4%Magazines/Catalogs 3,970 1.5% 0.7% 2.3% Rock/Concrete/Brick 5,530 2.1% 0.0% 4.8%Cardboard - recyclable 9,164 3.4% 1.9% 4.9% Drywall 888 0.3% 0.0% 0.7%Cardboard - coated 2,459 0.9% 0.1% 1.8% Roofing Shingles 0 0.0% 0.0% 0.0%Boxboard 2,447 0.9% 0.6% 1.2% PVC 5 0.0% 0.0% 0.0%Mixed Recyclable Paper 14,678 5.5% 3.7% 7.2% Ceramics/Porcelain 102 0.0% 0.0% 0.1%Compostable Paper 13,955 5.2% 3.8% 6.6% Other C&D 4,623 1.7% 0.3% 3.1%R/C Paper 12,076 4.5% 0.8% 8.2% Problem Wastes 25,364 9.5%
Plastics 48,829 18.2% Televisions 0 0.0% 0.0% 0.0%PET Bottles 1,789 0.7% 0.4% 0.9% Computer Monitors 0 0.0% 0.0% 0.0%HDPE Bottles - natural 1,217 0.5% 0.1% 0.8% Computer Equipment 0 0.0% 0.0% 0.0%HDPE Bottles - colored 1,096 0.4% 0.2% 0.7% Electronic Equipment 4,880 1.8% 0.2% 3.5%#3-#7 Other Plastic Bottles 73 0.0% 0.0% 0.0% White Goods - refrigerated 0 0.0% 0.0% 0.0%Polystyrene 1,786 0.7% 0.4% 0.9% White Goods - non-refrigerated 0 0.0% 0.0% 0.0%Other Rigid Plastic Containers 17,104 6.4% 0.0% 13.7% Lead-Acid Batteries 0 0.0% 0.0% 0.0%Plastic Film 12,139 4.5% 3.4% 5.7% Other Household Batteries 136 0.1% 0.0% 0.1%R/C Plastic 13,627 5.1% 2.4% 7.8% Tires 775 0.3% 0.0% 0.7%
Metal 20,337 7.6% Bulky Items 10,428 3.9% 0.0% 8.9%Aluminum Cans 2,002 0.7% 0.4% 1.1% Fluorescent Lights 0 0.0% 0.0% 0.0%Other Aluminum 458 0.2% 0.1% 0.3% Ballasts 0 0.0% 0.0% 0.0%Tin Cans 2,721 1.0% 0.6% 1.5% Pallets 9,145 3.4% 0.0% 7.2%Ferrous Metals 9,048 3.4% 1.4% 5.4% Household Hazardous 692 0.3%Non-Ferrous Metals 153 0.1% 0.0% 0.1% Latex Paint 678 0.3% 0.0% 0.7%R/C Metal 5,956 2.2% 0.9% 3.5% Oil Paint 0 0.0% 0.0% 0.0%
Glass 4,048 1.5% Pesticides/Fertilizers 0 0.0% 0.0% 0.0%Glass - recyclable 3,299 1.2% 0.7% 1.8% Auto Used Oil Filters 0 0.0% 0.0% 0.0%R/C Glass 748 0.3% 0.1% 0.4% Mercury 0 0.0% 0.0% 0.0%
Organics 58,396 21.8% Other Hazardous 15 0.0% 0.0% 0.0%Yard Waste - <6" 723 0.3% 0.1% 0.5% Other Wastes 11,676 4.4%Yard Waste - >6" 0 0.0% 0.0% 0.0% Textiles 7,277 2.7% 1.4% 4.0%Food 35,212 13.1% 7.7% 18.6% Carpet 4,132 1.5% 0.4% 2.7%Diapers 9,781 3.6% 1.1% 6.2% Carpet Padding 267 0.1% 0.0% 0.2%Animal Waste/Kitty Litter 2,406 0.9% 0.3% 1.5%Bottom Fines/Dirt 6,547 2.4% 1.3% 3.6%R/C Organic 3,727 1.4% 0.9% 1.9%
Total Tons 268,310Sample Count 24

Cascadia Consulting Group, Inc. B-44 Wisconsin Waste Characterization Study Appendices
Construction & Demolition
Figure B - 20 – Overview of Composition, West central C&D
(Calendar Year 2001)
Household Hazardous
0.1%
Plastics2.3%
Metal16.1%
Glass1.5%
Organics0.2%
C&D61.3%
Problem Wastes12.7%
Paper5.0%
Other Wastes1.0%
Table B - 39 – Top Ten Components, West central C&D
(Calendar Year 2001)
Component Mean Cum. % Tons Cum. TonsRoofing Shingles 21.7% 21.7% 28,645 28,645Wood - untreated 18.8% 40.5% 24,806 53,451Ferrous Metals 14.7% 55.2% 19,449 72,901Rock/Concrete/Brick 12.7% 67.9% 16,781 89,682Cardboard - recyclable 4.5% 72.4% 5,900 95,582White Goods - refrigerated 4.2% 76.5% 5,493 101,074Drywall 3.8% 80.4% 5,085 106,159Televisions 3.1% 83.5% 4,089 110,249Pallets 2.8% 86.3% 3,705 113,954Ceramics/Porcelain 2.7% 88.9% 3,507 117,461
Total 88.9% 117,461

Cascadia Consulting Group, Inc. B-45 Wisconsin Waste Characterization Study Appendices
Table B - 40 – Detailed Composition Profile, West central C&D
(Calendar Year 2001)
Calculated at a 90% confidence level
Conf. Interval Conf. IntervalTons Mean Low High Tons Mean Low High
Paper 6,546 5.0% C&D 80,926 61.3%Newsprint 0 0.0% 0.0% 0.0% Wood - treated 0 0.0% 0.0% 0.0%High Grade Paper 0 0.0% 0.0% 0.0% Wood - untreated 24,806 18.8% 11.5% 26.1%Magazines/Catalogs 0 0.0% 0.0% 0.0% Rock/Concrete/Brick 16,781 12.7% 0.3% 25.1%Cardboard - recyclable 5,900 4.5% 1.5% 7.4% Drywall 5,085 3.8% 0.4% 7.3%Cardboard - coated 0 0.0% 0.0% 0.0% Roofing Shingles 28,645 21.7% 4.5% 38.9%Boxboard 2 0.0% 0.0% 0.0% PVC 20 0.0% 0.0% 0.0%Mixed Recyclable Paper 580 0.4% 0.0% 1.0% Ceramics/Porcelain 3,507 2.7% 0.0% 6.0%Compostable Paper 5 0.0% 0.0% 0.0% Other C&D 2,081 1.6% 0.4% 2.7%R/C Paper 60 0.0% 0.0% 0.1% Problem Wastes 16,767 12.7%
Plastics 3,026 2.3% Televisions 4,089 3.1% 0.0% 7.8%PET Bottles 8 0.0% 0.0% 0.0% Computer Monitors 0 0.0% 0.0% 0.0%HDPE Bottles - natural 0 0.0% 0.0% 0.0% Computer Equipment 0 0.0% 0.0% 0.0%HDPE Bottles - colored 70 0.1% 0.0% 0.1% Electronic Equipment 225 0.2% 0.0% 0.5%#3-#7 Other Plastic Bottles 0 0.0% 0.0% 0.0% White Goods - refrigerated 5,493 4.2% 0.0% 10.5%Polystyrene 205 0.2% 0.0% 0.4% White Goods - non-refrigerated 0 0.0% 0.0% 0.0%Other Rigid Plastic Containers 156 0.1% 0.0% 0.3% Lead-Acid Batteries 3,171 2.4% 0.0% 6.4%Plastic Film 1,188 0.9% 0.0% 2.1% Other Household Batteries 5 0.0% 0.0% 0.0%R/C Plastic 1,399 1.1% 0.1% 2.0% Tires 65 0.0% 0.0% 0.1%
Metal 21,204 16.1% Bulky Items 0 0.0% 0.0% 0.0%Aluminum Cans 86 0.1% 0.0% 0.1% Fluorescent Lights 15 0.0% 0.0% 0.0%Other Aluminum 386 0.3% 0.0% 0.6% Ballasts 0 0.0% 0.0% 0.0%Tin Cans 0 0.0% 0.0% 0.0% Pallets 3,705 2.8% 0.1% 5.5%Ferrous Metals 19,449 14.7% 0.4% 29.1% Household Hazardous 99 0.1%Non-Ferrous Metals 436 0.3% 0.0% 0.9% Latex Paint 0 0.0% 0.0% 0.0%R/C Metal 845 0.6% 0.0% 1.6% Oil Paint 0 0.0% 0.0% 0.0%
Glass 1,950 1.5% Pesticides/Fertilizers 0 0.0% 0.0% 0.0%Glass - recyclable 37 0.0% 0.0% 0.1% Auto Used Oil Filters 69 0.1% 0.0% 0.1%R/C Glass 1,912 1.4% 0.0% 3.9% Mercury 0 0.0% 0.0% 0.0%
Organics 251 0.2% Other Hazardous 30 0.0% 0.0% 0.1%Yard Waste - <6" 20 0.0% 0.0% 0.0% Other Wastes 1,319 1.0%Yard Waste - >6" 0 0.0% 0.0% 0.0% Textiles 131 0.1% 0.0% 0.2%Food 7 0.0% 0.0% 0.0% Carpet 689 0.5% 0.0% 1.4%Diapers 0 0.0% 0.0% 0.0% Carpet Padding 499 0.4% 0.0% 1.0%Animal Waste/Kitty Litter 0 0.0% 0.0% 0.0%Bottom Fines/Dirt 40 0.0% 0.0% 0.1%R/C Organic 185 0.1% 0.0% 0.4%
Total Tons 132,089Sample Count 16

Cascadia Consulting Group, Inc. B-46 Wisconsin Waste Characterization Study Appendices
COMPARISONS AMONG SUBSTREAM TONNAGES IN WEST CENTRAL REGION
Table B - 41– Composition Comparisons among Substreams, West central
(Calendar Year 2001)
(Mean Percentage) (Mean Percentage)Material Residential ICI C&D Material Residential ICI C&DPaper 24.3% 24.8% 5.0% C&D 13.1% 12.1% 61.3%
Newsprint 2.8% 1.7% 0.0% Wood - treated 0.0% 0.0% 0.0%High Grade Paper 1.8% 1.2% 0.0% Wood - untreated 12.0% 8.0% 18.8%Magazines/Catalogs 1.7% 1.5% 0.0% Rock/Concrete/Brick 0.3% 2.1% 12.7%Cardboard - recyclable 2.7% 3.4% 4.5% Drywall 0.0% 0.3% 3.8%Cardboard - coated 0.1% 0.9% 0.0% Roofing Shingles 0.0% 0.0% 21.7%Boxboard 1.4% 0.9% 0.0% PVC 0.0% 0.0% 0.0%Mixed Recyclable Paper 5.9% 5.5% 0.4% Ceramics/Porcelain 0.1% 0.0% 2.7%Compostable Paper 6.2% 5.2% 0.0% Other C&D 0.6% 1.7% 1.6%R/C Paper 1.8% 4.5% 0.0% Problem Wastes 6.3% 9.5% 12.7%
Plastics 12.8% 18.2% 2.3% Televisions 0.0% 0.0% 3.1%PET Bottles 0.7% 0.7% 0.0% Computer Monitors 0.0% 0.0% 0.0%HDPE Bottles - natural 0.3% 0.5% 0.0% Computer Equipment 0.0% 0.0% 0.0%HDPE Bottles - colored 0.6% 0.4% 0.1% Electronic Equipment 2.1% 1.8% 0.2%#3-#7 Other Plastic Bottles 0.1% 0.0% 0.0% White Goods - refrigerated 0.0% 0.0% 4.2%Polystyrene 1.0% 0.7% 0.2% White Goods - non-refrigerated 0.0% 0.0% 0.0%Other Rigid Plastic Containers 1.6% 6.4% 0.1% Lead-Acid Batteries 0.0% 0.0% 2.4%Plastic Film 5.3% 4.5% 0.9% Other Household Batteries 0.1% 0.1% 0.0%R/C Plastic 3.3% 5.1% 1.1% Tires 0.1% 0.3% 0.0%
Metal 7.4% 7.6% 16.1% Bulky Items 4.0% 3.9% 0.0%Aluminum Cans 1.3% 0.7% 0.1% Fluorescent Lights 0.1% 0.0% 0.0%Other Aluminum 0.3% 0.2% 0.3% Ballasts 0.0% 0.0% 0.0%Tin Cans 1.0% 1.0% 0.0% Pallets 0.0% 3.4% 2.8%Ferrous Metals 2.7% 3.4% 14.7% Household Hazardous 0.1% 0.3% 0.1%Non-Ferrous Metals 0.1% 0.1% 0.3% Latex Paint 0.0% 0.3% 0.0%R/C Metal 1.9% 2.2% 0.6% Oil Paint 0.0% 0.0% 0.0%
Glass 4.0% 1.5% 1.5% Pesticides/Fertilizers 0.0% 0.0% 0.0%Glass - recyclable 2.7% 1.2% 0.0% Auto Used Oil Filters 0.1% 0.0% 0.1%R/C Glass 1.2% 0.3% 1.4% Mercury 0.0% 0.0% 0.0%
Organics 26.4% 21.8% 0.2% Other Hazardous 0.1% 0.0% 0.0%Yard Waste - <6" 1.0% 0.3% 0.0% Other Wastes 5.6% 4.4% 1.0%Yard Waste - >6" 0.0% 0.0% 0.0% Textiles 4.5% 2.7% 0.1%Food 10.7% 13.1% 0.0% Carpet 0.9% 1.5% 0.5%Diapers 5.7% 3.6% 0.0% Carpet Padding 0.1% 0.1% 0.4%Animal Waste/Kitty Litter 3.5% 0.9% 0.0%Bottom Fines/Dirt 2.5% 2.4% 0.0%R/C Organic 2.9% 1.4% 0.1% Total 100.0% 100.0% 100.0%

Cascadia Consulting Group, Inc. B-47 Wisconsin Waste Characterization Study Appendices
COMPOSITION COMPARISONS AMONG REGIONS
Table B - 42 - Composition Comparisons among Regions
(Calendar Year 2001)
(Mean Percentage)Material Northeast North South central Southeast West centralPaper 17.2% 25.6% 22.2% 21.7% 20.2%
Newsprint 1.2% 4.8% 2.1% 1.9% 1.6%High Grade Paper 1.0% 2.9% 1.5% 1.4% 1.1%Magazines/Catalogs 0.8% 1.2% 1.0% 1.0% 1.2%Cardboard - recyclable 3.2% 2.9% 3.1% 5.3% 3.4%Cardboard - coated 0.1% 0.1% 0.0% 0.4% 0.4%Boxboard 0.7% 0.8% 0.9% 0.6% 0.8%Mixed Recyclable Paper 3.5% 5.0% 5.3% 3.9% 4.5%Compostable Paper 4.4% 4.2% 5.3% 5.1% 4.3%R/C Paper 2.3% 3.7% 2.9% 2.1% 2.6%
Plastics 9.0% 11.7% 10.9% 10.3% 12.9%PET Bottles 0.3% 0.7% 0.4% 0.4% 0.5%HDPE Bottles - natural 0.1% 0.3% 0.2% 0.2% 0.3%HDPE Bottles - colored 0.2% 0.4% 0.1% 0.2% 0.4%#3-#7 Other Plastic Bottles 0.0% 0.0% 0.0% 0.0% 0.0%Polystyrene 0.3% 0.8% 0.5% 0.4% 0.6%Other Rigid Plastic Containers 1.0% 0.9% 1.6% 1.4% 3.4%Plastic Film 3.8% 5.0% 4.0% 3.9% 4.0%R/C Plastic 3.3% 3.6% 4.1% 3.8% 3.6%
Metal 7.7% 4.9% 4.6% 5.4% 9.4%Aluminum Cans 0.2% 0.7% 0.2% 0.3% 0.8%Other Aluminum 0.4% 0.3% 0.2% 0.3% 0.3%Tin Cans 0.6% 1.1% 0.5% 0.3% 0.8%Ferrous Metals 5.0% 1.9% 3.0% 2.6% 5.7%Non-Ferrous Metals 0.1% 0.1% 0.1% 0.2% 0.1%R/C Metal 1.5% 0.9% 0.6% 1.7% 1.8%
Glass 2.1% 4.7% 1.2% 2.6% 2.3%Glass - recyclable 0.6% 2.1% 0.9% 0.7% 1.4%R/C Glass 1.5% 2.6% 0.3% 1.8% 0.8%
Organics 19.6% 20.9% 18.4% 15.9% 18.4%Yard Waste - <6" 1.3% 0.3% 0.4% 2.0% 0.4%Yard Waste - >6" 0.2% 0.0% 0.2% 0.1% 0.0%Food 11.3% 13.1% 11.3% 8.7% 9.4%Diapers 1.8% 2.3% 1.1% 1.4% 3.5%Animal Waste/Kitty Litter 0.9% 1.1% 1.2% 0.6% 1.5%Bottom Fines/Dirt 1.3% 2.4% 2.2% 1.4% 1.9%R/C Organic 2.7% 1.8% 2.0% 1.7% 1.6%

Cascadia Consulting Group, Inc. B-48 Wisconsin Waste Characterization Study Appendices
Table B – 42 - Composition Comparisons among Regions, Contd.
(Calendar Year 2001)
(Mean Percentage)Material Northeast North South central Southeast West centralC&D 31.5% 22.1% 31.3% 28.4% 23.5%
Wood - treated 0.4% 0.9% 1.5% 1.3% 0.0%Wood - untreated 15.4% 11.8% 11.2% 12.4% 11.7%Rock/Concrete/Brick 3.3% 1.3% 2.8% 4.2% 3.9%Drywall 1.9% 2.5% 1.5% 1.7% 1.0%Roofing Shingles 3.5% 0.9% 11.7% 5.9% 4.9%PVC 0.0% 0.2% 0.0% 0.1% 0.0%Ceramics/Porcelain 0.1% 0.2% 0.2% 0.4% 0.7%Other C&D 6.9% 4.3% 2.4% 2.2% 1.4%
Problem Wastes 7.9% 5.2% 7.7% 7.6% 9.2%Televisions 0.5% 0.8% 0.2% 0.5% 0.7%Computer Monitors 0.6% 0.0% 0.0% 0.2% 0.0%Computer Equipment 0.1% 0.2% 0.0% 0.0% 0.0%Electronic Equipment 0.9% 1.3% 1.1% 1.7% 1.5%White Goods - refrigerated 0.3% 0.0% 0.6% 0.0% 0.9%White Goods - non-refrigerated 0.2% 0.0% 0.0% 0.6% 0.0%Lead-Acid Batteries 0.0% 0.0% 0.0% 0.2% 0.5%Other Household Batteries 0.1% 0.1% 0.1% 0.0% 0.1%Tires 0.1% 0.1% 0.3% 1.3% 0.2%Bulky Items 3.2% 1.6% 3.1% 2.1% 3.0%Fluorescent Lights 0.0% 0.0% 0.0% 0.0% 0.0%Ballasts 0.0% 0.0% 0.0% 0.0% 0.0%Pallets 1.8% 1.2% 2.5% 0.9% 2.2%
Household Hazardous 0.3% 0.1% 0.6% 0.9% 0.2%Latex Paint 0.1% 0.0% 0.4% 0.1% 0.1%Oil Paint 0.1% 0.0% 0.0% 0.0% 0.0%Pesticides/Fertilizers 0.0% 0.0% 0.0% 0.0% 0.0%Auto Used Oil Filters 0.1% 0.0% 0.0% 0.0% 0.0%Mercury 0.0% 0.0% 0.0% 0.0% 0.0%Other Hazardous 0.1% 0.0% 0.1% 0.8% 0.0%
Other Wastes 4.8% 4.6% 3.0% 7.2% 4.0%Textiles 2.9% 2.3% 1.4% 2.7% 2.7%Carpet 1.8% 2.2% 1.2% 4.0% 1.1%Carpet Padding 0.0% 0.2% 0.4% 0.5% 0.2%
Total 100.0% 100.0% 100.0% 100.0% 100.0%

Cascadia Consulting Group, Inc. C-1 Wisconsin Waste Characterization Study Appendices
Appendix C: SAMPLING METHODOLOGY
OBJECTIVE
The objective of this study was to provide statistically valid composition and quantity estimates of Wisconsin generated municipal solid waste (MSW) at the statewide level as well as on a regional basis and according to the substream from which the waste came: residential, industrial/ commercial/institutional (ICI), or construction/demolition (C&D). This appendix outlines the sampling methodology that was used for this study. SAMPLING GROUPS
Waste analyzed for this study includes all MSW that is generated by residents and businesses within the State of Wisconsin and that is also disposed in MSW landfills located within the state. Special industrial wastes, such as foundry sand and paper mill sludge, as well as out-of-state wastes were not included in the study. For any specific geographic area, the total waste stream can be divided into substreams to facilitate more accurate analysis. For this study, a waste substream was identified by the particular generation characteristics that make it a unique portion of the total waste stream. There were three distinct substreams identified for this study.
1. Residential – MSW generated by single-family and two- to four-unit residences.9 This waste is primarily collected in packer trucks (e.g., commercially- or municipally- operated collection vehicles that compact the residential waste as it is collected), but some residential waste is “self-hauled” to disposal facilities by residents.
2. Industrial/commercial/institutional (ICI) – MSW generated by industrial facilities,
and by businesses, institutions, and multi-family dwellings consisting of five or more units. This waste is collected in a variety of vehicles including loose drop boxes, compactor drop boxes and packer trucks. Some of this waste is self-hauled by the businesses that generated it.10
3. Construction/demolition (C&D) – MSW generated from construction or demolition
activities. This waste typically is collected in vehicles such as dump trucks, loose roll-off boxes, and end dump vehicles. It may be transported either by a municipality, commercial hauler, or by the business or resident that generated the waste.
Within each substream, there are two different hauler types: commercial and self-haul.
1. Commercially collected waste is collected and transported to the disposal facility by
municipalities or companies whose primary business is to haul waste. 2. Self-hauled waste is collected and transported to the disposal facility by the
individual, business, or government agency that generated the waste.
9 This definition of “residential” is consistent with regulatory language identifying waste generated from the residential sector. 10 Special industrial wastes such as foundry sand and paper mill sludge were not included in this study. Wisconsin MSW landfills track and report these wastes separate from MSW.

Cascadia Consulting Group, Inc. C-2 Wisconsin Waste Characterization Study Appendices
Wisconsin’s waste stream was further divided into five distinct geographic regions identified by the Wisconsin Department of Natural Resources (WDNR): North, Northeast, Southeast, South Central, and West Central. Sampling sites were selected within each of these regions to ensure a geographically representative sample of statewide disposal. The site selection methodology is explained in the next section. SITE SELECTION
The number of sites at which sampling occurred was governed by the resources available for this study. The choice of specific sites where sampling occurred was guided by the strategy of including the disposal facilities that handle the largest amounts of in-state MSW (excluding special industrial wastes) disposed within the state. Of the 400 waste samples afforded by project resources, it was known that approximately 14 samples could be sorted each day over the course of 28 sorting days. Fourteen of the state’s largest disposal sites were chosen for inclusion in the study, which corresponded to a waste sorting period of two days at each site. An initial list of 14 sites was drawn up. The list was then adjusted to include the two largest publicly owned disposal facilities and to ensure that at least two facilities were included from each of the five designated regions of the state. Each disposal facility on the resulting list was contacted and taken through a qualifying interview. Landfills that refused to participate in the study were replaced by the next largest ones, by tonnage, in the region.11 Collectively, the 14 facilities that ultimately were selected disposed of 78% of Wisconsin’s MSW in 2001. The qualifying interviews were conducted to ensure that the selected facilities were fully informed about the assistance that would be required during their participation in the study, and to verify that the facilities receive MSW representative of that disposed in Wisconsin generally. The interviews were also used to verify that the selected facilities handled enough MSW from each sampling group to warrant two days of sampling and sorting. Table C-1 lists the disposal facilities selected for participation in this study. The corresponding WDNR region, county, in-state disposed tons (excluding special industrial wastes), and percent of statewide disposal are listed. Two of the fourteen sites shown are publicly operated (Outagamie County and Dane County landfills), while private companies maintain the other 12 facilities. Each WDNR region was represented by at least two sites to ensure a geographically representative sample and to protect each participating landfill’s anonymity with regards to specific waste data.
11 In fact, a landfill located in the South central region refused to participate in the study. The next largest facility, by tonnage, in the South central agreed to participate.

Cascadia Consulting Group, Inc. C-3 Wisconsin Waste Characterization Study Appendices
Table C - 1 – Sampling Sites12
Table C-2 shows the distribution of disposed tons from which samples were drawn for each of the five WDNR regions. The percent of sampled tons roughly matches the percent of statewide disposed tons for each region, which ensured that sampled waste was geographically representative of waste disposed statewide.
Table C - 2 – MSW Tons Disposed and Sampled by Region
SAMPLE ALLOCATION
The samples were apportioned among the three waste substreams as shown in Table C-3. More samples were allocated to the ICI substream than to the residential substream, because the ICI samples were expected to display greater variability in composition. During the study design phase of the project, the Construction and Demolition (C&D) substream was identified as meriting its own allocation of samples and its own analyses. Samples were assigned to the C&D substream to the extent permitted by study resources, while still preserving a sufficient number for the residential and ICI substreams.
12 WDNR provided the tonnages listed in this table. They correspond to in-state tons disposed during the 2001 calendar year, and are reported on an annual basis by all registered landfills within the state.
Facility Name Disposed MSW Tons
Pct. of Statewide Disposal
Cum Pct. of Statewide Disposal
Region County
W M W I - ORCHARD RIDGE RECYCLING & DISPOSAL 586,401 12.34% 12.34% Southeast WaukeshaW M W I - METRO RECYCLING & DISPOSAL FACILTY 395,021 8.31% 20.65% Southeast MilwaukeeW M W I - RIDGEVIEW RDF 360,134 7.58% 28.23% Northeast ManitowocW M W I - DEER TRACK PARK INC 354,121 7.45% 35.68% South central JeffersonSUPERIOR GLACIER RIDGE LANDFILL 352,110 7.41% 43.09% South central DodgeSUPERIOR EMERALD PARK LF LLC 334,289 7.03% 50.13% Southeast WaukeshaW M W I - VALLEY TRAIL RDF 233,414 4.91% 55.04% Northeast Green LakeSUPERIOR HICKORY MEADOWS LANDFILL LLC 202,169 4.25% 59.29% Northeast CalumetSUPERIOR SEVEN MILE CREEK LANDFILL INC-SEC 2 200,032 4.21% 63.50% West central Eau ClaireSUPERIOR CRANBERRY CREEK 198,811 4.18% 67.68% West central WoodW M W I - TIMBERLINE TRAIL RDF 191,186 4.02% 71.71% North RuskOUTAGAMIE COUNTY SW DIV LF 152,429 3.21% 74.91% Northeast OutagamieDANE COUNTY LF #2 RODEFELD 83,661 1.76% 76.68% South central DaneBFI WASTE SYSTEMS OF NORTH AMERICA INC 68,650 1.44% 78.12% North Washburn
RegionTotal MSW Tons Disposed
Pct. of Statewide Disposed MSW
Tons of MSW from which samples were drawn
Pct. of Statewide Sampled Tons
Northeast 1,183,610 24.9% 948,146 25.5%North 327,802 6.9% 259,836 7.0%South central 934,348 19.7% 789,892 21.3%Southeast 1,721,362 36.2% 1,315,711 35.4%West central 585,096 12.3% 398,843 10.7%Total 4,752,218 100.0% 3,712,428 100.0%

Cascadia Consulting Group, Inc. C-4 Wisconsin Waste Characterization Study Appendices
Table C - 3 – Proposed Number of Samples
Within each of these substreams, both commercially collected and self-hauled waste was sampled. Roughly 70%, or 280 samples, were planned from commercially collected loads, and 120 samples (about 30%) were planned from self-haul vehicles.
SAMPLING CALENDAR
To ensure representation of seasonal variation in the types and amounts of waste disposed, 400 samples were apportioned evenly between two seasons – summer and winter. Since the field crew was capable of sorting about 14 samples per day, and a total of 400 samples were planned, roughly 28 days of waste sorting were required. Each selected site was assigned to one of the two sampling seasons using a random selection procedure. This procedure was designed to select at least one site per region per season. This ensured that all five WDNR regions were represented during each season.13 Table C-4 lists the sampling sites, seasons, and specific dates during which sampling occurred.
Table C - 4 – Sampling Sites and Seasons
Working around major holidays and special events (e.g., college student move-in), and the sorting crew’s availability, 14 sampling days were selected within each season. Summer sampling occurred during August and September 2002. Winter sampling occurred during November and December 2002.
13 Sampling did not occur, as planned, in the west central region during the winter season due to a tornado storm.
Facility Name Region Season DatesSUPERIOR GLACIER RIDGE LANDFILL South central Summer Aug 19-20OUTAGAMIE COUNTY SW DIV LF Northeast Summer Aug 26-27W M W I - VALLEY TRAIL RDF Northeast Summer Aug 29-30W M W I - METRO RECYCLING & DISPOSAL FACILITY Southeast Summer Oct 1-2DANE COUNTY LF #2 RODEFELD South central Summer Oct 3-4SUPERIOR CRANBERRY CREEK West central Summer Sept 24-25SUPERIOR SEVEN MILE CREEK LANDFILL INC-SEC 2 West central Summer Sept 26-27BFI WASTE SYSTEMS OF NORTH AMERICA INC North Winter Dec 2-4W M W I - TIMBERLINE TRAIL RDF North Winter Dec 5-6W M W I - DEER TRACK PARK INC South central Winter Dec 9-10SUPERIOR EMERALD PARK LF LLC Southeast Winter Nov 11-12W M W I - ORCHARD RIDGE RECYCLING & DISPOSAL Southeast Winter Nov 13-14W M W I - RIDGEVIEW RDF Northeast Winter Nov 18-19SUPERIOR HICKORY MEADOWS LANDFILL LLC Northeast Winter Nov 20-21
Substream No. of Samples
Residential 115 Industrial/Commercial/Institutional 170 Construction & Demolition 115

Cascadia Consulting Group, Inc. C-5 Wisconsin Waste Characterization Study Appendices
In order to meet the objective of sorting 400 samples at a rate of approximately 14 samples per day at each of 14 disposal facilities, the study design provided for selecting two consecutive sampling/sorting days at each facility. This arrangement also served to maximize the efficiency of the sorting crew by avoiding the need to change locations on a daily basis, and it thereby afforded more samples to the study than would otherwise have been possible. DEVELOPMENT OF SAMPLING PLAN
Development of a sampling plan required the collection of data from each selected facility about the numbers and types of vehicles that typically arrive on each day of the week. Each facility provided average daily traffic counts for commercially collected and self-haul MSW loads delivered by four vehicle types: front-end packer trucks, other packer trucks (e.g., side or rear loading), roll-off boxes (loose and compacted), and self-hauled vehicles (e.g., cars, pickups, flatbed trucks, etc.). These traffic counts excluded vehicles delivering out-of-state and special industrial wastes, such as foundry sand and paper mill sludge. Please see Appendix E for a copy of the interview form that was used when interviewing personnel at the disposal facilities. Forms were then developed to be used by each facility’s scalehouse personnel for systematically selecting vehicles for sampling. Please refer to Appendix E for an example of a vehicle selection form. The systematic selection procedure is described in the next section. FIELD PROCEDURES
Random Selection of Waste Loads To determine which vehicles to target for sampling on a given day, vehicles were systematically selected as they entered the facility. Systematic selection consisted of taking every “nth” vehicle entering the facility. Sample intervals for each vehicle type were determined by dividing the day’s expected number of vehicles by the number of samples needed on that day. For example, if 21 front-end packers were expected and three samples were needed, then every seventh vehicle would be selected for sampling. Vehicle selection occurred at the inbound scale at each facility. The scalehouse staff was instructed to systematically select four types of vehicles (front packer trucks, other packer trucks, roll-offs, and self-haul vehicles) as they entered the facility. Numbers of vehicles were tracked on a vehicle selection form given to scalehouse staff at the beginning of each sampling day. (See Appendix E for an example of a vehicle selection form.) Selected vehicles were flagged with a brightly colored placard on the windshield and were directed to the sorting area. (Appendix E contains a copy of the windshield placard.) The sorting crew’s Field Supervisor then intercepted the selected vehicles near the designated waste sorting location and checked to determine whether the day’s sampling quotas had been met for each type of vehicle arriving. If sampling quotas had already been met for a given combination of substream and hauler type, then the vehicle that had been selected at the scalehouse was allowed to tip its load without being sampled.

Cascadia Consulting Group, Inc. C-6 Wisconsin Waste Characterization Study Appendices
Driver Interviews As the vehicle approached the sorting area, the Field Supervisor noted the hauler type (commercial or self-haul) and assigned the load a unique sample identification number. The driver was asked to identify the load as residential, ICI, or C&D, and then instructed to tip the load in the designated area.
Random Selection of Samples At the tipping area, a designated member of the field crew collected the sample placard from each selected vehicle and worked closely with the loader operator to capture the sample by:
1. Visually dividing each sample load into 16 cells after the load was tipped onto the ground. Once tipped, MSW loads tend to be distributed in an elongated configuration similar to that shown in Figure C-1 below.
2. Instructing the loader operator to capture waste from two randomly selected cells
in the grid – one from the top half of the load and one from the bottom half. These two cells were randomly selected prior to sampling using a random number generator. The desired cell numbers were printed on each load’s sampling sheet (see Appendix E for a copy).14
3. Mixing the waste extracted from the two cells on a hard, flat surface. The loader
operator was instructed to mix the waste so as to distribute the various waste materials throughout the pile. First, the loader mixed the waste back and forth in one direction. Then, the loader operator took waste from a cross-section of the pile (perpendicular to the mixing direction), ensuring a representative sample (see Figure C-2 below).
4. Selecting 200 to 300 pounds of material from the mixed pile. As indicated above,
material from a cross-section of the mixed waste pile was then captured and placed into barrels or onto a tarpaulin for sorting.
If a sample load weighed less than 300 pounds, but more than 200 pounds, the entire load was sorted as a sample. If a load weighed less than 200 pounds, additional material from the same type of load was combined, or the next load was taken as an alternate.
14 A variation of this method was used for homogeneous loads, such as those from roofing companies. Waste was taken from one of the two pre-selected cells, and placed directly onto a tarp for sorting. In other words, step 2 was modified and step 3 was skipped.

Cascadia Consulting Group, Inc. C-7 Wisconsin Waste Characterization Study Appendices
Figure C - 1 – The 16-Cell Grid as Applied to a Tipped Load15
10
1
9
2 3
11
5
13
7
154
6
8
10
1
9
2 3
11
5
13
7
154
6
8
Figure C - 2 – Mixing and Extracting Waste
Mix Extract Sample for Sorting
If very few loads from a substream were delivered on a given sampling day, it was been necessary to capture two samples from the same load. To accomplish this, waste was captured from four randomly selected cells, two from the top half of the load and two from the bottom. The two waste piles (two cells per pile) were mixed once again and then were sampled as described above.
Waste Sorting and Weighing The extracted material was placed into tared barrels or onto a tarp; it was weighed to verify that enough material had been accumulated to constitute a sample. At that time, the sample also was screened for hazardous materials (e.g., sharps). Any hazardous materials were set aside, and the sample was sorted by hand into the prescribed material categories. (Please refer to Appendix A for the complete list and definitions of this study’s material categories.) The Field Supervisor monitored the homogeneity of the materials as they were sorted, reclassifying any items that were improperly sorted.
For a given sample, individual material weights were recorded on a sampling sheet (please see Appendix E for a copy) to the nearest 1/10th of a pound. In addition to the material weights, the Field Supervisor noted the incidence of (1) sharps and bio-hazardous wastes, and (2) reusable items. A count of mercury-containing items was also recorded. 15 The number of cells in this grid was adjusted downward for small loads. For example, a small load would have been divided into eight cells instead of 16 to ensure that a sufficient amount of waste (between 200 and 300 pounds per cell) was captured for sampling.

Cascadia Consulting Group, Inc. C-8 Wisconsin Waste Characterization Study Appendices
At the end of each sampling day, the Field Supervisor reviewed each waste sampling sheet to ensure accuracy, completeness, and legibility. A copy was made of each form, and the originals were shipped to Cascadia Consulting Group, Inc. for data entry and analysis.
Upon completing the summer and winter waste sorts, data from the sampling forms were entered into a Microsoft Access database customized for this project.
COLLECTION OF WASTE QUANTITY DATA
Caveat: To protect each participating landfill’s privacy, all facility-specific composition and waste quantity information was kept confidential by the consultant team. This information was neither published nor shared with the WDNR. These data were instead aggregated at the statewide, substream, and regional levels. Two types of data were collected related to waste quantities. The first type concerned the total amount of waste originating from within the State of Wisconsin and disposed at a particular disposal facility or within an entire region of the state. This information came from records maintained by WDNR. The second type of data concerned the relative amounts of waste entering each disposal facility from each type of load (i.e., residential, ICI or C&D, and commercially hauled or self-hauled). These data were obtained from participating landfills and assembled based on a combination of facility records and surveys that were conducted at the gatehouses of some facilities. Vehicle surveys were conducted at 2 of the 14 participating facilities – Metro Recycling and Disposal Facility, in Milwaukee, and Valley Trail RDF, in Greenlake – that were unable to provide information about the relative amounts of waste associated with each type of load (e.g., residential self-haul, commercially hauled ICI, etc.). The surveys provided data with which to estimate the fraction of the waste at a facility that belonged to each type of load. The methodology used for vehicle surveys is described below. For each survey day, the surveyor was on site for the full operating day, or roughly 8 to 10 hours. As each vehicle carrying waste arrived at the facility’s gatehouse, the surveyor conducted a brief interview with the driver and recorded the following information if the waste was generated within Wisconsin and was not considered as special industrial waste (e.g., foundry sand, paper mill sludge):
1. the type of waste – residential, ICI, or C&D
2. the hauler type – commercially collected or self-hauled
3. the vehicle type – packer, roll-off, self-haul, or transfer trailer A net weight for each vehicle was obtained from scalehouse records. A copy of the form that was used during vehicle surveys is included in Appendix E. When the vehicle surveys for a facility were complete, the net weights of all vehicles belonging to each load type were added together to arrive at the relative contributions from each load type (i.e., residential, ICI or C&D, and commercially hauled or self-hauled).

Cascadia Consulting Group, Inc. D-1 Wisconsin Waste Characterization Study: Appendices
Appendix D:Appendix D:Appendix D:Appendix D: CCCCOMPOSITION OMPOSITION OMPOSITION OMPOSITION CCCCALCULATIONSALCULATIONSALCULATIONSALCULATIONS
To develop composition and quantity profiles for this study, three main steps were taken. These steps are as follows:
1. Calculate the estimated composition of the waste;
2. Calculate the estimated quantity of waste; and,
3. Combine composition and quantity estimates using a weighted average calculation. Each of these steps is described in detail below. CCCCOMPOSITION OMPOSITION OMPOSITION OMPOSITION CCCCALCULATIONSALCULATIONSALCULATIONSALCULATIONS
The composition estimates represent the ratio of the components’ weight to the total wasteratio of the components’ weight to the total wasteratio of the components’ weight to the total wasteratio of the components’ weight to the total waste for each noted substream. They were derived by summing each component’s weight across all of the selected records and dividing by the sum of the total weight of waste, as shown in the following equation:
rc
wj
iji
ii
=∑
∑
where:
c = weight of particular component w = sum of all component weights for i = 1 to n where n = number of selected samples for j = 1 to m where m = number of components
The confidence interval for this estimate was derived in two steps. First, the variance around the estimate was calculated, accounting for the fact that the ratio includes two random variables (the component and total sample weights). The variance of the ratio estimator variance of the ratio estimator variance of the ratio estimator variance of the ratio estimator equation follows:
( )�V
n w
c r w
nr
ij j ii
j=
⋅
⋅
−
−
∑1 112
2
where:
w
w
n
ii=∑

Cascadia Consulting Group, Inc. D-2 Wisconsin Waste Characterization Study: Appendices
Next, precision levelsprecision levelsprecision levelsprecision levels at the 90% confidence interval were calculated for a component’s mean as follows:
( )r t Vj rj± ⋅ �
where:
t = the value of the t-statistic (1.645) corresponding to a 90% confidence level For more detail, please refer to Chapter 6 “Ratio, Regression and Difference Estimation” of Elementary Survey Sampling by R.L. Scheaffer, W. Mendenhall and L. Ott (PWS Publishers, 1986). QQQQUANTITY UANTITY UANTITY UANTITY CCCCALCULATIONSALCULATIONSALCULATIONSALCULATIONS
First, quantity estimates were derived for each substream at each of the landfills that participated in the study. The steps involved are described below.
1. From WDNR, Cascadia obtained annual tonnage figures for the total amount of MSW disposed at each participating landfill during 2001. Out-of-state and special industrial wastes, such as foundry sand and paper mill sludge, were not included in these totals.
2. When possible, Cascadia obtained from each landfill specific estimates of the tonnage
(or the percent of the landfill’s annual tonnage) for: a) the waste associated with each substream and hauler type b) the amount of waste that arrives in mixed loads c) the amount of waste that arrives from transfer stations
3. When possible, Cascadia obtained an estimate of the amount of waste to be assigned
to the residential and ICI substreams from mixed loads delivered to the facility.
4. For landfills that receive more than half of their waste from transfer stations, Cascadia contacted the transfer stations to obtain estimates of tonnage (or percent of annual tons) associated with each substream and hauler type. This was done with the transfer stations associated with seven of the 14 participating landfills.
5. For the transfer stations associated with landfills that receive less than half of their
waste from transfer stations (i.e., for those landfills not covered in Step 4 above), an alternate method was used to estimate the portion of transfer station waste belonging to each substream. Average percentages associated with each substream and hauler type were calculated for each of three groups of transfer stations – (1) those owned by Waste Management, (2) those owned by Superior, and (3) all other transfer stations. The estimated portions by substream were then applied to the total tonnage that passes through the transfer station to the landfill.
The best available information was assembled from the steps described above to bring together a complete picture of the waste entering each of the participating landfills, broken out by substream and hauler type. Next, tonnages from the landfills within each region were combined to estimate the proportions of waste by substream and hauler type at the regional level.

Cascadia Consulting Group, Inc. D-3 Wisconsin Waste Characterization Study: Appendices
While collecting tonnage data and developing tonnage estimates, only waste generated by residents and businesses within Wisconsin was considered. Additionally, special industrial wastes, such as foundry sand and paper mill sludge, and other wastes diverted from disposal (e.g., green waste) were not included. CCCCOMBINING OMBINING OMBINING OMBINING CCCCOMPOSITION AND OMPOSITION AND OMPOSITION AND OMPOSITION AND QQQQUANTITY UANTITY UANTITY UANTITY CCCCALCULATIONSALCULATIONSALCULATIONSALCULATIONS
Because each composition and quantity profile is made up of different types of waste (e.g., residential waste in the West central region is made up of waste from the two hauler types – commercial and self-haul), a weighted average calculation was used to assign relative importance to each type of waste according to their relative tonnage contribution. For example, to develop a composition and quantity profile for residential waste from the West central region, both self-haul and commercially collected waste samples were combined, with more importance given to the commercially collected ones (contributing about 85% of total residential tons disposed in that region). The tonnages used for these calculations are shown in Table D - 1 below.
Table D Table D Table D Table D ---- 1111 –––– Tonnage and Weighting Figures Associated with Each Substream Tonnage and Weighting Figures Associated with Each Substream Tonnage and Weighting Figures Associated with Each Substream Tonnage and Weighting Figures Associated with Each Substream
Residential waste ICI waste C&D waste
RegionCommercially
hauledSelf-
hauledCommercially
hauledSelf-
hauledCommercially
hauledSelf-
hauledTotal by
regionNortheast 312,478 38,393 497,579 24,600 250,104 60,456 1,183,610Northeast 131,776 6,446 127,142 3,899 51,685 6,854 327,802South central 282,283 25,582 353,428 17,727 208,765 46,563 934,348Southeast 463,414 90,610 744,185 63,327 290,317 69,508 1,721,362West central 155,973 28,724 253,467 14,844 110,391 21,697 585,096Total by substream 1,345,924 189,755 1,975,800 124,398 911,263 205,077 4,752,218 Some or all of the figures in Table D - 1 were converted to relative percents, depending on which combination of substreams and regions was being considered in a particular analysis. The relative percents were then used as weighting factors in the analysis (p in the equations that follow). To develop a quantity profile, the appropriate tonnages were also applied to the 62 waste component percentages for each analysis.16
16 Sharps and reusable items were not included in these analyses. Sharps were not included in the weight of the sample (only incidence was noted), and the weights of reusable items were categorized according to the 62 individual categories defined for the study (e.g., bulky items or white goods).

Cascadia Consulting Group, Inc. D-4 Wisconsin Waste Characterization Study: Appendices
The weighted average for a composition estimate for combined substreamsweighted average for a composition estimate for combined substreamsweighted average for a composition estimate for combined substreamsweighted average for a composition estimate for combined substreams was performed as follows:
( )O p r p r p rj j j j= + + +1 1 2 2 3 3* ( * ) ( * ) ...
where:
p = the proportion of tonnage contributed by the noted substream r = ratio of component weight to total waste weight in the noted substream for j = 1 to m where m = number of components
The variance of the weighted averagevariance of the weighted averagevariance of the weighted averagevariance of the weighted average was calculated:
VarO p V p V p Vj r r rj j j
= + + +( * � ) ( * � ) ( * � ) ...12
22
32
1 2 3

Cascadia Consulting Group, Inc. E-1 Wisconsin Waste Characterization Study: Appendices
Appendix E: FIELD FORMS The field forms for this study are included in the following order:
1. Initial Site Interview Form
2. Vehicle Survey Form
3. Vehicle selection sheet
4. Sample identification placard
5. Sampling instructions
6. Waste sampling sheet

Cascadia Consulting Group, Inc. E-2 Wisconsin Waste Characterization Study: Appendices
Initial Site Interview Form Thank you for your cooperation in completing this questionnaire. We will be sorting in August/September and November/December of 2002, over 2-3 days. We will sort about 14 loads of waste entering the site per day, and survey all vehicles entering the site on that day. Sort Season: Summer Winter Out-of-state waste? Yes No
Facility Information Facility Name Facility Address City County Region Contact Name Phone Number Primary Data Contact Phone Number Primary Field Contact Phone Number Additional Information Does this facility receive in-state waste from transfer stations? Yes No If yes, what percentage of total in-state waste comes from these stations? Please list all transfer stations delivering in-state waste below.
Transfer Station Information (if applicable) Station Name Contact Phone Notes

Cascadia Consulting Group, Inc. E-3 Wisconsin Waste Characterization Study: Appendices
Resid’l Comm’l
1. Space requirements: 2-3 truck bays (or equivalent space) will be needed adjacent to the working face/tip area of the facility. Could you provide a map of this area?
2. Equipment needs: will a front-end loader (or Bobcat) and operator be available to provide load samples?
3. Does the site have a vehicle scale(s)? Yes No How many?
Who uses the scale(s)? (e.g., commercial vehicles only, all vehicles)
4. Does the site have gates? Yes No How
many? Who uses each gate? (e.g., commercial vehicles only)
5. Hours facility is open to the public for self-haul?
6. Hours facility is open to commercial haulers?
7. In the table below, provide information for commercial and self-hauled loads during a typical week.
(IN-STATE MSW and C&D WASTE ONLY)
(For a typical week) COMMERCIAL HAULERS (Packers and Roll-offs)
SELF-HAUL (Trucks and cars)
# OF LOADS
TONNAGE
8. Please provide the following information on commercial haulers that use their facility:
Company Contact Phone

Cascadia Consulting Group E-4 Wisconsin Waste Characterization Study Appendices
9. Please complete the following table for in-state waste accepted during a typical week:
Direct haul loads by day of week. (Please do not include Transfer Trailers)
*Special includes whole loads of contaminated soil, foundry sand, paper mill sludge, and materials used for daily cover or other beneficial uses.
DAY FRONT PACKER OTHER PACKER ROLL-OFF SELF-HAUL SPECIAL*
MONDAY
# OF LOADS
TUESDAY
# OF LOADS
WEDNESDAY
# OF LOADS
THURSDAY
# OF LOADS
FRIDAY
# OF LOADS
SATURDAY
# OF LOADS
SUNDAY
# OF LOADS

Cascadia Consulting Group E-5 Wisconsin Waste Characterization Study Appendices
Additional information:
10. Can you provide written directions and/or a map to the site (such as used for directing tour groups)?
11. With prior notice, would you be willing to allow WDNR staff, local officials, and/or media persons on site during this study? How much notice would you prefer?
Thank you for completing this questionnaire. Upon completion, please fax to Mary Chamberlain at R. W. Beck: (651) 994-8396.

Cascadia Consulting Group E-6 Wisconsin Waste Characterization Study Appendices
Wisconsin Waste Characterization Study: Vehicle Survey Form
Date ______________ Surveyor Page _____ of _____
Site ___________________________
Vehicle License or ID Number Substream Hauler Vehicle Type For Mixed Res and ICI loads Net Weight of Load
Surveyor's Notes
Ask driver toR = residential S = self-haul P = packer estimate % of load T = tons
ICI = commercial C = comm'l R = roll-off that is Res and ICI P = poundsC&D = const/demo S = self-haul C = cubic yards
M = mixed T = transfer trailer (Must total to 100%)TS = transfer station
S = special % Res % ICI
1 R ICI CD M TS S S C P R S T
2 R ICI CD M TS S S C P R S T
3 R ICI CD M TS S S C P R S T
4 R ICI CD M TS S S C P R S T
5 R ICI CD M TS S S C P R S T
6 R ICI CD M TS S S C P R S T
7 R ICI CD M TS S S C P R S T
8 R ICI CD M TS S S C P R S T
9 R ICI CD M TS S S C P R S T
10 R ICI CD M TS S S C P R S T
11 R ICI CD M TS S S C P R S T
12 R ICI CD M TS S S C P R S T
13 R ICI CD M TS S S C P R S T
14 R ICI CD M TS S S C P R S T
15 R ICI CD M TS S S C P R S T
16 R ICI CD M TS S S C P R S T
17 R ICI CD M TS S S C P R S T
18 R ICI CD M TS S S C P R S T
19 R ICI CD M TS S S C P R S T
20 R ICI CD M TS S S C P R S T
21 R ICI CD M TS S S C P R S T
22 R ICI CD M TS S S C P R S T
23 R ICI CD M TS S S C P R S T
24 R ICI CD M TS S S C P R S T
25 R ICI CD M TS S S C P R S T
1. Make entries neatly in pen.2. Enter the information at the top of each page. Enter total # of pages on each page at the end of the day.3. If you circle the mixed substream, ask the driver for the % of each.4. If you make an error on an entry, draw a line through the entire entry and start over on a new line.

Cascadia Consulting Group E-7 Wisconsin Waste Characterization Study Appendices
Wisconsin Waste Characterization StudyVehicle Selection Sheet
Site: Outagamie Co. Landfill
Date: August 26, 2002
1. Cross off one number for each vehicle type entering your facility.2. When you reach the circled number, give the driver the sample placard to put on the windshield and alert the sampling crew the vehicle has been selected.3. Repeat this process until the specified number of vehicles are selected.
FRONT-LOADING PACKERS NEED 3 TOTAL - SAMPLE EVERY VEHICLE1
1
1
OTHER PACKERS (e.g. Side or Rear Loaders) NEED 3 TOTAL - SAMPLE EVERY 13th VEHICLE1 2 3 4 5 6 7 8 9 10 11 12 13
1 2 3 4 5 6 7 8 9 10 11 12 13
1 2 3 4 5 6 7 8 9 10 11 12 13
ROLL - OFFS (e.g. Loose drop boxes, compactor boxes, luggers) NEED 4 TOTAL - SAMPLE EVERY 5th VEHICLE1 2 3 4 5
1 2 3 4 5
1 2 3 4 5
1 2 3 4 5
SELF-HAUL (e.g. Cars, pick-ups, moving vans, flatbed trucks, dump trucks) NEED 4 TOTAL - SAMPLE EVERY 20th VEHICLE1 2 3 4 5 6 7 8 9 10 11 12 13 14 15 16 17 18 19 20
1 2 3 4 5 6 7 8 9 10 11 12 13 14 15 16 17 18 19 20
1 2 3 4 5 6 7 8 9 10 11 12 13 14 15 16 17 18 19 20
1 2 3 4 5 6 7 8 9 10 11 12 13 14 15 16 17 18 19 20

Cascadia Consulting Group E-8 Wisconsin Waste Characterization Proposal Appendices
Sample Identification Placard

Cascadia Consulting Group E-9 Wisconsin Waste Characterization Proposal Appendices
Sampling Instructions
AS THE VEHICLE APPROACHES: 1. Record the date and site in the upper left-hand box. 2. Assign the load a unique sample ID (e.g., “Res1” for the 1st residential sample). 3. Remove bright pink placard from vehicle windshield.
ASK THE DRIVER THE FOLLOWING: 1. Is the load commercially collected or self-hauled? Mark off the collection type.
a) Commercial haulers - companies whose primary business is to haul garbage, usually have the company name printed on the truck.
b) Self haulers – individuals, businesses, or government agencies that haul their own garbage.
2. Is the load is from a house, industrial/commercial/institutional, or construction/demolition site? Mark the substream. a) If the load is from more than one of these substreams, ask the driver to estimate the
percent of each (e.g., 80% from houses and 20% from businesses). b) If more than 80% is from one, mark that substream on the sampling sheet.
SELECT SAMPLE AND TRACK SAMPLING GOALS: 1. Direct the loader operator to the 2 cell numbers designated on the sampling sheet.
There is one cell for the top of the load and one for the bottom. 2. The sample should be mixed before sorting. 3. Track the daily sampling goals by substream as listed below. These are listed on the
bottom of the sampling sheet also.
FRONT END PACKERS
OTHER PACKERS
ROLL- OFFS
SELF - HAUL
Vehicle Type Substream No. Of Samples
ICI
Residential
ICI
C&D
Residential
C&D
ICI
2-3
3
2-3
2
1
1
2

Waste Sampling Sheet
Cascadia Consulting Group E-10 Wisconsin Waste Characterization Study Appendices
Date: 1. Newsprint
Site: 2. High Grade
Sample ID: 3. Magazines/Catalogs
Collection Type: 4. Cardboard - recyclable
5. Cardboard - coated
Substream: 6. Boxboard
7. Mixed Recyclable
If mixed, % Res and ICI: ________%Res ________%ICI 8. Compostable
9. R/C Paper
Notes:
10. PET Bottles
11. HDPE Bottles - natural
12. HDPE Bottles - colored
13. #2 - #7 - Other Bottles
14. Styrofoam
Top Cell: 15. Other Rigid Containers
16. Film
Bottom Cell: 17. R/C Plastic
18. Aluminum Cans
59. Sharps/Infectious Waste 19. Other Aluminum
(List No. of times found) 20. Tin Cans
Reusable Items 21. Ferrous
(Check if yes) 22. Non-Ferrous
23. R/C Metal
List Reusable Items (Types and Quantities)
(NOT including toilets, single-pane windows, large carpet rolls) 24. All Colors - recyclable
25. R/C Glass
26. Yard Waste - <6"
27. Yard Waste - >6"
28. Food
SAMPLING GOALS 29. Diapers
Substream: Res ICI CD 30. Animal Waste/Kitty Litter
Daily 4 6 4 31. Bottom Fines/Dirt
Per Site 8 12 8 32. R/C Organic
O R G A N I C S
PAPER
PLASTIC
METAL
GLASS
SH
Res ICI
9
2 3 4 5 6 71 8
10 11 12 13 14 15 16
Com
C&D
33. Wood - treated
34. Wood - untreated
35. Rock/Concrete/Brick
36. Drywall
37. Roofing Shingles
38. PVC
39. Ceramics/Porcelain
40. Other C&D
41. Televisions
42. Computer Monitors
43. Computer Equipment
44. Electronic Equipment
45. White Gds - refrig.
46. White Gds - non-refrig.
47. Lead-Acid Batteries
48. Other Hshld Batteries
49. Tires
50. Bulky Items
51. Fluorescent Lights
52. Ballasts
53. Pallets
54. Latex Paint
55. Oil Paint
56. Pesticides/Fertilizers
57. Auto Used Oil Filters
58. Mercury Item Count:
60. Other Hazardous
61. Textiles
62. Carpet
63. Carpet Padding
64. Top Fines Total Wt.:
(Visually estimate each material in
residue and record a % for each)
C & D
O T H E R
H H W
P R O B L E M