wolbachia intervention to reduce dengue transmission … · mathematical modelling to investigate a...
TRANSCRIPT
Mathematical modelling to investigate a
Wolbachia intervention to reduce dengue
transmission
Meksianis Zadrak Ndii
S. Si (Bachelor of Science) (Universitas Nusa Cendana, Indonesia)
M.Sc (The Australian National University, Australia)
A thesis submitted for the degree of
Doctor of Philosophy
at The University of Newcastle, Australia
2015
arX
iv:1
711.
0360
7v1
[q-
bio.
PE]
9 N
ov 2
017

Statement of originality
The thesis contains no material which has been accepted for the award of any other degree
or diploma in any university or other tertiary institution and, to the best of my knowledge
and belief, contains no material previously published or written by another person, except
where due reference has been made in the text. I give consent to the final version of
my thesis being made available worldwide when deposited in the University’s Digital
Repository, subject to the provisions of the Copyright Act 1968. Unless an Embargo has
been approved for a determined period.
Callaghan, August 2015
Meksianis Zadrak Ndii

I dedicate this work to my wife, Bertha, and our daugther, Geavanna.
Acknowledgements
I would like to take this opportunity to sincerely thank numerous people for their con-
tributions and support throughout my studies. I realise that one or two sentences are not
enough to fully acknowledge their contributions.
It was not easy to make the transition from simply being a course taker to becoming
an independent researcher. This transition would not have been possible without the help
and guidance of three inspiring, dedicated and approachable supervisors: Dr. Roslyn I.
Hickson, Dr. David Allingham, and Dr. Kathryn Glass. My PhD studies would have
taken much longer and been much more difficult without your help. To Roslyn, thank
you for our regular meetings and discussions in the early phase of my PhD (the first two
years), which have equipped me to conduct research. Thank you all for your tireless su-
pervision, expertise, wisdom, and encouragement. Our weekly skype meetings triggered
discussions, generated ideas, and of course made the completion of this thesis possible.
Thank you for your constructive feedback, suggestions of directions for my research, and
proofreading of thesis and paper drafts, which helped to improve my English writing
skills. I have learned responsibility from you all. I am fortunate to have worked with
you, and have enjoyed this challenging journey. The contribution of the late Prof. Geoffry
N. Mercer to this work is also acknowledged. He and Roslyn were the first people to
introduce me to this field, and together with David and Kathryn have helped me through
my PhD journey. I would also like to thank Dr. Teresa Bates, who, together with all my
supervisors, greatly helped me to improve my English writing.
iii
I would like to thank my wife, Bertha, for her love and support. Thanks for looking
after our daughter, Gea, without me. I hope this is the last time I will be away from home
for a long time. I thank Gea for her smile and laugh, which motivated me to work harder
and complete this work. I would also like to express my very great appreciation to my
parents, the Ndii and Djahi families for their support and prayers.
I acknowledge the University of Newcastle for awarding me a PhD scholarship and
the Faculty of Science and Information Technology for awarding me an RHD conference
scholarship. I would also like to acknowledge ANZIAM for partial funding through the
CSIRO/ ANZIAM student support scheme for my travel to the MISG and ANZIAM con-
ferences. I acknowledge Universitas Nusa Cendana for allowing me to pursue my further
study.
Thanks to my friends from Indonesia in Australia: Astija Surya, Elisa Sesa, Junaidi,
Muhammad Ilyas, Novi Bong, Sri Hastuti and Tadulako’s group, Stefa Yuwiko, and Yodi
Christiani who have made me feel at home. I would also like to thank David and Tricia
Mileham for their caring.
Above all, I believe that God has been working through these wonderful people to
make His purpose in my life fulfilled, as is stated in Jeremiah 29:11: “For I know the
thoughts that I think toward you, saith the Lord, thoughts of peace, and not of evil, to give
you hope in your latter end”. I pray for all the best for your careers, and future endeavours
in your lives.

Abstract
The introduction of Wolbachia-carrying mosquitoes into the population has recently been
proposed as an alternative strategy against dengue. Although laboratory experiments have
shown that the Wolbachia bacterium can reduce the levels of dengue virus in mosquitoes,
it is also important to assess the performance of Wolbachia in reducing the incidence of
dengue in human populations.
In this thesis, deterministic mathematical models of human and mosquito populations
in which either one or two dengue serotypes circulate are developed. We adapt these mod-
els to enable the investigation of dengue disease dynamics in the absence and presence of
Wolbachia in order to assess the performance of Wolbachia as a strategy to reduce human
dengue incidence.
When studying the situation in which a single dengue serotype is present in the popu-
lation, we consider scenarios where dengue is introduced into the human population once
and multiple times. We find that when mosquitoes infected with the Wolbachia strain
WMel, which reduces the mosquito lifespan by at most 10%, are released into the popula-
tion, the Wolbachia-carrying mosquitoes persist. The ranges of the reproductive and death
rates for Wolbachia-carrying mosquitoes which allow mosquitoes carrying Wolbachia to
persist in competition with non-Wolbachia carrying mosquitoes are also found. Further-
more, the transmission probability, the biting rate and the average death rate are the pa-
rameters exerting the most influence on the cumulative number of infectious individuals in
the population. An analysis of the basic reproduction number, R0, for the model consider-
v
ing the absence and presence of Wolbachia-carrying mosquitoes shows that the presence
of Wolbachia-carrying mosquitoes reduces the number of days for which R0 > 1. When
multiple introductions of dengue are considered, it is found that the presence of Wol-
bachia reduces the potential lengths of the seasons in which epidemics are likely to occur.
The strength of seasonality also affects the reduction in dengue incidence caused by the
introduction of Wolbachia: if seasonality is strong, then there are some seasons when
mosquitoes have longer life spans and more individuals are infected in each outbreak so
that Wolbachia becomes less effective in reducing dengue incidence.
Our two-serotype dengue models are used to investigate dengue serotypes with sym-
metric and asymmetric characteristics. For serotypes with symmetric characteristics, we
investigate the performance of Wolbachia in reducing dengue incidence under different
disease introduction scenarios, and find that a difference in the disease introduction sce-
nario does not affect the performance of Wolbachia in reducing dengue incidence. Fur-
thermore, the transmission probability is a more influential parameter regulating dengue
dynamics than antibody-dependent enhancement. When dengue serotype characteristics
differ (asymmetry), the more transmissible dengue serotype will dominate the primary
infection, while the other serotype will dominate the secondary infections. The number
of secondary infections caused by the more transmissible serotype can still be reduced
by the introduction of Wolbachia-carrying mosquitoes, but the proportional reduction in
dengue cases is not as high.
Our findings suggest that Wolbachia intervention can be used as an effective alter-
native strategy against dengue. Wolbachia should reduce the number of primary dengue
cases in areas with moderate transmission levels, and can provide an even greater re-

duction in the number of secondary cases. Given the higher risk of severe outcomes in
secondary cases, Wolbachia has great potential for improving public health.
Publications, Talks and Awards
The following is a list of papers and manuscripts that I have written during my PhD
candidature
Ndii, M.Z., Hickson, R.I., Mercer, G.N. 2012. Modelling the introduction of Wol-
bachia into Aedes aegypti to reduce dengue transmission. The ANZIAM Journal.
53(3), 213–227. http://dx.doi.org/10.1017/S1446181112000132. (This pa-
per was written and published during my PhD candidature, but was based on the
work undertaken during my Masters study at the ANU. The work is therefore not
included in this thesis.)
Ndii, M.Z., Hickson, R.I., Allingham, D., Mercer, G.N. 2015. Modelling the trans-
mission dynamics of dengue in the presence of Wolbachia. Mathematical Bio-
sciences. 262,156–166. http://dx.doi.org/10.1016/j.mbs.2014.12.011.
(This paper is based on the work in Chapters 3 and 4.)
Ndii, M.Z., Allingham, D., Hickson, R.I. Glass, K. The effect of Wolbachia on
dengue transmission dynamics when dengue is repeatedly introduced. This paper
has been submitted for publication. (This paper is based on the work in Chapters 3
and 4.)
Ndii, M.Z., Allingham, D., Hickson, R.I. Glass, K.The effect of Wolbachia on
dengue dynamics in the presence of two serotypes of dengue: symmetric and asym-
metric epidemiological characteristics. This paper has been submitted for publica-
viii
tion. (This paper is based on the work in Part 2; Chapters 6, 7, and 8.)
The following is a list of the talks I have given during my PhD candidature
Ndii, M.Z., Allingham D., Hickson, R.I., Glass, K. The effects of Wolbachia on
dengue outbreaks when dengue is repeatedly introduced. 51st Applied Mathematics
Conference ANZIAM, 2015, Gold Coast.
Ndii, M.Z.., Hickson, R.I., Allingham D., Mercer, G.N., Glass, K. Introduction of
Wolbachia into Aedes aegypti significantly reduces human dengue cases, Mathe-
matical Biology Conference, Joint meeting Society for Mathematical Biology and
Japanese Mathematical Biology 2014. 28 July–1 Agustus 2014. Osaka, Japan.
Ndii, M.Z.., Hickson, R.I., Allingham D., Mercer, G.N. The effect of Wolbachia
on dengue transmission. 50th Applied Mathematics Conference, ANZIAM 2014,
Rotorua, New Zealand.
Ndii, M.Z., Hickson, R.I., Allingham D., Mercer, G.N. An analysis of a seasonal
dengue model with the presence of Wolbachia. Joint ACT/NSW ANZIAM mini meet-
ing 2013, Sydney.
Ndii, M.Z., Hickson, R.I., Allingham D., Mercer, G.N. An analysis of a seasonal
dengue model with the presence of Wolbachia. Australian Mathematical Society
Workshop on Infectious Disease Modelling, September 2013. Newcastle.
Ndii, M.Z., Hickson, R.I., Allingham D., Mercer, G.N. Dengue and mosquitoes:
can we stop transmission?. 49th Applied Mathematics Conference ANZIAM, 2013,
Newcastle.
Ndii, M.Z., Hickson, R.I., Mercer, G.N. CARMA Seminar, 2012. The University of
Newcastle, Australia.
The following supports were received during my candidature
• Faculty of Science and Information Technology RHD Conference Scholarship to at-
tend the 2014 Annual Meeting of the Society for Mathematical Biology and Japanese
Society for Mathematical Biology, 28 July-1 August 2014, Osaka, Japan.
• Funding from the CSIRO/ANZIAM student support scheme to attend the 50th Ap-
plied Mathematics Conference, ANZIAM, 2014, New Zealand.
• Funding from the CSIRO/ANZIAM student support scheme to attend the Mathe-
matics in Industry Study Group 2013 in Brisbane, and the 49th Applied Mathematics
Conference ANZIAM, 2013, Newcastle.
Contents
Acknowledgements iii
Abstract v
Publications, Talks and Awards viii
List of Figures xviii
List of Tables xix
1 Introduction 1
1.1 Background and Research Motivation . . . . . . . . . . . . . . . . . . . 1
1.2 Research Aims . . . . . . . . . . . . . . . . . . . . . . . . . . . . . . . 4
1.3 Contributions . . . . . . . . . . . . . . . . . . . . . . . . . . . . . . . . 4
1.4 Outline of the Thesis . . . . . . . . . . . . . . . . . . . . . . . . . . . . 6
2 Literature Review 9
2.1 Biological Review . . . . . . . . . . . . . . . . . . . . . . . . . . . . . . 9
2.1.1 Dengue . . . . . . . . . . . . . . . . . . . . . . . . . . . . . . . 10
2.1.2 Dengue Vectors . . . . . . . . . . . . . . . . . . . . . . . . . . . 13
2.1.3 Wolbachia . . . . . . . . . . . . . . . . . . . . . . . . . . . . . . 15
xi
2.2 Mathematical Review . . . . . . . . . . . . . . . . . . . . . . . . . . . . 18
2.2.1 The Deterministic SIR model . . . . . . . . . . . . . . . . . . . . 18
2.2.2 Vector-borne Disease Modelling . . . . . . . . . . . . . . . . . . 21
2.2.3 Seasonality . . . . . . . . . . . . . . . . . . . . . . . . . . . . . 22
2.2.4 Basic Reproduction Number . . . . . . . . . . . . . . . . . . . . 23
2.2.5 Mathematical Models for Wolbachia Population Dynamics . . . . 24
2.2.6 Mathematical Models for Dengue in the Absence of Wolbachia . . 27
2.2.7 Mathematical Models for Dengue in the Presence of Wolbachia . . 30
2.2.8 Latin Hypercube Sampling and Partial Rank Correlation Coefficient 31
2.3 Summary . . . . . . . . . . . . . . . . . . . . . . . . . . . . . . . . . . 34
2.3.1 Biological Aspects . . . . . . . . . . . . . . . . . . . . . . . . . 34
2.3.2 Mathematical Aspects . . . . . . . . . . . . . . . . . . . . . . . 35
Part 1: A Single Dengue Serotype 37
3 Mathematical Modelling of a Single Dengue Serotype 39
3.1 Model in the Absence of Wolbachia . . . . . . . . . . . . . . . . . . . . 39
3.2 Model in the Presence of Wolbachia . . . . . . . . . . . . . . . . . . . . 45
3.3 Basic and Effective Reproduction Number . . . . . . . . . . . . . . . . . 51
3.4 Discussion . . . . . . . . . . . . . . . . . . . . . . . . . . . . . . . . . . 56
3.5 Summary . . . . . . . . . . . . . . . . . . . . . . . . . . . . . . . . . . 57
4 Dengue Transmission Dynamics for a Single Introduction Event 58
4.1 Data and Parameter Estimation . . . . . . . . . . . . . . . . . . . . . . . 58
4.2 Wolbachia Parameters . . . . . . . . . . . . . . . . . . . . . . . . . . . . 59
4.3 Measurement of the Effect of Wolbachia on Dengue Outbreaks . . . . . . 61
4.4 Sensitivity Analysis . . . . . . . . . . . . . . . . . . . . . . . . . . . . . 62
4.5 Results . . . . . . . . . . . . . . . . . . . . . . . . . . . . . . . . . . . . 63
4.5.1 Parameter Estimation and Sensitivity of the Model in the Absence
of Wolbachia . . . . . . . . . . . . . . . . . . . . . . . . . . . . 64
4.5.2 Sensitivity Analysis of the Model in the Presence of Wolbachia . . 69
4.5.3 Parameter Exploration . . . . . . . . . . . . . . . . . . . . . . . 70
4.5.4 The Basic Reproduction Number . . . . . . . . . . . . . . . . . . 73
4.6 Discussion and Conclusions . . . . . . . . . . . . . . . . . . . . . . . . . 75
4.7 Summary . . . . . . . . . . . . . . . . . . . . . . . . . . . . . . . . . . 78
5 Dengue Transmission Dynamics for Multiple Introductions 80
5.1 Introduction . . . . . . . . . . . . . . . . . . . . . . . . . . . . . . . . . 80
5.1.1 Simulation Procedure . . . . . . . . . . . . . . . . . . . . . . . . 82
5.1.2 Introduction Scenarios . . . . . . . . . . . . . . . . . . . . . . . 83
5.2 Results . . . . . . . . . . . . . . . . . . . . . . . . . . . . . . . . . . . . 84
5.2.1 Potential for an Outbreak . . . . . . . . . . . . . . . . . . . . . . 84
5.2.2 The Effect of the Strength of Seasonality . . . . . . . . . . . . . . 86
5.2.3 The Effect of the Transmission Rate . . . . . . . . . . . . . . . . 86
5.2.4 The Effective Reproduction Number . . . . . . . . . . . . . . . . 89
5.3 Discussion and conclusions . . . . . . . . . . . . . . . . . . . . . . . . . 90
5.4 Summary . . . . . . . . . . . . . . . . . . . . . . . . . . . . . . . . . . 92
Part 2: Two Dengue Serotypes 94
6 Mathematical Modelling of Two Dengue Serotypes 96
6.1 Model Formulation . . . . . . . . . . . . . . . . . . . . . . . . . . . . . 96
6.1.1 Model in the Absence of Wolbachia . . . . . . . . . . . . . . . . 97
6.1.2 Model in the Presence of Wolbachia . . . . . . . . . . . . . . . . 102
6.2 Parameter Descriptions . . . . . . . . . . . . . . . . . . . . . . . . . . . 108
6.3 Summary . . . . . . . . . . . . . . . . . . . . . . . . . . . . . . . . . . 111
7 Two Serotypes with Symmetric Epidemiological Characteristics 112
7.1 Introduction . . . . . . . . . . . . . . . . . . . . . . . . . . . . . . . . . 112
7.2 Scenarios of Dengue Introduction . . . . . . . . . . . . . . . . . . . . . . 113
7.3 Results . . . . . . . . . . . . . . . . . . . . . . . . . . . . . . . . . . . . 116
7.3.1 First Dengue Introduction Scenario . . . . . . . . . . . . . . . . . 116
7.3.2 Second Dengue Introduction Scenario of Dengue . . . . . . . . . 118
7.4 Discussion and Conclusions . . . . . . . . . . . . . . . . . . . . . . . . . 122
7.5 Summary . . . . . . . . . . . . . . . . . . . . . . . . . . . . . . . . . . 127
8 Two Serotypes with Asymmetric Epidemiological Characteristics 128
8.1 Introduction . . . . . . . . . . . . . . . . . . . . . . . . . . . . . . . . . 128
8.2 Results . . . . . . . . . . . . . . . . . . . . . . . . . . . . . . . . . . . . 131
8.2.1 Effect of Asymmetric Antibody-Dependent Enhancement . . . . . 131
8.2.2 Effect of Asymmetric Transmission Probabilities . . . . . . . . . 134
8.3 Discussion and Conclusions . . . . . . . . . . . . . . . . . . . . . . . . . 137
8.4 Summary . . . . . . . . . . . . . . . . . . . . . . . . . . . . . . . . . . 140
9 Conclusions and Future Directions 141
9.1 Summary of the Results . . . . . . . . . . . . . . . . . . . . . . . . . . . 142
9.2 Conclusions . . . . . . . . . . . . . . . . . . . . . . . . . . . . . . . . . 144
9.3 Future Directions . . . . . . . . . . . . . . . . . . . . . . . . . . . . . . 145
Appendix
Basic Reproduction Number 148
Bibliography 152
List of Figures
2.1 The lifecycle of mosquitoes . . . . . . . . . . . . . . . . . . . . . . . . . 14
2.2 The aquatic mosquito death rate for different temperatures . . . . . . . . 15
2.3 The adult mosquito death rate for different temperatures . . . . . . . . . . 16
3.1 Flowchart of the single serotype dengue model in the absence of Wol-
bachia-carrying mosquitoes . . . . . . . . . . . . . . . . . . . . . . . . . 41
3.2 Flowchart of the single serotype dengue model in the presence of Wol-
bachia-carrying mosquitoes . . . . . . . . . . . . . . . . . . . . . . . . . 46
4.1 A plot of the persistence of the Wolbachia-carrying mosquito population . 62
4.2 Plots of observed data and the output of the fitted models . . . . . . . . . 67
4.3 Plot of the PRCC over time of the model in the absence of Wolbachia . . . 68
4.4 Plot of PRCC over time for the model in the presence of Wolbachia . . . . 70
xv
xvi
4.5 Plot of proportional reduction in dengue due to Wolbachia against ratios
of death rates, reproductive rates, transmission probabilities and biting rates 71
4.6 The basic reproduction numbers for both the absence and presence of Wol-
bachia-carrying mosquitoes . . . . . . . . . . . . . . . . . . . . . . . . . 74
5.1 Plot of the time series of dengue outbreaks with weekly introductions . . . 84
5.2 Plot of the first week of introduction of introduced dengue cases versus
outbreak size . . . . . . . . . . . . . . . . . . . . . . . . . . . . . . . . 85
5.3 The effect of the strength of seasonality on the proportional reduction in
dengue . . . . . . . . . . . . . . . . . . . . . . . . . . . . . . . . . . . . 87
5.4 Plot of transmission rate (βN) vs. outbreak size in the absence and pres-
ence of Wolbachia and βN vs. the proportional reduction in dengue . . . . 88
5.5 Plot of the week of introduction of dengue cases vs. outbreak size in the
absence and presence of Wolbachia-carrying mosquitoes, and the effective
reproduction number. . . . . . . . . . . . . . . . . . . . . . . . . . . . . 89
6.1 Schematic representation of model with two dengue serotypes in the ab-
sence of Wolbachia-carrying mosquitoes. . . . . . . . . . . . . . . . . . . 98
6.2 Schematic representation of the model with two dengue serotypes in the
presence of Wolbachia-carrying mosquitoes . . . . . . . . . . . . . . . . 105
7.1 Dengue introduction scenario 1: each dengue serotype is introduced in
alternate year . . . . . . . . . . . . . . . . . . . . . . . . . . . . . . . . 114

xvii
7.2 Dengue introduction scenario 2: one dengue serotype is introduced weekly
for two years and then another dengue serotype is introduced weekly for
another two years . . . . . . . . . . . . . . . . . . . . . . . . . . . . . . 114
7.3 Time series plot for dengue introduction scenario 1 (top) and 2 (bottom) . 115
7.4 The effect of changes in the ADE rate for both dengue serotypes under the
first scenario of dengue introduction . . . . . . . . . . . . . . . . . . . . 117
7.5 Contour plots showing simultaneous changes to the ADE rate and the
transmission probability for the first scenario of dengue introduction. . . . 119
7.6 Contour plots showing simultaneous changes to the ADE rate (φ ) and the
tranmission probability (TN) for primary infections under the first scenario
of dengue introduction . . . . . . . . . . . . . . . . . . . . . . . . . . . 120
7.7 Contour plots showing simultaneous changes to the ADE (φ ) and the
transmission probability (TN) under the first scenario of dengue introduc-
tion in the secondary infections . . . . . . . . . . . . . . . . . . . . . . . 121
7.8 The effect of changes in ADE for both serotypes in dengue cases under
second scenario of dengue introduction . . . . . . . . . . . . . . . . . . . 122
7.9 Contour plots showing simultaneous changes to the ADE and the trans-
mission probability under the second scenario of dengue introduction. . . 123
7.10 Contour plots showing simultaneous changes to the ADE rate and the
transmission probability for primary infections under the second scenario
of dengue introduction . . . . . . . . . . . . . . . . . . . . . . . . . . . 124
xviii
7.11 Contour plots showing simultaneous changes to the ADE and the trans-
mission probability for secondary infections under the second scenario of
dengue introduction . . . . . . . . . . . . . . . . . . . . . . . . . . . . . 125
8.1 The effect of changes in the ADE for serotype 2 on primary and secondary
infections . . . . . . . . . . . . . . . . . . . . . . . . . . . . . . . . . . 132
8.2 The effect of changes in the ADE for serotype 2 on primary and secondary
infections caused by each serotype . . . . . . . . . . . . . . . . . . . . . 133
8.3 The effect of changes in the transmission probability of serotype 2 on
primary and secondary infections . . . . . . . . . . . . . . . . . . . . . . 135
8.4 The effect of changes in the transmission probability of serotype 2 on
primary and secondary infections caused by each serotype . . . . . . . . 136

List of Tables
4.1 Parameter descriptions, values and sources for dengue models in the ab-
sence and presence of Wolbachia-carrying mosquitoes with a single dengue
serotype . . . . . . . . . . . . . . . . . . . . . . . . . . . . . . . . . . . 65
6.1 Parameter descriptions, values and sources for dengue models in the ab-
sence and presence of Wolbachia-carrying mosquitoes with two dengue
serotypes . . . . . . . . . . . . . . . . . . . . . . . . . . . . . . . . . . . 110
xix
Chapter 1
Introduction
1.1 Background and Research Motivation
Dengue is a vector-borne disease which is transmitted by mosquitoes. Approximately
two thirds of the world’s population is living in dengue-endemic regions, with around 390
million individuals infected annually [10].
There are four serotypes of dengue: DEN1, DEN2, DEN3, and DEN4. Individuals
infected with one of the serotypes obtain life long immunity to that serotype, but only
temporary immunity to the other serotypes. When infected with a second serotype, indi-
viduals are at greater risk of developing severe forms of dengue such as Dengue Haem-
morhagic Fever (DHF) and Dengue Shock Syndrome (DSS). Interactions between dengue
serotypes may affect dengue transmission dynamics because of differences in epidemio-
logical characteristics, and disease severity [4, 27, 74, 79, 87, 92] between serotypes.
Fluctuations in mosquito populations due to climatic factors such as temperature and
rainfall results in seasonality in dengue transmission dynamics. In areas and regions where
dengue is not endemic, but mosquitoes reside, dengue outbreaks are triggered by imported
cases [46, 54]. These are individuals who have acquired dengue overseas and brought it
to the non-endemic regions. After mosquitoes are exposed to dengue, a certain period
1
2
of time is required for the dengue viruses to replicate in the mosquito’s body so that the
mosquito can transmit the disease. This period is known as the extrinsic incubation period
(EIP).
A number of strategies for controlling dengue have been implemented, but they are
difficult to sustain [31, 55, 66, 77, 78], particularly in the developing world. For exam-
ple, the use of insecticides has become largely ineffective as mosquitoes have developed
resistance to the chemicals [31, 55, 66]. Therefore, new control strategies are necessary.
One strategy that has been recently proposed is to infect mosquito populations with
the Wolbachia bacterium [11, 29, 41, 62, 67, 94]. There are two mechanisms by which
Wolbachia can work to control dengue transmission. First, Wolbachia impairs the abil-
ity of the dengue virus to replicate inside the mosquito [11, 29, 41, 67, 94], particularly
in salivary gland [94]. Consequently, the ability of Wolbachia-carrying mosquitoes to
transmit dengue viruses can be reduced. Second, Wolbachia reduces the mosquito’s lifes-
pan [94, 111]. As a result, the mosquito’s lifespan may be lower than the extrinsic incuba-
tion period (EIP) so the transmission will not occur. However, in order for this intervention
to be successful, it is necessary for Wolbachia-carrying mosquitoes to be established and
persist in the field.
Studies utilising mathematical models have suggested that Wolbachia-carrying mosquitoes
are likely to persist in the field [17, 33, 34, 70]. This has been confirmed by field exper-
iments [39, 41, 94]. An open question that then arises is “to what extent can Wolbachia
reduce dengue transmission?”. This question forms the central focus of this thesis.
To measure the effectiveness of Wolbachia in reducing dengue at the population level
is challenging since many factors such as seasonality, importation of dengue and dengue

3
serotype characteristics affect dengue transmission dynamics. An efficient way to mea-
sure the effectiveness of Wolbachia is by the use of a mathematical model. A mathematical
model allows us to determine the underlying causes of outbreaks and to understand the
effectiveness of the control strategies that have been implemented. To date, few studies
have used mathematical models to understand the effect of Wolbachia in reducing dengue
transmission, and hence our models will provide new insight on the effectiveness of Wol-
bachia in reducing dengue at a population level. Further, we shall investigate the effects of
seasonality, dengue importation, and dengue serotype characteristics, which have received
relatively little attention.
We are particularly interested in quantifying the effectiveness of Wolbachia-carrying
mosquitoes on the reduction of dengue incidence once their population has been estab-
lished. As a result, we shall assume that Wolbachia-carrying mosquitoes persist and are
established in the population, and shall not investigate the spread of mosquitoes carrying
Wolbachia into the population in this thesis.
Throughout this thesis, the terminology “dengue/disease introduction” refers to dengue/
disease importation. For clarity, two things should be noted. When studying the effects
of Wolbachia in the presence of a single dengue serotype, single and multiple dengue in-
troductions mean that we introduce a single dengue serotype once and multiple times, re-
spectively. Second, when studying the effects of Wolbachia in the presence of two dengue
serotypes, dengue cases are introduced multiple times, with different dengue serotypes.
The term, “dengue introduction scenarios” is used to refer to the manner in which a par-
ticular dengue serotype is introduced into the population.
4
1.2 Research Aims
The main question addressed in this thesis is “to what extent can Wolbachia reduce dengue
transmission?”. This has been approached by formulating novel mathematical models in
the absence and presence of Wolbachia-carrying mosquitoes for single and two dengue
serotypes. The specific aims of this thesis are to:
1. Determine the level of reduction in dengue incidence caused by the presence of Wol-
bachia-carrying mosquitoes.
2. Explore the effects of seasonality and other important parameters on dengue trans-
mission dynamics and the persistence of Wolbachia-carrying mosquitoes.
3. Determine the effects of dengue introduction scenarios on the performance of Wol-
bachia in reducing dengue incidence.
4. Investigate the effects of two dengue serotypes and dengue serotype characteristics
on the performance of Wolbachia in reducing dengue incidence.
1.3 Contributions
The novel contributions of this thesis are as follows.
1. Deterministic mathematical models of scenarios incorporating one and two dengue
serotypes in the absence and presence of Wolbachia-carrying mosquitoes are pro-
duced, incorporating sinusoidally forced death rates for the mosquitoes. These mod-
els take into account important biological features of dengue and Wolbachia. The
5
models are used to study the effectiveness of Wolbachia in reducing the incidence
of dengue at a population level. Furthermore, these models serve as a baseline for
further investigation of Wolbachia interventions. To the best of our knowledge, the
two serotype dengue model in the presence of Wolbachia is the first population level
model to investigate the effectiveness of Wolbachia in the presence of more than one
dengue serotype.
2. The important parameters of the models that drive dengue epidemics, are determined
using sensitivity analysis through the standard combination of Latin Hypercube Sam-
pling and Partial Rank Correlation Coefficient (LHS/PRCC) [13, 56, 103], where the
parameters relative significances are ranked. These findings will be useful to guide
future data collections to better inform future models.
3. The ranges of biologically realistic parameter values, which determine the persistence
of Wolbachia-carrying mosquitoes and dengue epidemics, are calculated. These find-
ings confirm the potential Wolbachia strains that can persist in the field, and also the
maximum benefits of Wolbachia for the different parameter values.
4. The level of reduction in dengue incidence due to Wolbachia intervention is deter-
mined by comparing the relative difference of the outbreak sizes in the absence and
presence of Wolbachia-carrying mosquitoes. We estimate the level of reduction in
dengue incidence due to Wolbachia in scenarios where one and two dengue serotypes
are present. In the single serotype scenario, the levels of dengue incidence reduction
after single and multiple introductions of dengue are determined. In the presence of
two dengue serotypes, the levels of dengue incidence reduction for serotypes with
6
symmetric and asymmetric epidemiological characteristics are determined.
1.4 Outline of the Thesis
In the next chapter, we present a review of literature related to this thesis, and then in
the subsequent six chapters, we present the original contributions of this thesis. These
contributions are divided into two parts corresponding to the presence of one (Chapters 3-
5) and two (Chapters 6–8) dengue serotypes in the population. The final chapter discusses
the conclusions drawn and future directions for research. A brief overview of the contents
of each chapter is given below.
Chapter 2: Literature Review
A review of literature is presented in this chapter. Chapter 2 contains reviews of relevant
literature from two main viewpoints: biological and mathematical reviews. The biolog-
ical literature reviewed presents background information about dengue, dengue vectors
and Wolbachia. The mathematical reviews provide background on the deterministic SIR
model, vector-borne disease modelling, seasonality, the basic reproduction number, and
introduce models specific for Wolbachia population dynamics and models for dengue epi-
demiology in the absence and presence of Wolbachia-carrying mosquitoes.
Chapter 3: Mathematical Modelling of a Single Dengue Serotype
This chapter contains the full derivation of our single serotype dengue models in the ab-
sence and presence of Wolbachia-carrying mosquitoes. The assumptions and important
features of these models are described. The models are an extension of previously pub-
lished models by Ndii et al. [70]∗ and introduce a human population in which dengue∗This work was conducted during my Masters study at the ANU
7
is present as well as seasonally varying death rates for adult mosquitoes. These models
are then used to study the effect of single and multiple dengue introductions, which are
presented in Chapter 4 and Chapter 5, respectively. The expressions for the basic and
effective reproduction numbers for these models are also derived.
Chapter 4: Dengue Transmission Dynamics for a Single Introduction Event
In this chapter, the performance of Wolbachia in reducing dengue incidence after a single
introduction of dengue cases is investigated. The parameter estimation is also presented.
We justify the parameter values chosen and explore the parameter spaces of several pa-
rameters. A global sensitivity analysis for the model is also conducted, and we compare
the reproduction numbers obtained in the absence and presence of Wolbachia-carrying
mosquitoes.
Chapter 5: Dengue Transmission Dynamics for Multiple Introductions
In this chapter, we investigate multiple introductions of dengue cases over weekly, year-
round and three month periods, and assess the performance of Wolbachia in reducing
dengue in these scenarios. We then investigate the potential for an outbreak, and the
effects of the transmission rate and seasonality on Wolbachia performance in reducing
dengue. We also compare the effective reproduction number and our simulations where
dengue cases are introduced for one week of the year.
Chapter 6: Mathematical Modelling of Two Dengue Serotypes
After studying the performance of Wolbachia in reducing dengue incidence when only a
single dengue serotype circulates, we turn our attention to the performance of Wolbachia
in reducing dengue in the presence of two dengue serotypes. We begin by developing two
serotype dengue models in the absence and presence of Wolbachia-carrying mosquitoes.

8
These models take into account antibody-dependent enhancement (ADE) and temporary
immunity. As a reminder for readers, we re-describe the parameter values used in our in-
vestigation. The models are then used to study the effects of the symmetric and asymmet-
ric epidemiological characteristics of dengue serotypes which are presented in Chapters 7
and 8, respectively.
Chapter 7: Two Serotypes with Symmetric Epidemiological Characteristics
In this chapter, the symmetric epidemiological characteristics of dengue serotypes under
different disease introduction scenarios are investigated. Two disease introduction scenar-
ios are considered. First, individuals carrying dengue serotype 1 are introduced into the
population at weekly intervals for one year, and then individuals carrying another dengue
serotype are introduced into the population at weekly intervals for another year. Second,
individuals carrying dengue serotype 1 are introduced into the population at weekly inter-
vals over a period of two years, and then individuals carrying another dengue serotype are
introduced into the population at weekly intervals over a further two year period. We ex-
plore the effects of the antibody-dependent enhancement and the transmission probability
on Wolbachia performance in reducing dengue incidence in these two scenarios.
Chapter 8: Two Serotypes with Asymmetric Epidemiological Characteristics.
In this chapter, we study the performance of Wolbachia in reducing dengue incidence
when the epidemiological characteristics of dengue serotypes differ. As in Chapter 7, we
explore the effects of the antibody-dependent enhancement and the transmission proba-
bility on Wolbachia performance in reducing dengue incidence.
Chapter 9: Conclusions and Future Directions
In this chapter, we summarise the original results discovered in this thesis, present our
conclusions and suggest several possible future directions for research.
Chapter 2
Literature Review
The review of literature presented in this chapter is divided into two parts: a review of bio-
logical literature and a review of mathematical literature. The biological literature review
introduces dengue (Section 2.1.1), the dengue vector (Section 2.1.2), and Wolbachia (Sec-
tion 2.1.3). The mathematical literature review explains the deterministic SIR model (Sec-
tion 2.2.1), vector-borne disease modelling (Section 2.2.2), the inclusion of seasonality in
compartmental models (Section 2.2.3), the basic reproduction number (Section 2.2.4),
and introduces a model for Wolbachia population dynamics (Section 2.2.5), a model for
dengue in the absence (Section 2.2.6) and presence of Wolbachia (Section 2.2.7), and
the Latin Hypercube Sampling (LHS) and Partial Rank Correlation Coefficient (PRCC)
methods (Section 2.2.8).
When material from this review is required in later chapters, we shall reference the
appropriate sections so that the interested reader can review the details.
2.1 Biological Review
This section presents background information about dengue, dengue vectors and Wol-
bachia.
9
10
2.1.1 Dengue
Dengue is a vector borne disease that is transmitted by mosquitoes, and has attracted pub-
lic health concern worldwide. Over 40% of the world’s population are living in dengue-
endemic regions and approximately 390 million individuals are infected with dengue an-
nually [10]. Infections with the dengue virus can lead to dengue fever (DF), dengue haem-
orrhagic fever (DHF) and dengue shock syndrome (DSS), the last two of which are the
most severe forms of dengue. The fatality rates for DHF and DSS can be as high as 20%,
although this can be reduced to less than 1% if the proper treatment is accessible [102],
which is generally in developed countries.
The number of dengue cases is increasing worldwide [45, 64, 75]. For example, in
Australia, there has been an increasing trend in the number of dengue cases over the last
two decades, an increase from around 17 in 1991 to over 1000 in 2015 [75]. In dengue
endemic countries there are also increasing numbers of dengue cases. In Indonesia, the
incidence of dengue has been increasing since 1968 [45]. In Malaysia, the number of
dengue cases increased by 14% annually from 2000–2010 [64].
In regions or countries where dengue is not endemic, outbreaks of the disease are
triggered by imported cases. These are individuals who have acquired dengue overseas. In
Australia, local outbreaks are generally caused by imported cases, with an estimated 1132
overseas-acquired cases of dengue entering Australia in 2010 [46]. In Taiwan, dengue
outbreaks begin by importation of dengue. The disease then spreads until transmission
ends in winter due to the cold weather. The same pattern is repeated every year [54]. These
examples highlight the effect of dengue importation on disease transmission dynamics.

11
There are four serotypes of dengue viruses: DEN1, DEN2, DEN3 and DEN4. Indi-
viduals obtain lifelong immunity to a given dengue serotype after infection with it, and
have a short-term antibody response to the other serotypes, which lasts for around 2–9
months [96]. If they are subsequently infected by a different serotype, they are likely to
contract DHF or DSS. Patients with a severe form of dengue show peak viraemia levels
(levels of the virus in the blood) 100–1000 times higher than DF patients [92].
DHF is associated with the antibody dependent enhancement (ADE) of dengue virus
replications. The ADE mechanism is as follows. An individual who is primarily infected
by a particular serotype will produce neutralising antibodies to that serotype, but when
the same individual is secondarily infected with other serotypes, the pre-existing antibod-
ies to the previous infection do not neutralise, but rather enhance, the replication of the
secondary virus [68, 98]. ADE may result in higher transmissibility rates of dengue from
humans to mosquitoes.
There is variability in the epidemiological characteristics of the four dengue serotypes,
and the severity of the disease varies between serotypes [4, 27, 74, 79, 87, 92]. Nishiura
and Halstead [74] found that DEN1 infection causes more severe symptoms than DEN4,
while Tricou et al. [87] found that infections with DEN1 result in higher viraemia levels
than infections with DEN2. Estimates of the basic reproduction numbers from serological
data showed relatively little difference between dengue serotypes [27, 79].
The distribution and the dominance of dengue serotypes in a given outbreak varies
over time. In Thailand, all four dengue serotypes circulated during the period 2000-
2010, with DEN3 being dominant during the periods 2000–2002 and 2008–2010, whereas
DEN4 was most common between 2003 and 2008 as reported by Limkittikul et al. [53].

12
In Malaysia, DEN1 was dominant during 2004 and 2005, but was overtaken by DEN2,
which was dominant during 2006 and 2007. Although all four dengue serotypes were cir-
culating in 2014, none of them was dominant [64]. In Taiwan, DEN2 dominated during
2002 and 2003, DEN3 dominated during 2005–2006, and DEN1 dominated in 2004 and
2007 [54]. More information about dengue epidemics in several countries can be found
in the literature (see, for example, [14, 22, 52, 93]).
In general, the characteristics of DF infection are high fever with a temperature of ap-
proximately 40◦C, severe headache, pain behind the eyes, muscle and joint pains, nausea,
vomiting, swollen glands or rash. These symptoms last for approximately 2–7 days. Peo-
ple with a severe form of dengue exhibit all DF symptoms, together with plasma leakage,
fluid accumulation, respiratory distress, severe bleeding, or organ impairment, symptoms
which may lead to death if proper treatment is not administered [102].
The dynamics of dengue transmission are very seasonal due to fluctuations in the
dengue vector caused by climatic factors such as temperature and rainfall. Furthermore,
there are differences between regions or countries in the periods when epidemics occur.
For example, in Thailand, the number of cases peaks between May and September each
year as reported by Limkittikul et al. [53]. In Taiwan, the peak is around October and then
incidence diminishes around December [54].
There are several important aspects to be considered when studying dengue dynam-
ics at a population level: importation of dengue, dengue serotype characteristics and the
seasonal factors which affect the mosquito population dynamics.

13
2.1.2 Dengue Vectors
Two vectors that transmit dengue are Aedes albocpictus and Aedes aegypti. The latter is
considered to be the main vector. Aedes albocpictus mostly lives in rural areas and large
water containers. Aedes aegypti is highly anthropophilic, preferring to feed on humans
only, and lives in urban and semi urban areas which are densely populated. Aedes aegypti
moves only short distances of around 300 m during its lifetime [36].
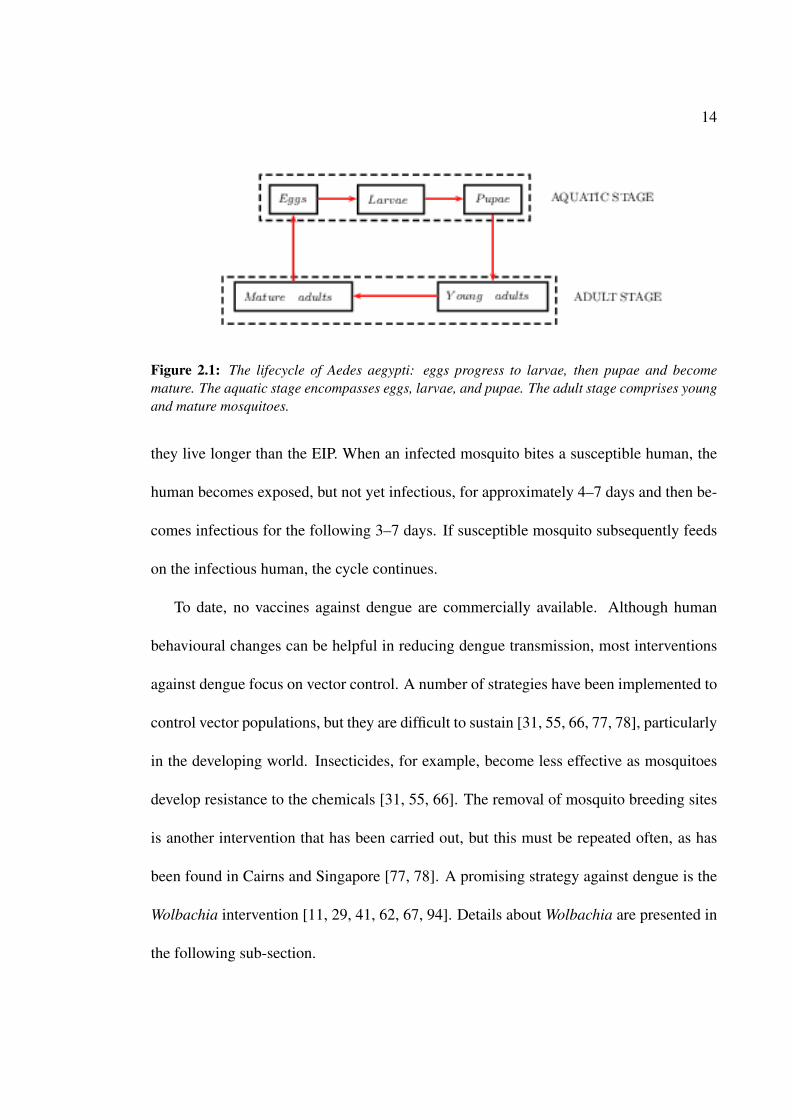
Figure 2.1 shows the Aedes aegypti lifecycle, which consists of eggs, larvae, pupae,
young adult and adult Aedes aegypti. In modelling, eggs, larvae and pupae are commonly
grouped into one category because only adult mosquitoes can transmit dengue and the
dengue virus cannot influence the aquatic stage of development. The mosquito life cycle
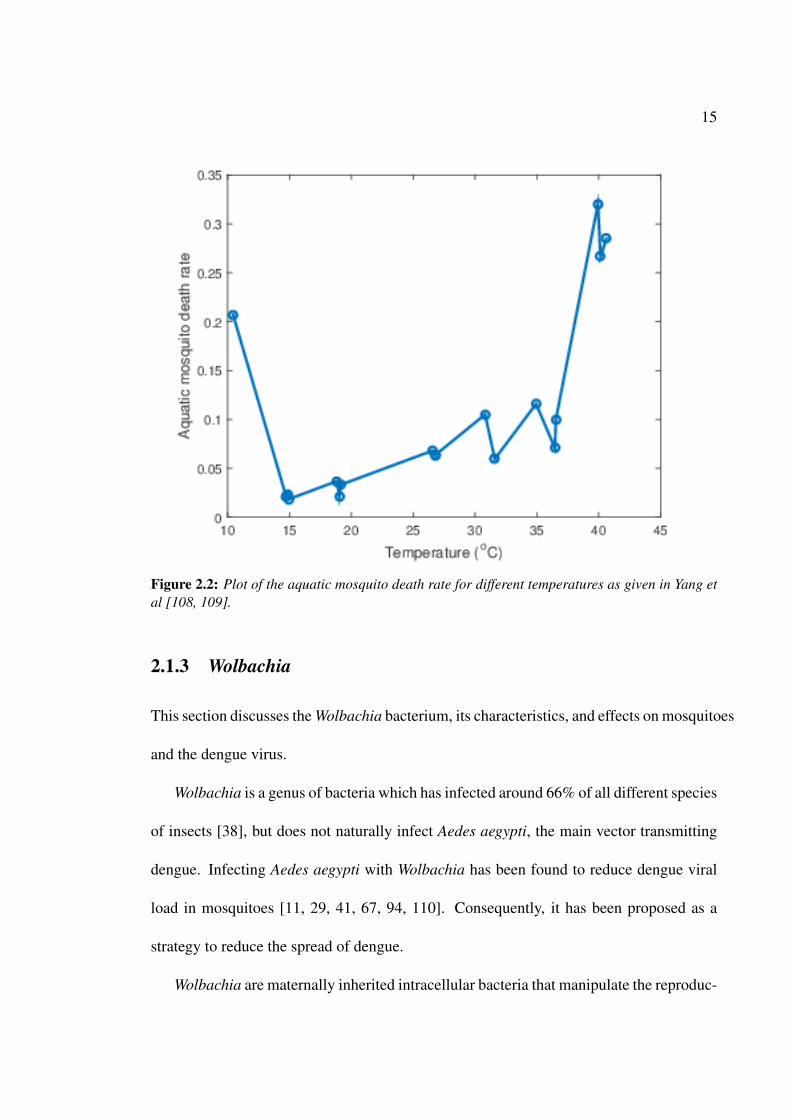
is highly dependent on climatic conditions such as temperature and rainfall. Figures 2.2–
2.3 show the plots of the aquatic death rate and the adult mosquito death rate against
temperature given by Yang et al. [108, 109]. These figures show that the aquatic death
rate and the adult mosquito death rate vary as the temperature changes. Figure 2.2 shows
that the aquatic death rate is high when the temperature is less than approximately 13◦C
or greater than 35◦C. The adult death rate is very high when the temperature is below
15◦C (see Figure 2.3).
When feeding on an infected human, Aedes aegypti ingests viraemic blood. After a
period of time known as the Extrinsic Incubation Period (EIP), the salivary glands of the
mosquito become infected. During the EIP the viruses replicate and are internally dis-
seminated within the mosquito. The EIP varies depending on temperature, but on average
lasts for one to two weeks [16, 95]. Infected mosquitoes are able to transmit dengue if
14
Figure 2.1: The lifecycle of Aedes aegypti: eggs progress to larvae, then pupae and becomemature. The aquatic stage encompasses eggs, larvae, and pupae. The adult stage comprises youngand mature mosquitoes.
they live longer than the EIP. When an infected mosquito bites a susceptible human, the
human becomes exposed, but not yet infectious, for approximately 4–7 days and then be-
comes infectious for the following 3–7 days. If susceptible mosquito subsequently feeds
on the infectious human, the cycle continues.
To date, no vaccines against dengue are commercially available. Although human
behavioural changes can be helpful in reducing dengue transmission, most interventions
against dengue focus on vector control. A number of strategies have been implemented to
control vector populations, but they are difficult to sustain [31, 55, 66, 77, 78], particularly
in the developing world. Insecticides, for example, become less effective as mosquitoes
develop resistance to the chemicals [31, 55, 66]. The removal of mosquito breeding sites
is another intervention that has been carried out, but this must be repeated often, as has
been found in Cairns and Singapore [77, 78]. A promising strategy against dengue is the
Wolbachia intervention [11, 29, 41, 62, 67, 94]. Details about Wolbachia are presented in
the following sub-section.
15
Figure 2.2: Plot of the aquatic mosquito death rate for different temperatures as given in Yang etal [108, 109].
2.1.3 Wolbachia
This section discusses the Wolbachia bacterium, its characteristics, and effects on mosquitoes
and the dengue virus.
Wolbachia is a genus of bacteria which has infected around 66% of all different species
of insects [38], but does not naturally infect Aedes aegypti, the main vector transmitting
dengue. Infecting Aedes aegypti with Wolbachia has been found to reduce dengue viral
load in mosquitoes [11, 29, 41, 67, 94, 110]. Consequently, it has been proposed as a
strategy to reduce the spread of dengue.
Wolbachia are maternally inherited intracellular bacteria that manipulate the reproduc-

16
Figure 2.3: Plot of the adult mosquito death rate for different temperatures as given in Yang etal. [108, 109].
tion of a diverse range of arthropod hosts. One form of reproductive manipulation caused
by Wolbachia infection is known as cytoplasmic incompatibility (CI) [41, 86, 94, 97]. CI
gives a female Aedes aegypti mosquito a reproductive advantage, the details of which are
given below.
1. Wolbachia-carrying female mosquitoes produce viable offspring when mating with
either Wolbachia-carrying or non-Wolbachia male mosquitoes, and immature mosquitoes
mature to non Wolbachia and Wolbachia-carrying mosquitoes.
2. Non-Wolbachia female mosquitoes can only reproduce successfully with non-Wolbachia
male mosquitoes, and immature mosquitoes mature to non-Wolbachia mosquitoes
17
only.
3. If non-Wolbachia female mosquitoes mate with Wolbachia-carrying males, they can-
not produce offspring successfully, although an embryo is formed, further blocking
reproduction [94].
Laboratory experiments have been conducted to assess the effects of Wolbachia on
Aedes aegypti. Two Wolbachia strains were used in these experiments: WMelPop and
WMel [41, 88, 90, 94]. WMelPop halves the mosquito lifespan [94, 111] and reduces egg
viability [63]. WMelPop has been found to reduce blood feeding success [89]. Further-
more, a fecundity cost of up to 56% has been found in WMelPop-carrying mosquitoes [61,
94]. By contrast, WMel reduces the mosquito lifespan by approximately 10% [94], does
not influence the time development of Aedes aegypti and has no significant effect on egg
viability after oviposition [94]. Both strains of Wolbachia have the ability to reduce the
levels of dengue viruses in the salivary glands of Aedes aegypti [67, 94].
If Wolbachia causes a marked reduction in the mosquito lifespan, multiple introduc-
tions of Wolbachia-carrying mosquitoes may be required to ensure Wolbachia persis-
tence in the wild. The elapsed time between introductions and the number of released
mosquitoes determines the likelihood of persistence [34]. The release of more males than
females can also lead to Wolbachia persistence [35, 113].
Results from field experiments show that Wolbachia-carrying mosquitoes can per-
sist [39, 41]. These results suggest that the population of Wolbachia-carrying mosquitoes
can stabilise over time, and hence, potentially reduce dengue transmission. Furthermore,
the proportion of Wolbachia-carrying mosquitoes in the field has been found to be around
18
90% in comparison to non-Wolbachia mosquitoes [39, 41]. Moreover, the maternal trans-
mission of Wolbachia may be perfect or near to perfect, as seen in field trials [39]. Lower
rates of infection with dengue viruses of serotypes 1–3 in mosquitoes carrying Wolbachia
have also been found.
In summary, there are several important characteristics of Wolbachia that can affect
the population dynamics of mosquitoes, namely cytoplasmic incompatibility (CI), the
mosquito death rate and the maternal transmission. Dengue-related characteristics such
as reduced biting rates, and reduced levels of dengue virus in mosquitoes are also key to
the potential reduction in dengue transmission.
2.2 Mathematical Review
This section presents the mathematical theory used in this thesis. This includes a formu-
lation of the deterministic SIR model, an explanation of seasonality, and discussions of
vector-borne disease modelling, the basic reproduction number, a model specific for Wol-
bachia and dengue dynamics, and the latin hypercube sampling (LHS) and partial rank
correlation coefficient (PRCC) methods for multivariate analysis.
2.2.1 The Deterministic SIR model
A deterministic formulation of the SIR model is presented in this section. A deterministic
model is appropriate when studying disease transmission dynamics in large populations,
as is the case throughout this thesis. The SIR model has been used as a cornerstone for the
development of compartment-based models. The general principle of compartment-based

19
models is that the population is divided into different sub-populations, according to their
disease status. In the SIR model, the population is divided into three sub-populations,
namely Susceptible (S), Infectious (I) and Removed (R).
Let us consider the simple SIR model without demography and assume homogenous
and well-mixed populations. Humans are born susceptible to infection and move to the
infectious class at a rate β after contact with infectious individuals. After a period of time
1/γ , they recover. This SIR model is governed by the following system of differential
equations
dSdt
=−β IS, (2.1)
dIdt
= β IS− γI, (2.2)
dRdt
= γI, (2.3)
where β and γ are positive constants. Here the parameter β represents a combination
of the rate at which contact between susceptible and infectious people is made and the
probability that contact results in the successful transmission of the disease, while the
parameter γ is the recovery rate.
We can determine the threshold above which an epidemic occurs by rearranging the
infected population equation (Equation 2.2), that is
dIdt
= I (βS− γ) .
20
It is easy to see that the critical threshold is S = γ/β , where the populations of S and I
are in proportions. When an infectious case is introduced to the population, an epidemic
will proceed if the susceptible population is higher than this critical threshold, otherwise
an outbreak cannot occur. The inverse of this critical threshold is called the basic repro-
duction number (further explained in subsection 2.2.4), which is defined to be the number
of new cases generated by a typical infectious individual in an entirely susceptible popu-
lation.
The classical SIR model can be extended by adding other classes, depending on the
purpose of the model and the characteristics of the disease being studied. For example,
if a disease has a latent period, one may add a latent compartment to the system of equa-
tions. Another possible extension would be to include demographic factors such as birth
and death rates. As additional details are incorporated into the model, it becomes more
complex, and typically the calculation of the basic reproduction number is conducted by
constructing the next generation matrix and finding the spectral radius of that matrix as
described in Section 2.2.4. Although some analytical expressions such as the steady state
or the critical threshold can be derived, deriving analytical solutions in terms of S and I
simultaneously is not straightforward [47]. This is particularly true when models become
increasingly complex as additional important features are included. One way to find the
solutions of a deterministic model is by the use of computational tools. Throughout this
thesis, we use MATLAB [58] to generate the solutions of the models.
21
2.2.2 Vector-borne Disease Modelling
Some diseases such as malaria, chikungunya, and dengue are transmitted to humans via
a vector and consequently their transmission dynamics are affected by the population dy-
namics of the vector. At the population level, the transmission dynamics of vector-borne
diseases can be investigated using mathematical models [60, 72, 104, 105]. Determin-
istic models provide one technique for modelling the transmission dynamics of vector-
borne diseases, particularly in large populations. The simple SIR model presented in
Section 2.2.1 can be extended into such a model by including the vector population and
introducing parameters which adjust for the biological features of the vectors and the dis-
ease. A review on vector-borne disease mathematical models can be found in Smith et
al. [83].
When more than one vector is involved in the transmission of a disease, the biological
features of each vector such as its transmission rate, and birth and death rates influence
disease transmission. In this thesis, we construct deterministic mathematical models in-
cluding two types of mosquitoes: mosquitoes not carrying Wolbachia and mosquitoes
carrying Wolbachia (referred throughout this thesis as “non-Wolbachia” and “Wolbachia-
carrying” mosquitoes, respectively), together with the human population with dengue, and
use these models to investigate the spread of dengue. We focus on the situation where an
outbreak occurs and measure the reduction in the number of people infected due to the
introduction of Wolbachia-carrying mosquitoes.
22
2.2.3 Seasonality
The transmission of infectious diseases varies seasonally depending on various factors.
Climatic fluctuation contributes to the seasonal dynamics of many infectious diseases
because it affects pathogen transmission rates [49]. For vector-borne diseases, climatic
factors are linked to the fluctuation of vector populations and, hence, to vector-borne
disease transmission.
In most mathematical models, the seasonal effect is captured by the use of sinusoidal
and/or square wave functions. For example, seasonal variation in the transmission rate
can be represented using a sinusoidal function such as
β (t) = β0 (1+δ cos2πt) , (2.4)
where β (t) is the transmission rate which varies seasonally, β0 is the average transmission
rate, and δ is the amplitude of seasonal forcing of the transmission rate or “strength of
seasonality” and lies between 0 and 1.
Seasonal variation can also be modelled using a square wave function such as
β =
β0 (1+δ ) , for high seasons,
β0 (1−δ ) , for low seasons,(2.5)
where each year is divided into two different seasons: the high season and the low season.
The parameter δ represents the degree of seasonality which varies between 0 and 1 (see
[25, 48, 71, 76, 85]).
23
2.2.4 Basic Reproduction Number
The basic reproduction number is an important quantity in epidemiological modelling
which is commonly estimated when data is available [19, 30]. The basic reproduction
number, generally denoted by R0, is defined to be the number of secondary cases gener-
ated by a typical infectious individual in an entirely susceptible population. The expres-
sion for the basic reproduction number can be obtained by constructing the next gener-
ation matrix (NGM) for the model [23, 24, 37, 91] and finding its dominant eigenvalue.
Another method to derive the basic reproduction number for a non-seasonal model is to
use the “survival function”. However, this method becomes increasingly difficult when
there are more infectious states and hence the use of the next generation approach is more
appropriate [37].
Diekmann et al. [24] give a clear explanation of how to construct the NGM, which
they denote by K. The decomposition of the NGM relates to epidemiologically new in-
fections only. For example, changes in the population in a model with latent and infectious
compartments consist of new infections into the latent compartment and members of the
population moving from the latent to the infectious compartment. The change from the
latent to the infectious compartment is not a new infection. A matrix whose decomposi-
tion relates to the expected offspring of individuals in any infected state is called a next
generation matrix with large domain and denoted by KL. Diekmann et al. showed that the
largest eigenvalue of the next generation matrix with large domain is equal to that of the
next generation matrix, ρ (KL) = ρ (K), and hence, to the basic reproduction number, R0.
The steps for finding the basic reproduction number given in Diekmann et al. [24] are
24
the following.
1. Let n be the number of infected states, and xxx=(x1,x2, ...,xn) be the possible infected
states of individuals. We write a linearised infected subsystem around the disease-
free steady state in the form
dxdtdxdtdxdt
= (TTT +ΣΣΣ)xxx , (2.6)
where T is the transmission matrix, which encodes the production of new infection,
and ΣΣΣ is the transition matrix, which encodes the transition of infected individu-
als between compartments including those that transfer out of compartments for
reasons such as the death of the individual.
2. The next generation matrix with large domain can be found using the formula KL =
−TΣΣΣ−1. The basic reproduction number is calculated by finding the spectral radius
of the matrix KL.
2.2.5 Mathematical Models for Wolbachia Population Dynamics
A number of mathematical models have been developed to provide insight into the popula-
tion dynamics of Wolbachia-carrying mosquitoes [17, 33, 34, 57, 70, 112, 113]. Hancock
et al. [34] developed a mathematical model to explore the host population dynamics and
Wolbachia infection frequency with both single and multiple introductions (“seeding”)
of Wolbachia-carrying mosquitoes. The same authors also developed a metapopulation
model to explore spatial dynamics and found that spatial variations in density-dependent
competition have an effect on the spread of Wolbachia infection [33]. Chan and Kim [17]
developed a spatial mathematical model incorporating both slow and fast dispersal situa-
25
tions for the spread of mosquitoes. They found that temperature affects the speed of Wol-
bachia invasion and that the death rate of Wolbachia-carrying mosquitoes influences their
persistence. Zhang et al. [112] developed a birth-pulse model of Wolbachia spread con-
sidering cyptoplasmic incompatibility and different density dependent death rates. They
found that it is likely that mosquitoes carrying Wolbachia will invade the population.
Zheng et al. [113] developed a mathematical model to analyse the release of Wolbachia-
carrying mosquitoes into the population, and found that the release of minimal numbers
of mosquitoes with Wolbachia can lead to persistence of Wolbachia-carrying mosquitoes.
Ndii et al. [70] developed a mathematical model of mosquito population dynamics in
the presence of Wolbachia which incorporated the effects of CI in the mating function
and competition for resources in the aquatic stage. They found that Wolbachia-carrying
mosquitoes and non-Wolbachia mosquitoes can coexist, and showed that the steady state
where Wolbachia-carrying mosquitoes alone persist only exists when maternal transmis-
sion is perfect, a finding which was confirmed by Chan and Kim [17]. Rodriguez et
al. [57] used a mathematical model to analyse the changes in the proportion of Wol-
bachia-carrying mosquitoes during the host’s life cycle on the dynamics of the spread
of Wolbachia, and found that the spread of Wolbachia may be affected by these changes.
In this thesis, we extend the model of Ndii et al. [70] to include a human population
in which dengue is present. The extended model is used to investigate the performance
of Wolbachia in reducing dengue. The model for mosquito population dynamics in the
presence of Wolbachia-carrying mosquitoes as given by Ndii et al. [70] is governed by
the following differential equations
26
dAN
dt= ρN
FNMN
P
(1− (AN +AW )
K
)−µNAAN− τNAN , (2.7)
dMN
dt= εNτNAN−µNMN + εNW (1−α)τW AW , (2.8)
dFN
dt= (1− εN)τNAN−µNFN +(1− εNW )(1−α)γW AW , (2.9)
dAW
dt= ρW
FW (MW +MN)
P
(1− (AN +AW )
K
)−µWAAW − τW AW , (2.10)
dMW
dt= εW ατW AW −µW MW , (2.11)
dFW
dt= (1− εW )ατW AW −µW FW , (2.12)
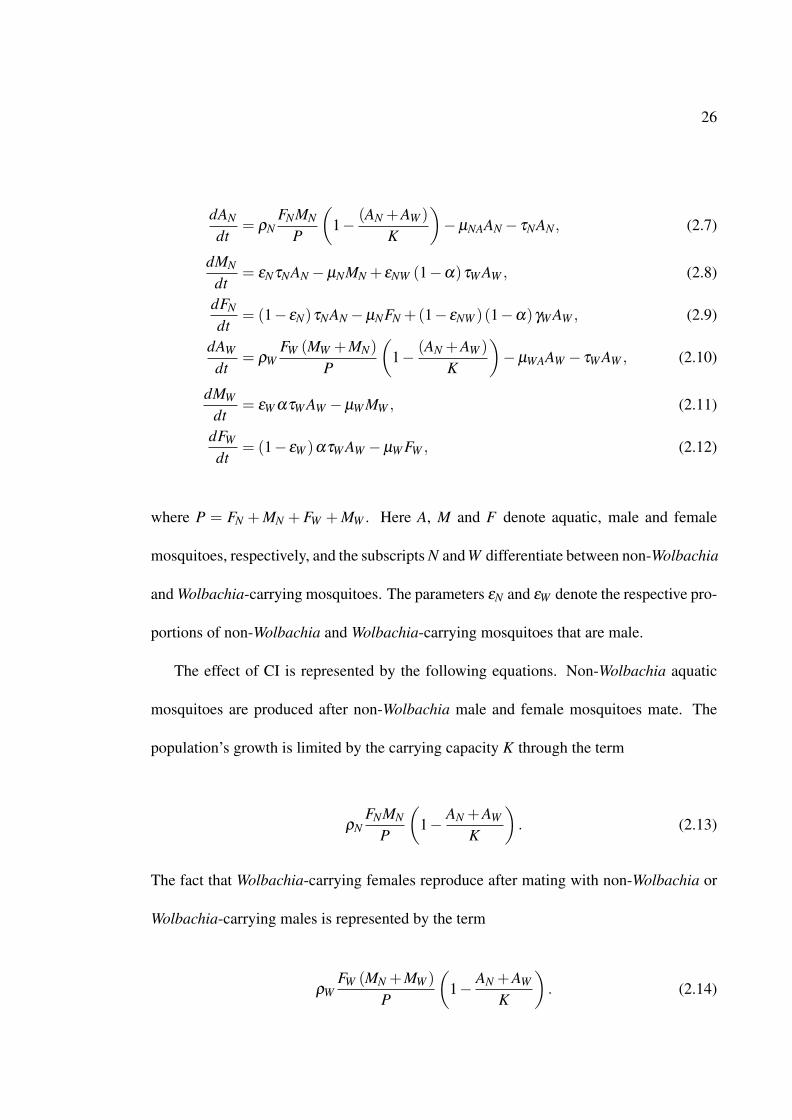
where P = FN +MN + FW +MW . Here A, M and F denote aquatic, male and female
mosquitoes, respectively, and the subscripts N and W differentiate between non-Wolbachia
and Wolbachia-carrying mosquitoes. The parameters εN and εW denote the respective pro-
portions of non-Wolbachia and Wolbachia-carrying mosquitoes that are male.
The effect of CI is represented by the following equations. Non-Wolbachia aquatic
mosquitoes are produced after non-Wolbachia male and female mosquitoes mate. The
population’s growth is limited by the carrying capacity K through the term
ρNFNMN
P
(1− AN +AW
K
). (2.13)
The fact that Wolbachia-carrying females reproduce after mating with non-Wolbachia or
Wolbachia-carrying males is represented by the term
ρWFW (MN +MW )
P
(1− AN +AW
K
). (2.14)

27
Furthermore, the effects of imperfect maternal transmission are also included in the
model. That is, not all Wolbachia aquatic mosquitoes mature to be Wolbachia-carrying
adult mosquitoes. A proportion of them mature to be non-Wolbachia adults. This pro-
portion is represented by the parameter α . A proportion εNW of the Wolbachia aquatic
mosquitoes that mature to become non-Wolbachia mosquitoes become male and the rest
become female mosquitoes.
2.2.6 Mathematical Models for Dengue in the Absence of Wolbachia
A number of dengue models have been developed and analysed. A review of various
deterministic dengue models can be found in Andraud et al. [6]. Dengue models were
split into two categories: vector-host and host-to-host transmission.
To capture the effect of seasonality, a sinusoidal function is generally used [5, 60].
For example, McLennan-Smith and Mercer [60] developed a mathematical model for
dengue which included seasonality in the transmission rate. The model was found to have
increasingly complex behaviour as the strength of seasonality was increased. Andraud
et al. [5] used a periodically-forced model to estimate parameter values using data from
Singapore. They found a good fit between the output from the model and the data from
Singapore, and showed that seasonality is an important factor driving dengue dynamics.
Yang and Ferreira [107] developed a dengue mathematical model with variation in
some parameter values over time. The parameters were set to different values to represent
favourable and unfavourable conditions for the development of mosquitoes. Their model
divided aquatic and adult mosquito populations into six compartments: eggs, larvae, pu-
pae, susceptible, exposed and infectious adults. They found that, although dengue persists
28
in favourable conditions, there is a gap of several years between successive outbreaks of
dengue.
Several studies have investigated the effects of introducing individuals with dengue
into the population [9, 99]. Bannister-Tyrrell et al. [9] investigated the variation of dengue
activity in Australia using a process based modelling approach in which dengue was in-
troduced bimonthly, monthly and weekly. They found that increasing the frequency of
introductions of dengue results in larger outbreaks. Williams et al. [99] used an exist-
ing dengue model, which involved an entomological component (CIMSiM) and a disease
component (DENSiM), to assess the effects of the importation rate on dengue outbreaks.
They conducted weekly introductions with the number of imported dengue cases rang-
ing from 1–25 individuals. They found that higher rates of importation each week result
in increased monthly dengue incidence. However, these studies did not investigate the
importation of different serotypes of dengue, a factor which is known to affect dengue
transmission dynamics and have effects on secondary infections.
A number of mathematical models considering multiple serotypes of dengue have
been developed [1, 3, 12, 21, 26, 42, 50, 65, 100]. An important issue that arises when in-
vestigating disease dynamics in the presence of multiple serotypes of dengue is the effect
of antibody dependent enhancement (ADE) on dengue dynamics. Adams and Boots [1]
used a two-serotype dengue model to study dengue transmission dynamics, and found that
the enhancement of transmission does not lead to the exclusion of either serotype when
both serotypes have the same basic reproduction number. Ferguson et al. [26] found that
enhancement may permit the coexistence of all serotypes. Woodall and Adams [100]
developed a model in which they assumed that only small fraction of primarily infected
29
humans became susceptible to enhanced secondary infection. They found that antibody-
dependent enhancement may not be driving the oscillatory dynamics of dengue. Aguiar
et al. [3] developed a seasonal multiple serotype dengue model and performed a com-
parison study between non-seasonal, low seasonal and high seasonal models with a low
importation rate of infected individuals. They found complex dynamics, and a match be-
tween empirical DHF monitoring data and model simulations. Romero et al. [65] found
that the presence of ADE heterogenity can facilitate the persistence of dengue serotypes.
Kooi et al. [50] used a mathematical model to analyse the characteristics of two dengue
serotypes for which the force of infection differs. They concluded that models that include
the assumption of identical epidemiological characteristics are useful when the difference
between dengue serotype characteristics is not great, otherwise an exploration of different
(asymmetric) epidemiological characteristics is required. However, most of these studies
did not consider different disease introduction strategies (or Wolbachia).
Most multiple serotype dengue models do not take vector population dynamics into
account. Hu et al. [42] investigated the effect of including the mosquito population and
the host incubation period on the dynamics of dengue when multiple serotypes are circu-
lating. In this host-only model, they found a large degree of frequency instability which
made future predictions difficult. However, this behaviour disappears when the vector is
included in the model. Their findings emphasize the importance of including vectors of
dengue in mathematical models.
Another area of deficiency in the mathematical literature lies in the scarcity of stud-
ies investigating Wolbachia intervention using mathematical models which include both
non-Wolbachia and Wolbachia-carrying mosquitoes. Given that the presence of multiple

30
serotypes of dengue has been observed to influence dengue dynamics, a study of the ef-
fectiveness of the Wolbachia intervention in reducing dengue in the presence of more than
one dengue serotype is also worthwhile.
2.2.7 Mathematical Models for Dengue in the Presence of Wolbachia
Few mathematical models have been developed that couple a model of the Wolbachia-
carrying mosquito population with a human dengue model [35, 43]. Hughes et al. [43] de-
veloped a mathematical model considering the situation where only either non-Wolbachia
or Wolbachia-carrying mosquitoes persist in the population. They found that Wolbachia
can be a powerful control for dengue when R0 is not too large (R0 < 6.2). Hancock
et al. [35] explored a scenario of Wolbachia release and its effects on vector-borne dis-
eases, but did not specifically consider dengue. They found that the male-biased release
of Wolbachia-carrying mosquitoes can reduce disease transmission. Ferguson et al. [28]
formulated and estimated a basic reproduction number (R0) for dengue, and found that
Wolbachia can reduce the basic reproduction number by 66–75 %. A reduction of the
basic reproduction number by 66–75 % should be sufficient to reduce dengue incidence
in areas with low to moderate transmission settings, that is, with typical R0 = 3−4 [28].
However, if R0 > 4, a reduction of 66-75% still results in R0 > 1 and hence, dengue
outbreaks can still occur. Although the effective reproduction number is still higher than
unity, the presence of Wolbachia can still reduce the number of dengue cases, though the
proportional reduction in dengue incidence is not high.
The existing studies have not investigated the effect of disease introduction scenarios
on Wolbachia performance. This is important as the introduction of dengue into the pop-

31
ulation is irregular, and it is uncertain which dengue serotypes will enter the population
at any given time. If the characteristics of dengue serotypes differ [4, 27, 74, 79, 87, 92],
undertanding the effects of these factors on Wolbachia performance in reducing dengue
incidence is important. To our knowledge, no population level models have been devel-
oped to study the performance of Wolbachia in reducing dengue incidence when more
than one dengue serotype circulates. In this thesis, we develop models in which two
dengue serotypes circulate and study the performance of Wolbachia in reducing dengue
incidence under these conditions.
2.2.8 Latin Hypercube Sampling and Partial Rank Correlation Co-
efficient
The degree of certainty in models for infectious disease dynamics is not always known.
Although some parameter values can be estimated from data, there remains uncertainty
in estimates. Other parameter values are difficult to estimate from data. For example,
data sets generally do not provide information on the number of asymptomatic cases, or
the exact time a pathogen infects people. Therefore, it is important to conduct sensitivity
analyses of the model parameters in order to determine which parameters have the greatest
effects on the model outcomes of interest, and to assess the likely impact of changes in
parameters within reasonable bounds.
If the inputs such as parameters or initial conditions are known with little uncertainty,
we can estimate the degree of uncertainty in the output by finding the partial derivative of
the output function with respect to the input parameters [18, 56]. This is known as a local
32
sensitivity analysis. In epidemiological models, most parameters are very uncertain, and
so a global sensitivity analysis is more appropriate.
Latin Hypercube Sampling (LHS), in conjuction with Partial Rank Correlation Coef-
ficient (PRCC) multivariate analysis [13, 56], is often used for global sensitivity analysis.
LHS is a stratified Monte Carlo sampling method, where the random parameter distribu-
tions are divided into N equal probability intervals [13, 56, 59, 103]. Here N is the sample
size. Each interval of each parameter is sampled only once without replacement, and the
entire range of each parameter is explored [13, 56, 59, 103]. Inputs and outputs are then
ranked before PRCC indices are determined.
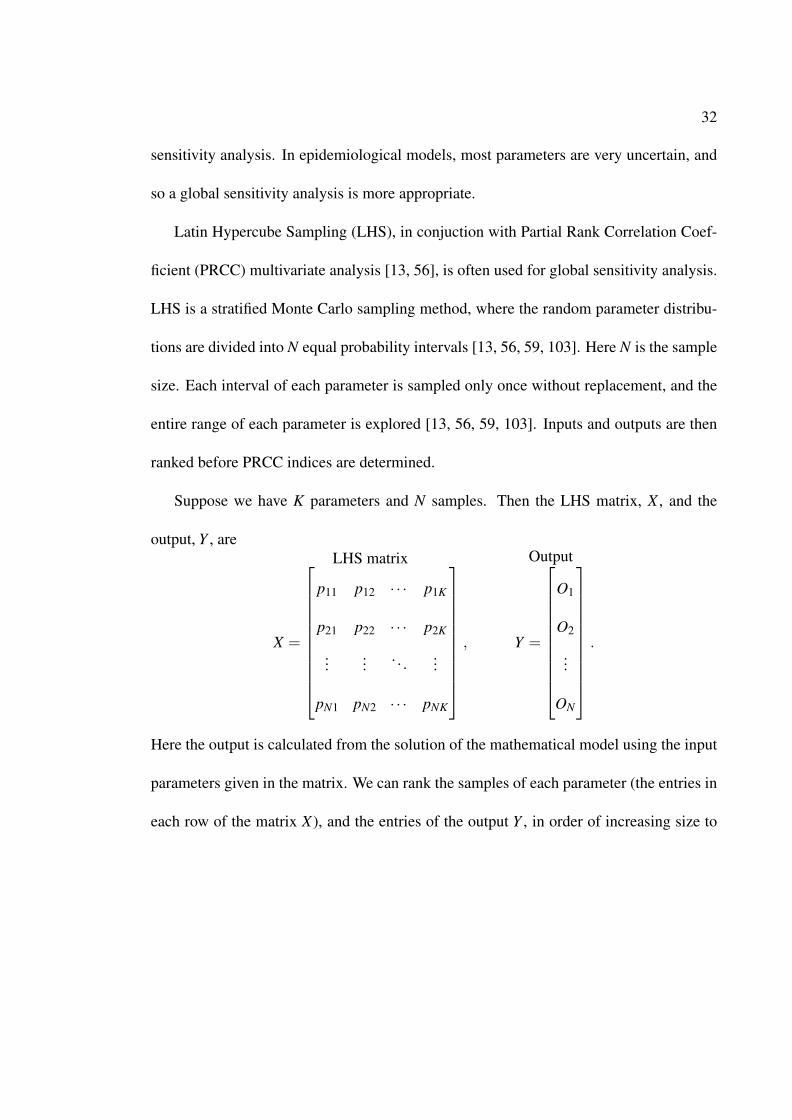
Suppose we have K parameters and N samples. Then the LHS matrix, X , and the
output, Y , areLHS matrix
X =
p11 p12 · · · p1K
p21 p22 · · · p2K
...... . . . ...
pN1 pN2 · · · pNK
,
Output
Y =
O1
O2
...
ON
.
Here the output is calculated from the solution of the mathematical model using the input
parameters given in the matrix. We can rank the samples of each parameter (the entries in
each row of the matrix X), and the entries of the output Y , in order of increasing size to

33
give matricesLHS matrix
XR =
x11 x12 · · · x1K
x21 x22 · · · x2K
...... . . . ...
xN1 xN2 · · · xNK
,
Output
YR =
y1
y2
...
yN
,
with entries XR = [xi j] and YR = [yi], where xi j ∈ {1, . . . ,K} is the rank of parameter pi j in
our parameter sample ordering and yi ∈ {1, . . . ,N} is the rank of output Oi in the ordering
of our output values.
The partial rank correlation coefficient between XR and YR (PRCC(XR,YR)) is found
using the formula [20, 56]
γxy =Cov(x j,y)√(
Var(x j)Var(y)) = ∑
Ni=1(xi j−µx
)(yi−µy)√
∑Ni=1(xi j−µx
)2∑
Ni=1 (yi−µy)
2, (2.15)
where µx and µy are the sample means, and j = 1,2, ..,K.
The partial rank correlation coefficient is then inspected to assess the sensitivity of the
parameters. If the coefficient is close to 1 or -1, the parameters are more sensitive, with
negative values indicating an inverse relationship between the inputs and outputs. For
example, an increase in the inputs leads to a decrease in outputs, and conversely. As the
PRCC measures the nonlinear but monotonic relationships between inputs and outputs,
then the output should be increasing monotonic function. In our analysis, the output is the
cumulative number of infectious humans.
Significance tests can be performed to assess whether PRCC (γ) is significantly dif-
ferent from zero. This is tested using the statistic [13, 20]

34
T = γ
√N−21− γ2 . (2.16)
If the PRCC value is higher than the T-test value, it is statistically significant.
2.3 Summary
This chapter is summarised in two sections, covering biological and mathematical re-
views.
2.3.1 Biological Aspects
1. The increasing number of dengue cases in many countries is an indication of the threat
it poses.
2. There are four dengue serotypes. Individuals infected by one of the seroptypes gain
life long immunity to that serotype, but are more likely to develop a more severe form
of dengue called Dengue Haemorhagic Fever (DHF) or Dengue Shock Syndrome
(DSS) when they are later infected by other serotypes. A particular risk associated
with secondary infections is higher viral loads, which can lead to higher transmissi-
bility and death.
3. Aedes albopictus and Aedes aegypti are mosquitoes that transmit dengue. The latter
is considered to be the main vector. The death rate of mosquitoes is environmentally-
dependent.
4. Wolbachia gives female mosquitoes a reproductive advantage, known as cytoplasmic
35
incompatibility (CI). Wolbachia reduces the lifespan of mosquitoes by up to 50% for
the WMelPop strain and 10% for the WMel strain. It also reduces the reproductive
rate and viral load in the mosquitoes.
5. The higher death rates for mosquitoes carrying Wolbachia may result in Wolbachia-
carrying mosquitoes being unable to persist in the field.
6. Little research has been conducted to investigate potential reductions in dengue when
the Wolbachia intervention is implemented in the field.
7. The times of importation of dengue into the population are irregular, and the dengue
serotypes that enter the population are uncertain.
8. Little research has considered the effects of different disease importation strategies
on Wolbachia performance in reducing dengue.
2.3.2 Mathematical Aspects
1. A deterministic model can be utilised to understand disease transmission dynamics,
in particular, for large populations.
2. The basic reproduction number R0 is the average number of new cases generated by
one infected individual in an entirely susceptible population. R0 is used to determine
whether epidemics can occur.
3. Mathematical models for single and multiple serotypes of dengue have been devel-
oped, but only a few include a Wolbachia-carrying mosquito population.
4. Seasonal effects can be captured using sinusoidal or square wave functions.
36
5. A global sensitivity analysis is highly relevant as most parameters of epidemiological
models are very uncertain. Latin Hypercube Sampling, in conjunction with the Partial
Rank Correlation Coefficient calculation, can be used to understand the sensitivity of
the outcome variables to the input parameters.
6. Only a few mathematical models have been developed to study the effect of Wol-
bachia on dengue transmission dynamics.
7. Very few mathematical models have been developed to study the performance of Wol-
bachia in reducing dengue when more than one dengue serotype circulates in the
population.
Part 1: A Single Dengue Serotype
In part 1 of this thesis, we investigate the performance of Wolbachia in reducing the inci-
dence of dengue in populations where a single dengue serotype is circulating. The focus
is on single and multiple introductions of dengue cases into the population. This part
comprises Chapters 3–5, and the results are summarised below.
Summary
• Single serotype dengue transmission models in the absence and presence of Wol-
bachia-carrying mosquitoes are developed in Sections 3.1 (Equations (3.1)–(3.8)) and
3.2 (Equations (3.18)–(3.29)), respectively.
• We estimated parameter values for the model against data from Cairns, Australia,
presented in Table 4.1, Section 4.5.1.
• Sensitivity analyses, conducted in Sections 4.5.1 and 4.5.2, reveals that the transmis-
sion probability, the biting rate and the average adult mosquito death rate are the most
influential parameters (see Figures 4.3 and 4.4).
• Using the WMel strain allows Wolbachia-carrying mosquitoes to persist according to
our steady state analysis of the model (Section 4.2, Figure 4.1).
• We show in Section 4.5.4 that Wolbachia reduces the number of days at which the
37

38
reproduction number is higher than unity (R0 > 1) by up to 78 days (Section 4.5.4,
Figure 4.6).
• Wolbachia introduction reduces the lengths of the potential seasons in which epi-
demics occur by up to six weeks as shown in Section 5.2.1, Figure 5.2.
• Wolbachia is effective in reducing dengue incidence by up to 80% in areas or re-
gions with low and medium seasonality and moderate transmission rates as shown in
Sections 5.2.2 and 5.2.3, Figures 5.3 and 5.4, respectively.

Chapter 3
Mathematical Modelling of a Single Dengue
Serotype∗
In this chapter, seasonal dengue models for a single serotype in the absence and presence
of Wolbachia-carrying mosquitoes are developed. The models are an extension of the
model developed by Ndii et al. [70] for mosquito populations, which was reviewed in
Section 2.2.5. The aim of this chapter is to present a full derivation and important features
of the models. In Chapters 4 and 5 we shall use these models to investigate the effects of
Wolbachia on dengue transmission dynamics under single and multiple introductions of
dengue.
3.1 Model in the Absence of Wolbachia
In this section we formulate the baseline model, that is, the model in the absence of
Wolbachia-carrying mosquitoes. Our model includes populations of humans and non-
Wolbachia mosquitoes.
The human and mosquito populations in this model are assumed to be homogeneous
∗The models are part of the manuscripts that have been published as “Modelling the transmission dy-namics of dengue in the presence of Wolbachia”, Meksianis Z. Ndii, R. I. Hickson, David Allingham, G.N.Mercer, in Mathematical Biosciences (2015) and submitted as “The effect of Wolbachia on dengue out-breaks when dengue is repeatedly introduced”, Meksianis Z. Ndii, David Allingham, R.I. Hickson, KathrynGlass.
39

40
and well-mixed, and we assume that only one dengue serotype is circulating. The model
comprises human and vector (mosquito) populations, with births and seasonally forced
deaths for the adult mosquito population. As the ratio between male and female mosquitoes
is approximately 1.02:1 [7], the numbers of male and female mosquitoes are assumed to
be equal. As only female mosquitoes feed on blood from humans as part of their reproduc-
tive cycle, only female mosquitoes can transmit dengue. Consequently, this model only
considers female mosquitoes. Vertical transmission of dengue in mosquitoes can occur
(see, for example, [44, 51]), however this tends to be at low levels [51], and there is no
evidence this level changes with the introduction of Wolbachia, and so we ignore vertical
transmission. A schematic representation of the model is given in Figure 3.1. Here the
subscript H denotes the human population and the subscript N denotes the non-Wolbachia
mosquito population.
The human population is divided into four subpopulations, namely Susceptible (SH),
Exposed (EH), Infectious (IH) and Recovered (RH). Furthermore, a constant human pop-
ulation size is assumed, and hence human birth and death rates are assumed to be equal,
that is, B = µH and NH = SH +EH + IH +RH .
The mosquito population is divided into subpopulations of Aquatic (AN) comprised of
eggs, larvae and pupae, Susceptible (SN), Exposed (EN) and Infectious (IN) mosquitoes.
The total adult female mosquito population is FN = SN +EN + IN . The subscript N is
used to denote non-Wolbachia mosquitoes. We use this subscript here for consistency and
to differentiate from the Wolbachia-carrying mosquitoes included in the models in later
sections. We group eggs, larvae and pupae into one compartment as they are not involved
in the transmission of dengue. Without loss of generality, they can be represented by a

41
Figure 3.1: The flowchart of the model in the absence of Wolbachia-carrying mosquitoes, Equa-tions (3.1)–(3.8). Solid lines are population progression lines and dashed lines are disease trans-mission lines. The subscript H is for the human population and N is for the non-Wolbachiamosquito population. The compartments are ‘S’ for susceptible, ‘E’ for exposed to dengue, but notyet infectious, ‘I’ for infectious, ‘R’ for recovered, and ‘A’ for the aquatic phase of the mosquitolife cycle. The transition rates between compartments are shown next to the progression lines andthese are described in the text.
single death rate and maturation rate for the purpose of modelling. No recovered class is
required for mosquitoes as they remain infected for the rest of their lives.

42
The model is then governed by the following system of differential equations,
dSH
dt= BNH−
bNTNIN
NHSH−µHSH , (3.1)
dEH
dt=
bNTNIN
NHSH− γHEH−µHEH , (3.2)
dIH
dt= γHEH−σ IH−µHIH , (3.3)
dRH
dt= σ IH−µHRH , (3.4)
dAN
dt= ρN
FN
2
(1− AN
K
)− (τN +µNA)AN , (3.5)
dSN
dt= τN
AN
2−(
bNTNIH
NH+µN(t)
)SN , (3.6)
dEN
dt=
(bNTNIH
NH
)SN− (γN +µN(t))EN , (3.7)
dIN
dt= γNEN−µN(t)IN . (3.8)
The probability of transmission from a non-Wolbachia mosquito to a human is assumed
to be the same as the reverse, hence we let THN = TNH = TN . The variation in the adult
mosquito death rate is strongly influenced by environmental factors such as temperature,
humidity, and rainfall [109] and in our model is sinusoidally forced,
µN(t) = µN0
(1−η cos
(2π(t +ω)
365
)). (3.9)
Here η is the amplitude of seasonal forcing in the adult death rate, which will be called

43
the strength of seasonality throughout this thesis. Further, µN0 is the average adult death
rate, t is time and ω is the phase shift, which is used to align the cosine function with
the seasonal factors in Far North Queensland. This forcing of the adult death rate results
in appropriate seasonal fluctuations in the adult mosquito population, in turn leading to a
seasonal aquatic population through the mating function. Hence, there is no need to force
the reproductive rate, and we keep it constant.
A human becomes exposed (but not yet infectious) after being bitten by an infectious
mosquito at rate bNTNIN/NH (Equations (3.1) and (3.2)), where bN is the successful biting
rate and TN is the transmission probability from non-Wolbachia mosquitoes to humans and
the reverse. Exposed humans then become infectious at rate γH and recover from dengue
at rate σ .
The aquatic population increases as the male and female mosquitoes mate and breed,
but the population is limited by carrying capacity K through a logistic term
ρNFNMN
MN +FN
(1− AN
K
).
Since there are equal numbers of male and female mosquitoes, MN = FN , this becomes
ρNFN(1−AN/K)/2 (Equation (3.5)). Members of the aquatic population die at rate µNA
and mature into susceptible female mosquitoes at rate τN , where only half of the maturing
aquatics are female. Susceptible mosquitoes progress to the exposed class after biting
infectious humans at rate bNTNIH/NH . They then become infectious at rate γN (Equation
(3.8)), where 1/γN is the extrinsic incubation period.
The populations of both humans and mosquitoes are non-dimensionalised by letting
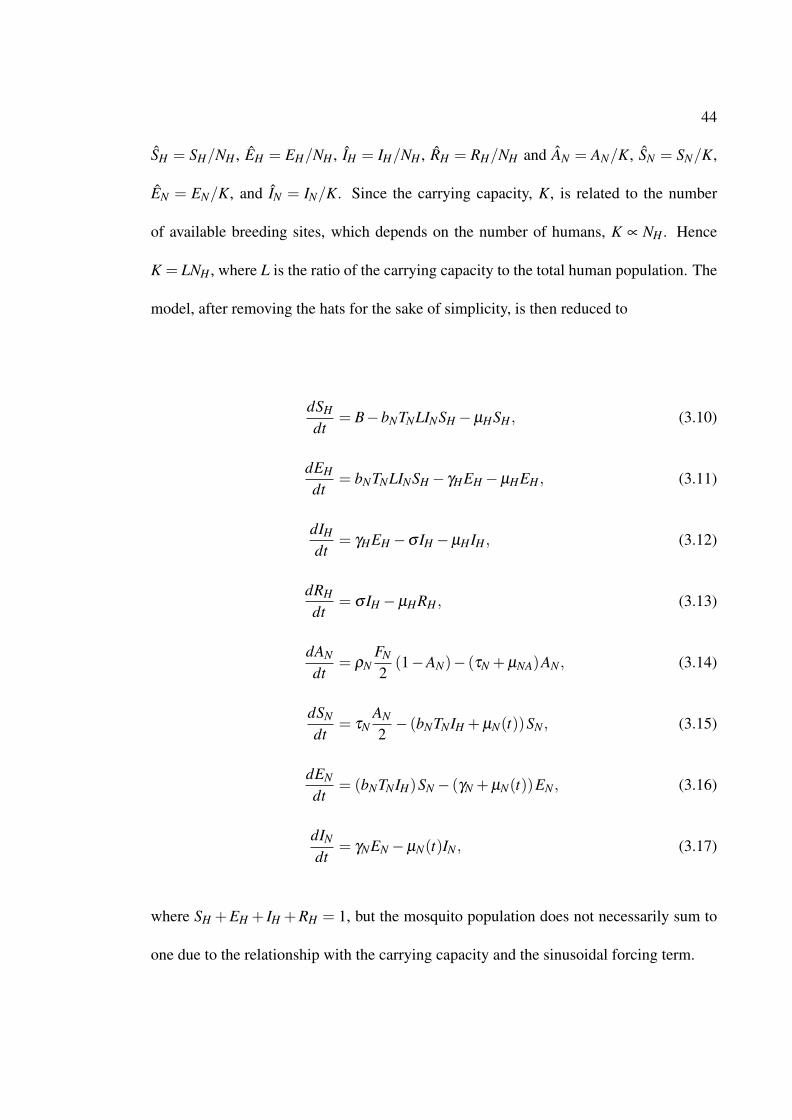
44
SH = SH/NH , EH = EH/NH , IH = IH/NH , RH = RH/NH and AN = AN/K, SN = SN/K,
EN = EN/K, and IN = IN/K. Since the carrying capacity, K, is related to the number
of available breeding sites, which depends on the number of humans, K ∝ NH . Hence
K = LNH , where L is the ratio of the carrying capacity to the total human population. The
model, after removing the hats for the sake of simplicity, is then reduced to
dSH
dt= B−bNTNLINSH−µHSH , (3.10)
dEH
dt= bNTNLINSH− γHEH−µHEH , (3.11)
dIH
dt= γHEH−σ IH−µHIH , (3.12)
dRH
dt= σ IH−µHRH , (3.13)
dAN
dt= ρN
FN
2(1−AN)− (τN +µNA)AN , (3.14)
dSN
dt= τN
AN
2− (bNTNIH +µN(t))SN , (3.15)
dEN
dt= (bNTNIH)SN− (γN +µN(t))EN , (3.16)
dIN
dt= γNEN−µN(t)IN , (3.17)
where SH +EH + IH +RH = 1, but the mosquito population does not necessarily sum to
one due to the relationship with the carrying capacity and the sinusoidal forcing term.
45
3.2 Model in the Presence of Wolbachia
In this section the formulation of the model in the presence of Wolbachia is presented.
This extends the model in the absence of Wolbachia-carrying mosquitoes given in Equa-
tions (3.1)–(3.8) by including a Wolbachia-carrying mosquito population.
The population of Wolbachia-carrying mosquitoes is divided into subpopulations of
Aquatic (AW ) comprised of eggs, larvae and pupae, Susceptible (SW ), Exposed (EW )
and Infectious (IW ) mosquitoes, where SW +EW + IW = FW . The subscript W is used
to denote Wolbachia and to differentiate between non-Wolbachia and Wolbachia-carrying
mosquitoes. The model comprises twelve compartments in total, four for each of the three
modelled populations: two mosquito populations and one human population. A schematic
representation of the model is given in Figure 3.2.
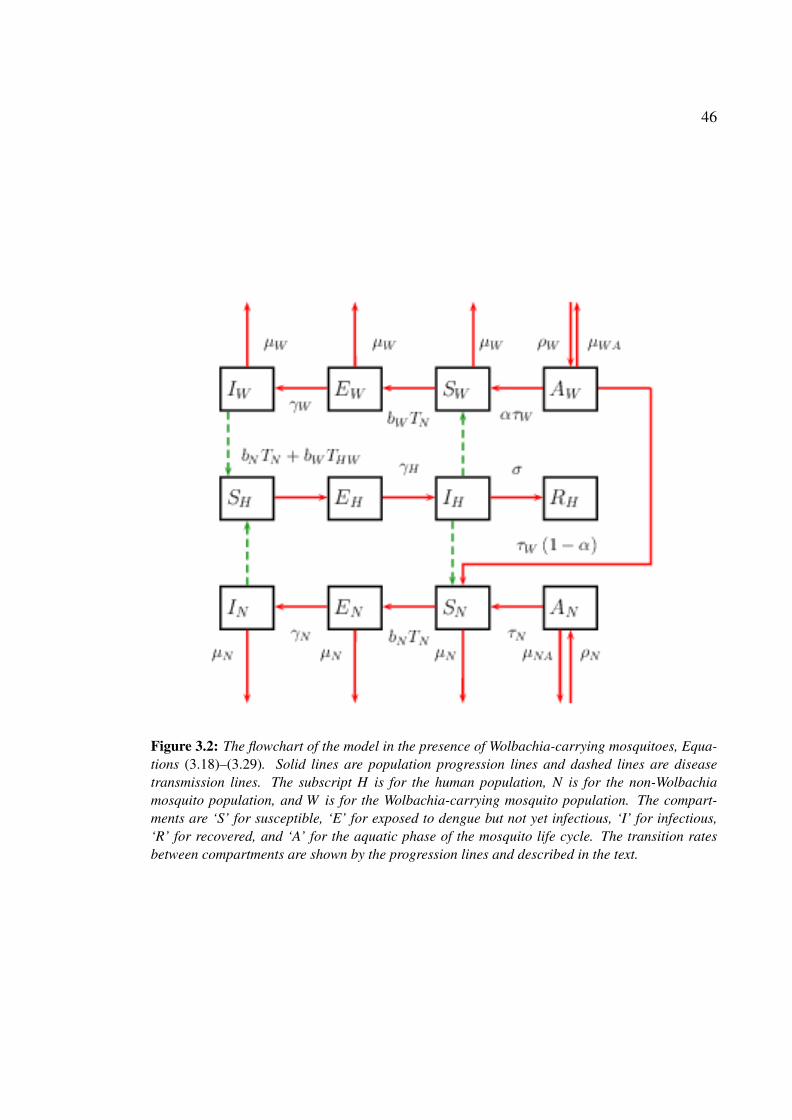
46
Figure 3.2: The flowchart of the model in the presence of Wolbachia-carrying mosquitoes, Equa-tions (3.18)–(3.29). Solid lines are population progression lines and dashed lines are diseasetransmission lines. The subscript H is for the human population, N is for the non-Wolbachiamosquito population, and W is for the Wolbachia-carrying mosquito population. The compart-ments are ‘S’ for susceptible, ‘E’ for exposed to dengue but not yet infectious, ‘I’ for infectious,‘R’ for recovered, and ‘A’ for the aquatic phase of the mosquito life cycle. The transition ratesbetween compartments are shown by the progression lines and described in the text.

47
The model is governed by the following system of differential equations
dSH
dt= BNH−
bTNIN
NHSH−
bW THW IWNH
SH−µHSH , (3.18)
dEH
dt=
bTNIN
NHSH +
bW THW IWNH
SH− γHEH−µHEH , (3.19)
dIH
dt= γHEH−σ IH−µHIH , (3.20)
dRH
dt= σ IH−µHRH , (3.21)
dAN
dt= ρN
F2N
2(FN +FW )
(1− (AN +AW )
K
)− (τN +µNA)AN , (3.22)
dSN
dt= τN
AN
2+(1−α)τW
AW
2−(
bNTNIH
NH+µN(t)
)SN , (3.23)
dEN
dt=
bNTNIH
NHSN− (γN +µN(t))EN , (3.24)
dIN
dt= γNEN−µN(t)IN , (3.25)
dAW
dt= ρW
FW
2
(1− (AN +AW )
K
)− (τW +µWA)AW , (3.26)
dSW
dt= τW α
AW
2−(
bW TNIH
NH+µW (t)
)SW , (3.27)
dEW
dt=
bW TNIH
NHSW − (γW +µW (t))EW , (3.28)
dIWdt
= γW EW −µW (t)IW . (3.29)
In this model, the exposure rates for humans are different from those in the model in
48
the absence of Wolbachia, as seen in Equations (3.1). In this model, a susceptible human
becomes exposed after being bitten by either non-Wolbachia or Wolbachia-carrying infec-
tious mosquitoes at rate bNTNIN/NH or bW THW IW/NH , respectively (see Equations (3.18)
and (3.19)). Here bW is the biting rate for Wolbachia-carrying mosquitoes and THW is the
transmission probability from Wolbachia-carrying mosquitoes to humans. Note that the
transmission probability from humans to Wolbachia-carrying mosquitoes is assumed to be
equal to that of humans to non-Wolbachia mosquitoes, so TWH = TN . By contrast, there
are differences in the transmission probabilities of dengue from mosquitoes to humans for
Wolbachia and non-Wolbachia mosquitoes (see Section 4.2 for an explanation).
The effects of cytoplasmic incompatibility and imperfect maternal transmission on
the mosquito populations are included in this model. The effect of CI is incorporated
by differences in the mating functions. That is, the non-Wolbachia females can only
reproduce when mating with Wolbachia mosquito males, giving
ρNFNMN
P, (3.30)
where P = FN +MN +FW +MW . As the ratio of male to female mosquitoes is assumed
to be 1:1, this is reduced to ρNF2N/(2(FN +FW )) (see Equation (3.22)). The aquatic Wol-
bachia mosquitoes are produced when Wolbachia-carrying female mosquitoes mate with
either non-Wolbachia or Wolbachia males, giving the term
ρW FW (MN +MW )
P, (3.31)
where P = FN +MN +FW +MW , which simplifies to ρW FW/2 (Equation (3.26)). The
49
growth of aquatic mosquitoes is limited by carrying capacity K, so that each mating func-
tion is multiplied by
AN +AW
K. (3.32)
Wolbachia-carrying aquatic mosquitoes mature to be Wolbachia-carrying adult mosquitoes
at rate τW . To capture the imperfect maternal transmission of Wolbachia [40, 94], we as-
sume that a proportion α of them become Wolbachia-carrying adults and a proportion
(1−α) become non-Wolbachia adults (see Equations (3.23) and (3.27)). In a similar
manner to that for non-Wolbachia mosquitoes, the death rate of Wolbachia-carrying adult
mosquitoes varies seasonally (µW = f µN . More explanation of about this relationship is
given in Section 4.2).
The non-dimensionalised model form is a useful generalisation, with the indepen-
dence of variable scale allowing the solution to be applicable in other settings, such as for a
different population size. Therefore, as in the model in the absence of Wolbachia-carrying
mosquitoes, the populations of both human and mosquitoes are non-dimensionalised by
dividing the human subpopulations by NH and the mosquito subpopulations by K. The
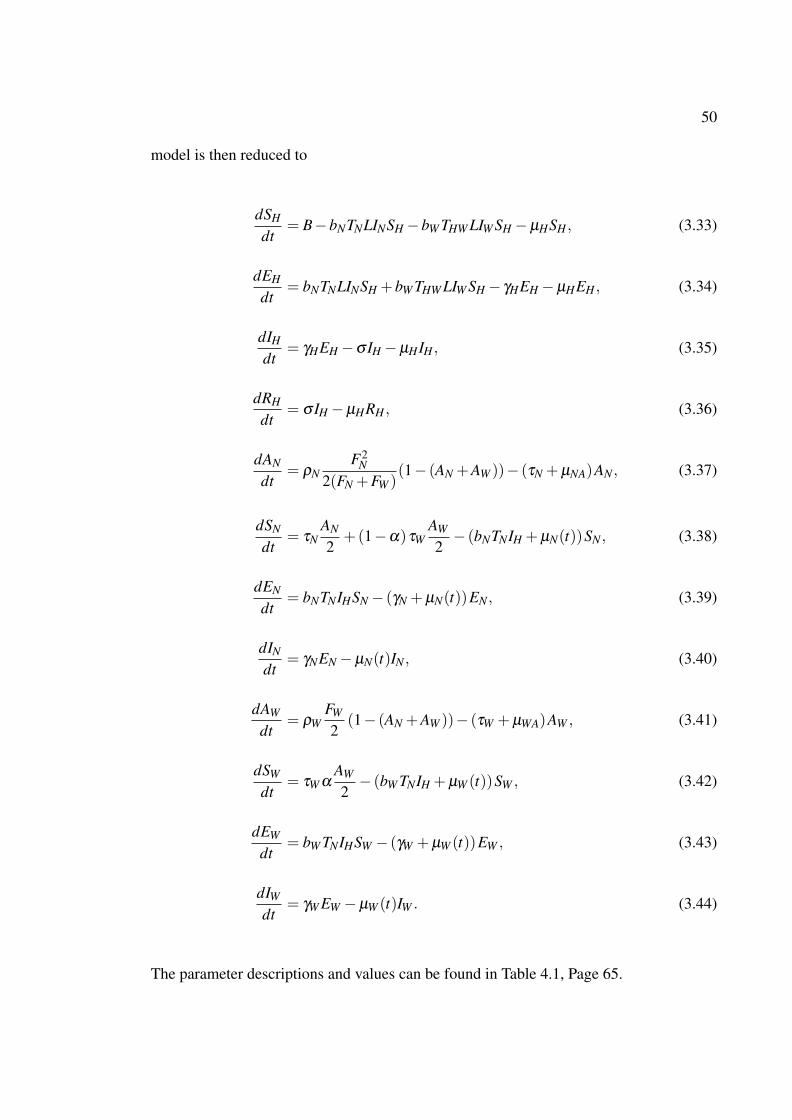
50
model is then reduced to
dSH
dt= B−bNTNLINSH−bW THW LIW SH−µHSH , (3.33)
dEH
dt= bNTNLINSH +bW THW LIW SH− γHEH−µHEH , (3.34)
dIH
dt= γHEH−σ IH−µHIH , (3.35)
dRH
dt= σ IH−µHRH , (3.36)
dAN
dt= ρN
F2N
2(FN +FW )(1− (AN +AW ))− (τN +µNA)AN , (3.37)
dSN
dt= τN
AN
2+(1−α)τW
AW
2− (bNTNIH +µN(t))SN , (3.38)
dEN
dt= bNTNIHSN− (γN +µN(t))EN , (3.39)
dIN
dt= γNEN−µN(t)IN , (3.40)
dAW
dt= ρW
FW
2(1− (AN +AW ))− (τW +µWA)AW , (3.41)
dSW
dt= τW α
AW
2− (bW TNIH +µW (t))SW , (3.42)
dEW
dt= bW TNIHSW − (γW +µW (t))EW , (3.43)
dIWdt
= γW EW −µW (t)IW . (3.44)
The parameter descriptions and values can be found in Table 4.1, Page 65.

51
3.3 Basic and Effective Reproduction Number
The basic reproduction number (R0) is one of the most important quantities in infectious
disease modelling, acting as an epidemic threshold. If R0 > 1, an outbreak may occur,
whereas it cannot if R0 < 1. We determine R0 for our model in order to investigate the
effect of introducing Wolbachia-carrying mosquitoes on the epidemic threshold.
Following Diekmann, Heesterbeek and Roberts [24], to construct a next generation
matrix, we need to first identify the subsystem of ODEs that describes the production
of new cases and the changes between infectious classes or groups, which is called the
infected subsystem. From the model (3.18)–(3.29), the infected subsystem is
dEH
dt=
bNTNIN
NHSH +
bW THW IWNH
SH− γHEH−µHEH , (3.45)
dIH
dt= γHEH−σ IH−µHIH , (3.46)
dEN
dt=
bNTNIH
NHSN− (γN +µN(t))EN , (3.47)
dIN
dt= γNEN−µN(t)IN , (3.48)
dEW
dt=
bW TNIH
NHSW − (γW +µW (t))EW , (3.49)
dIWdt
= γW EW −µW (t)IW . (3.50)
At the infection-free steady state, EH = IH = EN = IN = EW = IW = 0, and SH = NH .

52
For small (EH , IH ,EN , IN ,EW , IW ), the linearised infected subsystem is approximated by
Equations (3.45)–(3.50), with SH = NH .
Let x = (EH , IH ,EN , IN ,EW , IW )′. We want to write the linearised infected subsystem
in the form
dxdt
= (T+ΣΣΣ)x,
where T is the transmission matrix, whose entries correspond to transmission events, and
ΣΣΣ is the transition matrix, whose entries correspond to movement between the infected
compartments including deaths. The transmission matrix T is
T =
0 0 0 bNTN 0 bW THW
0 0 0 0 0 0
0 bNTNNH
SN(t) 0 0 0 0
0 0 0 0 0 0
0 bW TNNH
SW (t) 0 0 0 0
0 0 0 0 0 0
,
where SN(t) and SW (t) are the population of mosquitoes with and without Wolbachia. As
mosquito populations vary seasonally, both of these are functions of time. The transition
matrix ΣΣΣ is

53
ΣΣΣ=
−(γH +µH) 0 0 0 0 0
γH −(σ +µH) 0 0 0 0
0 0 −(γN +µN(t)) 0 0 0
0 0 γN −µN(t) 0 0
0 0 0 0 −(γW +µW (t)) 0
0 0 0 0 γW −µW (t)
.
We next find the inverse of the transition matrix ΣΣΣ−1:
ΣΣΣ−1 =
− 1(γH+µH)
0 0 0 0 0
− γH(γH+µH)(σ+µH)
− 1(σ+µH)
0 0 0 0
0 0 − 1(γN+µN(t))
0 0 0
0 0 − γNµN(t)(γN+µN(t))
− 1µN(t)
0 0
0 0 0 0 − 1(γW+µW (t)) 0
0 0 0 0 − γWµW (t)(γW+µW (t)) −
1µW (t)
.
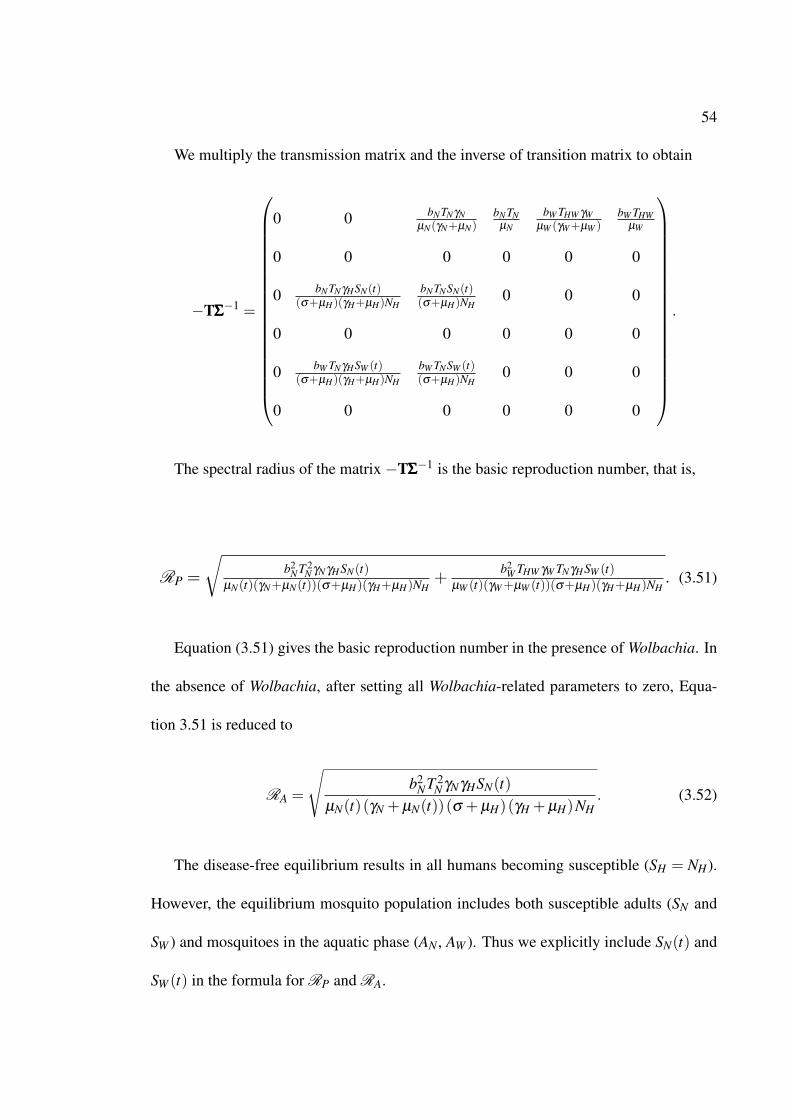
54
We multiply the transmission matrix and the inverse of transition matrix to obtain
−TΣΣΣ−1 =
0 0 bNTNγNµN(γN+µN)
bNTNµN
bW THW γWµW (γW+µW )
bW THWµW
0 0 0 0 0 0
0 bNTNγHSN(t)(σ+µH)(γH+µH)NH
bNTNSN(t)(σ+µH)NH
0 0 0
0 0 0 0 0 0
0 bW TNγHSW (t)(σ+µH)(γH+µH)NH
bW TNSW (t)(σ+µH)NH
0 0 0
0 0 0 0 0 0
.
The spectral radius of the matrix −TΣΣΣ−1 is the basic reproduction number, that is,
RP =
√b2
NT 2N γNγHSN(t)
µN(t)(γN+µN(t))(σ+µH)(γH+µH)NH+
b2W THW γW TNγHSW (t)
µW (t)(γW+µW (t))(σ+µH)(γH+µH)NH. (3.51)
Equation (3.51) gives the basic reproduction number in the presence of Wolbachia. In
the absence of Wolbachia, after setting all Wolbachia-related parameters to zero, Equa-
tion 3.51 is reduced to
RA =
√b2
NT 2N γNγHSN(t)
µN(t)(γN +µN(t))(σ +µH)(γH +µH)NH. (3.52)
The disease-free equilibrium results in all humans becoming susceptible (SH = NH).
However, the equilibrium mosquito population includes both susceptible adults (SN and
SW ) and mosquitoes in the aquatic phase (AN , AW ). Thus we explicitly include SN(t) and
SW (t) in the formula for RP and RA.

55
The basic reproduction number found here can be considered to be an instantaneous
basic reproduction number which depends on fluctuations in the mosquito population,
SN(t) and SW (t).
Besides determining the basic reproduction number, it is also important to determine
time-dependent variations in the potential for transmission of infectious disease. This
is usually conducted by evaluating the effective reproduction number. The effective re-
production number is the average number of secondary cases generated by a primary
case [73, 106]. The effective reproduction number is different to the basic reproduction
number in that it takes into account the depletion of susceptible individuals and any public
health intervention [30]. To make it easier for readers to differentiate between basic and
effective reproduction numbers in this thesis we will refer to the reproduction number as
the basic reproduction number if the population is entirely susceptible, even where there
is a Wolbachia intervention.
The effective reproduction number can be obtained by multiplying the basic repro-
duction number by the proportion of the population that is susceptible populations [73].
The first term of Equation (3.51) is the average number of secondary infectious humans
produced by one primary human case in a completely susceptible population of humans
and non-Wolbachia mosquitoes. The second term of Equation (3.51) is the same as the
first term, but where mosquitoes carry Wolbachia. The effective reproduction number can
be obtained as the sum of the first term multiplied by (SH(t)/NH)(SN(t)/FN(t)) and the
second term multiplied by (SH(t)/NH)(SW (t)/FW (t)). That is,
RPeff =√
R1eff+R2eff , (3.53)

56
where
R1eff =b2
NT 2N γNγHSN(t)
µN(t)(γN +µN(t))(σ +µH)(γH +µH)NH
SH(t)NH
SN(t)FN(t)
, (3.54)
and
R2eff =b2
W THW γW TNγHSW (t)µW (t)(γW +µW (t))(σ +µH)(γH +µH)NH
SH(t)NH
SW (t)FW (t)
. (3.55)
In the absence of Wolbachia-carrying mosquitoes, the effective reproduction number
is
RAeff =√
R1eff . (3.56)
3.4 Discussion
Mathematical models developed in this chapter are used to investigate the effectiveness
of a Wolbachia control strategy in reducing the number of human dengue cases under
scenarios of single and multiple introductions of human dengue cases. In these models,
we assume a well-mixed and homogeneous population and ignore heterogeneity in the
population, although our models could be extended to include this. Furthermore, although
we assume the transmission probabilities from humans to mosquitoes and mosquitoes to
human are the same, the force of infections of humans and mosquitoes are different due
to differences in the proportions of infectious humans and mosquitoes (Equations (3.1)
57
and (3.6) , respectively). Vertical transmission of dengue in mosquitoes can occur (see,
for example, [44, 51]), however this tends to be at low levels [51]. Furthermore, Adams
and Boots [2] found that vertical transmission is not an important factor for determining
dengue persistence. As the purpose of this thesis is to determine the indicative reduction
in the number of dengue cases due to a Wolbachia intervention, the assumptions used
in this thesis are sufficient. Further explorations can be conducted and suggestions are
detailed in Section 9.3.
3.5 Summary
• Single serotype dengue models in the absence and presence of Wolbachia-carrying
mosquitoes are developed (Sections 3.1 and 3.2).
• We provide dimensionalised and non-dimensionalised models (Sections 3.1 and 3.2).
• The death rate of mosquitoes is sinusoidally forced (Section 3.1, Equation (3.9)).
• The basic and effective reproduction number is derived, which can be considered to be
an instantaneous basic reproduction number (Section 3.3, Equations (3.51)–(3.56)).
• The basic and effective reproduction number depends on fluctuations in the mosquito
population (Section 3.3, Equations (3.51)–(3.56)).

Chapter 4
Dengue Transmission Dynamics for a
Single Introduction Event ∗
The aim of this chapter is to study the effects of Wolbachia on dengue transmission dy-
namics in the case where there is a single introduction of dengue cases into the human
population.
The mathematical models developed in Chapter 3 are used to investigate the effects
of Wolbachia on dengue transmission dynamics for a single strain. We consider a single
outbreak with a duration of approximately one year, and hence omit human births and
deaths from our models by setting B = µH = 0. We work with our non-dimensionalised
models in the absence (Equations (3.10)–(3.17)) and presence (Equations (3.33)–(3.44))
of Wolbachia-carrying mosquitoes.
4.1 Data and Parameter Estimation
Cairns is the largest city in the region of Australia where Aedes aegypti are present and
local dengue transmission occurs, and is also where the Wolbachia field trials, which
∗This work is part of the manuscript that has been published as Meksianis Z. Ndii, R. I. Hickson, DavidAllingham, G. N. Mercer. Modelling the transmission dynamics of dengue in the presence of Wolbachia.Mathematical Biosciences. 262:157–166. 2015.
58

59
began in 2011, are being conducted [41]. In summer 2008/2009, there was a DEN3
outbreak in Cairns [? ] and we use data from this outbreak to estimate the parameter
values of transmission probability (TN), strength of seasonality (η) and seasonal phase
(ω) for the baseline model, for example, in the absence of Wolbachia, represented by
Equations (3.10)–(3.17). The other parameter values were obtained from the literature
and are given in Table 4.1. The Cairns data covers the period from 2nd November 2008
to 31st May 2009 and was extracted from Figure 2 of the paper by Ritchie et al. [? ]. As
our model is formulated as a proportion of the population, each data point is divided by
150,000, which was the approximate population of Cairns in 2008 [15].
We minimise the sum of the squared error between the model and data, which is given
by
RSS =n
∑i=1
(yi− fi(x))2 , (4.1)
where yi is the total proportion of human dengue cases up to the ith week from the observed
data, and fi(x) is the total proportion of human dengue cases up to the ith week from the
model simulations. The lsqnonlin built-in function in MATLAB [58] is then used to
estimate the TN , η and ω parameter values.
4.2 Wolbachia Parameters
In this section, model parameters relating to Wolbachia-carrying mosquitoes are presented
and discussed. Most of these are given in terms of non-Wolbachia mosquitoes, following
the conventions in the literature. The relationships between Wolbachia and non-Wolbachia
parameters,

60
ρW = cρN , (4.2)
THW = dTN , (4.3)
µW = f µN , (4.4)
bW = gbN . (4.5)
The reproductive rate of Wolbachia-carrying mosquitoes is generally lower than that
for non-Wolbachia-carrying mosquitoes (c < 1). There is a significant difference in re-
productive rates for the WMelPop and a marginal difference for the WMel strain. This
is because WMelPop decreases the viability of eggs [63], whereas WMel does not have a
significant effect on them [94].
The death rate of Wolbachia-carrying mosquitoes is higher than that of non-Wolbachia
mosquitoes ( f > 1) because Wolbachia reduces the mosquito lifespan [94, 111]. WMel
and WMelPop reduce the lifespan of mosquitoes by up to 10% and 50%, respectively [94,
111].
Wolbachia also inhibits viral replication and dissemination in the mosquitoes [11,
29, 41, 67, 94]. This results in a lower dengue viral load in the Wolbachia-carrying
mosquitoes, and to reflect this, we set the transmission probability from infectious Wol-
bachia-carrying mosquitoes to humans to less than that for Wolbachia-free mosquitoes
(d < 1). Additionally, Wolbachia causes a condition known as bendy proboscis [89] which
inhibits feeding and lowers the successful biting rate (g < 1). This lower biting rate also
captures the effect that, due to the inhibition of viral replication, some Wolbachia-carrying
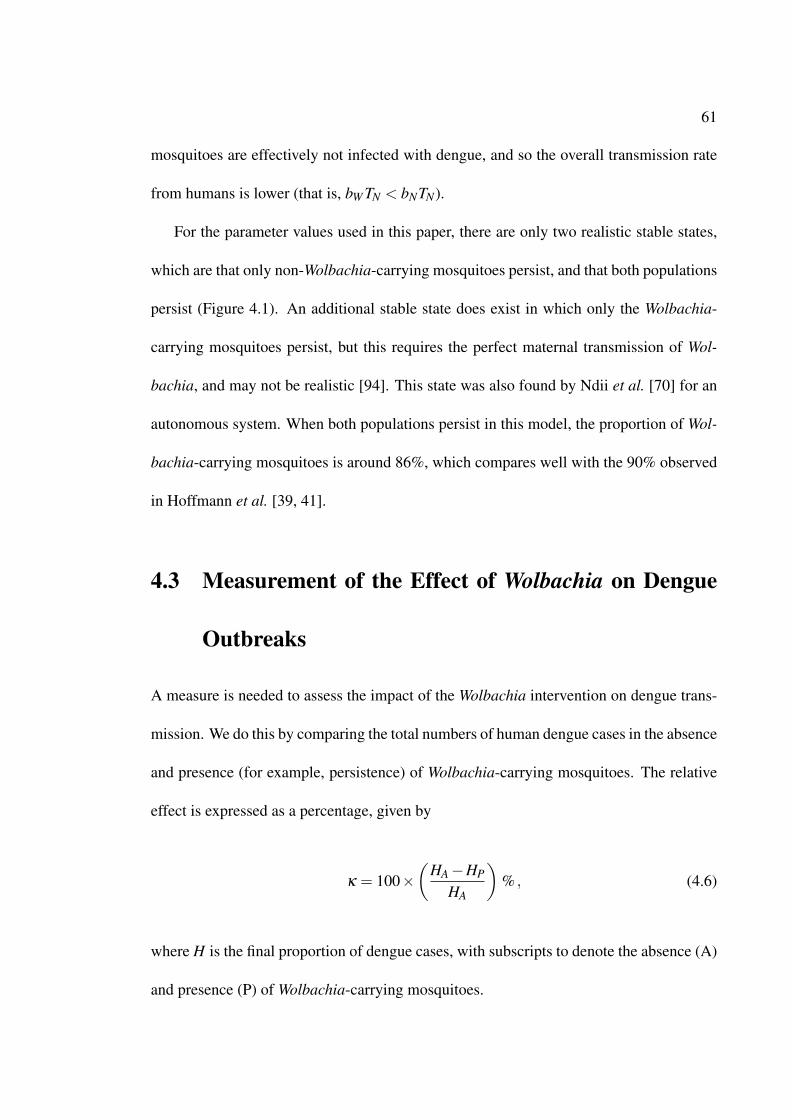
61
mosquitoes are effectively not infected with dengue, and so the overall transmission rate
from humans is lower (that is, bW TN < bNTN).
For the parameter values used in this paper, there are only two realistic stable states,
which are that only non-Wolbachia-carrying mosquitoes persist, and that both populations
persist (Figure 4.1). An additional stable state does exist in which only the Wolbachia-
carrying mosquitoes persist, but this requires the perfect maternal transmission of Wol-
bachia, and may not be realistic [94]. This state was also found by Ndii et al. [70] for an
autonomous system. When both populations persist in this model, the proportion of Wol-
bachia-carrying mosquitoes is around 86%, which compares well with the 90% observed
in Hoffmann et al. [39, 41].
4.3 Measurement of the Effect of Wolbachia on Dengue
Outbreaks
A measure is needed to assess the impact of the Wolbachia intervention on dengue trans-
mission. We do this by comparing the total numbers of human dengue cases in the absence
and presence (for example, persistence) of Wolbachia-carrying mosquitoes. The relative
effect is expressed as a percentage, given by
κ = 100×(
HA−HP
HA
)% , (4.6)
where H is the final proportion of dengue cases, with subscripts to denote the absence (A)
and presence (P) of Wolbachia-carrying mosquitoes.

62
Figure 4.1: A plot of the persistence, shown by the shaded region, of the Wolbachia-carryingmosquito population, over a range of the Wolbachia reproductive and death rates, expressed as ra-tios of the non-Wolbachia rates. In the unshaded region only non-Wolbachia-carrying mosquitoespersist.
4.4 Sensitivity Analysis
A global sensitivity analysis is performed using the standard combination of Latin Hy-
percube Sampling (LHS) and Partial Rank Correlation Coefficient (PRCC) multivariate
analysis [13, 56, 59, 103]. LHS is a stratified Monte Carlo sampling method, in which the
random parameter distributions are divided into N equal probability intervals and samples
are taken from each [13, 56, 59, 103]. Here N is the sample size for each parameter. Each
interval of each parameter is sampled exactly once without replacement, so that the entire
range of each parameter is explored [13, 56, 103]. Parameters are sampled from a trian-

63
gular probability distribution because we expect that the values close to the peak of the
triangular distribution pattern are those which are more likely to occur. The minimum,
maximum and expected values are given in Table 4.1.
PRCC is an efficient method for measuring the nonlinear, but monotonic relationship
between inputs and the model outcome of interest [13, 20, 56, 103]. In this paper, the
inputs are the parameters as well as the initial number of exposed humans, while the model
outcome is the cumulative proportion of infectious individuals, which is the solution of
the differential equation
dCIH
dt= γHEH .
The ranges of the input parameters are available in the literature and only samples of the
parameter values that result in the persistence of mosquitoes are included in the calcula-
tion. The PRCC is computed for the full length of 31 weeks, the period of time for which
data is available (see Richie et. al[? ]). The most significant parameters are those for
which a small change in value leads to a significant change in the output, that is in the
cumulative number of infectious humans.
4.5 Results
In this section the model simulation and sensitivity analysis results are presented for both
models. The governing systems of differential equations are integrated using MATLAB’s
inbuilt routine “ode45”, with the parameter values given in Table 4.1. We run the model
until the mosquito population reaches the periodic stable state, before the infected humans
are introduced into the population on the 2nd of November. That is, the transient dynamics

64
of the introduction of the Wolbachia mosquitoes into the system are not considered. In Far
North Queensland, dengue is not endemic, hence dengue outbreaks occur as dengue cases
are introduced into the population. For both models, the initial conditions for the human
population are EH0 = 2/(1.5×105), IH0 = 0 = RH0 and SH0 = 1−EH0− IH0−RH0.
4.5.1 Parameter Estimation and Sensitivity of the Model in the Ab-
sence of Wolbachia
In this section we consider the model in the absence of Wolbachia, that is, Equations (3.10)–
(3.17), as described in Chapter 3, which serves as a baseline model for comparison with
the Wolbachia intervention. Most of the parameters are obtained from the literature, as per
the references in Table 4.1. The remaining three parameters, TN , η and ω , are estimated
via optimisation using MATLAB’s lsqnonlin function. We constrain the optimisation by
physical limits, that is, between 0 and 1 for TN since it is a probability, 0 to 365 for the
seasonal phase ω , and 0 to 1 for η , so that the death rate µN remains positive at all times.
The ranges of parameter values are chosen such a way that it is biologically realistic and
result in the persistence of Wolbachia-carrying mosquitoes.
We fit the parameters as follows. The model is run to its periodic stable state and then
two exposed humans are introduced. The sum of squares error is calculated using the
cumulative 31-week proportional weekly data of Ritchie et al. [? ]. The parameters are
then estimated using MATLAB’s lsqnonlin function, with a final sum of squares error
equal to 3× 10⁻⁷. The resulting parameter values TN , η and ω are given in Table 4.1.
To assess the goodness-of-fit, we calculated the χ2 statistic for the model residuals using
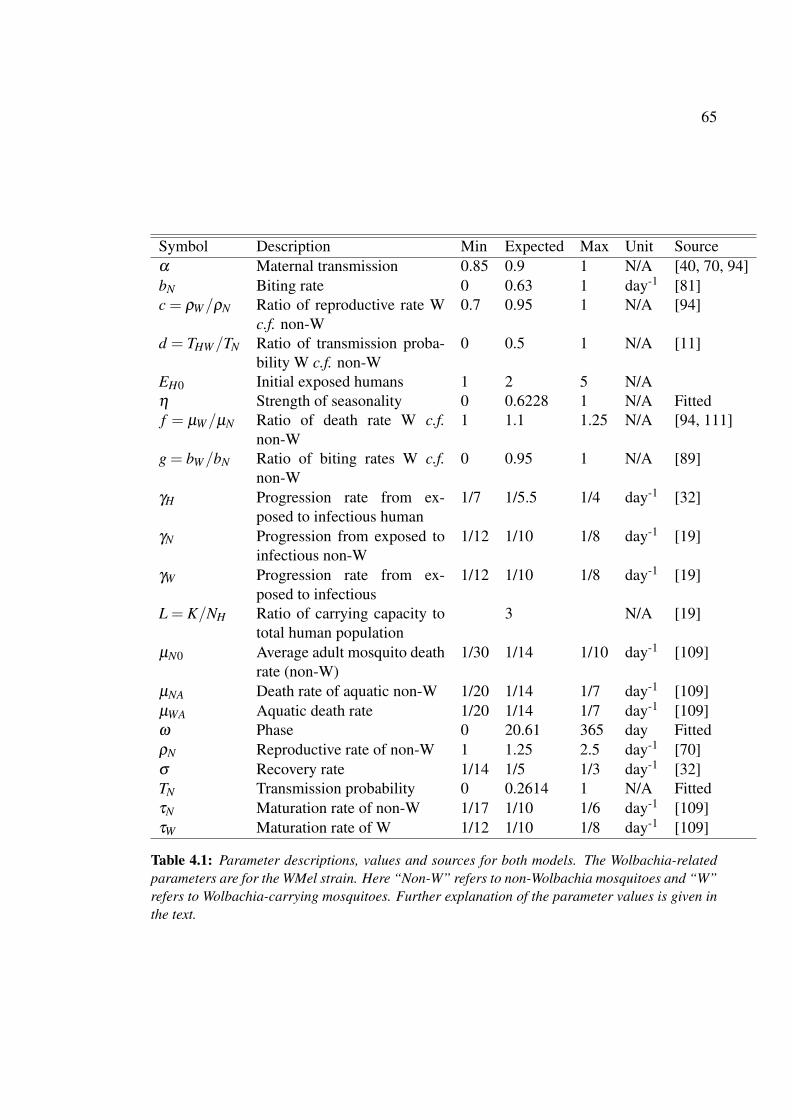
65
Symbol Description Min Expected Max Unit Sourceα Maternal transmission 0.85 0.9 1 N/A [40, 70, 94]bN Biting rate 0 0.63 1 day-1 [81]c = ρW/ρN Ratio of reproductive rate W
c.f. non-W0.7 0.95 1 N/A [94]
d = THW/TN Ratio of transmission proba-bility W c.f. non-W
0 0.5 1 N/A [11]
EH0 Initial exposed humans 1 2 5 N/Aη Strength of seasonality 0 0.6228 1 N/A Fittedf = µW/µN Ratio of death rate W c.f.
non-W1 1.1 1.25 N/A [94, 111]
g = bW/bN Ratio of biting rates W c.f.non-W
0 0.95 1 N/A [89]
γH Progression rate from ex-posed to infectious human
1/7 1/5.5 1/4 day-1 [32]
γN Progression from exposed toinfectious non-W
1/12 1/10 1/8 day-1 [19]
γW Progression rate from ex-posed to infectious
1/12 1/10 1/8 day-1 [19]
L = K/NH Ratio of carrying capacity tototal human population
3 N/A [19]
µN0 Average adult mosquito deathrate (non-W)
1/30 1/14 1/10 day-1 [109]
µNA Death rate of aquatic non-W 1/20 1/14 1/7 day-1 [109]µWA Aquatic death rate 1/20 1/14 1/7 day-1 [109]ω Phase 0 20.61 365 day FittedρN Reproductive rate of non-W 1 1.25 2.5 day-1 [70]σ Recovery rate 1/14 1/5 1/3 day-1 [32]TN Transmission probability 0 0.2614 1 N/A FittedτN Maturation rate of non-W 1/17 1/10 1/6 day-1 [109]τW Maturation rate of W 1/12 1/10 1/8 day-1 [109]
Table 4.1: Parameter descriptions, values and sources for both models. The Wolbachia-relatedparameters are for the WMel strain. Here “Non-W” refers to non-Wolbachia mosquitoes and “W”refers to Wolbachia-carrying mosquitoes. Further explanation of the parameter values is given inthe text.
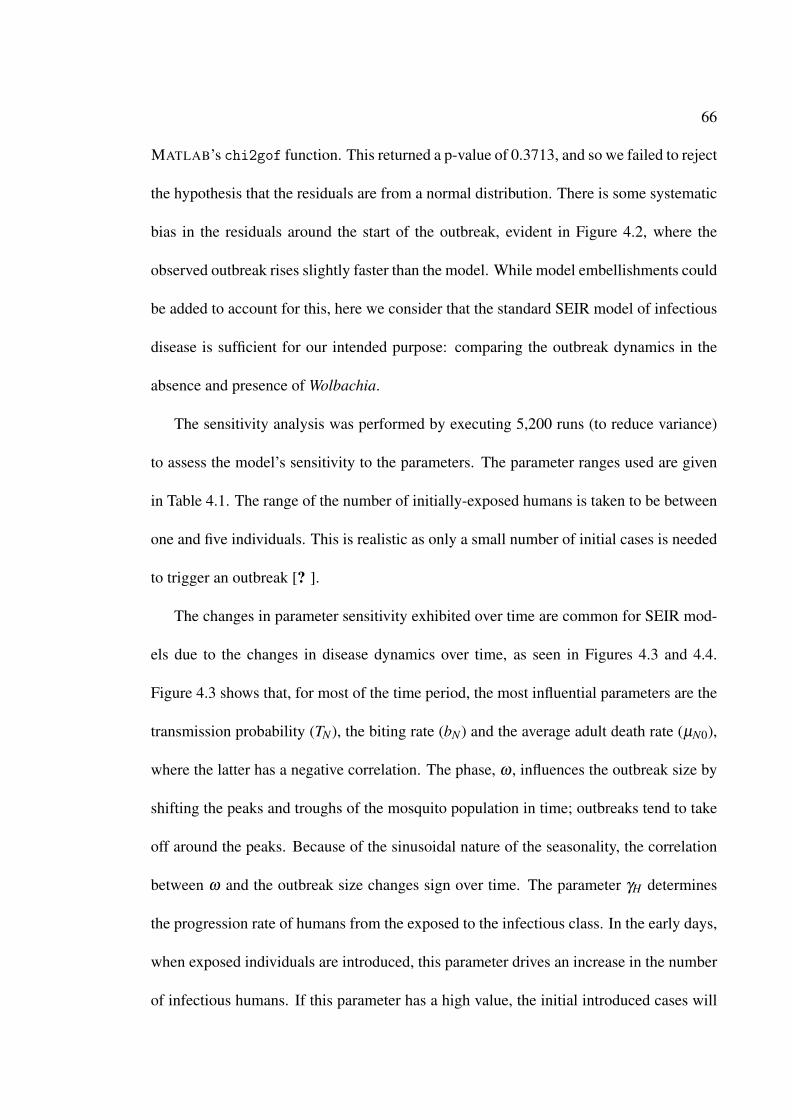
66
MATLAB’s chi2gof function. This returned a p-value of 0.3713, and so we failed to reject
the hypothesis that the residuals are from a normal distribution. There is some systematic
bias in the residuals around the start of the outbreak, evident in Figure 4.2, where the
observed outbreak rises slightly faster than the model. While model embellishments could
be added to account for this, here we consider that the standard SEIR model of infectious
disease is sufficient for our intended purpose: comparing the outbreak dynamics in the
absence and presence of Wolbachia.
The sensitivity analysis was performed by executing 5,200 runs (to reduce variance)
to assess the model’s sensitivity to the parameters. The parameter ranges used are given
in Table 4.1. The range of the number of initially-exposed humans is taken to be between
one and five individuals. This is realistic as only a small number of initial cases is needed
to trigger an outbreak [? ].
The changes in parameter sensitivity exhibited over time are common for SEIR mod-
els due to the changes in disease dynamics over time, as seen in Figures 4.3 and 4.4.
Figure 4.3 shows that, for most of the time period, the most influential parameters are the
transmission probability (TN), the biting rate (bN) and the average adult death rate (µN0),
where the latter has a negative correlation. The phase, ω , influences the outbreak size by
shifting the peaks and troughs of the mosquito population in time; outbreaks tend to take
off around the peaks. Because of the sinusoidal nature of the seasonality, the correlation
between ω and the outbreak size changes sign over time. The parameter γH determines
the progression rate of humans from the exposed to the infectious class. In the early days,
when exposed individuals are introduced, this parameter drives an increase in the number
of infectious humans. If this parameter has a high value, the initial introduced cases will
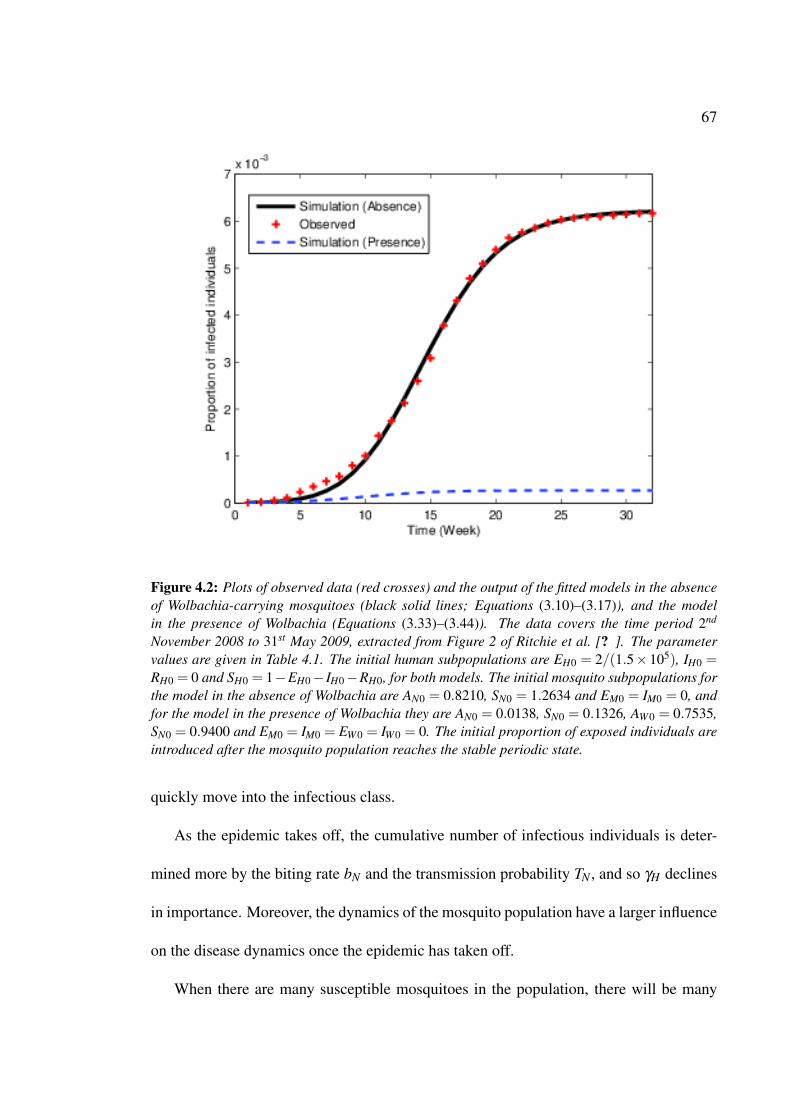
67
Figure 4.2: Plots of observed data (red crosses) and the output of the fitted models in the absenceof Wolbachia-carrying mosquitoes (black solid lines; Equations (3.10)–(3.17)), and the modelin the presence of Wolbachia (Equations (3.33)–(3.44)). The data covers the time period 2nd
November 2008 to 31st May 2009, extracted from Figure 2 of Ritchie et al. [? ]. The parametervalues are given in Table 4.1. The initial human subpopulations are EH0 = 2/(1.5× 105), IH0 =RH0 = 0 and SH0 = 1−EH0− IH0−RH0, for both models. The initial mosquito subpopulations forthe model in the absence of Wolbachia are AN0 = 0.8210, SN0 = 1.2634 and EM0 = IM0 = 0, andfor the model in the presence of Wolbachia they are AN0 = 0.0138, SN0 = 0.1326, AW0 = 0.7535,SN0 = 0.9400 and EM0 = IM0 = EW0 = IW0 = 0. The initial proportion of exposed individuals areintroduced after the mosquito population reaches the stable periodic state.
quickly move into the infectious class.
As the epidemic takes off, the cumulative number of infectious individuals is deter-
mined more by the biting rate bN and the transmission probability TN , and so γH declines
in importance. Moreover, the dynamics of the mosquito population have a larger influence
on the disease dynamics once the epidemic has taken off.
When there are many susceptible mosquitoes in the population, there will be many

68
Figure 4.3: Plot of the PRCC over time of the model in the absence of Wolbachia. The PRCC iscalculated with respect to the cumulative number of infectious individuals. The grey area indicatesthe region where the PRCC is not significantly different from zero (significance level 0.01), using5,200 samples.
infectious mosquitoes and hence many infected humans. An increase in the number of
susceptible mosquitoes is regulated by the parameter τN and so this parameter has an im-
portant impact in the later period after the epidemic has taken off. As expected, the cumu-
lative number of infectious individuals is most sensitive to the number of initially-exposed
humans (EH0) at early times since they are immediately added to this output. However,
for the range considered, EH0 does not change the proportion of dengue reduction due to
the introduction of Wolbachia-carrying mosquitoes.

69
4.5.2 Sensitivity Analysis of the Model in the Presence of Wolbachia
In this section the effects of Wolbachia-carrying mosquitoes on the dengue dynamics are
investigated. Variations in parameter values are explored to quantify the persistence of
Wolbachia-carrying mosquitoes and its effects on the number of human dengue cases.
The initial conditions for the two mosquito populations are AN0 = 0.0138, SN0 = 0.1326,
EN0 = IN0 = 0, AW0 = 0.7535, SW0 = 0.9400, and EW0 = 0 = IW0, which are obtained by
running MATLAB simulations of the model in the absence of dengue to the periodic stable
state. Since the WMel strain of Wolbachia is used in the Cairns field experiments [41], we
use its expected parameter values in our model.
The results of the sensitivity analysis are similar to those for the model in the ab-
sence of Wolbachia, and are shown in Figure 4.4. The transmission probability (TN), the
biting rate (bN) and the average adult mosquito death rate (µN0) are the most influential
parameters on the model outcome. Furthermore, at early times, the cumulative number
of infectious individuals is sensitive to EH0 and γH . An exploration of the ratios of trans-
mission probability, d = THW/TN , biting rate, g = bW/bN , and death rate, f = µW/µN , is
also carried out as they relate to the most influential parameters. We also explore the ratio
of the reproductive rates for Wolbachia and non-Wolbachia mosquitoes, c = ρW/ρN , to
obtain information regarding its effect on dengue disease dynamics and on the parameter
range for which Wolbachia-carrying mosquitoes persist.
70
Figure 4.4: Plot of PRCC over time for the model in the presence of Wolbachia. For clarity weshow only those parameters that have a PRCC outside the range (-0.05,0.05) over the whole timewindow. The grey area indicates the region in which the PRCC is not significantly different fromzero (significance level 0.01), using 5,190 samples that result in the persistence of Wolbachia-carrying mosquitoes.
4.5.3 Parameter Exploration
Although we are using values for c, d, f and g from the literature, the provided values
are generally qualitative descriptions, or come from laboratory trials which may not be
representative of what happens in the field, and hence the correct parameter values may
differ. Therefore, in this Section, we vary these parameters, one at a time, to determine
their effects on human dengue incidence as measured by the relative effect given in Equa-
tion (4.6). Thus, we quantify the effect of introducing Wolbachia-carrying mosquitoes on
dengue transmission for a range of realistic parameter values.
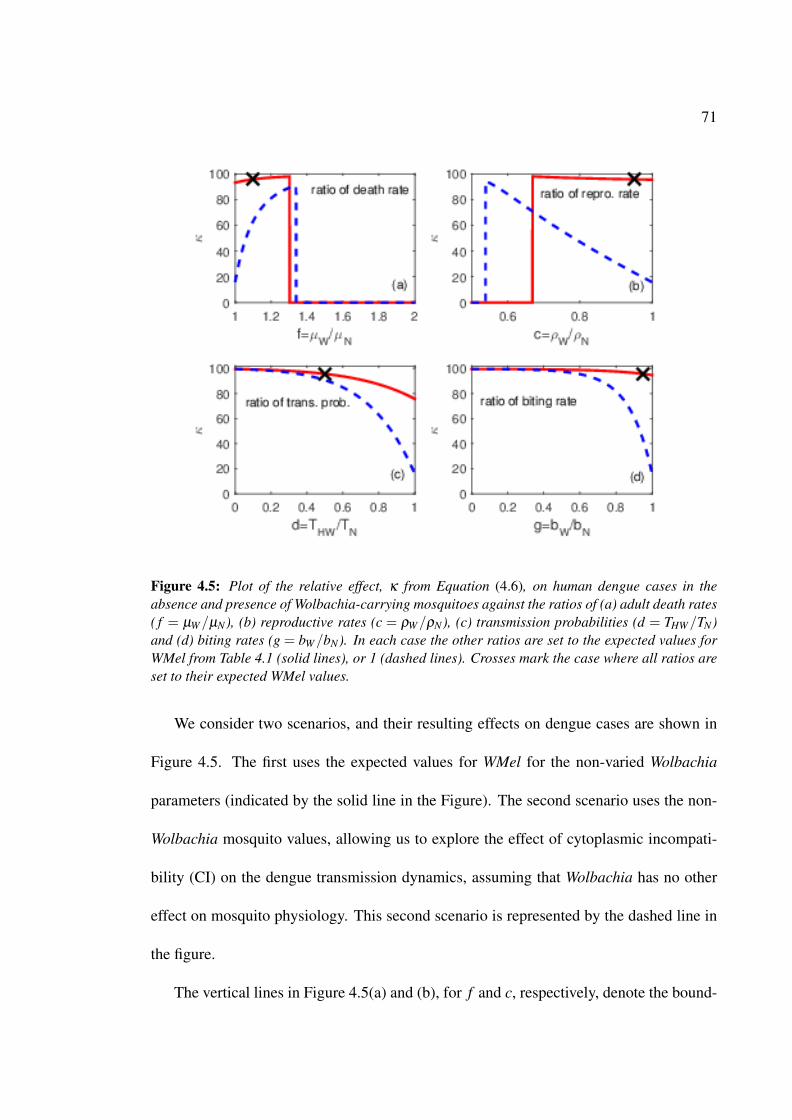
71
Figure 4.5: Plot of the relative effect, κ from Equation (4.6), on human dengue cases in theabsence and presence of Wolbachia-carrying mosquitoes against the ratios of (a) adult death rates( f = µW/µN), (b) reproductive rates (c = ρW/ρN), (c) transmission probabilities (d = THW/TN)and (d) biting rates (g = bW/bN). In each case the other ratios are set to the expected values forWMel from Table 4.1 (solid lines), or 1 (dashed lines). Crosses mark the case where all ratios areset to their expected WMel values.
We consider two scenarios, and their resulting effects on dengue cases are shown in
Figure 4.5. The first uses the expected values for WMel for the non-varied Wolbachia
parameters (indicated by the solid line in the Figure). The second scenario uses the non-
Wolbachia mosquito values, allowing us to explore the effect of cytoplasmic incompati-
bility (CI) on the dengue transmission dynamics, assuming that Wolbachia has no other
effect on mosquito physiology. This second scenario is represented by the dashed line in
the figure.
The vertical lines in Figure 4.5(a) and (b), for f and c, respectively, denote the bound-

72
ary between persistence (κ > 0) and non-persistence (κ = 0) for the Wolbachia-carrying
mosquitoes. Both scenarios show that as the death rate of Wolbachia-carrying mosquitoes
increases, the relative effect on dengue incidence also increases up to the point where the
Wolbachia-carrying mosquitoes no longer persist, around f = 1.30 for the solid line and
f = 1.34 for the dashed line. The default values, with f = 1.1, are identified on the figure
by a cross, showing that WMel should reduce human dengue incidence by approximately
96%. Interestingly, in the second scenario, when c = d = f = g = 1, we see that even
if all of the Wolbachia parameters are equal to their non-Wolbachia counterparts, human
dengue incidence is still reduced by approximately 16%. This occurs due to the combi-
nation of CI and competition, with the total female mosquito population (FN +FW ) being
reduced.
The CI means Wolbachia-free and Wolbachia-carrying mosquitoes have different mat-
ing functions, and, in particular, that no non-Wolbachia offspring are produced from the
combination of a non-Wolbachia female and a Wolbachia-carrying male (there is effec-
tively a 0×FNFW term in Equation 3.22). This difference in the mating functions, com-
bined with the competition in the aquatic phase, results in a reduced total mosquito popu-
lation, and hence less dengue. This provides the new insight that CI, when considered in
isolation, alters the dengue transmission dynamics.
The solid line with expected WMel values in Figure 4.5(b) shows that when the re-
productive rate of Wolbachia-carrying mosquitoes is too low compared to non-Wolbachia
mosquitoes, the Wolbachia-carrying mosquitoes no longer persist, and hence have no ef-
fect on human dengue incidence. This occurs at approximately c = 0.66 for the expected
parameter values (solid line), and c = 0.52 for d = f = g = 1 (dashed line). When Wol-
73
bachia-carrying mosquitoes do persist, their effect on human dengue incidence decreases
with increasing c since the total number of mosquitoes increases, despite CI. However,
this effect is negligible for the expected parameter values (solid line), with an over 90%
reduction in dengue for all values where Wolbachia-carrying mosquitoes persist.
The results given in Figure 4.5(c) show that even if d ≈ 1 (transmission is not directly
affected by Wolbachia), a reduction in human dengue incidence of approximately 76% is
still obtained due to the other effects of Wolbachia on mosquito physiology. In addition,
as shown in Figure 4.5(d), a 90% reduction in human dengue incidence is obtained even
though the biting rate of Wolbachia-carrying mosquitoes is close to that of non-Wolbachia
mosquitoes (g≈ 1).
4.5.4 The Basic Reproduction Number
Using the formula for the basic reproduction number in Chapter 3, we investigate the ba-
sic reproduction number. Figure 4.6 shows the effects of seasonal forcing on the basic
reproduction number. This can be considered to be an instantaneous basic reproduction
number. The results show that the basic reproduction number is greater than one, mean-
ing an outbreak may occur, for approximately 208 out of 365 days for the model where
Wolbachia is absent, and 130 days for the model where Wolbachia is present. That is,
Wolbachia intervention reduces the number of days when an outbreak can occur by 78
days a year in this deterministic model. If infected humans are introduced in favourable
conditions, where the basic reproduction number is higher than unity, then outbreaks can
still occur [? ? ]. This means that introducing Wolbachia-carrying mosquitoes reduces
the chance that a dengue outbreak will happen by reducing the number of days when the

74
Figure 4.6: The basic reproduction numbers for both the absence (solid lines) and presence(dashed lines) models, with sinusoidally forced mosquito adult death rates. The dotted horizontalline shows the important threshold value, R0 = 1.
conditions are favourable. The basic reproduction number is a function of the parameter
values, and is affected in the following way by key ones. If the transmission probabil-
ity increases, the basic reproduction number also increases. When the ratio of death rate
of Wolbachia-carrying to non-Wolbachia mosquitoes (f) increases, the basic reproduc-
tion number decreases, but then increases when f > 1:3. This is realistic because if f >
1:3, Wolbachia-carrying mosquitoes die out and non-Wolbachia mosquitoes dominate the
population, which then results in a higher R0. If the vertical transmission is not ignored,
the basic reproduction number would be different. That is, some proportion of mosquitoes
mature to be exposed mosquitoes. However, the modelling method would be the same.
75
4.6 Discussion and Conclusions
We have developed a mathematical model for dengue transmission dynamics in the pres-
ence of a Wolbachia-carrying mosquito population in order to quantify the effects of a
Wolbachia intervention on human dengue incidence. Our model incorporates seasonal
forcing through the adult mosquito death rate, the effect of cytoplasmic incompatibility,
and competition for resources in the aquatic stage. This model considers the circula-
tion of only a single dengue serotype with the mosquito population in a periodic stable
state, appropriate to the study of a single dengue outbreak. It is assumed that half of the
mosquito population mature into female adults, that a single introduction event occurs,
and that there is no initial dengue immunity in the human population. These effects will
have an impact on dengue transmission dynamics, with initial dengue immunity reducing
the relative effect of the Wolbachia introduction due to smaller outbreak sizes. However,
the purpose of this model was to obtain an indication of the effect of the introduction
of Wolbachia-carrying mosquitoes on dengue transmission dynamics. Extensions to the
model which consider the effect of immunity in the human population are considered in
Chapters 5, 7, and 8.
A model which does not incorporate seasonality can only fit the data for Far North
Queensland in one of two ways. First, nearly all humans need to have been previously in-
fected and now recovered (RH0≈ 1), which is not realistic. Second, all mosquitoes can die
out, as they would at some time in a one year period in a model which incorporated sea-
sonal effects. However, unlike in a model which includes seasonal effects, the mosquito
population cannot re-emerge, so this finding is again not realistic. Thus seasonality must
76
be incorporated into our model if we wish it to fit the data for Far North Queensland.
The key parameter ranges were explored in order to determine the level of dengue inci-
dence reduction due to Wolbachia and the persistence of Wolbachia-carrying mosquitoes.
This was an important part of our work as definite values for many parameters are not
known. A global sensitivity analysis was used to determine the most influential parame-
ters.
We found that inoculating mosquitoes using the Wolbachia strain WMel, which re-
duces the mosquito lifespan by at most 10%, allows Wolbachia-carrying mosquitoes to
persist. This result is compatible with the recommendations of Walker et al. [94] and
the results from field experiments [39, 41]. Furthermore, we obtain new insight from
Figure 4.5 into the importance of cytoplasmic incompatibility as a biological factor. CI
not only gives a reproductive advantage to Wolbachia-carrying female mosquitoes, but
also influences the transmission dynamics of dengue as it reduces the mosquito popula-
tion. The release of more Wolbachia-carrying males than females is being considered
by Hancock et al. [35], and their analysis may be important in considering the effect of
cytoplasmic incompatibility on dengue transmission dynamics, and the possible femini-
sation of the Wolbachia-carrying mosquito population. However, our results suggest that,
with equal numbers of males and females, Wolbachia-carrying mosquitoes can persist,
and hence a reduction in dengue human incidence can be obtained through the use of this
intervention.
The ratios of the transmission probability, d = THW/TN , and of the biting rate, g =
bW/bN , determine the level of reduction in human dengue incidence due to the introduc-
tion of Wolbachia. By contrast, the ratios of the death rate, f = µW/µN , and of the repro-

77
ductive rate, c = ρW/ρN , determine the persistence of Wolbachia-carrying mosquitoes.
This finding is corroborated by our sensitivity analysis. Additionally, the biting and re-
productive rates are linked, since female mosquitoes feed on human blood during their
reproductive cycle. However, we treat the biting and reproductive rates as independent
when exploring the parameter space and note that the relative behaviour of these parame-
ters is as shown in Figure 4.5. A significant reduction in human dengue incidence due to
the introduction of Wolbachia is also corroborated by the results found for the reproduc-
tion number. Figure 4.6 shows that the number of days where this quantity is higher than
unity is reduced by around 78 days when Wolbachia-carrying mosquitoes are introduced,
indicating that the chance of a dengue outbreak occurring is reduced. This indicates that,
in our seasonal model, the time of introduction of dengue is important. When individu-
als with dengue enter the population at the appropriate time of the year, an outbreak can
occur. This is further explored in Chapter 5.
In conclusion, a one-strain dengue mathematical model incorporating Wolbachia-carrying
mosquitoes has been developed and analysed for a single outbreak. We quantify the ef-
fect that Wolbachia will have on human dengue cases, once the mosquito populations
have reached their periodic stable states. Wolbachia comes with a fitness cost but also a
reproductive advantage (CI) to Aedes aegypti mosquitoes, and we explore the parameter
values for which Wolbachia will persist in the mosquito population. Our results show
that for realistic WMel parameter values, Wolbachia-carrying mosquitoes can greatly re-
duce the transmission of dengue. We also show that in the absence of any other effect
on the mosquito physiology by Wolbachia, cytoplasmic incompatibility alone affects the
transmission of dengue, reducing the human incidence.
78
The results discovered this chapter provide an indication that Wolbachia is effective
in reducing dengue transmission. This chapter focuses on a single introduction of dengue
cases. Generally, individuals with dengue enter the population multiple times, and the
elapsed time between introductions is irregular. Therefore, understanding the effect of
Wolbachia on dengue transmission dynamics when individuals carrying dengue enter the
population multiple times is important. In the next chapter, multiple introductions of
dengue cases into the population are investigated to assess their effects on the performance
of Wolbachia in reducing dengue transmission.
4.7 Summary
• We estimated the parameter values against data for Cairns, Australia in Section 4.5.1.
• Wolbachia is expected to reduce dengue transmission by over 90% (Section 4.5.3, see
Figure 4.5).
• Using the WMel strains that reduces the mosquito lifespan by approximately 10%
allows the mosquitoes carrying Wolbachia to persist in the wild (Sections 4.2 and
4.5.3, Figures 4.1 and 4.5(a).)
• A global sensitivity analysis reveals that the transmission probability, the average
death rate and the biting rate are the important parameters (Sections 4.5.1 and 4.5.2,
see Figures 4.3 and 4.4).
• The presence of Wolbachia reduces the number of days at which basic reproduction
number is higher than one by around 78 days in a year (Section 4.5.4, Figure 4.6).

79
• In the absence of any other effect on the mosquito physiology by Wolbachia, cy-
toplasmic incompatibility (CI) alone reduces the dengue incidence (Section 4.5.3,
Figure 4.5).
Chapter 5
Dengue Transmission Dynamics for Mul-
tiple Introductions∗
In the previous chapter, we studied the effect of Wolbachia on dengue transmission dy-
namics for a single introduction of dengue cases. In this chapter, we study the effect of
Wolbachia on dengue transmission dynamics for multiple introductions of dengue. The
aim of this chapter is to investigate the performance of Wolbachia in reducing dengue
incidence when dengue cases are introduced into the population multiple times.
We work with our dimensionalised models from Chapter 3 in the absence (Equations
(3.1)–(3.8)) and presence (Equations (3.18)–(3.29)) of Wolbachia-carrying mosquitoes.
5.1 Introduction
The transmission dynamics of dengue are very seasonal due to fluctuations in the mosquito
population as a result of variations in climatic conditions such as temperature and rainfall.
In regions with strongly seasonal climatic conditions, epidemics generally occur at certain
times of the year and are mostly triggered by the importation of dengue cases. This means
∗This work is part of the manucript that has been submitted for publication as Meksianis Z. Ndii, DavidAllingham, R.I. Hickson, Kathryn Glass. The effect of Wolbachia on dengue outbreaks when dengue isrepeatedly introduced.
80
81
that the time period in which an infected individual enters the population is an important
factor in determining whether an outbreak will occur.
Only a few research projects have considered the effects of multiple introduction times
on dengue outbreaks (see Section 2.2.6). Some studies have investigated the effects of the
frequency of dengue introductions on dengue transmission dynamics [9, 99]. Bannister-
Tyrrell et al. [9] investigated the variation in dengue activity in Australia using a process-
based modelling approach in which dengue cases were introduced once a year, bimonthly,
monthly and weekly. Williams et al. [99] used an existing dengue model, which involved
an entomological component (CIMSiM) and a disease component (DENSiM), to assess
the effects of the importation rate on dengue outbreaks. They assumed that between 1 and
25 dengue cases were introduced into the population at weekly intervals. A few mathemat-
ical models have been developed to study the effects of Wolbachia on dengue transmission
dynamics. In this chapter, we investigate the combined influence of these two factors on
dengue transmission dynamics by exploring the performance of Wolbachia in reducing
dengue incidence when dengue cases are repeatedly introduced into the population.
Mathematical models describing dengue transmission dynamics in the absence and
presence of Wolbachia-carrying mosquitoes are given in Chapter 3. The model incor-
porates seasonality through a function controlling the adult mosquito death rate and is
parameterised for Cairns, Australia. However, this model can be generalised to simulate
dengue transmission dynamics in other places where dengue outbreaks are triggered by
the importation of dengue cases. We measure the effectiveness of the Wolbachia interven-
tion by comparing the incidence of dengue in the absence and presence of Wolbachia, and
use this to compute the proportional reduction in dengue incidence. The formula for this
82
reduction is given in Equation (4.6) on Page 61.
5.1.1 Simulation Procedure
We run simulations for our model using the built-in MATLAB functions ode45 and
odextend. The initial conditions used for the simulations are SH0 = 150,000 [15], AN0 =
3× SH0, SN0 = 3× SH0 [19], SW0 = 2× SN0 [94], and the remaining populations are set
to zero. In experiments conducted to assess the spread of Wolbachia and its persistence,
Wolbachia and non-Wolbachia mosquitoes were released in the ratio 2:1 [94], and so we
set SW0 = 2× SN0. In the absence of Wolbachia-carrying mosquitoes, SW0 = 0. In this
analysis, the phase, ω , is shifted 60 days (ω = 80.61 days) as our start time is January.
We use the following procedure for our simulations. First, the model is run without
dengue using the initial conditions described above until the mosquito population reaches
the periodic stable state, and then individuals with dengue are introduced. Second, we
continue the simulation using “odextend” for another week, after which dengue is reintro-
duced. The reintroduction procedure is repeated until the final introduction for the year.
Step two is repeated for the same periods of each following year until the human infected
population has remained constant for at least 75 consecutive years. As we assume a con-
stant human population, when individuals with dengue are introduced, the same number
of individuals are removed from the susceptible human class, SH . We are particularly
interested in the occurrence of outbreaks as the aim of this chapter is to determine the
reduction in dengue outbreak size due to Wolbachia. To ensure that the disease does not
persist when the infected human population is less than one individual, the infected pop-
ulation is set to zero if it falls below a threshold of 0.5, which is a deterministic proxy for

83
stochastic fade-out.
5.1.2 Introduction Scenarios
We consider weekly year-round introductions and weekly three-month introduction peri-
ods. Plots of the time series for infected humans when we introduce dengue every week
in a year (1st scenario) and every week in a three month period (2nd and 3rd scenarios)
are given in Figure 5.1. In the second scenario, dengue cases are introduced weekly from
June to August, while in the third scenario, dengue cases are introduced weekly from
September to November. The introduction periods are represented by rectangles at the
top of Figure 5.1. In the second and third scenarios, the disease dies out over winter, but
the overall dynamics for each of the three scenarios are very similar due to the level of
introduction.
The true number of imported cases is very uncertain and differs across geographic
regions [80]. In Queensland, for instance, the number of imported dengue cases was
around 202 in 2010 and 118 in 2011 [46]. The number of imported cases in Taiwan has
increased over time from one individual in 1998 to around 15 individuals in 2007 [82].
In our model, two dengue cases are introduced each week, with a total of 104 imported
cases for year-round introduction (scenario 1) and 26 imported cases for each of the three
month periods of introduction (scenarios 2 and 3).
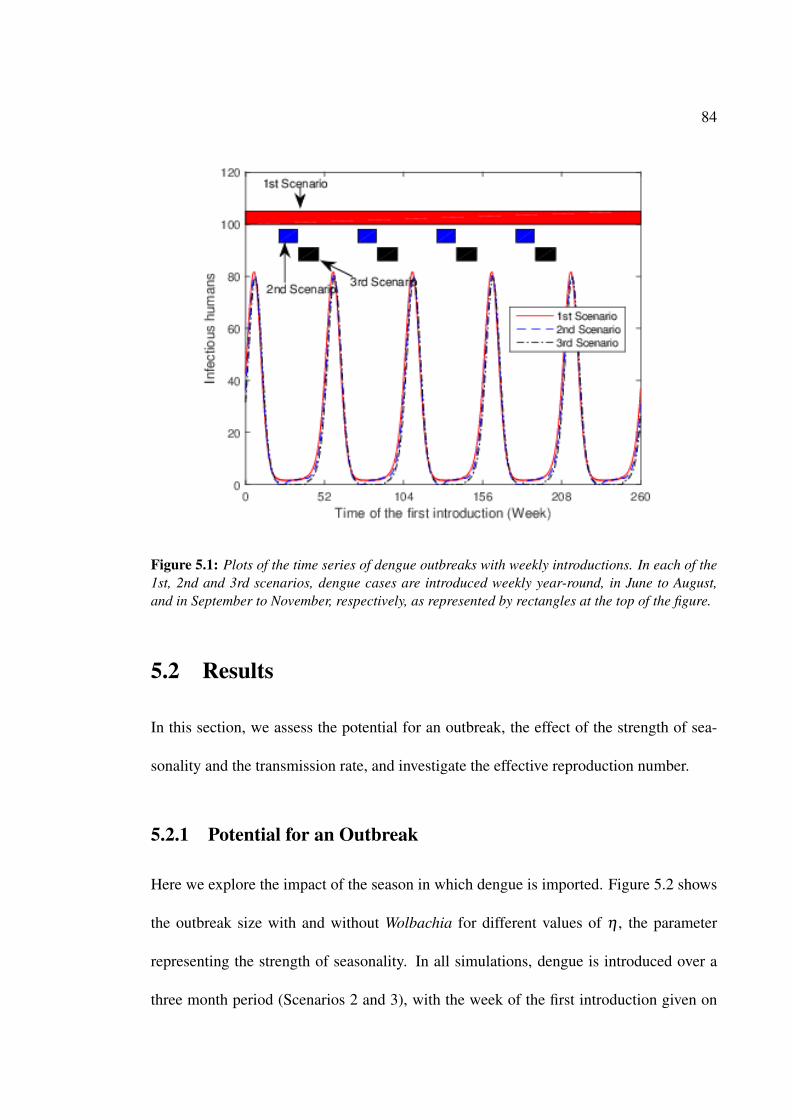
84
Figure 5.1: Plots of the time series of dengue outbreaks with weekly introductions. In each of the1st, 2nd and 3rd scenarios, dengue cases are introduced weekly year-round, in June to August,and in September to November, respectively, as represented by rectangles at the top of the figure.
5.2 Results
In this section, we assess the potential for an outbreak, the effect of the strength of sea-
sonality and the transmission rate, and investigate the effective reproduction number.
5.2.1 Potential for an Outbreak
Here we explore the impact of the season in which dengue is imported. Figure 5.2 shows
the outbreak size with and without Wolbachia for different values of η , the parameter
representing the strength of seasonality. In all simulations, dengue is introduced over a
three month period (Scenarios 2 and 3), with the week of the first introduction given on

85
Figure 5.2: Plot of the first week of introduction of introduced dengue cases versus outbreak size.The square and diamond are the first week of the introduction for scenarios 2 and 3 respectively.Parameter values are given in Table 4.1. ‘Absence’ means that Wolbachia-carrying mosquitoeshave not been introduced. ‘Presence’ means that Wolbachia-carrying mosquitoes have been in-troduced. The parameter η represents the seasonality strength.
the x-axis. Figure 5.2 shows that the lengths of the potential outbreak seasons have been
reduced in the presence of Wolbachia-carrying mosquitoes for all three values of η . The
maximum potential outbreak size occurs when dengue is first introduced between June
and September. Furthermore, the outbreak season contracts as the strength of seasonality
(η) increases.
In investigating the effects of the transmission rate and the strength of seasonality un-
der the assumption that dengue is introduced over a period of three months, we use the
June to August (scenario 2) and September to November (scenario 3) time periods of in-

86
troduction as outbreaks can potentially occur when dengue is introduced in these periods.
We use three-month periods of introduction as these are equivalent to the approximate
length of a climatic season such as Summer or Winter.
5.2.2 The Effect of the Strength of Seasonality
The strength of seasonality is one of the key factors to explore since it affects vector dy-
namics. As the strength of seasonality (η) increases, the outbreak size increases both in
the absence and presence of Wolbachia-carrying mosquitoes (Figure 5.3). When we look
at the overall effects of Wolbachia on dengue, we see that the proportional reduction in
dengue decreases as the strength of seasonality increases. Furthermore, the time of in-
troduction also affects the impact of Wolbachia on dengue incidence. The reduction in
dengue incidence when cases are introduced weekly throughout the year (scenario 1) is
lower than that for either of the scenarios modelling three months of introduction, and
hence Wolbachia is less effective in this scenario. For low values of the strength of sea-
sonality, the proportional reduction in dengue is approximately 80% for year-round intro-
duction (scenario 1) and over 80% for the three month periods of introduction (scenarios
2 and 3). In general, the Wolbachia intervention is most effective when the amplitude of
seasonality is low.
5.2.3 The Effect of the Transmission Rate
The transmission probability (TN) and the biting rate (bN) are the most influential pa-
rameters in the model [69] and so we explore the effects of these parameters on dengue
dynamics in the presence of Wolbachia. As these two parameters have similar effects on
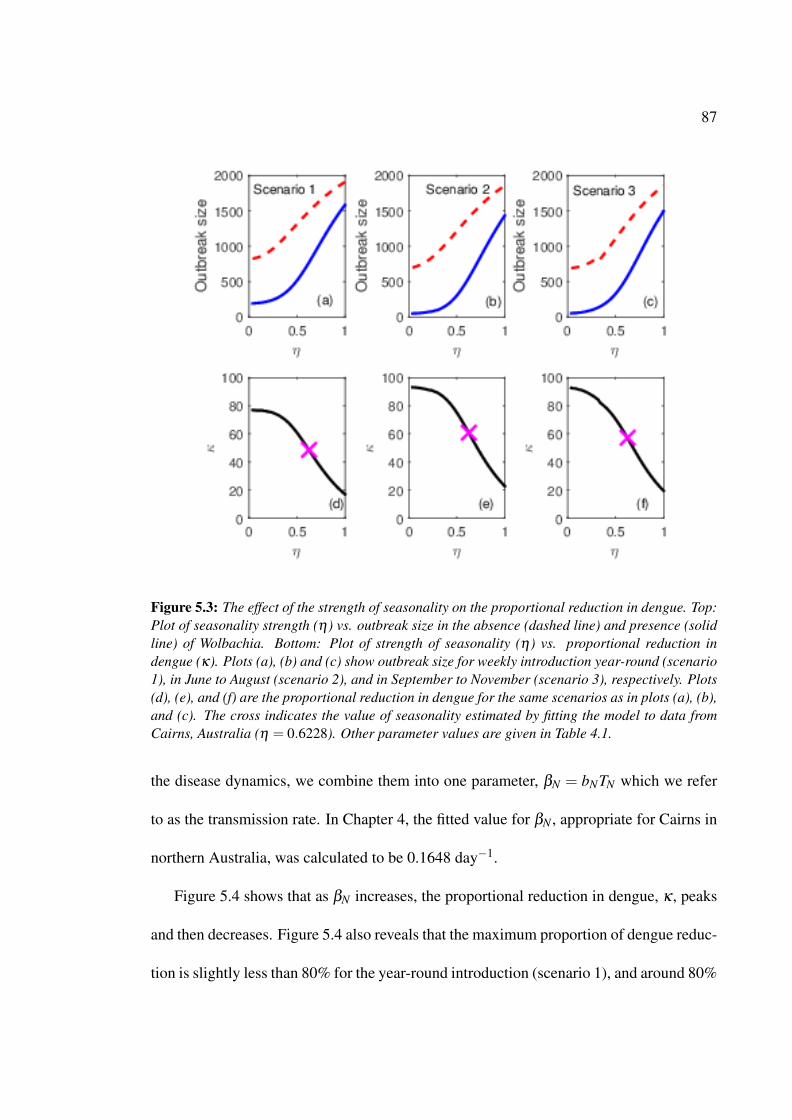
87
Figure 5.3: The effect of the strength of seasonality on the proportional reduction in dengue. Top:Plot of seasonality strength (η) vs. outbreak size in the absence (dashed line) and presence (solidline) of Wolbachia. Bottom: Plot of strength of seasonality (η) vs. proportional reduction indengue (κ). Plots (a), (b) and (c) show outbreak size for weekly introduction year-round (scenario1), in June to August (scenario 2), and in September to November (scenario 3), respectively. Plots(d), (e), and (f) are the proportional reduction in dengue for the same scenarios as in plots (a), (b),and (c). The cross indicates the value of seasonality estimated by fitting the model to data fromCairns, Australia (η = 0.6228). Other parameter values are given in Table 4.1.
the disease dynamics, we combine them into one parameter, βN = bNTN which we refer
to as the transmission rate. In Chapter 4, the fitted value for βN , appropriate for Cairns in
northern Australia, was calculated to be 0.1648 day−1.
Figure 5.4 shows that as βN increases, the proportional reduction in dengue, κ , peaks
and then decreases. Figure 5.4 also reveals that the maximum proportion of dengue reduc-
tion is slightly less than 80% for the year-round introduction (scenario 1), and around 80%

88
Figure 5.4: Top: Plot of transmission rate (βN) vs. outbreak size in the absence (dashed line)and presence (solid line) of Wolbachia. Bottom: Plot of transmission rate (βN) vs. proportionalreduction in dengue (κ). Plots (a), (b) and (c) are the outbreak size for weekly introduction year-round (scenario 1), in June to August (scenario 2), and in September to November (scenario 3),respectively. Plots (d), (e), and (f) are the proportional reduction in dengue for the same scenariosas in plots (a), (b), and (c). The cross indicates the value of the transmission rate estimated byfitting the model to data from Cairns, Australia, (βN = 0.1648). Other parameter values are givenin Table 4.1.
for weekly introduction during June to August (scenario 2) and September to November
(scenario 3). For Cairns, the proportional reduction in dengue is around 50% for year-
round introduction and 60% for three-month introductions.
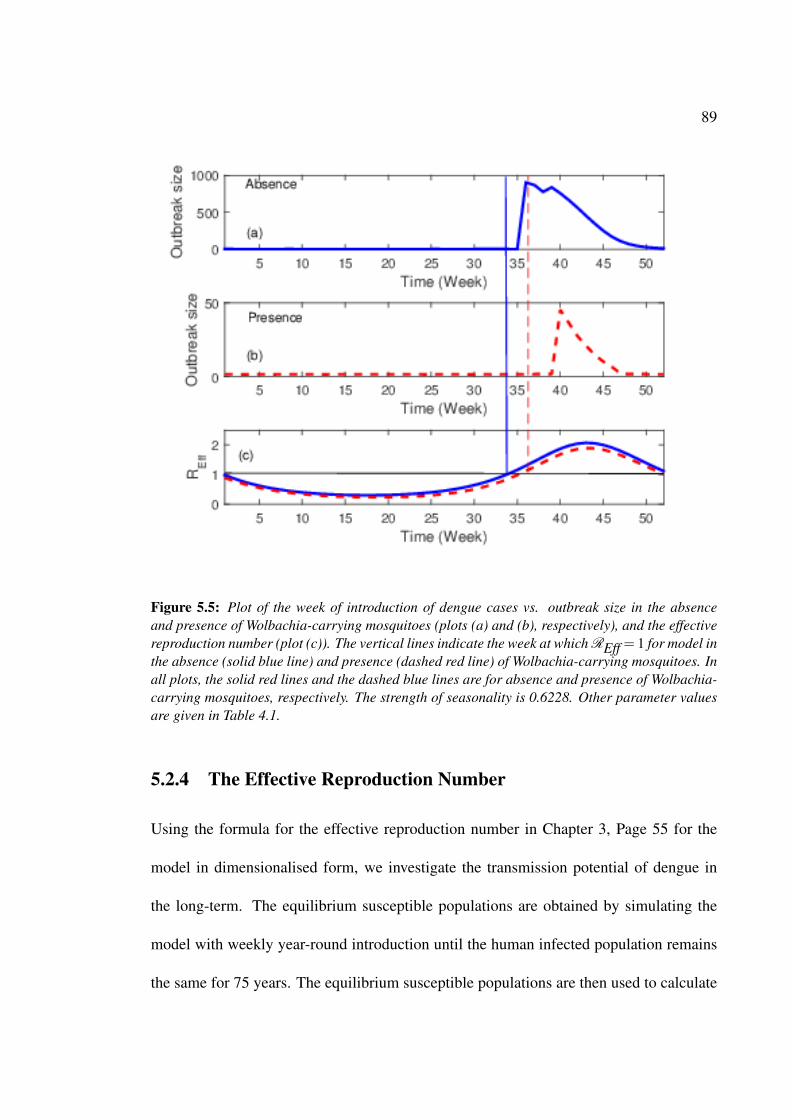
89
Figure 5.5: Plot of the week of introduction of dengue cases vs. outbreak size in the absenceand presence of Wolbachia-carrying mosquitoes (plots (a) and (b), respectively), and the effectivereproduction number (plot (c)). The vertical lines indicate the week at which REff = 1 for model inthe absence (solid blue line) and presence (dashed red line) of Wolbachia-carrying mosquitoes. Inall plots, the solid red lines and the dashed blue lines are for absence and presence of Wolbachia-carrying mosquitoes, respectively. The strength of seasonality is 0.6228. Other parameter valuesare given in Table 4.1.
5.2.4 The Effective Reproduction Number
Using the formula for the effective reproduction number in Chapter 3, Page 55 for the
model in dimensionalised form, we investigate the transmission potential of dengue in
the long-term. The equilibrium susceptible populations are obtained by simulating the
model with weekly year-round introduction until the human infected population remains
the same for 75 years. The equilibrium susceptible populations are then used to calculate
90
the effective reproduction number. We then simulate our model where two dengue cases
are introduced once a year in a specific week (we implement a thresholding of 0.5 to keep
consistency), and compare this with the results of the effective reproduction number.
A comparison of the effective reproduction number (REff) and with the outbreak size
shows a similar threshold (Figure 5.5). If we introduce dengue cases in the week at which
REff > 1, an outbreak is likely to occur (Figure 5.5). There is a slight difference between
the week in which REff > 1 and the week in which outbreak takes off. The outbreak
takes off around two weeks later in the absence of Wolbachia and four weeks later in the
presence of Wolbachia-carrying mosquitoes.
5.3 Discussion and conclusions
We investigated the effects of Wolbachia on dengue transmission dynamics using a math-
ematical model which includes the importation of humans infected with dengue.
We found that, in the presence of Wolbachia-carrying mosquitoes, the time-window
in which epidemics can occur is reduced by between two and six weeks (see Figure 5.2),
depending on the strength of seasonality. This is driven by a decline in the mosquito
population size, likely caused by a reduction in the mosquito lifespan and, thus, in the
mosquito’s reproductive rate. An increase in the strength of seasonality further reduces
the time-window in which an outbreak can occur due to the presence of a limited number
of mosquitoes over winter. In this case, the decline in the mosquito population numbers
is due to a short lifespan driven by seasonality. The model provides the insight that the
presence of Wolbachia-carrying mosquitoes reduces the length of the potential seasons in
91
which an outbreak can occur.
We also compared the time-dependent reproduction number and the simulation, and
found the time at which an outbreak occurs qualitatively matches. That is, an outbreak
occurs when the reproduction number is greater than one. The models agree within 2–4
weeks and this slight discrepancy is likely due to a combination of disease importation
assumptions and thresholding rules that lead to outbreak fadeout for some reproductions
numbers close to one. As the purpose of this thesis is to obtain general understanding of
the performance of Wolbachia in reducing dengue incidence, the general consistency in
these approaches is sufficient and reassuring.
In comparing the outbreak sizes, as the strength of seasonality is increased, we found
that outbreak sizes increase and the benefits of Wolbachia decrease. This increase in out-
break size is caused by a larger mosquito population since the mosquito lifespan is longer
when seasonality is at its highest. This larger mosquito population increases the chance
that a human in the population is infected. In contrast, as the transmission rate increases,
there is an intermediate level of transmission (around 0.08 to 0.12) at which Wolbachia
is most effective. At these transmission rates, outbreaks will occur in the absence of
Wolbachia, but only either very small or no outbreaks will occur in the presence of Wol-
bachia-carrying mosquitoes. When the strength of seasonality is around 0.02-0.30 and
the transmission rates are around 0.08 to 0.12 day−1, dengue incidence can be reduced
by more than 80%, depending on the time of year in which dengue cases are introduced.
In reality, infected individuals enter populations year-round, according to a number of
different factors. However, our results across scenarios 1–3 show that the effect of Wol-
bachia is largely independent of the time of introduction. Overall, our results suggest that
92
dengue incidence can be reduced by up to 80% in populations where dengue is repeatedly
introduced.
In this chapter, multiple introductions of a single dengue strain were explored. Al-
though these findings provide insights into the performance of Wolbachia in reducing
dengue incidence, generally individuals with different dengue serotypes enter the popu-
lation at random times. Moreover, since four dengue serotypes are circulating in most
places [53, 64], the effects of Wolbachia on dengue transmission dynamics with multiple
serotypes are of interest. This may influence Wolbachia performance in reducing dengue.
However, generally only one serotype dominates a given outbreak [53, 64, 84]. In the
following three chapters, the performance of Wolbachia in reducing dengue when more
than one dengue serotype circulates in the population is investigated.
5.4 Summary
• We conducted multiple introductions of a single dengue serotype to investigate the
performance of Wolbachia in reducing dengue incidence.
• When dengue is not endemic, timing of imported cases determines the likelihood of
an outbreak (Sections 5.2.1 and 5.2.4, see Figures 5.2 and 5.5).
• We found that the time window in which outbreak occurs has been reduced by up
to six weeks in the presence of Wolbachia-carrying mosquitoes (Section 5.2.1, Fig-
ure 5.2).
• A reduction of 80% in dengue incidence can be obtained when the strength of sea-
93
sonality and the transmission rates are around 0.02–0.3 and 0.08–0.12, respectively
(Sections 5.2.2 and 5.2.3, see Figures 5.3 and 5.4).
Part 2: Two Dengue Serotypes
In this part of the thesis, the performance of the Wolbachia intervention when two dengue
serotypes circulate is studied. In addition, the effects of symmetric and asymmetric epi-
demiological characteristics on Wolbachia performance in reducing dengue incidence are
explored. This part comprises Chapters 6–8, and the results are summarised below.
Summary
• Two-serotype dengue models in the absence and presence of Wolbachia-carrying
mosquitoes are developed (Chapter 6, Equations (6.3)–(6.14) and (6.24)–(6.39)).
• The procedure for simulation is the same as that in Chapter 5, except here the dengue
serotype being introduced varies according to the scenario of dengue introductions
(Section 7.2).
• Different disease introduction scenarios are explored and the results show that varying
the disease introduction scenario does not affect Wolbachia performance in reducing
dengue incidence, with up to 80% reduction in human dengue cases (Chapter 7, Sec-
tions 7.3.1 and 7.3.2).
• Although the antibody-dependent enhancement parameter affects the performance of
Wolbachia in reducing dengue incidence, the transmission probability remains the
key parameter regulating the dengue dynamics, and, hence, Wolbachia performance
in reducing dengue incidence (Chapters 7 and 8).
94
95
• When one serotype is more transmissible, that serotype will dominate the primary
infections, and the secondary infections will be dominated by the less transmissible
serotype. The performance of Wolbachia in reducing dengue infection caused by the
more transmissible serotype subsequently declines (Section 8.2.2).
• The proportional reduction in secondary infections due to the Wolbachia intervention
is higher than that for primary infections (Chapters 7 and 8).

Chapter 6
Mathematical Modelling of Two Dengue
Serotypes dengue∗
In order to investigate the performance of Wolbachia in reducing dengue incidence when
more than one dengue serotype circulates, we develop two-serotype models for dengue in
the absence and presence of Wolbachia-carrying mosquitoes. In this chapter, we present
a full derivation of these models and explain their important features. In Chapters 7 and 8
we use our models to study the effects of symmetric and asymmetric epidemiological
characteristics of the serotypes on dengue transmission dynamics.
6.1 Model Formulation
In these models, human and mosquito populations are assumed to be well-mixed and ho-
mogenous, and we include two serotypes of dengue. The ratio between male and female
mosquitoes is 1.02:1 [7]. For simplicity, we assume that the numbers of male and fe-
male mosquitoes are equal, that is, FN = MN and FW = MW . Subscripts H, N, W denote
humans, non-Wolbachia and Wolbachia-carrying mosquitoes, respectively. Superscripts i
∗The mathematical models presented here are part of the manuscript that has been submitted for publi-cation as M.Z. Ndii, D. Allingham, R. I. Hickson, K. Glass. The effect of Wolbachia on dengue dynamics inthe presence of multiple serotypes of dengue: symmetric and asymmetric epidemiological characteristics.
96
97
and j denote serotypes 1 or 2. This chapter is organised as follows. First, we present the
formulation of the model in the absence of Wolbachia, and then the model in the presence
of Wolbachia. Finally, we remind the reader of the relationships between and the values
of several important parameters for the models.
6.1.1 Model in the Absence of Wolbachia
A two-serotype dengue model in the absence of Wolbachia-carrying mosquitoes is formu-
lated. This model is an extension of the single serotype dengue model in the absence of
Wolbachia-carrying mosquito population given in Equations (3.1)–(3.8) on page 42. The
model comprises human and non-Wolbachia mosquito populations, and the schematic
representation of the model is given in Figure 6.1. Superscripts i and j denote dengue
serotypes, where i = 1,2 and j = 3− i.
The human population is divided into 14 different classes:
• Susceptible to all serotypes, SH .
• Exposed and infectious with serotype i, E iH and Ii
H , respectively.
• Temporarily immune to all serotypes, but previously infected by serotype i, X iH .
• Susceptible to serotype j and previously infected by serotype i, S jiH .
• Exposed and infectious to serotype j and previously infected by serotype i, E jiH and
I jiH , respectively.
• Recovered from all serotypes, RH .

98
Figure 6.1: Schematic representation of model with two serotypes in the absence of Wolbachia-carrying mosquitoes. Solid lines are population progression lines and dashed lines are diseasetransmission lines. The subscript H is for the human population, N is for the non-Wolbachia-carrying mosquito population and i is for the serotype. The compartments are ‘S’ for suscep-tible, ‘E’ for exposed to dengue but not yet infectious, ‘I’ for infectious, ‘R’ for recovered fromall serotypes, ‘X’ for temporary immunity to all serotypes and ‘A’ for the aquatic phase of themosquito life cycle. The transition rates between compartments are shown next to the progressionlines and are described in the text.

99
The total human population is then given by the equation
NH = SH +RH +2
∑i=1
(E i
H + IiH +X i
H)+
2
∑i=1
j=3−i
(S ji
H +E jiH + I ji
H
). (6.1)
The non-Wolbachia mosquito population is divided into six compartments:
• Mosquitoes in the aquatic stage, AN .
• Susceptible, SN .
• Exposed to either serotype, E iN .
• Infectious with either serotype, IiN .
The mosquitoes remain infectious throughout their lifetime, hence no recovered class for
mosquitoes is required. We also assume that the mosquitoes are never co-infected with
both serotypes. The total population of non-Wolbachia mosquitoes, FN , is given by the
equation
FN = SN +2
∑i=1
(E i
N + IiN). (6.2)
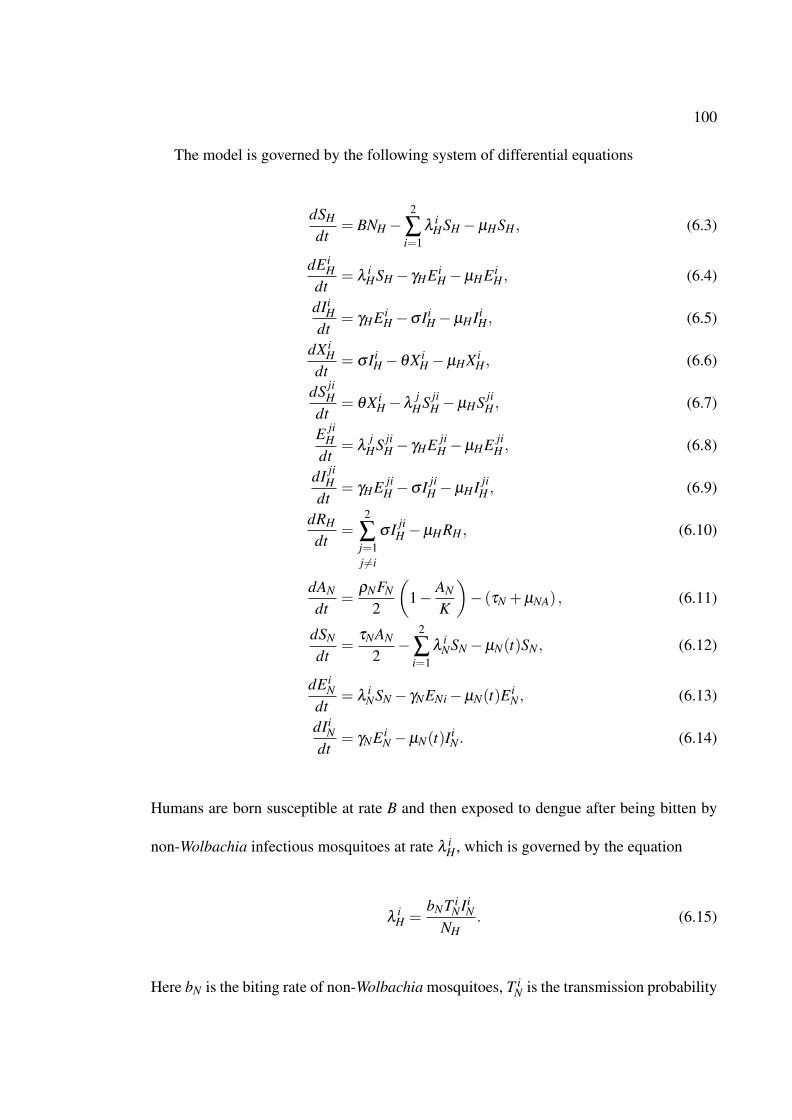
100
The model is governed by the following system of differential equations
dSH
dt= BNH−
2
∑i=1
λiHSH−µHSH , (6.3)
dE iH
dt= λ
iHSH− γHE i
H−µHE iH , (6.4)
dIiH
dt= γHE i
H−σ IiH−µHIi
H , (6.5)
dX iH
dt= σ Ii
H−θX iH−µHX i
H , (6.6)
dS jiH
dt= θX i
H−λj
HS jiH−µHS ji
H , (6.7)
E jiH
dt= λ
jHS ji
H− γHE jiH −µHE ji
H , (6.8)
dI jiH
dt= γHE ji
H −σ I jiH −µHI ji
H , (6.9)
dRH
dt=
2
∑j=1j 6=i
σ I jiH −µHRH , (6.10)
dAN
dt=
ρNFN
2
(1− AN
K
)− (τN +µNA) , (6.11)
dSN
dt=
τNAN
2−
2
∑i=1
λiNSN−µN(t)SN , (6.12)
dE iN
dt= λ
iNSN− γNENi−µN(t)E i
N , (6.13)
dIiN
dt= γNE i
N−µN(t)IiN . (6.14)
Humans are born susceptible at rate B and then exposed to dengue after being bitten by
non-Wolbachia infectious mosquitoes at rate λ iH , which is governed by the equation
λiH =
bNT iNIi
NNH
. (6.15)
Here bN is the biting rate of non-Wolbachia mosquitoes, T iN is the transmission probability
101
from non-Wolbachia mosquitoes with serotype i to humans, and NH is the total human
population, given in Equation 6.1. The transmission probability between humans and
non-Wolbachia mosquitoes is assumed to be the same, and is denoted by T iN .
Exposed individuals progress to the infectious class at rate γH , and then to the tempo-
rary immunity class at rate σ . After spending 1/θ time units in the temporary immunity
class, they become susceptible to the other serotype j, where j 6= i. They may then be-
come exposed to dengue after being bitten by non-Wolbachia mosquitoes carrying dengue
serotype j at rate
λj
H =bNT j
NI jN
NH. (6.16)
Following re-exposure, they become infectious at rate γH , and recover from the secondary
infection at rate σ . We assume that dengue is not fatal, so that humans die only at the
natural death rate, µH . As explained in Section 2.1.1, fatality due to the severe forms of
dengue is only 1% in developed nations and we focus on the difference in dengue cases in
the presence versus absence of Wolbachia-carrying mosquitoes, so use this simplification.
Non-Wolbachia aquatic mosquitoes are produced when non-Wolbachia female FN and
male MN mosquitoes mate. The growth of the aquatic mosquito population is limited by
the carrying capacity K, through the inclusion of the term:
ρNFNMN
(FN +MN)
(1− AN
K
). (6.17)
As the ratio between males and females is around 1.02:1 [7], we assume that there are
equal populations of male and female mosquitoes, FN = MN . Therefore, Equation 6.17 is
102
reduced to
ρNFN
2
(1− AN
K
). (6.18)
Non-Wolbachia aquatic mosquitoes become adult susceptible mosquitoes at rate τN . The
susceptible mosquitoes are infected with dengue after biting infectious humans with either
primary or secondary infections at rate
λiN =
bNT iNIi
HNH
+φ ibT i
NIi jH
NH. (6.19)
Here φ i is the antibody-dependent enhancement of serotype i, which is higher than one
since infectious individuals with a secondary infection have a higher viral load, and hence,
a higher transmission rate. The exposed mosquitoes become infectious at rate γH . The
death rate of adult mosquitoes is sinusoidally forced according to the equation
µN = µN0
(1−η cos
(2π (t +ω))
365
)), (6.20)
where µN0 is average death rate, η is the amplitude of seasonality and ω is a phase shift
as also done in Section 3.1.
6.1.2 Model in the Presence of Wolbachia
In this section, a two-serotype dengue model in the presence of Wolbachia-carrying mosquitoes
is formulated. The model is an extension of the model in the absence of Wolbachia-
carrying mosquitoes given in Equations (6.3)–(6.14) of the previous section. The flowchart
for this model is given in Figure 6.2. The two-serotype dengue model in the presence of
103
Wolbachia-carrying mosquitoes is governed by Equations (6.24)–(6.39).
The model comprises human, non-Wolbachia and Wolbachia-carrying mosquito pop-
ulations. The human and non-Wolbachia mosquito compartments are the same as in
the model in the absence of Wolbachia-carrying mosquitoes. The population of Wol-
bachia-carrying mosquitoes is grouped into six compartments, which are mosquitoes in
the aquatic stage, AW , susceptible, SW , exposed to either serotype i, E iW , and infectious
with either serotype i, IiW . The total population of Wolbachia-carrying mosquitoes is
FW = SW +2
∑i=1
(E i
W + IiW), (6.21)
and the total population of non-Wolbachia mosquitoes is given in Equation (6.2).
Unlike in the model in the absence of Wolbachia, susceptible humans are exposed
to dengue after being bitten by either infectious non-Wolbachia or Wolbachia-carrying
mosquitoes, that is, at a rate governed by
λiH =
bNT iNIi
NNH
+bW T i
HW IiW
NH. (6.22)
Here THW is the transmission probability from Wolbachia-carrying mosquitoes to humans.
The parameter bW is the successful biting rate of Wolbachia-carrying mosquitoes, where
bW < bN since Wolbachia reduces the biting rate [89]. Exposed individuals progress to
infectious, temporary immunity and secondary susceptible classes at the same rates as in
model in the absence of Wolbachia-carrying mosquitoes. Individuals who were previously

104
infected by serotype i are re-infected by dengue serotype j at rate
λj
H =bNT j
NI jN
NH+
bW T jHW I j
WNH
, (6.23)
where j 6= i. Infectious individuals then move to secondary infectious and recovered
classes at the same rates as in the model in the absence of Wolbachia. All humans die at
the natural death rate, µH .
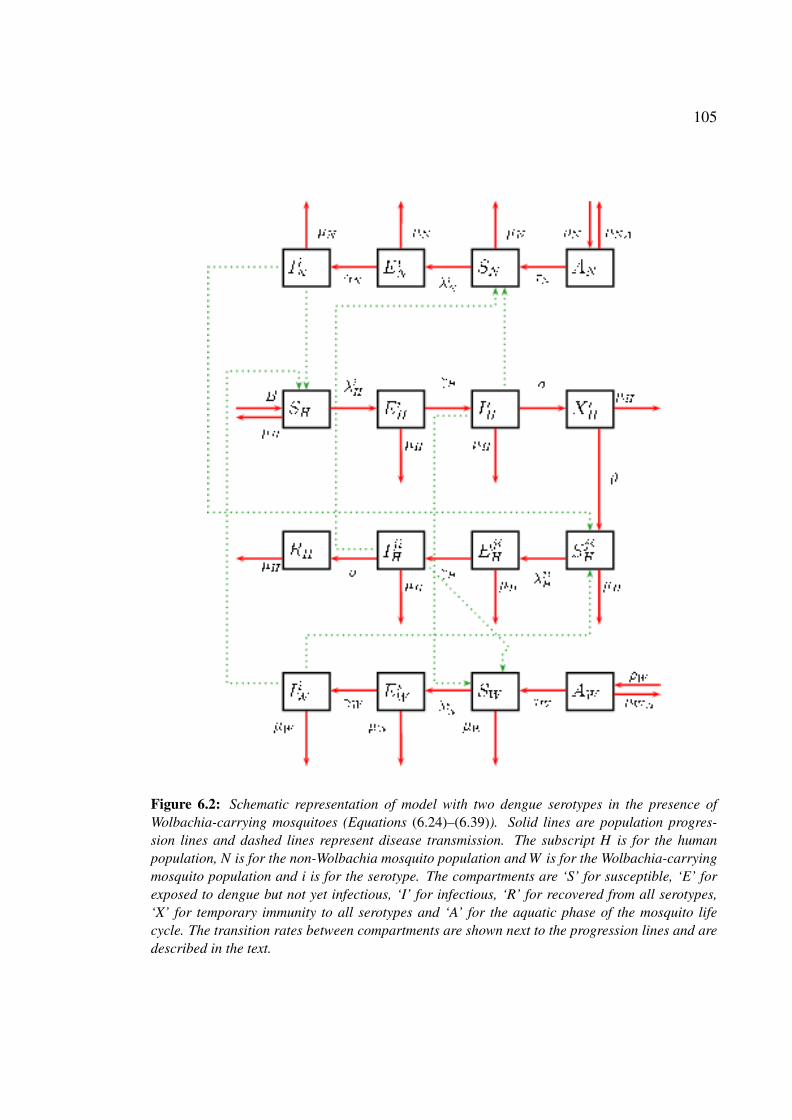
105
Figure 6.2: Schematic representation of model with two dengue serotypes in the presence ofWolbachia-carrying mosquitoes (Equations (6.24)–(6.39)). Solid lines are population progres-sion lines and dashed lines represent disease transmission. The subscript H is for the humanpopulation, N is for the non-Wolbachia mosquito population and W is for the Wolbachia-carryingmosquito population and i is for the serotype. The compartments are ‘S’ for susceptible, ‘E’ forexposed to dengue but not yet infectious, ‘I’ for infectious, ‘R’ for recovered from all serotypes,‘X’ for temporary immunity to all serotypes and ‘A’ for the aquatic phase of the mosquito lifecycle. The transition rates between compartments are shown next to the progression lines and aredescribed in the text.
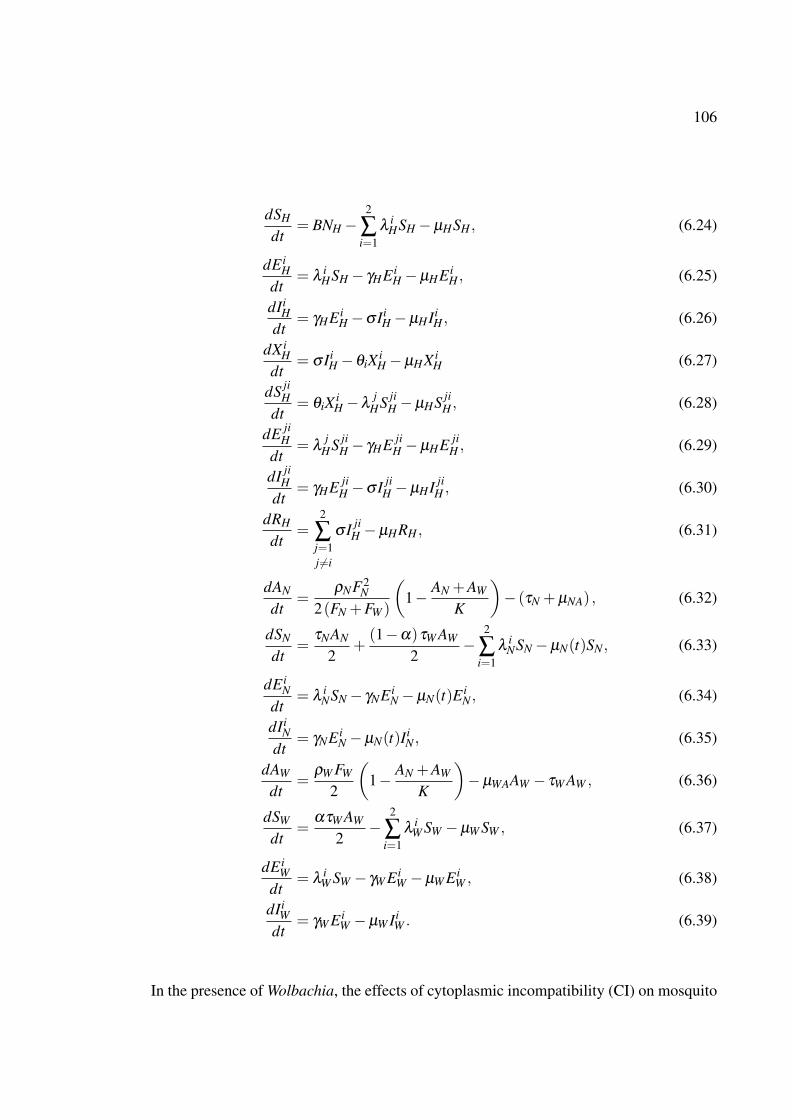
106
dSH
dt= BNH−
2
∑i=1
λiHSH−µHSH , (6.24)
dE iH
dt= λ
iHSH− γHE i
H−µHE iH , (6.25)
dIiH
dt= γHE i
H−σ IiH−µHIi
H , (6.26)
dX iH
dt= σ Ii
H−θiX iH−µHX i
H (6.27)
dS jiH
dt= θiX i
H−λj
HS jiH−µHS ji
H , (6.28)
dE jiH
dt= λ
jHS ji
H− γHE jiH −µHE ji
H , (6.29)
dI jiH
dt= γHE ji
H −σ I jiH −µHI ji
H , (6.30)
dRH
dt=
2
∑j=1j 6=i
σ I jiH −µHRH , (6.31)
dAN
dt=
ρNF2N
2(FN +FW )
(1− AN +AW
K
)− (τN +µNA) , (6.32)
dSN
dt=
τNAN
2+
(1−α)τW AW
2−
2
∑i=1
λiNSN−µN(t)SN , (6.33)
dE iN
dt= λ
iNSN− γNE i
N−µN(t)E iN , (6.34)
dIiN
dt= γNE i
N−µN(t)IiN , (6.35)
dAW
dt=
ρW FW
2
(1− AN +AW
K
)−µWAAW − τW AW , (6.36)
dSW
dt=
ατW AW
2−
2
∑i=1
λiW SW −µW SW , (6.37)
dE iW
dt= λ
iW SW − γW E i
W −µW E iW , (6.38)
dIiW
dt= γW E i
W −µW IiW . (6.39)
In the presence of Wolbachia, the effects of cytoplasmic incompatibility (CI) on mosquito
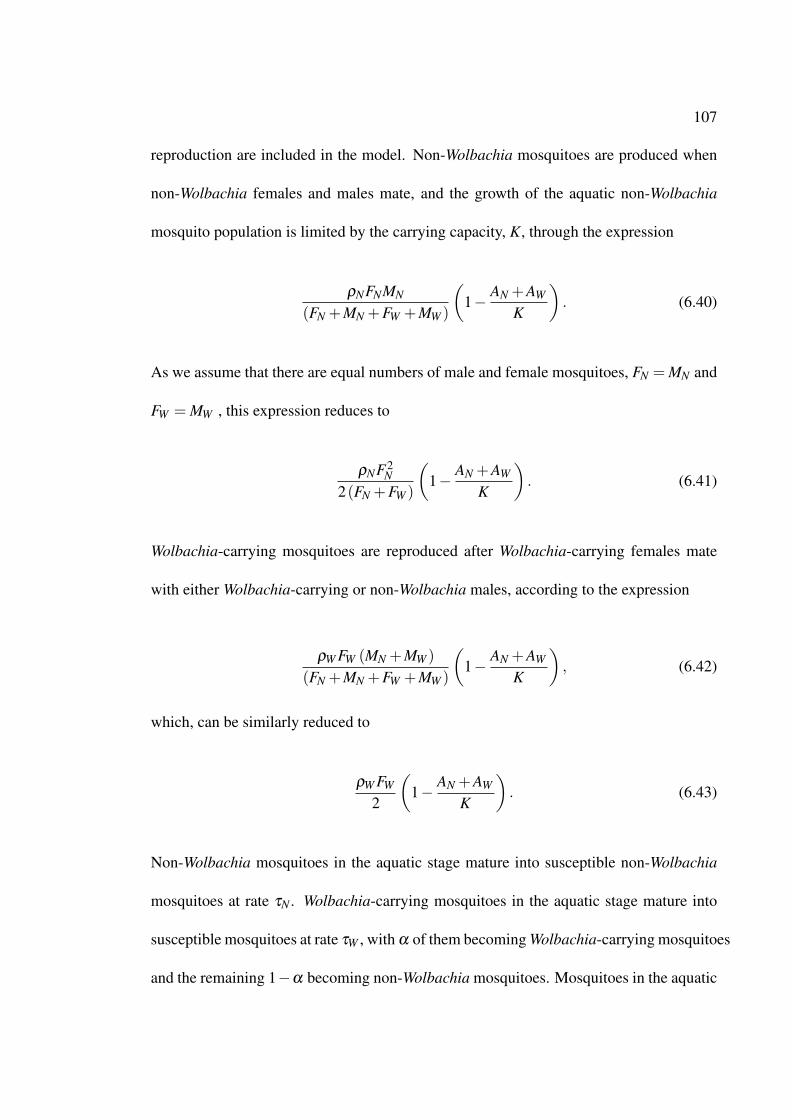
107
reproduction are included in the model. Non-Wolbachia mosquitoes are produced when
non-Wolbachia females and males mate, and the growth of the aquatic non-Wolbachia
mosquito population is limited by the carrying capacity, K, through the expression
ρNFNMN
(FN +MN +FW +MW )
(1− AN +AW
K
). (6.40)
As we assume that there are equal numbers of male and female mosquitoes, FN = MN and
FW = MW , this expression reduces to
ρNF2N
2(FN +FW )
(1− AN +AW
K
). (6.41)
Wolbachia-carrying mosquitoes are reproduced after Wolbachia-carrying females mate
with either Wolbachia-carrying or non-Wolbachia males, according to the expression
ρW FW (MN +MW )
(FN +MN +FW +MW )
(1− AN +AW
K
), (6.42)
which, can be similarly reduced to
ρW FW
2
(1− AN +AW
K
). (6.43)
Non-Wolbachia mosquitoes in the aquatic stage mature into susceptible non-Wolbachia
mosquitoes at rate τN . Wolbachia-carrying mosquitoes in the aquatic stage mature into
susceptible mosquitoes at rate τW , with α of them becoming Wolbachia-carrying mosquitoes
and the remaining 1−α becoming non-Wolbachia mosquitoes. Mosquitoes in the aquatic
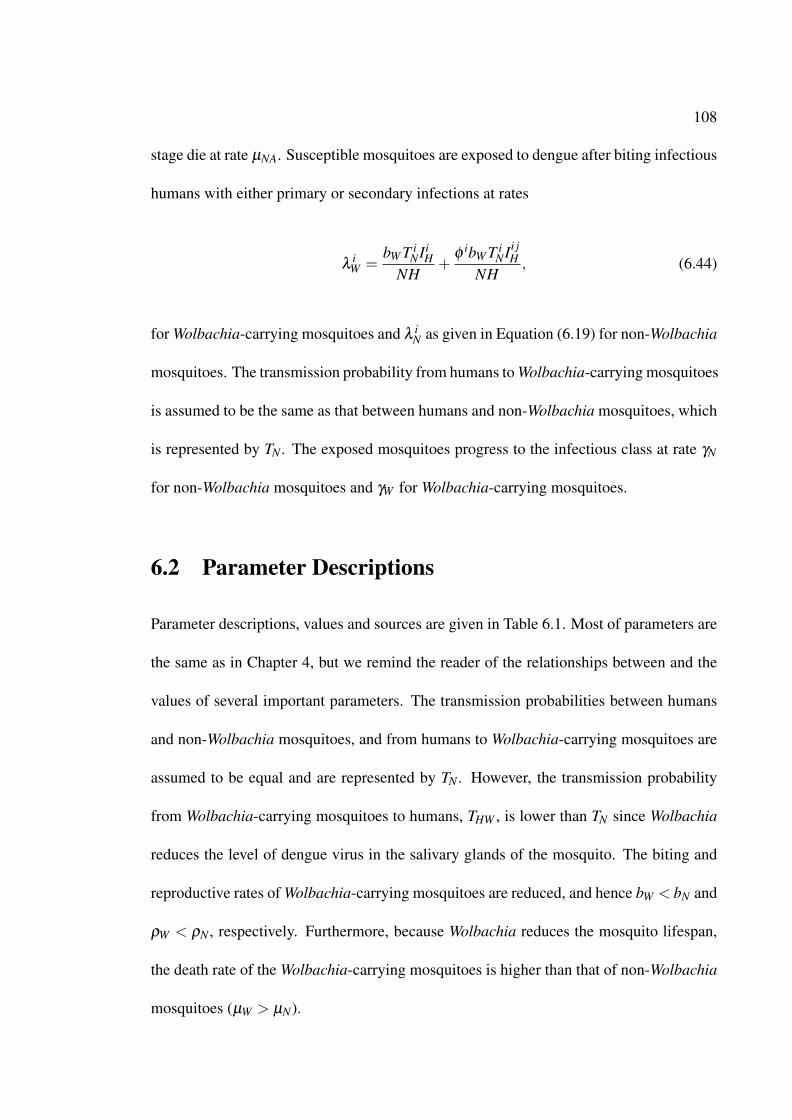
108
stage die at rate µNA. Susceptible mosquitoes are exposed to dengue after biting infectious
humans with either primary or secondary infections at rates
λiW =
bW T iNIi
HNH
+φ ibW T i
NIi jH
NH, (6.44)
for Wolbachia-carrying mosquitoes and λ iN as given in Equation (6.19) for non-Wolbachia
mosquitoes. The transmission probability from humans to Wolbachia-carrying mosquitoes
is assumed to be the same as that between humans and non-Wolbachia mosquitoes, which
is represented by TN . The exposed mosquitoes progress to the infectious class at rate γN
for non-Wolbachia mosquitoes and γW for Wolbachia-carrying mosquitoes.
6.2 Parameter Descriptions
Parameter descriptions, values and sources are given in Table 6.1. Most of parameters are
the same as in Chapter 4, but we remind the reader of the relationships between and the
values of several important parameters. The transmission probabilities between humans
and non-Wolbachia mosquitoes, and from humans to Wolbachia-carrying mosquitoes are
assumed to be equal and are represented by TN . However, the transmission probability
from Wolbachia-carrying mosquitoes to humans, THW , is lower than TN since Wolbachia
reduces the level of dengue virus in the salivary glands of the mosquito. The biting and
reproductive rates of Wolbachia-carrying mosquitoes are reduced, and hence bW < bN and
ρW < ρN , respectively. Furthermore, because Wolbachia reduces the mosquito lifespan,
the death rate of the Wolbachia-carrying mosquitoes is higher than that of non-Wolbachia
mosquitoes (µW > µN).
109
The period of temporary immunity is taken to be half a year or 6 months [96], hence
θ = 1/(0.5× 365) day−1. As individuals with secondary infections have higher viral
loads, this leads to higher transmission rates. Therefore, the antibody-dependent enhance-
ment, φ , is set to 1.1 [42].
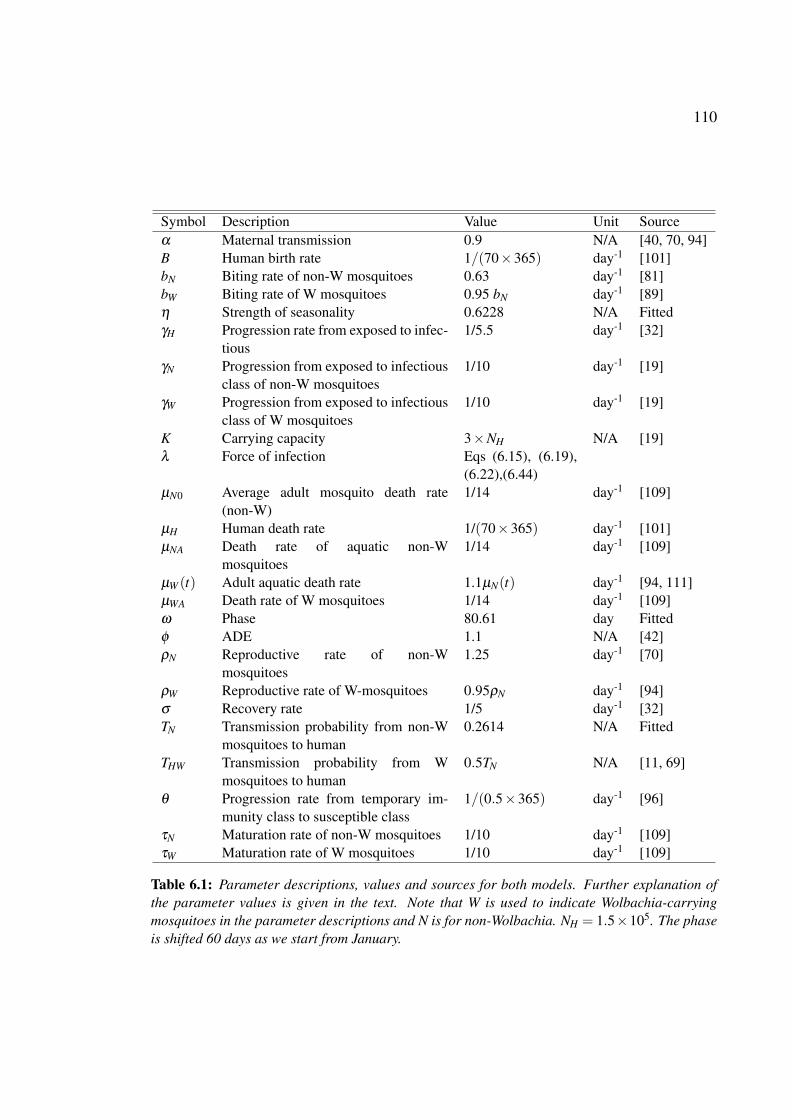
110
Symbol Description Value Unit Sourceα Maternal transmission 0.9 N/A [40, 70, 94]B Human birth rate 1/(70×365) day-1 [101]bN Biting rate of non-W mosquitoes 0.63 day-1 [81]bW Biting rate of W mosquitoes 0.95 bN day-1 [89]η Strength of seasonality 0.6228 N/A FittedγH Progression rate from exposed to infec-
tious1/5.5 day-1 [32]
γN Progression from exposed to infectiousclass of non-W mosquitoes
1/10 day-1 [19]
γW Progression from exposed to infectiousclass of W mosquitoes
1/10 day-1 [19]
K Carrying capacity 3×NH N/A [19]λ Force of infection Eqs (6.15), (6.19),
(6.22),(6.44)µN0 Average adult mosquito death rate
(non-W)1/14 day-1 [109]
µH Human death rate 1/(70×365) day-1 [101]µNA Death rate of aquatic non-W
mosquitoes1/14 day-1 [109]
µW (t) Adult aquatic death rate 1.1µN(t) day-1 [94, 111]µWA Death rate of W mosquitoes 1/14 day-1 [109]ω Phase 80.61 day Fittedφ ADE 1.1 N/A [42]ρN Reproductive rate of non-W
mosquitoes1.25 day-1 [70]
ρW Reproductive rate of W-mosquitoes 0.95ρN day-1 [94]σ Recovery rate 1/5 day-1 [32]TN Transmission probability from non-W
mosquitoes to human0.2614 N/A Fitted
THW Transmission probability from Wmosquitoes to human
0.5TN N/A [11, 69]
θ Progression rate from temporary im-munity class to susceptible class
1/(0.5×365) day-1 [96]
τN Maturation rate of non-W mosquitoes 1/10 day-1 [109]τW Maturation rate of W mosquitoes 1/10 day-1 [109]
Table 6.1: Parameter descriptions, values and sources for both models. Further explanation ofthe parameter values is given in the text. Note that W is used to indicate Wolbachia-carryingmosquitoes in the parameter descriptions and N is for non-Wolbachia. NH = 1.5×10⁵. The phaseis shifted 60 days as we start from January.
111
6.3 Summary
• Two-serotype dengue models in the absence and presence of Wolbachia-carrying
mosquitoes are developed in Sections 6.1.1 and 6.1.2, Equations (6.3)–(6.14) and
(6.24)–(6.39), respectively.
• In the absence of Wolbachia-carrying mosquitoes, individuals are infected after being
bitten by infectious non-Wolbachia mosquitoes.
• In the presence of Wolbachia-carrying mosquitoes, individuals are infected after being
bitten by infectious non-Wolbachia or Wolbachia-carrying mosquitoes.
• Antibody dependent enhancement (ADE) is included, where the ADE is represented
by φ . Antibody dependent enhancement increases infectivity of individuals with sec-
ondary infections. This can lead to more severe forms of dengue.
• The temporary immunity class is included in the model. Individuals in this class have
recovered from primary infections and have a temporary immunity to all serotypes
of dengue. They later become susceptible to the serotypes with which they have not
previously been infected.
Chapter 7
Two serotypes with symmetric epidemi-
ological characteristics ∗
In Chapters 4–5, we studied the effect of Wolbachia on dengue dynamics when a single
serotype of dengue was circulating. We considered scenarios when dengue cases were
introduced into the population once, and multiple times. In this chapter and the next, we
use the mathematical models formulated in Chapter 6 to study the effect of Wolbachia on
dengue dynamics when two serotypes of dengue are circulating, assuming first symmetric
and then asymmetric epidemiological characteristics of the serotypes. The aim of this
chapter is to investigate the effectiveness of Wolbachia in reducing dengue transmission
for two serotypes with symmetric epidemiological characteristics under different disease
introduction scenarios.
7.1 Introduction
Several mathematical models have been developed to investigate dengue dynamics in the
absence of Wolbachia-carrying mosquitoes when more than one dengue serotype circu-
∗The results of scenario one form part of the manuscript that has been submitted for publication as M.Z.Ndii, D. Allingham, R.I. Hickson, K. Glass. The effect of Wolbachia on dengue dynamics in the presence oftwo serotypes of dengue: symmetric and asymmetric epidemiological characteristics.
112
113
lates [1, 3, 12, 21, 26, 42, 50, 65, 100]. However, these models did not consider differing
disease introduction scenarios, a factor which can influence disease transmission dynam-
ics. In addition, to the best of our knowledge, no modelling studies have been conducted
to investigate the effects of Wolbachia on dengue dynamics when more than one dengue
serotype circulates under different disease introduction scenarios.
Understanding the effect of different disease introduction scenarios on Wolbachia per-
formance in reducing dengue incidence is of importance, because the exposure of the
population to different dengue serotypes may alter the disease dynamics.
In this chapter, we assume that the two circulating dengue serotypes have identical
epidemiological characteristics (the symmetric case).
7.2 Scenarios of Dengue Introduction
Deciding on an exact strategy for the introduction of dengue serotypes into the popu-
lation is a challenging task because individuals with a particular dengue serotype enter
the population at irregular intervals [53]. Furthermore, the dominant dengue serotype in
any one location varies over time. For example in Thailand, DEN3 was common during
2002–2004 and 2008–2010, whereas DEN4 was common during 2003–2008 [53].
Here we consider two disease introduction scenarios as illustrated in Figures 7.1 and
7.2. In the first scenario, individuals carrying dengue serotype 1 are introduced weekly
over a one year period, and individuals carrying another dengue serotype are introduced
weekly over an additional one year period (Figure 7.1). In the second scenario, individuals
carrying dengue serotype 1 are introduced weekly for a duration of two years, and then

114
Figure 7.1: Introduction scenario 1: Individuals with a particular dengue serotype are introducedweekly in alternate years. In this scenario, individuals carrying dengue serotype 1 are introducedweekly for one year, and then individuals carrying dengue serotype 2 are introduced weekly in thesubsequent year. Throughout this chapter, the terminology, scenario 1, or, first scenario, refers tothis disease introduction strategy. In this figure, t denotes the time in years.
Figure 7.2: Introduction scenario 2: Individuals with a particular dengue serotype are introducedweekly, where individuals infected carrying dengue serotype 1 are introduced weekly for two years,and then individuals infected carrying dengue serotypes 2 are introduced weekly for two years.Throughout this chapter, the terminology, scenario 2, or, second scenario, refers to this diseaseintroduction strategy. In this figure, t is the time in years.
individuals carrying another dengue serotype are introduced weekly over an additional
two year period (Figure 7.2). These patterns are then repeated for many years. Throughout
this chapter and in Chapter 8, serotypes 1 and 2 refer to two different dengue serotypes,
but do not specifically refer to DEN1 and DEN2.
We use simulations to investigate the effect of Wolbachia when two dengue serotypes
circulate under two disease introduction scenarios. Our simulations are conducted in the
same way as that presented in Chapter 5, Page 82, except for differences in the dengue
serotypes, depending on the disease introduction scenario. The effects of the antibody-
dependent enhancement rate (φ ) and the transmission probability (TN) on Wolbachia per-
formance in reducing dengue are examined for all scenarios.
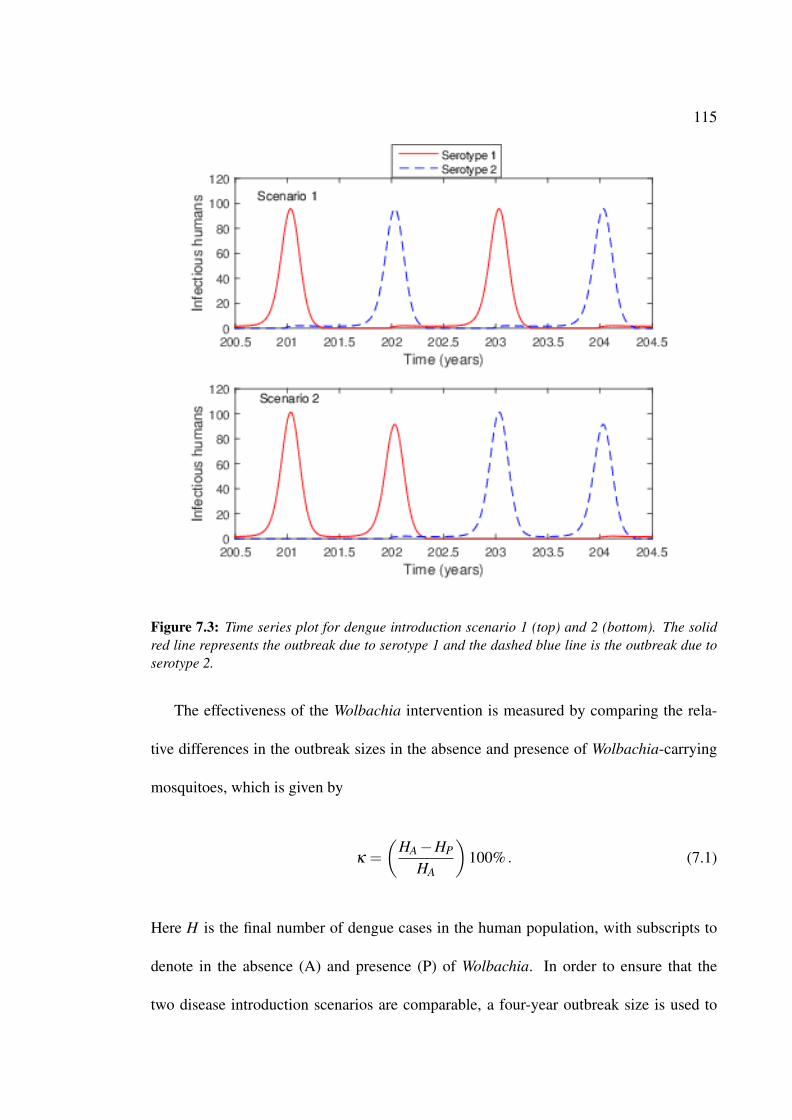
115
Figure 7.3: Time series plot for dengue introduction scenario 1 (top) and 2 (bottom). The solidred line represents the outbreak due to serotype 1 and the dashed blue line is the outbreak due toserotype 2.
The effectiveness of the Wolbachia intervention is measured by comparing the rela-
tive differences in the outbreak sizes in the absence and presence of Wolbachia-carrying
mosquitoes, which is given by
κ =
(HA−HP
HA
)100% . (7.1)
Here H is the final number of dengue cases in the human population, with subscripts to
denote in the absence (A) and presence (P) of Wolbachia. In order to ensure that the
two disease introduction scenarios are comparable, a four-year outbreak size is used to
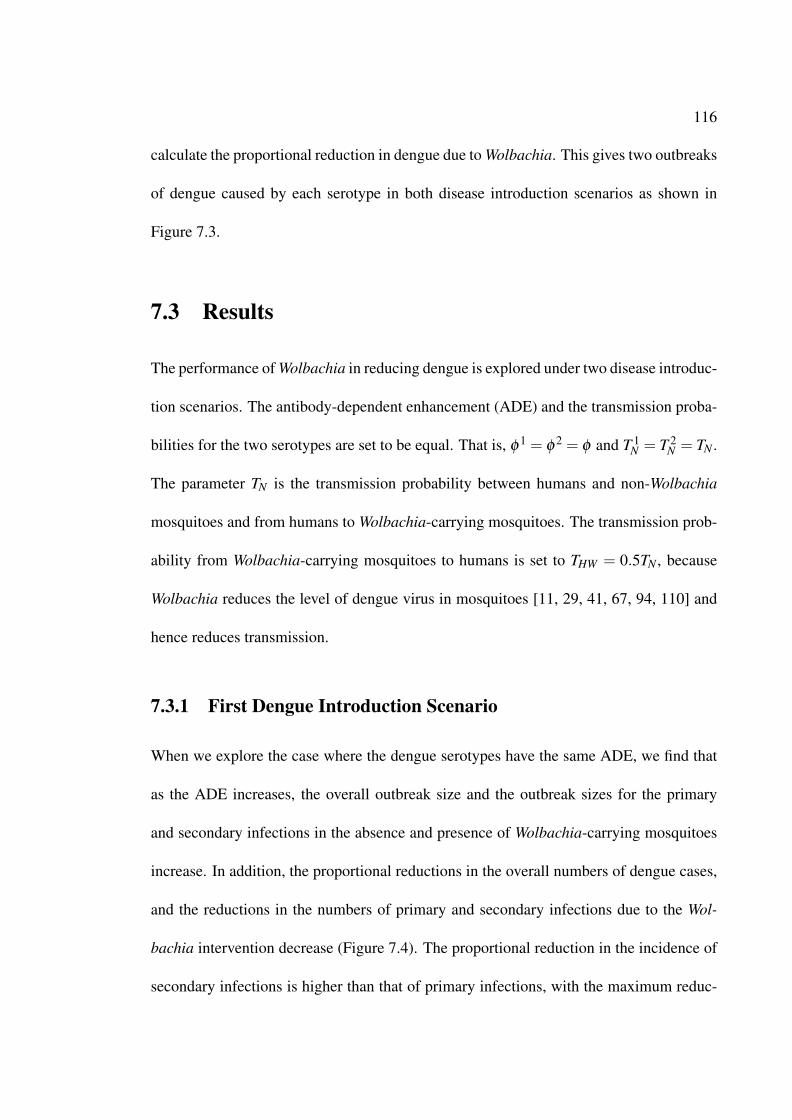
116
calculate the proportional reduction in dengue due to Wolbachia. This gives two outbreaks
of dengue caused by each serotype in both disease introduction scenarios as shown in
Figure 7.3.
7.3 Results
The performance of Wolbachia in reducing dengue is explored under two disease introduc-
tion scenarios. The antibody-dependent enhancement (ADE) and the transmission proba-
bilities for the two serotypes are set to be equal. That is, φ 1 = φ 2 = φ and T 1N = T 2
N = TN .
The parameter TN is the transmission probability between humans and non-Wolbachia
mosquitoes and from humans to Wolbachia-carrying mosquitoes. The transmission prob-
ability from Wolbachia-carrying mosquitoes to humans is set to THW = 0.5TN , because
Wolbachia reduces the level of dengue virus in mosquitoes [11, 29, 41, 67, 94, 110] and
hence reduces transmission.
7.3.1 First Dengue Introduction Scenario
When we explore the case where the dengue serotypes have the same ADE, we find that
as the ADE increases, the overall outbreak size and the outbreak sizes for the primary
and secondary infections in the absence and presence of Wolbachia-carrying mosquitoes
increase. In addition, the proportional reductions in the overall numbers of dengue cases,
and the reductions in the numbers of primary and secondary infections due to the Wol-
bachia intervention decrease (Figure 7.4). The proportional reduction in the incidence of
secondary infections is higher than that of primary infections, with the maximum reduc-
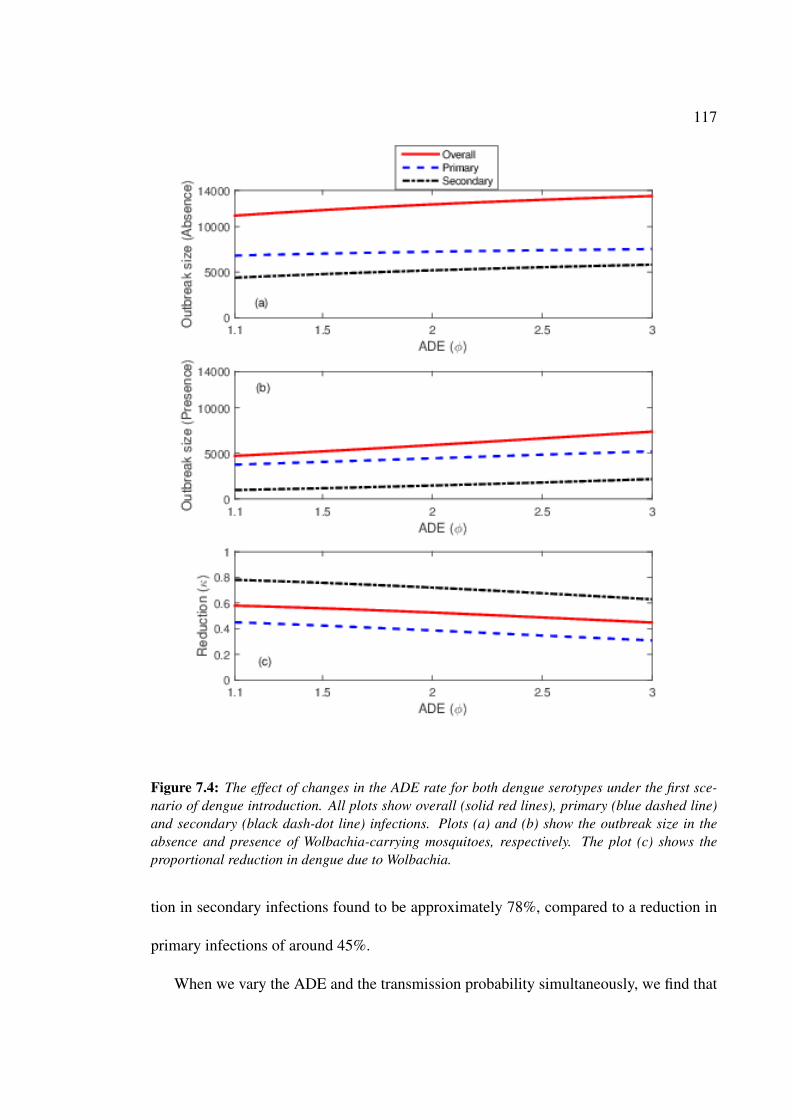
117
Figure 7.4: The effect of changes in the ADE rate for both dengue serotypes under the first sce-nario of dengue introduction. All plots show overall (solid red lines), primary (blue dashed line)and secondary (black dash-dot line) infections. Plots (a) and (b) show the outbreak size in theabsence and presence of Wolbachia-carrying mosquitoes, respectively. The plot (c) shows theproportional reduction in dengue due to Wolbachia.
tion in secondary infections found to be approximately 78%, compared to a reduction in
primary infections of around 45%.
When we vary the ADE and the transmission probability simultaneously, we find that
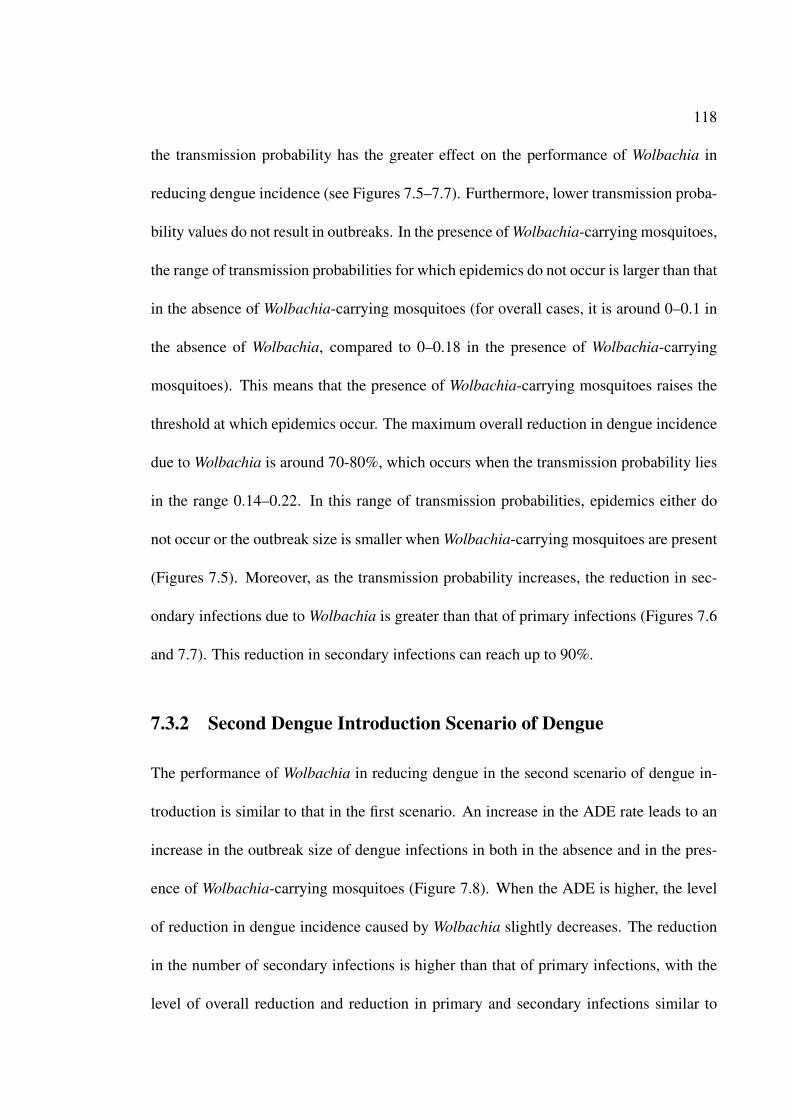
118
the transmission probability has the greater effect on the performance of Wolbachia in
reducing dengue incidence (see Figures 7.5–7.7). Furthermore, lower transmission proba-
bility values do not result in outbreaks. In the presence of Wolbachia-carrying mosquitoes,
the range of transmission probabilities for which epidemics do not occur is larger than that
in the absence of Wolbachia-carrying mosquitoes (for overall cases, it is around 0–0.1 in
the absence of Wolbachia, compared to 0–0.18 in the presence of Wolbachia-carrying
mosquitoes). This means that the presence of Wolbachia-carrying mosquitoes raises the
threshold at which epidemics occur. The maximum overall reduction in dengue incidence
due to Wolbachia is around 70-80%, which occurs when the transmission probability lies
in the range 0.14–0.22. In this range of transmission probabilities, epidemics either do
not occur or the outbreak size is smaller when Wolbachia-carrying mosquitoes are present
(Figures 7.5). Moreover, as the transmission probability increases, the reduction in sec-
ondary infections due to Wolbachia is greater than that of primary infections (Figures 7.6
and 7.7). This reduction in secondary infections can reach up to 90%.
7.3.2 Second Dengue Introduction Scenario of Dengue
The performance of Wolbachia in reducing dengue in the second scenario of dengue in-
troduction is similar to that in the first scenario. An increase in the ADE rate leads to an
increase in the outbreak size of dengue infections in both in the absence and in the pres-
ence of Wolbachia-carrying mosquitoes (Figure 7.8). When the ADE is higher, the level
of reduction in dengue incidence caused by Wolbachia slightly decreases. The reduction
in the number of secondary infections is higher than that of primary infections, with the
level of overall reduction and reduction in primary and secondary infections similar to
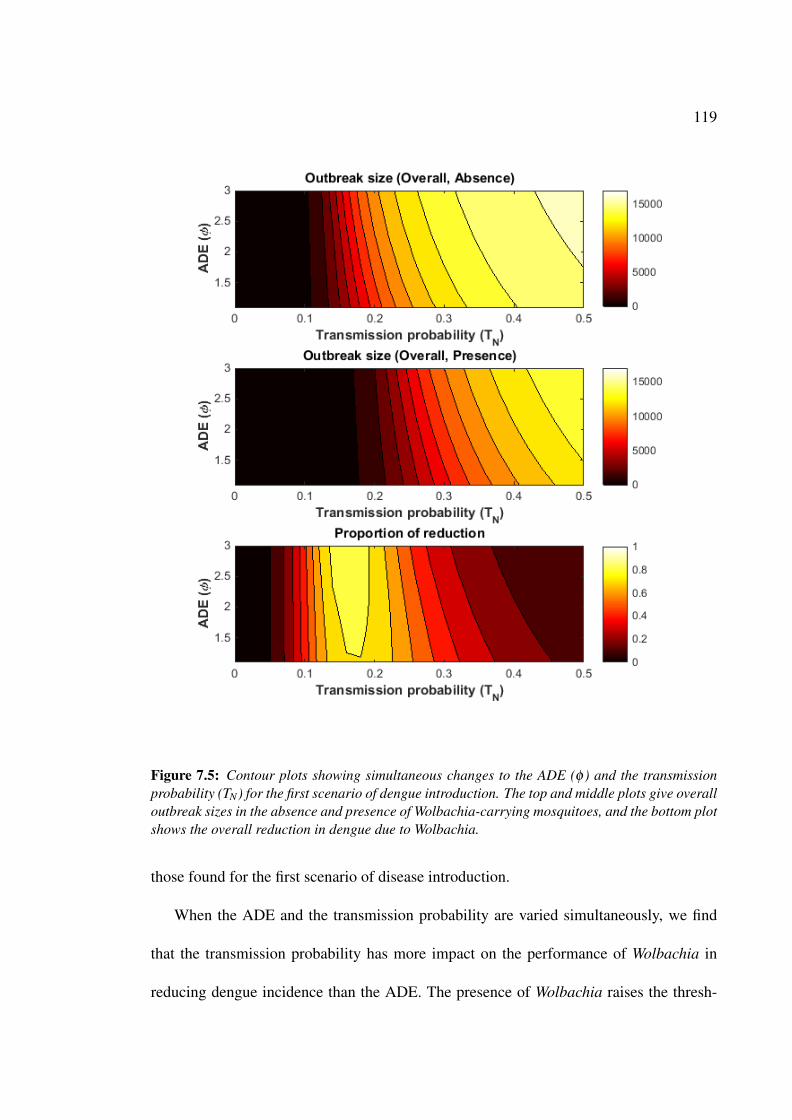
119
Figure 7.5: Contour plots showing simultaneous changes to the ADE (φ ) and the transmissionprobability (TN) for the first scenario of dengue introduction. The top and middle plots give overalloutbreak sizes in the absence and presence of Wolbachia-carrying mosquitoes, and the bottom plotshows the overall reduction in dengue due to Wolbachia.
those found for the first scenario of disease introduction.
When the ADE and the transmission probability are varied simultaneously, we find
that the transmission probability has more impact on the performance of Wolbachia in
reducing dengue incidence than the ADE. The presence of Wolbachia raises the thresh-

120
Figure 7.6: Contour plots showing simultaneous changes to the ADE rate (φ ) and the transmis-sion probability (TN) for primary infections under the first scenario of dengue introduction. Thetop and middle plots give the outbreak sizes for primary infections in the absence and presenceof Wolbachia-carrying mosquitoes, and the bottom plot shows the overall reduction in primaryinfections due to Wolbachia.
old at which epidemics occur (see Figures 7.9–7.11). The maximum overall reduction in
dengue reaches 80% for a similar range of transmission probabilities (around 0.14-0.22)
to the one found for the first disease introduction scenario (Figure 7.9). The effects of

121
Figure 7.7: Contour plots showing simultaneous changes to the ADE (φ ) and the transmissionprobability (TN) under the first scenario of dengue introduction. The top and middle plots givethe outbreak sizes for secondary infections in the absence and presence of Wolbachia-carryingmosquitoes, and the bottom plot shows the reduction in secondary infections due to Wolbachia.
ADE become stronger for higher values of the transmission probability. The proportional
reduction in secondary infections is higher than that for primary infections. The maxi-
mum reduction in primary infections is 80%, compared to more than 90% for secondary
infections.

122
Figure 7.8: The effect of changes in the ADE rate for both dengue serotypes under the secondscenario of dengue introduction. All plots show overall (solid red lines), primary (blue dashedline) and secondary (black dash-dot line) infections. Plots (a) and (b) show the outbreak sizein the absence and presence of Wolbachia-carrying mosquitoes, respectively. Plot (c) shows theproportional reduction in dengue due to Wolbachia.
7.4 Discussion and Conclusions
In this chapter, we analysed the effect of Wolbachia on dengue dynamics under different
disease introduction scenarios, when two dengue serotypes with symmetric epidemiolog-

123
Figure 7.9: Contour plots showing simultaneous changes to the ADE (φ ) and the transmissionprobability (TN) under the second scenario of dengue introduction. The top and middle plotsgive overall outbreak size in the absence and presence of Wolbachia-carrying mosquitoes, and thebottom plot shows the overall reduction in dengue due to Wolbachia.
ical characteristics are circulating. We found that the benefits of Wolbachia are similar
regardless of the disease introduction scenario. Since the time of introduction of a par-
ticular dengue serotype into the population is very uncertain, it is not easy to predict the
dominant serotype before an epidemic occurs. Predicting the dominant dengue serotype
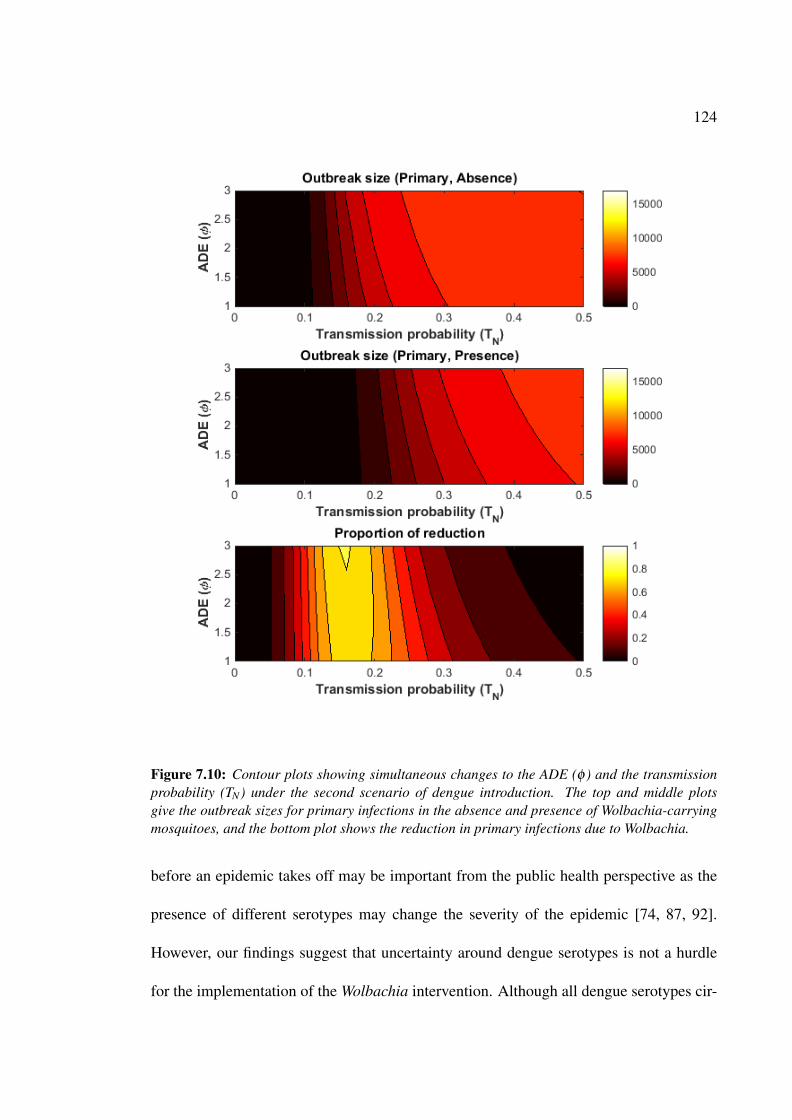
124
Figure 7.10: Contour plots showing simultaneous changes to the ADE (φ ) and the transmissionprobability (TN) under the second scenario of dengue introduction. The top and middle plotsgive the outbreak sizes for primary infections in the absence and presence of Wolbachia-carryingmosquitoes, and the bottom plot shows the reduction in primary infections due to Wolbachia.
before an epidemic takes off may be important from the public health perspective as the
presence of different serotypes may change the severity of the epidemic [74, 87, 92].
However, our findings suggest that uncertainty around dengue serotypes is not a hurdle
for the implementation of the Wolbachia intervention. Although all dengue serotypes cir-
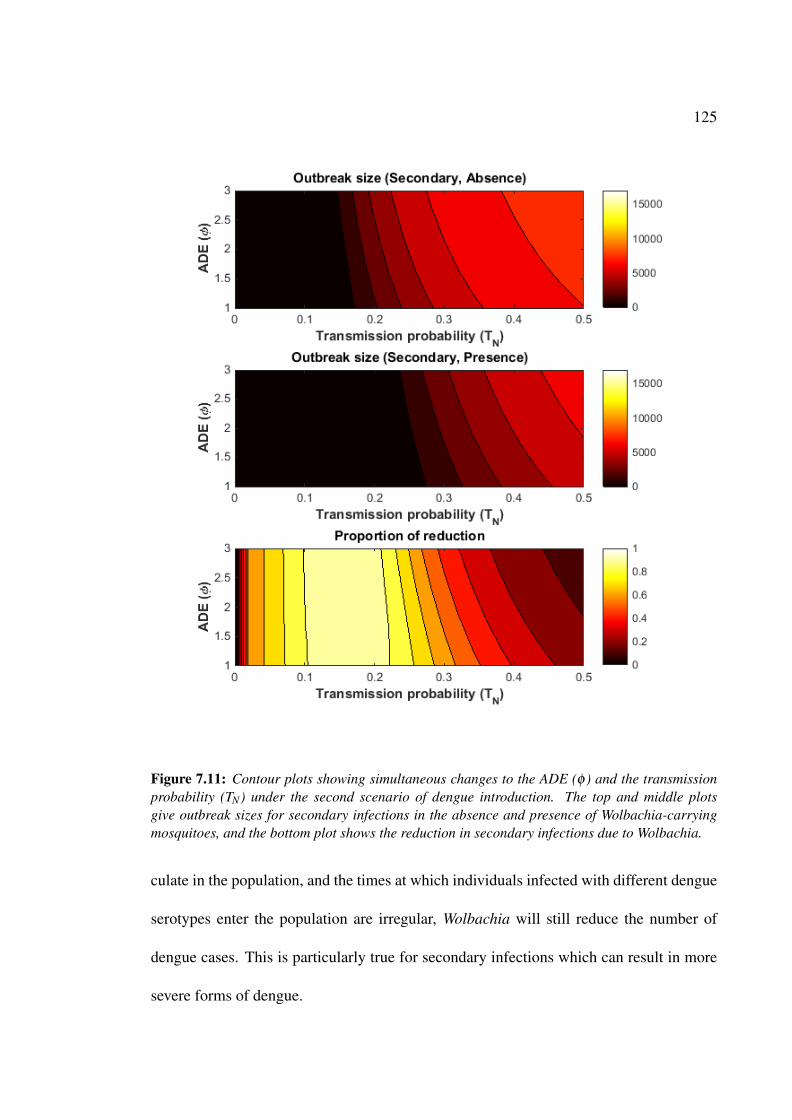
125
Figure 7.11: Contour plots showing simultaneous changes to the ADE (φ ) and the transmissionprobability (TN) under the second scenario of dengue introduction. The top and middle plotsgive outbreak sizes for secondary infections in the absence and presence of Wolbachia-carryingmosquitoes, and the bottom plot shows the reduction in secondary infections due to Wolbachia.
culate in the population, and the times at which individuals infected with different dengue
serotypes enter the population are irregular, Wolbachia will still reduce the number of
dengue cases. This is particularly true for secondary infections which can result in more
severe forms of dengue.
126
Our results for both disease introduction scenarios show that the outbreak size in-
creases as the transmission probability increases. Furthermore, we found that the ADE
does not have a noticeable impact on the effectiveness of Wolbachia unless the transmis-
sion probability is high. The maximum overall reduction in dengue cases is obtained for
transmission probabilities in the range 0.14-0.22, and a considerable reduction in sec-
ondary infections of 70-90% is achieved. However, if the transmission probability is
high, reductions in dengue incidence of only 20-40% are likely. This implies that Wol-
bachia will be most effective in reducing dengue transmission if dengue serotypes are not
strongly transmissible, a similar finding to the results of Chapter 5 for a single serotype.
As the transmission probability is one of the parameters that regulates the basic reproduc-
tion number, our results are consistent with the finding by Hughes and Britton [43] and
Ferguson et al [28] that Wolbachia will be effective if the basic reproduction number is
not too high. Our finding that differences in the ADE levels between serotypes have much
less impact on dengue dynamics than differences in the transmission probability indicates
that a better understanding of serotype-specific transmission probabilities may be needed
to optimize the delivery of the Wolbachia intervention.
In order to confirm our results, two further scenarios of dengue introductions were ex-
plored: introducing individuals carrying serotype 1 for the first six months and individuals
carrying another dengue serotype for a further six months, and introducing individuals
carrying dengue serotypes 1 and 2 at the same time. We found similar results to those
presented in this chapter.
Research has shown that the epidemiological characteristics of dengue serotypes may
be different [4, 79, 87, 92]. Although our results in this chapter, assuming symmetric
127
epidemiological characteristics, provide insights into the effectiveness of Wolbachia in
reducing human dengue incidence in the presence of more than one dengue serotype, an
analysis of asymmetric epidemiological characteristics is of importance to further our un-
derstanding of Wolbachia performance in reducing human dengue incidence. The effects
of Wolbachia on dengue transmission dynamics when the epidemiological characteristics
between serotypes differ are explored in the next chapter.
7.5 Summary
• We investigate the effect of Wolbachia in reducing dengue incidence under different
disease introduction scenarios when the antibody-dependent enhancement (ADE) and
the transmission probability of serotypes are the same.
• We found that different disease introduction scenarios do not affect the performance
of Wolbachia in reducing dengue incidence (Sections 7.3.1 and 7.3.2 ).
• The level of ADE does not have a noticeable effect on dengue transmission dynamics
(Sections 7.3.1 and 7.3.2, see Figures 7.4–7.11).
• The proportional reduction in secondary infections (up to 90%) is higher than that in
the primary infections (up to 80%; Sections 7.3.1 and 7.3.2, see Figures 7.4–7.11).
Chapter 8
Two Serotypes with Asymmetric Epidemi-
ological Characteristics∗
In the previous chapter, we studied the effect of Wolbachia on dengue transmission dy-
namics under different disease introduction scenarios when the epidemiological charac-
teristics of the serotypes were assumed to be symmetric. In this chapter, we study the
effect of Wolbachia on dengue transmission dynamics when the epidemiological charac-
teristics of the serotypes are asymmetric. That is, we explore the case where one serotype
is more transmissible or has a higher ADE than the other.
8.1 Introduction
Research has shown that the characteristics of dengue serotypes may be different [4, 27,
74, 79, 87, 92]. For example, the severity of disease varies between serotypes [92], DEN1
may result in more severe symptoms than DEN4 [74], and infections with DEN1 may
result in higher viraemia levels than infections with DEN2 [87]. These differences may
affect the performance of Wolbachia in reducing dengue transmission.
∗Results and discussions in this chapter form part of the manuscript that has been submitted for publica-tion as M.Z. Ndii, D. Allingham, R.I. Hickson, K. Glass. The effect of Wolbachia on dengue dynamics inthe presence of two serotypes of dengue: symmetric and asymmetric epidemiological characteristics.
128

129
Modelling studies have investigated the effects of asymmetric epidemiological charac-
teristics on dengue dynamics in the absence of Wolbachia-carrying mosquitoes [50, 65].
However, little has been done to investigate the effects of asymmetric epidemiological
characteristics of dengue serotypes on the performance of Wolbachia in reducing dengue
transmission. In this chapter, we use the mathematical models formulated in Chapter 6
to study the effects of Wolbachia in reducing dengue incidence when the epidemiological
characteristics of the two circulating serotypes differ, Equations (6.3)–(6.14) and Equa-
tions (6.24)–(6.39). The characteristics of interest are the antibody-dependent enhance-
ment parameter, φ , and the transmission probability, TN .
The equations from Chapter 6 describing the forces of infection for humans, non-
Wolbachia mosquitoes and Wolbachia-carrying mosquitoes are, respectively,
λiH =
bNT iNIi
NNH
+bW T i
HW IiW
NH, (8.1)
λiN =
bNT iNIi
HNH
+φ ibNT i
NIi jH
NH, (8.2)
λiW =
bW T iNIi
HNH
+φ ibW T i
NIi jH
NH. (8.3)
Here T iN is the transmission probability of serotype i between humans and non-Wolbachia
mosquitoes, and from humans to Wolbachia-carrying mosquitoes. The parameter φ i is the
ADE for serotype i, and the parameters bN and bW are the biting rates of non-Wolbachia
and Wolbachia-carrying mosquitoes, respectively. The parameter T iHW is the transmission
130
probability from Wolbachia-carrying mosquitoes with serotype i to humans, and it is set
to T iHW = 0.5T i
N . In our investigations, the ADE and the transmission probability for
serotype 2 are set to be higher than those for serotype 1 as follows:
φ2 = φ
1 + εφ ,
T 2N = T 1
N + εT .
(8.4)
Here φ 1 = 1.1 [42] and T 1N = 0.2614 [69]. The parameter εφ varies between 0 and 1.9
(0 ≤ εφ ≤ 1.9) and the parameter εT varies between 0 and 0.2387 (0 ≤ εT ≤ 0.2387).
Thus 1.1 ≤ φ 2 ≤ 3 and 0.2614 ≤ T 2N ≤ 0.5, which are reasonable ranges for ADE and
the transmission probability [6, 42]. Therefore, the force of infection for humans, non-
Wolbachia mosquitoes and Wolbachia-carrying mosquitoes of serotype 2 is higher than
that of serotype 1:
λ2H ≥ λ
1H , λ
2N ≥ λ
1N and λ
2W ≥ λ
1W .
Since, as we discovered in Chapter 7, disease introduction scenarios do not appear
to influence the performance of Wolbachia in reducing dengue transmission, only one
disease introduction scenario is used in this analysis. That is, each dengue serotype is
introduced weekly in alternate years. Although the strategy of dengue introductions is
different, the total outbreak sizes caused by different serotypes were similar for both sce-
narios. This means that although λ is different, the outbreak size caused by each dengue
serotype would be similar for different scenarios of dengue introductions. Therefore, in
this analysis, we use the scenario where each dengue serotype is introduced weekly in
131
alternate years.
The outbreak size over two years is used to quantify the proportional reduction in
dengue incidence due to Wolbachia as it includes the sizes of the outbreaks caused by
both serotypes. The four-year outbreak size used in the preceding chapter is unnecessary
here because we are not comparing the performance of Wolbachia in reducing dengue
under different disease introduction scenarios. The simulation procedures used here are
the same as those used in the previous chapters (Chapters 5 and 7).
8.2 Results
In this section, the results of simulations exploring the effects of asymmetry in the antibody-
dependent enhancement (ADE) (Section 8.2.1) and the transmission probabilities (Sec-
tion 8.2.2) on Wolbachia performance in reducing dengue incidence are presented. A
discussion and conclusion appears in Section 8.3.
8.2.1 Effect of Asymmetric Antibody-Dependent Enhancement
In our simulations for this section, the ADE for serotype 2 is varied and that of serotype 1
is fixed.
When the dengue serotypes have different ADE, an increase in the ADE for serotype 2
leads to slight increases in the overall outbreak size and the outbreak size due to primary
and secondary infections in the absence and presence of Wolbachia-carrying mosquitoes.
The proportional reduction in dengue incidence caused by Wolbachia also decreases (Fig-
ure 8.1). The proportional reduction in secondary infections (73–78%) is higher than
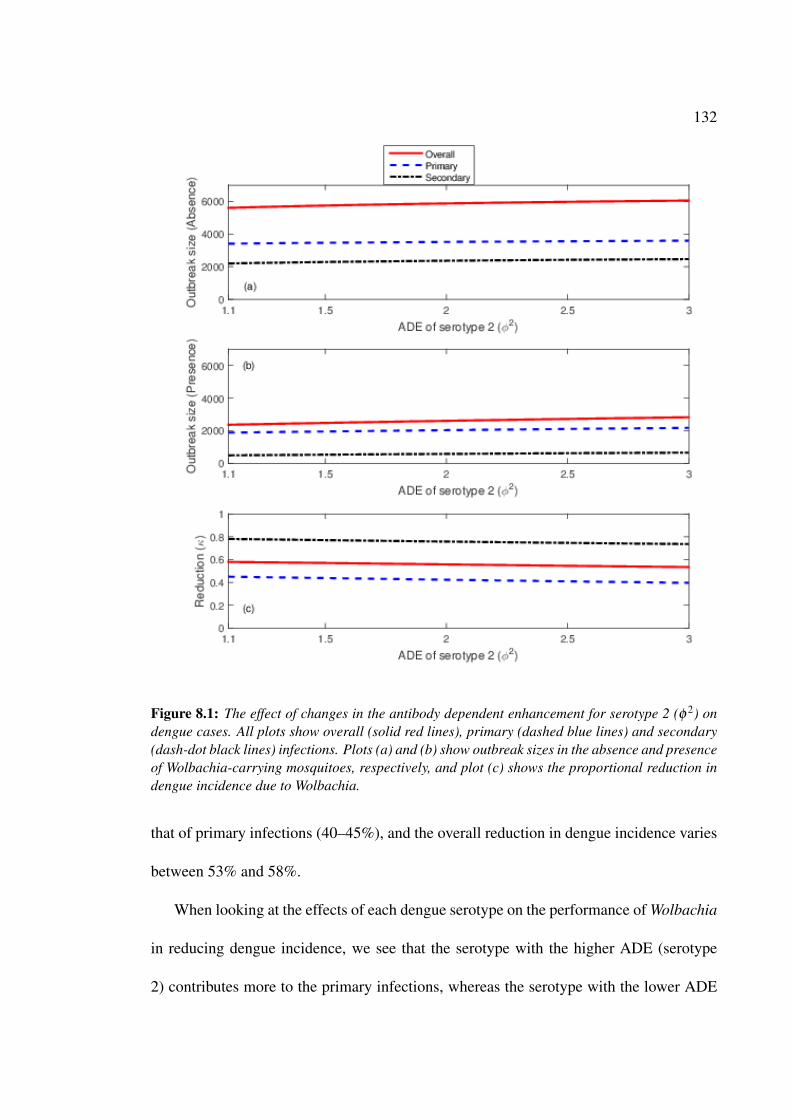
132
Figure 8.1: The effect of changes in the antibody dependent enhancement for serotype 2 (φ 2) ondengue cases. All plots show overall (solid red lines), primary (dashed blue lines) and secondary(dash-dot black lines) infections. Plots (a) and (b) show outbreak sizes in the absence and presenceof Wolbachia-carrying mosquitoes, respectively, and plot (c) shows the proportional reduction indengue incidence due to Wolbachia.
that of primary infections (40–45%), and the overall reduction in dengue incidence varies
between 53% and 58%.
When looking at the effects of each dengue serotype on the performance of Wolbachia
in reducing dengue incidence, we see that the serotype with the higher ADE (serotype
2) contributes more to the primary infections, whereas the serotype with the lower ADE
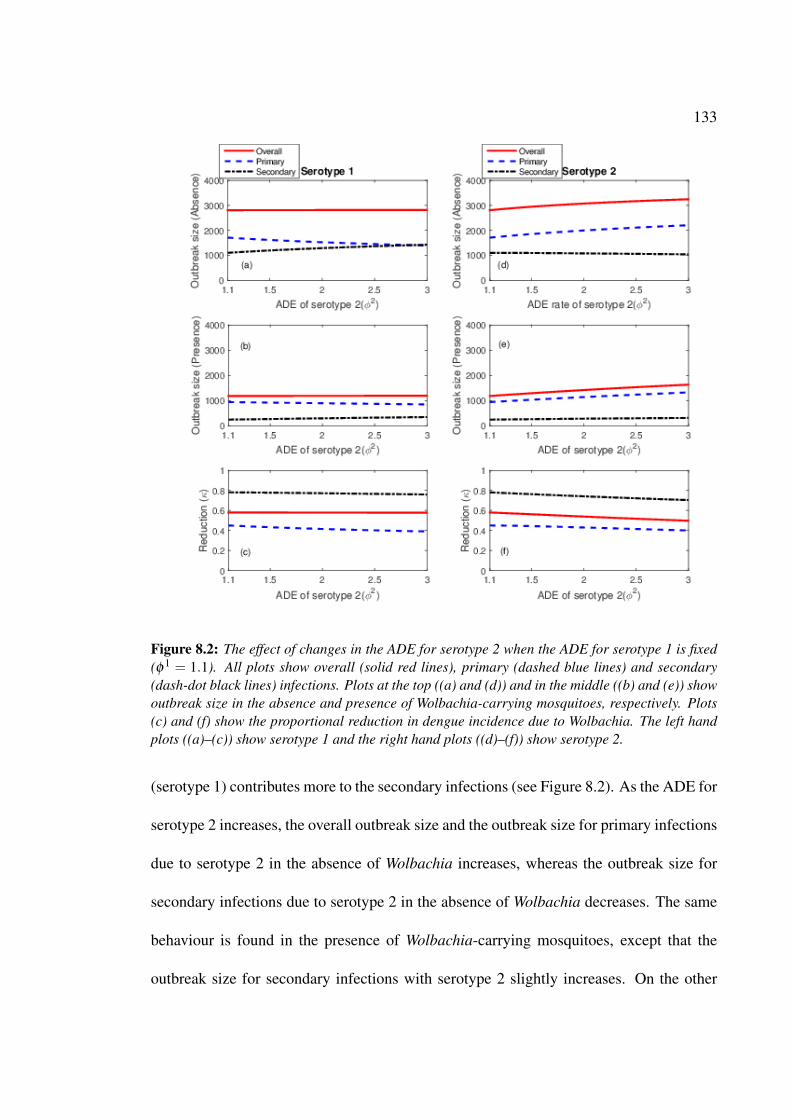
133
Figure 8.2: The effect of changes in the ADE for serotype 2 when the ADE for serotype 1 is fixed(φ 1 = 1.1). All plots show overall (solid red lines), primary (dashed blue lines) and secondary(dash-dot black lines) infections. Plots at the top ((a) and (d)) and in the middle ((b) and (e)) showoutbreak size in the absence and presence of Wolbachia-carrying mosquitoes, respectively. Plots(c) and (f) show the proportional reduction in dengue incidence due to Wolbachia. The left handplots ((a)–(c)) show serotype 1 and the right hand plots ((d)–(f)) show serotype 2.
(serotype 1) contributes more to the secondary infections (see Figure 8.2). As the ADE for
serotype 2 increases, the overall outbreak size and the outbreak size for primary infections
due to serotype 2 in the absence of Wolbachia increases, whereas the outbreak size for
secondary infections due to serotype 2 in the absence of Wolbachia decreases. The same
behaviour is found in the presence of Wolbachia-carrying mosquitoes, except that the
outbreak size for secondary infections with serotype 2 slightly increases. On the other
134
hand, as the ADE for serotype 2 increases, the overall outbreak size for serotype 1 in the
absence of Wolbachia-carrying mosquitoes remains constant because the decrease in the
number of primary infections is offset by the slight increase in the number of secondary
infections. Similar behaviour is found in the presence of Wolbachia-carrying mosquitoes.
Moreover, as the ADE for serotype 2 increases, the performance of Wolbachia in reducing
the number of dengue cases due to serotype 2 decreases, though the reduction in the
secondary infections (70–78%) is higher than that in the primary infections (40–45%).
The performance of Wolbachia in reducing dengue infections due to serotype 1 is similar
to its performance against infections caused by serotype 2.
8.2.2 Effect of Asymmetric Transmission Probabilities
If the transmission probability of serotype 2 is higher than that of serotype 1, the overall
outbreak size and the outbreak sizes for primary and secondary infections in the absence
and presence of Wolbachia-carrying mosquitoes increases, and the proportional reduction
in overall, primary and secondary cases due to Wolbachia decreases (see Figure 8.3).
The overall reduction varies between 31% and 58%, and the reduction in primary and
secondary infections decreases from 45% to 13% and 78% to 60%, respectively.
A strong effect on the Wolbachia performance in reducing dengue caused by differ-
ences in the transmission probabilities between dengue serotypes is observed (Figure 8.4).
Generally, the more transmissible serotype (serotype 2) will dominate the primary infec-
tions, while the less transmissible serotype (serotype 1) will dominate the secondary in-
fections. The overall outbreak size of dengue caused by serotype 1 remains constant as
the decrease in the number of primary infections is balanced by the increase in the number
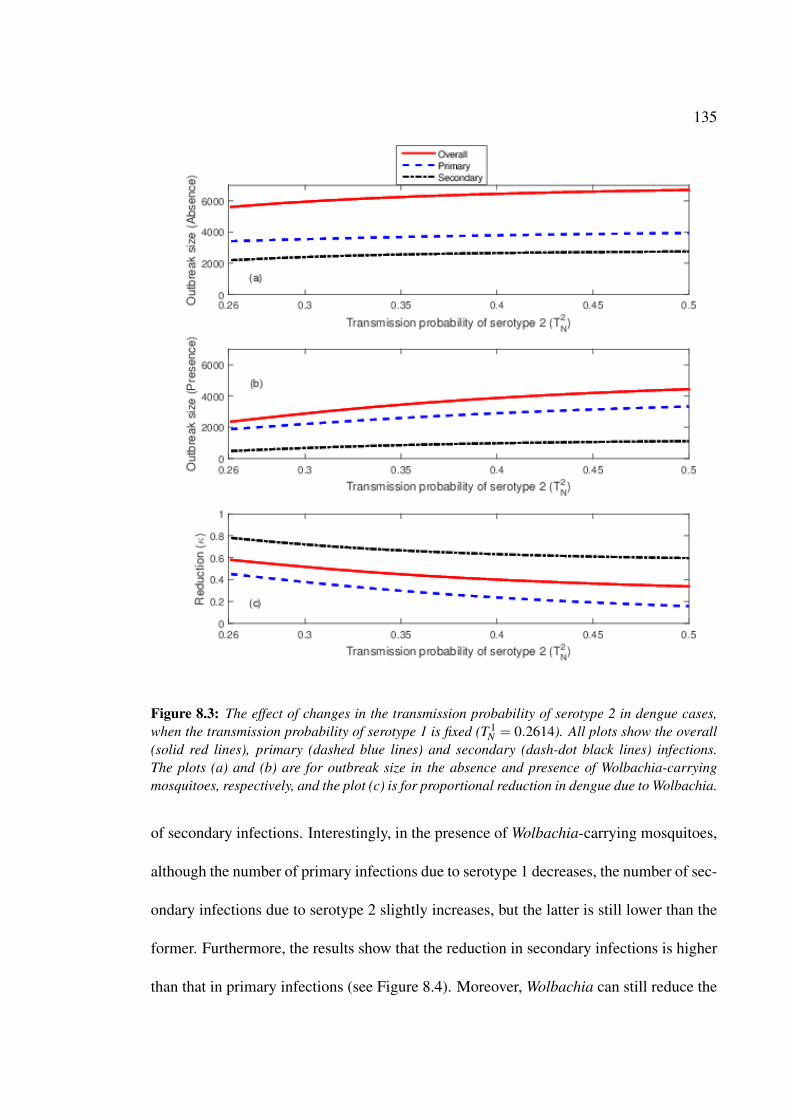
135
Figure 8.3: The effect of changes in the transmission probability of serotype 2 in dengue cases,when the transmission probability of serotype 1 is fixed (T 1
N = 0.2614). All plots show the overall(solid red lines), primary (dashed blue lines) and secondary (dash-dot black lines) infections.The plots (a) and (b) are for outbreak size in the absence and presence of Wolbachia-carryingmosquitoes, respectively, and the plot (c) is for proportional reduction in dengue due to Wolbachia.
of secondary infections. Interestingly, in the presence of Wolbachia-carrying mosquitoes,
although the number of primary infections due to serotype 1 decreases, the number of sec-
ondary infections due to serotype 2 slightly increases, but the latter is still lower than the
former. Furthermore, the results show that the reduction in secondary infections is higher
than that in primary infections (see Figure 8.4). Moreover, Wolbachia can still reduce the

136
Figure 8.4: The effect of changes in the transmission probability of serotype 2 while the transmis-sion probability of serotype 1 is fixed. All plots show the overall (solid red lines), primary (dashedblue lines) and secondary (dash-dot black lines) infections. The plots at the top ((a) and (d)) and inthe middle ((b) and (e)) show the outbreak size in the absence and presence of Wolbachia-carryingmosquitoes, respectively, and the plots at the bottom ((c) and (f)) show the proportional reductionin dengue incidence due to Wolbachia, with the left hand plots ((a)–(c) showing serotype 1 and theright hand plots ((d)–(f)) showing serotype 2.
number of dengue cases caused by the more transmissible serotype (serotype 2).
137
8.3 Discussion and Conclusions
In this chapter, we investigated the effect of asymmetric epidemiological characteristics on
the performance of Wolbachia in reducing dengue incidence. Although ADE influences
the performance of Wolbachia in reducing dengue incidence, the transmission probability
is still the most influential parameter. The results are consistent with our previous findings
for dengue serotypes with symmetric epidemiological characteristics. In the simulations
conducted for this chapter, the reduction in secondary dengue infections due to Wolbachia
is higher than that for primary infections.
As the ADE of serotype 2 is varied, the overall outbreak sizes in the absence and
presence of Wolbachia-carrying mosquitoes increases. Furthermore, the reduction in pri-
mary and secondary infections due to Wolbachia declines slightly as the ADE of serotype
2 (φ 2) increases. This implies that ADE does not have a large impact on the performance
of Wolbachia in reducing dengue. When looking at the effect on individual serotypes,
as the ADE of serotype 2 increases, the outbreak sizes of serotype 2 primary infections
increase and the incidence of serotype 1 primary infections decreases. Serotype 2 con-
tributes more to primary infections than serotype 1 as the ADE of serotype 2 increases.
Because more individual humans are primarily infected by serotype 2, secondary infec-
tions are dominated by serotype 1. If there are two serotypes circulating in the population
and more individuals have primary infections with one of the serotypes, then it is likely
that more individuals have secondary infections with the other serotype.
Interestingly, we find that although the number of primary infections due to serotype 1
decreases in the presence of Wolbachia-carrying mosquitoes, the number of secondary
138
infections caused by serotype 2 increases slightly. However, the number of secondary in-
fections caused by serotype 2 is still lower than the number of primary infections caused
by serotype 1. This may be for the following reasons. As the ADE of serotype 2 in-
creases, there are more individuals primarily infected with serotype 2 than serotype 1.
The higher number of primary infections with serotype 2 affects the force of infection,
resulting in a greater likelihood of secondary infection with serotype 2 for individuals
previously infected with serotype 1. Hence, as the ADE for serotype 2 increases, the
number of secondary infections caused by serotype 2 increases. This implies that there
is a complex interaction between variables regulating the force of infections. Note that
similar behaviour is also found when varying the transmission probability of serotype 2.
A strong effect on the performance of Wolbachia in reducing dengue transmission
is found when the transmission probability of one of the serotypes is greatly different
from the transmission probability of the other. When the transmission probability of one
serotype is higher than that of the other serotype, the number of primary infections caused
by that serotype (the serotype with higher transmission probability (T 2N )) is increased and
secondary infections are more likely to be caused by the other serotype (the serotype
with the lower transmission probability (T 1N )). This is biologically realistic because when
T 2N > T 1
N , more individuals are primarily infected with serotype 2 and thus they are more
likely to be secondarily infected with serotype 1. Furthermore, Wolbachia will be less
effective in in reducing the overall number of dengue cases caused by the more transmis-
sible serotype. Although asymmetry in the transmission probabilities can lead to a higher
number of secondary infections due to the less transmissible serotype, this incidence can
be reduced by up to 78% with the implementation of the Wolbachia intervention.

139
Our findings suggest that if the more transmissible serotype is responsible for more
severe illness, then reducing the incidence of primary infections may be of concern. This
is because the more transmissible serotype will cause more primary infections. Although
secondary infections can lead to more severe forms of dengue, paying attention to primary
infections is also important given that the level of reduction in dengue primary infections
due to the Wolbachia intervention is not as great as the reduction in secondary infections.
Furthermore, our finding that differences in antibody-dependent enhancement rates be-
tween serotypes have a much smaller effect on dengue dynamics than differences in the
transmission probabilities indicates that a better understanding of serotype-specific trans-
mission probabilities may be needed in order to develop strategies to optimize the delivery
of Wolbachia interventions.
Further investigation of the variables that regulate the force of infections is needed
to advance our understanding of Wolbachia performance in reducing dengue incidence.
A further exploration of serotype-specific effects on the performance of Wolbachia in
reducing dengue incidence is one possible avenue for future exploration. Ferguson et
al. [28] estimated the basic reproduction numbers for the four dengue serotypes. If the
data becomes available, one could find similar estimates for the parameters that govern the
force of infection or the basic reproduction number. Our theoretical explorations provide
insights into the performance of Wolbachia when two dengue serotypes circulate in the
population, and, in particular, when the epidemiological characteristics between serotypes
differ. The results are consistent with our findings for a single serotype presented in part
1 of this thesis. It may be of future interest to explore Wolbachia performance when more
than two dengue serotypes circulate.

140
8.4 Summary
• We investigate the performance of Wolbachia in reducing dengue incidence when the
level of antibody-dependent enhancement (ADE) and the transmission probability of
dengue serotypes are different (Sections 8.2.1 and 8.2.2).
• When a dengue serotype has higher ADE or transmission probability, that serotype
will contribute more to primary infections, whereas the other serotype will contribute
more to secondary infections (Sections 8.2.1 and 8.2.2, see Figures 8.2 and 8.4).
• The proportional reduction in secondary infections is higher than that in primary in-
fections when one serotype is more transmissible that the other serotype (around 60–
78% compared to around 13–45%; see Section 8.2.2) or has higher ADE than the
other serotype (73–78% compared to 40–45%; see Section 8.2.1) .
Chapter 9
Conclusions and Future Directions
The central question addressed by this thesis is “to what extent can Wolbachia reduce
dengue transmission?”. We have approached this question by formulating novel mathe-
matical models for populations in which one and two dengue serotypes circulate in the
absence and presence of Wolbachia-carrying mosquitoes. The details of these mathe-
matical models are given in Chapter 3 (single serotype dengue models) and Chapter 6
(two-serotype dengue models). As discussed in Section 1.2, the aims of this thesis are to
1. Determine the level of reduction in dengue incidence caused by the presence of Wol-
bachia-carrying mosquitoes.
2. Explore the effects of seasonality and other important parameters on dengue trans-
mission dynamics and the persistence of Wolbachia-carrying mosquitoes.
3. Determine the effects of dengue introduction scenarios on the performance of Wol-
bachia in reducing dengue incidence.
4. Investigate the effects of two dengue serotypes and dengue serotype characteristics
on the performance of Wolbachia in reducing dengue incidence.
Our original results, presented in Chapters 3–8, fulfil the aims of this thesis as listed
above. Aim 1 is satisfied in Chapters 4, 5, 7 and 8. Aim 2 is satisfied in Chapter 4. Aim 3
141

142
is satisfied in Chapters 5 and 7, while Aim 4 is satisfied in Chapters 7–8. A summary of
the original results contained in this thesis is given below in Section 9.1.
9.1 Summary of the Results
The original findings discovered in this thesis can be grouped into two parts: results which
consider the circulation of a single dengue serotype and results which consider the circu-
lation of two dengue serotypes.
Part 1 of this thesis (Chapters 3-5), is concerned with the development of novel mathe-
matical models for dengue transmission dynamics where it is assumed that a single dengue
serotype is circulating in the population. Separate models are developed to consider both
the absence and presence of Wolbachia-carrying mosquitoes. These models are then used
to analyse the effects of Wolbachia on dengue transmission dynamics when dengue cases
are introduced once and multiple times.
When dengue cases are introduced into the population once, and Wolbachia-carrying
mosquitoes persist, a reduction in dengue incidence of up to 90% can be obtained. Fur-
thermore, the choice of Wolbachia strain for inoculation of the mosquitoes has a signif-
icant effect on the ability for Wolbachia-carrying mosquitoes to persist in competition
with non-Wolbachia mosquitoes. The WMel strain, which reduces the lifespan of the
mosquito by at most 10%, allows the Wolbachia-carrying mosquitoes to persist, whereas
the WMelPop strain is unlikely to allow persistence since it reduces the mosquito lifespan
by up to 50%.
Cytoplasmic incompatibility, when considered in isolation from all other physiolog-

143
ical effects of Wolbachia on the mosquitoes, was found to reduce the number of human
dengue cases. When exploring the key parameters for our models, we found the range
of the ratios of reproductive and death rates for adult non-Wolbachia mosquitoes which
allowed Wolbachia-carrying mosquitoes to persist. Furthermore, the transmission prob-
ability, the biting rate and the average death rate were found to be the most influential
parameters, the latter having a negative relationship with the cumulative number of infec-
tious individuals. The results for the basic reproduction number, R0, show that Wolbachia
reduces the number of days for which R0 > 1.
When investigating multiple introductions of dengue cases into the population, we
simulated weekly introductions of dengue cases into the population throughout the year
and over three month periods. We found that Wolbachia reduces the potential length
of the season in which epidemics are likely to occur by up to six weeks, depending on
the strength of seasonality. The largest reduction in dengue incidence found was around
80%, which is obtained when the strength of the seasonal forcing is low. The efficacy
of Wolbachia also depends on the transmission rate, with the bacteria most effective in
reducing dengue incidence at moderate transmission rates ranging from 0.08–0.12. This
is consistent with fitted estimates for Cairns, Australia as given in Chapter 4.
In part 2 of the thesis (Chapters 6–8), the performance of Wolbachia in reducing
dengue incidence when two serotypes of dengue circulate in the population is investi-
gated.
When considering the case where epidemiological characteristics of these serotypes
are the same (the ‘symmetric case’), we found that varying the disease introduction sce-
nario does not affect dengue transmission dynamics. Although the timing of dengue intro-
144
ductions is irregular and is not easy to investigate, the results for the disease introduction
scenarios that we simulated suggest that the Wolbachia intervention can be implemented,
regardless of the disease introduction scenario. Furthermore, the antibody-dependent en-
hancement rate does not noticeably affect the impact of Wolbachia on dengue incidence
unless the transmission probability is high. A considerable reduction in secondary infec-
tions of 60-80% is achieved through the Wolbachia intervention.
When the epidemiological characteristics of the dengue serotypes differ, there is a
shift towards greater numbers of primary infections of the serotype with the higher en-
hancement rate or higher transmission probability. Where only the antibody-dependent
enhancement rate differs between serotypes, we find relatively little decline in the effec-
tiveness of Wolbachia. However, if one serotype is more transmissible than the other,
Wolbachia is less effective in reducing dengue cases caused by the more transmissible
serotype. Although the number of secondary infections caused by the less transmissible
serotype is higher, a reduction of around 78% in the number of secondary infections can
be obtained by the implementation of the Wolbachia intervention.
9.2 Conclusions
In this thesis we sought to answer the question: “to what extent can Wolbachia reduce
dengue transmission?”.
We found that once mosquitoes carrying the Wolbachia bacterium persist, a reduction
in dengue incidence of up to 80% can be obtained in the presence of one or two circulating
dengue serotypes. A higher reduction in the incidence of secondary infections can be ob-
145
tained regardless of the epidemiological characteristics of the serotypes. Different disease
introduction scenarios and levels of antibody-dependent enhancement in secondary cases
do not affect the performance of Wolbachia in reducing dengue incidence. By contrast,
differences in the transmission probabilities of the serotypes have a much greater effect. If
the transmission probability is high, Wolbachia can reduce the number of dengue cases by
only around 20%-40%. Where serotypes have different epidemiological characteristics,
the more transmissible serotype will dominate primary infections, and the less transmis-
sible serotype will dominate secondary infections.
Our findings suggest that Wolbachia should reduce the number of primary dengue
cases in areas with moderate transmission levels, and cause even greater reductions in
the incidence of secondary cases. Given the higher risk of severe outcomes in secondary
cases, Wolbachia has great potential for improving public health.
9.3 Future Directions
The work contained in this thesis makes a significant contribution to the current knowl-
edge of dengue transmission dynamics and provides evidence of the effectiveness of the
Wolbachia intervention in reducing dengue transmission. To advance our understanding
of the performance of Wolbachia in reducing dengue incidence, several possible directions
are open for study. These may utilise our work as a baseline.
1. In this thesis, deterministic mathematical models are formulated, which are appro-
priate for large population sizes. A stochastic approach could be used to further
our understanding of the impact of small infected population sizes on dengue dy-
146
namics in the presence of Wolbachia-carrying mosquitoes. Alternatively, a hybrid
modelling approach, coupling deterministic and stochastic models could be used. In
such an approach, a stochastic model would be used when the infected population
becomes small, and a deterministic model when the infected population exceeds a
certain threshold value.
2. We found that the biting rate is one of the important parameters that regulates the
transmission dynamics of dengue. In this thesis, the biting rate is assumed to be fixed.
To further our understanding of the effect of the biting rate on dengue transmission
dynamics in the presence of Wolbachia-carrying mosquitoes, it may be of interest
to explore variations in the biting rate of mosquitoes. Such variations could occur as
mosquitoes get older and may have an impact on regulating the transmission dynamics
of dengue.
3. It may be of interest to explore the effect of feminisation of the population of Wol-
bachia-carrying mosquitoes on the performance of Wolbachia in reducing dengue
transmission. The release of more males than females seems to have an effect on the
mosquito population dynamics [35, 113], and, hence, on dengue transmission dynam-
ics.
4. We define an “instantaneous basic reproduction number” using a formula for au-
tonomous systems and replace the equilibrium mosquito population with a time-
varying mosquito population. It may be interesting to derive the basic reproduction
number for the full seasonally-dependent model, or use the concept proposed by Ba-
caer [8] to investigate the epidemic threshold.
147
5. A different approach such as metapopulation modelling or integro-differential equa-
tions may be used to investigate the effects of human movements on dengue transmis-
sion dynamics.
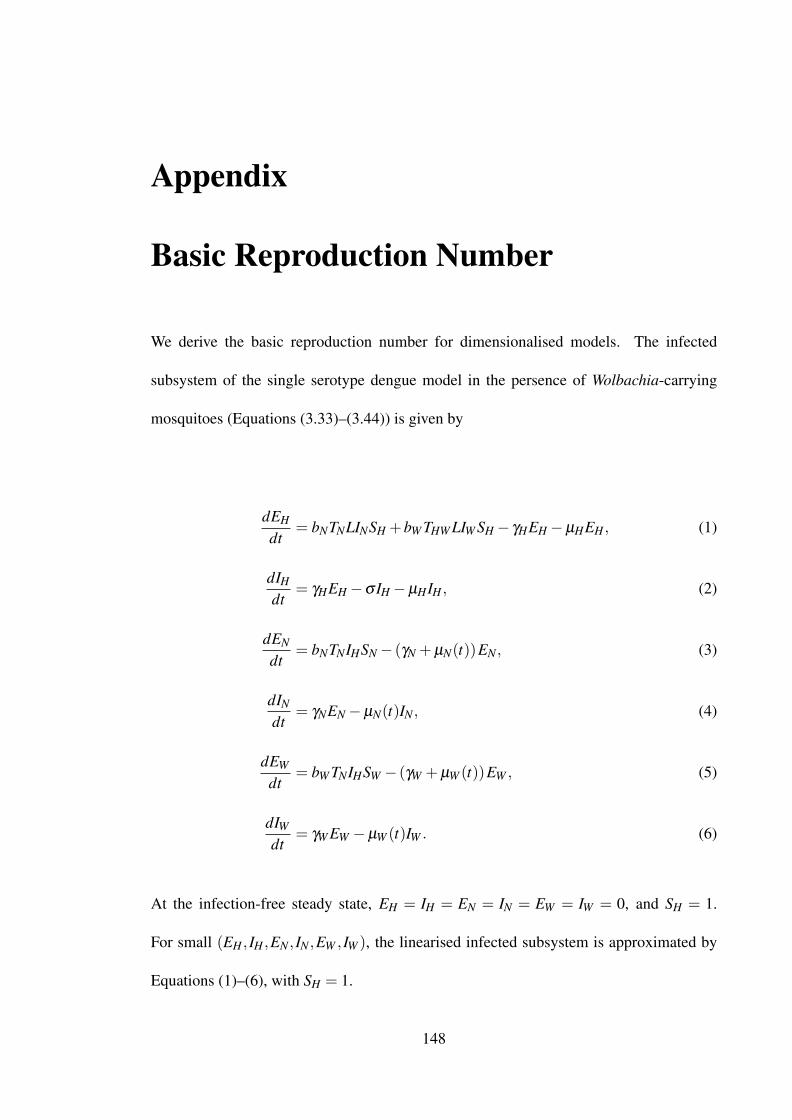
Appendix
Basic Reproduction Number
We derive the basic reproduction number for dimensionalised models. The infected
subsystem of the single serotype dengue model in the persence of Wolbachia-carrying
mosquitoes (Equations (3.33)–(3.44)) is given by
dEH
dt= bNTNLINSH +bW THW LIW SH− γHEH−µHEH , (1)
dIH
dt= γHEH−σ IH−µHIH , (2)
dEN
dt= bNTNIHSN− (γN +µN(t))EN , (3)
dIN
dt= γNEN−µN(t)IN , (4)
dEW
dt= bW TNIHSW − (γW +µW (t))EW , (5)
dIWdt
= γW EW −µW (t)IW . (6)
At the infection-free steady state, EH = IH = EN = IN = EW = IW = 0, and SH = 1.
For small (EH , IH ,EN , IN ,EW , IW ), the linearised infected subsystem is approximated by
Equations (1)–(6), with SH = 1.
148
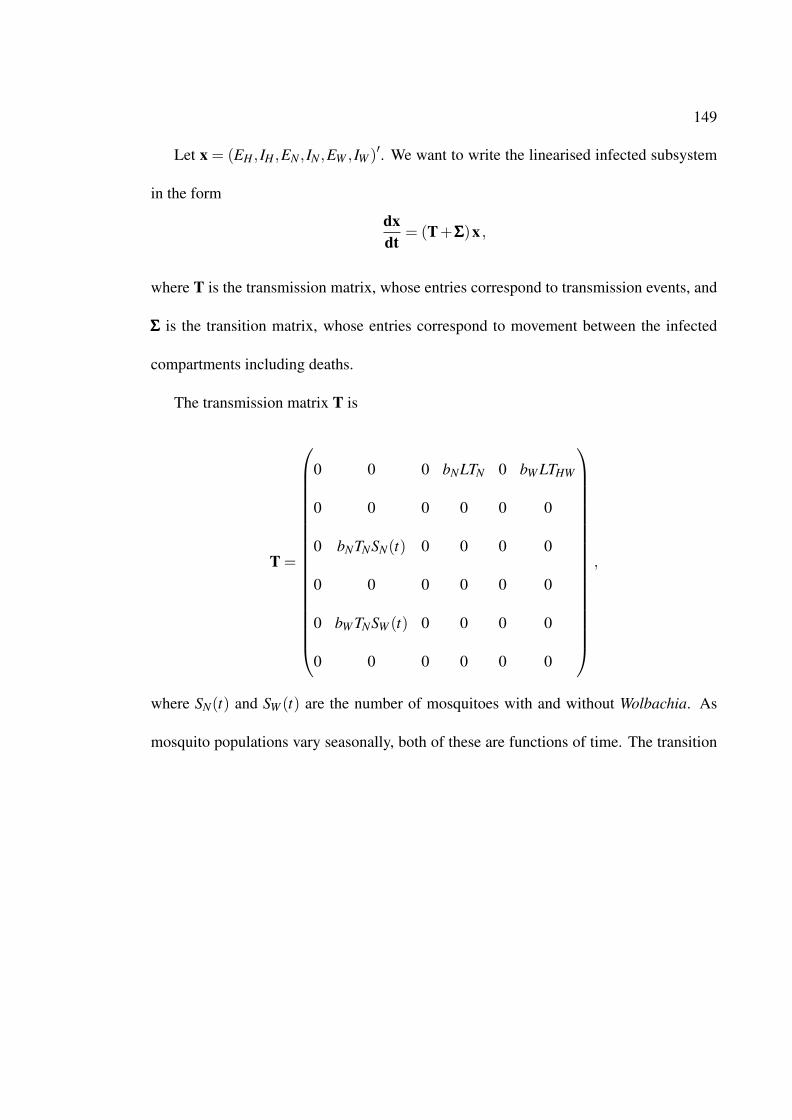
149
Let x = (EH , IH ,EN , IN ,EW , IW )′. We want to write the linearised infected subsystem
in the form
dxdt
= (T+ΣΣΣ)x ,
where T is the transmission matrix, whose entries correspond to transmission events, and
ΣΣΣ is the transition matrix, whose entries correspond to movement between the infected
compartments including deaths.
The transmission matrix T is
T =
0 0 0 bNLTN 0 bW LTHW
0 0 0 0 0 0
0 bNTNSN(t) 0 0 0 0
0 0 0 0 0 0
0 bW TNSW (t) 0 0 0 0
0 0 0 0 0 0
,
where SN(t) and SW (t) are the number of mosquitoes with and without Wolbachia. As
mosquito populations vary seasonally, both of these are functions of time. The transition
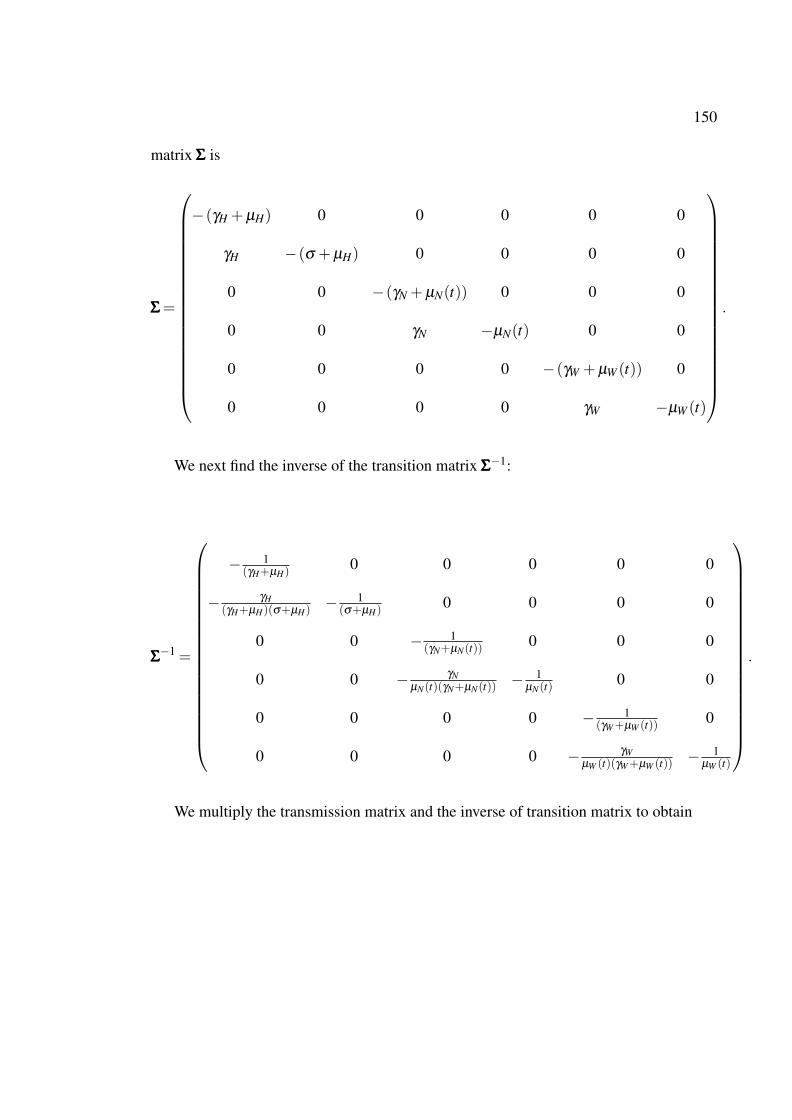
150
matrix ΣΣΣ is
ΣΣΣ=
−(γH +µH) 0 0 0 0 0
γH −(σ +µH) 0 0 0 0
0 0 −(γN +µN(t)) 0 0 0
0 0 γN −µN(t) 0 0
0 0 0 0 −(γW +µW (t)) 0
0 0 0 0 γW −µW (t)
.
We next find the inverse of the transition matrix ΣΣΣ−1:
ΣΣΣ−1 =
− 1(γH+µH)
0 0 0 0 0
− γH(γH+µH)(σ+µH)
− 1(σ+µH)
0 0 0 0
0 0 − 1(γN+µN(t))
0 0 0
0 0 − γNµN(t)(γN+µN(t))
− 1µN(t)
0 0
0 0 0 0 − 1(γW+µW (t)) 0
0 0 0 0 − γWµW (t)(γW+µW (t)) −
1µW (t)
.
We multiply the transmission matrix and the inverse of transition matrix to obtain

151
−TΣΣΣ−1 =
0 0 bNLTNγNµN(γN+µN)
bNLTNµN
bW LTHW γWµW (γW+µW )
bW LTHWµW
0 0 0 0 0 0
0 bNTNγHSN(t)(σ+µH)(γH+µH)
bNTNSN(t)(σ+µH)
0 0 0
0 0 0 0 0 0
0 bW TNγHSW (t)(σ+µH)(γH+µH)
bW TNSW (t)(σ+µH)
0 0 0
0 0 0 0 0 0
.
The spectral radius of the matrix −TΣΣΣ−1 is the basic reproduction number, that is,
RP =
√b2
NLT 2N γNγHSN(t)
µN(t)(γN+µN(t))(σ+µH)(γH+µH)+
b2W LTHW γW TNγHSW (t)
µW (t)(γW+µW (t))(σ+µH)(γH+µH). (7)
Equation (7) gives the basic reproduction number in the presence of Wolbachia. In the
absence of Wolbachia, after setting all Wolbachia-related parameters to zero, Equation 7
is reduced to
RA =
√b2
NLT 2N γNγHSN(t)
µN(t)(γN +µN(t))(σ +µH)(γH +µH). (8)
The basic reproduction number found here can be considered to be an instantaneous
basic reproduction number which depends on fluctuations in the mosquito population,
SN(t) and SW (t).
Bibliography
[1] B. Adams and M. Boots. Modelling the relationship between antibody-dependentenhancement and immunological distance with application to dengue. Journal ofTheoretical Biology, 242:337–346, 2006.
[2] B. Adams and M. Boots. How important is vertical transmission in mosquitoesfor the persistence of dengue? insights from a mathematical model. Epidemics,2:1–10, 2010.
[3] M. Aguiar, S. Ballesteros, B. W. Kooi, and N. Stollenwerk. The role of seasonal-ity and import in a minimalistic multi–strain dengue model capturing differencesbetween primary and secondary infections: complex dynamics and its implicationsfor data analysis. Journal of Theoretical Biology, 289:181–196, 2011.
[4] B. M. Althouse, A. P. Durbin, K. A. Hanley, S. B. Halstead, S. C. Weaver, andD. A. T Cummings. Viral kinetics of primary dengue virus infection in non-human primates: A systematic review and individual pooled analysis. Virology,452–453:237–246, 2014.
[5] M. Andraud, N. Hens, and P. Beutels. A simple periodic–forced model for denguefitted to incidence data in Singapore. Mathematical Biosciences, 244:22–28, 2013.
[6] M. Andraud, N. Hens, Ch. Marais, and P. Beutels. Dynamic epidemiological mod-els for dengue transmission: A systematic review of structural approaches. PLoSONE, 7:e49085, 2012.
[7] J. Arrivillaga and R. Barrera. Food as a limiting factor for Aedes aegypti in waterstorage containers. Journal of Vector Ecology, 29:11–20, 2004.
[8] N. Bacaer. Approximation of the basic reproduction number R0 for vector–bornediseases with a periodic vector population. Bulletin of Mathematical Biology,69:1067–1091, 2007.
[9] M. Bannister-Tyrrell, C. Williams, S. A. Ritchie, G. Rau, J. Lindesay, G. Mercer,and D. Harley. Weather-driven variation in dengue activity in Australia exam-ined using a process-based modeling approach. The American Journal of TropicalMedicine and Hygiene, 88:65–72, 2013.
[10] S. Bhatt, P. W. Gething, O. J. Brady, J. P. Messina, A. W. Farlow, et al. The globaldistribution and burden of dengue. Nature, 496:1476–4687, 2013.
[11] G. Bian, Y. Xu, P. Lu, Y. Xie, and Z. Xi. The endosymbiotic bacterium Wolbachiainduces resistance to dengue virus in Aedes aegypti. PLoS Pathogen, 6:e1000833,2010.
[12] S. Bianco, L. B. Shaw, and I. B. Schwartz. Epidemics with multistrain interac-tions: The interplay between cross immunity and antibody-dependent enhance-ment. Chaos: An Interdisciplinary Journal of Nonlinear Science, 19:043123, 2009.
152

153
[13] S. M. Blower and M. Dowlatabadi. Sensitivity and uncertainty analysis of com-plex models of disease transmission: an HIV model, as an example. InternationalStatistical Review, 62:229–243, 1994.
[14] L. Bravo, V. G. Roque, J. Brett, R. Dizon, and M. L’Azou. Epidemiology of denguedisease in the Philippines (2000–2011): A systematic literature review. PLoS Ne-glected Tropical Diseases, 8:e3027, 2014.
[15] Cairns Regional Council. Population and housing fact sheet. http://www.dsdip.qld.gov.au/resources/map/population-housing-factsheets/cairns-regional-council.pdf, 2008. [Online; accessed 12–08–2015].
[16] M. Chan and M. A. Johansson. The incubation periods of dengue viruses. PLoSONE, 7:e50972, 2012.
[17] M. H. T. Chan and P. S. Kim. Modelling a Wolbachia invasion using a slow fastdispersal reaction diffusion approach. Bulletin of Mathematical Biology, 75:1501–1523, 2013.
[18] N. Chitnis, J. M. Hyman, and J. M. Cushing. Determining important parametersin the spread of malaria through the sensitivity analysis of a mathematical model.Bulletin of Mathematical Biology, 70:1272–1296, 2008.
[19] G. Chowel, P. Diaz-Duenas, J. C. Miller, A. A. Velazco, J. M. Hyman, P. W. Fen-imore, and C. Castillo-Chaves. Estimation of the reproduction number of denguefever from spatial epidemic data. Mathematical Biosciences, 208:571–589, 2007.
[20] W. J. Conover and R. L. Iman. Rank transformations as a bridge between paramet-ric and nonparametric statistics. The American Statistician, 35:124–129, 1981.
[21] D. A. T. Cummings, I. B. Schwartz, L. Billings, L. B. Shaw, and D. S. Burke. Dy-namic effects of antibody-dependent enhancement on the fitness of viruses. Pro-ceedings of the National Academy of Sciences of the United States of America,102:15259–15264, 2005.
[22] H. G. Dantes, J. A. Farfan-Ale, and E. Sarti. Epidemiological trends of denguedisease in Mexico (2000–2011): A systematic literature search and analysis. PLoSNeglected Tropical Diseases, 8:e3158, 2014.
[23] O. Diekmann, J. A. P Heesterbeek, and J. A. J. Metz. On the definition and thecomputation of basic reproduction ratio R0 in models for infectious diseases inheterogenous population. Journal of Mathematical Biology, 28:629–656, 1990.
[24] O Diekmann, J. A. P Heesterbeek, and M. G. Roberts. The construction of next–generation matrices for compartmental epidemic models. Journal of the RoyalSociety Interface, 7:873–885, 2010.
[25] D. J. D. Earn, P. Rohani, B. M. Bolker, and B. T. Grenfell. A simple model forcomplex dynamical transitions in epidemics. Science, 287:667–670, 2000.

154
[26] N. Ferguson, R. Anderson, and S. Gupta. The effect of antibody-dependentenhancement on the transmission dynamics and persistence of multiple-strainpathogens. Proceedings of the National Academy of Sciences, 96:790–794, 1999.
[27] N. M. Ferguson, C. A. Donnelly, and R. M. Anderson. Transmission dynamicsand epidemiology of dengue: insights from age-stratified sero-prevalence surveys.Philosophical Transactions of the Royal Society of London B: Biological Sciences,354:757–768, 1999.
[28] N. M. Ferguson, D. T. Hue Kien, H. Clapham, R. Aguas, V. T. Trung, T. N.Bich Chau, J. Popovici, P. A. Ryan, S. L. O’Neill, E. A. McGraw, V. T. Long,L. T. Dui, H. L. Nguyen, N. V. Vinh Chau, B. Wills, and C. P. Simmons. Modelingthe impact on virus transmission of Wolbachia-mediated blocking of dengue virusinfection of Aedes aegypti. Science Translational Medicine, 7:279ra37, 2015.
[29] F. D. Frentiu, T. Zakir, T. Walker, J. Popovici, A. T. Pyke, A. van den Hurk, E. A.McGraw, and S. L. O’Neill. Limited Dengue virus replication in field-collectedAedes aegypti mosquitoes infected with Wolbachia. PLoS Neglected Tropical Dis-eases, 8:e2688, 2014.
[30] K. Glass, G. N. Mercer, H. Nishiura, E. S. McBryde, and N. G. Becker. Estimatingreproduction numbers for adults and children from case data. Journal of The RoyalSociety Interface, 8:1248–1259, 2011.
[31] N. Grisales, R. Poupardin, S. Gomez, I. Fonseca-Gonzalez, H. Ranson, andA. Lenhart. Temephos resistance in Aedes aegypti in Colombia compromisesdengue vector control. PLoS Neglected Tropical Diseases, 7:e2438, 2013.
[32] D. J. Gubler. Dengue and dengue hemorrhagic fever. Clinical Microbiology Re-views, 11:480–496, 1998.
[33] P. A. Hancock and H. C. J. Godfray. Modelling the spread of Wolbachia in spatiallyheterogeneous environments. Journal of The Royal Society Interface, 9:3045–3054, 2012.
[34] P. A. Hancock, S. P. Sinkins, and H. C. J. Godfray. Population dynamic models ofthe spread of Wolbachia. The American Naturalist, 177:323–333, 2011.
[35] P. A. Hancock, S. P. Sinkins, and H. C. J. Godfray. Strategies for introducingWolbachia to reduce transmission of mosquito–borne diseases. PLoS NeglegtedTropical Diseases, 5:e1024, 2011.
[36] L. C. Harrington, T. W. Scott, K. Lerdthusnee, R. C. Coleman, A. Costero, G. G.Clark, J. J. Jones, S. Kitthawee, P. Kittayapong, R. Sithiprasasna, and J. D. Edman.Dispersal of the dengue vector Aedes aegypti within and between rural communi-ties. The American Journal of Tropical Medicine and Hygiene, 72:209–220, 2005.
[37] J. M. Heffernan, R. J. Smith, and L. M. Wahl. Perspectives on the basic reproduc-tive ratio. Journal of The Royal Society Interface, 2:281–293, 2005.

155
[38] K. Hilgenboecker, P. Hammerstein, A. Telschow, and J. H. Werren. How manyspecies are infected with Wolbachia? a statistical analysis of current data. FEMSMicrobiology Letters, 281:215–220, 2008.
[39] A. A. Hoffmann, I. Iturbe-Ormaetxe, A. G. Callahan, B. L. Phillips, K. Billing-ton, J. K. Axford, B. Montgomery, A. P. Turley, and S. L. O’Neill. Stability ofthe WMel Wolbachia infection following invasion into Aedes aegypti populations.PLoS Neglected Tropical Diseases, 8:e3115, 2014.
[40] A. A. Hoffmann, M Turelli, and L G Harshman. Factors affecting the distribution ofcytoplasmic incompatibility in Drosophila simulans. Genetics, 126:933–48, 1990.
[41] A. A. Hofmann, B. L. Montgomery, J. Popovici, I. Iturbe-Ormaetxe, P. H. Johnson,et al. Successful establishment of Wolbachia in Aedes populations to suppressdengue transmission. Nature, 476:454–457, 2011.
[42] K. Hu, C. Thoens, S. Bianco, S. Edlund, M. Davis, J. Douglas, and J. H. Kaufman.The effect of antibody-dependent enhancement, cross immunity, and vector popu-lation on the dynamics of dengue fever. Journal of Theoretical Biology, 319:62–74,2013.
[43] H. Hughes and N. F. Britton. Modelling the use of Wolbachia to control denguefever transmission. Bulletin of Mathematical Biology, 75:796–818, 2013.
[44] Gunther J., Martinez-Munoz J. P., Perez-Ishiwara D. G., and Salas-Benito J. Evi-dence of vertical transmission of dengue virus in two endemic localities in the Stateof Oaxaca, Mexico. Intervirology, 50:347–352, 2007.
[45] M. Karyanti, C. S. P. M. Uiterwaal, R. Kusriastuti, S. Hadinegoro, M. Rovers,H. Heesterbeek, A. Hoes, and P. Bruijning-Verhagen. The changing incidence ofdengue haemorrhagic fever in Indonesia: a 45-year registry-based analysis. BMCInfectious Diseases, 14:412, 2014.
[46] K. Katrina, National Arbovirus & Malaria Advisory Committee, and C. Giele. In-creasing notifications of dengue in Australia related to overseas travel, 1991 to2012. Communicable Diseases Intelligence, 37:E5–E7, 2013.
[47] M. J. Keeling and P. Rohani. Modelling Infectious Diseases in Humans and Ani-mals. Princeton University Press, 2008.
[48] M. J. Keeling, P. Rohani, and B. T. Grenfell. Seasonally forced disease dynam-ics explored as switching between attractors. Physica D: Nonlinear Phenomena,148:317–335, 2001.
[49] K. Koelle, M. Pascual, and Md. Yunus. Pathogen adaptation to seasonal forcing andclimate change. Proceedings of the Royal Society B: Biological Sciences, 272:971–977, 2005.
[50] B. W. Kooi, M. Aguiar, and N. Stollenwerk. Analysis of an asymmetric two-straindengue model. Mathematical Biosciences, 248:128–139, 2014.
156
[51] L. Lambrechts, T. W. Scott, and D. J. Gubler. Consequences of the expandingglobal distribution of Aedes albopictus for dengue virus transmission. PLoS Ne-glected Tropical Diseases, 4:e646, 2010.
[52] M. L’Azou, A. Taurel, C. Flamand, and P. Quenel. Recent epidemiological trendsof dengue in the French territories of the Americas (2000–2012): A systematicliterature review. PLoS Neglected Tropical Diseases, 8:e3235, 2014.
[53] K. Limkittikul, J. Brett, and M. L’Azou. Epidemiological trends of dengue diseasein Thailand (2000–2011): A systematic literature review. PLoS Neglected TropicalDiseases, 8:e3241, 2014.
[54] C. Lin, Y. Huang, P. Shu, H. Wu, Y. Lin, T. Yeh, H. Liu, C. Liu, and H. Lei.Characteristic of dengue disease in Taiwan: 2002–2007. The American Journal ofTropical Medicine and Hygiene, 82:731–739, 2010.
[55] R. Maciel-de Freitas, F. C. Avendanho, R. Santos, G. Sylvestre, S. C. Araujo,J. B. P. Lima, A. J. Martins, G. E. Coelho, and D. Valle. Undesirable consequencesof insecticide resistance following Aedes aegypti control activities due to a dengueoutbreak. PLoS ONE, 9:e92424, 2014.
[56] S. Marino, I. B. Hogue, C. J. Ray, and D. E. Kirschner. A methodology for per-forming global uncertainty and sensitivity analysis in systems biology. Journal ofTheoretical Biology, 254:178–196, 2008.
[57] P. Martinez-Rodriguez, R. Granero-Belinchon, F. Arroyo-Yebras, and J. L. Bella.New insight into Wolbachia epidemiology: Its varying incidence during the hostlife cycle can alter bacteria spread. Bulletin of Mathematical Biology, 76:2646–2663, 2014.
[58] MATLAB. R2014b. The MathWorks Inc.
[59] M. D. McKay, R. J. Beckman, and W. J. Conover. A comparison of three methodsfor selecting values of input variables in the analysis of output from a computercode. Technometrics, 21:239–245, 1979.
[60] T. McLennan-Smith and G. N. Mercer. Complex behavior in a dengue model with aseasonally varying vector population. Mathematical Biosciences, 248:22–30, 2014.
[61] C. J. McMeniman, G. L. Hughes, and S. L. O’Neill. A Wolbachia symbiontin Aedes aegypti disrupts mosquito egg development to a greater extent whenmosquitoes feed on nonhuman versus human blood. Journal of Medical Ento-mology, 48:76–84, 2011.
[62] C. J. McMeniman, R. V. Lane, B. N. Cass, A. W. C. Fong, M. Sidhu, Y. Wang, andS. L. O’Neill. Stable introduction of a life–shortening Wolbachia infection into themosquito Aedes aegypti. Science, 323:141–144, 2009.
157
[63] C. J. McMeniman and S. L. O’Neill. A virulent Wolbachia infection decreases theviability of the dengue vector Aedes aegypti during periods of embryonic quies-cence. PLoS Neglected Tropical Diseases, 4:e748, 2010.
[64] M. S. Mia, R. A. Begum, A. C. Er, R. D. Z. R. Z. Abidin, and J. J. Pereira. Trendsof dengue infections in Malaysia, 2000–2010. Asian Pacific Journal of TropicalMedicine, 6:462 – 466, 2013.
[65] L. Mier-y-Teran Romero, I. B. Schwartz, and D. A. T. Cummings. Breakingthe symmetry: Immune enhancement increases persistence of dengue viruses inthe presence of asymmetric transmission rates. Journal of Theoretical Biology,332:203 – 210, 2013.
[66] I. R. Montella, A. J. Martins, P. F. Viana-Medeiros, J. B. P. Lima, I. A. Braga, andD. Valle. Insecticide resistance mechanisms of Brazilian Aedes aegypti populationsfrom 2001 to 2004. The American Journal of Tropical Medicine and Hygiene,77:467–477, 2007.
[67] L. A. Moreira, I. Iturbe-Ormaetxe, J. A. Jeffery, G. Lu, A. T. Pyke, et al. Wol-bachia symbiont in Aedes aegypti limits infection with dengue, chikungunya, andplasmodium. Cell, 139:1268–1278, 2009.
[68] B. R. Murphy and S. S. Whitehead. Immune response to dengue virus and prospectsfor a vaccine. Annual Review of Immunology, 29:587–619, 2011.
[69] M. Z. Ndii, R. I. Hickson, D. Allingham, and G. N. Mercer. Modelling the transmis-sion dynamics of dengue in the presence of Wolbachia. Mathematical Biosciences,262:157–166, 2015.
[70] M. Z. Ndii, R. I. Hickson, and G. N. Mercer. Modelling the introduction of Wol-bachia into Aedes aegypti to reduce dengue transmission. The ANZIAM Journal,53:213–227, 2012.
[71] H. T. H. Nguyen and P. Rohani. Noise, nonlinearity and seasonality: the epidemicsof whooping cough revisited. Journal of The Royal Society Interface, 5:403–413,2008.
[72] R. Nikin-Beers and S. M. Ciupe. The role of antibody in enhancing dengue virusinfection. Mathematical Biosciences, 263:83–92, 2015.
[73] H. Nishiura and G. Chowell. The effective reproduction number as a prelude to sta-tistical estimation of time-dependent epidemic trends. In G. Chowell, J. M. Hyman,L. M. A. Bettencourt, and C. Castillo-Chavez, editors, Mathematical and Statisti-cal Estimation Approaches in Epidemiology, pages 103–121. Springer Netherlands,2009.
[74] H. Nishiura and S. B. Halstead. Natural history of dengue virus (DENV)–1 andDENV–4 infections: Reanalysis of classic studies. Journal of Infectious Diseases,195:1007–1013, 2007.
158
[75] NNDSS. Number of notifications of Dengue virus infection, received from Stateand Territory health authorities in the period of 1991 to 2014 and year-to-datenotifications for 2015. http://www9.health.gov.au/cda/source/rpt_4.cfm,June 2015. [Online; accessed 10–July–2015].
[76] R. Olinky, A. Huppert, and L. Stone. Seasonal dynamics and thresholds governingrecurrent epidemics. Journal of Mathematical Biology, 56:827–839, 2008.
[77] E. Ooi, K. Goh, and D. J. Gubler. Dengue prevention and 35 years of vector controlin Singapore. Emerging Infectious Diseases, 12:887–893, 2006.
[78] S. A. Ritchie, J. N. Hanna, Susan L. Hills, John P. Piispanen, W. John H. McBride,Alyssa Pyke, and Ross L. Spark. Dengue control in North Queensland, Australia:Case recognition and selective indoor residual spraying. Dengue Bulletin, 26:7–12,2002.
[79] I. Rodriguez-Barraquer, R. Buathong, S. Iamsirithaworn, A. Nisalak, J. Lessler,R. G. Jarman, R. V. Gibbons, and D. A.T. Cummings. Revisiting Rayong: Shift-ing seroprofiles of dengue in Thailand and their implications for transmission andcontrol. American Journal of Epidemiology, 179:353–360, 2014.
[80] E. Schwartz, L. H. Weld, A. Wilder-Smith, F. Sonnenburg, J. S. Keystone, K. C.Kain, J. Torresi, and D. O. Freedman. Seasonality, annual trends, and charac-teristics of dengue among ill returned travelers, 1997–2006. Emerging InfectiousDiseases, 14:1081–1088, 2008.
[81] T. W. Scott, P. H. Amerasinghe, A. C. Morrison, L. H. Lorenz, G. G. Clark,D. Strickman, P. Kittayapong, and J. D. Edman. Longitudinal studies of Aedes ae-gypti (Diptera: Culicidae) in Thailand and Puerto Rico: Blood feeding frequency.Journal of Medical Entomology, 37:89–101, 2000.
[82] C. Shang, C. Fang, C. Liu, T. Wen, K. Tsai, and C. King. The role of importedcases and favorable meteorological conditions in the onset of dengue epidemics.PLoS Neglected Tropical Diseases, 4:e775, 2010.
[83] D. L. Smith, T. A. Perkins, R. C. Reiner, C. M. Barker, T. Niu, L. F. Chaves, A. M.Ellis, D. B. George, A. Le Menach, J. R. C. Pulliam, D. Bisanzio, C. Buckee,C. Chiyaka, D. A. T. Cummings, A. J. Garcia, M. L. Gatton, P. W. Gething, D. M.Hartley, G. Johnston, E. Y. Klein, E. Michael, A. L. Lloyd, D. M. Pigott, W. K.Reisen, N. Ruktanonchai, B. K. Singh, J. Stoller, A. J. Tatem, U. Kitron, H. C. J.Godfray, J. M. Cohen, S. I. Hay, and T. W. Scott. Recasting the theory of mosquito-borne pathogen transmission dynamics and control. Transactions of The RoyalSociety of Tropical Medicine and Hygiene, 108:185–197, 2014.
[84] S. T. Stoddard, H. J. Wearing, R. C. Reiner, A. C. Morrison, H. Astete, S. Vil-carromero, C. Alvarez, C. Ramal-Asayag, M. Sihuincha, C. Rocha, E. S. Halsey,T. W. Scott, T. J. Kochel, and B. M. Forshey. Long-term and seasonal dynamics ofdengue in Iquitos, Peru. PLoS Neglected Tropical Diseases, 8:e3003, 2014.
159
[85] L. Stone, R. Olinky, and A. Huppert. Seasonal dynamics of recurrent epidemics.Nature, 446, 2007.
[86] R. Stouthamer, J. A. J. Breeuwer, and G. D. D. Hurst. Wolbachia Pipientis: Mi-crobial manipulator of arthropod reproduction. Annual Review of Microbiology,53:71–102, 1999.
[87] V. Tricou, N. N. Minh, J. Farrar, H. T. Tran, and C. P. Simmons. Kinetics of viremiaand ns1 antigenemia are shaped by immune status and virus serotype in adults withdengue. PLoS Neglected Tropical Diseases, 5:e1309, 2011.
[88] A. Turley, M. Zalucki, S. O’Neill, and E. McGraw. Transinfected Wolbachia haveminimal effects on male reproductive success in Aedes aegypti. Parasites and Vec-tors, 6:36, 2013.
[89] A. P. Turley, L. A. Moreira, S. L. O’Neill, and E. A. McGraw. Wolbachia infectionreduces blood–feeding success in the dengue fever mosquito, aedes aegypti. PLoSNeglected Tropical Diseases, 3:e516, 2009.
[90] A. P. Turley, R. C. Smallegange, W. Takken, M. P. Zalucki, S. L. O’Neill, and E. A.MCGraw. Wolbachia infection does not alter attraction of the mosquito Aedes (Ste-gomyia) aegypti to human odours. Medical and Veterinary Entomology, 28:457–460, 2014.
[91] P. van den Driessche and J. Watmough. Reproduction numbers and sub–thresholdendemic equilibria for compartmental models of disease transmission. Mathemat-ical Biosciences, 180:29–48, 2002.
[92] D. W. Vaughn, S. Green, S. Kalayanarooj, B. L. Innis, S. Nimmannitya, S. Sun-tayakorn, T. P. Endy, B. Raengsakulrach, A. L. Rothman, F. A. Ennis, andA. Nisalak. Dengue viremia titer, antibody response pattern, and virus serotypecorrelate with disease severity. Journal of Infectious Diseases, 181:2–9, 2000.
[93] L. A. Villar, D. P. Rojas, S. Besada-Lombana, and E. Sarti. Epidemiological trendsof dengue disease in Colombia (2000–2011): A systematic review. PLoS NeglectedTropical Diseases, 9:e0003499, 2015.
[94] T. Walker, P. H. Johnson, L. A. Moreira, I. Iturbe-Ormaetxe, F. D. Frentiu, et al.The WMel Wolbachia strain blocks dengue and invades caged Aedes aegypti popu-lations. Nature, 476:450–453, 2011.
[95] D. M. Watts, D. S. Burke, B. A. Harrison, R. E. Whitmire, and A. Nisalak. Effectof temperature on the vector efficiency of Aedes aegypti for dengue 2 virus. TheAmerican Journal of Tropical Medicine and Hygiene, 36:143–152, 1987.
[96] H. J. Wearing and P. Rohani. Ecological and immunological determinants ofdengue epidemics. Proceedings of the National Academy of Sciences, 103:11802–11807, 2006.
160
[97] J. H. Werren. Biology of Wolbachia. Annual Review of Entomology, 42:587–609,1997.
[98] S. S. Whitehead, J. E. Blaney, A. P. Durbin, and B. R. Murphy. Prospects for adengue virus vaccine. Nature Reviews Microbiology, 5:518–528, 2007.
[99] C. R. Williams, B. S. Gill, G. Mincham, A. H. Mohd Zaki, N. Abdullah, W. R. W.Mahiyuddin, R. Ahmad, M. K. Shahar, D. Harley, E. Viennet, A. Azil, and A. Ka-maluddin. Testing the impact of virus importation rates and future climate changeon dengue activity in Malaysia using a mechanistic entomology and disease model.Epidemiology and Infection, FirstView:1–9, 2015.
[100] H. Woodall and B. Adams. Partial cross-enhancement in models for dengue epi-demiology. Journal of Theoretical Biology, 351:67–73, 2014.
[101] World Health Organisation. Global Health Observatory (GHO).http://www.who.int/gho/mortality_burden_disease/life_tables/situation_trends/en/, 2012. [Online; accessed 9 February 2015].
[102] World Health Organisation. Dengue and severe dengue Fact sheet No117. http://www.who.int/mediacentre/factsheets/fs117/en/, May 2015. [Online;accessed 15 June 2015].
[103] J. Wu, R. Dhingra, M. Gambhir, and J. V. Remais. Sensitivity analysis of infectiousdisease models: methods, advances and their application. Journal of The RoyalSociety Interface, 10:1–14, 2013.
[104] L. Yakob, M. Bonsall, and G. Yan. Modelling knowlesi malaria transmission inhumans: vector preference and host competence. Malaria Journal, 9:329, 2010.
[105] L. Yakob and A. C. A. Clements. A mathematical model of chikungunya dynamicsand control: The major epidemic on Reunion Island. PLoS ONE, 8:e57448, 032013.
[106] H. M. Yang. The basic reproduction number obtained from jacobian and nextgeneration matrices-a case study of dengue transmission modelling. Biosystems,126:52–75, 2014.
[107] H. M. Yang and C. P. Ferreira. Assessing the effects of vector control on denguetransmission. Applied Mathematics and Computation, 198:401–413, 2008.
[108] H. M. Yang, M. L. G. Macoris, K. C. Galvani, and M. T. C. Andrighetti. Followup estimation of Aedes aegypti entomological parameters and mathematical mod-ellings. Biosystems, 103:360–371, 2011.
[109] H. M. Yang, M. L. G. Macoris, K. C. Galvani, M. T. M. Andrighetti, and D. M. V.Wanderley. Assessing the effects of temperature on the population of Aedes aegypti,the vector of dengue. Epidemiology and Infection, 137:1188–1202, 2009.
161
[110] Y. H. Ye, A. M. Carrasco, F. D. Frentiu, S. F. Chenoweth, N. W. Beebe, A. F.van den Hurk, C. P. Simmons, S. L. O’Neill, and E. A. McGraw. Wolbachia re-duces the transmission potential of dengue-infected Aedes aegypti. PLoS NeglectedTropical Diseases, 9:e0003894, 2015.
[111] H. L. Yeap, P. Mee, T. Walker, A. R. Weeks, S. L. O’Neill, et al. Dynamics ofthe “Popcorn” Wolbachia infection in outbred Aedes aegypti informs prospects formosquito vector control. Genetics, 187:583–595, 2011.
[112] X. Zhang, S. Tang, and R. A. Cheke. Birth-pulse models of Wolbachia-inducedcytoplasmic incompatibility in mosquitoes for dengue virus control. NonlinearAnalysis: Real World Applications, 22:236–258, 2015.
[113] B. Zheng, M. Tang, and J. Yu. Modeling Wolbachia spread in mosquitoes throughdelay differential equations. SIAM Journal on Applied Mathematics, 74:743–770,2014.