workforce outcomes of wia-funded on-the-job training in ohio
TRANSCRIPT

WORKFORCE OUTCOMES OF WIA-FUNDED
ON-THE-JOB TRAINING IN OHIO
Kristin Harlow, Research Associate
Center for Human Resource Research
I n f o r m i n g P o l i c y a n d P r a c t i c e t h r o u g h E d u c a t i o n a n d L a b o r M a r k e t s I C o l u m b u s , O H I F e b r u a r y 2 5 , 2 0 1 5

AGENDA
1. Research Question and Context
2. Workforce Investment Act (WIA)
3. On-the-Job Training (OJT)
4. Ohio Longitudinal Data Archive
5. Research Design
6. Results
2

Does WIA-funded on-the-job
training improve workforce
outcomes for trainees in Ohio?
Signs point to Yes
3
RESEARCH QUESTION

Sessions Today:
Workforce Success Measures Dashboard
Performance Measurement of Workforce
Development Programs
Longitudinal Data Systems
CONFERENCE CONTEXT
4

Federal workforce
development
funding
Ohio: WIB Regions
and County-level
OhioMeansJobs
Centers
5
WORKFORCE INVESTMENT ACT
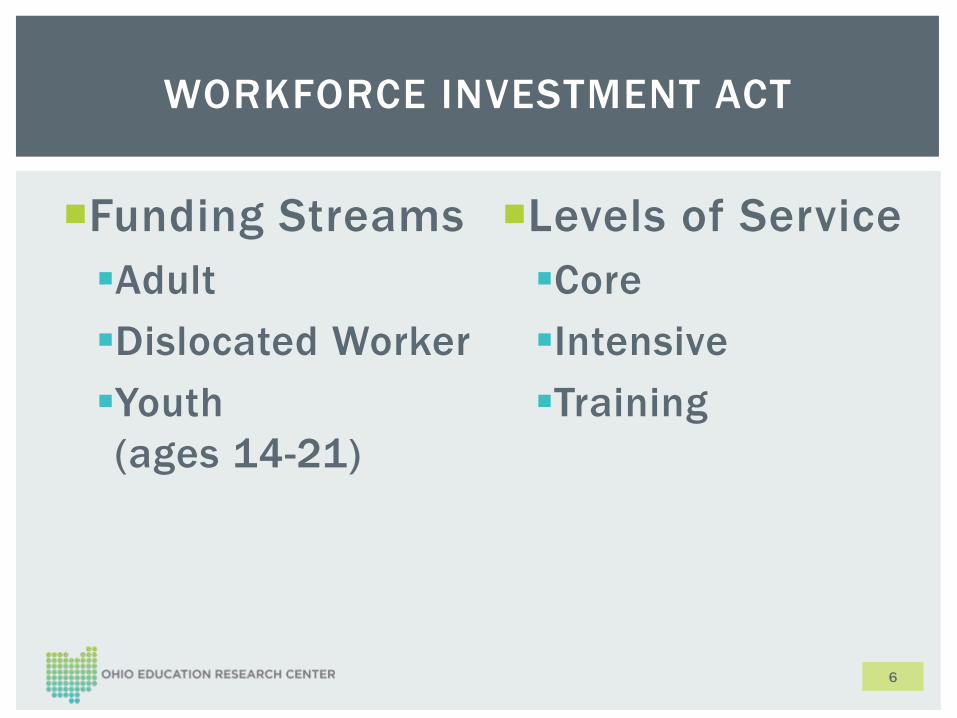
Funding Streams
Adult
Dislocated Worker
Youth
(ages 14-21)
Levels of Service
Core
Intensive
Training
6
WORKFORCE INVESTMENT ACT

Reimburse an employer up to 50% of salary for a maximum of:
six months, or
$8,000
Match based on potential position’s skill requirements and individual’s skill level
Used at the discretion of OhioMeansJobsCenters
In 2012-13, approximately 20% of total WIA trainees received OJT
7
WIA ON-THE-JOB TRAINING

WIA has been studied nationally over the
years
e.g. Heinrich et al., 2009; Hollenbeck et al., 2005
Studies have found WIA-funded training is
correlated with higher wages and
employment, in aggregate
8
WHY STUDY WIA OJT?

Job training often refers to formal training
Research finds employer-provided training is
at least as important for worker productivity (see, e.g., Acemoglu & Pischke, 1999)
On-the-job training is squishy
Varies from firm to firm
Lack of systematic information
Particular benefit of OJT is intangible
9
WHY STUDY WIA OJT?
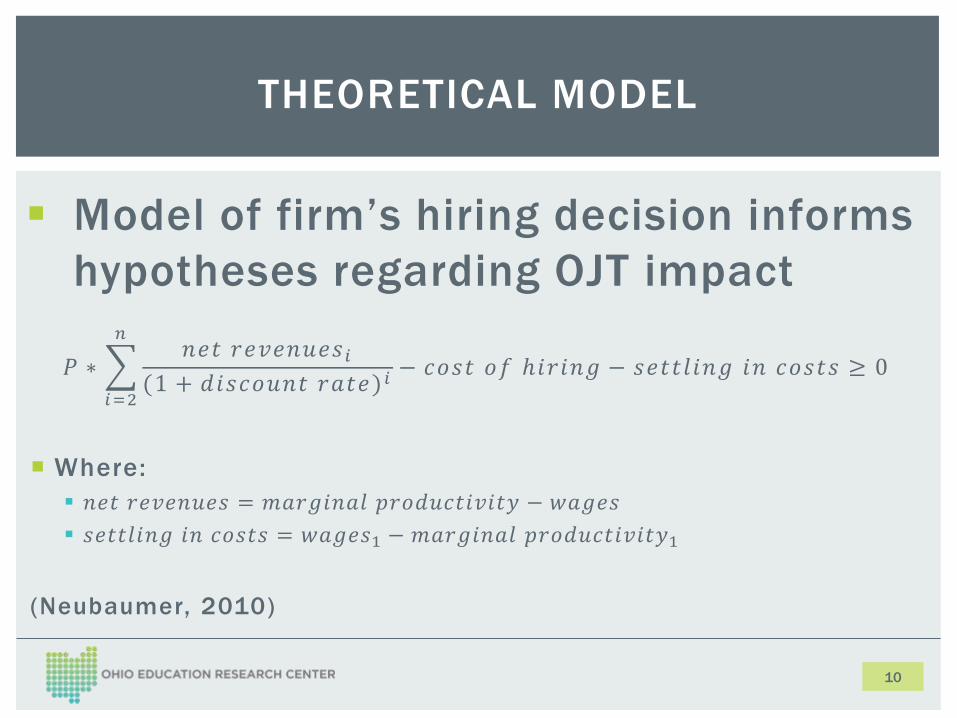
THEORETICAL MODEL
Model of firm’s hiring decision informs
hypotheses regarding OJT impact
𝑃 ∗
𝑖=2
𝑛𝑛𝑒𝑡 𝑟𝑒𝑣𝑒𝑛𝑢𝑒𝑠𝑖
(1 + 𝑑𝑖𝑠𝑐𝑜𝑢𝑛𝑡 𝑟𝑎𝑡𝑒) 𝑖− 𝑐𝑜𝑠𝑡 𝑜𝑓 ℎ𝑖𝑟𝑖𝑛𝑔 − 𝑠𝑒𝑡𝑡𝑙𝑖𝑛𝑔 𝑖𝑛 𝑐𝑜𝑠𝑡𝑠 ≥ 0
Where:
𝑛𝑒𝑡 𝑟𝑒𝑣𝑒𝑛𝑢𝑒𝑠 = 𝑚𝑎𝑟𝑔𝑖𝑛𝑎𝑙 𝑝𝑟𝑜𝑑𝑢𝑐𝑡𝑖𝑣𝑖𝑡𝑦 − 𝑤𝑎𝑔𝑒𝑠
𝑠𝑒𝑡𝑡𝑙𝑖𝑛𝑔 𝑖𝑛 𝑐𝑜𝑠𝑡𝑠 = 𝑤𝑎𝑔𝑒𝑠1 − 𝑚𝑎𝑟𝑔𝑖𝑛𝑎𝑙 𝑝𝑟𝑜𝑑𝑢𝑐𝑡𝑖𝑣𝑖𝑡𝑦1
(Neubaumer, 2010)
10

Do firms receiving OJT funding have an incentive to
provide high-quality training?
Employee is hired at a certain fixed wage,
If the probability of an employee staying with the firm
increases, it is of benefit to the firm to improve the
employee’s marginal productivity.
Hypothesis: WIA-funded OJT will improve the value
of the worker, and will result in long-term wage and
employment benefits.
11
HYPOTHESIS
OLDA Administrative Data
Quasi-Experimental Design
12
HOW CAN WE TEST THE HYPOTHESIS?

OHIO LONGITUDINAL DATA ARCHIVE
Ohio
Longitudinal
Data Archive
(OLDA)
Ohio
Education
Research
Center
(OERC)
Center for
Human
Resource
Research
(CHRR)
Researchers
State Agents
Public Stakeholders
13

14
OHIO LONGITUDINAL DATA ARCHIVE
OLDA
Ohio Department of Job and Family
Services
Individual Wages and Employers
Employer Information
Unemployment Insurance Benefits
Workforce Investment Act
Ohio Board of Regents
Ohio Public Higher Education
Student
Faculty
Ohio Technical Centers
(formerly AWE)
Adult Basic and Literacy Education
Ohio Department of Education
Education Management Information
System (EMIS)
Student
Staff
District
Course
15
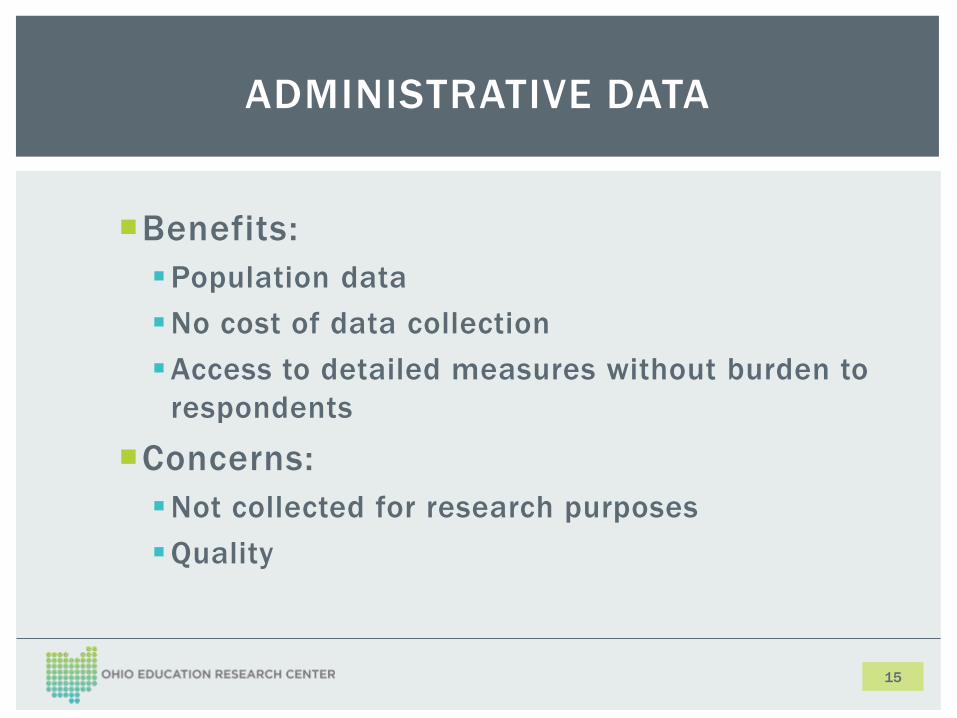
ADMINISTRATIVE DATA
Benefits:
Population data
No cost of data collection
Access to detailed measures without burden to
respondents
Concerns:
Not collected for research purposes
Quality

Does WIA-funded on-the-job
training improve workforce
outcomes for trainees in Ohio?
16
RESEARCH QUESTION - REMINDER

17
OLDA CAN BE USED TO STUDY THIS
QUESTIONOLDA
Ohio Department of Job and Family
Services
Individual Wages and Employers
Employer Information
Unemployment Insurance Benefits
Workforce Investment Act
Ohio Board of Regents
Ohio Public Higher Education
Student
Faculty
Ohio Technical Centers
(formerly AWE)
Adult Basic and Literacy Education
Ohio Department of Education
Education Management Information
System (EMIS)
Student
Staff
District
Course

Administrative records collected for Federal
reporting
Includes all individuals who receive any
services from OhioMeansJobs Centers
Variables include:
Services received, including OJT
Dates of service
Demographic variables
18
WIA DATA

All wages reported to Ohio Department of Job
and Family Services (ODJFS) for
unemployment insurance purposes
Wage data excludes the following:
Wages from federal employers
Earnings from self-employment
Wages from employment outside the state of Ohio
19
WAGE DATA

Identifies individuals who receive
unemployment insurance funds each
calendar quarter
20
UNEMPLOYMENT DATA

Randomized experiment – creates a treatment and control groups that are statistically similar
Propensity score matching – creates a comparison group that is statistically similar to the existing treatment group
Accounts for observed differences between the groups
Statistically similar through matching rather than randomization
21
RESEARCH DESIGN

OJT participants between 2006-2008
Literature indicates training benefits appear in the
long term (3 to 5 years)
Outcomes measured after 4 years:
Employment
Wages
22
RESEARCH DESIGN
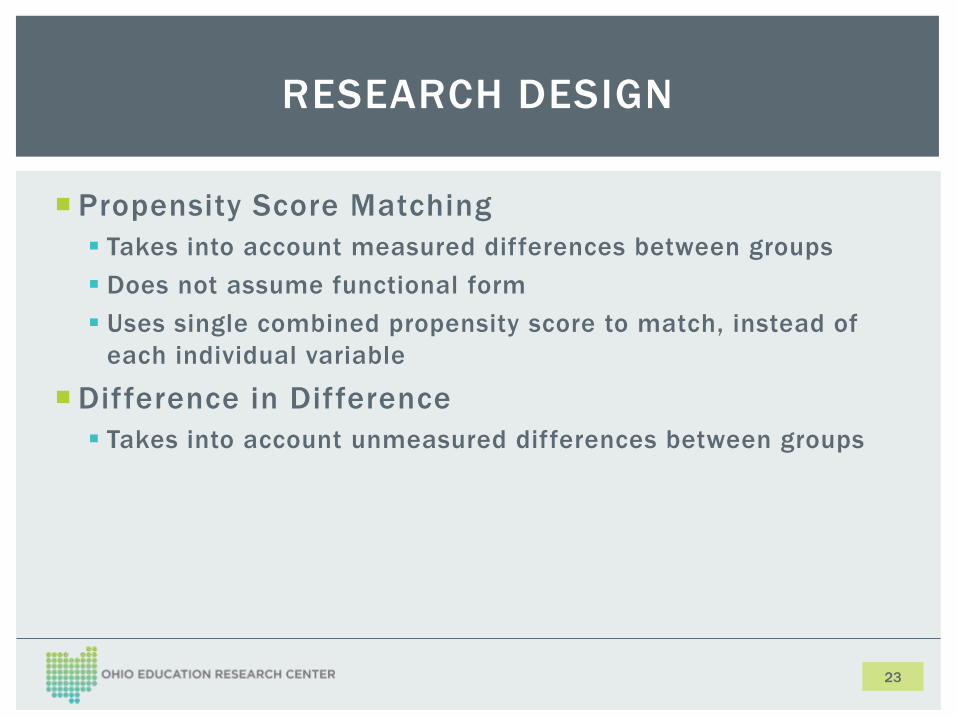
Propensity Score Matching
Takes into account measured differences between groups
Does not assume functional form
Uses single combined propensity score to match, instead of
each individual variable
Difference in Difference
Takes into account unmeasured differences between groups
23
RESEARCH DESIGN

OJT (n=1,115) Comparison Pool (n=27,160)
Mean SD Mean SD
Age 37.35 11.47 39.28 12.11
Male 69.2% 46.2% 49.5% 50.0%
Nonwhite 16.5% 37.1% 43.5% 49.6%
Veteran 7.2% 25.8% 3.9% 19.2%
Dislocated Worker 32.5% 46.9% 16.6% 37.2%
Received UI 26.4% 44.1% 17.7% 38.2%
Conditional Earnings $6,080 $5,610 $5,429 $5,661
Earnings Dip 69.2% 46.2% 66.4% 47.2%
24
DESCRIPTIVE STATISTICS - UNMATCHED

25
OJT VS. NON-OJT
WIA PARTICIPANTS 2006-2008

Group matched on:
Demographics
WIA funding stream and supportive services
Variables describing employment in quarters 3 through 8 prior to
participation
Variables describing employment/wage dip prior to participation
Industry (1-digit NAICS code)
Geographic region
Quarter of participation
26
MATCHING

OJT (n=980) Comparison Pool (n=980)
Mean SD Mean SD
Age 37.54 11.64 37.23 11.75
Male 66.2% 47.3% 64.5% 47.9%
Nonwhite 17.4% 38.0% 17.6% 38.1%
Veteran 6.3% 24.4% 6.9% 25.4%
Dislocated Worker 27.0% 44.4% 27.4% 44.6%
Received UI 23.3% 42.3% 22.1% 41.5%
Conditional Earnings $5,925 $5,775 $5,722 $5,253
Earnings Dip 68.7% 46.4% 70.3% 45.7%
27
DESCRIPTIVE STATISTICS – MATCHED

28
RESULTS – PERCENT FOUND WORKING
0%
10%
20%
30%
40%
50%
60%
70%
80%
90%
100%
Comparison OJT

29
RESULTS - WAGES
$0
$1,000
$2,000
$3,000
$4,000
$5,000
$6,000
$7,000
$8,000
$9,000
$10,000
Comparison OJT

Difference in Difference Model
Beginning fourth quarter before participation
Average of quarters 15 through 18
Average 11.0 percentage point difference
in individuals found working
Average $1,100 difference in quarterly
wages
30
RESULTS –
DIFFERENCE IN DIFFERENCE MODELS

How do outcomes vary by industry?
By firm?
Are there best practices in OJT?
Which firms are retaining their
employees long-term?
31
NEXT STEPS


Acemoglu, D., & Pischke, J.-S. (1999). Beyond Becker: Training in Imperfect Labour Markets. The Economic Journal , F112-42.
Heinrich, C.J., Mueser, P.R., Troske, K.R., Jeon, K. -S., & Kahvecioglu, D.C. (2009). New Estimates of Public Employment and Training Program Net Impacts: A Nonexperimental Evaluation of the Workforce Investment Act Program . Bonn, Germany: Institute for the Study of Labor.
Hollenbeck, K., Schroeder, D., King, C.T., & Huang, W.-J. (2005). Net Impact Estimates for Services Provided through the Workforce Investment Act. Washington: U.S. Department of Labor.
Neubaumer, R. (2010). Can Training Programs or Rather Wage Subsidies Bring the Unemployed Back to Work? A Theoretical and Empirical Investigation for Germany. Bonn, Germany: The Open Access Publication Server of the ZBW – Leibniz Information Centre for Economics.
WORKS CITED

Race and/or gender are missing from about 5% of all individuals represented in the WIA data set
Used multiple imputation to create basic model of outcomes
Found no difference between model using multiple imputation and model dropping individuals with missing data
Going forward, dropping all individuals with missing demographics
34
MISSING DATA
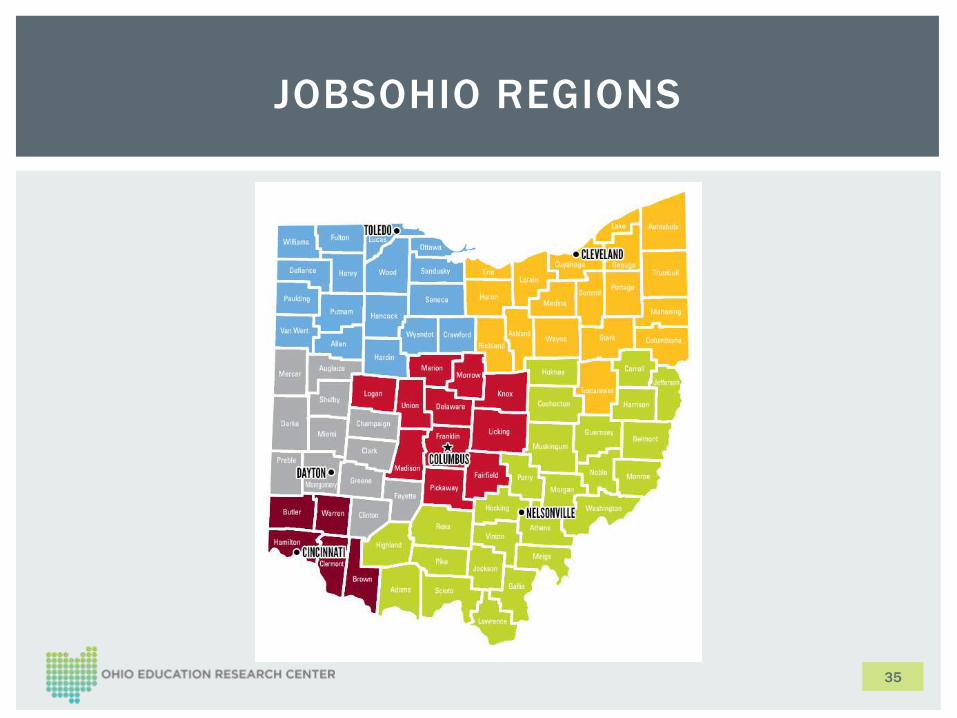
35
JOBSOHIO REGIONS

Employment Measures for quarters 3 through 8 prior to participation:
Employment Rate Percent of quarters employed
Conditional Earnings Average earnings for those quarter employed
Earnings Trend Slope of trend in earnings
Earnings Variation Variation in earnings
Employers per Quarter Average number of employers per quarter
Dip Measures:
Earnings Dip Categorical variable identifying earnings dip (quarter 1 or 2 is more than
20% less than any quarter through quarter 8 prior)
Quarter of Dip Number of quarters prior to participation that the dip occurred
Percent of Earnings Percent of pre-dip earnings that the dip represents
36
EMPLOYMENT CREATED VARIABLES
(Hollenbeck et al., 2005)