working paper series - ecineq · working paper series inequality in developing economies: the role...
TRANSCRIPT

Working Paper Series
Inequality in developing economies: The role of institutional development Joshy Easaw Antonio Savoia
ECINEQ WP 2009 – 121
ECINEQ 2009-121
August 2009
www.ecineq.org
Inequality in developing economies: The role of institutional development*
Joshy Easaw University of Bath
Antonio Savoia†
University of Reading and Universitá di Salerno
Abstract
In the present paper we study the distributive impact of institutional change in developing countries. In such economies, economic institutions, such as property rights systems, may act to preserve the interests of a rich minority, but this depends crucially on the level of political equality. For example, dominant classes can control key-markets, access to assets and investment opportunities, especially if they enjoy disproportionate political power. We test this hypothesis using cross-section and panel data methods on a sample of low- and middle-income economies from Africa, Asia and Latin America. Results suggest that: (a) increasing the protection of property rights increases income inequality; (b) such an effect is larger in low-democracy environments; (c) a minority of countries have developed a set political institutions capable of counterbalancing this effect. Keywords: Inequality, developing economies, institutions, property rights, democracy JEL classification: O15, O17, D70
* The paper has benefited from comments on an earlier draft by Adalgiso Amendola, Mark Casson, Guido Cozzi, Marina Della Giusta, Roberto Golinelli, Branko Milanovic, and Kunal Sen. We must finally thank participants at the 2007 ECINEQ meeting and seminar participants at the Institute of Development Policy and Management at the University of Manchester for helpful comments on previous drafts. All errors are our own. † Corresponding author: [email protected]
2
1. Introduction
The distribution of resources and the rules that govern the economy are central to
economic development. Western economies have long undergone economic and political
transformations that have delivered a high level of income per capita and nearly uniform
levels of socially-acceptable income inequality. In developing economies, instead, economic
performance reflect institutional arrangements – created in colonial times and inherited by
postcolonial states – that were ill-suited for development. Acemoglu, Johnson and Robinson
(2005) summarise this research: they trace the primary cause of economic backwardness to
the way economic and political institutions in developing economies function. Similarly,
Besley and Ghatak (2009) emphasise the importance of property rights. However, while the
effects of institutions on national income have been extensively researched, their
distributional impact has not received adequate consideration so far.
An assessment of this impact is particularly relevant for developing economies.
Indeed, a steady concentration of income is often one of the main characteristics of these
economies. Moreover, they have recently started further institutional reforms, which is an
ongoing process. From the political point of view, an increasing number of countries have
tried to move away from authoritarian politics and unaccountable governments and started
experimenting with forms of procedural democracy. Especially in the post Cold War era when
electoral competition was introduced. On the economic front, production and exchange have
mimicked those of richer economies, such as increased privatisation and deregulation. These
reforms and the way they relate to historical institutional structures must have an impact on
efficiency. But what are the effects on equity? We do not know a great deal about the
distributional consequences of institutional change.
Principles of economics of inequality suggest that the possibility of acquiring factors
of production, the right to any benefit from them and initial endowment (as well as ability to
increase one’s marginal productivity) determine each person’s amount of income (see
Champernowne and Cowell, 1998). Institutional and political processes affect this amount
because they mould the individual’s incentives and constraints the range of activities they can
undertake. Such processes set the rules that shape property relations and, consequently, the
rewards each production factor receives. Institutions affect taxation, wage-setting policies,
strategies that promote or hinder the acquisition of skills among different sectors of the
population and access into markets. Ultimately, all these elements relate to agents’ capability
to earn and appropriate income from the production factors they own, i.e. property rights
3
regimes. We refer to this set of economic institutions as the rules, both formal and informal,
defining and protecting private property which enhance the ability to appropriate returns from
ownership and use of factors of production.
In this paper we use both cross-section and panel data methods to investigate
empirically the effect of property rights on income inequality in developing countries. Such
institutions can exacerbate inequality if they are conceived to preserve or increase the
economic and political interests of privileged minorities. For instance, one’s property rights
can also be protected by weakening the risk of expropriation of productive assets via
controlling the political system, by erecting barriers to entry, or by setting favourable tax
regimes, as well as engaging in rent-seeking activities (see Acemoglu, 2008). In all these
cases, the resulting property rights may be inequitable. Unlike previous literature, we account
for the interaction between political and economic institutions. In particular, we highlight that
a situation where property relations are inequitable is more likely to occur in environments
where political power is disproportionately allocated to oligarchies. In developing economies,
an undemocratic power structure could prevent such economies from building an institutional
apparatus that can alleviate the concentration of income. These phenomena could be
prominent in many ex-colonies, where economic institutions could have led to high and
persistent inequality.
An assessment of the impact of economic institutions on income inequality is useful to
understand reforms aimed at creating investment incentives or at extending the economic
opportunities of low-income groups (for example, access to and control of factors of
production and assets or workers’ right to organise and bargain). The paper also provides
novel evidence on the relationship between political systems and economic inequality. The
standard argument would suggests that democratic politics may increase redistributive
expenditure. Democratisation, instead, could affect the level of income inequality ‘indirectly’
by changing the functioning of property rights systems.
This is consistent with recent literature on the determinants of inequality. Bourguignon
et al. (2007, pp.250-253) call for a systematic analysis of the effect of institutions, in the
current and future research agenda on the persistence of inequality. Bowles (2004) has coined
the expression “institutional poverty traps” to refer to institutional arrangements that engender
inequality.2 This paper also deals with the debate relating to the evolution of inequality
during the process of development. A perennial question in the study of income inequality is:
2 The role of institutions is emphasised also by Atkinson (1997), stressing the role of social customs and norms.

4
are there are any factors that lead inequality to describe an inverted-U pattern as output
increases (see, for example, Milanovic, 2000)? Recent literature suggests that the actual
trajectory of inequality could depend on institutional arrangements adopted by governments,
which distribute the gains of economic growth across the population (Acemoglu and
Robinson, 2002; Piketty, 2006).3 Finally, the paper contributes to the broader literature which
investigates the determinants of income distribution within and across countries, as suggested
by Atkinson (1997). For example, cross-national studies have emphasised the role of
democratisation, financial development and education (Li, Squire and Zou, 1998) and,
recently, the role of colonialism (Angeles, 2007) and factor rewards, especially labour’s share
(Daudey and García-Peñalosa, 2007).
The paper is structured as follows. In section 2 we discuss the hypotheses to be
investigated empirically. Section 3 formulates the empirical model to be tested and we also
introduce the data used. The results are presented in section 4. The final section summarises
and discuss the implications of the empirical results.
2. Inequality and institutions: theoretical and empirical issues
2.1 Theoretical issues
Does improved property rights protection increase or decrease inequality? In principle,
the effect could take either sign. We should know in whose favour such rules work or whose
property rights are protected. Some literature outlines the following causal mechanism. The
presence and exploitation of factor endowments in many colonial economies, such as labour
abundance, natural resources and soil suitability for cash crops with substantial economies of
scale, explain extreme level of historical inequality in income, human capital and political
power. Such historical conditions allowed colonial elites to establish an institutional
framework that secured the investment returns for the few, so reinforcing income inequality
over time. This state of affairs did not change after the end of colonialism. Hence, the
functioning of laws pertaining to property rights and economic relationships, since
independence, contribute to the persistence of inequality. Angeles (2007) shows that the
presence of a European minority is associated with production systems aimed at exploiting
native populations (and is a robust predictor of current income inequality in pooled OLS
3 Acemoglu and Robinson (2002) formalised the idea that inequality could be the result of institutional transformation which encourage redistribution and is forced by the threat of social unrest. Sustained social mobilisation channelled Western economies on an inverted-U pattern, while some economies in sub-Saharan Africa and Latin America have experienced an ‘autocratic disaster’.

5
regressions). For example, in South Africa, the British and Afrikaners dominated the
agricultural and mining resources prohibiting the acquisition of land by natives (and political
power passed to European descendants following independence). Jolly (2006) observes that in
developing economies inequalities of landholdings, mine or forest resources are high because
at the time of independence constitutions often prevent property disputes (or only allow this if
there is to be a full compensation). In other cases, property rights (for example, mining
royalties) have been allocated either through political connections or even by subverting the
political system (such as, mounting a coup). Engerman and Sokoloff (2005) went further to
document how certain forms of inequitable institutions arose in many Latin American and
sub-Saharan African economies. In order to exploit their natural resources, labour abundance
and soil fertility, colonisers established exploitative institutions in many areas of Latin
America and the Caribbean. Property relations created and perpetuated the concentration of
income and wealth in economies that were rich in minerals or had suitable soil for large-
plantation commodities for the production of cash crops (e.g. sugar, coffee, and bananas)
using forced labour. Examples of these are found in Brazil, El Salvador, Guatemala and the
Caribbean islands, but also Mexico, Peru and Bolivia.4 Morrisson (2006) has showed that the
existence of dualistic structures in colonial and postcolonial Senegal and Kenya has kept
inequality high, while Ghana had taxation and labour market structures such that inequality
was low. In some other areas of sub-Saharan Africa, the functioning of agricultural markets
and the extraction of natural resources was distorted in the favour specific groups, primarily
the political and economic elites and their clients in the urban areas. Small-scale farmers were
‘expropriated’ of their crops which were sold at prices below the market level through state
marketing boards, to whom they were compelled to sell (Bates, 1988). The presence of
natural wealth, whether controlled by a state-owned or private enterprise, co-exists with
systems that extract rents (Milanovic, 2003).5
Following this literature, the access to and the reward of production factors were
4 This also created societies where political power ensured the elite had a disproportionate influence on the economy. The share of the voting population in the region has historically been very low, franchise was granted under wealth and literacy requirements, and lack of secrecy of vote was also a recurring feature of political systems (Engerman and Sokoloff, 2005). 5 Such phenomena may not be so pervasive in south and east Asia (quite exceptional is the case of Taiwan and South Korea, where land education inequality decreased substantially). Acemoglu and Robinson (2002) define ‘East Asian miracle’ phenomena of ‘growth with equity’ in Asia (as opposed to the ‘growth with inequality’ in Latin America and the recent increase in economic inequality in Western Countries, e.g. Britain and USA). Bardhan (2005) observes that cultural values in India and China translated in formal and informal rules that made such societies relatively more egalitarian (e.g., the absence of law of primogeniture has contributed to keep low land inequality). Perhaps not negligible is also East Asia’s reduced importance of cash crops and mineral resources, exceptions being plantation economies such as Sri Lanka and The Philippines.

6
created to protect the interests of an influential minority. Hence, we are going to test the
hypothesis that property rights regimes contributed to increase inequality. Before turning to
this, we have to discuss the role of political systems and their interplay with economic rules.
Extending the franchise is expected to deliver a reduction in inequality. If the median
voter shifts the income distribution below the mean income one should expect higher taxation,
and more redistributive policies. The amount will be proportional to the level of inequality
prior to democratisation, that is the initial number of poor. Yet, such mechanisms are not
consistent with the experiences of developing economies. In fact, econometric evidence does
not find a robust correlation between the two variables (see, for a recent review, Gradstein and
Milanovic, 2004). Are there any other types of redistributive effects? The redistributive role
of democratisation could be ‘indirect’, rather than directly through public expenditure. Here,
we consider and test the idea that a democratic political system could be a necessary condition
to change property relations either weakening the property rights of the elite or strengthening
the property rights of the poor. Examples of this could cover wage-setting policies to
regulating entry into markets. Rodrik (1999) and Robinson (2001) have argued, and provided
evidence, that democracies redistribute by increasing the wages share through reforms of
labour market institutions; e.g. workers have the right to organise in order to increase their
bargaining power, there are higher minimum wages and more favourable hiring and firing
practices. Acemoglu (2008) has suggested that the form that property rights in democratic
environments works differently than in oligarchic ones. In the latter the dominant economic
elite has enough political power to control key-markets by erecting entry barriers (e.g.
through direct regulation, but also obtaining subsidised credit or inputs) as well as protecting
themselves from expropriation and from redistributive taxation and thus protecting their own
property rights. Unlike democratic societies, oligarchic societies provide limited access to
property rights and worse distributional outcomes. Developing economies might have, in
most cases, established property rights that reflect the unequal balance of political power. If
this is the case, economic inequality is also explained by the interplay of political and
economic institutions. Economic institutions grant narrow or broad access to property rights
according to the degree of inclusiveness of the political system. Hence, the distributional
effects of property rights can be different at different stages of democratisation.
2.3 Empirical literature
Cross-national investigations on the determinants of economic inequality in
developing countries are sparse (an exception is Milanovic, 2003) and the role of economic
7
institutions has not been systematically addressed. Perhaps this is, in part, due to the limited
availability of inequality data in developing economies. There are, however, few recent
studies that consider the distributive impact of institutions in the broader geographical
context. The first test was provided in Chong and Calderon (2000), taking a cross-sectional
approach. With a sample covering 70 developed as well as developing countries, results show
that institutional quality measured by a composite index based on political risk data by
International Country Risk Guide (ICRG) and the Business Environmental Risk Intelligence
(BERI)6, displays a quadratic relationship with income inequality. For poor economies
institutional quality is positively linked with income inequality, but the inverse holds for rich
economies. Another cross-section study, on the other hand, finds a statistically insignificant
impact for institutions with OLS regressions using a linear specification (Sylwester, 2004).7
Chong and Gradstein (2007) study, using a panel of more than 100 countries and controlling
for unobserved heterogeneity, the correlation between income inequality and a number of
institutional indicators, capturing democratic and institutional stability aspects, and find
evidence for ‘better’ institutions reducing income inequality.8 Similarly, Carmignani
(forthcoming), estimating a system aimed at explaining the amount of redistribution (in a
panel of countries), finds that weaker institutions (measured also with a property rights index)
also have a distributional impact, raising income inequality.
Empirical research is limited and has tended to treat institutions as an indistinct body,
while it could be insightful to disentangle the impact of political and economic institutions.
Political systems have a distinct role from economic institutions. Democracy can directly
affect economic inequality but it also moulds economic institutions by including or excluding
the citizens from the political process which builds economic systems. Hence, property rights
issues could be linked to the nature of the political regime. While in developed economies
institutions are stable and consolidated, in less developed economies institutional failures are
by far more frequent and extensive. After all, the issue of institutional reform, especially
property rights clarity, is high on the agenda of development scholars and policy makers alike.
Here, at least in part, we intend to fill these gaps.
6 From ICRG: (i) ‘risk of expropriation’; (ii) ‘repudiation of contracts by government’; (iii) ‘law and order tradition’; (iv) ‘corruption in government’; and (v) ‘quality of bureaucracy’. From BERI: (i) ‘contract enforceability’; (ii) ‘nationalization potential’; (iii) ‘bureaucratic delays’; and (iv) ‘infrastructure quality’. 7 On a sample of ex-colonies (including USA, Canada, Australia and New Zealand), and using a composite index of institutional development (consisting of political rights and civil liberties, political stability, government effectiveness, limits to government regulation and adherence to the rule of law). 8 They use Freedom House political rights and civil liberties indices; and ‘rule of law’, ‘corruption’, ‘government stability’, ‘bureaucratic quality’ and ‘democratic accountability’ from ICRG.

8
3. Methodology and data
Regressions based on cross-section averages can be a suitable tool to test relationships
whose mechanisms are long run characteristics, as argued in Easterly (2007).9 In this case,
how political and institutional development contributed to present-day inequalities (e.g. post-
colonial, or even colonial, history). Hence, an empirical counterpart to the foregoing ideas can
take the following functional form: '
, , 1 0 1 , , 1 2 , , 1 , , 1 1 (1)i T T i t t i t t i t t i t tIneq I Q Xβ β β φ ε− − − − , , −= + ⋅ + ⋅ + ⋅ +
Where,, , 1i T TIneq − is the average inequality index of interest for country i between the end of
the sample period, T, and T-1. , , 1i t tQ − is a measure of economic institutions, i.e. clarity of
property rights, for country i between times t and t-1, with t<T-1. The choice of period
attenuates problems of reverse causality that might cloud the inference about property rights.
Similarly, the level of political democracy is , 1i t tI , − . In practice, a suitable response variable
can be Gini coefficient measured as the average of the available observations from 1991 to the
end of the sample period, while we use averages of democracy and of the available
observations of the property rights rating. The coefficient β1 and β2 can be interpreted,
respectively, as the long run effect of democratic and property rights consolidation on income
inequality.
, , 1i t tX − is a set (kx1 vector) of controls. Following Li, Squire and Zou (1998), we
control for education, land inequality and the level of financial development (a set of
inequality determinants whose effects, as we shall test, could also be depending on the level
of democratisation). The average level of education provides a greater supply of skilled
labour, which tends to reduce the skill premium and hence reduces inequality in the
distribution of labour incomes. Land inequality and the level of financial development are
capturing assets inequality: how difficult it is to access credit for the poor, lacking collaterals.
We also control for regional dummies, to capture unobserved regional effects; other long-run
determinants of inequality, which include the level economic development – measured by
GDP per capita, to capture economy-size effects – and its square, to capture Kuznets curve-
type effects; and inflation, which hits the poor harder, as they are normally unable to hedge
against it. Equation (1) also conditions on the suitability of land for wheat versus sugarcane,
which, as elaborated by Easterly (2007), is exogenous and picks the historical variation of
inequality. Finally, , , 1i t tε − is the error, capturing all other omitted factors.
9 Contributions following this strategy are Chong and Calderon (2000) and Daudey and García-Peñalosa (2007).
9
Following from the foregoing discussion, inequality can be modelled allowing for
interaction effects:
( ) ', , 1 0 1 , , 1 2 , , 1 3 , , 1 , , 1 , , 1 1 (2)i T T i t t i t t i t t i t t i t t i t tIneq I Q Q I Xβ β β β φ ε− − − − − − , , −= + ⋅ + ⋅ + ⋅ ⋅ + ⋅ +
Equation (2) admits that the estimated parameters can be heterogeneous across the population,
and interaction terms are one way to account for that. Hence, the partial effect of property
rights institutions is now conditional on democratic consolidation:2 3 , , 1i t tIneq Q Iβ β −∂ ∂ = + ⋅ .
In particular, β2 is the impact of one unit change in property rights institutions on income
inequality when democracy is zero. We expect that stronger property rights protection
increases income inequality, β2 is positive. Such effect is moderated by increased
democratisation as this process modifies the functioning of property rights; therefore, β3 is
expected to take a negative sign. However, from estimating (2) alone we cannot observe if
economic institutions have a significant effect on inequality when democracy is not zero,
although all these cases can be very informative. Thus, for a full interpretation of the partial
effects, we have to plug in the values of democracy and then recalculate standard errors and
significance of the resulting marginal effect.
Relying on the cross-section approach – as in (1) and (2) – would enable us to tell
which countries adopt inequitable economic institutions based on choices on the political
structure rooted in (recent) history. And it is consistent with the literature, which tries to
explain long run phenomena. The potential consequence of averaging the variables over years
is that it tends to obscure episodes of political and institutional change within countries which
should be reflected in a subsequent change in the distribution of resources. For example, such
approach does not capture the likely effects of episodes of political reforms towards
democratisation over time or, vice versa, of reversions to authoritarianism (e.g. some Latin
American nations). If this is the case, one could complement the evidence from cross-section
regressions based on averages with a panel approach, as it can validate such results if we
concentrate on the within variation. A causal link between property rights and inequality
suggests that we should also see a relationship between changes in property rights and
changes in income inequality. Put it differently, we should be able to ask: does income
concentration (with its other characteristics held constant) become higher when its legal
system increase private property protection? To answer such question one has to investigate
whether the cross-sectional relationship between the variables of interest disappears when
country fixed effects are included in the regression, thus removing the long-run determinants
of both property rights protection and inequality that are time-invariant. Furthermore, we can
minimise the confounding effect of omitted variables by controlling for common trends, e.g.

10
the decades since the late 1970s have witnessed world-wide economic and political shocks.
In practice, such approach could not be as effective as expected. The causal
mechanisms, and the variables under scrutiny, have long run features and evolve slowly over
time. The available data structure, as we shall discuss below, is not the best-suited for this
type of analysis. The time dimension of the available panel of developing economies is such
that, while property rights and democracy show enough variability over time, inequality tends
to change a lot across countries, but little over time. Hence, procedures that remove the effects
of time invariant factors also remove most of the variation the one wants to explain.
Notwithstanding, we attempt to investigate the short run behaviour of the relationships under
scrutiny by exploiting within country variation, even though, as we shall argue, results should
be treated with caution. This requires estimating the relationships of interest using Fixed
Effects (FE) estimator, which is entirely based on time-series variation (e.g. as captured by
deviations from individual means, Within estimator).
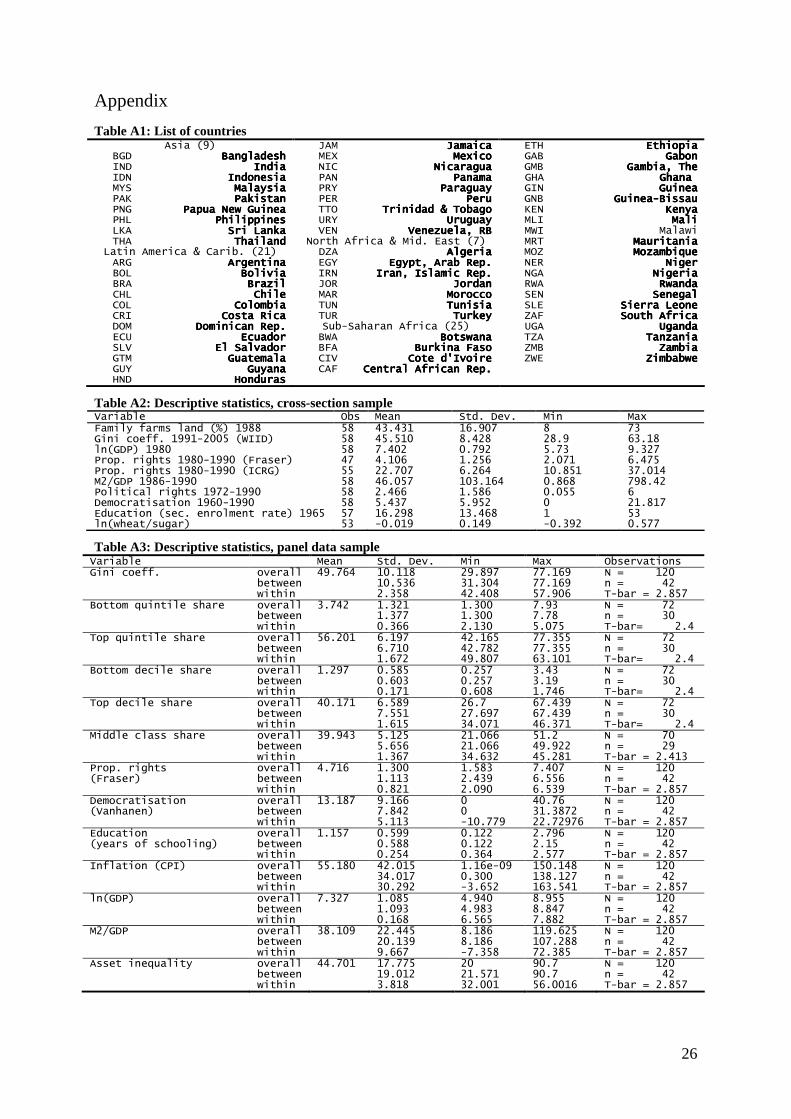
3.1 Data
This study uses aggregate data at country level. The sample is composed of sixty-three
developing countries (which are not transition economies), defined as low- and middle-
income economies in South and Central America, sub-Saharan Africa, North Africa and the
Middle East and Asia. The data appendix provides a list, divided by regions.
Our preferred measure of protection of private property rights is extracted from the
Index of Economic Freedom of the Fraser Institute. In its recent denomination, Legal
Structure and Security of Property Rights is a continuous variable ranging between 1 and 10;
a higher score corresponds to a better protection of private property rights. As far as we are
aware, it is available over a longest time span – having been recorded, every five years, from
1970 until 2000 (and every year from 2001 on) – also for a large number of developing
economies. This makes it crucial to conduct panel data analysis. It is a subjective index:
expresses experts’ views – from the business community and academia – on how secure they
consider investments to be in a given country, according to a number of dimensions (they do
not tell us about the ‘breadth’ of private property rights – i.e. the allocation of such rights). 10
10 It has been assembled over the years from different sources – essentially, but not exclusively, the International Country Risk Guide, the Business Environment Risk Intelligence, and the Global Competitiveness Report – and has undergone some changes in the definition, although the underlying concept stayed unchanged (see, for details, the various Economic Freedom of the World Reports, e.g. Gwartney and Lawson, 2007). It includes: (a) Judicial independence (from GCR): the judiciary is independent and not subject to interference by the government or parties in dispute (This component is from the Global Competitiveness Report’s question: “Is the judiciary in your country independent from political influences of members of government, citizens, or firms?

11
As a democratisation measure, we utilise the database by Vanhanen (2000), which is a
continuous variable – taking values greater or equal to zero – based on objective assessment.
It is computed (by multiplying and dividing by 100) from equally weighting two indices:
competition and participation.11 It is a ‘parsimonious’ index, which captures few necessary
attributes of procedural democracy. This feature is appealing, as makes the index free from
judgment on the attributes that political democracy should have (e.g. some analysts consider a
market-based economic system and protection of private property as defining attributes).
To measure income inequality, our preferred index is the Gini coefficient. Although
UNU-WIDER (2007) offered a higher quality dataset, the World Income Inequality Database
(WIID), one must address the well-known comparability problems that exist when using
secondary datasets of income inequality. Hence, we had to select and adjust the available
observations to make the observations as consistent as possible to obtain the Gini coefficient
of disposable household income.12
No—heavily influenced (=1) or Yes—entirely independent (=7).” See World Economic Forum, Global Competitiveness Report (various issues), at http://www.weforum.org/en/initiatives/gcp/index.htm). (b) Impartial courts (from GCR): a trusted legal framework exists for private businesses to challenge the legality of government actions or regulation (this component is from the Global Competitiveness Report’s question: “The legal framework in your country for private businesses to settle disputes and challenge the legality of government actions and/or regulations is inefficient and subject to manipulation (=1) or is efficient and follows a clear, neutral process (=7).” (c) Protection of property rights (from GCR): this component is from the Global Competitiveness Report’s question: “Property rights, including over financial assets are poorly defined and not protected by law (=1) or are clearly defined and well protected by law (=7).” (d) Military interference in the rule of law and the political process (from ICRG); This component is based on the International Country Risk Guide’s Political Risk Component Military in Politics: “A measure of the military’s involvement in politics. Since the military is not elected, involvement, even at a peripheral level, diminishes democratic accountability. Military involvement in government might stem because of an actual or created internal or external threat. Such a situation would imply the distortion of government policy in order to meet this threat, for example by increasing the defence budget at the expense of other budget allocations. In some countries, the threat of military take-over can force an elected government to change policy or cause its replacement by another government more amenable to the military’s wishes. A military takeover or threat of a takeover may also represent a high risk if it is an indication that the government is unable to function effectively and that the country therefore has an uneasy environment for foreign businesses. A full-scale military regime poses the greatest risk. In the short term a military regime may provide a new stability and thus reduce business risks. However, in the longer term the risk will almost certainly rise, partly because the system of governance will be become corrupt and partly because the continuation of such a government is likely to create an armed opposition.” (e) Rule of law (from ICRG, see above): it is defined as integrity of the legal system, i.e. strength and impartiality of the legal system and popular observance of the law. 11 Competition is calculated by subtracting the percentage of votes won by the largest party from 100 (i.e. the smaller parties’ share of the votes cast in parliamentary or presidential elections). If data on the distribution of votes are not available, this variable is calculated on the basis of the distribution of seats in parliament. Participation is calculated as the share of population that actually votes as a percentage of total population. 12 From the version 2b of the WIID, we first delete all observations for which the underlying notion of income or earnings is unknown or incomplete (‘quality 4’ data, the lowest ranking), and thus we only use the top 3 rankings. To maximise the comparability over time (within each country), we have adopted the following procedure. Following a suggestion by Luis Angeles (to whom we are grateful), we formed a series for each country by keeping the observations coming from the same source and survey, which represented the majority of the observations for the country. In this way, we should be confident that Gini coefficients, quintiles and deciles coming from WIID are as comparable as possible – at least along the time evolution, which is crucial in panel models – because known and unknown methodological differences are potentially accounted for. Of course, this
12
Large and updated land inequality data have remained scarce. Nevertheless, Easterly
(2007) has recently suggested the use of the share of agricultural land occupied by family
farms – recorded every ten years from 1858 to 1998 – assembled from many different sources
by Vanhanen (2005), which is a proxy of land and asset inequality. In panel regressions, its
data points are too few to yield a meaningful sample size. However, we can exploit another
proxy for asset inequality. Despite some data quality issues, Castelló and Doménech (2002)
constructed measures of human capital inequality for a panel of 108 countries. Taking
attainment levels (average schooling years of the population aged 15 years and over) from
Barro and Lee (2001), they compute Gini coefficients and the distribution of education by
quintiles over five-year intervals from 1960 to 2000.
Our dataset is completed with the secondary enrolment rate by Barro and Lee (2001),
and some macroeconomic variables from the World Development Indicators (World Bank,
2007): annual inflation (consumer price index), GDP per capita, and the ratio of a measure of
money supply (monetary aggregate M2) on GDP, capturing the level of financial
development.
4. Empirical analysis and results
4.1 Cross-section evidence
Figure 1 plots the Gini-WIID average of the available observations from 1991 to 2000 and of
the democratisation index averaged over 1960-1990 – where the vertical and horizontal lines
are the averages of Gini index (at 45.52) and democratisation (at 5.44). The regression line
has a coefficient of 0.017, and a t-ratio = 0.11 (R-squared = 0.0002, 58 countries). The
regression line essentially overlaps with the mean. Hence, there seems to be weak correlation
holds if one assumes that there have been no changes in the methodology of the survey used to construct the series for each country – or if they occurred, they had little effect. However, this also means throwing away a great deal of information. For the majority of developing economies, we would end up with few data points. Then, each selected series have been supplemented with observations originated in other surveys (than the one with the majority of observations) only if at least income definition and the income sharing unit are equivalent, as well as the area and population coverage is most extensive. As indicated in the revision notes of the most recent version of the database manual (UNU/WIDER, 2007), for Latin American countries we kept the observations computed by SEDLAC, as they already display a good degree of harmonization. The procedure, as it is, ensures that inequality measures are as comparable as possible within each country, but leaves us with the problem that they are not comparable among different countries. This could result in a substantial error if one wants to compare developing countries among themselves. Hence, the next step is to amend the above series in a way that they become comparable across countries. Following the ‘old fashioned’ approach, major sources of incomparability across countries have been identified by introducing the dummies for gross income and earnings, expenditure and consumption, and person as a reference unit. Regressing the dummies against the observed data produces the correction factors to estimate the normalisation to Gini coefficient of disposable household income.
13
between the development of democratic systems and income inequality.
Figure 1 [about here]
Figure 2 [about here]
How do property rights correlate with income inequality instead? In figure 2, the scatter plot
of the Gini index against the property rights index (respective averages are 45.52 and 4.11) –
taken as an average of the available observations from the 1980s to 1990 – shows a moderate,
positive correlation, with an estimated coefficient of 1.621, t-ratio=2.02 (R2=0.061, 47
countries). However, when splitting the sample according to the mean (5.44) of the 1960-
1990 average of Vanhanen’s democracy index, we find that the slope can be quite pronounced
in countries below democracy average (dots), while in countries scores above such value
(squares), the slope of the regression line switches to negative. Figure 3 suggests that the
relationship between income inequality and protection of private property in developing
economies could be a nonlinear one. Cross-section results will document if this is the case.
Figure 3 [about here]
Table 1 reports the regression results. The dependent variable is income inequality
measured as the average of the available observations over 1991-2000. We first run an OLS
regression where the 1980-90 average of property rights and the 1960-90 average democracy
enter in linear form, together with the initial values of other determinants of income inequality
(taken in years available for most developing economies): land inequality, level of education,
financial development and GDP per capita (in log form). The property rights coefficient is
insignificant at the conventional levels. But the effect of political and economic institutions on
inequality could be more nuanced. When adding the Political rights-Property rights
interaction term, the result changes. Both the property rights coefficient, β2, and the
interaction term coefficient, β3, are highly significant. The goodness of fit improves. A linear
restrictions test of the joint significance of β2 and β3 rejects the null of both being zero at 1%
confidence level (also in all the remaining regressions). The third and fourth columns verify
that this is not the result of omitted variables, where the coefficients of interest are picking the
effect of historical or region-specific factors. Introducing regional dummies and the (natural
log of) wheat/sugar ratio, as proposed by Easterly (2007), to capture the historical conditions
for inequality as the suitability of land to sugar versus wheat cultivation, does not alter the
results.13 The fifth column re-estimates the model using robust regression methods,
confirming that outliers are not actually driving the key results, while the last two regressions
13 Based on FAO data, it is defined as log(wheat/sugar)=log[(1+share of arable land suitable for wheat)/(1+share
14
introduce alternative democracy and property rights measures and re-estimate the model using
OLS and robust regression.14 Utilising the Political Rights index by Freedom House and the
property rights index based on data from the International Country Risk Guide (produced by
Political Risk Services and available only from 1984 to 1997) does not affect our key results
(magnitudes are different due to different scales).
Table 1 [about here]
Perhaps the most interesting implications arise from the joint interpretation of
magnitude and sign of β2 and β3. Following the fourth model, β2 shows that a one point
increase in the property rights score triggers an increase income inequality Gini index of
2.166 points, when democracy scores zero. The ongoing system of property rights will
increase inequality, in autocratic regimes. Although empirically relevant (as six countries
score zero democratisation), this must be supplemented with an assessment when democracy
takes values greater than zero. In figure 4, we report the partial effects at the observed values
of the 1960-1990 democratisation index in the sample (continuous line, where each dot is the
country’s partial effect) and their statistical significance (95% confidence intervals, with a
dashed line). For the majority of the countries there is a positive and significant effect of
property rights of inequality (significant at least at 5% confidence level) and its value ranges,
approximately, from 1.2 to 2.2 Gini points for a one-unit increase in property rights, which
seems sizable (the Fraser property rights index has a standard deviation of 1.26).15 Figure 4
also shows that countries with more democratic political institutions are able to mitigate first,
and then to reverse the sign of the marginal effect from positive to negative, so reducing
inequality. A second group of countries falls in the region bounded between the two 5%
confidence lines of the graph, where the calculated marginal effect is statistically not different
from zero.16 Finally, only a handful countries seem to have created political systems such that
the partial effect of economic institutions is reversed and shows a negative sign. In this small
group of countries we find India, which is an established democracy. Uruguay, Venezuela and
of arable land suitable for sugarcane)]. 14 We perform Iteratively Reweighted Least Squares (IRLS), which works iteratively by first calculating a measure of influential observations (Cook’s distance) and excluding any observation for which such measure is greater than 1. Then it performs a regression, calculates case weights based on absolute residuals, and regresses again using those weights. Iteration stops when the maximum change in weights drops below a given tolerance level. We use the default 0.001. 15 Many countries falling in this group are Sub-Saharan African economies – e.g. Zimbabwe, Congo (Rep.), Tanzania, South Africa, Kenya, Zambia – also a few are Latin American countries belong to this group, e.g. Haiti, Panama, Chile, Paraguay and Nicaragua. Asian countries in this group are Indonesia, Pakistan and Bangladesh. 16 In particular, countries scoring a democracy level approximately equal to 4 (out of 21.82, the maximum) are sufficiently democratic to neutralise the inequality-worsening effect of property rights.
15
Costa Rica also lie in this area. However, the significance of the partial effects for such
economies (with more consolidated democracy) is marginal (10% level), at best.
Figure 4 [about here]
4.1.1 Robustness checks
We have experimented with a number of other controls: the square of per capita GDP
(to capture the likely existence of a Kuznets curve), inflation, and share of major religions.
We have also checked robustness to an alternative democratisation index, using Polity2index
(from Polity IV project). Sign and significance of the coefficients of interest do not change.
It is also important to investigate if our inference about the population of developing
countries might be affected by outlying observations or a few leverage data points so casting
doubt on the generality of the results. Therefore, we performed formal checks for influential
observations based on popular techniques that can identify countries with either a high
leverage or large residuals. We have calculated leverage measures based on hat values,
Cook’s Distance – considering points with high influence the ones higher than F0.5; k, (n-k) – and
the DFITS statistic, taking as a threshold 2 /jD F IT S k N> . We used them jointly to detect
countries that result as influential in more than one measure. Regressions excluding up to five
countries with highest values in leverage measures do not significantly change our results.
Next, we have checked to what extent influential observations affect the magnitude of
specific coefficients, property rights and its interaction with democracy, by calculating
DFBETA statistic. In this case too, results do not show any sensible change by excluding
from the regression the values that are above the cut-off 2jD FBETA N> . In particular,
countries that seems to be potentially influential are The Philippines, Ghana and Jamaica for
the property rights coefficient; and Venezuela for the interaction term coefficient. However,
once removed from the regressions, our estimates show little sensitivity.
Table 2 [about here]
Our last robustness test is to exclude each continent from the regression, in turn, to
check if any of them drives the results. Table 2 reports the results when using, for example,
Political Rights and ICRG property rights scores. The signs of the coefficients of interest do
not change, although one could have expected the results to be sensitive o the presence of
Latin American economies. Magnitudes (and significance) are sensitive to including Sub-
Saharan Africa in the sample. However, we estimate the same model with much less
information of data, which does result in a loss of precision.
16
4.2 Panel data evidence
Results based on cross-section averages suggest that strengthening property rights
increases income inequality, and this is particularly large in low-democracy environments. So
they also signal that political democracy could ‘indirectly’ affect the concentration of income
in a market economy, by affecting the functioning of the rules that protect and enforce
property rights, although only few developing economies have levels of democratisation high
enough to counterbalance such effect. The complement to this analysis is to investigate the
existence of a relationship between changes in property rights and changes in income
inequality, bearing in mind the methodological caveats on the effectiveness of panel data.
The panel has an unbalanced and unequally spaced structure, spanning from 1970 to
2004. We average our series over 5-year periods (1970-1974, 1975-1979 and so on). But
property rights scores (by Fraser institute), the proxy for asset (human capital) inequality, and
education data are originally recorded at the very beginning of every 5-year episode (1970,
1975 and so on). The descriptive statistics (reported in the appendix) show that the time
dimension of the key variables is short (average T is less that 3 for both inequality and
property rights). A significant part of the variation in property rights and democracy occurs
within countries (they exhibit similar standard deviations across and within countries).
Income inequality, instead, exhibits much variation across countries and little over time (in
line with previous literature, e.g. Li et al, 1998), meaning that sharp changes are unlikely. It is
a persistent phenomenon, which one has to control for.17 Hence, we recast the cross section
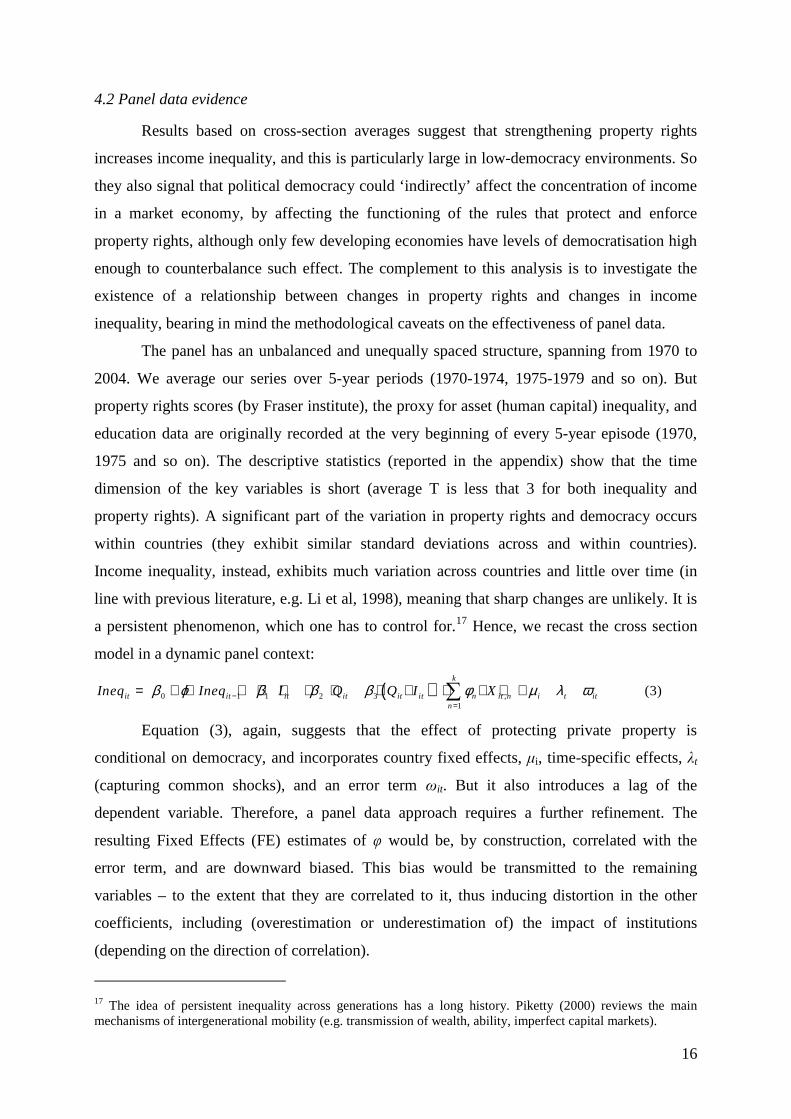
model in a dynamic panel context:
( )0 1 1 2 3 ,1
(3)k
it it it it it it n it n i t itn
Ineq Ineq I Q Q I Xβ ϕ β β β φ µ λ ω−=
= + ⋅ + ⋅ + ⋅ + ⋅ + ⋅ + + +∑
Equation (3), again, suggests that the effect of protecting private property is
conditional on democracy, and incorporates country fixed effects, µi, time-specific effects, λt
(capturing common shocks), and an error term ωit. But it also introduces a lag of the
dependent variable. Therefore, a panel data approach requires a further refinement. The
resulting Fixed Effects (FE) estimates of φ would be, by construction, correlated with the
error term, and are downward biased. This bias would be transmitted to the remaining
variables – to the extent that they are correlated to it, thus inducing distortion in the other
coefficients, including (overestimation or underestimation of) the impact of institutions
(depending on the direction of correlation).
17 The idea of persistent inequality across generations has a long history. Piketty (2000) reviews the main mechanisms of intergenerational mobility (e.g. transmission of wealth, ability, imperfect capital markets).

17
Since we are handling a small-T-large-N panel, the size of this bias will not be
negligible (as T increases, FE estimator is consistent). This problem can just as well be
handled using Generalised Method of Moments (GMM) estimation. In a panel context, lagged
values of the endogenous variables are valid instruments, as long as there is no (2nd order)
serial correlation in the disturbances. However, such procedures are data intensive and require
a fairly large number of consecutive observations: a standard that inequality, and property
rights, data does not accommodate. Assuming that the instruments are relevant and valid, the
resulting loss of degrees of freedom would be large when exploiting lags to use the available
moment conditions. We are constrained by the sample size instead. And only few countries
have as many as three adjacent observations for inequality.18
Notwithstanding, a dynamic approach is still feasible in this context. Several
suggestions have been proposed to correct for the bias of the FE estimator (see Baltagi, 2008,
pp.147-148). In particular, Bruno (2005) extends previous results on bias approximation for
finite samples by Bun and Kiviet (2003) to unbalanced panels. In its essence, this approach
first suggests an expression to measure the FE bias and, using Monte Carlo Simulations,
considers three possible nested approximations of the bias.19 We correct for the most
comprehensive one, B3 (in the original notation). This results in a Least Squares Dummy
Variable Corrected estimates (LSDVC), initialised by consistent estimates for dynamic
models, Anderson and Hsiao (1982) estimator (with instrument in levels), which subtract the
bias adjustments for each coefficient from FE estimates and apply bootstrapping to calculate
the standard errors of the adjusted coefficients.
18 Suppose, for example, we use the methodology proposed by Anderson and Hsiao (1982), i.e. to time difference (a simplified version of) equation (3) to remove country fixed effects:
'1 1 = + + + ( 4 )i t i t i t t i tI n e q I n e q y φ λ ω− −∆ ∆ ∆ ∆ ∆
Such transformation consumes the first observation in each wave. Then equation (4) cannot be estimated consistently by OLS. But, in the absence of serial correlation in the original residual, ωit (i.e., no second order serial correlation in ∆ωit), Ineqit−2 is uncorrelated with ∆ωit, so can be used as instrument for ∆Ineqit−1 to obtain consistent estimates. Similarly, yit−2 is used as an instrument for ∆yit−1. It is easy to verify that such procedure rapidly leads our sample size to less than eighty observations when instrumenting ∆Ineqit−1 with two lags (in levels). In addition, we find that the instruments do not always show satisfactory relevance. This is actually a well-known problem daunting the practice of dynamic panels. Estimators relying on first-differencing to eliminate unobserved individual-specific effects will generate, with persistent series (close enough to random walks), first-differences close to innovations, and it will be unlikely that available lags identify the parameters of interest. Intuitively, they tend to be correlated very little with first-differences. Econometric theory has rapidly developed estimators that exploit additional moment conditions (see Baltagi, 2008, 149-163). Although Anderson-Hsiao estimator leads to consistent estimates, it is not efficient, since, under the assumption of no further serial correlation in ωit, not only Ineqit−2, but all further lags of Ineqit are uncorrelated with ∆ωit, and can also be used as additional instruments. For example, Arellano and Bond (1991) develop a GMM estimator using all of these moment conditions. When they are all valid, this GMM estimator is more efficient than Anderson-Hsiao estimators. These and other estimators, that improved on them in recent years, are all the more infeasible. The literature is debating under what conditions one can add additional instruments, trading the loss of degrees of freedom with a potential increase in GMM efficiency (see Baltagi, 2008, pp.164-169).
18
4.2.1 Results
Table 3 estimates (3) by OLS, Within FE and, in the last column, by LSDVC. In
dynamic panel data models, OLS and FE are the ‘upper’ and ‘lower bound’ estimates of φ,
respectively. They serve the purpose of assessing the bias (in φ as well as β2 and β3) and allow
comparisons with the adjusted estimates. In our case, β2 and β3 are underestimated by OLS,
where lagged Gini is overestimated. The opposite holds for unadjusted FE estimates. LSDVC
estimates fall in between, as expected. The effects of property rights and democracy on
inequality are as expected, not just in the long run (as found in the cross-section estimates) but
also when looking at their changes, as captured by FE estimator.
Table 3 [about here]
In a dynamic context, the ‘short run’ (5-year) impact of property rights on inequality is
our usual partial effect as expressed by β2 and β3. This can now be distinguished from the long
run multiplier. If causal, this estimate would imply that a one-unit strengthening of private
property protection increases the ‘steady-state’ value of inequality by a cumulative, long run
effect of (β2+β3Iit)/(1 - φ). The bias-adjusted FE model suggests it is: (1.34-0.081*I)/(1-0.449),
which is equal to 2.431, when evaluated at democracy first decile (which is zero). The
corresponding effect for one standard deviation of property rights, instead, would be 3.35 Gini
points. This effect is relatively large, bearing in mind that the mean of inequality in
developing countries is 49.76. 20
Note also that, since Vanhanen’s democratisation minimum score is zero in a
nontrivial number of cases (31.24% cases), β2 (and its corresponding long-run effect) can
have an interpretation that is theoretically – as well as empirically – relevant for the ‘short
run’ impact of property rights on inequality. However, a full assessment of the partial effects
shall also look at when the moderating effect of β3 is taken into account, i.e., when
democratisation takes values greater than zero. Based on the estimates of the LSDVC
regression, in table 4, we have calculated significance and magnitude of the effects of
property rights evaluated at different points of the democracy distribution for the whole
sample of developing economies. We have substituted to β3 the median score of
democratisation, its 1st and 4th quartile, as well as its 1st and top decile scores.
Table 4 [about here]
There is a positive effect when the partial effect of property rights is evaluated at the
19 In particular, with an increasing level of accuracy: B1 = c1(T
-1); B2 = B1 + c2(N-1T-1); B3 = B2 + c3 (N
-1T-2). 20 Incidentally, the lagged inequality coefficient implies that, in a five-year period, developing economies close 55.51% of the gap between the ‘equilibrium’ value of inequality and its current value.

19
first decile and quartile of democracy (which is the same, as they are both zero) of 1.34
inequality points, for a one-unit increase in property rights. The effect of a one-standard
deviation change in property rights (1.583 points) could trigger an increase of 2.12 Gini points
in a five-year timeframe. The partial effect is still positive and marginally significant when
democracy is at its median. For a relevant number of countries in the sample, there is an
increase in inequality associated when property rights protection is greater. The partial effect
is still positive when democracy is measured at its 3rd quartile, but is insignificant. Finally,
when democracy at its top decile is plugged in, the partial effect changes its sign into a
negative one, but it is not statistically significant. This is interesting though. For it shows that
only when countries achieve a high level of democracy they have sufficiently representative
systems to reverse the inequality-worsening effect of property rights regimes, or at least
neutralise it. To put it another way, few countries seem to have equitable political institutions
such that the partial effect of economic institutions may be reversed and show a negative sign.
4.2.2 Further results on the role of democratisation
The type of political environment could also affect the access to production factors:
physical and financial capital, land, human capital. Developing democratic attributes –
franchise extension, freedom of association, government accountability – could influence the
functioning of the education system, the land and credit markets. Governments can be forced
by the electoral process to design land reforms and to regulate the credit market that would
thus become less concentrated. Human capital can become affordable to the have-nots, in
democracies, by promoting the acquisition of skills among different sectors of the population,
improving the quality of education systems and public health care (e.g. Robinson, 2001; Lake
and Baum, 2001; Baum and Lake, 2003). Therefore, in democracies, the extent of education,
land inequality and financial development can have a different impact than in
nondemocracies, improving the access to the factors of production for the poor.
Table 5 [about here]
To test if property rights if actually picking the effect such mechanisms, we have
interacted democracy with our proxy for asset inequality, financial development and
education. We expect that the effect of education and financial development reduce income
inequality, such effects are stronger in more democratic systems; the effect of asset inequality
increases income inequality, but this effect is weaker in democracies. Results are reported
table 5, where we repeat the same exercise as in table 3, when including all the hypothesised
interaction terms of democracy. We would expect that the effect of education and of financial
20
development reduces income inequality, and such effects should be stronger in democracies.
But there is no evidence that democracy has an effect through the functioning of education,
financial development, and the distribution of assets. The only channel is by influencing the
functioning of property rights rules as the only significant interaction term of democracy is
the one with property rights.
We have experimented with other democracy data – e.g. Polity IV, using the Polity2
variable – obtaining similar results. As a robustness check, tables 3 and 5 regressions have
also been estimated when excluding, in turn, the continents from the regression. Signs stay as
expected in all cases. However, when excluding Latin American and Asian countries, our
coefficients of interest loose significance at the conventional levels. However, it must also be
said that the sample size drops (sharply) to 64 and 86 observations respectively. Hence, it is
difficult to tell if Latin America or Asia are crucial for the results because of their relevance to
the hypotheses under investigation or simply because we have a loss of degrees of freedom. 21
4.2.3 A closer look at the distribution of income
The results from a dynamic specification can also be analysed for different segments
of the distribution of income (table 6): the share of income accruing to the bottom and the top
quintiles and deciles as well as the share of income accruing to the three middle quintiles. We
find that, in the absence of democracy, property rights institutions increase the share of
income of the upper classes, and decrease the share of the middle class (the sum of the three
middle quintiles). This effect should be eroded when democracy increases. Finally, there is no
evidence of property regimes depressing the share of income accruing to the bottom quintile
and deciles, which is interesting because it is suggestive of the effects of institutions on
poverty. The message is that, in the absence of political equality, economic institutions make
the upper classes richer while leaving the lower classes trailing behind.
Table 6 [about here]
We have also extended the results of table 5 to the case of multiple interactions of
democracy, to check if they might be affecting specific classes. The same observations of the
foregoing discussion remain valid.
21 Two further remarks are in order. Measurement error, as the discrepancy between our institutional indicators and the ‘true’ concept of institutions we would like to capture, could affect both property rights and democracy. If the noise can be approximated by classic errors in variables assumption (measurement error is uncorrelated with the true variable we would like to observe), this is a source of attenuation bias. Therefore, it stacks the odds against our results, implying that estimates of the partial effect of property rights are conservative. Secondly, a brief remark on endogeneity is due. Income inequality and property rights simultaneously affects each or they could be linked over time by a feedback process. Perhaps it could not be a concern as we find no evidence of 2nd-order serial correlation in the residuals, suggesting there may be no feedback from inequality to institutions.

21
4.3 Discussion of results
Fixed Effects evidence confirms our previous cross-section results and shows that
positive changes in property rights protection are associated with a change in the same sign of
income inequality. Moving towards a more democratic political system can counteract this
effect. Hence, strengthening property rights regimes can increase the concentration of income
in the hands of the few, especially in countries with poor levels of political equality. A closer
look at distribution of income reveals that property rights increase the income of top quintile
and decile, and decrease the middle class share. An increase in democratisation would
counterbalance this, while we have weak evidence that property rights affect the share of
bottom quintile and decile. The role of democracy seems to be an ‘indirect’ one, working
only through the property system. In fact, we find no evidence that democracy affects
inequality by moderating the effect of financial development, education or forms of asset
inequality.
Taken together, cross-section and panel data results show an interesting empirical
regularity, which is robust to the extent that the effect of property rights does not result from
the omission of any regional fixed effect, historical or country-specific factor (as well as
common shocks). We find that economic institutions have a distributional impact in
developing economies. But such impact is conditional on the level of democratisation.
However, one should not be tempted to make stronger claims. Since cross-section regressions
do not control for country and time effects, FE estimator is, in principle, an effective
complement to cross section evidence, but it also removes all the important variation in
income inequality. In addition, the limited sample size does not allow to assess issues of
robustness and, more importantly, to address endogeneity as one should want to.
5. Summary and conclusions
This paper has tried to bring together two hypotheses. First, economic institutions can
have a direct impact on income distribution. Second, the extent to which political power is
shared among citizens matters for the functioning economic institutions, thus making their
impact different at different stages of democratisation. Taken together, the two hypotheses are
complements and express the idea that both political and economic rules are important for
income inequality.
We test both hypotheses by estimating the effect of property rights regimes and
political democracy on income inequality on a sample of developing countries. Using cross-
section and panel data techniques, we estimate a model that embodies the possibility of
22
interaction between political democracy and property rights measures. We find that property
rights significantly increase the level of income inequality in the vast majority of developing
countries, especially in low-democracy political environments. Suggesting that institutions in
these economies tend to serve the interests of a minority. The inequality-increasing effect may
be counterbalanced only in systems which are able to develop sufficiently inclusive political
institutions. As the democratisation process unfolds, this effect should be reduced, albeit to a
limited extent, implying that more political equality modifies the functioning of institutions so
to ease economic inequality. The role of democracy seems to be an ‘indirect’ one and is
channelled only through the property rights system. In fact, we find no evidence that
democracy affects inequality by moderating the effect of financial development, education
and asset inequality.
Our results seem to support the view that, in the last decades, institutional
arrangements in most developing countries have worked according to the interests of
dominant groups, thereby not granting opportunities to lower classes. A limitation of our
analysis is that it is not able to assess the specific channels through which property rights
affect inequality. This remains at speculative level – e.g. oligarchies’ rent-seeking behaviour
and control of key markets – and perhaps deserves further investigation.
The effect of inequality on development has attracted a lot of attention again since the
1990s. Recently, a World Development Report (World Bank, 2005) has argued that inequality
hinders development as it prevents the poor from being part of the economically active
population and restricts the equality of opportunities for some members of the society so
diverting resources from investment. The relationships we have identified are relevant in the
analysis of the inequality-development relationship. They flag the importance of institutional
issues and might lead to some interesting policy indications. Even when stimulating
investment, property rights systems could also harm economic activity in the long-run, if
inequality reaches socially unsustainable levels. When designing reforms aimed at
strengthening investment incentives, the distributional consequences of institutional change
cannot ignore issues of political equality either (and its consolidation within the political
system). The likely outcome could be attractive: getting economic institutions right – property
rights, in particular – could deliver both efficiency and equity.
23
References
Acemoglu D. and Robinson, J.A. (2002), “The Political Economy of the Kuznets Curve”, Review of Development Economics, 62(2): 183-203
Acemoglu D., (2008), “Oligarchic vs. Democratic Societies”, Journal of the European Economic Association, March, 6(1):1–44
Acemoglu D., Johnson S. and Robinson, J.A. (2005). “Institutions as the Fundamental Cause of Long-Run Growth”, in Aghion, P. and Durlauf, S. (eds.) Handbook of Economic Growth, vol. 1A, ch. 6, Amsterdam: North Holland
Anderson T. W. and C. Hsiao, (1982), “Formulation and Estimation of Dynamic Models Using Panel Data”, Journal of Econometrics 18: 570–606.
Angeles L., (2007), “Income Inequality and Colonialism: How Much Does History Matter?”, European Economic Review, 51: 1155-1176
Arellano M. and S. Bond, (1991), “Some tests of specification for panel data: Monte Carlo evidence and an application to employment equations”, Review of Economic Studies, 58: 277-297
Atkinson A.B., (1997), “Bringing Income Distribution in from the Cold”, The Economic Journal, 107: 297-321, March
Baltagi B.H., (2008), Econometric Analysis of Panel Data, Wiley, 4th edition
Bardhan P., (2005), “Institutions Matter, but which ones?”, Economics of Transition 13(3): 499-532
Barro R. J. and Lee J. W., (2001), “International data on educational attainment updates and implications”, Oxford Economic Papers, 3: 541-63; the working paper version is available on line at http://www.cid.harvard.edu/ciddata/ciddata.html
Bates R.H., (1988), “Governments and Agricultural Markets in Africa”, in Bates R.H. (ed), Toward a Political Economy of Development: a Rational Choice Perspective, University of California Press
Baum M.A. and Lake D.A., (2003), “The Political Economy of Growth: Democracy and Human Capital”, American Journal of Political Science, 47(2): 333-347
Besley T. and Ghatak M., (2009), “Property Rights and Economic Development”, Chapter for the Volume V of the Handbook of Development Economics edited by Dani Rodrik and Mark Rosenzweig, February
Bourguignon F., Ferreira F. and Walton M., (2007), “Efficiency, Equity and Inequality Traps: a Research Agenda”, Journal of Economic Inequality 5: 235-256
Bowles S., (2004), “Institutional Poverty Traps”, chapter 5 in Bowles S., Durlauf S.N. and Hoff K. (eds.), Poverty Traps, Princeton University Press
24
Bruno G.S.F., (2005), “Approximating the bias of the LSDV estimator for dynamic unbalanced panel data models”, Economics Letters, 87: 361-366
Bun M.J.G. and Kiviet, J.F., (2003), “On the diminishing returns of higher order terms in asymptotic expansions of bias”, Economics Letters 79, 145–152
Carmignani F., (forthcoming), “The Distributive Effects of Institutional Quality when Government Stability is Endogenous”, European Journal of Political Economy
Castelló A. and Doménech R., (2002), “Human Capital Inequality and Economic Growth: Some New Evidence”, The Economic Journal, 112: 187-200; available at: http://www.res.org.uk/economic/datasets/readmefile/march02/vol112iss478.asp
Champernowne D.G. and Cowell F.A., (1998), Economic Inequality and Income Distribution, Cambridge University Press
Chong A. and Calderón C., (2000), “Institutional Quality and Income Distribution”, Economic Development and Cultural Change, 48: 761-786
Chong A. and Gradstein M., (2007), “Inequality and Institutions”, Review of Economics and Statistics, August, 89(3): 454–465
Daudey E. and Garcia-Penalosa C., (2007), “The Personal and Factor Distributions of Income in a Cross-Section of Countries”, Journal of Development Studies, 43(5): 812-829
Easterly W., (2007), “Inequality Does Cause Underdevelopment: Evidence from New Instruments”, Journal of Development Economics, 84: 755-776
Engerman S. L. and Sokoloff K. L., (2005), “Colonialism, Inequality and Long-Run Paths of Development”, NBER Working Paper 11057
Gradstein M. and Milanovic B., (2004), “Does Liberté = Egalité? A Survey of the Empirical Links between Democracy and Inequality with some Evidence on the Transition Economies”, Journal of Economic Surveys, 18(4): 515-537
Gwartney J. G. and Lawson R. A., (2007), Economic Freedom of the World: 2007 Annual Report; online at www.freetheworld.com
Jolly R., (2006), “Inequality in Historical Perspective”, UNU-WIDER Research Paper No. 32, March
Lake D.A. and Baum M.A., (2001), “The Invisible Hand of Democracy: Political Control and the Provision of Public Services”, Comparative Political Studies, 34(6): 587-621
Li H., Squire L., Zou H., (1998), “Explaining International and Intertemporal variations in Income Inequality”, The Economic Journal, 108 (January): 26-43
Milanovic B., (2003), “Is Inequality in Africa Really Different?”, World Bank Policy Research Working Papers Series No.3169
Milanovic B., (2000), “Determinants of Cross-Country Income Inequality: an Augmented Kuznets’ Hypothesis”, in: M. Uvalic and V. Franicevic (eds) Equality, Participation, Transition: Essays in Honour of Branko Horvat, Palgrave
25
Morrisson C., (2006), “Institutions, Factor Endowment and Inequality in Ghana, Kenya and Senegal”, in de Janvry A. and Kanbur R. (eds.), Poverty, Inequality and Development: Essays in Honour of Erik Thorbecke, Springer
Piketty T., (2000), “Theories of Persistent Inequality and Intergenerational Mobility”, chapter 8 in Atkinson A.B. and Bourguignon F., Handbook of Income Distribution, Amsterdam: North Holland
Piketty T., (2006), “The Kuznets’ Curve: Yesterday and Tomorrow”, in A. Banerjee, R. Bénabou and D. Mookherjee (eds.), Understanding Poverty, Oxford University Press
Robinson J.A., (2001), “Where Does Inequality Come From? Ideas and Implications for Latin America”, OECD Development Centre Working Paper No.188, December
Rodrik D., (1999), “Democracies Pay Higher Wages”, Quarterly Journal of Economics, 54(3):707-738
Sylwester K., (2004), “A note on geography, institutions, and income inequality”, Economics Letters 85: 235–240
UNU-WIDER, United Nations University – World Institute for Development Economics Research, (2007), “World Income Inequality Database”, online at http://www.wider.unu.edu/wiid/wiid.htm, version 2b, May
Vanhanen T., (2000), “A New dataset Measuring Democracy, 1810-1998”, Journal of Peace Research, 37(2): 251-265
Vanhanen T., (2005), Democratization: A Comparative Analysis of 170 Countries, Routledge (forthcoming), data and documentation available at http://www.fsd.uta.fi/english/data/catalogue/FSD1216/
World Bank, (2005), World Development Report 2006: Equity and Development, World Bank
World Bank, (2007), World Development Indicators, CD-Rom
26
Appendix
Table A1: List of countries Asia (9) JAM JamaicaJamaicaJamaicaJamaica ETH Ethiopia Ethiopia Ethiopia Ethiopia
BGD BangladeshBangladeshBangladeshBangladesh MEX Mexico Mexico Mexico Mexico GAB GabonGabonGabonGabon IND IndiaIndiaIndiaIndia NIC NicaraguaNicaraguaNicaraguaNicaragua GMB Gambia, TheGambia, TheGambia, TheGambia, The IDN IndonesiaIndonesiaIndonesiaIndonesia PAN Panama Panama Panama Panama GHA Ghana Ghana Ghana Ghana MYS MalaysiaMalaysiaMalaysiaMalaysia PRY Paraguay Paraguay Paraguay Paraguay GIN GuineaGuineaGuineaGuinea PAK Pakistan Pakistan Pakistan Pakistan PER Peru Peru Peru Peru GNB GuineaGuineaGuineaGuinea----BissauBissauBissauBissau PNG Papua New GuineaPapua New GuineaPapua New GuineaPapua New Guinea TTO Trinidad & TobagoTrinidad & TobagoTrinidad & TobagoTrinidad & Tobago KEN Kenya Kenya Kenya Kenya PHL Philippines Philippines Philippines Philippines URY UruguayUruguayUruguayUruguay MLI Mali Mali Mali Mali LKA Sri LankaSri LankaSri LankaSri Lanka VEN Venezuela, RBVenezuela, RBVenezuela, RBVenezuela, RB MWI Malawi THA ThailandThailandThailandThailand North Africa & Mid. East (7) MRT Mauritania Mauritania Mauritania Mauritania
Latin America & Carib. (21) DZA AlgeriaAlgeriaAlgeriaAlgeria MOZ MozambiqueMozambiqueMozambiqueMozambique ARG ArgentinaArgentinaArgentinaArgentina EGY Egypt, Egypt, Egypt, Egypt, Arab Rep.Arab Rep.Arab Rep.Arab Rep. NER Niger Niger Niger Niger BOL BoliviaBoliviaBoliviaBolivia IRN Iran, Islamic Rep.Iran, Islamic Rep.Iran, Islamic Rep.Iran, Islamic Rep. NGA Nigeria Nigeria Nigeria Nigeria BRA BrazilBrazilBrazilBrazil JOR Jordan Jordan Jordan Jordan RWA Rwanda Rwanda Rwanda Rwanda CHL ChileChileChileChile MAR Morocco Morocco Morocco Morocco SEN Senegal Senegal Senegal Senegal COL Colombia Colombia Colombia Colombia TUN Tunisia Tunisia Tunisia Tunisia SLE Sierra LeoneSierra LeoneSierra LeoneSierra Leone CRI Costa RicaCosta RicaCosta RicaCosta Rica TUR TurkeyTurkeyTurkeyTurkey ZAF South AfricaSouth AfricaSouth AfricaSouth Africa DOM Dominican Rep.Dominican Rep.Dominican Rep.Dominican Rep. Sub-Saharan Africa (25) UGA UgandaUgandaUgandaUganda ECU EcuadorEcuadorEcuadorEcuador BWA BotswanaBotswanaBotswanaBotswana TZA TanzaniaTanzaniaTanzaniaTanzania SLV El SalvadEl SalvadEl SalvadEl Salvadorororor BFA Burkina FasoBurkina FasoBurkina FasoBurkina Faso ZMB ZambiaZambiaZambiaZambia GTM Guatemala Guatemala Guatemala Guatemala CIV Cote d'IvoireCote d'IvoireCote d'IvoireCote d'Ivoire ZWE ZimbabweZimbabweZimbabweZimbabwe GUY GuyanaGuyanaGuyanaGuyana CAF Central African Rep.Central African Rep.Central African Rep.Central African Rep. HND Honduras Honduras Honduras Honduras
Table A2: Descriptive statistics, cross-section sample Variable Obs Mean Std. Dev. Min Max Family farms land (%) 1988 58 43.431 16.907 8 73 Gini coeff. 1991-2005 (WIID) 58 45.510 8.428 28.9 63.18 ln(GDP) 1980 58 7.402 0.792 5.73 9.327 Prop. rights 1980-1990 (Fraser) 47 4.106 1.256 2.071 6.475 Prop. rights 1980-1990 (ICRG) 55 22.707 6.264 10.851 37.014 M2/GDP 1986-1990 58 46.057 103.164 0.868 798.42 Political rights 1972-1990 58 2.466 1.586 0.055 6 Democratisation 1960-1990 58 5.437 5.952 0 21.817 Education (sec. enrolment rate) 1965 57 16.298 13.468 1 53 ln(wheat/sugar) 53 -0.019 0.149 -0.392 0.577
Table A3: Descriptive statistics, panel data sample Variable Mean Std. Dev. Min Max Observations Gini coeff. overall 49.764 10.118 29.897 77.169 N = 120 between 10.536 31.304 77.169 n = 42 within 2.358 42.408 57.906 T-bar = 2.857 Bottom quintile share overall 3.742 1.321 1.300 7.93 N = 72 between 1.377 1.300 7.78 n = 30 within 0.366 2.130 5.075 T-bar= 2.4 Top quintile share overall 56.201 6.197 42.165 77.355 N = 72 between 6.710 42.782 77.355 n = 30 within 1.672 49.807 63.101 T-bar= 2.4 Bottom decile share overall 1.297 0.585 0.257 3.43 N = 72 between 0.603 0.257 3.19 n = 30 within 0.171 0.608 1.746 T-bar= 2.4 Top decile share overall 40.171 6.589 26.7 67.439 N = 72 between 7.551 27.697 67.439 n = 30 within 1.615 34.071 46.371 T-bar= 2.4 Middle class share overall 39.943 5.125 21.066 51.2 N = 70 between 5.656 21.066 49.922 n = 29 within 1.367 34.632 45.281 T-bar = 2.413 Prop. rights overall 4.716 1.300 1.583 7.407 N = 120 (Fraser) between 1.113 2.439 6.556 n = 42 within 0.821 2.090 6.539 T-bar = 2.857 Democratisation overall 13.187 9.166 0 40.76 N = 120 (Vanhanen) between 7.842 0 31.3872 n = 42 within 5.113 -10.779 22.72976 T-bar = 2.857 Education overall 1.157 0.599 0.122 2.796 N = 120 (years of schooling) between 0.588 0.122 2.15 n = 42 within 0.254 0.364 2.577 T-bar = 2.857 Inflation (CPI) overall 55.180 42.015 1.16e-09 150.148 N = 120 between 34.017 0.300 138.127 n = 42 within 30.292 -3.652 163.541 T-bar = 2.857 ln(GDP) overall 7.327 1.085 4.940 8.955 N = 120 between 1.093 4.983 8.847 n = 42 within 0.168 6.565 7.882 T-bar = 2.857 M2/GDP overall 38.109 22.445 8.186 119.625 N = 120 between 20.139 8.186 107.288 n = 42 within 9.667 -7.358 72.385 T-bar = 2.857 Asset inequality overall 44.701 17.775 20 90.7 N = 120 between 19.012 21.571 90.7 n = 42 within 3.818 32.001 56.0016 T-bar = 2.857

27
Figure 1: Inequality and Democracy
DZA
ARG
BGD
BOL
BRA
BFA
CIV
CAF
CHLCOL
CRI
DOM
ECU
EGY
SLV
ETH
GAB
GMB
GHA
GTM
GIN
GNB
GUY
HND
INDIDN
IRN
JAMJOR
KEN
MYS
MLIMRT
MEX
MARMOZ
NIC
NER NGA
PAK
PAN PNGPRY
PERPHL
RWA
SEN
SLE
ZAF
LKA
THA
TTOTUN
UGA
TZA
URY
VENZMB
3040
5060
70G
ini c
oef
ficie
nt (W
IID), 1
991
-2000
0 5 10 15 20Democratisation (Vanhanen), 1960-1990
Income inequality and political democracy
Figure 2: Inequality and Property rights
DZA
ARG
BGD
BOL
BRA
CMR
CAF
CHLCOL
CRI
DOM
ECU
EGY
SLV
GAB
GHA
GTM
GUY
HND
INDIDN
IRN
JAMJOR
KEN
MYS
MLI
MEX
MAR
NIC
NERNGA
PAK
PAN PRY
PERPHL
SEN
ZAF
LKA
THA
TTOTUN
UGA
TZA
URY
VENZMB
3040
5060
70G
ini c
oef
ficie
nt (W
IID), 1
991
-2000
2 3 4 5 6 7Property rights (Fraser Inst.), 1980-1990
Income inequality and property rights
Figure 3: Inequality and Prop. rights at advanced and early stages of democratisation
ARGBOL CMR
CHLCOL
CRI
DOM
ECU
SLV
GTM
GUY
HND
IND
JAM
MYSPAN
PERPHL
LKA
TTOURY
VEN
DZA
BGD
BRACAF
EGY
GAB
GHA IDN
IRN
JOR
KEN
MLI
MEX
MAR
NIC
NERNGA
PAK
PRYSEN
ZAF
THA
TUN
UGA
TZAZMB
3040
5060
70In
com
e in
equal
ity (W
IID), 1
991
-200
0
2 3 4 5 6 7Property rights (Fraser Inst.), 1980-1990
The relationship at different stages of democratisationIncome inequality and Property rights
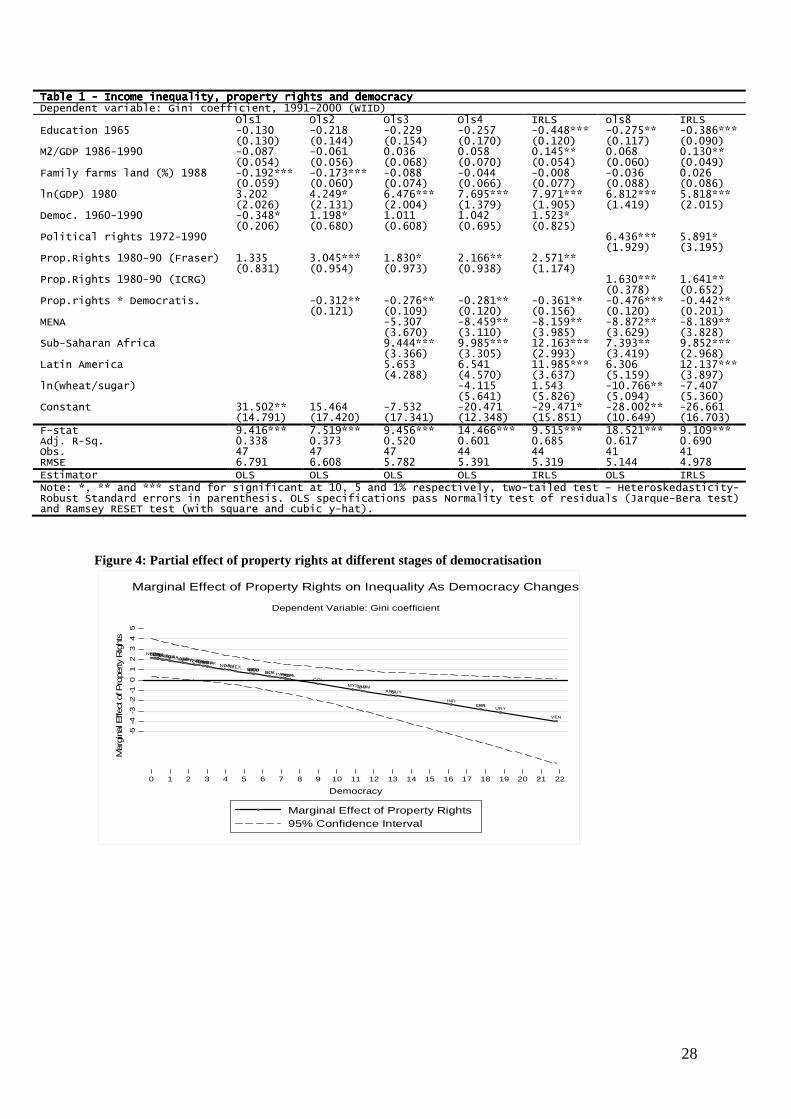
28
Table 1 Table 1 Table 1 Table 1 ---- Income inequality, property rights and democracy Income inequality, property rights and democracy Income inequality, property rights and democracy Income inequality, property rights and democracy Dependent variable: Gini coefficient, 1991-2000 (WIID) Ols1 Ols2 Ols3 Ols4 IRLS ols8 IRLS Education 1965 -0.130 -0.218 -0.229 -0.257 -0.448*** -0.275** -0.386*** (0.130) (0.144) (0.154) (0.170) (0.120) (0.117) (0.090) M2/GDP 1986-1990 -0.087 -0.061 0.036 0.058 0.145** 0.068 0.130** (0.054) (0.056) (0.068) (0.070) (0.054) (0.060) (0.049) Family farms land (%) 1988 -0.192*** -0.173*** -0.088 -0.044 -0.008 -0.036 0.026 (0.059) (0.060) (0.074) (0.066) (0.077) (0.088) (0.086) ln(GDP) 1980 3.202 4.249* 6.476*** 7.695*** 7.971*** 6.812*** 5.818*** (2.026) (2.131) (2.004) (1.379) (1.905) (1.419) (2.015) Democ. 1960-1990 -0.348* 1.198* 1.011 1.042 1.523* (0.206) (0.680) (0.608) (0.695) (0.825) Political rights 1972-1990 6.436*** 5.891* (1.929) (3.195) Prop.Rights 1980-90 (Fraser) 1.335 3.045*** 1.830* 2.166** 2.571** (0.831) (0.954) (0.973) (0.938) (1.174) Prop.Rights 1980-90 (ICRG) 1.630*** 1.641** (0.378) (0.652) Prop.rights * Democratis. -0.312** -0.276** -0.281** -0.361** -0.476*** -0.442** (0.121) (0.109) (0.120) (0.156) (0.120) (0.201) MENA -5.307 -8.459** -8.159** -8.872** -8.189** (3.670) (3.110) (3.985) (3.629) (3.828) Sub-Saharan Africa 9.444*** 9.985*** 12.163*** 7.393** 9.852*** (3.366) (3.305) (2.993) (3.419) (2.968) Latin America 5.653 6.541 11.985*** 6.306 12.137*** (4.288) (4.570) (3.637) (5.159) (3.897) ln(wheat/sugar) -4.115 1.543 -10.766** -7.407 (5.641) (5.826) (5.094) (5.360) Constant 31.502** 15.464 -7.532 -20.471 -29.471* -28.002** -26.661 (14.791) (17.420) (17.341) (12.348) (15.851) (10.649) (16.703) F-stat 9.416*** 7.519*** 9.456*** 14.466*** 9.515*** 18.521*** 9.109*** Adj. R-Sq. 0.338 0.373 0.520 0.601 0.685 0.617 0.690 Obs. 47 47 47 44 44 41 41 RMSE 6.791 6.608 5.782 5.391 5.319 5.144 4.978 Estimator OLS OLS OLS OLS IRLS OLS IRLS Note: *, ** and *** stand for significant at 10, 5 and 1% respectively, two-tailed test – Heteroskedasticity-Robust Standard errors in parenthesis. OLS specifications pass Normality test of residuals (Jarque-Bera test) and Ramsey RESET test (with square and cubic y-hat).
Figure 4: Partial effect of property rights at different stages of democratisation
NERTUNJORKENCAFMLIDZAEGYTZAGHAUGAGABSENTHAZAFIDNBRAZMBBGDPAK NGAPRYMEXNICGTMHNDECU SLVBOLPANPHLPERCHL
COLMYSJAMDOM
ARGGUY
INDCRILKA
URY
VEN
-5-4
-3-2
-10
12
34
5
Mar
gina
l Effe
ct o
f Pro
perty
Rig
hts
0 1 2 3 4 5 6 7 8 9 10 11 12 13 14 15 16 17 18 19 20 21 22
Democracy
Marginal Effect of Property Rights95% Confidence Interval
Dependent Variable: Gini coefficient
Marginal Effect of Property Rights on Inequality As Democracy Changes

29
TaTaTaTable 2: Income inequality, property rights and democracy ble 2: Income inequality, property rights and democracy ble 2: Income inequality, property rights and democracy ble 2: Income inequality, property rights and democracy –––– OLS estimates OLS estimates OLS estimates OLS estimates Dependent variable: Gini coefficient, 1991-2000 (WIID) Excluded continent: Latin America Asia MENA SS Africa Education 1965 -0.188 -0.196 -0.316*** -0.114 (0.202) (0.139) (0.082) (0.110) M2/GDP 1986-1990 -0.012 -0.085 0.030 -0.043 (0.116) (0.087) (0.032) (0.055) Family farms land (%) 1988 -0.140 -0.134 -0.109* -0.127* (0.214) (0.084) (0.056) (0.066) log(GDP) 1980 1.600 4.338* 6.987*** 7.629** (3.339) (2.378) (1.275) (2.760) Political rights 1972-1990 12.471** 6.681*** 7.738*** 5.505 (4.756) (2.370) (1.953) (4.591) Prop. rights 1980-1990 (ICRG) 3.442** 1.563*** 1.946*** 1.429* (1.307) (0.549) (0.480) (0.727) Prop. rights * Pol. rights -0.875* -0.479*** -0.578*** -0.397 (0.403) (0.154) (0.123) (0.272) log(wheat/sugar) -29.862* -7.562 -11.631** -15.669** (13.908) (5.562) (5.462) (6.296) Constant -7.793 3.625 -23.218* -25.355 (22.690) (20.102) (11.507) (27.551) F-stat 6.080*** 3.217*** 17.495*** 8.409*** Adj. R-Sq. 0.232 0.373 0.529 0.490 Obs. 21 33 38 32 RMSE 7.770 5.949 5.549 5.879 Note: *, ** and *** stand for significant at 10, 5, and 1% respectively, two-tailed test – Heteroskedasticity-Robust Standard errors in parenthesis. OLS specifications pass Normality test of residuals (Jarque-Bera test) and Ramsey RESET test (with square and cubic y-hat).
Table Table Table Table 3333 ---- Income inequality: Dynamic model Income inequality: Dynamic model Income inequality: Dynamic model Income inequality: Dynamic model Dependent variable: Gini coefficient (WIID) Estimation method: OLS Within FE LSDVC Ginit-1 0.947*** 0.282** 0.449*** (0.043) (0.137) (0.127) Education -1.076 0.455 0.257 (0.870) (1.732) (1.851) M2/GDP -0.010 0.004 -0.003 (0.015) (0.052) (0.039) Asset inequality -0.029 0.230** 0.197** (0.039) (0.095) (0.092) Property rights 0.318 1.409** 1.340** (0.697) (0.659) (0.668) Democratisation 0.080 0.380** 0.371* (0.177) (0.144) (0.204) Prop.Rigths * Democratisation -0.030 -0.084*** -0.081** (0.035) (0.030) (0.038) lnGDP -14.301** -3.385 -7.284 (6.536) (13.188) (14.481) lnGDP2 0.968** -0.037 0.254 (0.461) (0.988) (0.995) Inflation (CPI) 0.035 0.021 0.020 (0.023) (0.015) (0.021) Constant 54.286** 40.219 (20.879) (45.325) Time effects Yes Yes Yes F-stat 70.831*** 23.298*** R-Sq. 0.891 0.541 Obs. 120 120 120 Countries 42 42 42 Note: *, **, *** and **** stand for significant at 10, 5, 1 and 0.1% respectively, two-tailed test – FE and Pooled OLS Standard errors, in parenthesis, are robust for arbitrary heteroskedasticity and clustering at the country level. LSDVC standard errors are calculated by bootstrapping (50 repetitions) – Time dummies are jointly significant.
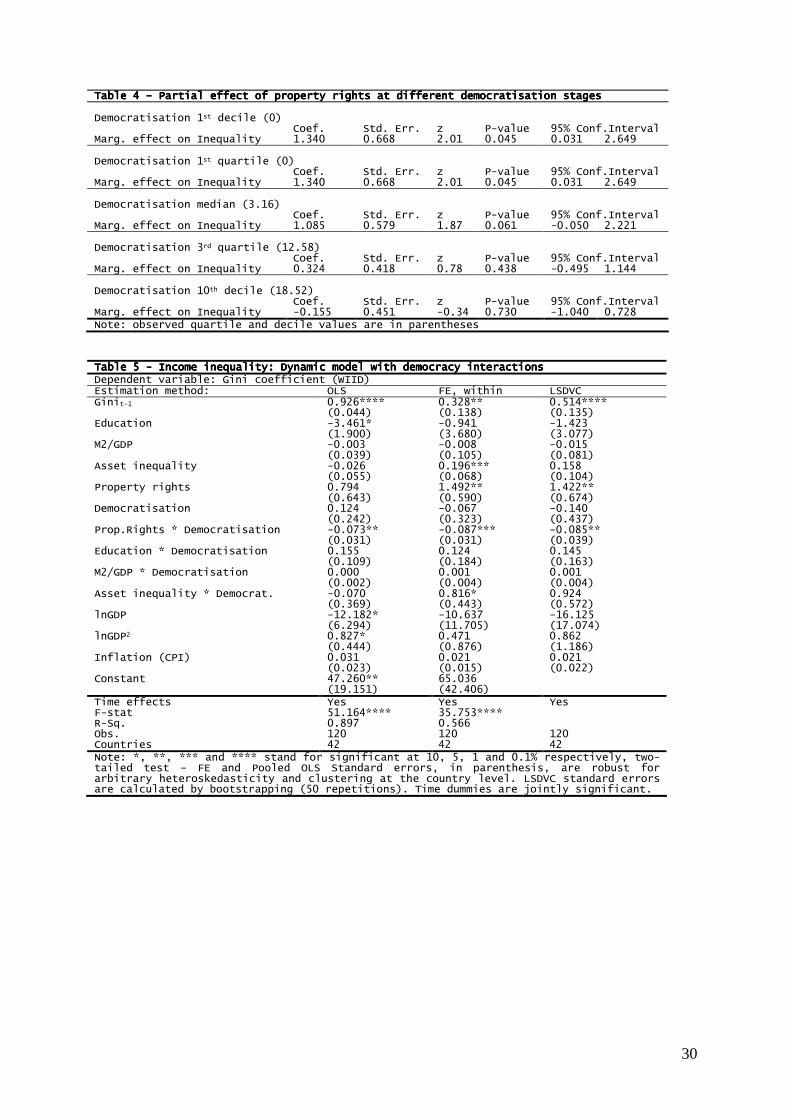
30
Table Table Table Table 4444 –––– Partial effect of property rights at different democratisation stages Partial effect of property rights at different democratisation stages Partial effect of property rights at different democratisation stages Partial effect of property rights at different democratisation stages Democratisation 1st decile (0) Coef. Std. Err. z P-value 95% Conf.Interval Marg. effect on Inequality 1.340 0.668 2.01 0.045 0.031 2.649 Democratisation 1st quartile (0) Coef. Std. Err. z P-value 95% Conf.Interval Marg. effect on Inequality 1.340 0.668 2.01 0.045 0.031 2.649 Democratisation median (3.16) Coef. Std. Err. z P-value 95% Conf.Interval Marg. effect on Inequality 1.085 0.579 1.87 0.061 -0.050 2.221 Democratisation 3rd quartile (12.58) Coef. Std. Err. z P-value 95% Conf.Interval Marg. effect on Inequality 0.324 0.418 0.78 0.438 -0.495 1.144 Democratisation 10th decile (18.52) Coef. Std. Err. z P-value 95% Conf.Interval Marg. effect on Inequality -0.155 0.451 -0.34 0.730 -1.040 0.728 Note: observed quartile and decile values are in parentheses
Table Table Table Table 5555 ---- Income inequality: Dynamic model with democracy interactions Income inequality: Dynamic model with democracy interactions Income inequality: Dynamic model with democracy interactions Income inequality: Dynamic model with democracy interactions Dependent variable: Gini coefficient (WIID) Estimation method: OLS FE, within LSDVC Ginit-1 0.926**** 0.328** 0.514**** (0.044) (0.138) (0.135) Education -3.461* -0.941 -1.423 (1.900) (3.680) (3.077) M2/GDP -0.003 -0.008 -0.015 (0.039) (0.105) (0.081) Asset inequality -0.026 0.196*** 0.158 (0.055) (0.068) (0.104) Property rights 0.794 1.492** 1.422** (0.643) (0.590) (0.674) Democratisation 0.124 -0.067 -0.140 (0.242) (0.323) (0.437) Prop.Rights * Democratisation -0.073** -0.087*** -0.085** (0.031) (0.031) (0.039) Education * Democratisation 0.155 0.124 0.145 (0.109) (0.184) (0.163) M2/GDP * Democratisation 0.000 0.001 0.001 (0.002) (0.004) (0.004) Asset inequality * Democrat. -0.070 0.816* 0.924 (0.369) (0.443) (0.572) lnGDP -12.182* -10.637 -16.125 (6.294) (11.705) (17.074) lnGDP2 0.827* 0.471 0.862 (0.444) (0.876) (1.186) Inflation (CPI) 0.031 0.021 0.021 (0.023) (0.015) (0.022) Constant 47.260** 65.036 (19.151) (42.406) Time effects Yes Yes Yes F-stat 51.164**** 35.753**** R-Sq. 0.897 0.566 Obs. 120 120 120 Countries 42 42 42 Note: *, **, *** and **** stand for significant at 10, 5, 1 and 0.1% respectively, two-tailed test – FE and Pooled OLS Standard errors, in parenthesis, are robust for arbitrary heteroskedasticity and clustering at the country level. LSDVC standard errors are calculated by bootstrapping (50 repetitions). Time dummies are jointly significant.

31
Table 6Table 6Table 6Table 6 ---- Income inequality: Dynamic model, LSDVC estimates Income inequality: Dynamic model, LSDVC estimates Income inequality: Dynamic model, LSDVC estimates Income inequality: Dynamic model, LSDVC estimates by income shares by income shares by income shares by income shares Dependent variable: 1st
quintile 5th quintile
1st decile 10th decile Middle class share
Inequalityt-1 0.015 0.220 0.037 0.256 0.241 (0.220) (0.177) (0.209) (0.177) (0.195) Education -0.561 1.063 -0.256 0.940 -0.603 (0.789) (1.613) (4.398) (1.560) (1.403) M2/GDP 0.004 -0.033 0.004 -0.042 0.022 (0.018) (0.034) (0.099) (0.033) (0.034) Asset inequality -7.325 13.469 -3.212 11.116 -9.246 (5.225) (9.815) (28.047) (9.316) (8.889) Property rights -0.155 1.749*** -0.037 1.995*** -1.533** (0.380) (0.675) (2.212) (0.665) (0.662) Democratisation -0.052 0.325 -0.018 0.354* -0.266 (0.119) (0.215) (0.670) (0.208) (0.174) Prop.Rights * Democrat. 0.010 -0.065 0.003 -0.067* 0.056* (0.022) (0.040) (0.124) (0.039) (0.034) ln(gdp) -5.113 29.064 -4.203 34.568 -18.853 (16.005) (31.089) (91.370) (30.185) (24.047) ln(gdp)2 0.409 -2.143 0.308 -2.408 1.440 (1.040) (2.034) (5.982) (1.974) (1.533) Inflation (CPI) -0.000 0.003 0.000 0.004 -0.001 (0.009) (0.018) (0.051) (0.017) (0.010) Time effects Yes Yes Yes Yes Yes Obs. 66 66 66 66 65 Countries 28 28 28 28 27 Note: *, **, *** and **** stand for significant at 10, 5, 1 and 0.1% respectively, two-tailed test. LSDVC standard errors are calculated by bootstrapping (50 repetitions). Time dummies are jointly significant.