working proactive towards higher otd1188642/fulltext01.pdf · design/methodology/approach - the...
TRANSCRIPT

IN THE FIELD OF TECHNOLOGYDEGREE PROJECT INDUSTRIAL ENGINEERING AND MANAGEMENTAND THE MAIN FIELD OF STUDYINDUSTRIAL MANAGEMENT,SECOND CYCLE, 30 CREDITS
, STOCKHOLM SWEDEN 2017
Working Proactive Towards Higher OTDA case study at the operations department at ABB GA Products, investigating the possibility to enhance a more proactive way of work towards higher OTD.
FILIP DANIELSSON
DANIEL STRÖMQVIST
KTH ROYAL INSTITUTE OF TECHNOLOGYSCHOOL OF INDUSTRIAL ENGINEERING AND MANAGEMENT


1
Working Proactive Towards Higher OTD
A case study at the operations department at ABB GA Products, investigating the possibility to enhance a more proactive way of work towards higher OTD.
Filip Danielsson Daniel Strömqvist
Master of Science Thesis INDEK 2017:23 KTH Industrial Engineering and Management
Industrial Management SE-100 44 STOCKHOLM

2
Proaktivt Arbete för att Nå en Högre Leveransprecision
En fallstudie på ABB GA Products för att undersöka deras operativa avdelnings
möjlighet att arbeta proaktivt för att nå en högre leveransprecision.
Filip Danielsson Daniel Strömqvist
Examensarbete INDEK 2017:23
KTH Industriell teknik och management Industriell ekonomi och organisation
SE-100 44 STOCKHOLM

3
Master of Science Thesis INDEK 2017:23
Working proactive towards higher OTD
Filip Danielsson Daniel Strömqvist
Approved 2017-05-26
Examiner Matti Kaulio
Supervisor Vikash Sinha
Commissioner ABB GA Products
Contact person Erik Strömberg
Abstract Purpose - The purpose of this study is to investigate and understand which significant parameters affect OTD within an ATO company, and furthermore develop a model which would enhance proactive work in order to achieve a higher OTD. Design/methodology/approach - The data is primarily of qualitative nature, employing semi-structured interviews and workshop, with backup from quantitative production data. An abductive approach was applied by iterating and aligning findings with relevant literature and theory. These mixed methodologies created a triangulation of data, which through our analysis help with the validation of our conclusions. Findings - Through our findings we can conclude that significant parameters which lowers OTD for an ATO company can be found all through the supply chain. For this thesis and its model, parameters were chosen based on their ability to be quantified. For ABB GA Products, we found 36 significant parameters as well as a systematic approach for an ATO company to iteratively go through them to investigate which orders are affected by which flags. Through this approach an ATO company should be able to work more proactively towards higher OTD. Research limitations/implications - This thesis is conducted through a case study at ABB GA Products only, which should be considered when using the results for further research. Practical implications - Specifies a logical scheme to classify risk of delayed orders. Originality/value - Advances theory in production and operations management regarding performance measurement, towards a more proactive approach of measuring reactive KPI’s Keywords - On time delivery, ATO, Lead-time, Operations, Performance measurement, Production Control

4
Examensarbete INDEK 2017:23
Proaktivt arbete för att nå en högre leveransprecision
Filip Danielsson Daniel Strömqvist
Godkänt 2017-05-26
Examinator Matti Kaulio
Handledare Vikash Sinha
Uppdragsgivare ABB GA Products
Kontaktperson Erik Strömberg
Sammanfattning Syfte - Syftet med denna studie är att undersöka och förstå vilka de signifikanta parametrarna är som påverkar leveransprecisionen inom ett ATO-företag, samt utveckla en modell med syfte att stödja ett proaktivt arbete för att nå en högre leveransprecision, OTD. Design/Metod/Ansats - Data är primärt av kvalitativt slag, framtagen genom semi-strukturerade intervjuer och workshops, samt kompletterad av kvantitativa produktionsdata. En abduktiv ansats applicerades genom att iterera empiriska resultat i kontext av relevant teori. Användandet av flera metoder skapade en triangulering av data, vilket genom vår analys hjälpt till med validering av vår slutsats. Resultat – Vi kan dra slutsatsen att signifikanta parametrar som ofta sänker leveransprecisionen för ett ATO-företag kan hittas i hela värdekedjan. För detta examensarbete och dess modell valdes dock endast de parametrar som besitter förmågan att kunna kvantifieras. För ABB GA Products fann vi 36 signifikanta parametrar, samt en systematisk ansats för hur ett ATO-företag iterativt kan gå igenom dem för att undersöka hur varje order påverkas av flaggorna. Genom det förslaget borde ett ATO-företag proaktivt kunna arbeta mot att förbättra sin leveransprecision. Forskningsbegränsningar - Denna studie är genomförd endast vid ABB GA Product, vilket borde tas hänsyn till vid framtida forskning. Praktiska implikationer -Specificerar en modell för att klassificera risk för sena ordrar. Originalitet/Värde - Tillför till teori inom produktion och verksamhetsstyrning angående prestationsmätning, mot ett mer proaktivt tillvägagångssätt för att mäta reaktiva nyckeltal Nyckelord - Leveransprecision, Montering mot order, Ledtid, Verksamhet, Prestationsmätning,

5
Table of contents
1 Introduction 101.1 Background 101.2 Problematization 121.3 Purpose and Aim 121.4 Research Questions 13
1.4.1 Main Research Question 131.4.2 Sub Research Questions 13
1.5 Delimitations 131.6 The Expected Contribution of Our Master Thesis 14
2 Method 152.1 Research Approach 152.2 Research Design 162.3 Pre-study - Interviews, Literature Study and BPM 182.4 Literature Review 182.5 Empirical Data Gathering 19
2.5.1 Semi-structured Interviews 192.5.2 Quantitative Operations Data 212.5.3 Workshop 21
2.6 Analysis 232.6.1 Qualitative Data 242.6.2 Quantitative Data 24
2.7 Reliability, Validity and Generalizability 242.8 Ethics 26
3 Literature and Theory 273.1 Traditional View on OTD: Understanding of Operations and Production Control 273.2 Expanded View on OTD: Extending Operational Boundaries 303.3 On Time Delivery 313.4 Factors of delay 33
4 Empirical Setting 354.1 ABB 354.1 ABB GA Products 354.1.1 ABB GA Products Operations 35

6
5. Empirical Findings 365.1 Phase one: BPM, SAP-data and Contextual Interviews 36
5.1.1 Data: SAP and Business Process Map 365.1.2 Contextual Interviews 38
5.2 Phase two: Semi-structured Interviews and Workshop 385.2.1 Semi-structured Interviews 385.2.2 Workshop 41
5.4 Conclusion of Results 436 Flag Based Model 44
6.1 Flags 446.2 The Flag Marker, Based on the Order Backlog 456.3 Desired Features in a Potential Software Version 466.4 Possible Visualization of Model 476.5 Concluding Remarks and How to Use the Program in Practice 49
7 Analysis and Discussion 507.1 Operations Management and Production Control 507.2 On Time Delivery 517.3 Reasons for Late Orders 537.4 Production Control Models 55
8 Conclusion 588.1 Answers to Research Questions 58
8.1.1 Main research question: How can an assembly-to-order (ATO) company work proactive towards higher on time delivery (OTD)? 60
8.2 Concluding remarks 618.2.1 Implications to practice 618.2.2 Future Research Ideas 62
9 Appendix 639.1 Flags 63
9 Reference List 69

7
Figures Figure 1: A visualization of the used research design Figure 2: Process map of the operations process flow Figure 3: Complete analysis power point deck from SAP-data Figure 4: The process flow of the model. How data is gathered from SAP then then matched with positions in orders Figure 5: A potential visualization of the flag based model
Graphs Graph 1: Level of processing/refinement or added value Graph 2: A visualization of the ranking-tool used in the workshop Graph 3: Display of delays, 29400 positions from Jan 2016 - February 2017 was used
Images Image 1 and 2: Participants in the conducted workshop can be viewed on the left, as well as some of the result can be viewed to the right
Tables Table 1: Interview targets, both internally and externally from ABB Table 2: Changes in business and the response by operations Table 3: An exhibit from Parmenters book from 2015, which describes parameters of a successful KPI Table 4: Examples of mentioned flags, as well as who can spot the flags and where they can be found. Complete list in Appendix

8
Glossary and Acronyms
ABB Asea Brown Boveri
GA Products Grid Automation Products
MRQ Master research question
SRQ Sub research question
OTD On time delivery
ERP Enterprise resource planning
EIS Enterprise information system
SAP German ERP-system
METS Internal manufacturing system
KTH Royal institute of technology
MRP Material resource planning
OPEX Operational excellence
SOP Sales and operations planning
NPS Net Promoter Score

9
Foreword This Master thesis was conducted during the spring of 2017 on behalf of the Royal Institute of technology and ABB GA Products. With this thesis, we finalize our master of science in Industrial engineering and management. We would like to thank our supervisor Vikash Sinha, at the Royal Institute of Technology, for all the guidance and support. All the knowledge and constant attention has been invaluable, nor has there never been a person to respond to an email faster or more concrete than him. We also would like to thank our supervisor at ABB GA Products, Erik Strömberg. Even though he is a very busy manager at GA Products, he has given us all the time, material and support needed to finalize this thesis, and always doing so with a smile on his face. The final individual we would like to thank is Leif Danielsson, who lent us his car during this period, which enabled us to travel back and forth between ABB GA Products in Västerås and the Royal Institute of Technology. To conclude, we would like to thank all the employees at GA Products that took time out of their busy schedules to answer questions, help us with various tasks or just chat over a coffee. We learned a lot and had fun doing so, thank you.

10
1 Introduction
The introduction starts with a brief background on the subject of this case study as well as a short introduction of how companies handles the on time delivery issues. Furthermore, a short description of the case company, the purpose, aim, and the research questions addressed in the thesis are elaborated. Finally, the chapter concludes by explaining the delimitation of the study, and its contribution to theory.
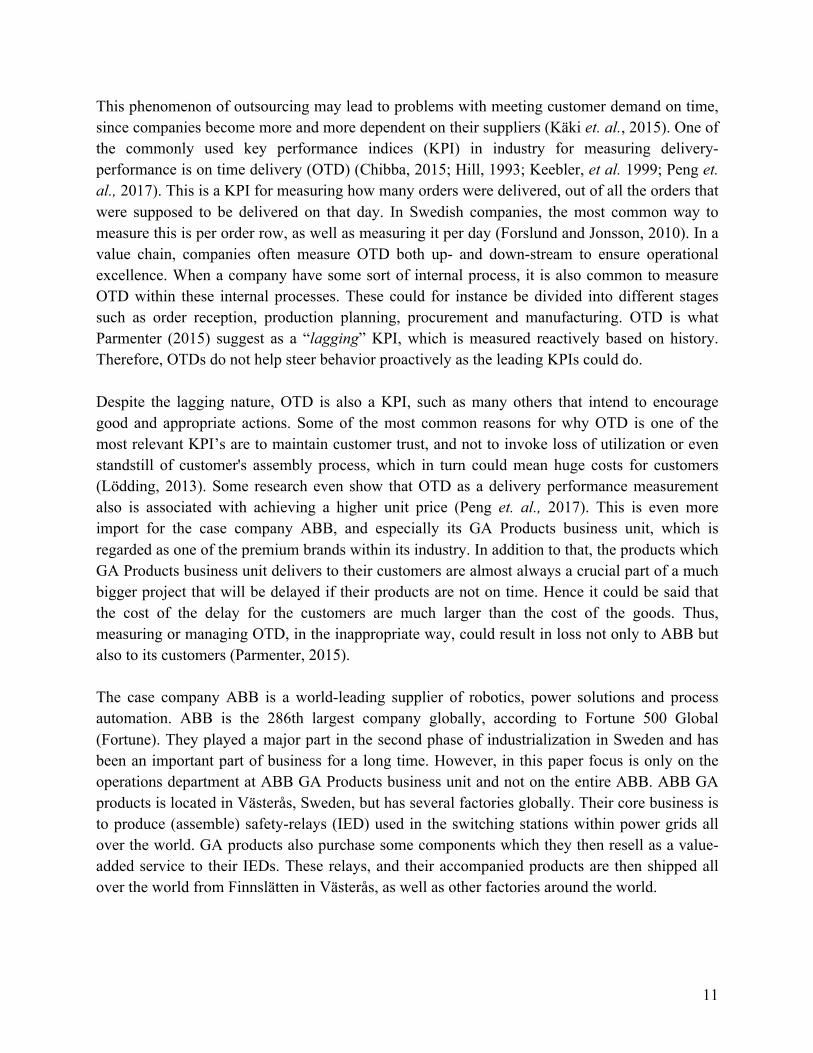
1.1 Background Companies all over the world are narrowing their focus and concentrating on their core-business. Thus, they are to a larger extent than ever sourcing components and functions from suppliers rather than producing or making it themselves. Hence the level of refinement (value added) done within organizations has declined - see graph 1 (Andrén, 2015). This makes more classical production companies move towards becoming more of a manufacturing/assembly-to-order company (MTO/ATO). Companies find several benefits by moving towards these models of production/assembly, such as economics of scale and the opportunity to focus on the core capabilities (Gottfredson et. al., 2005), leading to a higher level of specialization. However, it also causes companies to become more dependent on each other. One of the most obvious dependencies is between producing companies and their suppliers. It is of great significance that these suppliers deliver on time and have products of expected quality since the ability to carry out operations in an excellent manner requires suppliers to do the same.
Graph 1: Level of processing/refinement or added value.
11
This phenomenon of outsourcing may lead to problems with meeting customer demand on time, since companies become more and more dependent on their suppliers (Käki et. al., 2015). One of the commonly used key performance indices (KPI) in industry for measuring delivery-performance is on time delivery (OTD) (Chibba, 2015; Hill, 1993; Keebler, et al. 1999; Peng et. al., 2017). This is a KPI for measuring how many orders were delivered, out of all the orders that were supposed to be delivered on that day. In Swedish companies, the most common way to measure this is per order row, as well as measuring it per day (Forslund and Jonsson, 2010). In a value chain, companies often measure OTD both up- and down-stream to ensure operational excellence. When a company have some sort of internal process, it is also common to measure OTD within these internal processes. These could for instance be divided into different stages such as order reception, production planning, procurement and manufacturing. OTD is what Parmenter (2015) suggest as a “lagging” KPI, which is measured reactively based on history. Therefore, OTDs do not help steer behavior proactively as the leading KPIs could do. Despite the lagging nature, OTD is also a KPI, such as many others that intend to encourage good and appropriate actions. Some of the most common reasons for why OTD is one of the most relevant KPI’s are to maintain customer trust, and not to invoke loss of utilization or even standstill of customer's assembly process, which in turn could mean huge costs for customers (Lödding, 2013). Some research even show that OTD as a delivery performance measurement also is associated with achieving a higher unit price (Peng et. al., 2017). This is even more import for the case company ABB, and especially its GA Products business unit, which is regarded as one of the premium brands within its industry. In addition to that, the products which GA Products business unit delivers to their customers are almost always a crucial part of a much bigger project that will be delayed if their products are not on time. Hence it could be said that the cost of the delay for the customers are much larger than the cost of the goods. Thus, measuring or managing OTD, in the inappropriate way, could result in loss not only to ABB but also to its customers (Parmenter, 2015). The case company ABB is a world-leading supplier of robotics, power solutions and process automation. ABB is the 286th largest company globally, according to Fortune 500 Global (Fortune). They played a major part in the second phase of industrialization in Sweden and has been an important part of business for a long time. However, in this paper focus is only on the operations department at ABB GA Products business unit and not on the entire ABB. ABB GA products is located in Västerås, Sweden, but has several factories globally. Their core business is to produce (assemble) safety-relays (IED) used in the switching stations within power grids all over the world. GA products also purchase some components which they then resell as a value-added service to their IEDs. These relays, and their accompanied products are then shipped all over the world from Finnslätten in Västerås, as well as other factories around the world.

12
Work towards improving OTD within GA Products is done continuously. Daily meetings is held in order to detect negative issues and take precautions towards them, but these actions is done in hindsight, after the problem has already occurred. In order to raise awareness in an as early state as possible, GA products has requested that a pro-active model would be of interest if it could alarm potential risk regarding future OTD. With such a solution GA Products believes that some of these issues affecting OTD negative could be detected earlier on in the operations process, as well as raising awareness of the subject within the operations function, and GA Products on a whole. Making the OTD performance measurement, move from reactive to proactive.
1.2 Problematization OTD is becoming an increasingly important KPI since the level of refinement is decreasing. Furthermore, the research regarding looking at the problem in a proactive manner in an assembly-to-order company are limited. Within ABB in general and GA products in particular, OTD is one of the most important and evaluated KPIs. ABB is using it as one of their KPI’s since it is a great performance index, reflecting many underlying causes and focuses on the efficiency of processes. In addition to that when ABB is conducting their annually NPS it turns out that OTD is the number one most important parameters for their customers. Despite this, the OTD for the operations department at ABB GA products have lately declined. This causes not only frustration and dissatisfaction among customers but also stress internally. In order to stay competitive and remain its high market share ABB has to, among many other things, have satisfied customers. Hence, delivering on time and reaching its internal goal of 95 percent OTD is crucial to succeed within its business. GA products and many other companies are currently measuring OTD on the past, which is the norm. Then it can be concluded that an order was late in hindsight, however the incentive to get it delivered on time is low since it already was late. But in order to act pro-actively a company such as ABB cannot have re-active KPI’s. This is the reason for proposing a new methodology that enables companies to work more pro-actively towards reaching a higher OTD by forecasting risk categorizations of order delay in advance. Thus, when the risk of delay of an order is indicated to be high, there is still time to act and make it to be on time.
1.3 Purpose and Aim Consequently, the purpose of this study is to investigate and understand which significant parameters that affects OTD within an ATO-company. Furthermore, to create a model, that classifies every order in the order backlog based on its possibility to be delivered on time. This model will help companies to work in a more pro-active way towards achieving a higher OTD.

13
1.4 Research Questions Based on the problematization in the above paragraph, we propose the following research questions for investigation.
1.4.1 Main Research Question
How can an assembly-to-order (ATO) company work proactive towards a higher on time delivery (OTD)?
1.4.2 Sub Research Questions
1. What are the most significant parameters that lowers OTD for an ATO company? 2. How can these identified parameters be utilized in a proactive way of work towards
higher OTD? To help us answer the main research question (MRQ), we have formulated it as a question requiring mixed methods, suggested by research (Tashakkori, Abbas Creswell, John W. 2007). Thereafter we have designed two sub research questions (SRQ) with requirement of qualitative and quantitative studies in a sequential manner. Where the latter one emerge as a result of researching the first one.
1.5 Delimitations In this section follows all the delimitations of the paper:
1. This thesis leaves out the possibility of constructing a software and focuses mostly on method and models for OTD delay forecasts.
2. When investigating how other companies work with achieving appropriate OTD. We also
look at companies with either production or assembling operations. We do not narrow down just to assembly-to-order (ATO) companies, but as well to make-to-order (MTO) and engineer-to-order companies (ETO). This is to receive a deeper understanding of what is important for an ATO company.
3. When looking at what parameters affect OTD, we look at each step of the internal flow of
ABB GA Products. We also look at first tier suppliers and customers. This is to narrow down the number of parameters in an effective way.
4. To have a high OTD there are two important factors, the first one is to promise an
accurate delivery date based on calculations, and the second one is to keep what is

14
promised. This paper only focuses on holding on to what is promised, not the process of calculating lead-times to customers.
5. We build the model based on the order backlog, therefore we do not indulge in any
demand forecasting.
6. This thesis is not claiming to suddenly increase OTD over one night. OTD requires efficient and solid processes and when having those in place, a model like the one in this paper can help to increase OTD even further. This tool is a part of a bigger strategy.
7. This thesis is solely focused on B2B companies.
1.6 The Expected Contribution of Our Master Thesis Based on the case of ABB GA products business unit, this master thesis will broadly contribute to the theory of operations management and production control systems with regards to a proactive approach towards performance measurement. Specifically, this will be done by introducing a proactive method for managing OTD and encouraging companies to act proactively before an order will be delivered late to make it on time. The extant literature focuses on how to reduce lead times with regards to a specific issue as well as solutions to improve OTD from a process-perspective, but these solutions are rarely a perfect way to abolish these issues. This is where our thesis fills a gap by focusing on real-time data regarding its effect on OTD, in order to capture those problems which slip through established solutions and offers a chance to be proactive towards solving them. The focus of the thesis lays on an operational day-to-day basis and is not a strategic initiative, it focuses more on small-wins rather radical solutions. Furthermore, pragmatically this thesis is supposed to contribute to ABB’s understanding of what their most crucial parameters affecting OTD are, and how to manage them in a more proactive manner. This study serves as a pre-study in order to implement a larger holistic approach and furthermore a basis for development of a software in order to increase their operations OTD.

15
2 Method
The methodological part of this thesis will describe how the research of this paper has been conducted, in order to answer the MRQ and subsequent SRQ. The chapter starts with research approach where an explanation of the work surrounding the paper as well as why ABB was chosen as the company to conduct the research at. Research approach is later followed by Research design, which describes why certain methods were selected in order to move the thesis from an initial research question to a conclusion. Then proceeds a detailed description of the three areas pre-study, literature study and empirical data gathering methodologies. Which in turn consists of semi structured interviews, workshop and quantitative operations data. The chapter ends with an explanation of how the analysis of gathered data vas carried out as well as how the credibility of the research was maintained.
2.1 Research Approach The research approach describes the work outside of the paper and some of the time management surrounding it, as well as why ABB was chosen as the company to conduct the research at. This master thesis was conducted by two master students at the Industrial engineering and management program at KTH. The production and digitalization topic seemed to be a great challenge and opportunity to leverage on previous knowledge from the computer-science trajectory within the program, but also to broaden our knowledge into the new territory of production. We started in January 2017 and finished in the end of May 2017. The master thesis report was conducted, mainly through a case study, at ABB GA products in Västerås, Sweden. Their business unit deemed suitable due to it being a classic industrial company with relevance as an industrial engineer. It has also gone from being a MTO business towards ATO, which makes them a company following the overall trend - reduction of value added in production, see graph 1 in the introduction section 1.1. As stated by our supervisor at GA Products, their operations processes level of maturity was rather low when it came to digitalization and working pro-active with OTD. As it is now they are keeping track of OTD at each stage of their internal process, and furthermore visualizing this for everyone to see at the office. Another benefit of choosing ABB GA Products as the company to conduct our research at was because it is just one business unit out of many at ABB, which would pose the opportunity to receive deep insight into other similar ABB businesses. Other companies might not have this option due to secrecy and integrity. However, this was avoided by choosing a multi-national group such as ABB. During the spring 2017, while working with the thesis we had continuously meetings with both our supervisor at ABB as well with our supervisor at KTH in order to receive feedback, problem-solve and help us with academic questions. There were also four seminars during this period. At

16
these seminars, we had the opportunity to receive feedback from our peers, as well as present what we had done, which in turn motivated us to continuously work with the paper and not to save everything until the end.
2.2 Research Design In this section, we will outline how we designed our research through a case study to answer SRQ one and later two, as well as all parts required to reach a successful conclusion. The use of case studies is preferred when the question being investigated is posed as “how” or “why”, which is the case in this paper. They are also useful when the investigator has little control over events, or when the focus of the investigation is a contemporary phenomenon within a real-life context (Yin, 2009). The use of case study can be done either by conducting different cases for investigating different issues or in the case of this paper, to investigate the same issue, but out of different perspectives (Voss, 2002). In this case study we used mixed methodologies, based on both qualitative data as well as quantitative data. Some might argue that multiple methodologies are rather time-consuming, but it is shown that the benefits often outweigh the problems, regarding receiving a more complete picture of the investigated phenomena (Shah and Corley, 2006). The thesis started off with a pre-study, which later on would lead us to use three methods to answer SRQ one and literature study to answer SRQ two. In order to accelerate our work and minimize our starting time in this thesis we started off by conducting a pre-study, containing a brief literature review to understand basic concepts related to production and OTD, as well as a round of contextual interviews. This was done by interviewing nine employees at GA Products to help us understand their current situation as well as their processes. This was done within the first three weeks of the thesis and resulted in a business process map (BPM), see figure 2. When understanding regarding the current situation was established, we moved on with our case study to conduct methods which would help us answer research question one and two. For SRQ one, we used three different methods for data collection. Each one of these methods served its own distinct purpose. We interviewed senior employees within companies similar to GA Products, they were responsible for operational excellence but their role varied some. We did this to get inspiration and to compare GA Products situation with others. Then we held a workshop to gather different perspectives and experiences from GA Products operations department related to OTD. Finally, we supplemented the prior two methods with an independent quantitative analysis based on data from their ERP-system SAP. This was done to make sure that all stakeholders had an objective and aligned view on OTD at GA Products. This analysis was also available for the participants during the workshop to enhance fact based discussions and provide inspiration. In

17
order to answer SRQ two, and later on the main research question, we continually read up on literature regarding the subject of the thesis. The research conducted in this paper has an abductive approach. This means the empirical material gives reason to possible change in theoretical material, and vice versa, to iteratively result in a converging conclusion (Blomkvist and Hallin, 2015). There is also research claiming pragmatism as a research paradigm which supports the abductive reasoning between iterative data collection and analyzing (Felzer, 2010). This established approach is visualized in figure 1.
Figure 1: A visualization of the used research design.
The result of this entire report is mainly of a qualitative nature. Empirical data gathered through it will be processed in relation to gathered literature and theory on the subject, as well as be reviewed with a perspective of criticism. The abductive iteration between theoretical and empirical data will increase validity in this study, since it will help converge the theoretical data with the empirical. After gathering data, the understanding of it and its relevance in relation to the problem of the thesis is important to understand. Since this study will be built on mixed methodologies, both quantitative and qualitative, we will require appropriate analytical work for each category.

18
2.3 Pre-study - Interviews, Literature Study and BPM We initiated the research at ABB GA products with a pre-study in order to understand the current situation as fast as possible and shorten the time in order to actually start the thesis work. This was done by focusing on three things parallel the first three weeks. First of we interviewed nine different people within ABB GA Products to understand how their part of the operations process work. For instance, what they are selling, who does what and what their state of departure from an OTD perspective is. The second thing we did was a smaller version of the literature study, looking at what is OTD, what is ROTD, what are the difference between MTO, ETO etc. Since both of the authors had close to none prior experience in production, quite a lot of reading-up was required to be considered serious when interviewing experts. The result of both interviews and literature study was a BPM. It was done to visualize for us and our supervisor at ABB GA products that we had understood the operations process, and where to look in order to solve the research question. This map was developed along the way but was finalized after approximately three weeks and became the sign that our pre-study phase was over, see figure 2 for BPM.
2.4 Literature Review This section describes how the theoretical framework was structured as well as how the sourcing of literature was conducted to be the foundation for an answer to SRQ two. The literature review was part of our study from the beginning, even helping us to set focus on our pre-study. In accordance with our supervisor at KTH, we tried to focus on the main areas of which our thesis touch upon, working from a bigger holistic perspective, in order to then narrow the review to what this thesis is trying to answer. The larger holistic areas we started investigating was OTD out of a traditional operational view, with an extra depth in production control and performance measurements. Furthermore, an extended perspective on value chain analysis and business process mapping was reviewed. The review then concludes with the areas OTD and factors of delays in orders. In this way, comparison with existing theories on a whole can be done. In the abductive approach of this thesis, we iteratively conducted the literature study parallel to the gathering of empirical data. This was done to further understand our findings of the subject as well as understanding existing theory in building a model for estimating future OTD. The theoretical data were predominantly gathered from renowned journals such as “Journal of Operations Management”, “International Journal of operations and production management” and “Production and operations management” for instance, as well as books, which often were

19
found on KTH online library, PRIMO. We started off by looking through journals presented by our supervisor to receive a better view and understanding of the subject. As mentioned before, this was part of the pre-study. Subsequently we went deeper with our theoretical research, browsing through material cited by read articles. This gave us a better understanding of the subject as well as a deeper sense of critical thinking towards it.
2.5 Empirical Data Gathering This section starts with describing the gathering of qualitative data through semi-structured interviews. It then moves on to describe the same thing for the quantitative data gathering and workshop. The data gathered for this study was mainly from ABB GA Products in Västerås. But also through other divisions and business units within ABB, as well as one other ATO-company. The use of multiple sources of data provides a triangulation of facts, which in turn makes the case study more convincing and accurate (Yin, K. 2009)
2.5.1 Semi-structured Interviews
When designing semi-structured interviews, it is important to have a few questions prepared in advance. These questions should be prepared in such a way that they produce follow-up questions which would be hard to prepare in advance, as well to still maintain some sort of theme of the answers between interviews. It is important to not underestimate the preparations required for semi-structured interviews (Wengraf, 2001), which is why, in this paper we carefully planned who to interview and hopeful outcome of it. Qualitative semi-structured interviews were used for the purpose of gaining information regarding the operations process and its effect on OTD. The goal was to gain knowledge on how routines regarding work to improve OTD is conducted, why OTD is of importance and what are the main issues affecting OTD in different areas. This was in order to further understand our research problem and receive inspiration towards our own solution as well. Open-ended questions were prepared in advance in order to have some sort of structure to be able to compare and aggregate responses from interviewees, these pre-defined questions can be found in appendix. All interviews conducted were done with two interviewers, where one focused on asking the prepared questions, and one on taking notes as well as observing the interviewee for possible signs and reactions. All interviews were recorded with consent from the interviewee and stored in the cloud. This was done in order to save data for possible validation of data as well to check if some notes taken during the interview were correct. Three focus areas were chosen for the interviews in an attempt to use the technique of triangulation of data sources to receive an increased accuracy of facts. These areas are internally within ABB GA Products, with individuals within operations. The second area for interviews are

20
with other divisions and business units within ABB. The third area is externally, with research experts working with similar problems as in this paper as well as one other ATO company with similar traits as ABB GA Products. When selecting interviewees, we were interested in individuals within operations of the targeted organization, which had some sort of influence and responsibility over the work affecting OTD, as well as competence regarding the subject. Through our supervisor, we received a recommended list of people to interview. These were all roles working almost daily with how they can improve OTD both in the short and long-term, therefore being of interest to interview, see table 1. In addition to the list mentioned above, Erik Förlin working with operational excellence at ABB Management consulting helped us to get in contact with relevant people at other units within ABB with the same characteristics as GA Products.
Internally
Name Organization Role Type Volume per year Revenue
Göran Lindholm
HV Breakers Lean and business development manager
ATO 4500 breakers 1,5 bil. SEK
Johan Ohlsson
Machines OPEX global ETO 100 machines -
Erik Förlin Internal Consultant
Senior Consultant - - -
Kerstin Olsson
Robotics OPEX manager PG SU
ATO 20 000 robots Confidential
Lina Heybroek
ABB Robotics Planning manager ATO 20 000 robots Confidential
Fredrik Ekdahl
ABB GA Products
Global operations manager
ATO 15 000 relays N/A
Externally
Magnus Wiktorsson
MDH Professor of production systems
- - -
Toni Cedermark
Öhlins Senior manager, supply chain management
ATO/MTS N/A 1 bil SEK
Table 1: Interview targets, both internally and externally from ABB
Internally within ABB, Göran Lindholm and Johan Ohlsson were of interest since they are both in charge of improving operations, as well as working in companies similar to ABB GA Products, with regards to quantity produced and being ATO-companies. Robotics, which consists of a much larger organization and production were also of interest because of their similarity of

21
being an ATO/ETO company. Fredrik Ekdahl was responsible for operational excellence at GA Products seven sites worldwide, he therefore knew the situation at GA products quite well and was particularly interesting to interview. Externally, we wanted to discuss the subject with someone researching the area of production and therefore possess a deeper knowledge of parameters affecting OTD. Through our supervisor at ABB we were given the opportunity to discuss the subject with a professor at Mälardalens University (MDH), which would possess an academic perspective on the issue. We also managed to conduct an interview with the senior manager of supply chain management at Öhlins, a world leading company within suspension for the racing industry. There we had the opportunity to oversee how other companies than ABB sets their strategy for meeting set KPI’s and foremost OTD. Five of the interviews were done through a physical meeting. These meeting resulted in a guided tour in their production facilities.
2.5.2 Quantitative Operations Data
This section describes why the quantitative data was used, where it was to be found and how it was refined for the purpose of analyzing it. ABB has a lot of data in their ERP-system: SAP, which was used to understand the situation and analyze it during the research. Example data that was used was production plans, customer orders, purchasing orders, OTD-historical statistics and metadata about OTD. We constructed and calculated even more metadata from existing data in the ERP-system, an example of this is the average delay of an order not being delivered on time. The data we retrieved from SAP with help from ABB GA products contained many gaps due to less smart side-effects in SAP and therefore needed reparation. To solve this issue, we used simple logic. For example, the data contained timestamps for sequential processes, e.g. when events A, B and C happens sequentially, and the date for B is missing when A and C happened at the same day. Then it is safe to say that B happened on that day to. In this way, we expanded the data with approximately 40 000 data points, which corresponded to a five percent growth in total.
2.5.3 Workshop
The workshop section describes the purpose of the chosen method, as well as how it was conducted. Its purpose was to collect the total experience and knowledge from the employees within GA Products to answer SRQ one. We invited at least one person from every team within the operations department to receive a broader spectrum of perspectives. In addition to that, one person from strategic sourcing participated. He was invited to contribute to the strategic sourcing perspective and engagement in this thesis. The participants ended up being 12 people, all invited to participate in the workshop. The selection was based on our prior experience interviewing people in our pre-study, our supervisor

22
but also capacity constraints. Nine people came to attend the workshop and did so very actively. They all represented every function in the operations department and therefore could be thought of as covering the entire spectra of the operations process. The represented functions were factory support, order intake, packing, production, transport, production planning and strategic sourcing. In addition to that we had the manager of the operations department and a senior process developer attending. The team of participants were very experienced, with an estimated average time spent at ABB of 20 years. Approximately 14 days prior to the workshop every participant was invited to the event, this invitation contained a brief description of the workshop, mostly important its date and time. Seven days later and one week before the workshop took place more detailed information was sent out. This e-mail contained what we were going to do in detail at the workshop, its purpose as well as some inspirational material from our quantitative analysis. This was done in order to get the participants more engaged. The sought scenario was that everyone would start to think about OTD and the operations process before arriving at the workshop. When arriving at the two-and-a-half-hour long workshop, the first thing was to introduce everyone once again to our work, why were we at ABB, who we were and then started to set the scene. After that, we went through the agenda in detail for the morning. This was followed by informing the participants about the groups and tasks they were going to perform. Three groups of three members per group was formed prior to the workshop based on personality type. This was done in order to make every group have a mix with some more eccentric and others more thoughtful and therefore have a better balance in the group. The first of the three tasks in the workshop was to identify as many causes to an order not being on time as possible. We chose to call the causes flags, they will therefore be referred to as flags from now on. Every group wrote every flag on an individual post-it paper. Every group was encouraged to strive for quantity in this brainstorming activity. After that, the second task was to refine and develop every flag. This means to write a short text to describe each flag. Also to state whether a flag was possible to measure or not, as well as where it could be found. An example of a flag that was mentioned in the workshop was if the order was going to a certain country. Some countries require tremendous paperwork and certificates attached in the delivery, therefore it is rather common that these orders are late because this pre-paperwork takes time. The third and last task of the workshop was to position all the flags relative each other in a grid described in graph 2. On the x-axis was the frequency of that certain flag, and the y-axis represented how much impact it did on orders ability to be on time.
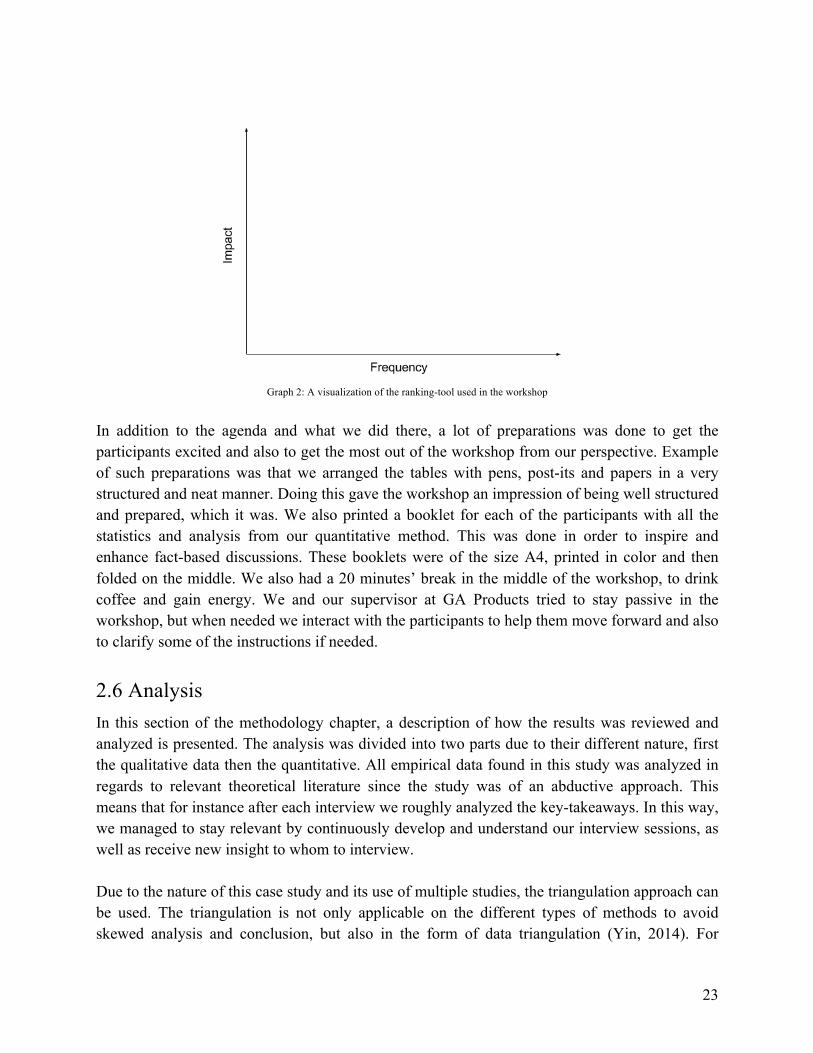
23
Graph 2: A visualization of the ranking-tool used in the workshop
In addition to the agenda and what we did there, a lot of preparations was done to get the participants excited and also to get the most out of the workshop from our perspective. Example of such preparations was that we arranged the tables with pens, post-its and papers in a very structured and neat manner. Doing this gave the workshop an impression of being well structured and prepared, which it was. We also printed a booklet for each of the participants with all the statistics and analysis from our quantitative method. This was done in order to inspire and enhance fact-based discussions. These booklets were of the size A4, printed in color and then folded on the middle. We also had a 20 minutes’ break in the middle of the workshop, to drink coffee and gain energy. We and our supervisor at GA Products tried to stay passive in the workshop, but when needed we interact with the participants to help them move forward and also to clarify some of the instructions if needed.
2.6 Analysis In this section of the methodology chapter, a description of how the results was reviewed and analyzed is presented. The analysis was divided into two parts due to their different nature, first the qualitative data then the quantitative. All empirical data found in this study was analyzed in regards to relevant theoretical literature since the study was of an abductive approach. This means that for instance after each interview we roughly analyzed the key-takeaways. In this way, we managed to stay relevant by continuously develop and understand our interview sessions, as well as receive new insight to whom to interview. Due to the nature of this case study and its use of multiple studies, the triangulation approach can be used. The triangulation is not only applicable on the different types of methods to avoid skewed analysis and conclusion, but also in the form of data triangulation (Yin, 2014). For

24
instance, with regards to the workshop session, we received data regarding the same subject, but from different sources in order to have different perspectives on the same problems.
2.6.1 Qualitative Data
During all the interviews, the analysis and extraction of relevant take-away was done continuously. It was based on intuition and what was relevant to our research. It is quite complicated to limit people to talk to just about our topic, they tend to talk a little bit about everything. This requires us to sort what they say, in order to reach the goal of the interviews, which would be answers that would help us answer SRQ one. In the end, by internal discussions of what was of most relevance to us, we could aggregate the common reasons and thereafter use them for the model. After the workshop an analysis was done, we developed the flags and sorted between them. Approximately 15 flags were of such characteristics that they were very hard to involve in the model of this paper. An example of such a flag was the “Inaccurate stock balance”. The system says that we are supposed to have 10 of some component in our stock, but in reality there is none. A flag like this one is of course valid, since it can cause orders to be late. However, its characteristics is such that it cannot be predicted, thus it cannot be used in a model like the one in this thesis. Therefore, flags with some characteristics such as this one was eliminated.
2.6.2 Quantitative Data
The analysis of the quantitative SAP data had a rather exploratory characteristic. When analyzing this data, we created a lot of different graphs and tried to visualize the content of the raw-data. Some of the analysis done was also based on intuitions by employees. They thought that a certain phenomenon would be in a certain way - which we then could either prove or disprove from a fact-based perspective. In this way, the quantitative data served as a complement to the qualitative methods and therefore increased the validity of the data.
2.7 Reliability, Validity and Generalizability In this section reliability, validity and generalizability of the case study is reviewed. These are typically the common bases for judging the credibility of research. Reliability is often referred to as how well the research approach is neutral in its effect, its possibility to replicate and if it is general enough to use in multiple occasions. Validity is a term that is used to describe how accurate and precise the observed data is. It is also used in viewing how relevant the data is regarding the stated research question. Generalizability, also called external validity, refers to the possibility to apply findings from this research to other areas or phenomenon, not only let the findings be unique for this particular case (Denscombe, 2010). In case research, all these concepts could be more difficult to achieve if done wrong and not prepared. Case studies

25
therefore need to maximize their qualitative control of their research in order for further research to replicate and apply accomplished result (Yin, 2014). Reliability Reliability is harder to achieve in a case study where the methods are more of a qualitative nature, than in a more quantitative study with statistical results. In our case study at ABB GA Products we use methods such as interviews which by the impact of the interviewer and in what context the interview is conducted may cause difficulty in consistency and objectivity. This in turn would cause this type of method harder to replicate. Therefore, as much documentation regarding the process as possible were conducted. Both preparation was done in deciding and documenting in what the open-ended questions should be as well as why we should ask them. Also, thorough interview notes were documented in order to follow up on our interviews in hindsight. This would help other researchers to copy and replicate this method we used in order to achieve common results (Gibbert et. al. 2008). In our other methods such as workshop where we achieved a lot of useful results, we had a clear plan from the start. This consisted of the agenda of the workshop, why it was conducted and the aspired outcome of it, which then would serve as a basis for replicating this method and use it in other research if needed and therefore good for reliability. The most difficult method in regard to reliability was the gathering and analysis of SAP data. We had a clear plan of first making the data more complete, which we described how to do by examples in the data gathering section of methodologies. These examples and how to analyze them in form of structuring insightful power point slides, to some extent depends on how the data received from the start looks like and its characteristics. We try to address this by describing it and conducting it in a general manner, and in the end, the findings of the SAP-data was rather negligible in comparison to the results given by other methods, which would reduce its impact on reliability. Validity In order to achieve high validity within a case study, three tactics can be followed (Yin, 2014). The first one is to use multiple sources of evidence which would converge lines of inquiry. In this case study, we not only used different types of data such as receiving some from interviews, other from quantitative databases such as SAP and some from workshops. We also managed to obtain a wide range of experts in our interviews, ranging from different parts in ABB GA products, other divisions in ABB, as well as external from ABB. This in turn would contribute to the converging lines of inquiry, a sort of triangulation which would cause findings and results to be more convincing and accurate. The second tactic is to establish a chain of events to ensure that the data is connected to the result. This means the possibility for an external reader of the case study to follow the study all the way from the initial research question to the final conclusion of the case study. In this case

26
study, the aim of all the methods has predominantly been regarding answering SRQ one. This has been emphasized thoroughly by connecting how the used methods has resulted in answering the research question, and this has been structured in such a manner in the report to ease this for the reader. The third and last approach is to iteratively have the report read and reviewed by key informants in order to get the work, its data and its results confirmed along the way. In order to keep our result in a line of inquiry we constantly let our key-informants at ABB review our results, as well being questioned regarding methods and conclusions. This iterative approach would then help to support validity of this case study. Generalizability When conducting both single or multiple case studies, statistical generalization is not possible (Yin, 2014). This does not mean that case studies are non-applicable of the concept of generalizability. In methodology, difference is made between statistical generalizability and analytical generalizability. The analytical approach differs from the statistical one in the way that it generalizes from empirical observations to theory, instead of population, which is how the case study applies the concept of generalizability (Gibbert et al, 2008). In order to find analytical generalizability within our work, we focused to position our work in between three theories regarding the research question and compare our results towards them. Even though the case study was conducted at ABB GA products, the research question is asked in a generalizable manner and the answer should in theory be able to help similar companies as the ATO business unit in which the study was conducted. To summarize the credibility of the report, we have focused on working towards the three pillars of credibility; reliability, validity and generalizability. This has been conducted before the research even begun, as well as iteratively towards the end. When analyzing the credibility of the report, it is safe to say that the three parameters supporting it are fulfilled.
2.8 Ethics When starting our thesis work at ABB, we signed a contract stating what we were supposed to deliver, what the compensation for our work would be as well as that all important findings would belong to ABB. The department where we then were going to spend our upcoming four months at was informed that we were two master thesis students there and what we were writing about, this was done in order to let everyone know of our intentions. We also stated who we were and what our purpose was every time we had some sort of professional interaction with employees at ABB, such as through interviews or workshop. Permission was asked every time we recorded an interview or took pictures. An agreement has been made with ABB to not disclose any confidential information, such as certain financial numbers nor operational or strategic plans.

27
3 Literature and Theory This chapter will investigate previous literature and research regarding both SQR. The first two sections will be about a traditional view on OTD as well as an expanded view in order to give a broader perspective on how OTD relates to the existing literature. The traditional one will focus on the understanding of operations and production control, while the expanded view will look into value chain analysis and business process mapping. Thereafter a chapter about OTD will follow in order to enhance the understanding of the concept OTD. When OTD is reviewed, a section of understanding the underlying factors of OTD follows.
3.1 Traditional View on OTD: Understanding of Operations and Production Control On time delivery as other KPI’s could be difficult to understand without the understanding of how an operations function work and its role within an organization. This understanding of operations and its processes could be understood within the traditional view of operations management and production control, focusing on plant management and in isolation of firm strategy. Operations management is the field of management research centered on how to manage the operational part of a company, how should a company produce their goods and services, and thereby relates the operational performance of a company to its financial performance (Jacobs et. al., 2016). The operations manager is the one with responsibility of these functions within the operations process, whether they are individual functions or the entire process. Some of these key-activities are (Slack et. al., 2010): ● Understanding the operations strategic performance objectives: This means to
understand what the organization is trying to achieve. To form right strategic and performance objectives.
● Developing an operations strategy: Since operations involves many decisions, it is important to have general principles and routines developed which aligns to the long-term goal of the organization.
● Planning and control: This activity is crucial and decides what to produces and when, then making sure that things are actually getting done.
● Improving performance measurement: The continuing work of improving the performance of the operation, and furthermore the entire organization.
In the book by Slack et. al. (2010), they mention how it is the operations function that supports the entire business of the organization to respond to challenging and changing business environments. Some of these changes they mention can be seen in table 2. There, some changes are towards a more complex customer relationship, in regards to demands for better service,

28
more choices and higher quality expectation. This is also something mentioned in a more recent article by Schonberger et. al. (2017). They talk about the importance of meeting these changing customer demands in order to maintain competitiveness. Some researchers even claim that it is the entire supply chain that competes and not merely the organizations with their own strategies (Chibba, 2017).
Changes in business environment Operations response
● Higher quality expectations ● Demands for better service ● More choice and variety ● Frequently new products ● Rapidly developing technologies
● Globalization of operations networking
● Information-based technologies ● Internet-based integration of
operations activities ● Customer relationship management ● Flexible working patterns ● Mass customization ● Operational excellence ● Fast time-to-market methods ● Lean process design ● Failure analysis
Table 2: Changes in business and the response by operations.
Operations management is a broad subject and the entire spectrum cannot and will not be covered in this literature study. Instead a focus will be set on the more relevant areas for this paper, such as production control and performance measurement. This will be covered in the following part. Production control is the area on how to control and monitor production, e.g. control the refinement process. It aims at creating and sustaining conditions so the right number of products of the right quality at the right moment in time is produced in order to maximize their profit (van Rijn, 1989). Control in operations on a whole is also described as the process of coping with changes in plans and redrawing them in the short term in order to meet customers’ demands, for example finding a new supplier or repairing a machine quickly (Slack et. al., 2010). It can also involve any task related to production, such as scheduling, handling materials and making sure facilities are correctly staffed etc. In order to control an organization's production and operation to meet the objective of set plans, routines must be in order and performance measured. Performance measurement is the process of quantifying actions, where measurement relates to the quantification, and performance of the operation stems from actions taken by the operations managers (Neely, 1993). It would be impossible to continuously exert some sort of control over operations, without performance

29
measurements. Some common aggregation of performance measurement are the following areas; cost, dependability, flexibility, quality and speed. These measurements are measured and then compared with set goals, commonly what demanded by market. Then work is formed to align the organizations values with the demand of the market. The work with performance measurement can be summarized with three generic issues (Slack et. al., 2010). ● What factors to include as performance measures? ● Which are the most important performance measures? ● What detailed measures to use?
When talking about performance measurement, one usually talks about Key Performance Indicators (KPI’s). According to Parmenter (2015), KPI tells the management how they are performing, and if by monitoring them, management can take appropriate measures to greatly increase performance. There is also a distinction between KPI’s and Key Result Indicators (KRIs). One of the most important KRI is profit, but that is not performance, it is a result. The most common KPI on the other hand is OTD, which will be reviewed in a more detailed matter further down (Parmenter, 2015). Parmenter (2015) has also made a list of all the parameters of a successful KPI, see table 3.
Requirement Description
Nonfinancial The unit of the measurement should not be expressed in dollars or yen, etc.
Timely Should be measured frequently
CEO focus Acted upon, by the CEO or management
Simple Everyone understands the KPI
Team based Responsibility can be tied to an individual or a team
Significant impact The KPI should measure something of major impact of the entire organization
Limited dark side They encourage appropriate actions. Good actions should be rewarded and vice versa
Table 3: An exhibit from Parmenters book from 2015, which describes parameters of a successful KPI.
In table 3, the parameter regarding encouraging appropriate behavior and that good actions should be rewarded, is something that might come easier if employees participate in the development of these performance measurements (Groen et. al., 2017). Groen (2017) also state that this causes the employees to feel that these measures are of higher quality, and that they are in better control in order to perform well in their job. Parmenter (2015) segments KPI’s into two

30
parts. The KPI’s which are “lagging”, which means measurements that can be measured in hindsight of a problem. Then there are those, which he calls “leading”. These are KPI’s that are supposed to measure in order to incite proactive behavior. This is rather progressive and an increasing trend among performance measurement, according to Neely (1995). He states a common method and area to explore in order to be proactive and predict negative impact before to much damage has been done is in statistical process control (SPC). It is a method which use statistical methods to forecast potential outcomes of processes, and by that is truly proactive in a leading way. Even though performance measurement is a strategic endeavor implemented by many organizations, the research area still has a lot of challenges left to solve, such as more focus on acting upon these measurements (Gao, 2015) As mentioned earlier, it is important to understand what are the most crucial parameters to measure for an organization. There are different approaches by doing this, but one way to understand the activities within the operation process as well as extending operational boundaries can be found in value chain analysis and business process mapping. The importance of understanding the value chain as well as business process mapping can be found in the section below.
3.2 Expanded View on OTD: Extending Operational Boundaries In today's business climate, operations cannot only be viewed as an isolated phenomenon in order to add value to shareholders. It should instead be a phenomenon viewed in line with a business strategy. This type of operational understanding and insight can be derived from business process mapping and value stream literature. Below is an aggregation of such literature in order to expand the view on OTD and lay a foundation for better understanding of upcoming sections such as On time delivery, and Factors of delay. There is plenty of literature regarding the strategic importance of improving a company’s value chain. Michael Porter, first wrote in his book “Competitive advantage” (Porter, 1985), that there are five generic activities for a company to focus on to compete within an industry. Three of them are operations, inbound and outbound logistics, which are the parts covering the scope of this paper. He also discusses the importance of support functions e.g. procurement to achieve a competitive edge, which is of significance to understand possible reasons of failing OTD. Even if the theory of value chain analysis, to gain competitive advantage is well known and widely spread, it is important to not see each activity in the value chain as independent. There exists a relationship between activities, and the level of competitive advantage depends on how well this interrelationship is managed as well as how they are managed individual. This linkage between activities can affect the competitive advantage in two way, optimism and co-ordination (Prescott, 2001). In a paper about implementing a model for improving OTD for a manufacturing organization, the authors discuss the importance of focusing on the entire process in an

31
organization instead of just evaluating individual units performance. If a single unit performs on time it has performed its duty, but it is of importance to take the whole process into consideration and evaluation to easier see problems as the occur (Karim et al, 2010). This is in line with earlier mentioned theory about value chain analysis by Michael Porter and Prescott C. Ensign (Prescott, 2001; Karim et al, 2010). Viewing the process externally is also of importance. Sharing information with customers is as important as sharing internally within the process in order to achieve a superior supply chain performance (Huo et. al., 2014). The use of looking at the entire value chain and the process of it, can be of help to better understand data within the value chain but also the problems associated with it, e.g. the implementation of a model to measure OTD (Karim et al, 2010). An established model used by previous mentioned paper, is the use of Business Process Modeling (BPM). This is a theory and model defined by Melenovsky (Melenovsky, 2006) as a management discipline for process-oriented organizations, with the goal to improve on operational performance. With BPM, research show that a process-oriented organization can achieve three important outcomes: Clarity on strategic decisions, Alignment of an organization's resources and increased discipline in daily operations (Spanyi, 2003). All these three are factors are of interest to help to answer given research question.
3.3 On Time Delivery KPI’s and especially OTD has now been put into context by increasing understanding of operations and production control, then extending our view with value chain analysis and BPM. It remains to understand what OTD is, its importance in today’s industry, both in operations as well as in a strategic view. This is done by investigating previous literature and journals which tackles this subject in order to see what is of relevance to this study. This investigation can be found below. There have been many articles written the recent years with focus on investigating causes as well as improving OTD for manufacturing companies (Karim et al., 2010; Samaranayake, 2012; Donderwinkel, 2015). OTD has become more of a competitive factor and customers tend to use it more and more as a performance measure, which in turn drives manufacturers to focus on it (Chibba, 2015; Hill, 1993; Keebler, et al. 1999; Peng et. al., 2017). A few of the most important reasons for why OTD is one of the most relevant KPI’s are (Lödding, 2013); ● Customer trust: Customers will become doubtful if a delivery date is promised to the
customer then not kept. ● Follow-up costs of delayed delivery: If a delivery is delayed, then loss of utilization or
even standstill of a customer's assembly belt might occur. ● Delivery time: If delivery time is not met, then customers will plan for additional delivery
time buffers, causing ordering on speculation.

32
OTD is also particularly important for ATO and MTO companies, i.e. who produces things on order. These orders usually consist of custom parts that needs to be ordered from several different suppliers. In order to avoid supply-demand mismatches it is important to synchronize downstream with complex customer relationship, which in these day can be volatile, uncertain, complex and ambiguous (Schonberger, 2017). Demand-supply mismatch is also something that has resulting in foremost excess inventory, but also production disruption, as well as product introduction (Hendricks et. al., 2017). This puts a further complexity and exposure to competitiveness on manufacturers to meet targeted OTD, which also can be improved by looking at vertical integration of the value chain (Yue et al., 2009). A study from 2010 on Swedish companies shows that this is a performance measurement commonly measured by order line or item level, as well as using daily time units, instead of e.g. weekly or monthly. Which is also true for the targeted company for this specific case study (Forslund and Jonsson, 2010). There is also some research stating that for an ATO company it is important to understand that different delivery performance measurement affect customer separately. It is shown that for instance OTD is a delivery performance measurement associated with achieving a higher unit price for customers (Peng et. al., 2017). Which in turn is a good sign for ABB, who are more of a premium supplier to the grid market. Many articles discuss the importance of OTD as a performance measure (e.g. Keebler et al. 1999, Karim et al. 2010, Stock and Lambert, 2001) but few discuss the underlying causes of it and possible ways of proactive preventing negative impacts on OTD. Furthermore, there has been evidence shown to not only focus on inventory management to improve operational outcomes. It is argued to not be sufficient enough to only focus on inventory management to increase measurements such as OTD, as well as product quality and productivity (Vastag and Whybark, 2005). It is difficult to find articles regarding information on how to tell typical warning signs that will impact OTD negatively in the future. An approach of measuring and improving on time delivery is by integrating performance management processes (PM), and this becomes even more important when orders change and the flexibility of deliverance becomes more important. This is done to control and give feedback to strategic management and operations (Forslund and Jonsson, 2010). This approach is not the only one, many models and solutions has been built in order to solve issues affecting KPI negative, foremost OTD. The famous statistician George Box stated, “All models are wrong”, which he later revised to "All models are wrong but some are useful" (Box, 1976; Box, 1979). What he means is that models are only approximation to reality and not the full truth of a situation. In the following section are models presented by previous research on the subject of especially OTD. What they try to illustrate as well as their shortcomings. There are many proposed models within production, but one model proposal for OTD and of relevance to the problem stated in this report is by Samaranayake et al (2013). They propose a

33
model built upon fuzzy logic and real-time data from a company’s ERP-system. The purpose of their model is to input data regarding variations in demand forecasting, materials shortages and distribution lead time. With this data, the model can output a percentage value of the probability to produce said product in time of deliverance. This article is relevant in the sense of forecasting OTD-probability as well as analyzing real-time data from ERP-systems, which is of importance for this paper as well. What the paper lacks is a representation and traceability of what root causes has the biggest impact on the forecasted OTD. This is important for the company in this case study in order to early on resolve issues. Zou and Li (2006), solved a problem with how rush orders and machine breakdowns affect delivery date by introducing a job shop scheduling process they built, combined with an EIS and ERP. Seo et. al. (2015) proposed a model to prioritize high-priority orders in order to increase on time delivery. Their proposed answer was a trade of maximizing the utilization of factory tools as well as prioritization of order-slots. Even though their solution improved OTD, it only focused on a semiconductor chip company, which might not be representative of the entire industry. Sarker and Wang (2006) concludes that mathematical supply chain models could be of help, but it is very difficult to develop a mathematical model general enough to incorporate every salient feature, lead time, delivery time and much more. Another requirement for creating a successful model, working proactively towards OTD is to understand what factors are affecting delay.
3.4 Factors of delay When measuring OTD, it is important to understand the goal of it. It is measured in order to resolve some issue affecting a company negative in regard to its customer. In order to resolve such issues, it is of great importance to understand what the factors are that would impose a delay on an order. Such factors and reasons of delay will be reviewed below with regards to relevant literature. In order to measure the underlying causes of why orders are late, it is important to automate data collection across the value chain, and to improve this by integration of information of each step (Forslund and Jonsson, 2010). With the trend of digitalization and its impact on manufacturing industry in terms of data volumes, computational power and connectivity (Baur and Wee, 2015), data collection and integration across the value chain is more prevailing than ever. A root cause of poor OTD is commonly connected to inventory issues (Lin et. al., 2000, Maia and Qassim, 1999), where usually MRP-systems is used to plan required material and capacity. These systems on the other hand has been found to be insufficient as control systems as well as in detailed planning of scheduling and capacity (Vandelaele et. al. 2000), especially in times where just-in-time (JIT) with its focus on short lead times and reduction of inventory, has taken an increased position since increased demand of flexibility of deliverance (Koh & Saad, 2006; Schonberger, 2017).

34
Reasons why orders within a production company are late could be many. A paper investigating this issue is Donderwinkel (2015). They also have a focus on improving OTD of a manufacturing company, but with a focus on inventory and supply management. In their paper, they assume the major issue of orders being late is related to material shortage connected to inventory due to poor inventory and supply management. They propose a solution on how the company in their paper should cluster their products in more appropriate manner to improve and understand their importance. They also work out a solution on replenishment policy of the company in order to keep a safer security stock. This is a problem which haunts every ATO-company, which thereby makes the article relevant to this paper. What the paper lacks in relation to this work though, is how they establish the root causes for OTD, and that it is rather narrow minded in how this solution of only looking upstream in the value chain will be a game changer for the company. There has also been more technical solutions applied to improve inventory management and furthermore OTD. Optimal batch scheduling has been studied for manufacturers delivering multiple products to multiple customers, with focus to minimize inventory cost and batch cost of suppliers (Selvarajah and Steiner, 2006). Another logistic issue related to OTD is the bullwhip-effect, where fluctuations in demand increase upstream in the supply chain. The further away from the end-customer the greater the increase is (Forrester, 1961). The problem causing this issue is customer's response to increased lead times by ordering more than they need (Sterman et. al. 2015). This effect lowers the logistic performance of the entire supply chain and increases its logistical cost. The bullwhip effect also promotes the development of overcapacities and negatively impacts the enterprise’s delivery reliability (Lödding, 2013). In an article by Karim et al (2010) which touch upon how to analyze what is important for a company to improve their OTD. They systematically investigate the underlying causes for an order being late and proposes an OTD improvement model which increased the OTD for a MTO company from 10 to 65 percent. The approach of which they find the root causes of poor OTD and structured solution is of importance to this paper. They found underlying causes for why an order is late through a business process model combined with product development and customer order management processes. This gave them the chance to understand the processes better and where to find the issues causing orders being late. What the paper lacks is a pro-active thinking towards OTD, and that the model is not constructed to adapt to new root causes for poor OTD. Their lacking in proactive thinking towards OTD is probably due to their low level of maturity in OTD. It is most certain companies with higher level of OTD and maturity towards it, which start focusing on proactive work towards improving OTD. When understanding what the factors of delay can be found in a process, an organization can work towards increasing their OTD and better their operations This can be done by letting frameworks and models be put to use in order to standardize processes and reduce waste.

35
4 Empirical Setting
In this chapter, a short presentation is done of the empirical settings in our case study. It starts with a broader description of ABB on a whole, then follows a more detailed description of the specific business unit where this case study was held, ABB GA Products. The chapter is then concluded with a description of the specific operations process we focused on.
4.1 ABB ABB is a multi-national corporation within electrification, robotics, industrial automation and power grids. ABB is headquartered in Zürich, Switzerland, where it settled down after the merger between Swedish Asea and Swiss Brown Boveri in 1988. ABB had in 2016, a total revenue of 34 billion USD which makes it the 286th biggest company in the world. ABB is listed at Nasdaq Stockholm, SIX Swiss Exchange in Zürich and the NYSE in USA.
4.1 ABB GA Products GA Products is short for Grid Automation products. The business unit is responsible for marketing, development, sales and manufacturing of protection as well as control equipment for the national and regional power grids. The business unit’s portfolio largely contains the IED Relion 670/650 and CombiFlex which in various ways protect equipment in the grid. It can for instance protect transformers or generators from catching fire when something goes wrong. The IED or safety relay which is the main product of GA Products can be thought of as an advanced earth fault switch.
4.1.1 ABB GA Products Operations The operations department is where our supervisor Erik Strömberg works as a manager within operations. The operations department was responsible for the daily-work regarding orders. All the way from receiving the order, making purchasing orders, planning production, producing the safety relays, packing them and dispatching them to the customer.

36
5. Empirical Findings This chapter aims to present the empirical findings of the case study at GA Products. This is done through explaining the two phases of our results. The first phase consisted of a pre-study in order to scope the thesis. The second phase is the semi-structured interviews, quantitative data analysis and a workshop, which all helped answering sub-research question one. Sub-research question two is answered separately in the next chapter - “Flag based model to classify orders ability of being on time”, were we explain how we built the entire model used for classifying flags regarding risk for future OTD. ABB GA Products operations manager knew that their OTD had declined and understood that there was room for improvement. For the moment, work only seemed revolving putting out fires to achieve requested OTD. GA Products had the vision of proactive work towards the future, but was lacking a plan and required human resources. They also had some data, but its granularity was not enough, nor sorted in a comprehensive manner. To understand the factors regarding OTD in-depth they offered us to consider their situation. To understand the current situation at ABB GA Products and set the scope of the thesis we began with a pre-study. When the pre-study was completed and a broader perspective and knowledge was developed, the more interesting study could be conducted with focus of answering SRQ one:
- What are the most significant parameters that lowers OTD for an ATO company?
5.1 Phase one: BPM, SAP-data and Contextual Interviews The first phase of this thesis contains the results of the pre-study. Also, how it was structured and the methods contribution to its result and how it contributed to the overall research question. It is divided into two sections: SAP and BPM as well as contextual interviews. Even though divided into two sections, they iteratively contributed to each other's development. For instance, further development of BPM guided us so we could understand what was unclear at the moment, and thereby contribute more to whom we should interview and what to ask.
5.1.1 Data: SAP and Business Process Map
To understand where to start our search for an answer to SRQ one we began to investigate all possible data from SAP available. With our empirical findings from e.g. production-, order- and purchasing data, we could start to map out the operations process within GA Products. This in order to receive a deeper understanding of the order flow and relationship between different functions within the process, furthermore to move closer to an answer to both SRQ one and two.

37
Figure 2: Process map of the operations process flow.
By visualizing their operational process, we developed a more clear and holistic perception. We could see what had been done-, what data could be found-, who worked in each function- and what systems was used in the process, as well as where it started and ended, as seen in figure 2. We could now see that almost all data in every function could be found in SAP. We could also see how procurement worked as a support function to operations, and that operations is depending on them with requests. During the investigation of SAP-data, several underlying issues that could affect a successful implementation of a future model was identified. Example of such, is that every order that was delayed is given a reason for this. These reasons were technical problem, material shortage, capacity shortage, complete delivery or unknown. Approximately 21 percent of all delayed orders from 2016 was classified as unknown, which is hard to make any conclusion from. Furthermore, the orders given the reason technical problem, did not make it clear whether the technical problem was at ABB or its supplier. During 2016, 12 percent of all delays could be derived to technical problems. Another phenomenon observed in SAP is statuses. These statuses signals where in the production process an order is. For instance, when an order is produced and is ready for packing, then it is given the status “Available”. One software developer at GA Products constructed a script that did a look up at every order four times per hour to fetch the current status and save it down. With this GA Products can make retroactive analysis with much better quality. Unfortunately, if one

38
order got more than one status in a 15-minute span, the first of them got lost. This is due to the statuses are not saved, only overwritten every time the lookup-script is run. This was very clear in their SAP data, it contained many holes. But with the available data we did conduct a rigorous analysis. Unfortunately, most of this analysis cannot be part of this paper due to confidentiality of ABB. Example of insights were that 70 percent of all their delays were 1-10 days long. Up to 32 percent of their delays were related to material shortage. Furthermore, 12 percent of all their delays was due to positions waiting for another yet incomplete position and the customer required complete delivery. In addition to this, we also saw some trends such as the order-intake over time was very volatile, and that delayed orders tend to occur in clusters rather than evenly spread throughout the year.
5.1.2 Contextual Interviews
When we began to map out the operations process, we also conducted contextual interviews with individuals and sub-managers within each function of the operations process. In this way, we could visualize what factors such as what data could be found in each function, who worked in each function and who was in charge, as well as what different data systems was used in each function, and how the flow of information worked. When mapping of one function was done and we for instance saw that we lacked understanding of how a released order moved on to become a production order, we asked around who to interview to receive further understanding of the process flow. This iterative process went on until we found our self-understanding the entire process and when the BPM stopped raising question we could not figure out the answer to.
5.2 Phase two: Semi-structured Interviews and Workshop The second phase was initiated when we, through our pre-study had come to conclusion on the scope of this thesis and the state of departure. These results helped us in order to proceed with our two next methods, semi-structured interviews and workshop.
5.2.1 Semi-structured Interviews
The interviews contained both high- and low-level interview targets, as well as subjects from different business units of ABB, giving the result a more triangulated source when exposed to different perspectives. In our interviews, we found issues all along the value chain, starting with the suppliers all the way to the customers. In some areas, issues were also mentioned by multiple interview subjects, making them even more relevant. When for instance asking the question regarding issues causing negative impact on OTD, many interview subjects backtracked upstream along the value chain, with the possible attempt of

39
finding the root cause. This may be the reason why many mentioned complications regarding suppliers. One of the interviewees stated following regarding negative impact on OTD: “One major reason which impact our OTD negative is bad quality of purchased goods from our
suppliers, quite often due to our own mistakes in the technical specifications in our quotas.” - OPEX manager PG SU
This is also a reason mentioned by two other interviewees. A global operations manager at ABB describes the issue as annoying, and that it is completely our own fault. It could for instance be R&D defining incorrect specifications to their suppliers, and when the lack of quality is discovered, then it is too late to fix it. Another issue concerning suppliers impact on OTD is the following:
“Our suppliers cannot keep their lead time, this could also possibly be due to us providing poor forecasts” -
Planning manager The issue of bad OTD of suppliers is also something mentioned by a strategic sourcing manager at GA Products globally. He states that when the time comes to measure the OTD of the suppliers at the end of a time period, then the supplier has the chance to interpose possible objections for errors they believe is caused by ABB and not them. In this way, the suppliers can increase their OTD in hindsight, making the data hard to analyze. The work of the strategic sourcing department is also something discussed by the Global OPEX Manager at Machines.
“Strategic sourcing department is not very mature, focusing more on cost than quality” - Global OPEX manager
It was also mentioned that the strategic sourcing department is measured on its amount of spend in emerging markets, this in order to keep cost down. But this in turn might contribute to choosing suppliers with lower OTD, causing an issue for the operations department within GA Products upstream. To conclude we can see that many warning signs can be found upstream within our supply chain, not only with our suppliers isolated, but also ABB’s interaction with them. The most substantial challenge, mentioned by most interview subjects was the first issue raised in the supplier findings, which is the issue of bad quality of purchased goods from suppliers. If we move focus further downstream in the supply chain, we have found some major and common issues internally causing negative impact on OTD, within our own production for instance. One of these difficulties is described as:
“Internal quality. We mount things the wrong way, bad tools and other issues” - Lean and business development manager

40
This issue is one of many complications concerning internal problems, but all of them are rather similar, most is regarding capacity problems. A manager for OPEX globally mentions a common problem to be that our own production cannot keep up the pace as calculated, causing delay in production and furthermore possible lowering OTD. The lean and business development manager mentioned earlier also stated that an issue could be when introducing new products, then it is common to promise customers lead and delivery-times that are not realistic. This is not only an issue when introducing new products. By moving downstream towards the customer, we can see that this is a rather common problem mentioned in interviews.
“We promise the customer a delivery date before we have agreed on the specifications of the products. Then our time to agree upon the technicalities takes too long and forces us out of the
time frame” - Global OPEX Manager
When this issue is combined with volatile demand on products, which results in peaks where GA Products run out of stock and capacity, then it is even harder to keep promised lead times according to a business development manager at HV Breakers. Another perspective is regarding what is promised to the customers. One of the respondents emphasized that having a high OTD contains two equally important parts. The first part is to keep what is promised, which all the answers above relates to. The other part is to promise accurate, in other words having a good system for calculating the delivery day. When failing at one of these two components, it is impossible to have a high OTD. This was something none of the interviewees really focused on except from one. One of the interviewees said that no matter how much they must do, they always promise and say that they can deliver on eight weeks. In a possible case, where there is dynamic lead-times and demand is quite high, the interviewee stated that their customers would start to put orders on speculation to ensure shorter lead-times. Then changing these orders after they have been placed, and sometimes remove them. This will cause a bull-whip effect upstream in the value chain which is unfavorable according the too interviewee. A final note from the interviews will be from the global OPEX manager, that argued net working capital, lead-time and OTD as the three cornerstones of operational excellence. It is easy to increase one of them on behalf of the others, but what is the essential thing is to increase all of them at the same time. These interviews gave us very good foundation for moving on to our last method, where we collectively tried to gather all employee’s thoughts and let them discuss and criticize each other in order to come to a conclusion on best suggestions for issues causing orders to be late. The result of this is described in the next section, the workshop.

41
5.2.2 Workshop
When all the interviews were conducted, we had received a broad perspective and had developed an understanding of relevant issues concerning delivering on time. It also gave us a solid foundation on where to start our workshop and who to consider as participants. In order to keep the brainstorming and discussions in the workshop based on facts, we created a inspirational booklet from SAP-data, see figure 3. It should be considered though that the result of this method is only based on our case-study at ABB GA Products. In the quantitative operations data analysis, we found many different insights with various interest. All the analysis was visualized into graphs. The complete analysis power point deck contained 30 slides, which is displayed in figure 3.
Figure 3: Complete analysis power point deck from SAP-data.
An example of such a graph in one of the slides are shown below in graph 3. It contains the delay distribution of all orders 2016. It describes that the majority of all delays are rather short, which is something the OTD measure does not take into account. During the workshop, we could see this working as a fact-based foundation in the discussions.

42
Graph 3: Display of delays, 29400 positions from Jan 2016 - February 2017 was used.
Example of insights drawn from the overall quantitative operations data analysis related to OTD which can be seen in figure 3, is that for instance 70 percent of all delays were 1-10 days long and up to 32 percent of all delays were related to material shortage. Approximately 37 percent of all orders required complete-delivery, but only 12 percent of all delays were related to required complete delivery. It could also be found that the order-intake over time was volatile. Another issue found through the completion of the power point deck is that delayed orders tend to occur at the same time, rather than evenly throughout the year. In the end these facts were appreciated by the participants as a fact-checker in the brainstorming of new flags. In the end, the workshop with nine employees at ABB GA Products and our supervisor Erik resulted in 59 distinct parameters that could cause an order to be delayed. These parameters are further on mentioned as flags. Of these 59 flags were 36 of interest, these flags can be found in appendix. Participants and some of the results can be viewed in images 1 and 2.
Image 1 and 2: Participants in the conducted workshop can be viewed on the left, as well as some of the result can be viewed to the right.

43
In the workshop, we asked the participants to clarify some parameters on each flag. These are what name they gave the flag. Also “who sees it?”, which means where it appears in the operations process. Is it for instance possible for the order function within the operations process to see if the flag is active. The last parameter “where”, is where the flag can be found, not in the process, but rather in what system. This could for instance be in the web interface BOL or the ERP system SAP. Examples of what attributes each flag were given in the workshop can be seen in table 4.
Nr Name Who sees it? Where?
1 Late changes Order Business Online, SAP
2 Short delivery time Order and Delivery SAP
.. Name-X Department-Y System-Z
59 Last flag Table 4: Examples of mentioned flags, as well as who can spot the flags and where they can be found. Complete list in Appendix 9.1
5.4 Conclusion of Results The outcome of the workshop, semi-structured interviews and quantitative data analysis was 36 distinct flags, after careful consideration. These flags are possible to measure and extract from existing data, even though some of them need a little bit of processing. This means that some flags require a decision of what quantity should trigger them. For instance, when measuring the flag big quantity, it could be ambiguous what is regarded as a big quantity. This needs to be decided regarding some of the flags. However, 23 flags were identified as not being possible to use because of their arbitrary nature. Example of such flags are “Human mistakes” or “Wrong status of quantity in stock”. These are flags that cannot be quantified or are unknown until discovered.

44
6 Flag Based Model Chapter six is dedicated to the findings corresponding to SRQ 2. This is done by presenting how the model was constructed, as well as describing all the different parts of it, the flags for instance. Then follows a description of how the flags are found, and their impact on an order. The chapter is then ending with a list of suggested features for an implemented software version of the model followed by a proposed visualization. The model has been developed in order to answer sub-research question 2:
- How can these identified parameters be utilized in a proactive way of work towards higher OTD?
Creating a model based on the results from SRQ-1 required to start off by classifying and refine the identified flags. Then an understanding of how all orders on a given day would be affected by different flags was deemed necessary. An explanation follows below of what a flag is and its characteristics.
6.1 Flags There is always a reason when an order is late to customer, something has happened. It can for instance be due to the supplier delivered to late or ABB GA Products forgot to prepare some documents which were supposed to be in order when the freight company arrived for pickup. At ABB GA Products, 36 out of 60 distinct reasons was identified that could cause an order to be late. A reason, or what in this thesis is called a flag warns about some characteristic of a specific order that needs extra attention, since this characteristic often cause orders to be late. Flags are related to a level of warning, which are on time, risk or late. An example of a flag which warns that an order is under risk is "Big quantity". This flag indicates that a certain order is containing more products than usual which makes it harder to deliver on time. However, it is not certain that this order will be delivered late, the risk of it is just increased. Other flags, such as "Late arrival of incoming goods" or "Formal production stop" would on the other hand guarantee that an order will be late. They are binary in their manner of inflicting risk, it is a 100 percent chance that an order will be late if marked by such a flag. All flags are not binary such as "Production stop", as mentioned above. When looking at the flag "Big quantity", one understands that the notion of what is big must be evaluated by the system. In order to be able to judge what is big, statistics was evaluated and a conclusion was drawn that an order is considered big if it in total contains more than 20 items, this stands for approximately 20 percent of all orders at GA Products. Other flags, such as "High volume right now" also needs to be evaluated. These evaluations were based on statistics, but there are other possibilities such as conclusions from interviews with experts or experienced employees.

45
What also is characteristic for flags are on what level they affect a deliverance to the customer. Three levels of effect were identified; position-, order- and general level. If a component i missing will only affect the corresponding item and position. However, if the customer has required "Complete Delivery" this affects every position in the entire order. Finally, yet equally important, some flags are more general, such as "High workload in packing". This is where it is an extra high workload for GA Products and therefore everything that goes through packing is affected by longer lead times. The refined flags can be found in appendix.
6.2 The Flag Marker, Based on the Order Backlog The model is based on the order backlog found in SAP, which is orders that have been placed but not yet shipped.
Figure 4: The process flow of the model. How data is gathered from SAP and then matched with positions in orders.
Every flag is evaluated for every position in the backlog, in order to determine whether that flag is active or not, see figure 4. For instance, if an order X is going to a country Y where the freight is done by flight. If it does, that flag on this particular position will be active and receive the “Fly transport”, otherwise this flag will not appear and it can be considered as being passive. The “Fly transport” has an effect on order level, so every position in that order will receive that flag.

46
After that, the iteration from that flag to the next continues. The second flag in this example is “Late changes”, which flags if the order has been changed lately. If something in the order specification has been changed within 30 days from the planned shipment day, the position receives that flag, i.e. its active. This continues until every flag has been checked for this position. When all the flags have been checked for this position, the model moves on to the next, until all flags have been controlled for all positions in the currently chosen time frame. As previously mentioned, some flags have a general infliction level. Such as “High volume right now”, “Capacity problem in production”. These flags are checked in the very end. At ABB GA Products orders contains a current status of where it is within the operations process. This status could be that the order is acknowledged, released, finished, available, picked, packed or shipped. Most of the flags can be closed when a production order releases a specific status. For instance, the flag “Late delivery from supplier” are no longer relevant when that item has arrived from the supplier. Therefore, when an order gets the status “Available”, which at GA Products means that it is ready for being packed and shipped, the flag just mentioned can be closed. Almost every flag has a case where it can be closed. This is in order to sort away irrelevant information as quick as possible to enable the user to focus on what matters. The data that the model uses, such as a suppliers OTD should be updated daily and not to be static. Static data would be outdated fast and become irrelevant. If the model starts to fill up with old data people will lose trust in the system and stop using it. Therefore, it is of uttermost importance to have a daily fetch of relevant data. It might even be relevant with a direct connection to SAP.
6.3 Desired Features in a Potential Software Version If this model would be implemented by a software developer some features may be desirable, such features are listed below. Dynamic ability to add flags While the list of flags in this paper being quite exhaustive for the particular purpose, it is likely that more flags will occur in the future. Therefore, the ability to dynamically add new flags to look for by the program is an important feature. With this feature, it is easier to keep the software modern and relevant for a longer time. Change the intervals and classification type of flags The flag “Big quantity” is currently set to 20, in order to be regarded as big. However, imagine a scenario when the production volumes grow over time or any other circumstance where the

47
average order volume increase. In this scenario it would be desired to have be able to change this interval, e.g. from 20 to 30. Manually interact with the software and making a flag active/passive. Sometimes everything is done in order to resolve a flag and therefore it is desired to make a flag passive even though it has not been fixed. Change time-span. A setting should be available in order to see all the orders with planned exWorks1 next week, or a specific date for instance. This is to let the user chose whether to see specific data within a certain timeframe or the entire backlog. Track history. For every position and order there should be a history, both for orders that were delivered on time as well as off-time. From this history, it should be possible to extract data in order to make it easier for others to do analysis. Show all positions The possibility to switch between displaying all positions in a given interval or only show positions with flags. Positions with flags can in turn be divided into on risk or being late as well. 7. Different colors on different level of effect There could be different colors on flags depending on their level of effect. If it is a order, position or general flag would be relevant.
6.4 Possible Visualization of Model A potential visualization of this model is presented below, and should only be viewed as a guide for further development of software, as well as conveying the right image on how this model might look when finished, see figure 5.
1 Incoterm for being ready at loading dock for transport

48
Figure 5: A potential visualization of the flag based model
The red numbers in the visualization is only inserted in order to explain each function of the potential model. Each step is described below.
1. First, the user selects if he or she would like to view all orders in the order backlog, or all orders in a month/week/day.
2. The user then specifies what week/month/day. 3. In this window, all selected orders can be viewed, how many orders they contain, if they
are affected by complete delivery as well as how many flags they are associated with. 4. When an order is selected, all its positions is displayed in this window. Here the user can
see the positions number, how the flags on each position will affect the order (“Late” or “Risk of late”) in the “T”-column. The user can also see how many flags that affect each position (#Flag).
5. If the user selects a position in window four, then that positions flags will be displayed in window five. The option is also given to the user to click the resolve-button (RES), if a flag has been resolved.
6. In window six, the user can see all general flags. These are the flags that are not connected to a specific order or position, but could affect them all.
7. If a flag in window five or six is selected, then the description of that flag can be viewed in window seven.

49
6.5 Concluding Remarks and How to Use the Program in Practice The purpose of the model is to enhance proactive work. The way to work with this program is on a day-to-day basis, most likely more than one time per day. Its impact on effect is dependent on that people use it, we recommend that not only a manager should use it in isolation. The purpose of the flags is to encourage actions and to target the scarce resource attention on what is relevant and matters. When actions have been taken or someone feel that a flag somehow does not make sense anymore, then that flag is meant to be closed. This to get rid of distraction and only focus on what matters in the operations.
50
7 Analysis and Discussion An analysis of empirical findings presented in chapter five is described below. This is done in context of already established theories presented in chapter four. The areas in which we analyze and discuss the findings are in traditional view of operations management and production control as well as the extended view. We will then narrow our analysis down by looking at OTD in our empirical findings compared to theory. Then move on to why something is late and thereafter focusing on previous research as well as established models for improving the OTD KPI.
7.1 Operations Management and Production Control Through our empirical findings and pre-study on the entire operations process, we received an important view on how a real operations function work outside from the textbook, as well as the managerial work. But the longer our stay at GA Products and the more interviews conducted, the more we realized that ABB is very much aligned with existing theory on what are, for instance the key activities for an operational department within an organization. Every key-activity is of focus for ABB GA Products, which in some sense makes them exemplary to examining and conducting a case study on regarding operational perspective (Slack et. al., 2010). The activities of Planning and control as well as Improving performance measurement, is where extra focus has been applied. Regarding the first area, it is more important to understand that it can be the reason for poor values in the latter one; Improving performance measurement, which in turn is the activity which has received most focus. Slack (2015) also describe changes in business environments which in turn generates businesses to respond to these changes. Some of the mentioned changes, that ABB as well has taken into action is; Lean process design, Mass customization and Operational excellence. The operational excellence is one of the responses to increased demand for better services and higher quality exception. This is where we can see the importance for GA Products to constantly develop and strive for a better operations department to continuously adjust to changing business environments. We found that GA Products has done substantial work in production control in order to have the right amount of orders in production at the right time. They work with different systems which help them plan these orders in order to meet customers’ demands on quality, quantity and deliverance. Even though relative careful control and planning is in place, a major issue was found in GA Products operations through our empirical findings. This was that of customers changing specifications on orders and the need to re-prioritize orders. To measure the success of enforced control and planning, GA Products has in accordance with theory implemented the use of KPI’s. This is not only done in order to measure internally, but also to measure their customers and suppliers. Slack et. al. (2010) mentions three issues which should be covered when working with KPI’s. One of them is What detailed measures to use. This is something that was also found as an issue in one of our interviews. We found that some fulfillment of KPI’s are

51
used for measuring the end-performance of employees or departments, causing different functions not caring about the organization on a holistic level, making decisions biased towards their own favor. This issue is also something that Parmenter (2015) discuss, that a KPI require the appropriate level of encouragement to award good behavior. Too much encouragement or an injustice way of measuring something, might cause problems in what type of goals shall be fulfilled. On the other hand, Parmenter (2015) also proposes that KPI’s should have significant impact on the entire organization, which is true in some sense. But departments are responsible and measured on different KPI’s at GA Products. This causes conflicts between individuals and departments, when for instance one department not caring if an action is made which might lower an important KPI for another, just as long as the owned KPI is improved. One of these KPI’s is between invoicing and OTD, which in some respects do not care about the other in the current way it is being measured. According to theory KPI’s should not even be measured in units of currency, which is the case of GA Products and invoicing (Parmenter, 2015) Another distinction Parmenter (2015) does is between leading and lagging KPI’s. At ABB GA Products, most KPI’s are lagging, they measure them after impact is done. This is where we can see the use of taking a lagging KPI like OTD and with the use of a proactive model, turning it towards a more leading KPI. Before moving on to discuss how our result helped us create a model, we must analyze our results in regard to what theory states regarding OTD.
7.2 On Time Delivery When conducting our pre-study, and later on through our interviews, we truly realized the emphasis ABB put on OTD. This is in line with our findings in theories, for instance by Chibba (2015), Hill (1993) and Keebler et. al. (1999). They conclude that OTD is an important performance measurement and a competitive factor for many organizations today. This is especially true for ABB, where a delay on an order from them could mean huge delays and costs for their customers. In one of our interviews we were presented with a possible scenario for when OTD is certainly of importance. Some of GA Products customers require delivery of IEDs to remote areas in an unstable countries, where the delivery is supposed to be installed on a certain day. On that day, technicians need to be on site to be able to install these IEDs into a possible sub-station, and the whole procedure will probably have to be guarded by military escort. In these events, it is crucial that the IEDs is on site the day when GA Products promised they would be there. But it is not only important to keep what is promised but also to promise correctly is something that was mentioned in our interviews. The consequence of this is something also mentioned by Lödding (2013) as one of the most important reasons for why OTD is one of the most relevant KPI’s. He states that customers will become doubtful if a delivery date is promised and then not kept. Even though most of the customers to GA Products are internal, it is still important to promise correctly, since a delay could cause a complete standstill at customer's site and furthermore significant cost.

52
In some of our interviews with other business units within ABB, they mention that their production differs from ABB GA Products in volume, and therefore requires a different measurement of OTD. For instance, ABB Machines produce seven machines in one month. A late delivery of one machine would affect the entire OTD negatively by 14 percent, which is of major significance if one would compare with GA Products. Still the most common measurement of OTD is the one that GA Products has in use today, and that is to measure per day, as well as to measure per order row (or position, which it is referred to at GA Products) according to Forslund and Jonsson (2010). However, this established way of measuring is still limited and do not fully reflect reality. Since it is measured per order row, the quantity is not included. An order row with 100 pieces of something being late and another row with 1 piece is equally affecting OTD when either of them is late. However, the 100-piece order can, and probably will further upset the customer. Another aspect of the measurement is that GA Products count their orders as delivered when they have been given the status exWorks, which is when delivery has been booked and the orders packages is standing on the delivering dock ready for pickup. This puts the final risk on the freight company, which would be the responsible part if goods is not delivered on time since GA Products has fulfilled their agreement by delivering their goods on the dock by contracted time. If this is understood by the customers, then this arrangement seems fair, since GA Products cannot promise the quality of the freight agent. We also understood in our empirical findings that GA Products not only measure their OTD on the entire operations process, but also individually on each function within the operations process. This means for instance that the packing-function might have a goal of 90 orders packed on a given day. If the number of orders packed is 90 at the end of that day, then they reach their OTD of 100 percent. If a problem might occur in the process though, then it will not show on the individual functions OTD, but instead on the total OTD, measured on the entire operations process. This relates to theory by Prescott (2001), who proposes a relationship between activities in a process, and that it is of importance for competitive advantage, how these interrelationships is managed. Karim et. al. (2010) also mentions that it is of importance to take the whole process into consideration and evaluation to easier spot problems as the occur. This shows that even though ABB GA Products focus on their internal OTD, within each one of their operations function, it is also equally as important to pay attention to the entire operations process, as well as upstream from supplier, all the way down to customers. Even though OTD is one of the most important KPI’s for producing companies (Chibba, 2015; Hill, 1993; Keebler, et al. 1999), not very much can be found when investigating how KPI’s might be in the future, especial OTD. Some proactive work commonly used to improve OTD in companies is the implementation of performance measurements (PM), as mentioned by Forslund and Jonsson (2010). This is something done by GA Products as well. They track issues and have daily routines for raising these issues to management levels where they will be resolved. This is very useful routines, but as stated by our research question, it would be even better if the chance

53
to receive some sort of warning sign even before the problem truly occurs. At least before the delivery date, so maybe something can be done to resolve it before it will be delayed to customer. But to understand what is causing orders to not be on time and therefore driving OTD negatively, it is important to first understand the process on a whole and furthermore, where issues and problems might occur. This is further analyzed in the next section Reasons for late orders, where we look at our results, foremost from our workshop as well as pre-study and how they relate to existing theory.
7.3 Reasons for Late Orders Early on in our thesis work, when investigating possible solutions on forecasting OTD, a realization regarding understanding what the underlying problem actually was, became necessary. Therefore, even in our pre-study we tried to map down the operations organization in a more holistic manner, in order to understand where the underlying issues of OTD might occur. In our pre-study, when both digging deep into data sheets, from SAP-data for instance, as well as creating a BPM we came to an understanding of further methods to use in order to understand underlying issues for late orders. The goal of our pre-study was to understand the organization and furthermore the operations department as well as its underlying issues with late orders. By conducting contextual interviews with key-individuals within each operations function as well as combining insights with this from SAP-data, we could create a business process map as conducted by Karim et. al. (2010) to further understand the entire process and its issues. This helped us to understand through our work, how each function was connected and exposed to an interrelationship. The visualization of the business map also gave us clarity on how to focus our academic work in order to conclude relevant factors of delay, but also how to do this in line with the strategic goals and resources of ABB. This is something Spanyi (2003) discusses as an important reason and outcome from creating a BPM. What we realized after creating the BPM, was that we needed support from individuals with expert knowledge, which is why we choose to conduct semi-structured interviews as well as holding a workshop. In our interviews, even though they were semi-structured and filled with open ended questions and follow-up questions, we tried to focus on issues concerning foremost our SRQ one. In our results, we present the most mentioned and aggregated issues that might lower OTD, furthermore be a reason of delay. Common reasons for delay mentioned in the interviews was regarding relations with suppliers. These reasons is due to supply chain issues regarding bad communication in the supply chain. One is regarding suppliers low OTD affecting GA Product's dependability in deliverance, and the other considerable reason is that quality from suppliers are not sufficient, possibly due to poor specifications from GA Products, both derived from low integration and bad communication throughout the supply chain. Forslund and Jonsson (2010) discusses the importance to automate data collection over the entire value chain, which in turn

54
would increase such integration and transparency. This is even more enabled by the trend of digitalization which would enable such data collections and analysis (Baur and Wee, 2015), which through our pre-study, became clear that GA Products has and have had a vision on. It is not always easy to separate what is GA Product's fault and what are their suppliers. One of their suppliers for instance had a special machine, which was GA Products responsibility to maintain. When GA Product failed to do so, then that supplier would come to a halt in production causing late delivery of components. According to ABB they adjust the result of that suppliers OTD in hindsight, since the problem was caused by ABB. What is not consequent in this scenario though, is that these adjustment does not follow through the entire supply chain to end customer. GA Products OTD towards customer will still be low, and not adjusted. We thereafter aimed to look at issues throughout the process ranging from suppliers all the way to customers, in accordance with literature Forslund and Jonsson (2010). Instead of looking upstream towards our supplier, a common reason for delay was found downstream, in an issue of re-prioritizing orders. This causes issues with rescheduling causing other orders being delayed, and is a problem which stems from demand is tilting towards flexibility and deliverance dependability (Koh & Saad, 2006; Schonberger, 2017). Vandelaele et. al. (2000) claims that common ERP and MRP systems is insufficient as control systems as well as in detailed planning and capacity, and therefore requires some sort of complementation in order to predict issues and whether some orders are more affected than others, which is where our potential model becomes useful. Many articles discuss how to improve and solve existing issues affecting orders negatively. These are measures that companies can implement in order to set up routines to abolish poor ways of work, but they will not remove a problem completely. For instance, the issue with bad communications upstream in the supply chain with suppliers and especially downstream, since most of GA Products customers is within ABB. This is something that companies can improve, but will most probably be a lasting issue, even if it is minimized. It would be rather naive to think an issue is 100 percent resolved due to precautionary measures been put into place. Therefore, supplementing pro-active work with a model or system that can catch those last errors which might slip through even though work has been done in order that solve most of these issues, would aid the operations function within an ATO-company to be even more pro-active towards achieving a higher OTD. But in order to raise these issues, work was conducted to find them and understand their importance. The results from the pre-study and interviews has been reviewed and analyzed as methods for answering SRQ one. In order to receive a higher credibility in our flags, we try to triangulate our findings of relevant factors with our findings from conducted workshop. From our workshop, we received 59 flags which could cause an order to be late. There we asked the participants to rank them, see method section regarding workshop. The participants were also

55
asked to specify on each flag, what operations function can spot the issue first as well as in what system the data regarding the flag can be retrieved. Through this exercise, we received flags which would be hard to spot in raw SAP-data, thanks to the participants representing different functions of operations and therefore possessing different excellence. This diversity of knowledge would let us receive insight on issues over the entire operations process, which is important in an competitive advantage mentioned in earlier literature (Forslund and Jonsson, 2010; Vastag and Whybark, 2005). All these flags were then summarized with flags found in the other methods and when later analyzing them, many had to be removed due their inadequate complexion. For instance, one flag could be due to human error, but this type of flag is almost impossible to measure and thereby is classified as unsuitable for this model. Then by iteration with our supervisor we could narrow down the number of flags to 36, see appendix. To conclude the analysis in this section, we can state that our empirical findings is in line with those in theory. This is in regard to which are the most common factors of delay is over all in line with theory, such as inventory issues, supplier communications problems and customer flexibility. The credibility of the result is also of substance in regard to not only be triangulated by different empirical methods, but also its iterative process of narrowing down the number of flags to the most crucial ones. What could be discussed as criticism towards the method of discovering and summarizing flags, is the iterative process of removing the inconclusive flags, and saving the useful one. We did this by talking to an expert manager with a perspective of the entire operations process, which also was our supervisor at GA products. But in the end the results could differ depending on who decides what flags are relevant, the result could seem rather arbitrary. But in the end, when the factors of delay had been identified, a possible model could be identified in order to support the goal to use the result of this analysis and its result.
7.4 Production Control Models The result corresponding to this section of the analysis is chapter six, which is the chapter regarding how the model that was developed through the work with this paper. This chapter discuss and analyze the developed model in context of established theory. The purpose of this model was to enable and encourage a more proactive way of work in order to increase the fraction of all orders that are being delivered on time, OTD. This was done to complement the sort of reactive nature in the KPI OTD, with the overall goal of achieving a higher OTD. When a company’s operations struggle, it can be difficult to know the underlying cause of the issue. But sometimes the issue is known, but there are still no systematic way of working in order to take all necessary actions. When it is known, what could go wrong and how to prevent it, then a great foundation to be proactive exists. The issue is that every individual will not know everything. The knowledge regarding their operational processes is large in ABB GA Products but fragmented over many different employees with various experience and mindsets. In this situation, a systematic way of working is required, so no information or knowledge get

56
lost. For example, at ABB GA Products, we identified 59 issues that could cause an order to be late. This is too many to keep track of manually. What this model could help with is to get rid of distractions, things which are not relevant for every order and put emphasis on what really matters in a systematic manner. This is perhaps the best value which is added through this model. If looking at this model through a critical and almost cynical perspective, we can see that this model not really provided anything new, nor have it done anything very smart or revolutionary. All it does is to aggregate common causes of delays into a system, which in a systematic and logical manner will tell the users what to focus on. Perhaps one could go as far as to call it a digital and interactive dashboard. During the development phase of this model we aimed towards developing a model that could estimate the OTD in the future with a number. For instance, based on the current situation in production, order stock and staff situation etc., we will have an OTD of 89 percent next week. A miniature scale of this type of model was attempted, but it was quickly realized that it becomes very difficult fast. Of course, historically data could, and should be used in order to calculate the impact of certain flags on its possibility to be on time. However, when having multiple flags on every order and around 40 different flags it will be a lot of different permutations of flags that needs to be given a probability. Some other flags are not of a binary character, for instance the flag “Big quantity”, when an order contains a lot of some article. Then, this flag will have different impact on the orders probability of being on time depending of how big it is. If this should be carried out we would recommend using combined probabilities with Bayes Rule and something like Samaranayake et al (2013) did with Fuzzy logic. However, we both changed our minds when realizing two things. The first reason, is based on what George Box (1976; 1979) stated, “All models are wrong”. Calculating an exact integer or even a decimal number for the OTD in the future would often be incorrect and therefore give a false sense of control which is undesirable (Thompson, 1999). The second reason is regarding when stepping back and really thinking about the purpose of the model and how an operations department could work with it. The purpose was to enable a proactive way of work in order to increase OTD. To enable this proactive way of work in order to deliver on time, then it is rather vague to be guided by just a number. It could describe that now are things really going the wrong direction which could work as an alarm. But what would be interesting is to know what actions could be taken instead. When we finally realized that no one really had the need of this approximate and indicative number for the future OTD, we decided to not calculate it. It is of course desired to construct a model as accurate as possible, with or without the exact mathematical result of OTD or any other production control model. In order to do solid and good analytical work to make as accurate models as possible, it is essential to have good data. We faced several situations during the work with this paper where data was not accurate, by that we mean, how to extract the data and what is measured is in some sense not logical. An example of this at ABB GA Products where that they classify all late orders into different categories based
57
on the reason. One of these categories was called “Technical Problem”, but when we dug deeper into this we realized that it is not clear who had the technical problem. In some cases, it was ABB GA Products that had some machine broken in their production, in other cases one of their supplier’s machinery was broken. This is not very logical or conclusive, and makes analytical work harder and less accurate. To conclude, it is hard, if not impossible as George Box states (Box, 1976; Box, 1979), to build a model that includes everything as well as being accurate. However, with this said it is still possible that supply chain models like ours could be of help. On this point, we completely agree with the conclusion drawn by Sarker and Wang (2006).

58
8 Conclusion This chapter concludes the analysis with summarizing our findings and how they answer our research question, as well as sub research questions. It will then end with some concluding remarks, containing recommendations for ABB GA Products, ideas for future research and topics to study. Through our work with this thesis, we have had both theoretical findings as well as empirical. These have been discussed in relation to each other in order to find answers in established research with purpose to generalize our empirical findings from our case study at ABB GA Products. In order to navigate correctly in existing theory as well as to scope our thesis towards both our academic requirements from our university and goals of ABB GA Products, we formulated a main research question “How can an assembly-to-order (ATO) company work proactive towards a higher on time delivery (OTD)?”. This was followed by two sub-research questions to help us answer our main one:
1. What are the most significant parameters that lowers OTD for an ATO company? 2. How can these identified parameters be utilized in a proactive way of work towards
higher OTD?
8.1 Answers to Research Questions What are the most significant parameters that lowers OTD for an ATO company? As mentioned earlier, we began to call these parameters flags, in order to have an umbrella term which people would understand. In order to find these significant flags, we realized that it is rather insufficient to only look towards what existing theory states regarding the issue in order to answer this question. For an ATO/MTO company, who assemble already produced components from their suppliers into their own products, it is important to have a broad insight to their supply chain, both upstream as well as downstream (Karim et al, 2010). Therefore, to have a broader insight than existing theory, as well as to validate our conclusion, we focused on retrieving empirical findings from all aspects of the operations process within our case study company. When then investigating empirical methods, realization regarding only considering quantitative data from GA Products in form of SAP-data and putting it into context by creating a BPM, would be insufficient when trying to not only find what flags which lower OTD, but also what

59
the most significant ones are. In order to find which ones were the most significant, we used the triangulation of gathered data. This made us able to understand what the most significant parameters were in a credible manner. It also created a validation by supporting, and discarding some of our own findings in the quantitative data from SAP, and also confirming data received through interviews and workshops. When investigating the entire operations process, from suppliers to customers and talking to key-individuals internally within operations at GA Products, we came to conclude 36 distinct parameters which were possible to quantify, affecting OTD negatively. We also came to an answer on what factors are important in order to call a flag significant. These factors are for instance that a flag must be able to be measured. In our workshops and interviews, we received some notions that human error could be a flag, which could be a reason for an order becoming late and thereby lowering OTD, but this flag is impossible to keep track of a raise a flag for. This makes this flag unsuitable as a candidate for being of significance. Another factor for being a flag of significance is its possibility to be classified as a flag causing an order to be under risk, or to be completely late. Also, the ability to understand whether or not it causes an issue on position-, order- or general level. In the end, we conclude with 36 different significant flags which could affect OTD negatively, see appendix. These flags can be found all through the operations process, but can all be traced and measured. Examples of flags often mentioned in empirical findings can be found upstream in the value chain at GA Products suppliers. There flags can be found, such as “Late delivery from supplier” as well as “Supplier product quality”. When looking downstream, towards the customers we can see flags such as “Complete delivery”, this is a common flag which not only affects one position, but all positions in that order, which makes it very significant to keep track of. This perspective on achieving a good view on the operation by looking on the entire process is also something with its base in literature (Karim et al, 2010; Prescott, 2001) How can these identified parameters be utilized in a proactive way of work towards higher OTD? As found in literature and theory, a lot of frameworks and models exists in operations management and production control (Samaranayake et al 2013; Seo et. al. 2015; Zou and Li, 2006), as well as in improving and keeping track of performance within a company (Vastag and Whybark, 2005; Forslund and Jonsson, 2010). The common thing with most of these models is that they look at an isolated problem, ranging from how to manage inventory levels, to complexity and diversity in regards to performance measurements such as lead-time or cost for instance. Then these models have this narrow view of an issue, in order to try to minimize it. This is just the thing, these issues are most often just minimized, not abolished. A reason for this is that these are just models, and one must remember the words of the famous statistician - “All models are wrong but some are useful” (Box, 1979). The issues will most probably still occur,

60
but just on fewer occasions, and probably with a lesser impact depending on the goal and means of the model. In order to find and raise awareness regarding these remaining issues slipping through existing models, a framework for taking an issue and making a flag of it, and then putting it into a logical scheme which will raise a warning sign on orders if the will be affected, is required. This is just how we propose our model should work, by iterating through all orders and checking if they are affected with a flag, then in future systems raise awareness within the operations functions that there is orders and position exposed to risk, and should therefore be managed. We conclude that by utilizing such a model, a proactive approach to OTD is possible.
8.1.1 Main research question: How can an assembly-to-order (ATO) company work proactive towards higher on time delivery (OTD)?
There are many ways possible in estimating future total OTD, and the result of the answer to this question depends on its goal. As discussed before, a probabilistic approach was considered at first, but was discarded due to its complexity being irrelevant. A decision supported by literature regarding mathematical models for production being too complex in order to keep general enough to be useful (Sarker and Wang, 2006). It would give a false sense of control and the exact number was not of interest (Thompson, 1999). In discussion with our supervisor, and with regards to theory, we conclude that in order to estimate future total OTD, it is just as sufficient to understand what orders are affected by risk, and not necessary the amount of risk. We conclude that in order to estimate future total OTD an ATO-company must undergo two phases. These phases is the sequential order of our sub-research questions. First, the company must investigate and understand what the most significant parameters are which would affect OTD negatively. These issues must then be reviewed whether they possess factors described in the flag-section. Secondly, these issues must be made to flags, containing parameters as to where they exist, how to measure them and on what level they affect OTD, position, order or general level. In order to keep this type of model relevant and to make it have impact on day-to-day operations two follow up steps is of relevance. Firstly, the model must be possible to update with new flags, in order to keep it relevant with changing business environment and challenges, which is one of key factors for an operations function according to literature (Schonberger et. al., 2017). Secondly, it is important to have a simple, yet comprehensive visualization of this model for all employees to interact with and to receive insight on ongoing issues in order to actually conduct a proactive work towards OTD. From a production and control perspective, this will give the operation function and its management even more control over OTD in order to reach better measurements.

61
8.2 Concluding remarks The purpose of this section is to share some final thoughts regarding this thesis, and to mention some possibilities for further research. It also contains some findings of importance for practice, which we recommend ABB GA Products to further investigate. This research can generate many implications to practice at GA products, but three of them are presented below as important to understand to further develop their operational excellence.
8.2.1 Implications to practice
Complete delivery Complete delivery is a concern for anyone that use OTD as one of their KPI's. At ABB GA Products, the customer had required complete delivery in 37 percent of all orders and 12 percent of all delays could be derived to complete delivery. There is no problem to offer complete delivery when you are delivering on time, but when you are not it has a spillover effect and will cause other positions in the same order to be late. On average, an order at ABB GA Products had three different positions per order, which implies that if one of these three positions is late all three will affect the OTD in a negative way, since the other two being on time cannot be shipped either. With this in mind, it is easy to say that on average positions in complete delivery orders that are being delayed will have 3 times as much negative effect on OTD as non-complete delivery orders would have. Thus, creating a structure of incentive so that customers will not demand complete delivery would be desirable. This could be done by paying a premium for the complete delivery option. Thereby the customers will consider if they really need it. This will also free space in the packing area at ABB GA Products and decrease net working capital. Transparency in supply chain An issue found in literature is regarding supply-demand mismatch (Schonberger, 2017; Hendricks et. al., 2017), which is also the case at GA Products. It is truly difficult to give accurate forecasts to suppliers. This becomes even harder when you do not have accurate demand forecasts on GA Products sales. The typical GA Products customer is another ABB unit, which either build cabinets or sell big infrastructural systems, which in their turn sell to the end customer. Therefore, sales forecasts have potential to get better. We recommend GA Products to cooperate closer with these other ABB units to have a more transparent supply-chain where meeting expectations and having a higher OTD becomes easier. This is done partially by sharing more information regarding customer demand in a transparent and automatized way. Details in data: Through our empirical work, we have found that in order to analyze large amounts of quantitative data, it is important that the data is accurately describing the real situation. When having a reason for delay such as "Technical problem", it is of uttermost importance to get to know who had the technical problem. It does not make sense to have the same reason for when

62
the supplier and GA Products have technical problems. Another example is when an order gets more than one status on 15 minutes, only the last one is saved. A third example is that all timestamps in SAP is with 00:00, which could be used to determine the exact time instead. This is crucial for progress when doing analytics work within operations management.
8.2.2 Future Research Ideas
During the work of this thesis and in regards to the scope of it, we recommend some areas of future research which could be of interest. ● Broaden the perspective of the proactive way of work towards higher OTD: In this
thesis, an investigation has been conducted regarding working more proactive with issues affecting OTD negatively. But this solution is only one out of possible countless of approaches to this issue. It was also done with one case-study, which might make this thesis results not as general as hoped.
● ATO & MTO - differences in delivery precision: As mentioned before, the subject for this case study is an ATO-company. This causes the issue of whether the result would be the same for a MTO-company. A hypothesis is that there is probably more issues associated with the production line within a MTO company than an ATO company, possibly due to ATO companies are even more dependent on their suppliers. The more actors upstream, the larger is the possibility that some problem might occur, e.g. low quality on ordered products from suppliers
● Transparencies impact on OTD: The lack of transparency regarding customer demand is something which through the empirical findings should be regarded as an extensive issue, not being able to have adequate information regarding future customer demand causes uncertainty, for instance inventory issues. Thus, research regarding transparency between customers and suppliers is desired in order to keep a high OTD. This could possibly be done in regard to digitalization and availability of data.

63
9 Appendix
9.1 Flags Below are the 36 distinct and refined flags that was used in this model. We identified 59 but 36 was used. Every flag has an acronym for communication purposes, in addition to that a name and a brief description. The last column in the table is the level of the flag, by this we mean on what level it has its effect. Some flags are general and affect the entire operations situations, some affect the entire order and some just a specific position in a order. Some flags such as “Big quantity” (BQ) are quantified, here statistics was used to determine what a big order is. This was done in many cases and due to confidentiality for ABB the exact figures on these intervals will not be exposed in this paper.
Number Acronym Name Description Level Late/Risk
1 CD Complete Delivery
Complete delivery is when partial deliveries are not allowed. In other words, all the ordered items must arrive at the same time to the customer.
Order Risk
2 FI First in, first served
The first order that was put are supposed to get the first incoming goods to be completed. This is simply a rule of priority.
Order Risk
3 SQ Supplier product quality
Quality problems related to this supplier.
Position Risk
4 SO Service order The order contains a service such as education. The operations department are not in charge of this education, and therefore they must control so that it gets delivered on time out
Position Risk

64
of normal procedures.
5 LC Late changes The customer make changes in the order after it was ordered.
Position Risk/Late
6 DT Different delivery time
A difference in exWorks or delivery-day in different data systems, e.g. SAP and Business Online.
Order Risk
7 SDT Short delivery time
Promised delivery-time to customer is shorter than our usual lead-time caused by manual interaction with business online. Probably a high-priority order.
Position Risk
8 SM Separate modules Order contains many free modules that require some type of manual operation such as testing.
Position Risk
9 MM IED config mismatch
Different specification of the product in the different computer systems.
Position Risk
10 LS Late submission Internal delay in operational process. Between finishing the product, packing it, shipping it etc. there are a certain allocated time. When this time is exceeded this flag will be active. The most obvious case here is that an item should be in place and have status "Available" 2 days before it is supposed to be shipped.
Position Risk
11 BQ Big quantity This order contains a big quantity. This could either be many different products, or many of the same type, or the combination. 20% of all orders contains more than 20 things, if this is the case the order will be flagged as big quantity.
Order Risk
12 HV High volumes High demand on our products General Risk

65
now. We have more orders in pipeline than usual. This flag will be active if this week is one of the 15% best weeks in planned shipment.
13 NC Technically not complete product
Technically not complete order, the customer have ordered something that is not ready to be shipped already.
Position Risk
14 FD Forecast deviation The actual sales exceed the forecast significantly this period.
General Risk/Late
15 RP Re-prioritization If some production order gets ahead of another and therefore do not follow the plan, then a flag will occur on the order that got passed by.
Position Risk
16 LCI Lack of customer-info
The customers’ information and delivery specifications are missing.
Order Risk/Late
17 PS Formal production stop
Formal production stop. Some product that we offer are currently stopped from being sold. Some error with it might have been detected and corrected before sales continue.
Position Risk
18 CP Capacity problem in production
Capacity problem in production, we have scheduled to produce more than our capacity of IEDs.
General Risk
19 SL Long supplier lead-time
This position contains a component that has a lead time longer than 40 days.
Position Risk
20 LA Late arrival of incoming goods
Late arrival of incoming goods. Something was supposed to arrive at a certain date, but when that date is the goods still have not arrived. Then this flag will be activated.
Position Risk/Late
21 MA Material Material availability check was Position Risk
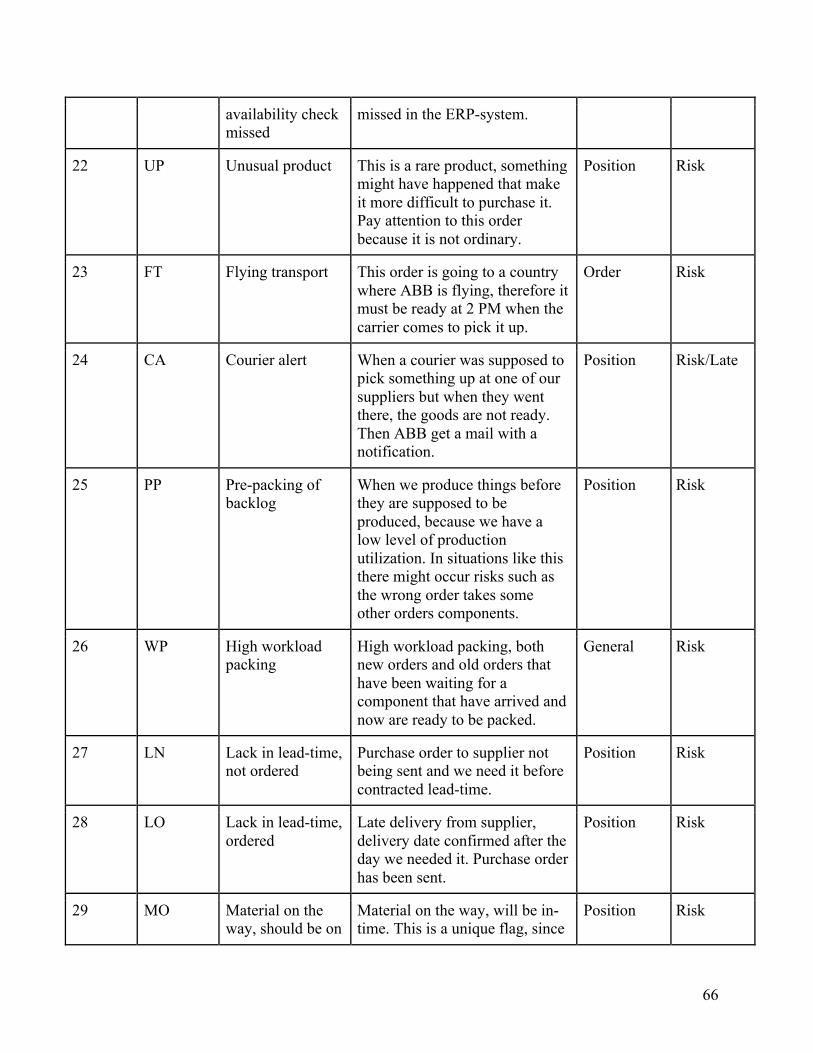
66
availability check missed
missed in the ERP-system.
22 UP Unusual product This is a rare product, something might have happened that make it more difficult to purchase it. Pay attention to this order because it is not ordinary.
Position Risk
23 FT Flying transport This order is going to a country where ABB is flying, therefore it must be ready at 2 PM when the carrier comes to pick it up.
Order Risk
24 CA Courier alert When a courier was supposed to pick something up at one of our suppliers but when they went there, the goods are not ready. Then ABB get a mail with a notification.
Position Risk/Late
25 PP Pre-packing of backlog
When we produce things before they are supposed to be produced, because we have a low level of production utilization. In situations like this there might occur risks such as the wrong order takes some other orders components.
Position Risk
26 WP High workload packing
High workload packing, both new orders and old orders that have been waiting for a component that have arrived and now are ready to be packed.
General Risk
27 LN Lack in lead-time, not ordered
Purchase order to supplier not being sent and we need it before contracted lead-time.
Position Risk
28 LO Lack in lead-time, ordered
Late delivery from supplier, delivery date confirmed after the day we needed it. Purchase order has been sent.
Position Risk
29 MO Material on the way, should be on
Material on the way, will be in-time. This is a unique flag, since
Position Risk

67
time. it is assuring that something will be on time.
30 MN Material is not on its way, but can be in time
Material is not on its way, but can be in time since we have a contracted lead-time shorter than the remaining days until we need it.
Position Risk
31 LST Low stock Low stock on some component that we need in this order.
Position Risk
32 NP New product This product has recently been launched, therefore there is some uncertainties regarding the processes around it. Could help to keep an extra eye on those.
Position Risk
33 CC Complex country Some countries require many documents to be attached at the delivery, like certificates from what ISO ABB have etc. This paperwork requires more time than other orders.
Order Risk
34 SOTD Low supplier OTD
Our supplier of a certain component that is needed in this order have a low OTD.
Position Risk
35 TP Supplier technical problem
Our supplier has technical problems, some of their production equipment is perhaps broke. This causes extra-long lead-time and sometimes completely stop on their products.
Position Risk
36 NCC Not commercially complete
The item that has been ordered is not commercially completed. R&D is perhaps done and specifications, but price, lead-times etc. remain. Someone did order it very fast before ABB was ready.
Position Risk

68

69
9 Reference List
Andrén, E. (2015). Effective Spend Analysis - Achieve Full Cost Control. Retrieved from http://tools.effso.se/wp-content/uploads/2017/02/EFFSO_WP_Effektiv_Spendanalys_2015.pdf
Blomkvist, Pär and Hallin, A. (2014). Metod för teknologer : examensarbete enligt 4-fasmodellen (1. uppl.). Lund: Studentlitteratur. Box, G. E. P. (1976). Science and Statistics. Journal of the American Statistical Association, 71(356), 791. https://doi.org/10.2307/2286841 Box, G. E. P. (1979). Robustness in the Strategy of Scientific Model Building. In Robustness in Statistics (pp. 201–236). Elsevier. https://doi.org/10.1016/B978-0-12-438150-6.50018-2
Chibba, A. (2015). Measuring supply chain performance: A framework for prioritizing measures. International Journal of Research in Business and Technology, 6(2), 782–793. Chibba, A. (2017). Supply Chain Quality Management - Exploring performance of manufacturing organizations. Luleå University of Technology. Retrieved from http://ltu.diva-portal.org/smash/get/diva2:1054917/FULLTEXT01.pdf
Denscombe, M. (2010). The Good Research Guide : for small-scale social research projects (4th ed.). Maidenhead, England: McGraw-Hill/Open University Press. Donderwinkel, S. (2015). Improving the On Time Delivery performance by the implementation of a Sales Inventory & Operations Planning process. University of Twente. Ensign, P. C. (2001). Value Chain Analysis and Competitive Advantage. Journal of General Management, 27(1), 18–42. https://doi.org/10.1177/030630700102700102 Forrester, J. W. (1961). Industrial dynamics. Cambridge, Mass. : M.I.T. Press.
Forslund, H., & Jonsson, P. (2010). Integrating the performance management process of on-time delivery with suppliers. International Journal of Logistics Research and Applications, 13(3), 225–241. https://doi.org/10.1080/13675561003712799 Fortune. (n.d.). Fortune Global 500, ABB. Retrieved from http://beta.fortune.com/global500/abb-286

70
Gao, J. (2015). Performance Measurement and Management in the Public Sector: Some Lessons from Research Evidence. Public Administration and Development, 35(2), 86–96. https://doi.org/10.1002/pad.1704
Gibbert, M., Ruigrok, W., & Wicki, B. (2008). What passes as a rigorous case study? Strategic Management Journal, 29(13), 1465–1474. https://doi.org/10.1002/smj.722 Gottfredson, M., Puryear, R., & Philips, S. (2005). Strategic Sourcing: From Periphery to the Core. Harward Business Review. Retrieved from https://hbr.org/2005/02/strategic-sourcing-from-periphery-to-the-core Groen, B. A. C., Wilderom, C. P. M., & Wouters, M. J. F. (2017). High Job Performance Through Co-Developing Performance Measures With Employees. Human Resource Management, 56(1), 111–132. https://doi.org/10.1002/hrm.21762 Hendricks, K. B., & Singhal, V. R. (2017). The Effect of Demand–Supply Mismatches on Firm Risk. Production and Operations Management, 23(12), 1937–5956. https://doi.org/10.1111/poms.12084
Huo, B., Zhao, X., & Zhou, H. (2014). The Effects of Competitive Environment on Supply Chain Information Sharing and Performance: An Empirical Study in China. Production and Operations Management, 23(4), 552–569. https://doi.org/10.1111/poms.12044 Jacobs, B. W., Kraude, R., & Narayanan, S. (2016). Operational Productivity, Corporate Social Performance, Financial Performance, and Risk in Manufacturing Firms. Production and Operations Management, 25(12), 2065–2085. https://doi.org/10.1111/poms.12596
Karim, M. A., Samaranayake, P., Smith, A. J. R., & Halgamuge, S. K. (2010). An on-time delivery improvement model for manufacturing organizations. International Journal of Production Research, 48(8), 2373–2394. https://doi.org/10.1080/00207540802642245 Keebler, J. S. and C. of L. M. (U. S. . and U. of T. (System) and C. S. C. (1999). Keeping score: measuring the business value of logistics in the supply chain. Council of Logistics Management. Retrieved from https://books.google.se/books?id=ax8jAPXou2EC Käki, A., Salo, A., & Talluri, S. (2015). Disruptions in Supply Networks: A Probabilistic Risk Assessment Approach. Journal of Business Logistics, 36(3), 273–287. https://doi.org/10.1111/jbl.12086

71
Koh, S. C. L., & Saad, S. M. (2006). Managing uncertainty in ERP-controlled manufacturing environments in SMEs. International Journal of Production Economics, 101(1), 109–127. https://doi.org/10.1016/j.ijpe.2005.05.011 Lin, G. Y., Breitwieser, R., Cheng, F., Eagen, J. T., & Ettl, M. (2000). Product Hardware Complexity and Its Impact on Inventory and Customer On-Time Delivery. International Journal of Flexible Manufacturing Systems, 12(2/3), 145–163. https://doi.org/10.1023/A:1008191530004 Lödding, H. (2013). Handbook of Manufacturing Control. Berlin, Heidelberg: Springer Berlin Heidelberg. https://doi.org/10.1007/978-3-642-24458-2
Melenovsky, M. J. (2006). Gartner’s Position on Business Process Management. Retrieved from https://www.gartner.com/doc/489533/gartners-position-business-process-management Nakandala, D., Samaranayake, P., & Lau, H. C. W. (2013). A fuzzy-based decision support model for monitoring on-time delivery performance: A textile industry case study. European Journal of Operational Research, 225(3), 507–517. https://doi.org/10.1016/j.ejor.2012.10.010 Neely, A. (1993). Performance Measurement System Design - Theory and Practice. Neely, A., Gregory, M., & Platts, K. (1995). Performance measurement system design. International Journal of Operations & Production Management, 15(4), 80–116. https://doi.org/10.1108/01443579510083622
Parmenter, D. (2015). Key Performance Indicators (3rd ed.). Hoboken, NJ, USA: John Wiley & Sons, Inc. https://doi.org/10.1002/9781119019855 Peng, D. X., & Lu, G. (2017). Exploring the Impact of Delivery Performance on Customer Transaction Volume and Unit Price: Evidence from an Assembly Manufacturing Supply Chain. Production and Operations Management, 26(5), 880–902. https://doi.org/10.1111/poms.12682
Porter, M. (1985). Competitive advantage : creating and sustaining superior performance. New York : Free Press ; London : Collier Macmillan, c1985. Samaranayake, P. (2009). Business process integration, automation, and optimization in ERP. Business Process Management Journal, 15(4), 504–526. https://doi.org/10.1108/14637150910975516

72
Schonberger, R. J., & Brown, K. A. (2017). Missing link in competitive manufacturing research and practice: Customer-responsive concurrent production. Journal of Operations Management, 49–51, 83–87. https://doi.org/10.1016/j.jom.2016.12.006 Seo, J. C., Chung, Y. H., & Park, S. C. (2015). On-Time Delivery Achievement of High Priority Orders in Order-Driven Fabrications. International Journal of Simulation Modelling, 14(3), 475–484. https://doi.org/10.2507/IJSIMM14(3)9.305 Shah, S. K., & Corley, K. G. (2006). Building Better Theory by Bridging the Quantitative/Qualitative Divide. Journal of Management Studies, 43(8), 1821–1835. https://doi.org/10.1111/j.1467-6486.2006.00662.x Slack, N., Chambers, S., & Johnston, R. (2010). Operations management (6th ed.). Pearson Education Limited. Spanyi, A. (2003). Business Process Management (BPM) is a Team Sport: Play it to Win! Anclote Press Imprint of Meghan-Kiffer Press.
Sterman, J. D., & Dogan, G. (2015). “I’m not hoarding, I’m just stocking up before the hoarders get here.” Journal of Operations Management, 39–40, 6–22. https://doi.org/10.1016/j.jom.2015.07.002
Stock, J.R. and Lambert, D. M. (2001). Strategic Logistics Management. McGraw-Hill. Retrieved from https://books.google.se/books?id=UCU3QAAACAAJ Tashakkori, A., & Creswell, J. W. (2007). Editorial: Exploring the Nature of Research Questions in Mixed Methods Research. Journal of Mixed Methods Research, 1(3), 207–211. https://doi.org/10.1177/1558689807302814 Thompson, S. C. (1999). Illusions of Control. Current Directions in Psychological Science, 8(6), 187–190. https://doi.org/10.1111/1467-8721.00044
Vandaele, N. J., Lambrecht, M. R., De Schuyter, N., & Cremmery, R. (2000). Spicer Off-Highway Products Division: Brugge Improves Its Lead-Time and Scheduling Performance. Interfaces, 30(1), 83–95. Retrieved from http://www.jstor.org.focus.lib.kth.se/stable/25062565 van Rijn, C. F. H. (1989). Production Control: A Multidisciplinary Problem. In E. O’shima & C. F. H. van Rijn (Eds.), Production Control in the Process Industry (pp. 1–15). Osaka,

73
Japan. Retrieved from http://ac.els-cdn.com.focus.lib.kth.se/B9780080369297500061/3-s2.0-B9780080369297500061-main.pdf?_tid=2e1d0aa0-2ffb-11e7-8726-00000aacb362&acdnat=1493814331_1f1a0608f74a44ea5ac8b9e420842ebc Vastag, G., & Clay Whybark, D. (2005). Inventory management: Is there a knock-on effect? International Journal of Production Economics, 93–94, 129–138. https://doi.org/10.1016/j.ijpe.2004.06.011 Voss, C., Tsikriktsis, N., & Frohlich, M. (2002). Case research in operations management. International Journal of Operations & Production Management, 22(2), 195–219. https://doi.org/10.1108/01443570210414329 Wang, S., & Sarker, B. R. (2006). Optimal models for a multi-stage supply chain system controlled by kanban under just-in-time philosophy. European Journal of Operational Research, 172(1), 179–200. https://doi.org/10.1016/j.ejor.2004.10.001 Wengraf, T. (2001). Qualitative Research Interviewing. 1 Oliver’s Yard, 55 City Road, London England EC1Y 1SP United Kingdom: SAGE Publications, Ltd. https://doi.org/10.4135/9781849209717 Yin, R. K. (2009). Case Study Research: Design and Methods. SAGE Publications. Retrieved from https://books.google.ca/books?id=FzawIAdilHkC Yue, J., Xia, Y., Tran, T., & Chen, B. (2009). Using Frontier Portfolios to Improve Make-to-Order Operations. Production and Operations Management, 18(2), 226–239. https://doi.org/10.1111/j.1937-5956.2009.01011.x Yvonne Feilzer, M. (2010). Doing Mixed Methods Research Pragmatically: Implications for the Rediscovery of Pragmatism as a Research Paradigm. Journal of Mixed Methods Research, 4(1), 6–16. https://doi.org/10.1177/1558689809349691 Zou, Z., & Li, C. (2006). Integrated and events-oriented job shop scheduling. The International Journal of Advanced Manufacturing Technology, 29(5), 551–556. https://doi.org/10.1007/s00170-005-2537-9

www.kth.se