workplace aerosol measurement · 25 workplace aerosol measurement jon c. volkwein centers for...
TRANSCRIPT
25 WORKPLACE AEROSOL MEASUREMENT
JON C. VOLKWEIN
Centers for Disease Control and Prevention, National Institute for Occupational Safety and Health, Pittsburgh, Pennsylvania
ANDREW D. MAYNARD
University of Michigan School of Public Health, Ann Arbor, Michigan
MARTIN HARPER
Centers for Disease Control and Prevention, National Institute for Occupational Safety and Health, Morgantown, West Virginia
25.1 Introduction 571
25.2 Aerosol Exposure Measurement in the Workplace 572 25.2.1 Health Relevant Sampling 572 25.2.2 Deposition Regions 572
25.3 Sampling Conventions 573 25.3.1 Sampling Against Exposure Conventions 574 25.3.2 Matching the Sampler to Sampling
Requirements 575 25.3.3 Filter and Substrate Selection 576 25.3.4 Pump Selection 576
25.4 Direct-Reading Instruments 579 25.4.1 Light Scattering 579 25.4.2 Tapered Element Oscillating Microbalance 580 25.4.3 Other Direct-Reading Instruments and
Methods 580
25.1 INTRODUCTION
Traditionally, workplace aerosols have been categorized as fumes (fine particles and agglomerates generated through combustion and vapor condensation), smokes (solid and liquid particles arising from incomplete combustion), dusts (solid particles generated through mechanical means), sprays (liquid aerosols with relatively large particle sizes, usually produced through mechanical means), and mists (liquid aerosols with finer particles, generally produced through condensation or atomization) (Vincent 1995).
25.5 Particle Size Measurement 581 25.5.1 Sampling Strategy 581
25.5.1.1 Personal Monitoring 581 25.5.1.2 Evaluation of Workplace Controls 583
25.6 Current Trends 583 25.6.1 Diesel Particulate in the Workplace 583 25.6.2 Toxic Materials 583 25.6.3 Engineered Nanomaterials 584 25.6.4 Sampling Aerosol and Vapor 584 25.6.5 Penetration versus Deposition 584
25.7 List of Symbols 584
25.8 References 585
These definitions tend to be used as descriptors rather than discrete classifications, and when considering measurement and health effects their use can be somewhat misleading. For example, a size selective sampler will not differentiate between a fume, smoke, or mist, and the distinction between health effects arising from a fume and a submicrometer dust can be somewhat blurred. Workplace aerosols present potential health impacts through ingestion, inhalation, or dermal contact, although it is the inhalation route that is of prime importance when considering aerosol measurement.
Aerosol Measurement: Principles, Techniques, and Applications, Third Edition. Edited by P. Kulkarni, P. A. Baron, and K. Willeke © 2011 John Wiley & Sons, Inc. Published 2011 by John Wiley & Sons, Inc.
571

572 WORKPLACE AEROSOL MEASUREMENT
Early workplace measurement (Walton and Vincent 1998) relied on particle number as the dominant metric with devices such as the koniometer (Le Roux 1970; Hewson 1996), impinger (Greenburg and Smith 1922), and thermal precipitator (Green and Watson 1935; Hamilton 1956) being used to collect samples and optical microscopy used to count numbers of particles. Although exposure to fibers is still assessed on a particle number basis, current sampling and analysis methods are dominated by the use of aerodynamic sizing of the aerosol followed by collection on filters and mass analysis (gravimetric, or by chemical analysis for specific elements or compounds). Mass is a suitable metric for assessing the dosage of systemic poisons, for example metals or pesticides, but it may be less suitable for assessing dosage for other end points. The main reason that mass is used is simply that gravimetric or chemical analysis is more accurate and more amenable to automation and instrumental analysis.
Workplace aerosol measurement, while similar to other areas of aerosol measurement, differs somewhat in application and circumstance. In most cases the bulk aerosol composition is known or can be deduced from the processes or products in use. The mass concentrations involved are typically an order of magnitude greater than those in the general environment. Finally, sampling is carried out specifically for assessing human exposure, rather than characterizing the aerosol itself or the physical or chemical processes associated with it.
While philosophies and approaches may differ, there is a great deal of commonality between methods used in the workplace, and those used in other areas of aerosol measurement. Thus, techniques and applications described elsewhere in this book will frequently be directly relevant to workplace sampling. Chapters 6 to 10 and 14 are particularly pertinent, providing detailed information on approaches to aerosol monitoring, filter collection, inertial, gravitational, centrifugal and thermal sampling, and direct-reading techniques. Chapters 23, 24, 26, and 27 on nonspherical particle measurement, bioaerosol measurement, ambient aerosol sampling, and aerosol exposure measurement are all relevant to the workplace. In this chapter, the emphasis is on the basic sampling philosophies and methods used on a routine basis in the. workplace and the application of direct-reading monitors in workplace aerosol measurement.
25.2 AEROSOL EXPOSURE MEASUREMENT IN THE WORKPLACE
25.2.1 Health Relevant Sampling
Workplace aerosol measurement involves the collection and analysis of samples, but ultimately concerns specific health effects caused by workers' exposure to aerosols. Thus, the method of sampling and metrics used aim to provide health
relevant information. Aerosol particles can enter the body through the skin, eyes, and gastrointestinal system, but generally the most sensitive route of entry into the body is through the respiratory system. The health effects resulting from deposition of an aerosol in the respiratory tract will depend on the dose received, and the body's response to the deposited particles (see Chapter 38). Physiological response to an aerosol is dependent on the chemical and physical nature of the particles and the location of the interaction (i.e., deposition region). The ultimate goal of workplace aerosol measurement is therefore to ascertain the dose of aerosol delivered to the body and to evaluate whether the dose or potential dose is sufficient to cause adverse health effects.
The respiratory system deposition region is primarily governed by particle size and shape. The health response may be a function of mass, chemical composition, or morphology, and possibly particle size, surface area, and surface chemistry. Ideally dose should be expressed in terms of the most appropriate metric. However, practical and economic restraints factor into the decision of appropriate aerosol measurement methods. In practice, it is simpler to measure penetration to the relevant areas of the respiratory system rather than dose, thus giving a measure of the potential dose. Mass and bulk chemical composition are easier to measure than parameters such as particle shape and surface area, and correlatibetween health effects and particle number and mass concetration (e.g., Bedford and Warner 1943) indicates mass to besuitable metric in many cases. Asbestiform fibers present exceptional case where dose is best represented by particnumber and shape, and accordingly a number amorphology-based metric is used (Chapters 23). Recentlthere has been concern that the health impacts of inhalnanometer-scale aerosol particles-particularly those assocated with some classes of emerging nanotechnologies-anot well-characterized by mass concentration measurementbut require exposure to be assessed in terms of alternative paameters (Maynard and Kuempel2005; Maynard et al. 200Fissan et al. 2007; Maynard and Aitken 2007; Oberd6stet al. 2007).
25.2.2 Deposition Regions
The respiratory system is an effective size-selective aerossampler in its own right, and it is false to assume that all aiborne particles will enter it. Large particles are excluded froentering the nose and mouth (the nasopharyngeal regiothrough inertial separation. Aspiration is a function ofnumber of parameters, including particle size, external speed, orientation to the prevailing air movement directioand breathing rate and volume. However, for external wispeeds of a few m/ s and lower, the probability of a particentering the mouth or nose (termed inhalable particlemay be generalized as being around 100% for particlwith aerodynamic diameters of a few micrometers a

below, reducing to around 50% at 100-/-Lm aerodynamic diameter (Vincent et al. 1990).
Aerosol deposition in the nasopharyngeal region is dominated by inertial impaction, although interception and diffusion (for particles in the nanometer size range) also contribute. Further inertial separation and interception occurs as the particles pass into the trachea and the upper lungs (tracheobronchial region). Although population variance is high (Lippmann 1977), penetration into the tracheobronchial region may be typified by particles smaller than approximately 10-/-Lm aerodynamic diameter (Lippmann 1977; ISO 1995). As the airways bifurcate to ever finer branches towards the alveolar region, aerosol particles are predominantly removed from the flow through a combination of impaction, interception, charge effects, and diffusion. In the preceding regions, deposited particles are cleared primarily by the action of cilia transporting them along to the upper airways. Particles depositing in the alveolar, or gas exchange, region are typically cleared either through the action of alveolar macrophages engulfing them, or transporting them to ciliated airways (phagocytosis), or by dissolution in the lung fluid. Particle deposition is through impaction and diffusion, and penetration to the alveolar region is restricted to particles around 5-j-Lm and less aerodynamic diameter (Lippmann 1977; ISO 1995). The clearance mechanism employed in the alveolar region, together with the close proximity of the bloodstream, leads to a number of health effects specific to particle deposition within this region. Not all particles that enter the respiratory track are deposited; a portion, depending on size, are exhaled in the breath [International Commission on Radiological Protection (ICRP) 1995].
Aerosol characteristics such as size, morphology, surface area, and structure are also influential; however, current technology lacks the means to characterize workplace aerosols as completely as may be desirable. Fortunately, the specificity of many workplace aerosols enables successful exposure monitoring to be carried out by linking a related metric (such as mass concentration) to empirical dose-response data (Maynard and Aitken 2007). The extent to which this approach is tenable where toxicity data are sparse is questionable however.
25.3 SAMPLING CONVENTIONS
The measurement of aerosol exposure via inhalation requires sampling devices that match particle deposition to the relevant areas of the respiratory system. However, aerosol deposition is highly dependent on the individual (Lippmann 1977), and not trivial to replicate in a sampling device. Broad standards have therefore been developed describing representative penetration characteristics of aerosol particles through the respiratory system as a function of aerodynamic
25.3 SAMPLING CONVENTIONS 573
diameter. More recently, similar standards have been proposed with modifications to take into account deposition as well as penetration (Vincent 2005), and these standards are under discussion within the International Organization for Standardization, but they have not been accepted at this time. The existing aerosol penetration standards provide a basis for estimating the aerosol concentration potentially available to cause harm within specific areas of the respiratory system, and underlie many industrial hygiene aerosol sampling methods.
Early estimates of penetration into what was considered the most vulnerable part of the system-the alveolar region-were proposed in the 1950s and 1960s, resulting in the British Mines Research Council (BMRC) and the American Conference of Government Industrial Hygienists (ACGIH) conventions describing respirable aerosols (BMRC 1952; ACGIH 1968). More recently, the International Organization for Standardization (ISO 1995) and the ACGIH (ACGIH 1998) arrived at convergent conventions describing the probability of particles penetrating to the nasopharyngeal, tracheobronchial, and alveolar regions. However, it wasn't until the early 1990s that international consensus was reached on particle penetration standards among ISO, AC GIH , and the European Committee for Standardization (CEN). The resulting conventions describe penetration as a function of particle aerodynamic diameter into the respiratory system (inhalable aerosol), into the tracheobronchial region (thoracic aerosol), and into the alveolar region (respirable aerosol), with thoracic and respirable aerosol as subfractions of the inhalable aerosol. These particle size-dependent fractions shown in Figure 25-1 are now widely used as the standards to which industrial hygiene aerosol samplers should conform (ISO 1995).
The inhalable convention is based on particle penetration through the mouth and nose of a breathing mannequin over a
.... ••••••••• Respirable . ...... - - Thoracic
0.8 ~- -- Totallnhalable
\ \- - - PM2.S ,- -- PM10
r::: 0.6 \.. 0
~ '\ Q) \ \', r::: \ CD 0.4 a.
\ \ "
0.2 \\ '1 \. , .... . ,
0 ....... .....
1 10 100
Date/11m
Figure 25-1 International workplace sampling conventions (ISO 1995). Environmental conventions are also shown for comparison (Chapter 26).
574 WORKPLACE AEROSOL MEASUREMENT
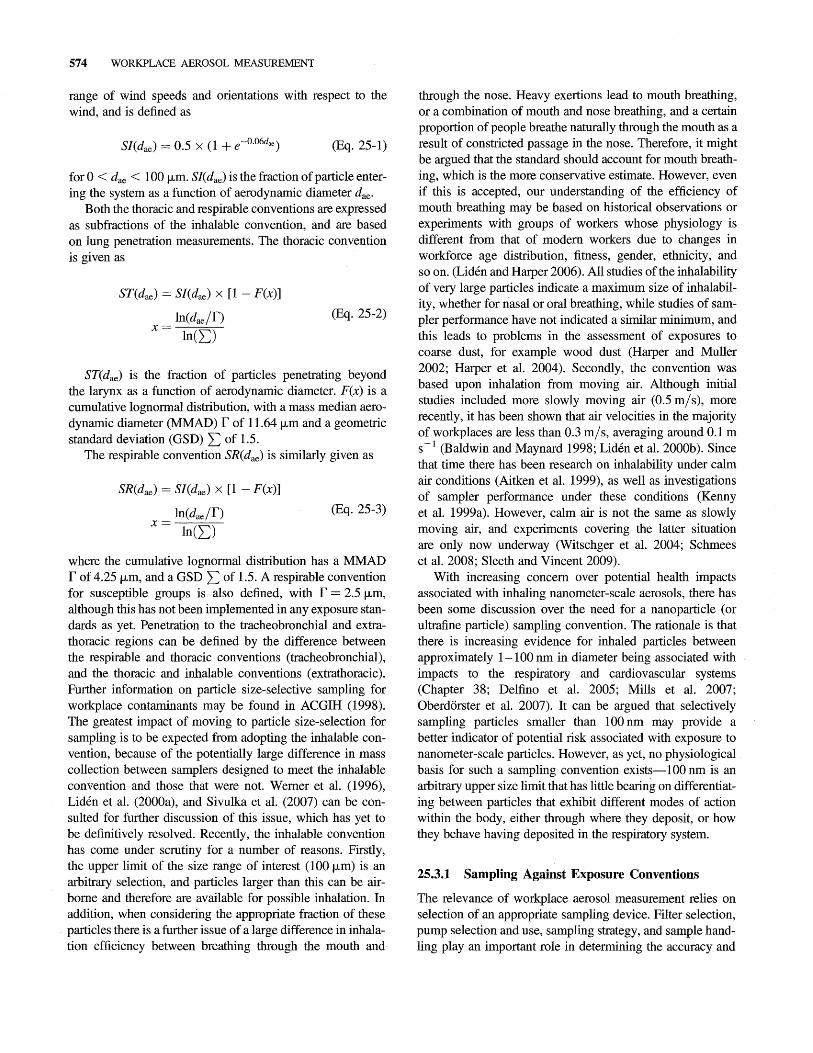
range of wind speeds and orientations with respect to the wind, and is defined as
(Eq.25-1)
for 0 < dae < 100 /Lm. SJ(dae) is the fraction of particle entering the system as a function of aerodynamic diameter dae.
Both the thoracic and respirable conventions are expressed as subfractions of the inhalable convention, and are based on lung penetration measurements. The thoracic convention is given as
ST(dae) = SJ(dae) x [1 - F(x)]
In(daelf) x = In(E)
(Eq.25-2)
ST(dae) is the fraction of particles penetrating beyond the larynx as a function of aerodynamic diameter. F(x) is a cumulative lognormal distribution, with a mass median aerodynamic diameter (MMAD) f of 11.64 /Lm and a geometric standard deviation (GSD) E of 1.5.
The respirable convention SR(dae) is similarly given as
SR(dae ) = SJ(dae) x [1 - F(x)]
In(daelf) x = In(E)
(Eq.25-3)
where the cumulative lognormal distribution has a MMAD f of 4.25 /Lm, and a GSD E of 1.5. A respirable convention for susceptible groups is also defined, with f = 2.5 /Lm, although this has not been implemented in any exposure standards as yet. Penetration to the tracheobronchial and extrathoracic regions can be defined by the difference between the respirable and thoracic conventions (tracheobronchial), and the thoracic and inhalable conventions (extrathoracic). Further information on particle size-selective sampling for workplace contaminants may be found in ACGIH (1998). The greatest impact of moving to particle size-selection for sampling is to be expected from adopting the inhalable convention, because of the potentially large difference in mass collection between samplers designed to meet the inhalable convention and those that were not. Werner et al. (1996), Liden et al. (2000a), and Sivulka et al. (2007) can be consulted for further discussion of this issue, which has yet to be definitively resolved. Recently, the inhalable convention has come under scrutiny for a number of reasons. Firstly, the upper limit of the size range of interest (100/Lm) is an arbitrary selection, and particles larger than this can be airborne and therefore are available for possible inhalation. In addition, when considering the appropriate fraction of these particles there is a further issue of a large difference in inhalation efficiency between breathing through the mouth and
through the nose. Heavy exertions lead to mouth breathing, or a combination of mouth and nose breathing, and a certain proportion of people breathe naturally through the mouth as a result of constricted passage in the nose. Therefore, it might be argued that the standard should account for mouth breathing, which is the more conservative estimate. However, even if this is accepted, our understanding of the efficiency of mouth breathing may be based on historical observations or experiments with groups of workers whose physiology is different from that of modem workers due to changes in workforce age distribution, fitness, gender, ethnicity, and so on. (Liden and Harper 2006). All studies of the inhalability of very large particles indicate a maximum size of inhalability, whether for nasal or oral breathing, while studies of sampler performance have not indicated a similar minimum, and this leads to problems in the assessment of exposures to coarse dust, for example wood dust (Harper and Muller 2002; Harper et al. 2004). Secondly, the convention was based upon inhalation from moving air. Although initial studies included more slowly moving air (0.5 m/s), more recently, it has been shown that air velocities in the majority of workplaces are less than 0.3 mis, averaging around 0.1 m s -1 (Baldwin and Maynard 1998; Liden et al. 2000b). Since that time there has been research on inhalability under calm air conditions (Aitken et al. 1999), as well as investigations of sampler performance under these conditions (Kenny et al. 1999a). However, calm air is not the same as slowly moving air, and experiments covering the latter situation are only now underway (Witschger et al. 2004; Schmees et al. 2008; Sleeth and Vincent 2009).
With increasing concern over potential health impacts associated with inhaling nanometer-scale aerosols, there has been some discussion over the need for a nanoparticle (or ultrafine particle) sampling convention. The rationale is that there is increasing evidence for inhaled particles between approximately 1-100 nm in diameter being associated with impacts to the respiratory and cardiovascular systems (Chapter 38; Delfino et al. 2005; Mills et al. 2007; Oberd6rster et al. 2007). It can be argued that selectively sampling particles smaller than 100 nm may provide a better indicator of potential risk associated with exposure to nanometer-scale particles. However, as yet, no physiological basis for such a sampling convention exists-1 00 nm is an arbitrary upper size limit that has little bearing on differentiating between particles that exhibit different modes of action within the body, either through where they deposit, or how they behave having deposited in the respiratory system.
25.3.1 Sampling Against Exposure Conventions
The relevance of workplace aerosol measurement relies on selection of an appropriate sampling device. Filter selection, pump selection and use, sampling strategy, and sample handling play an important role in determining the accuracy and

suitability of sampling devices. Useful sources of information include ACGIH (1995) and ACGIH (1998).
25.3.2 Matching the Sampler to Sampling Requirements
A number of the industrial hygiene aerosol samplers introduced to the market in recent years have been developed and tested against International sampling conventions (ISO 1995). However, many devices are still available that were brought into use prior to acceptance of the current conventions. Many such samplers continue to be in use as they are prescribed by national regulations, or their use is preferred to maintain traceability to historic measurement methods, whose results may have been used to develop risk assessments. Some agree reasonably well with the relevant convention and others have been brought into line by altering the sampling flow rate [e.g., the SIMPEDS respirable cyclone (Bartley et al. 1994; Maynard and Kenny 1995)]. Performance tests of existing samplers have given mixed results in the laboratory (Kenny et al. 1997; Gomer et al. 2001).
The development of inhalable samplers has been hampered by the complexities of how external conditions, such as wind speed and direction, affect aspiration, together with the difficulties of making penetration measurements with particles up to 100-f.Lm aerodynamic diameter or larger. The 10M personal inhalable sampler was the first sampler built to match the inhalable convention, and was developed following aspiration measurements with a breathing mannequin (Mark and Vincent 1986). The 10M sampler has significant shortcomings. For instance the filter is very accessible to accidental or deliberate sample tampering, plastic cassettes have severe instability in weighing (Smith et al. 1998; Li and Lundgren 1999; Liden and Bergman 2001), there is evidence for significant projectile and large particle entry (Liden and Kenny 1994; Aitken and Donaldson 1996; Aizenberg et al. 2001), and it can give extremely variable results when external winds are directional (Roger et al. 1998). It is included in the UK method for determining dust gravimetrically (Health and Safety Executive 1997), where the entire capsule is weighed, and, by reference, in the UK method for metals analysis (Health and Safety Executive 2006). However, in this latter method, no guidance is given on how to account for particulate that has collected on internal surfaces of the sampler other than on the filter. This is a problem where these "wall deposits" are a significant part of the sample, since, by design they are intended to be an integral part of the sample. The issue of wall deposits has come to the forefront as the 10M sampler is compared to the traditional closed-face 37-mm cassette used in the United States and some European countries as a result of changes in limit values to reflect sampling in accordance with the inhalable convention (Harper and Demange 2007). Field studies of
25.3 SAMPLING CONVENTIONS 575
the closed-face cassette sampler side by side with the 10M sampler show much better agreement when the filter deposits alone are compared (Harper et al. 2007) or the filter deposits and the wall deposits are compared for both (Demange et al. 2002). The cheap and disposable closed-face cassette has many practical advantages over more expensive and necessarily re-usable samplers. Internal capsules such as the
TM 1 TM Accucap from SKC or the Woodchek from MSA are available for use in the closed-face cassette to ensure all particles are included in gravimetric analysis, including those that might otherwise have deposited on the walls of the sampler. Otherwise, for chemical analysis where the filter is digested, it may be necessary to wipe the internal surfaces of the sampler with a small piece of filter or wipe material and add this to the digestion step (Harper 2006).
More recent samplers such as the CIP10-1 (ARE) address some of the problems inherent in the 10M inhalable sampler, but still fall short of the ideal. Samplers such as the Button Aerosol Sampler (SKC) have been developed specifically to reduce inters ampler variability and wind speed-dependence common to a number of inhalable samplers (Aizenberg et al. 2000, 2001), but it is unclear if it samples in accordance with the inhalable convention in the field (Harper and Muller 2002; Linnainmaa et al. 2008). Samplers following the thoracic and respirable conventions have been easier to engineer. The development of an empirical understanding of particle penetration through cyclones and polyurethane foams in particular has led to sampling devices that match the respirable and thoracic conventions reasonably well (Vincent et al. 1993; Kenny and Gussman 1997; Chen et al. 1998; Maynard 1999).
In recognition that no sampler will agree with the current workplace sampling conventions at all times, performance criteria are under development to set acceptable bounds on how well a device performs (CEN 1998). These boundaries are in essence set by comparing the mass fraction of a lognormal aerosol-characterized by its MMAD and GSD-that would be sampled by a device, to the mass that would be sampled by an ideal sampler (i.e., one following the convention perfectly). The comparison gives the sampler's bias as a function of aerosol size distribution (Bartley and Breuer 1982; Liden and Kenny 1992; Maynard and Kenny 1995). Incorporating errors inherent in sampler performance measurements and typical usage into calculations of bias allows the sampler's accuracy as a function of the aerosol size distribution to be estimated. When sampler accuracy and bias lie within acceptable bounds, a basis is provided for determining acceptable sampler performance.
From the available samplers that lie within acceptable performance criteria, the choice of device will depend largely on the sampling requirements. Two general types of sampling
1 Refer to Appendix I for complete manufacturers' addresses indexed to a three-letter code.
576 WORKPLACE AEROSOL MEASUREMENT
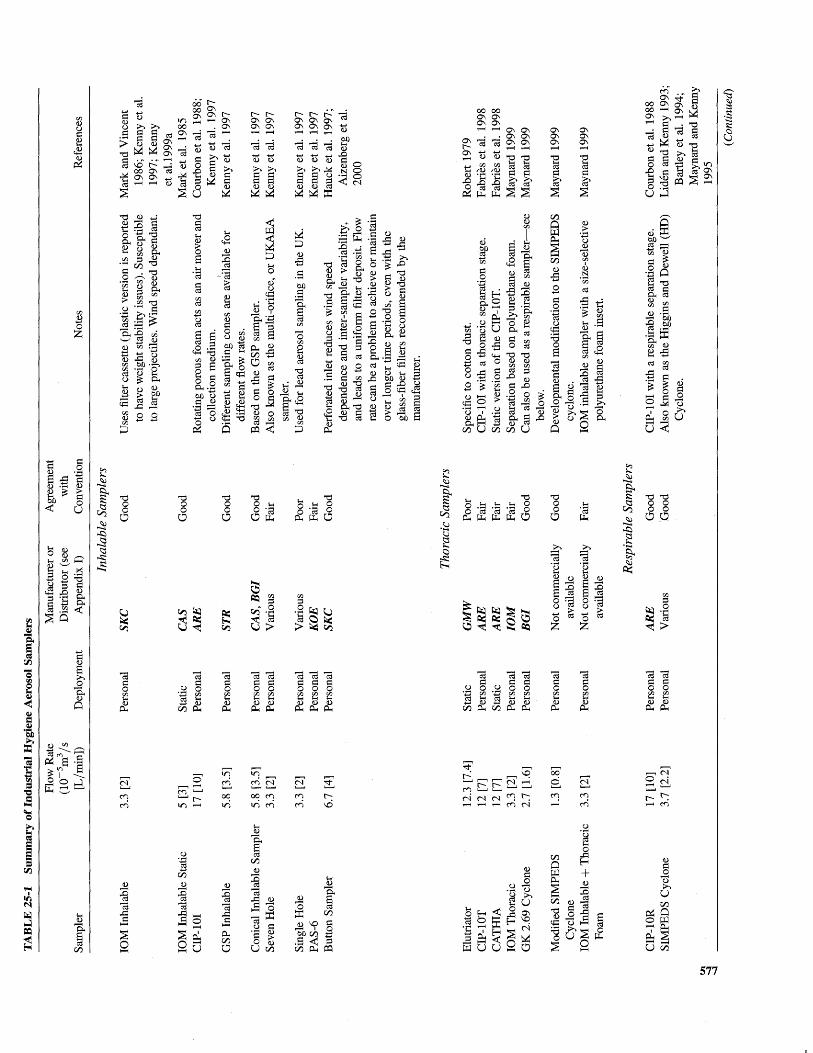
are used in the workplace: fixed location sampling (also called static or area sampling) or personal sampling, where the sampler is placed on the worker. Static and personal samplers should not be interchanged because poor correlation exists between the two types of sampling (Kissell and Sacks 2002; Rodes and Thornburg 2005). High flow-rate samplers should be used to increase the aerosol detection limit, for instance during short term sampling or when the sampled material has a low exposure limit (although the detection limit will also be dependent on the filter used and the analysis method). Where high air velocities are expected, samplers with a sampling efficiency that are not as prone to wind speed should be selected. Other considerations should include whether the aerosol charge is likely to affect sampling (e.g., Baron and Deye 1990; Puskaret al. 1991), whether projectiles are likely to enter the sampling orifice and be included in the sample, and whether there is a possibility of significant sample loss during transport (see Chapter 6). Table 25-1 summarizes many of the workplace sampling devices currently available or in use, and gives some indication as to their application.
Sampler selection, however, may be constrained when compliance type measurements are required. To simplify compliance type measurements, many governments mandate that a specific type or types of samplers operated at prescribed flow rates be used to collect samples for analysis. In the United States, for example, respirable particulates are collected using Dorr-Oliver cyclones at a flow rate of 1.7 L/ min or SIMPEDS-type cyclones at a flow rate of 2.2 L/min to estimate an ISO respirable-size fraction of particulates for analysis [NIOSH Manual of Analytical Methods (NMAM) 2003]. Specific government regulations should be consulted before compliance sampling is conducted.
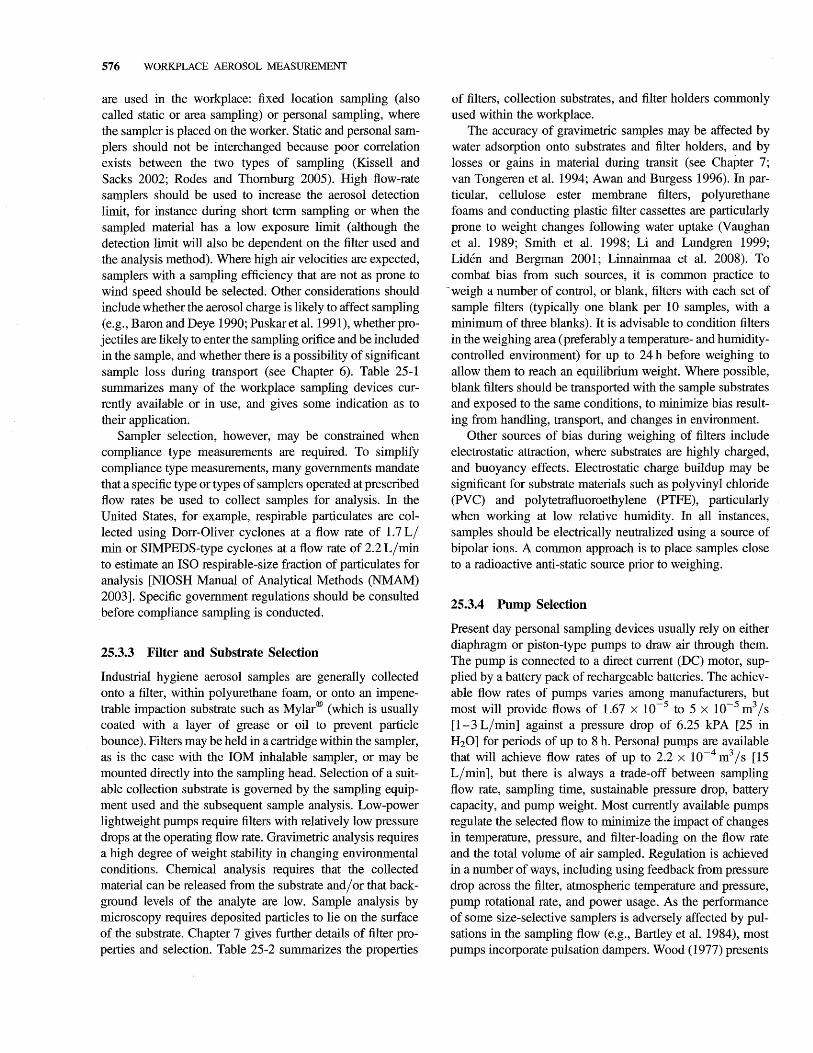
25.3.3 Filter and Substrate Selection
Industrial hygiene aerosol samples are generally collected onto a filter, within polyurethane foam, or onto an impenetrable impaction substrate such as Mylar® (which is usually coated with a layer of grease or oil to prevent particle bounce). Filters may be held in a cartridge within the sampler, as is the case with the 10M inhalable sampler, or may be mounted directly into the sampling head. Selection of a suitable collection substrate is governed by the sampling equipment used and the subsequent sample analysis. Low-power lightweight pumps require filters with relatively low pressure drops at the operating flow rate. Gravimetric analysis requires a high degree of weight stability in changing environmental conditions. Chemical analysis requires that the collected material can be released from the substrate and/or that background levels of the analyte are low. Sample analysis by microscopy requires deposited particles to lie on the surface of the substrate. Chapter 7 gives further details of filter properties and selection. Table 25-2 summarizes the properties
of filters, collection substrates, and filter holders commonly used within the workplace.
The accuracy of gravimetric samples may be affected by water adsorption onto substrates and filter holders, and by losses or gains in material during transit (see Chapter 7; van Tongeren et al. 1994; Awan and Burgess 1996). In particular, cellulose ester membrane filters, polyurethane foams and conducting plastic filter cassettes are particularly prone to weight changes following water uptake (Vaughan et al. 1989; Smith et al. 1998; Li and Lundgren 1999; Liden and Bergman 2001; Linnainmaa et al. 2008). To combat bias from such sources, it is common practice to
-weigh a number of control, or blank, filters with each set of sample filters (typically one blank per 10 samples, with a minimum of three blanks). It is advisable to condition filters in the weighing area (preferably a temperature- and humiditycontrolled environment) for up to 24 h before weighing to allow them to reach an equilibrium weight. Where possible, blank filters should be transported with the sample substrates and exposed to the same conditions, to minimize bias resulting from handling, transport, and changes in environment.
Other sources of bias during weighing of filters include electrostatic attraction, where substrates are highly charged, and buoyancy effects. Electrostatic charge buildup may be significant for substrate materials such as polyvinyl chloride (PVC) and polytetrafiuoroethylene (PTFE) , particularly when working at low relative humidity. In all instances, samples should be electrically neutralized using a source of bipolar ions. A common approach is to place samples close to a radioactive anti-static source prior to weighing.
25.3.4 Pump Selection
Present day personal sampling devices usually rely on either diaphragm or piston-type pumps to draw air through them. The pump is connected to a direct current (DC) motor, supplied by a battery pack of rechargeable batteries. The achievable flow rates of pumps varies among manufacturers, but most will provide flows of 1.67 x 10⁻⁵ to 5 X 10⁻⁵ m3/s [1-3 L/min] against a pressure drop of 6.25 kPA [25 in H20] for periods of up to 8 h. Personal pumps are available that will achieve flow rates of up to 2.2 X 10⁻⁴ m3/s [15 L/min] , but there is always a trade-off between sampling flow rate, sampling time, sustainable pressure drop, battery capacity, and pump weight. Most currently available pumps regulate the selected flow to minimize the impact of changes in temperature, pressure, and filter-loading on the flow rate and the total volume of air sampled. Regulation is achieved in a number of ways, including using feedback from pressure drop across the filter, atmospheric temperature and pressure, pump rotational rate, and power usage. As the performance of some size-selective samplers is adversely affected by pulsations in the sampling flow (e.g., Bartley et al. 1984), most pumps incorporate pulsation dampers. Wood (1977) presents
TA
BL
E 2
5-1
Su
mm
ary
of
Ind
ust
rial
Hyg
iene
Aer
osol
Sam
pler
s
Flo
w R
ate
Man
ufac
ture
r or
A
gree
men
t (l
0-5
m3 Is
D
istr
ibut
or (
see
wit
h S
ampl
er
[L/m
inD
D
eplo
ymen
t A
ppen
dix
I)
Con
vent
ion
Not
es
Ref
eren
ces
Inha
labl
e Sa
mpl
ers
10
M I
nhal
able
3.
3 [2
] P
erso
nal
SKC
G
ood
Use
s fi
lter
cass
ette
(pl
asti
c ve
rsio
n is
rep
orte
d M
ark
and
Vin
cent
to
hav
e w
eigh
t st
abil
ity
issu
es).
Sus
cept
ible
19
86;
Ken
ny e
t al
. to
lar
ge p
roje
ctil
es.
Win
d sp
eed
depe
ndan
t. 19
97;
Ken
ny
et a
l.19
99a
10
M I
nhal
able
Sta
tic
5 [3
] S
tati
c C
AS
Goo
d M
ark
et a
l. 19
85
CIP
-1O
I 17
[10
] P
erso
nal
AR
E
Rot
atin
g po
rous
foa
m a
cts
as a
n ai
r m
over
and
C
ourb
on e
t al
. 19
88;
coll
ecti
on m
ediu
m.
Ken
ny e
t al
. 19
97
I
GS
P I
nhal
able
5.
8 [3
.5]
Per
sona
l ST
R
Goo
d D
iffe
rent
sam
plin
g co
nes
are
avai
labl
e fo
r K
enny
et
al.
1997
di
ffer
ent
flow
rat
es.
Con
ical
Inh
alab
le S
ampl
er
5.8
[3.5
] P
erso
nal
CA
S, R
GI
Goo
d B
ased
on
the
GS
P s
ampl
er.
Ken
ny e
t al
. 19
97
Sev
en H
ole
3.3
[2]
Per
sona
l V
ario
us
Fai
r A
lso
know
n as
the
mul
ti-o
rifi
ce,
or U
KA
EA
K
enny
et
al.
1997
sa
mpl
er.
Sin
gle
Hol
e 3.
3 [2
] P
erso
nal
Var
ious
P
oor
Use
d fo
r le
ad a
eros
ol s
ampl
ing
in t
he U
K.
Ken
ny e
t al
. 19
97
PA
S-6
P
erso
nal
KO
E
Fai
r K
enny
et
al.
1997
B
utto
n S
ampl
er
6.7
[4]
Per
sona
l SK
C
Goo
d P
erfo
rate
d in
let
redu
ces
win
d sp
eed
Hau
ck e
t al
. 19
97;
depe
nden
ce a
nd i
nter
-sam
pler
var
iabi
lity
, A
izen
berg
et
al.
and
lead
s to
a u
nifo
rm f
ilter
dep
osit
. F
low
20
00
rate
can
be
a pr
oble
m to
ach
ieve
or m
aint
ain
over
lon
ger
tim
e pe
riod
s, e
ven
wit
h th
e gl
ass-
fibe
r fi
lters
rec
omm
ende
d by
the
m
anuf
actu
rer.
Tho
raci
c Sa
mpl
ers
Elu
tria
tor
12.3
[7.
4]
Sta
tic
GM
W
Poo
r S
peci
fic
to c
otto
n du
st.
Rob
ert
1979
C
IP-l
OT
12
[7]
P
erso
nal
AR
E
Fai
r C
IP-1
OI
wit
h a
thor
acic
sep
arat
ion
stag
e.
Fab
ries
et
al.
1998
C
AT
HIA
12
[7]
St
atic
A
RE
F
air
Sta
tic
vers
ion
of
the
CIP
-lO
T.
Fab
ries
et
al.
1998
1
0M
Tho
raci
c 3.
3 [2
] P
erso
nal
10
M
Fai
r S
epar
atio
n ba
sed
on p
olyu
reth
ane
foam
. M
ayna
rd 1
999
GK
2.6
9 C
yclo
ne
2.7
[1.6
] P
erso
nal
RG
I G
ood
Can
als
o be
use
d as
a r
espi
rabl
e sa
mp
ler-
see
May
nard
199
9 be
low
. M
odif
ied
SIM
PE
DS
1.
3 [0
.8]
Per
sona
l N
ot c
omm
erci
ally
G
ood
Dev
elop
men
tal m
odif
icat
ion
to t
he S
IMP
ED
S
May
nard
199
9 C
yclo
ne
avai
labl
e cy
clon
e.
10
M I
nhal
able
+ T
hora
cic
3.3
[2]
Per
sona
l N
ot c
omm
erci
ally
F
air
10
M in
hala
ble
sam
pler
wit
h a
size
-sel
ecti
ve
May
nard
199
9 F
oam
av
aila
ble
poly
uret
hane
foa
m i
nser
t.
Res
pira
ble
Sam
pler
s
CIP
-lO
R
17 [
10]
Per
sona
l A
RE
G
ood
CIP
-1O
I w
ith
a re
spir
able
sep
arat
ion
stag
e.
Cou
rbon
et
al.
1988
S
IMP
ED
S C
yclo
ne
3.7
[2.2
] P
erso
nal
Var
ious
G
ood
Als
o kn
own
as t
he H
iggi
ns a
nd D
ewel
l (H
D)
Lid
en a
nd K
enny
199
3;
Cyc
lone
. B
artl
ey e
t al
. 19
94;
May
nard
and
Ken
ny
til
1995
.....
:t .....
:t
( Con
tinu
ed)

!.II
T
AB
LE
25-
1 C
onti
nued
-.
.l Q
C
Flo
w R
ate
Man
ufac
ture
r or
A
gree
men
t (l
O-5
m3/
s D
istr
ibut
or (
see
wit
h S
ampl
er
[L/m
inD
D
eplo
ymen
t A
ppen
dix
I)
Con
vent
ion
Not
es
Ref
eren
ces
SK
C C
yclo
ne
Per
sona
l S
KC
G
ood
Var
iant
of
the
SIM
PE
DS
Cyc
lone
. L
iden
199
3 G
K 2
.69
Cyc
lone
7
[4.2
] P
erso
nal
BG
I G
ood
Can
als
o be
use
d as
a t
hora
cic
sam
ple
r-se
e M
ayna
rd 1
999
abov
e.
DO
ff-O
liver
(lO
mm
) 2.
8 [1
.7]
Per
sona
l V
ario
us
Goo
d S
ampl
er c
onst
ruct
ed f
rom
non
-con
duct
ing
Bar
tley
et
al.
1994
C
yclo
ne
nylo
n.
MR
E 1
13A
(G
ravi
met
ric
4.2
[2.5
] St
atic
C
AS
F
air
Use
lim
ited
to
UK
min
es.
Dun
mor
e et
al.
1964
D
ust S
ampl
er)
10
M
3.3
[2]
Per
sona
l S
KC
G
ood
10
M in
hala
ble
sam
pler
wit
h a
size
-sel
ecti
ve
Ken
ny e
t al
. 19
99b
Inha
labl
e +
Res
pira
ble
poly
uret
hane
foa
m i
nser
t. F
oam
has
wei
ght
Foa
m
stab
ilit
y is
sues
. F
oam
Res
pira
ble
Sam
pler
3.
3 [2
] P
erso
nal
Not
com
mer
cial
ly
Goo
d C
owle
d sa
mpl
er w
ith
size
sel
ecti
ve
Che
n et
al.
1998
av
aila
ble
poly
uret
hane
foa
m p
lugs
. V
irtu
al C
yclo
ne
Per
sona
l N
ot c
omm
erci
ally
G
ood
Pro
vide
s a
good
mat
ch w
ith
the
resp
irab
le
Che
n et
al.
1999
av
aila
ble
conv
enti
on s
lope
. Sp
iral
Sam
pler
4.
2 [2
.5]
Per
sona
l N
ot c
omm
erci
ally
U
ses
cent
rifu
gal
part
icle
sep
arat
ion.
Jo
hn a
nd K
reis
berg
av
aila
ble
1999
(PM
-2.5
op
erat
ion)
F
SP
-10
17 [
10]
Per
sona
l/
ST
R
Goo
d B
IA 2
002
stat
ic
Mis
cell
aneo
us S
ampl
ers
37-m
m C
asse
tte
(Ope
n)
3.3
[2]
Per
sona
l/
Var
ious
S
tand
ard
filte
r ca
sset
te,
wor
n fa
cing
dow
n at
K
enny
et
al.
1997
st
atic
45
° to
the
bod
y, b
ut f
acin
g fo
rwar
d m
ay
give
a b
ette
r ap
prox
imat
ion
to t
he in
hala
ble
conv
enti
on.
Wal
l de
posi
ts s
houl
d be
ac
coun
ted
for
whe
re n
eces
sary
. St
atic
-di
ssip
ativ
e ve
rsio
ns a
vaila
ble.
37
-mm
Cas
sett
e (C
lose
d)
3.3
[2]
Per
sona
l/
Var
ious
S
tand
ard
filte
r ca
sset
te a
s ab
ove
wit
h a
cap
Ken
ny e
t al
. 19
97
stat
ic
cont
aini
ng a
4-m
m d
iam
eter
inl
et.
Inte
rnal
ca
psul
es t
o ac
coun
t for
wal
l de
posi
ts a
re
avai
labl
e.
Sta
tic
Sam
pler
for
"T
otal
" V
aria
ble
Sta
tic
CA
S
Ope
n fa
ced
filte
r. W
idel
y us
ed i
n th
e U
K.
Mar
k et
al.
1986
A
eros
ol
Pas
sive
Sam
pler
P
erso
nal/
H
SE
, U
K
Ele
ctre
t-ba
sed
sam
pler
rel
ying
on
aero
sol
Bro
wn
et a
l. 19
94;
stat
ic
char
ge a
nd n
atur
ally
occ
urri
ng a
ir
Bro
wn
et a
l. 19
95
mov
emen
ts.
Cor
rela
tion
is
good
wit
h so
me
size
sel
ecti
ve s
ampl
ers.
C
owle
d S
ampl
er
3.3
[2]
(Typ
ical
) P
erso
nal/
V
ario
us
Use
d in
the
mai
n fo
r fi
ber
sam
plin
g. S
ize
stat
ic
sele
ctiv
ity
not
quan
tifi
ed.
Res
pico
n 5.
2 [3
.1]
Per
sona
l T
SI
Vir
tual
im
pact
or a
nd f
ilter
mea
sure
s al
l th
ree
Koc
h 19
98
sam
plin
g co
nven
tion
s.

TABLE 25-2 Filter Selection for Industrial Hygiene Aerosol Sampling
Weight Pressure Substrate or Cassette Typical Application Stabilitya Dropa
Glass fiber filter General collection *** **
Gravimetric analysis
Quartz-fiber filter Chemical analysis ***
Cellulose ester Imaging, fiber ***
membrane filter sampling, digestion for metals analysis
PVC membrane filter General collection **** ***
Gravimetric analysis
Teflon membrane Gravimetric analysis **** **
filter Chemical analysis Poly carbonate filter Particle imaging ****
Silver membrane Chemical analysis, ****
filter X -ray diffraction analysis
Polyurethane foam Various samplers ****
Mylar impaction Impaction substrate ** N/A substrate
Aluminum foil Impaction substrate ** N/A impaction substrate
Conducting plastic 10M inhalable N/A cassette sampler, conical
inhalable sampler Stainless steel 10M inhalable **** N/A
cassette sampler PVC Accucap
TM Gravimetric analysis **** ***
WoodchekTM (PVC Gravimetric analysis **** ***
filter and aluminum cone)
a A higher star rating indicates better weight stability or lower pressure drop.
a useful review of personal sampling pumps carried out in 1977, and apart from advances in flow control technology, basic pump mechanisms are the same.
The volumetric flow rate of sampling pumps needs to be set under the same conditions of temperature and humidity as sampling will be carried out and with the sampling device attached (including filter). Although many pumps incorporate a visual indication of flow rate such as a rotameter or digital display, these should be used for indication purposes only, and the sampling flow measured or calibrated using a primary standard such as a bubble flow meter or newer electronic flow meters, traceable to national or international standards. Typically, the set flow rate is expected to be within 5 % of the target flow rate, although the most recent guidelines on sampling in the UK specify flows to be set to ±1.67 x 10⁻⁶ m3
/ s [± 0.1 L/min] in all cases (HSE 1997).
25.4 DIRECT-READING INSTRUMENTS 579
25.4 DIRECT-READING INSTRUMENTS
Perhaps the most recent changes in workplace aerosol measurement have been in the area of real-time measurement. A report of the United States Secretary of Labor's Advisory Committee on the Elimination of Pneumoconiosis Among Coal Mine Workers listed several recommendations dealing with the need for continuous respirable dust monitors to help protect workers' health (US Department of Labor 1996). In addition, a National Institute for Occupational Safety and Health (NIOSH) Criteria Document lists improved sampling devices as a research need pertinent to coal miner respiratory health and prevention of disease (NIOSH 1995). Monitors giving a near-instantaneous, or rapid measure of aerosol properties (commonly referred to as real-time measurement instruments) are widely used in the workplace. Vincent (1995), Walton and Vincent (1998), and Maynard and Baron (2004), provide a broad summary of techniques commonly used in the workplace. However, many devices described in earlier chapters may be applied to the workplace if unique aspects of the workplace are taken into account.
Several approaches have being taken to address these unique aspects. An early effort used impaction sampling and beta-attenuation analysis of the deposit to determine short term aerosol measurements (Volkwein and Behum 1978). More promising technologies emerged that included lightscattering dust monitors, (Lehocky and Williams 1996; Tsao et al. 1996) and lately a person-wearable tapered-element oscillating microbalance (Volkwein et al. 2004, 2006). The principal goal of each of these efforts has been to develop an instrument that will give short term or real-time measurements of worker aerosol exposure. A further unique requirement for some workplace sampling may require intrinsic safety design such that Underwriters Laboratory or MSHA certification for use in potentially explosive environments can be secured. Detailed descriptions of the operational principles of these techniques may be found in Chapters 12 and 13 of this book.
25.4.1 Light Scattering
The theory of these instruments based on light scattering from particles has been summarized in Chapter 13. Several of the monitors have been characterized in the laboratory for different dusts (Keeton 1979; Marple and Rubow 1981, 1984; Kuusisto 1983; Rubow and Marple 1983). The relationship of the instruments' response to dust concentration is not simple but depends on particle size, particle composition, and on instrument design and manufacturing differences. Significant changes in dust particle characteristics such as shape, size, surface properties, and density can affect the instrument's correlation with mass concentration and require calibration of the instrument for each type of dust measured (Williams and Timko 1984). These factors have limited the use of photometers to dust-source identification and control

580 WORKPLACE AEROSOL MEASUREMENT
technology evaluation. They are not useful for monitoring compliance with dust standards.
For routine walk-through measurements, aerosol photometers are widely used, and available from an increasing number of manufacturers. Their use covers checking short term, task-specific, or instantaneous exposure levels in low to high aerosol loadings, and identifying exposure hot spots. The implementation of the measurement method has various guises, from passive instruments relying on convection to bring particles into the sensing zone (as with the MiniRAM, and the later Personal Data-RAM (TFS), to pumped devices such as the Microdust Pro (CAS), to instruments incorporating data loggers [e.g., the DustTrack (TSl) and Data-RAM (TFS)] or person-wearable SIDEPAK
1M (TSl).
Most devices are compact, with the majority being portable, and a number of them being suitable for personal sampling.
Over a relatively narrow size range (approximating to the upper end of respirable size fraction or the Mie scattering regime) the light scattered from an aerosol is roughly proportional to the scattering volume (Chapter 14; Baron 1994). Thus, after correcting for density, scattered light may be used as an indirect measure of mass concentration. The method is relatively good for measuring respirable aerosol concentration, but becomes tenuous when used for the thoracic subfraction, and potentially misleading when used to measure the inhalable aerosol mass concentration (the sensitivity to equivalent aerosol masses represented by 20-/Lm particles is approximately a factor of 102 lower than the sensitivity to 2-/Lm particles). Instruments such as the Respicon ™ (HUN) go some way to overcoming this size dependence of photometry by selectively concentrating larger particles through the use of virtual impaction (Koch et al. 1998, 2002; Rando et al. 2005). In some situations it is feasible to calibrate a photometer to the inhalable mass concentration, but only when the fine particles detected form a constant fraction of the inhalable aerosol. Optical single particle detection and sizing instruments such as the Grimm Work -Check (GRl) overcome some of the limitations of photometers, but their sensitivity is still restricted to a similar range of particle sizes.
In all cases it is advisable to calibrate photometers before using them with different aerosols, as particle size distribution, shape, and refractive index will affect measurements. Calibration is usually performed by carrying out parallel gravimetric sampling, and applying an adjustment factor to the photometer to ensure results agree. Many photometers have the facility to collect aerosol passing through the sensing zone on a filter, thus simplifying calibration. Zero offset checks are also recommended before use by placing the photometer in a clean environment; deposits on the optics and surfaces of the sensing zone can lead to a change in the instrument calibration. Calibration accuracy will further depend on the uniformity of the aerosol characteristics over the sample collection interval.
25.4.2 Tapered Element Oscillating Microbalance
The theory of the Tapered Element Oscillating Microbalance (TEOM, R&P) is summarized in Chapter 12. Despite its currently limited application to the mining industry, this technology offers a notable advantage of direct, near-realtime measurement of dust mass in the field. Since dust exposure standards are based on dust mass, this attribute of the TEOM is significant. Interest in the development of a prototype TEOM personal dust monitor began 25 years ago (Patashnick and Rupprecht 1983) as a device configured for strictly an end-of-shift measurement. It was not a real-time monitor, but used the oscillating microbalance principle to "weigh" the collection filter before and after dust sampling. The Bureau of Mines (BOM) evaluated this prototype system in the laboratory for end-of-shift applications (Williams and Vinson 1986). The effective standard deviation of repeated measurements was 1.6 fLg. Tests at controlled temperature and humidity showed less than 20 fLg of drift during an 8-h shift.
These early attempts to construct a person-wearable form of the TEOM required a substantial mass in the base of the tapered element to dampen the vibrations; this reduced the concepts "wearability." A proprietary development by R&P solved the need for a substantial base mass by electronically dampening the base vibration and enabling development of a person-wearable TEOM-based personal dust sampler. The PDM 3600 dust sampler for miners is now available from TFS (Volkwein et al. 2004, 2006).
25.4.3 Other Direct-Reading Instruments and Methods
While mass-based criteria are dominant for workplace aerosol measurements, there is growing recognition that other metrics may be more appropriate for nanometer-sized particulates such as surface area or number count. Recent developments in condensation particle counter (CPC) technology have led to a commercially available portable device with logging capabilities, suitable for semi-quantitative particle number measurements. The Model 3007 (TSl) is designed to provide near-instantaneous measurements of particle concentration between 10 nm and approximately 1000 nm. Although it is primarily aimed at investigating aerosol number concentration levels and variations, and tracking contamination sources in indoor environments, it is also being applied to measuring real-time particle number concentration measurements in the workplace. Other metrics under consideration include measurement of particulate surface area (Litton 2002; Ku and Maynard 2005; Maynard and Aitken 2007) or specific surface area equivalent dose (Oberdorster 2001) as used in the Model 3550, TSI N anoparticle Surface Area Monitor (Shin et al. 2007; Asbach et al. 2009).

-25.5 PARTICLE SIZE MEASUREMENT
Full characterization of the size distribution of an aerosol may be carried out during non-routine investigations using a range of available methods described in previous chapters (see Chapters 8, 11, and 13 to 17). Although many instrument types have been used in the workplace (Mark et al. 1984), cascade impactors (Chapter 8) are often the instrument of choice, giving an indication of the mass-weighted size distribution of an aerosol. Impactors are generally capable of giving the size distribution of an aerosol between around O.I-/-lm and 15-/-lm aerodynamic diameter and above. For area sampling, cascade impactors such as the Thermo Scientific Andersen impactor (TFS) and the Multi-Orifice Uniform Deposit Impactor (MOUDI; MSP) have found relatively widespread use in the workplace. The Andersen consists of eight multi-orifice stages with cutpoints between 10 /-lm and OA/-lm when operated at 4.72 x 10⁻⁴ m3 Is [28.3 L/min]. Collection is usually onto aluminum foils, although other substrates are available. The use of multi-orifices in the Andersen impactor allows deposits to be distributed with relative evenness onto substrates. This is taken further within the MOUDI, where many orifices per stage, together with rotating substrates, lead to uniform deposits. The MOUDI is available in an 8-stage or 10-stage version, and is capable of making aerosol size distribution measurements down to 0.056 /-lm at 5 x 10⁻⁴ m3 Is [30 L/min].
Aerosol size distributions within the breathing zone are generally of greater relevance to health than area samples, and small cascade-sty Ie impactors have been developed to enable personal aerosol size distribution measurements to be made. The Marple personal cascade impactor (TFS) (Rub ow et al. 1987) is configurable with up to eight stages, and will provide information on particle size distribution down to 0.5/-lm at a flow rate of 3.33 x 10⁻⁵ m3 Is [2 LI min]. The Personal Inhalable Dust Spectrometer (PIDS) is similar in concept to the Marple impactor, although the slot-shaped impactor jets of the Marple device are replaced by circular jets (Gibson et al. 1987). The PIDS is not currently commercially available. Cutpoints in the 8 stages of the PIDS range from 0.9 /-lm to 19 /-lm at 3.33 x 10⁻⁵ m3 Is [2 L/min]. The Sioutas personal cascade impactor (SKC) is a more recent development that provides 50% cutpoints at 2.5 /-lm, 1.0 /-lm, 0.50 /-lm, and 0.25 /-lm, giving a versatile device capable of measuring exposure against a range of sampling conventions (Misra et al. 2002). In addition, a newer MiniMOUDI™ (MSP) impactor offers a person-wearable instrument with size data down to O.OI/-lm.
Cascade impactors are of limited use for measuring aerosol size distributions to the upper limit of the inhalable convention (lOO-/-lm aerodynamic diameter), due to the relatively low cutpoint of the upper stage in most cases. Extrapolation of measured size distributions above this cutpoint is dependent on assumptions about the sampled aerosol
25.5 PARTICLE SIZE MEASUREMENT 581
and the aspiration efficiency of the device, and is generally not reliable. However the PIDS was designed with an inlet designed to follow the inhalable convention (Gibson et -al. 1987). It may be assumed that summing all deposits within the PIDS impactor gives a measure of the inhalable aerosol mass, and subsequent analysis of the deposits gives the size distribution as a function of the inhalable aerosol. Such an approach is advantageous to industrial hygiene measurements, where ultimately measurements need to be related to the mass of particles inhaled.
In cases where the specific health-related fractions of the aerosol are of more concern than a detailed analysis of particle size distribution, a number of samplers allow simultaneous measurement of all three fractions. The 10M personal multi-fraction sampler uses aerosol separation within polyurethane foams to achieve this (Vincent et al. 1993; Kenny et al. 1999b). Aerosol is sampled through a 15-mm diameter inhalable inlet at 3.33 x 10⁻⁵ m3 Is [2 L/min]. In the original concept, two polyurethane foam selectors of different grades placed in series separate the thoracic and respirable subfractions. The sampler enables the inhalable fraction to be measured by weighing deposits in both foams and the backup filter. The combined deposits on the filter and adjacent foam give the thoracic fraction, and the filter alone gives the respirable aerosol fraction. However, a version with thoracic foam is currently unavailable. An alternative approach is used by the Personal Spectrometer (PERSPEC; Prodi et al. 1988, 1989). The inhalable aerosol fraction is introduced to a highly divergent flow of clean air, and deposited onto a 47-mm filter. Deposition position is dependent on particle size, thus by weighing the complete filter the inhalable fraction can be determined, or by weighing specific areas of the filter (after cutting them out) different subfractions can be measured (Kenny and Bradley 1994). The Respicon sampler (TSl) achieves separation of the three aerosol size fractions using a series of virtual impactors (Koch et al. 1998, 2002; Rando et al. 2005). A modified version has been developed (Respicon TM , HUN) that allows real-time monitoring of each fraction using light scattering (Koch et al. 1998). A very recent development is a novel coarse particle sampler that incorporates diffusive sampling of ultrafine or nano-scale particulate (Gorbunov et al. 2009).
25.5.1 Sampling Strategy
Workplace aerosol measurements fall broadly into personal exposure assessment or engineering evaluation of controls. While general measurement requirements may seem similar, specific strategies should be tailored to the needs of the sampling.
25.5.1.1 Personal Monitoring While "static" or "area" sampling with fixed-point samplers is still used in many situations, it is now widely preferred that representative aerosol

582 WORKPLACE AEROSOL MEASUREMENT
sampling to monitor personal exposure should be carried out in the breathing zone-frequently defined as a region of the body not more than 0.3 m from the mouth and nose (Vincent 1995). Breathing zone measurements give a better representation of worker exposure. However, Vincent notes that placement of sampling devices in this region does not guarantee representative sampling, and large variations in sampled aerosol concentration can be seen across the front of the body, depending on worker orientation, placement of the aerosol source, and local air movements (Raynor et al. 1975; Vinson et al. 2007). A novel approach to sampling is to place a small device at the end of a personal "handsfree" microphone headset so that it is located much more centrally within the breathing zone (Liden and Sourakka 2009).
In mining, for example, personal exposure monitoring is preferable to area monitoring (Leidel et al. 1977). Dust concentrations have been shown to change dramatically over times of a few seconds and distances of just 0.6 m in underground coal mines (Kost and Saltsman 1977). Therefore, to meaningfully approximate a worker's dust exposure, personal monitoring is the preferred strategy (Kissell and Sacks 2002).
As a matter of convention, personal exposure measurements for chronic hazards are usually taken for the duration of a single work shift. An 8-h Time Weighted Average (TWA) mass concentration (cm ) relates to the process whereby exposure occurring within a 24-h period is treated as being equivalent to a single uniform exposure over 8 h. A TWA mass concentration can be determined from a single full-shift sample, or it can be calculated from a series of consecutive samples (Leidel et al. 1977). Where sampling gaps occur over a shift, exposures during these periods should be estimated from adjacent measurements, or from additional information (see Example 25-1). The TWA for a given time period (e.g., 8 h or 15 min for a Short Term Exposure Limit (STEL)) is calculated by:
n
LCmi x fi i=l
cm=--T--n
L fi = full shift duration (Eq. 25-4) i=l
where T is the given reference period (in minutes), fi is the duration of sample i in minutes and Cmi is the mass concentration of sample i.
EXAMPLE 25-1
Calculation of an 8-h TWA exposure. Three consecutive air samples for lead are collected at 3.3 x 10⁻⁵ m3/s [2 L/min] onto filters in the breathing zone of a worker in a brass foundry, with the results shown in Table 25-3.
The shift started at 08:00, and finished at 18:00. Breaks were taken between 09:30 and 10:00, 12:00 and 12:30, and 15:00 and 15:30. The work pattern was split into different tasks in the morning and the afternoon. Using equation 25-4, calculate the 8-h TWA exposure level over the total duration of the shift (600 min).
The assumption is made that during breaks, exposure is zero. During the afternoon period where no sampling was carried out, it is assumed that exposure is similar to that measured by Sample 3. Table 25-4 therefore gives a complete account of the day's exposure.
The 8-h TWA mass concentration is therefore given as
_ [(111 x 90) + (0 x 30) + (104 x 120) + (0 x 30) em - 8 x 60
+(17 x 150) + (0 x 30) + (17 x 150)] x 8 X 60
= 57 f-Lg/m3
using Equation 25-4.
For purposes of determination of compliance with occupational exposure limits, it is generally desirable to sample the workers assumed to be at maximum risk. Where the maximum-risk employees cannot be ascertained; employees should be selected at random. Leidel et al. (1977) recommend calculating the 95% one-sided lower confidence limit (LCL) and the 95% one-sided upper confidence limit (VCL). These are calculated as follows:
LCL(95%) = X - fa. x CVT
VCL(95%) = X + fa. x CVT (Eq. 25-5)
where fa. = 1.645 when a = 0.95, CVT is the coefficient of variation for the sampling/analytical method and OEL is the exposure limit. If LCL and X are above unity, then the exposure is classified as noncompliant. If VCL and X are
TABLE 25-3 Example Gravimetric Sample Data for a Worker in a Brass Factory
Flow Rate Sample Sample Mass Mass Time Time (10-5 m3/s Duration Volume Collected Concentration
Sample On Off [L/min]) (min) (L) (ILg) (f-Lg/m3)
#1 08:00 09:30 3.3 [2] 90 20 #2 10:00 12:00 3.3 [2] 120 25 #3 12:30 15:00 3.3 [2] 150 5

25.6 CURRENT TRENDS 583
TABLE 25-4 Complete Account of a Worker's Exposure to Lead in a Brass Factory (from Table 25-3)
Flow Rate Time Time (10-5 m3/s
Sample On Off [L/minD
#1 08:00 09:30 3.3 [2] #la (Break) 09:30 10:00 #2 10:00 12:00 3.3 [2] #2a (Break) 12:00 12:30 #3 12:30 15:00 3.3 [2] #3a (Break) 15:00 15:30 #4 (Est. from #3) 15:30 18:00
Total
below unity, then the exposure is classified as compliant. Finally, if unity lies between LCL and X' or between UCL and X' the exposure is classified as possible overexposure.
25.5.1.2 Evaluation of Workplace Controls Use of personal compliance type sampling results to judge the effectiveness of a control intervention may be misleading (Kissell 2003). Area sampling may be most appropriate for characterization of a workplace aerosol or for the evaluation of an engineering control. The chief advantage of area sampling is the elimination of the human variable in interpretation of the results. Other benefits include the use of a larger variety of instruments, and shorter sampling time periods.
Walk-through evaluations using real-time monitors are used to obtain an overview of environment and to target specific areas, operations, or personnel for monitoring. More detailed strategy should be used to measure or verify the effectiveness. This strategy should account for variables such as aerosol generation rate (production), transport, dilution, sampler location, and other factors (Kissell 2003). Sound statistical design and error analysis should also be a part of the evaluation (Robson et al. 2001).
25.6 CURRENT TRENDS
25.6.1 Diesel Particulate in the Workplace
In 1988, NIOSH recommended that whole diesel exhaust be regarded as a potential occupational carcinogen and that reductions in workplace exposure would reduce cancer risks (NIOSH 1988). Exposure to elevated concentrations of diesel exhaust has also been linked to health effects such as eye and nose irritation, headaches, nausea, and asthma (Kahn 1988; Wade and Newman 1993). Considerable debate has recently taken place regarding what should be the appropriate metric for measurement of diesel particulate matter (DPM) in the workplace.
In the mining workplaces, MSHA has chosen to regulate engine emissions in coal mines and to set a limit on ambient
Sample Sample Mass Mass Duration Volume Collected Concentration
(min) (L) (/-Lg) (/-Lg/m3)
90 180 20 111 30 0 0
120 240 25 104 30 0 0
150 300 5 17 30 0 0
150 5 (est.) 17
600 75
particulate carbon levels in all other mines (Stephenson 2006). The OSHA has no workplace ambient occupational limits for diesel particulate matter in general industry. The US Environmental Protection Agency (US EPA) , however, regulates diesel engine emissions and includes diesel particulate as part of their particulate matter (PM) standards.
Personal exposure to DPM in the workplace may be sampled using a personal sampling pump with an impactorclassified filter sample followed by NIOSH method 5040 analysis of the carbon components of the filter (Noll 2005). This provides a TWA measurement of the total, organic, and elemental carbon present on the filter.
The measurement challenge, from the point of view of health effects and regulation and control of particulate matter, lies in the ability to distinguish between particulates generated by the process and ambient diesel particulates. This becomes especially problematic if the process particulates contain carbon. The aerosol scientist must also deal with the changing particulate size and particulate speciation, which change with changes in control technologies and fuel blends.
The development of handheld oscillating microbalance systems for respirable dust monitoring in mining has been successful. While inlet and classification of inhalable and thoracic fractions will require special consideration using this technology, there is some optimism that the handheld oscillating microbalance may be capable of sensing the submicrometer DPM fraction of mine aerosols (Wu and Gillies 2008). This work involved placing a 0.8-micrometer cutpoint impactor on the inlet of a monitor and measuring only the mass of the submicrometer aerosol. When continuous sideby-side measurements of respirable and submicrometer aerosol were conducted, source apportionment between combustion and commutation aerosols was possible in near real time.
25.6.2 Toxic Materials
Workplace assessment of toxic aerosols such as beryllium, silica, and radioactive aerosols, is problematic when the toxic limit values approach the level of detection of the

584 WORKPLACE AEROSOL MEASUREMENT
substance. Chapter 28 provides specific information on monitoring radon and radioactive aerosols. The general solution of sampling a larger volume of air and concentrating the sample to provide sufficient quantity for quantitative analysis is limited in personal sampling because of equipment size constraints. Misra et al. (2002) describes the use of a 1.5 x 10⁻⁴
m3/s [9 L/min] flow-rate pump and impactor manufactured by SKC to enable collection of larger samples from a person-wearable device. Maynard (1999) describes the use of GK 2.69 (BG/) respirable cyclone using a 7 x 10⁻⁵ m3/s [4.2 L/min] flowrate which also enables larger samples for analysis. A 1.67 x 10⁻⁴ m3/s [10 L/min] cyclone is also available (BIA 2002). Such portable, higher flow-rate samplers improve the limits of detection for high toxicity aerosols. Alternatively, more sensitive analytical techniques are required to assess personal exposure of toxic materials in the workplace.
25.6.3 Engineered Nanomaterials
Toxicological information on responses to inhaled nanometer-scale low solubility particles is challenging the applicability of current sampling conventions and philosophies (Maynard and Aitken 2007). Recent toxicology on low toxicity insoluble materials such as titanium dioxide has indicated that a more appropriate dose metric for depositing in the alveolar region may be particle number, or surface area (see Chapter 38 for more details; Maynard and Kuempel 2005; Oberdorster et al. 2005, 2007). These studies appear to support some epidemiology investigations of the general population, indicating correlation between inhalation of fine particles and health effects (Dockery et al. 1993; Wichmann and Peters 2000; Pekkanen and Kulmala 2004; Delfino et al. 2005; Penttinen et al. 2006). The extent to which such findings are applicable to exposure within the workplace is not apparent at present, although there is increased concern that new nanoscale materials-specifically those associated with the emerging field of nanotechnology-could present new and unusual occupational hygiene risks (Maynard 2007). As yet, few data are available on occupational exposures to engineered nanomaterials. There is evidence that materials such as carbon nanotubes and carbon black are not readily aerosolized (Kuhlbusch et al. 2004; Maynard et al. 2004; Bello et aL 2009), although these data are not generalizeable, and may not apply to all situations where these materials are handled. Based on research in progress, a number of publications are anticipated over the next few years that provide a clearer picture of conditions under which exposure to airborne engineered nanomaterials might occur.
Occupational health agencies such as NIOSH in the United States have begun to formulate guidelines for the safe handling of engineered nanomaterials (NIOSH 2006). Similar guidelines are becoming available from industrybased groups (e.g., the DuPont/Environmental Defense
Fund Nano Risk Framework; Dupont 2007) and from consensus standards bodies (ISO 2006; ASTM 2007; ISO 2008). These begin to outline the challenges and possible solutions associated with measuring and controlling exposure to airborne engineered nanomaterials in the workplace.
25.6.4 Sampling Aerosol and Vapor
In some cases it is necessary to assess exposures to aerosol and vapor simultaneously. This situation can occur when a volatile liquid or a solid with significant vapor pressure is sprayed, or when a vapor can give rise to a condensation aerosol, or when a volatile substance is absorbed on other particulates. The most typical examples are the isocyanates used in spray-on finishes, or toluene di-isocyanate, which, while volatile, can be found attached to polyurethane aerosol in foam manufacture. In this particular case, it is important not only to collect both aerosol and vapor fractions simultaneously, but to also derivatize the isocyanate group quickly so that further reaction does not take place. Thus, an impinger filled with liquid reagent followed by a filter also coated with reagent is the standard sampling apparatus. Less reactive aerosol-vapor combinations can be sampled using a diffusion denuder, followed by a filter, although these are not common as personal samplers because of their generally large size. An improvement may be a novel design of dichotomous sampler (Kim and Raynor 2009).
25.6.5 Penetration versus Deposition
While penetration of particles to the airways system is a measure of exposure, it is not a good measure of dose for certain particle sizes. This is because of a deposition minimum that occurs at around 0.3 /-Lm AED at the intersection of the two major mechanisms of particle capture: diffusion for small particles and interception and impaction for larger particles. As long as mass is the preferred metric, then this deposition minimum likely has little effect on sampling to meet the inhalable convention, because the much larger particles are associated with very much larger masses. However, for smaller particles, the deposition minimum becomes important. Vincent (2005) discusses the impact of accounting for deposition on the current thoracic and respirable sampling conventions and how this would require the development of novel sampling techniques, and also discusses the potential impact on any proposed ultrafine or nanoparticle sampling convention.
25.7 LIST OF SYMBOLS
Sf inhalable penetration fraction
ST thoracic penetration fraction
SR respirable penetration fraction

c
d VCL
LCL
r 2: 1]
X
ae
R
T
I
25.8
concentration
diameter
upper confidence limit
lower confidence limit
mass median aerodynamic diameter
geometric standard deviation
efficiency
ratio of the concentration mean divided by the occupational exposure limit
aerodynamic diameter
respirable
thoracic
inhalable
REFERENCES
ACGIH. 1968. Threshold Limit Values of Airborne Contaminants. Cincinnati, OH: American Conference of Government Industrial Hygienists.
ACGIH. 1995. Air Sampling Instruments, 8 ed. Cincinnati, OH: American Conference of Government Industrial Hygienists.
ACGIH. 1998. Particle Size-Selective Sampling for Particulate Air Contaminants. Cincinnati, OH: American Conference of Government Industrial Hygienists.
Aitken, R. J., and R. Donaldson. 1996. Large Particle and Wall Deposition Effects in Inhalable Samplers. Health and Safety Executive, UK: Report Number 117/1996.
Aitken, A. J., P. E. J. Baldwin, G. C. Beaumont, L. C. Kenny and A. D. Maynard. 1999. Aerosol inhalabi1ity in low air movement environments. J. Aerosol Sci. 30:613-626.
Aizenberg, V., S. A. Grinshpun, K. Willeke, J. Smith, and P. A. Baron. 2000. Performance characteristics of the button personal inhalable sampler. Am. Ind. Hyg. Assoc. J. 61:398-404.
Aizenberg, V., K. Choe, S. A. Grinshpun, K. Willeke, and P. A. Baron. 2001. Evaluation of personal air samplers challenged with large particles. J. Aerosol Sci. 32:779-793.
Asbach, c., H. Fissan, B. Stahlmecke, T. A. 1. Kuhlbusch, and D. Y. H. Pui. 2009. Conceptual limitations and extensions of lung-deposited Nanoparticle Surface Area Monitor (NSAM). J. Nanopart. Res. 11:101-109.
ASTM International. 2007. Standard Guide For Handling Unbound Engineered Nanoscale Particles In Occupational Settings, Nanotechnologies-Part 2: Guide To Safe Handling And Disposal Of Manufactured Nanomaterials, BSI (2007). West Conshocken, PA: ASTM International.
Awan, S., and G. Burgess. 1996. The effect of storage, handling and transport traumas on filter-mounted dusts. Ann. Occup. Hyg. 40:525-530.
Baldwin, P. E. J., and A. D. Maynard. 1998. A survey of wind speeds in indoor workplaces. Ann. Occup. Hyg. 42:303-313.
25.8 REFERENCES 585
Baron, P. A. 1994. Direct-reading instruments for aerosols. A review. Analyst 119:35-40.
Baron, P. A., and G. J. Deye. 1990. Electrostatic effects in asbestos sampling I: Experimental measurements. Am. Ind. Hyg. Assoc. J. 51:51-62.
Baron, P. A., A. Khanina, A. B. Martinez, and S. A. Grinshpun. 2002. Investigation of filter bypass leakage and a test for aerosol sampling cassettes. Aerosol Sci. Techno!. 36:857 -865.
Bartley, D. L., and G. M. Breuer. 1982. Analysis and optimisation of the performance of the 10 mm cyclone. Am. Ind. Hyg. Assoc. J. 43:520-528.
Bartley, D. L., G. M. Breuer, and P. A. Baron. 1984. Pump fluctuations and their effect on cyclone performance. Am. Ind. Hyg. Assoc. J. 45:10-18.
Bartley, D. L., C. C. Chen, R. Song, and T. J. Fischbach. 1994. Respirable aerosol sampler performance testing. Am. Ind. Hyg. Assoc. J. 55:1036-1046.
Bedford, T., and C. Warner. 1943. Physical studies of the dust hazard and thermal environment in certain coalmines. Chronic Pulmonary Disease in South Wales Coalminers. II. Environmental Studies. London: British Medical Research Council, HMSO. Special report series no. 244: 1-78.
Blake, T., V. Castranova, D. Schwegler-Berry, P. Baron, G. J. Deye, C. H. Li, and W. Jones. 1998. Effect of fiber length on glass microfiber cytotoxicity. J. Toxico!. Environ. Health A 54: 243-259.
Bello, D., B. L. Wardle, N. Yamamoto, R. G. deVilloria, E. J. Garcia, A. J. Hart, K. Ahn, M. J. Ellenbecker, and M. Hallock. 2009. Exposure to nanoscale particles and fibers during machining of hybrid advanced composites containing carbon nanotubes. J. Nanopart. Res. 11:231-249.
BIA (Berufsgenossenschaftliches Institut fur Arbeitsschutz). 2002. Geriite zur Probenahme der alveolengiingige Staubfraktion (A-Staub), BIA No. 6068, BIA-Arbeitsmappe Messung von Gefahrstoffen, Bielefeld: Erich Schmidt Verlag.
BMRC. 1952. Recommendations of the BMRC panels relating to selective sampling. From the minutes of a joint meeting of Panels 1, 2 and 3, held on March 4th. 1952. British Medical Research Council.
Brown, R. c., M. A. Hemingway, D. Wake, and J. Thompson. 1995. Field trials of an electret-based passive dust sampler in metalprocessing industries. Ann. Occup. Hyg. 39:603-622.
Brown, R. c., D. Wake, A. Thorpe, M. A. Hemingway, and M. W. Roff. 1994. Preliminary assessment of a device for passive sampling of airborne particulate. Ann. Occup. Hyg. 38:303.
Burgess, W. A., L. Silverman, and F. Stein. 1961. A new technique for evaluating respirator performance. Am. Ind. Hyg. Assoc. J. 22:422-429.
CEN. 1998. Workplace atmospheres: assessment of performance of instruments for measurement of airborne particle concentrations. Comite Europeen de Normalisation: CEN prEN 13205.
Chen, c.-c., c.-Y. Lai, T.-S. Shih, and W.-Y. Yeh. 1998. Development of respirable aerosol samplers using porous foam. Am. Ind. Hyg. Assoc. J. 59:766-773.
586 WORKPLACE AEROSOL MEASUREMENT
Chen, c.-c., S.-H. Huang, W. Lin, T. Shih, and F. Jeng. 1999. The virtual cyclone as a personal respirable sampler. Aerosol Sci. Technol. 31:422-432.
Courbon, P., R. Wrober, and J.-F. Fabries. 1988. A new individual respirable dust sampler: The CIP-10. Ann. Occup. Hyg. 32:129-143.
Delfino, R. J., C. Sioutas, and S. Malik. 2005. Potential role of ultrafine particles in associations between airborne particle mass and cardiovascular health. Environ. Health Perspect. 113(8):934-946.
Demange, M., P. Gomer, J.-M. E1cabeche, and R. Wrobel. 2002. Field comparison of 37mm closed-face cassettes and 10M samplers. Appl. Occup. Environ. Hyg. 17:200-208.
Dobroski, H., D. P. Tuchman, and R. P. Vinson. 1995. Differential pressure as a means of estimating respirable dust mass on collection filters. Presented at American Industrial Hygiene Association Conference and Exposition, May 20-26: Kansas City, Missouri.
Dockery, D. W., C. A. Pope, X. Xu, J. D. Spengler, J. H. Ware, M. E. Fay, B. G. Ferris, and F. E. Speizer. 1993. An association between air pollution and mortality in six U.S. cities. N. Eng!. J. Med. 329:1753-1759.
Donaldson, K., X. Y. Li, and W. MacNee. 1998. Ultrafine (nanometre) particle mediated lung injury. J. Aerosol Sci. 30:553-560.
Dunmore, J. H., R. J. Hamilton, and D. S. G. Smith. 1964. An instrument for the sampling of respirable dust for subsequent gravimetric assessment. J. Sci. Instrum. 41:669-672.
DuPont and Environmental Defense. 2007. Nano Risk Framework. DuPont and Environmental Defense, Washington DC.
Fabries, J. F., P. Gomer, E. Kauffer, R. Wrobel, and J. C. Vigneron. 1998. Personal thoracic CIPlO-T sampler and its static version CATHIA-T. Ann. Occup. Hyg. 42:453-465.
Fissan, H., A Trampe, S. Neunman, C. Y. Pui, and W. G. Shin. 2007. Rationale and principle of an instrument measuring lung deposition area. Journal of Nanoparticle Research 9:53-59.
Gibson, H., J. H. Vincent, and D. Mark. 1987. A personal inspirable aerosol spectrometer for applications in occupational hygiene research. Ann. Occup. Hyg. 31(4A):463-479.
Gorbunov, B., N. D. Priest, R. B. Muir, P. R. Jackson, and H. Gnewuch. 2009. A novel size-selective airborne particle size fractionating instrument for health risk evaluation. Ann. Occup. Hyg. 53:225-237.
Gomer, P. R. Wrobel, V. Micka, V. Skoda, J. Denis, and J.-F. Fabries. 2001. Study of fifteen respirable aerosol samplers used in occupational hygiene. Ann Occup. Hyg. 45:43-54.
Gray, M. 1, J. Unwin, P. T. Walsh, and N. Worsell. 1992. Factors influencing personal exposure to gas and dust in workplace air-Application of a visualization technique. Safety Science 15:273-282.
Green, H. L., and H. H. Watson. 1935. Physical methods for the estimation of the dust hazard in industry. Medical Research Council Special Report Series 119. London: British Medical Research Council.
Greenburg, L., and G. W. Smith. 1922. A new instrument for sampling aerial dust. U.S. Bur. Mines Rept. Invest. 2392:1-3.
Gressel, M. G., W. A Heitbrink, and P. A Jensen. 1993. Video exposure monitoring-A means of studying sources of occupational air contaminant exposure, Part I-Video exposure monitoring techniques. Appl. Occup. Environ. Hyg. 8:334-338.
Hamilton, R. J. 1956. A portable instrument for respirable dust sampling. J. Sci. Instrum. 33:395-399.
Han, D.-H., K. Willeke, and C. E. Colton. 1997. Quantitative fit testing techniques and regulations for tight-fitting respirators: Current methods measuring aerosol or air leakage, and new developments. Am. Ind. Hyg. Assoc. J. 58:219-228.
Harper, M. 2006. A review of workplace aerosol sampling procedures and their relevance to the assessment of beryllium exposures. J. Environ. Monit. 8:598-604.
Harper, M., and B. S. Muller. 2002. An evaluation of total and inhalable samplers for the collection of wood dust in three wood products industries. J. Environ. Monit. 4:648-656.
Harper, M., M. Z. Akbar, and M. E. Andrew. 2004. Comparison of wood-dust aerosol size-distributions collected by air samplers. J. Environ. Monit. 6:18-22.
Harper, M., arid M. Demange. 2007. Concerning sampler wall deposits in the chemical analysis of airborne metals. J. Occup. Environ. Hyg. 4:D81-D86.
Harper, M., B. Pacolay, B. Hintz, D. L. Bartley, J. E. Slaven, and M. E. Andrew. 2007. Portable XRF analysis of occupational air filter samples from different workplaces using different samplers: final results, summary and conclusions. J. Environ. Monit.9:1263-1270.
Hauck, B. c., S. A. Grinshpun, A Reponen, T. Reponen, K. Willeke, and R. L. Bornschein. 1997. Field testing of new aerosol sampling method with a porous curved surface as inlet. Am. Ind. Hyg. Assoc. J. 58:713-719.
Heitbrink, W. A, M. G. Gressel, T. C. Cooper, T. Fischbach, D. M. O'Brien, and P. A. Jensen. 1993. Video exposure monitoring-A means of studying sources of occupational air contaminant exposure, Part 2-Data interpretation. App!. Occup. Environ. Hyg. 8:339-343.
Hewson, G. S. 1996. Estimates of silica exposure among metaliferous miners in Southern Australia. Appl. Occup. Environ. Hyg. 11:868-877.
Health and Safety Executive. 1997. Methodsfor the Determination of Hazardous Substances 14/3 General Methods for the Gravimetric Determination of Respirable and Total Inhalable Dust. London: HSE Books.
Health and Safety Executive. 2006. Methods for the Determination of Hazardous Substances 99 Metals in Air by ICP-AES. London: HSEBooks.
HSE. 1999. EH40/ 99 Occupational Exposure Limits 1999. London: HSEBooks.
Hyatt, E. c., J. A Pritchard, and C. P. Richards. 1972. Respirator efficiency measurement using quantitative DOP man tests. Ann. Ind. Hyg. Assoc. J. 33:635-643.
ICRP. 1995. Publication 66: Human respiratory tract model for radiological protection 66. Annals of the ICRP 24:1-3.

ISO. 1995. Air Quality-Particle Size Fraction Definitions for Health-Related Sampling, ISO Standard 7708. Geneva: International Standards Organisation.
ISO. 2006. Workplace Atmospheres-Ultrafine, Nanoparticle and Nano-Structured Aerosols-Inhalation Exposure Characterization and Assessment, ISOjTR 27628. Geneva: International Standards Organization.
ISO. 2008. Nanotechnologies-Health and Safety "Practices in Occupational Settings Relevan to Nanotechnologies. Geneva: International Standards Organization.
John, W., and N. Kreisberg. 1999. Calibration and testing of samplers with dry, poly disperse latex. Aerosol Sci. Technol. 31:221-225.
Kahn, G., P. Orris, andJ. Weeks. 1988. Acute overexposure to diesel exhaust: report of 13 cases. Am. J. Ind. Med. 13:405.
Kalatoor, S., S. A Grinshpun, K. Willeke, and P. A Baron. 1995. New aerosol sampler with low wind sensitivity and good filter collection uniformity. Atmos. Environ. 29: 1105 -1112.
Keeton, S. C. 1979. Carbon particulate measurements in a diesel engine. Sandia Laboratories Publication SAND 79-8210. Albuquerque, NM: Sandia Laboratories.
Kenny, L. C., R. Aitken, C. Chalmers, J. F. Fabries, E. GonzalezFernandez, H. Kromhout, G. Liden, D. Mark, G. Riediger, and V. Prodi. 1997. A collaborative European study of personal inhalable aerosol sampler performance. Ann. Occup. Hyg. 41:135-153.
Kenny, L. c., R. J. Aitken, P. E. l Baldwin, G. Beaumont, and A D. Maynard. 1999a. The sampling efficiency of personal inhalable samplers in low air movement environments. J.
Aerosol Sci. 30:627 -638.
Kenny, L. c., A Bowry, B. Crook, and J. D. Stancliffe. 1999b. Field testing of a personal size-selective bioaerosol sampler. Ann. Occup. Hyg. 43:393-404.
Kenny, L. c., and D. R. Bradley. 1994. Optimization ofthe Perspec multifraction aerosol sampler to new sampling conventions. Ann. Occup. Hyg. 38:23-35.
Kenny, L. c., and R. A Gussman. 1997. Characterization and modelling of a family of cyclone aerosol preseparators. J. Aerosol Sci. 28:677-688.
Kim, S. W., and P. C. Raynor. 2009. A new semivolatile aerosol dichotomous sampler. Ann. Occup. Hyg. 53:239-248.
Kissell F. N., and H. K. Sacks. 2002. Inaccuracy of area sampling for measuring the dust exposure of mining machine operators in coal mines. Mining Engineering 2:33-39.
Kissell, F. N. 2003. Handbookfor Dust Control in Mining, Centers for Disease Control and Prevention, Information Circular 9465.
Koch, W., W. Dunkhorst, and H. L6dding. 1998. RESPICON TM-3 F: A new personal measuring system for size segregated dust measurement at workplaces. Occ. Health Ind. Med. 38:161.
Koch, W., W. Dunkhorst, H. L6dding, Y. Thomassen, N. P. Skaugset, A. Nikov, and J. H. Vincent. 2002. Evaluation of the Respicon TM as a personal inhalable sampler in industrial environments. J. Environ. Monit. 4:657 -662.
Kost, J. A, and R. D. Saltsman. 1977. Evaluation of the respirable dust area sampling concept as related to the continuous miner
25.8 REFERENCES 587
operator, Report L-792. Bituminous Coal Research, Inc., Pittsburgh, P A
Ku, B. K., and A D. Maynard. 2005. Comparing aerosol surfacearea measurement of monodisperse ultrafine silver agglomerates using mobility analysis, transmission electron microscopy and diffusion charging. J. Aerosol Sci. 36(9): 1108-1124.
Kuhlbusch, T. A J., S. Neumann, and H. Fissan. 2004. Number size distribution, mass concentration, and particle composition of PM1, PM2.5, and PMlO in bag filling areas of carbon black production. J. Occup. Environ. Hyg. 1(10):660-671.
Kuusisto, P. 1983. Evaluation of the direct reading instruments for the measurement of aerosols. Am. Ind. Hyg. Assoc. J. 44:863-874.
Le Roux, W. L. 1970. Recorded Dust Conditions And Possible New Sampling Strategies In South African Gold Mines, Johannesburg International Pneumoconiosis Conference. Oxford: Oxford University Press.
Lehocky, A H., and P. L. Williams. 1996. Comparison of respirable samplers to direct-reading real-time aerosol monitors for measuring coal dust. Am. Ind. Hyg. Assoc. J. 57:1013-1018.
Leidel, N. A., K. A Busch, and J. R. Lynch. 1977. Occupational Exposure Sampling Strategy Manual, DREW (NIOSH) Publication No. 77-173, NTIS #PB 77-274752. National Institute for Occupational Safety and Health.
Li, S.-N., and D. A. Lundgren. 1999. Weighing accuracy of samples collected by 10M and CIS inhalable samplers. Am. Ind. Hyg. Assoc. J. 60:235 - 236.
Liden, G. 1993. Evaluation of the SKC personal respirable dust sampling cyclone. Appl. Occup. Environ. Hyg. 8:178-190.
Liden, G., and M. Harper. 2006. The need for an international sampling convention for inhalable dust in calm air. J. Occup. Environ. Hyg. 3:D94-DlO1.
Liden, G., and L. C. Kenny. 1992. The performance of respirable dust samplers-Sampler bias, precision and inaccuracy. Ann. Occup. Hyg. 36: 1-22.
Liden, G., and L. C. Kenny. 1993. Optimisation ofthe performance of existing respirable dust samplers. Appl. Occup. Environ. Hyg. 8:386-391.
Liden, G., and L. C. Kenny. 1994. Errors in inhalable dust sampling for particles exceeding 100 f,Lm. Ann. Occup. Hyg. 38:373-384.
Liden, G., B. Melin, A. Lidblom, K. Lindberg, and l-O. Noren. 2000a. Personal sampling in parallel with openface filter cassettes and 10M samplers for inhalable dust-implications for exposure limits. Appl. Occup. Environ. Hyg. 15:263-276.
Liden, G., L. Juringe, and A. Gudmundsson. 2000b. Workplace validation of a laboratory evaluation test of samplers for inhalable and "total" dust. J. Aerosol Sci. 31:199-219.
Liden, G., and G. Bergman. 2001. Weighing imprecision and handleability of the sampling cassettes of the 10M sampler for inhalable dust. Ann. Occup. Hyg. 45(3):241-252.
Liden, G., and J. Sourakka. 2009. A headset-mounted mini sampler for measuring exposure to welding aerosol in the breathing zone. Ann. Occup. Hyg. 53:99-116.

588 WORKPLACE AEROSOL MEASUREMENT
Linnainmaa, M., J. Laitenen, A Leskinen, O. Sippula, and P. Kalliokoski. 2008. Laboratory and field testing of sampling methods for inhalable and respirable dust. J. Occup. Environ. Hyg. 5:28-35.
Lippmann, M. 1977. Regional deposition of particles in the human respiratory tract. In Handbook of Physiology; Section IV, Environmental Physiology, D. H. K. Lee and S. Murphy (eds.). Philadelphia: Williams and Wilkins, pp. 2l3-232.
Litton, C. D. 2002. Studies of the measurement of respirable coal dusts and diesel particulate matter. Meas. Sci. Tech. 13:365-374.
Lison, D., C. Lardot, F. Huaux, G. Zanetti, and B. Fubini. 1997. Influence of particle surface area on the toxicity of insoluble manganese dioxide dusts. Arch. Toxicol. 71:725-729.
Maidment, S. C. 1998. Occupational hygiene considerations in the development of a structured approach to select chemical control strategies. Ann. Occup. Hyg. 42:391-400.
Mark, D., and J. H. Vincent. 1986. A new personal sampler for airborne total dust in workplaces. Ann. Occup. Hyg. 30:89-102.
Mark, D., J. H. Vincent, H. Gibson, R. J. Aitken, and G. Lynch. 1984. The development of an inhalable dust spectrometer. Ann. Occup. Hyg. 28:125-143.
Mark, D., J. H. Vincent, H. Gibson, and G. Lynch. 1985. A new static sampler for airborne total dust in workplaces. Am. Ind. Hyg. Assoc. J. 46:27 -l33.
Mark, D., J. H. Vincent, D. C. Stevens, and M. Marshall. 1986. Investigation of the entry characteristics of dust samplers of the type used in the British nuclear industry. Atmos. Environ. 20:2389 - 2396.
Marple, V. A, and K. L. Rubow. 1981. Instruments and Techniques for Dynamic Particle Size Measurement of Coal Dust, U.S. Bureau of Mines OFR 173-83; NTIS PB 83-262360.
Marple, V. A., and K. L. Rubow. 1984. Respirable Dust Measurement, U.S. Bureau of Mines Open File Report (OPR) 173-83; National Technical Information Service (NTIS) PB 83-262360.
Maynard, A D. 1999. Measurement of aerosol penetration through six personal thoracic samplers under calm air conditions. J.
Aerosol Sci. 30: 1227 -1242.
Maynard, A D. 2007. Nanotechnology: The next big thing, or much ado about nothing? Ann. Occup. Hyg. 51:1-12.
Maynard, A. D., and L. C. Kenny. 1995. Performance assessment of three personal cyclone models, using an aerodynamic particle sizer. J. Aerosol Sci. 26:671-684.
Maynard, A D. 2000. A simple model of axial flow cyclone performance under laminar flow conditions. J. Aerosol Sci. 31:151-167.
Maynard, A. D., and R. J. Aitken. 2007. Assessing exposure to airborne nanomaterials: Current abilities and future requirements. Nanotoxicology 1 (1 ):26-41.
Maynard, A D., and P. A Baron. 2004. Aerosols in the industrial environment. In Aerosols Handbook. Measurement, Dosimetry and Health Effects. L. S. Ruzer and N. H. Harley (eds.). Boca Raton: CRC Press, pp. 225 - 264.
Maynard, A D., and E. D. Kuempel. 2005. Airborne nanostructured particles and occupational health. J. Nanopart. Res. 7(6):587 -614.
Maynard, A D., R. J. Aitken, T. Butz, V. Colvin, K. Donaldson, G. Oberdorster, M. A. Philbert, J. Ryan, A Seaton, V. Stone, S. S. Tinkle, L. Tran, N. J. Walker, and D. B. Warheit. 2006. Safe handling of nanotechnology. Nature 444(16):267 -269.
Maynard, A D., P. A Baron, M. Foley, A. A Shvedova, E. R. Kisin, and V. Castranova. 2004. Exposure to carbon nanotube material: aerosol release during the handling of unrefined single walled carbon nanotube material. J. Toxicol. Environ. Health 67(1):87-107.
Mills, N. L., H. Tornqvist, M. C. Gonzalez, E. Vink, S. D. Robinson, S. Soderberg, N. A Boon, K. Donaldson, T. Sandstrom, A Blomberg, and D. E. NeWby. 2007. Ischemic and thrombotic effects of dilute diesel-exhaust inhalation in men with coronary heart disease. N. Engl. J. Med. 357(11):1075-1082.
Mine Safety and Health Administration. 2005. June 6, 2005, 30 CFR Part 57 Diesel Particulate Matter Exposure of Underground Metal and Nonmetal Miners; Final Rule. Fed. Reg. 2005, Mol 70, No. 107, p. 32868.
Misra, c., M. Singh, S. Shen, C. Sioutas, and P. M. Hall. 2002. Development and evaluation of a personal cascade impactor sampler (PCIS). J. Aerosol Sci. 33(7):1027-1047.
Morrow, P. E. 1994. Mechanisms and significance of "particle overload." In Toxic and Carcinogenic Effects of Solid Particles in the Respiratory Tract, D. L. Dungworth, J. L. Mauderly, and G. Oberdorster (eds.). Washington, DC: ILSI Press, pp. 17-25.
NIOSH. 1995. Criteria for a Recommended StandardOccupational Exposure to Respirable Coal Mine Dust, DHHS(NIOSH) Publication No. 95-107. Washington, DC: National Institute for Occupational Safety and Health.
NIOSH. 1988. Carcinogenic Effects of Exposure to Diesel Exhaust, Current Intelligence Bulletin No. 50, DHHS (NIOSH) Pub. No. 88-116, Washington, DC: U.S. Department of Health and Human Services, Public Health Service, Centers for Disease Control, National Institute for Occupational Safety and Health.
NIOSH. 2006. Approaches to Safe Nanotechnology. An Information Exchange with NIOSH. Atlanta, GA: National Institute for Occupational Safety and Health. www.cdc.gov/niosh/topics/ nanotech. Updated June 2006.
NMAM. 2003. NIOSH Manual of Analytical Methods. www.cdc. gov /niosh/nmam/pdfs/0600.pdf
Noll, J. D., R. J. Timko, L. McWilliams, P. Hall, and R. Haney. 2005. Sampling results of the improved SKC diesel particulate matter cassette. J. Environ. Health 2:29-37.
Oberdorster, G. 2001. Pulmonary effects of inhaled ultrafine particles. Int. Arch. Occup. Environ. Health 74:1-8.
Oberdorster, G., J. Ferin, and B. E. Lehnert. 1994. Correlation between particle-size, in-vivo particle persistence, and lung injury. Environ. Health Persp. 1 02(S5): 173 -179.
Oberdorster, G., V. Stone, and K. Donaldson. 2007. Toxicology of nanoparticles: A historical perspective. Nanotoxicology 1(1):2-25.
Oberdorster, G., A Maynard, K. Donaldson, V. Castranova, J. Fitzpatrick, K. Ausman, J. Carter, B. Karn, W. Kreyling, D. Lai, S. Olin, N. Monteiro-Riviere, D. Warheit, and H. Yang. 2005. Principles for characterizing the potential
human health effects from exposure to nanomaterials: elements of a screening strategy. Part Fibre Toxicol. 6(2:8), 1-3.
OSHA. 1998. Respiratory Protection Standard 29 Code of Federal Regulations (CFR) 1910.134.
Patashnick, H., and G. Rupprecht. 1983. Personal dust exposure monitor based on the tapered element oscillating microbalance. U.S. Bureau of Mines OFR 56-84; NTIS PB 84-173749.
Pekkanen, J., and M. Kulmala. 2004. Exposure assessment of ultrafine particles in epidemiologic time-series studies. Scand. J. Work Environ. Health 30:9-18.
Penttinen, P., M. Vallius, P. Tiittanen, J. Ruuskanen, and J. Pekkanen. 2006. Source-specific fine particles in urban air and respiratory function among adult asthmatics. Inhalation Toxicology 18(3):191-198.
Prodi, V., F. Belosi, A. Mularoni, and P. Lucialli. 1988. Perspec-a personal sampler with size characterization capabilities. Am. Ind. Hyg. Assoc. J. 49:75-80.
Prodi, v., C. Sala, F. Belosi, S. Agostini, G. Bettazzi, and A. Biliotti. 1989. Perspec, personal size separating sampler-Operational experience and comparison with other field devices. J. Aerosol Sci. 20:1565-1568.
Puskar, M. A., J. M. Harkins, J. D. Moomey, and L. H. Hecker. 1991. Internal wall losses of pharmaceutical dusts during closed-face, 37-mm polystyrene cassette sampling. Am. Ind. Hyg. Assoc. J. 52:280-286.
Rando, R., H. Poovey, D. Mokadam, J. Brisolara, and H. Glindmeyer. 2005. Field performance of the Respicon™ for size-selective sampling of industrial wood processing dust. J. Occup. Environ. Hyg. 2:219-226.
Raynor, G. S., E. C. Ogden, and J. V. Hayes. 1975. Spatial variation in airborne pollen concentrations. J. Allergy Clin. Immunol. 55:195-202.
Robert, K. Q. 1979. Cotton dust sampling efficiency of the vertical elutriator. Am. Ind. Hyg. Assoc. J. 40:535-545.
Robson, L. S., H. S. Shannon, L. M. Goldenhar, and A. R. Hale. 2001. Guide to Evaluation the Effectiveness of Strategies for Preventing Work Injuries: How to Show Whether a Safety Intervention Really Works, CDC, DHHS (NIOSH) publication No. 2001-119, p. 121.
Rodes, C. E., and J. W. Thornburg. 2005. Breathing zone exposure assessment. In Aerosols Handbook, L. S. Ruzer and N. H. Harley (eds.). Boca Raton, FL: CRC Press, pp. 61-74.
Roger, F., G. Lachapelle, J. F. Fabries, P. Gomer, and A. Renoux. 1998. Behaviour of the 10M aerosol sampler as a function of external wind velocity and orientation. J. Aerosol Sci. 29(Suppl. 1):SI133-S1134.
Rubow, K. L., and V. A. Marple. 1983. An instrument evaluation chamber: calibration of commercial photometers. In Aerosols in the Mining and Industrial Work Environment, vol. 3, V. A. Marple, and B. Y. H. Liu (eds.). Ann Arbor, MI: Ann Arbor Science, pp. 777 - 798.
Rubow, K. L., V. A. Marple, J. Olin, and M. A. McCawley. 1987. A personal cascade impactor: design, evaluation and calibration. Am. Ind. Hyg. Assoc. J. 48:532-538.
25.8 REFERENCES 589
Schmees, D. K., Y.-H. Wu, and J. H. Vincent. 2008. Experimental methods to determine inhalability and personal sampler performance for aerosols in ultra-low wind speed environments. J. Environ. Monit. 10:1426-1436.
Shin, W. G., D. H. Y. Pui, H. Fissan, S. Neumann, and A. Trampe. 2007. Calibration and numerical simulation of Nanoparticle Surface Area Monitor (TSI Model 3550 NSAM). J. Nanopart. Res. 9(1):61-69.
Sioutas, c., S. Kim, and M. Chang. 1999. Development and evaluation of a prototype ultrafine particle concentrator. J. Aerosol Sci. 30: 1001-10 17.
Sivulka, D. J., B. R. Conard, G. W. Hall, and J. H. Vincent. 2007. Species-specific inhalable exposures in the nickel industry: A new approach for deriving inhalation occupational exposure limits. Regu!. Toxico!. Pharmacol. 48:19-34.
Sleeth, D. K., and J. H. Vincent. 2009. Inhalability for aerosols at ultra-low wind speeds. In Proceedings of Inhaled Particles X, 23-25 September 2008, Manchester, UK. J. Phys. Conference Ser. 151. London: lOP Publishing, p. 6. doi: 101088/1742-6596/151/1/01/012062.
Smith, J. P., D. L. Bartley, and E. R. Kennedy. 1998. Laboratory investigation of the mass stability of sampling cassettes from inhalable aerosol samplers. Am. Ind. Hyg. Assoc. J.
59:582-585.
Stephenson, D. J., T. M. Spear, and M. B. Lutte. 2006. Comparison of sampling methods to measure exposure to diesel particulate matter in and underground metal mine. Mining Engineering 8:39-45.
Tsao, C. 1., T. S. Shih, and J. D. Lin. 1996. Laboratory testing of three direct reading dust monitors. am. Ind. Hyg. Assoc. J. 57:577 -563.
Unwin, J., P. T. Walsh, and N. Worsell. 1993. Visualization of personal exposure to gases and dust using fast-response monitors and video filming. Appl. Occup. Environ. Hyg. 8:348-350.
U.S. Department of Labor. 1996. Report of the Secretary of Labor's Advisory Committee on the Elimination of Pneumoconiosis Among Coal Mine Workers; recommendations 8 and 17.
van Tongeren, M. J. A., K. Gardiner, and I. A. Calvert. 1994. An assessment of the weight-loss in transit of filters loaded with carbon black. Ann. Occup. Hyg. 38:319-323.
Vaughan, N. P., B. D. Milligan, and T. L. Ogden. 1989. Filter weighing reproducibility and the gravimetric detection limit. Ann. Occup. Hyg. 33:331-337.
Vincent, J. H. 1995. Aerosol Science for Industrial Hygienists. Bath, UK: Pergamon.
Vincent, J. H. 1998. International occupational exposure standards: A review and commentary. Am. Ind. Hyg. Assoc. J. 59:729-742.
Vincent, J. H. 2005. Health-related aerosol measurement: a review of existing sampling criteria and proposals for new ones. J.
Environ. Monit. 7:1037-1053.
Vincent, J. H., R. A. Aitken, and D. Mark. 1993. Porous plastic foam filtration media: penetration characteristics and applications in particle size-selective sampling. J. Aerosol Sci. 24:929.

590 WORKPLACE AEROSOL MEASUREMENT
Vincent, J. H., D. Mark, B. G. Miller, L. Armbruster, and T. L. Ogden. 1990. Aerosol inhalability at higher windspeeds. 1. Aerosol Sci. 21:577-586.
Vinson, R, J. Volkwein, and L. McWilliams. 2007. Determining the spatial variability of personal sampler inlet locations. 1. Environ. Health 4:9708-714.
Volkwein, J. c., and P. T. Behum. 1978. Laboratory Evaluation of a Recording Respirable Mass Monitor. Am. Ind. Hyg. 1. 39(12):96.
Volkwein, J. c., R P. Vinson, L. J. McWilliams, D. P. Tuchman, and S. E. Mischler. 2004. Performance of a New Personal Respirable Dust Monitor for Mine Use, Centers for Disease Control and Prevention, Information Circular RI 9663.
Volkwein, J. c., R P. Vinson, S. J. Page, L. J. McWilliams, G. J. Joy, S. E. Mischler, and D. P. Tuchman. 2006. Laboratory and Field Performance of a Continuously Measuring Personal Respirable Dust Monitor, Centers for Disease Control and Prevention, Information Circular RI 9669.
Volkwein, J. C., A. L. Schoeneman, and S. J. Page. 1998. Laboratory Evaluation of Pressure Differential Dust Detector Tube. 1998 American Industrial Hygiene Conference, May, Atlanta, GA.
Wade, J. F., ill, and L. S. Newman. 1993. Diesel asthma: Reactive airways disease following overexposure to locomotive exhaust. 1. Occup. Med. 35:149.
Walton, H. W., and J. H. Vincent. 1998. Aerosol instrumentation in occupational hygiene: An historical perspective. Aerosol Sci. Tech. 28:417-438.
Werner, M. A., T. M. Spear, and J. H. Vincent. 1996. Investigation into the impact of introducing workplace aerosol standards based on the inhalable fraction. Analyst 9:1207-1214.
Wichmann, H. E., and A. Peters. 2000. Epidemiological evidence of the effects of ultrafine particle exposure. Philos. Trans. R. Soc. Lond. Ser. A-Math. Phys. Eng. Sci. 358(1775): 2751-2768.
Willeke, K., H. E. Ayer, and J. D. Blanchard. 1981. New methods for quantitative respirator fit testing with aerosols. Am. Ind. Hyg. Assoc. 1. 42:121-125.
Williams, K., and R J. Timko. 1984. Performance Evaluation of a Real-Time Aerosol Monitor, U.S. Bureau of Mines, Centers for Disease Control and Prevention, Information Circular 8968.
Williams, K. L., and R. P. Vinson. 1986. Evaluation of the TEOM Dust Monitor, U.S. Bureau of Mines, Centers for Disease Control and Prevention, Information Circular 9119.
Witschger, 0., S. A. Grinshpun, S. Fauvel, and G. Basso. 2004. Performance of personal inhalable aerosol samplers in very slowly moving air when facing the aerosol source. Ann. Occup. Hyg.4:51-368.
Wood, J. D. 1977. A review of personal sampling pumps. Ann. Occup. Hyg. 20:3 -17.
Wu, H. W., and A. D. S. Gillies. 2008. Developments in real time personal diesel particulate monitoring in mines. In Proceedings of the 12th U.S./North American Mine Ventilation Symposium. University of Reno, NV: Omnipress, pp. 629-636.