workshop #4 prez - slides 1-30 - california · 4.5 du/ac medium density residential @ 10 du/ac...
TRANSCRIPT

San Joaquin Valley Growth Response Study, Phase III
Presentation to:Advisory and StakeholdersWorkshop #4
October 27, 2004October 27, 2004
San Joaquin Valley Growth Response Study, Phase III
Study Purpose
To explore smart growth best practices and “new regionalism” opportunities Develop a comprehensive approach to guide growth and development within the San Joaquin ValleyTo develop the “toolbox” of land use and other models to enhance our regional planning efforts – transportation models cannot provide all the answers
San Joaquin Valley Growth Response Study, Phase III
Presentation OverviewPrevious ActivityWhy Change Modeling Practices?Alternative Scenarios – What are they?Overview of Three Model TypesSmart Growth IndicatorsModel BenefitsNext Steps to Model RefinementPotential Application of ToolsYour Modeling IdeasClosingSpecial Thank YouQuestions and Answers
San Joaquin Valley Growth Response Study, Phase III
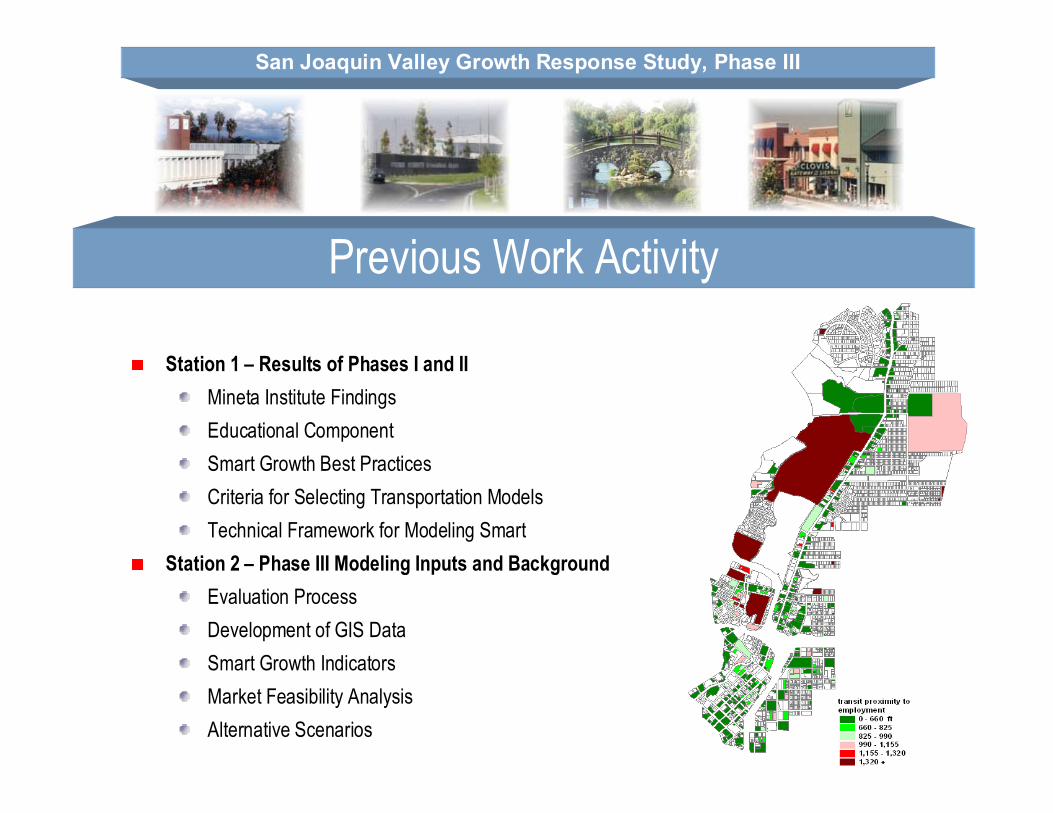
Previous Work Activity
Station 1 – Results of Phases I and IIMineta Institute FindingsEducational Component Smart Growth Best PracticesCriteria for Selecting Transportation Models Technical Framework for Modeling Smart
Station 2 – Phase III Modeling Inputs and BackgroundEvaluation ProcessDevelopment of GIS DataSmart Growth IndicatorsMarket Feasibility AnalysisAlternative Scenarios

San Joaquin Valley Growth Response Study, Phase III
Why Change Modeling Practices?
Standard Modeling Practices -TAZ geographyDemographic projection for household and job growthInconsistent relationship to land use patterns
ExistingPolicy
Difficult to review with the public and decision-makers Fresno-Clovis Core Area - TAZ Pattern
San Joaquin Valley Growth Response Study, Phase III
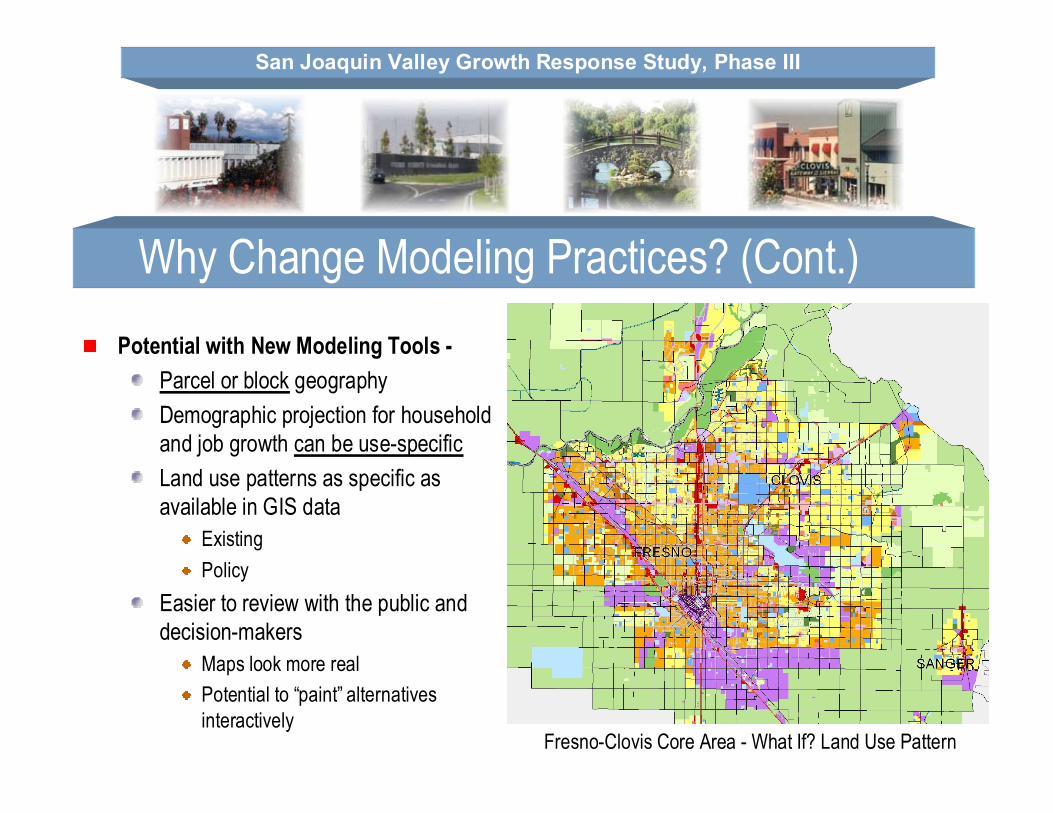
Why Change Modeling Practices? (Cont.)Potential with New Modeling Tools -
Parcel or block geographyDemographic projection for household and job growth can be use-specificLand use patterns as specific as available in GIS data
ExistingPolicy
Easier to review with the public and decision-makers
Maps look more realPotential to “paint” alternatives interactively
Fresno-Clovis Core Area - What If? Land Use Pattern
San Joaquin Valley Growth Response Study, Phase III
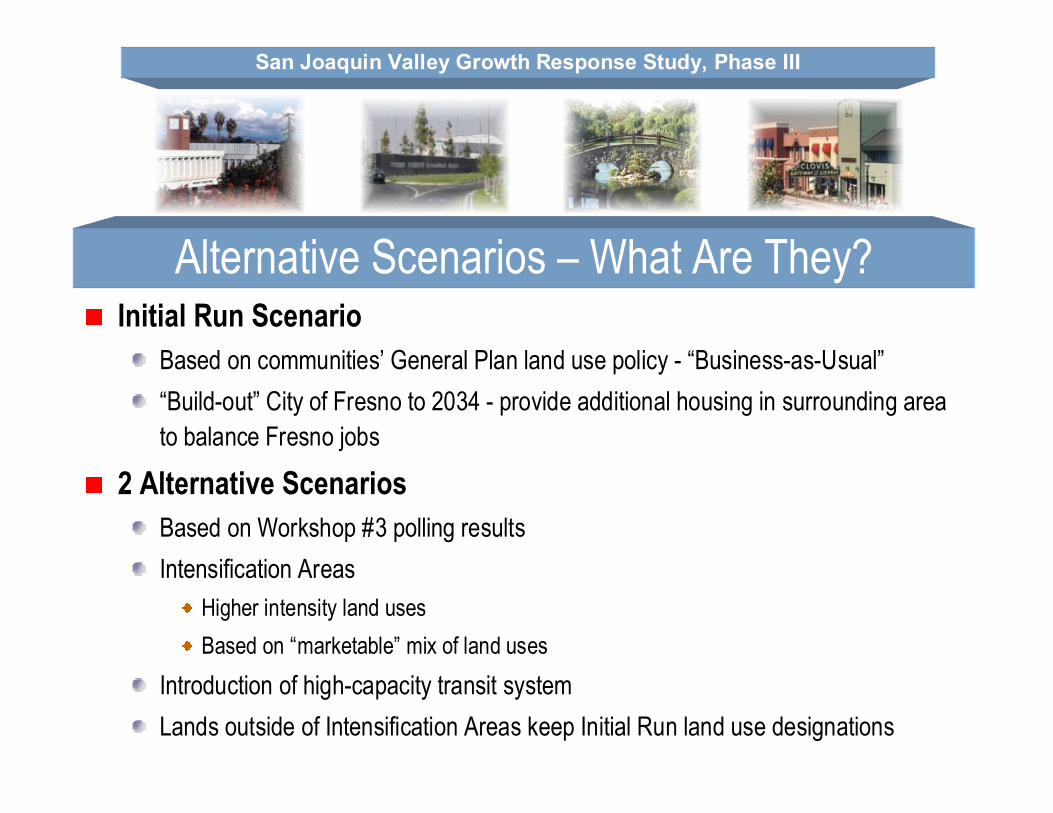
Alternative Scenarios – What Are They?Initial Run Scenario
Based on communities’ General Plan land use policy - “Business-as-Usual”“Build-out” City of Fresno to 2034 - provide additional housing in surrounding area to balance Fresno jobs
2 Alternative ScenariosBased on Workshop #3 polling resultsIntensification Areas
Higher intensity land usesBased on “marketable” mix of land uses
Introduction of high-capacity transit systemLands outside of Intensification Areas keep Initial Run land use designations
San Joaquin Valley Growth Response Study, Phase III
Economics of Land Use
Modeling Process based on Economic RealitiesNot just a Visioning ExerciseGrowth Forecast and Distributions reflect Real Estate Market Conditions
Strong Challenge given History, Lifestyles, EconomyCentral Valley dominated by Low Density, Affordable Living Large number of households prefer Non-Urban Lifestyle
San Joaquin Valley Growth Response Study, Phase III
Housing Demand
Demand for Higher Density DevelopmentGeodemographics – age/ household size/ current residence/ jobsHousehold Incomes – market-rate/ affordableLocation - new growth areas vs existing urbanized areas
Findings for Fresno/ Madera RegionSignificant Potential Interest: 12.5 percent of households(less than other regions)Policy implications: require investments in urban areas and support for higher density development in a number of locations

San Joaquin Valley Growth Response Study, Phase III
Housing Development Feasibility
Financial Feasibility of Higher Density DevelopmentPotential Sales Prices given Competitive SupplyDevelopment and Land Costs Key Considerations: parking costs; entitlement risk; existing uses
Findings for Fresno/ Madera RegionCompetitive housing market makes feasibility a challengePossibilities in new growth areas; urban areas require public investmentPolicy Implications: need active Redevelopment Agency involvement and supportive land use policies and policymakers
San Joaquin Valley Growth Response Study, Phase III
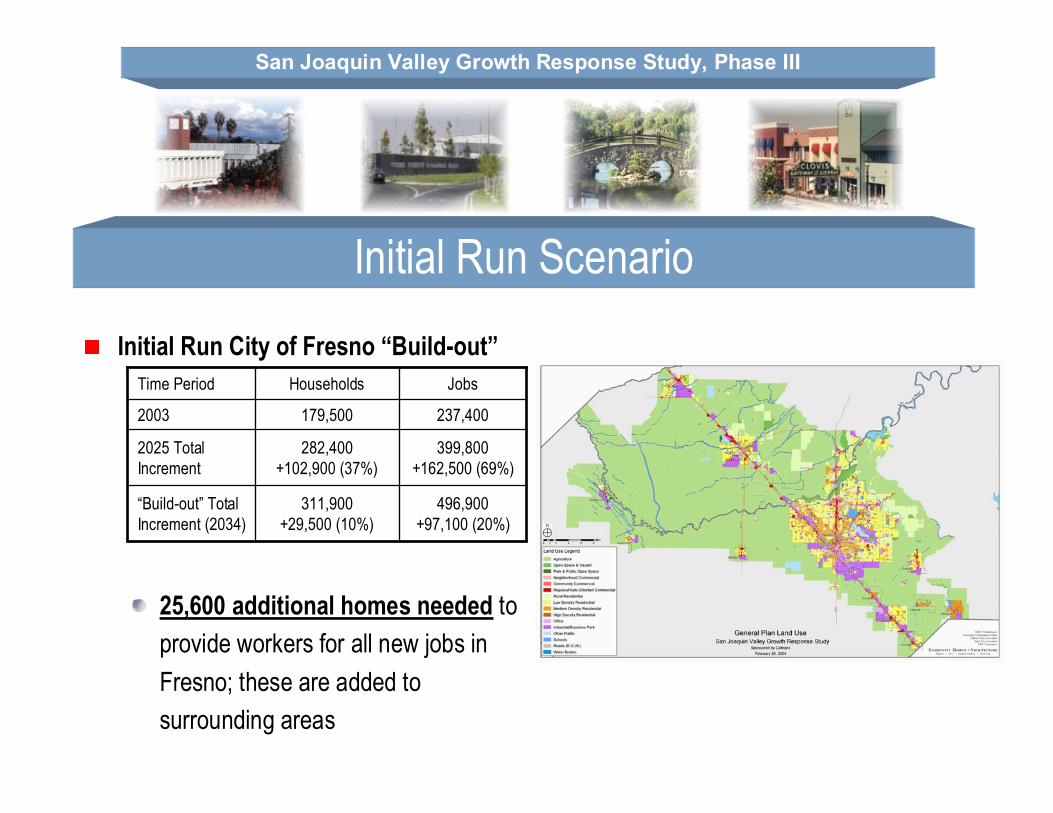
Initial Run City of Fresno “Build-out”
25,600 additional homes needed to provide workers for all new jobs in Fresno; these are added to surrounding areas
496,900+97,100 (20%)
311,900+29,500 (10%)
“Build-out” TotalIncrement (2034)
399,800+162,500 (69%)
282,400+102,900 (37%)
2025 TotalIncrement
237,400179,5002003
JobsHouseholdsTime Period
Initial Run Scenario
San Joaquin Valley Growth Response Study, Phase III
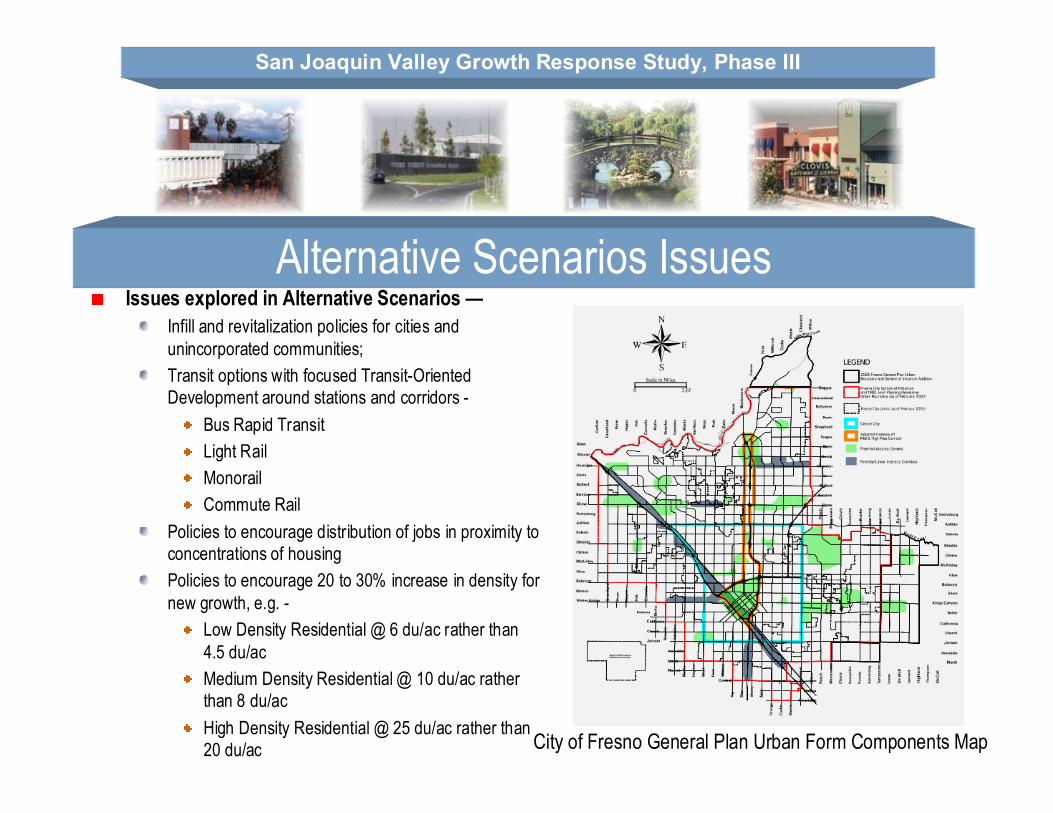
Alternative Scenarios IssuesIssues explored in Alternative Scenarios —
Infill and revitalization policies for cities and unincorporated communities;Transit options with focused Transit-Oriented Development around stations and corridors -
Bus Rapid TransitLight RailMonorailCommute Rail
Policies to encourage distribution of jobs in proximity to concentrations of housingPolicies to encourage 20 to 30% increase in density for new growth, e.g. -
Low Density Residential @ 6 du/ac rather than 4.5 du/acMedium Density Residential @ 10 du/ac rather than 8 du/acHigh Density Residential @ 25 du/ac rather than 20 du/ac City of Fresno General Plan Urban Form Components Map
San Joaquin Valley Growth Response Study, Phase III
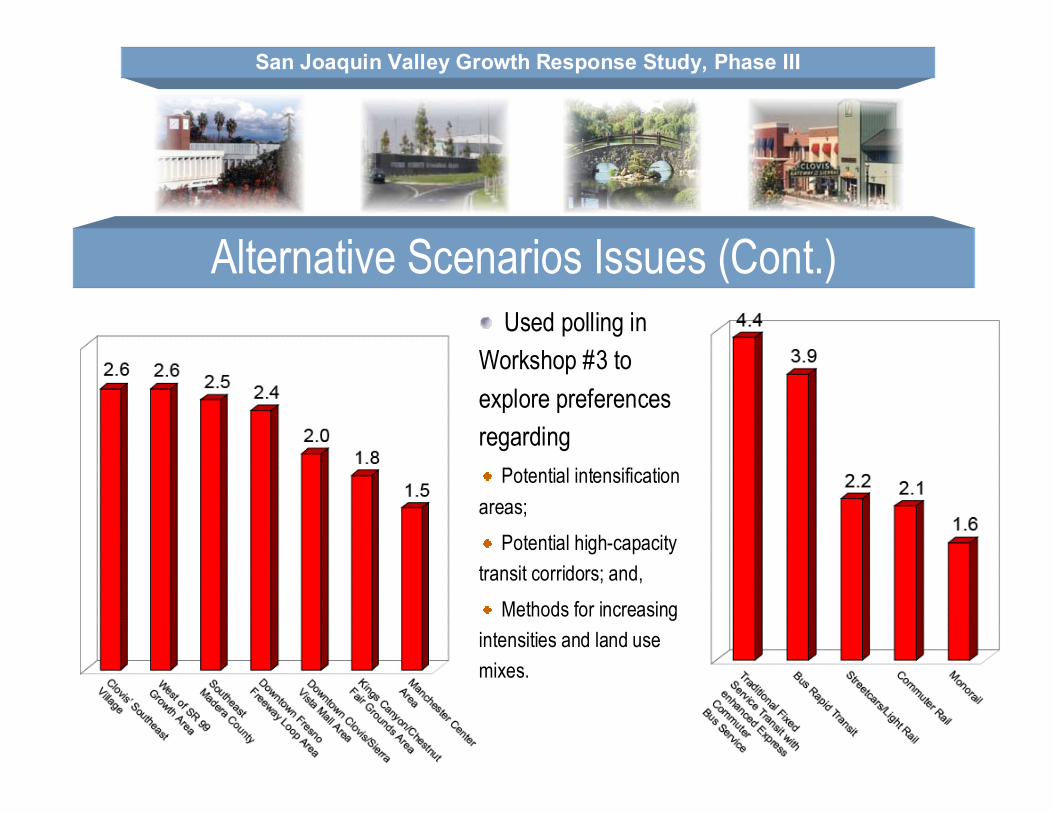
Alternative Scenarios Issues (Cont.)“Clicker” Interactive Polling
Used polling in Workshop #3 to explore preferences regarding
Potential intensification areas;
Potential high-capacity transit corridors; and,
Methods for increasing intensities and land use mixes.
San Joaquin Valley Growth Response Study, Phase III
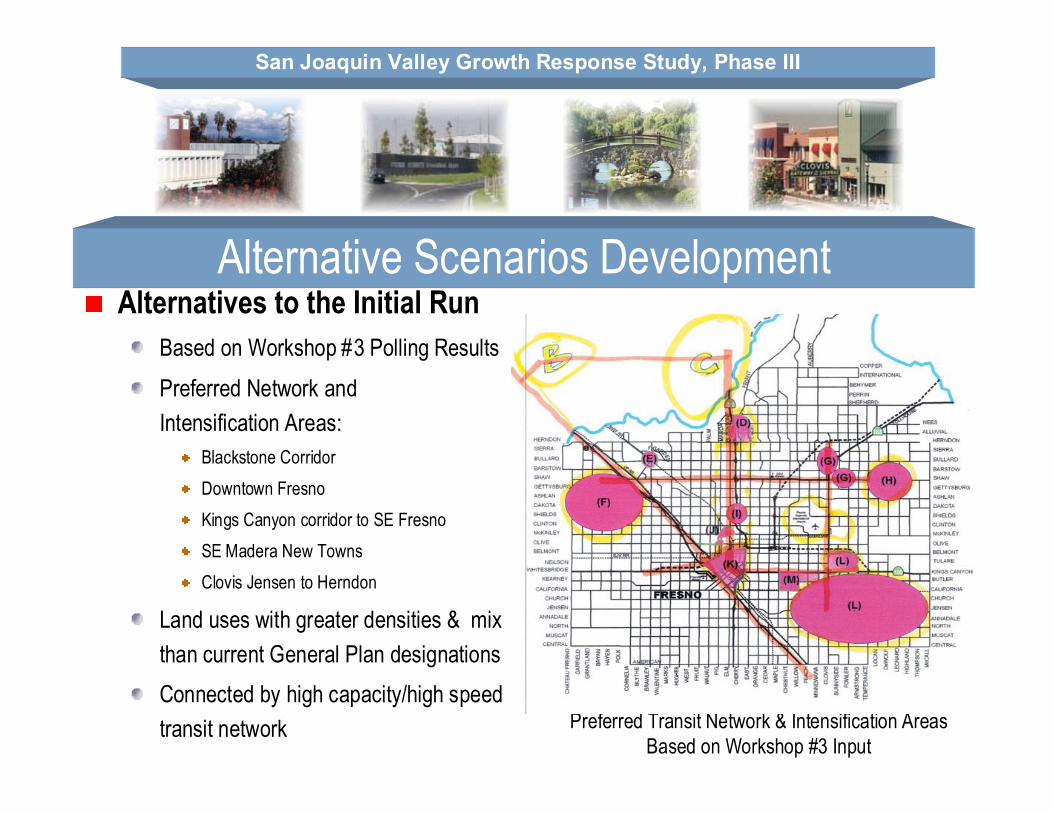
Alternative Scenarios DevelopmentAlternatives to the Initial Run
Based on Workshop #3 Polling ResultsPreferred Network and Intensification Areas:
Blackstone CorridorDowntown FresnoKings Canyon corridor to SE FresnoSE Madera New TownsClovis Jensen to Herndon
Land uses with greater densities & mix than current General Plan designationsConnected by high capacity/high speed transit network Preferred Transit Network & Intensification Areas
Based on Workshop #3 Input
San Joaquin Valley Growth Response Study, Phase III
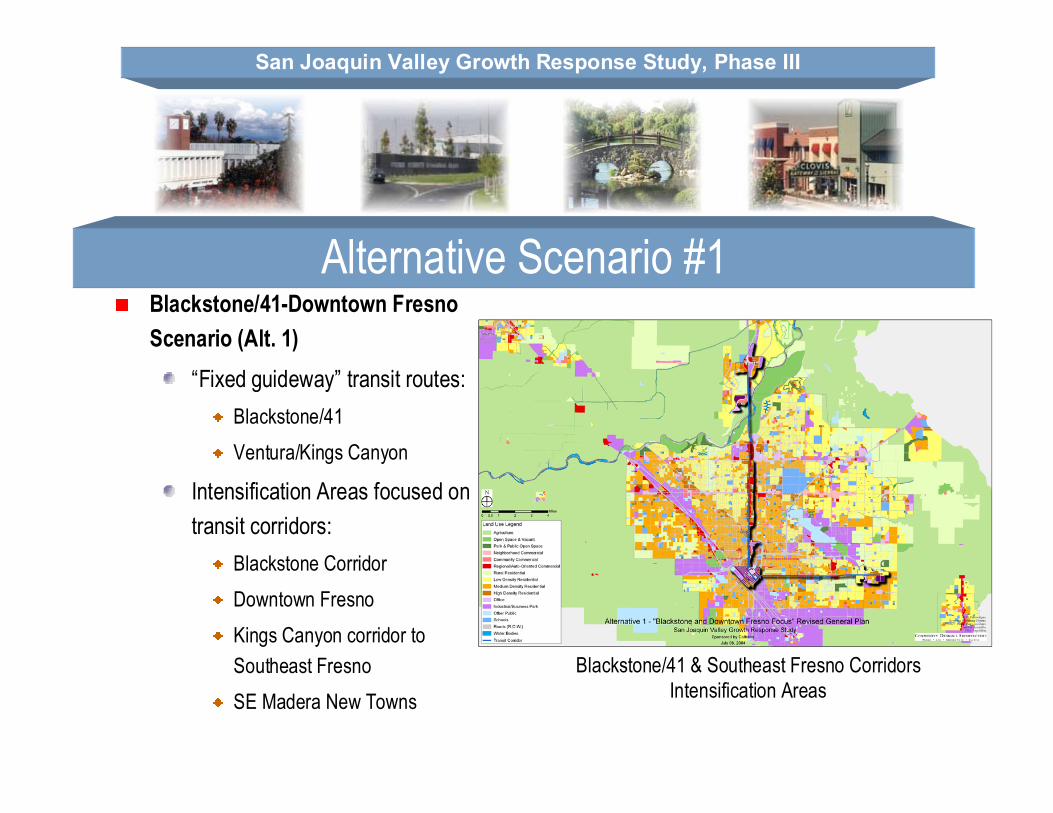
Alternative Scenario #1Blackstone/41-Downtown Fresno Scenario (Alt. 1)
“Fixed guideway” transit routes:Blackstone/41Ventura/Kings Canyon
Intensification Areas focused on transit corridors:
Blackstone CorridorDowntown FresnoKings Canyon corridor to Southeast FresnoSE Madera New Towns
Blackstone/41 & Southeast Fresno CorridorsIntensification Areas
San Joaquin Valley Growth Response Study, Phase III
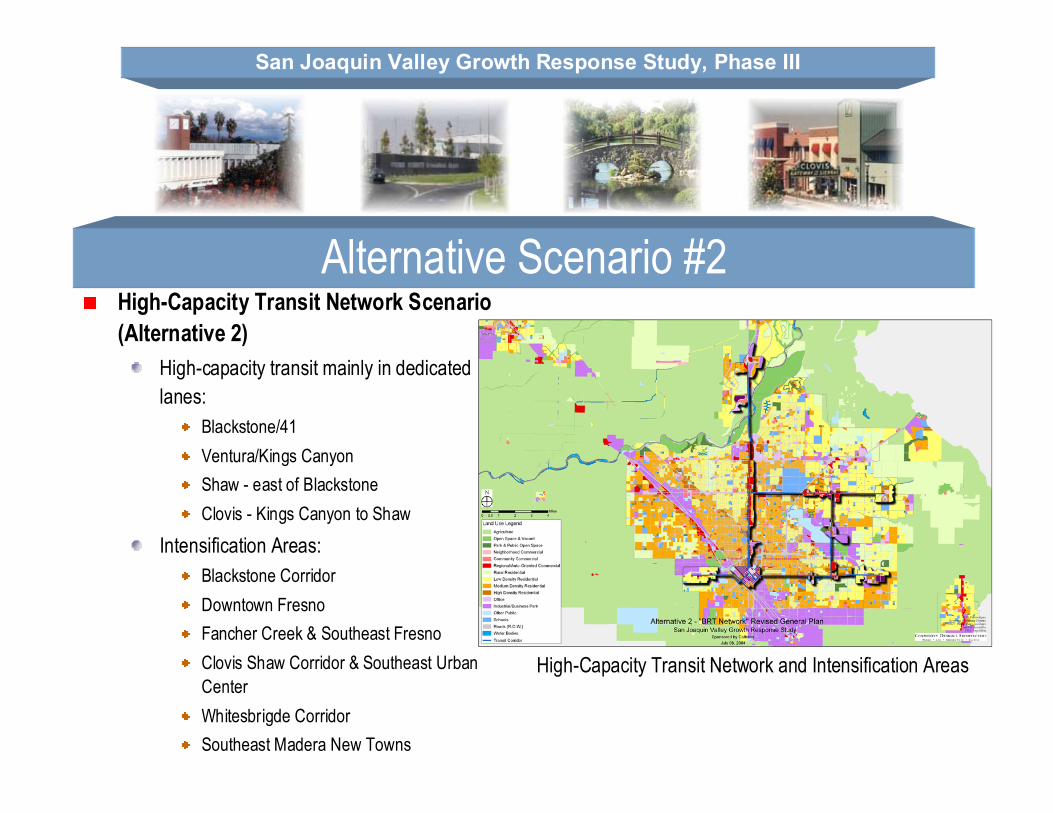
High-Capacity Transit Network and Intensification Areas
Alternative Scenario #2High-Capacity Transit Network Scenario (Alternative 2)
High-capacity transit mainly in dedicated lanes:
Blackstone/41Ventura/Kings CanyonShaw - east of BlackstoneClovis - Kings Canyon to Shaw
Intensification Areas:Blackstone CorridorDowntown FresnoFancher Creek & Southeast FresnoClovis Shaw Corridor & Southeast Urban CenterWhitesbrigde CorridorSoutheast Madera New Towns
San Joaquin Valley Growth Response Study, Phase III
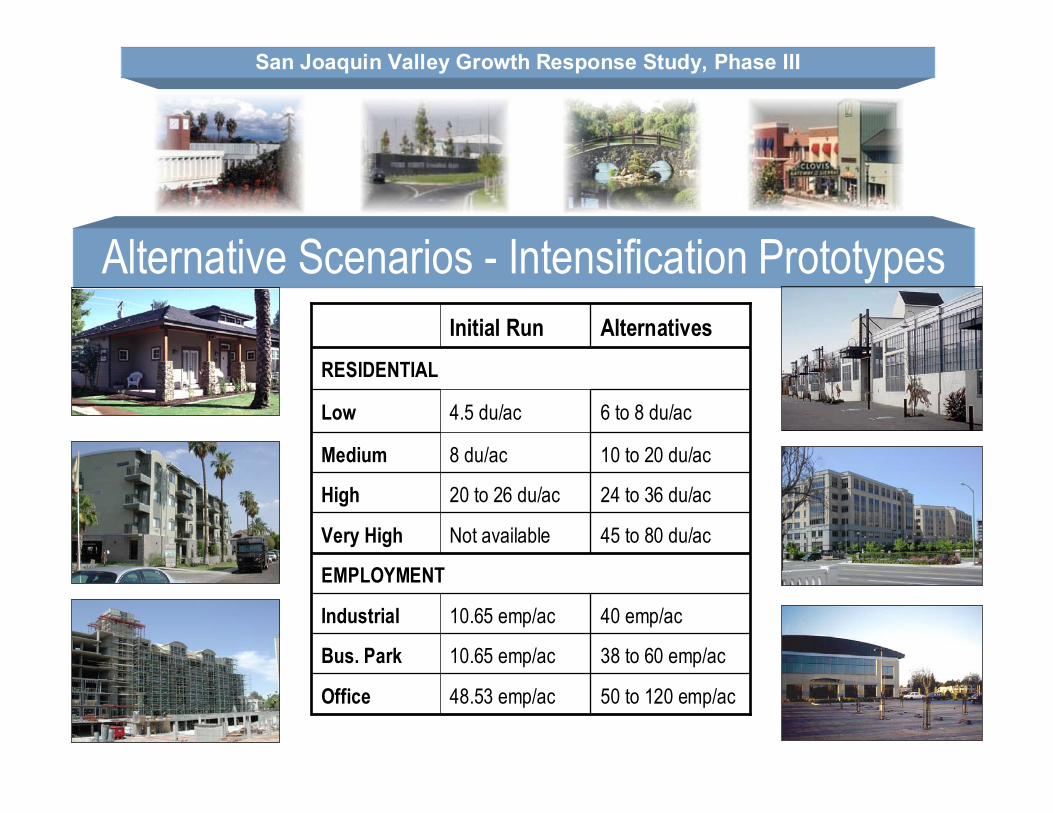
Alternative Scenarios - Intensification Prototypes
RESIDENTIAL
50 to 120 emp/ac48.53 emp/acOffice
38 to 60 emp/ac10.65 emp/acBus. Park
40 emp/ac10.65 emp/acIndustrial
EMPLOYMENT
45 to 80 du/acNot availableVery High
24 to 36 du/ac20 to 26 du/acHigh
10 to 20 du/ac8 du/acMedium
6 to 8 du/ac4.5 du/acLow
AlternativesInitial Run
San Joaquin Valley Growth Response Study, Phase III
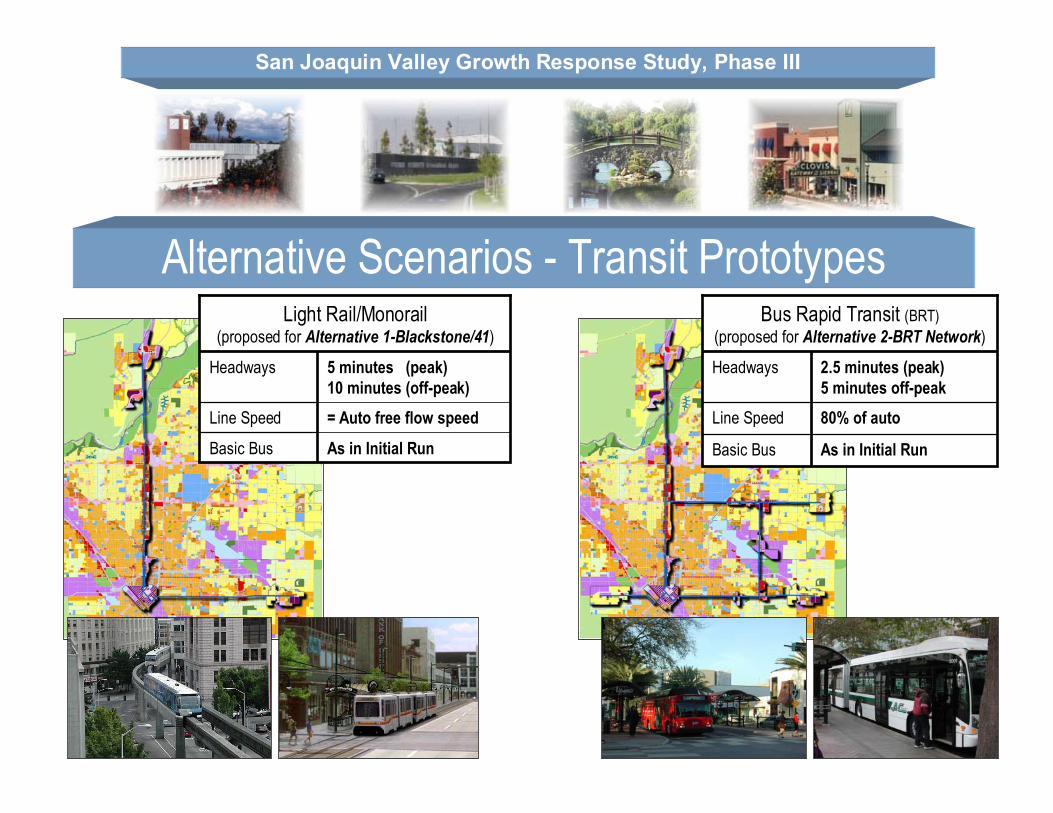
Alternative Scenarios - Transit Prototypes
As in Initial RunBasic Bus
= Auto free flow speedLine Speed
5 minutes (peak)10 minutes (off-peak)
Headways
Light Rail/Monorail(proposed for Alternative 1-Blackstone/41)
As in Initial Run Basic Bus
80% of autoLine Speed
2.5 minutes (peak)5 minutes off-peak
Headways
Bus Rapid Transit (BRT)(proposed for Alternative 2-BRT Network)
San Joaquin Valley Growth Response Study, Phase III
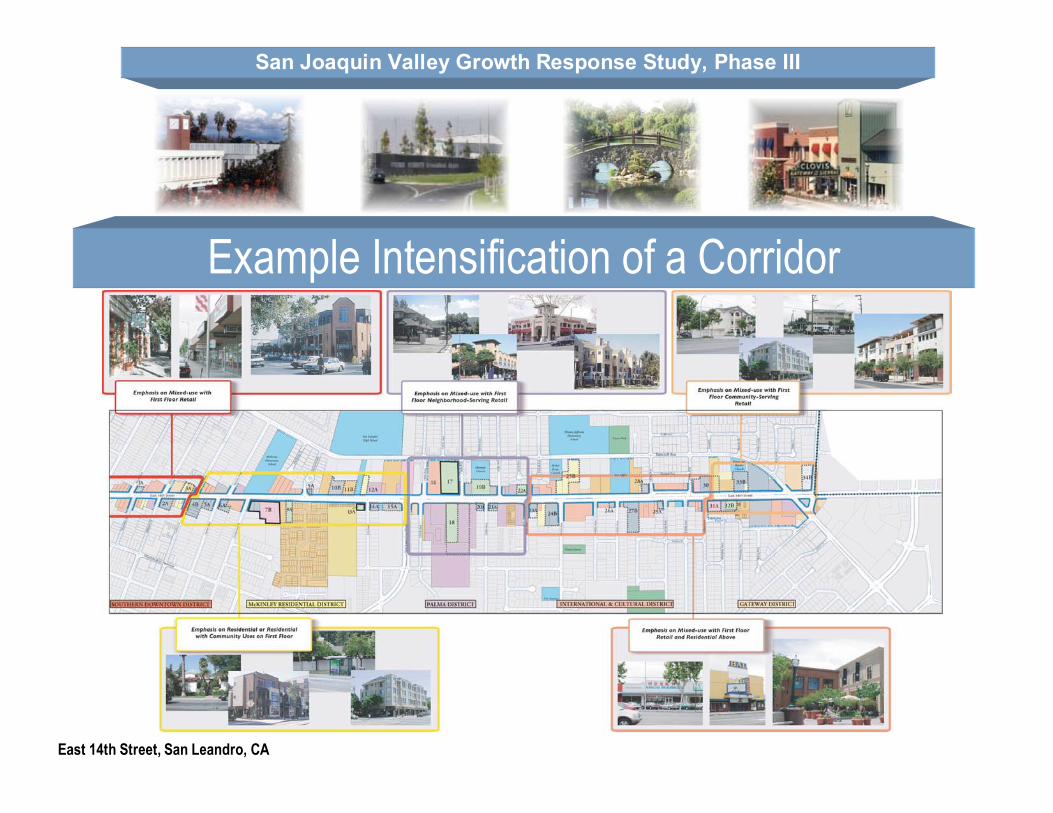
East 14th Street, San Leandro, CA
Example Intensification of a Corridor

San Joaquin Valley Growth Response Study, Phase III
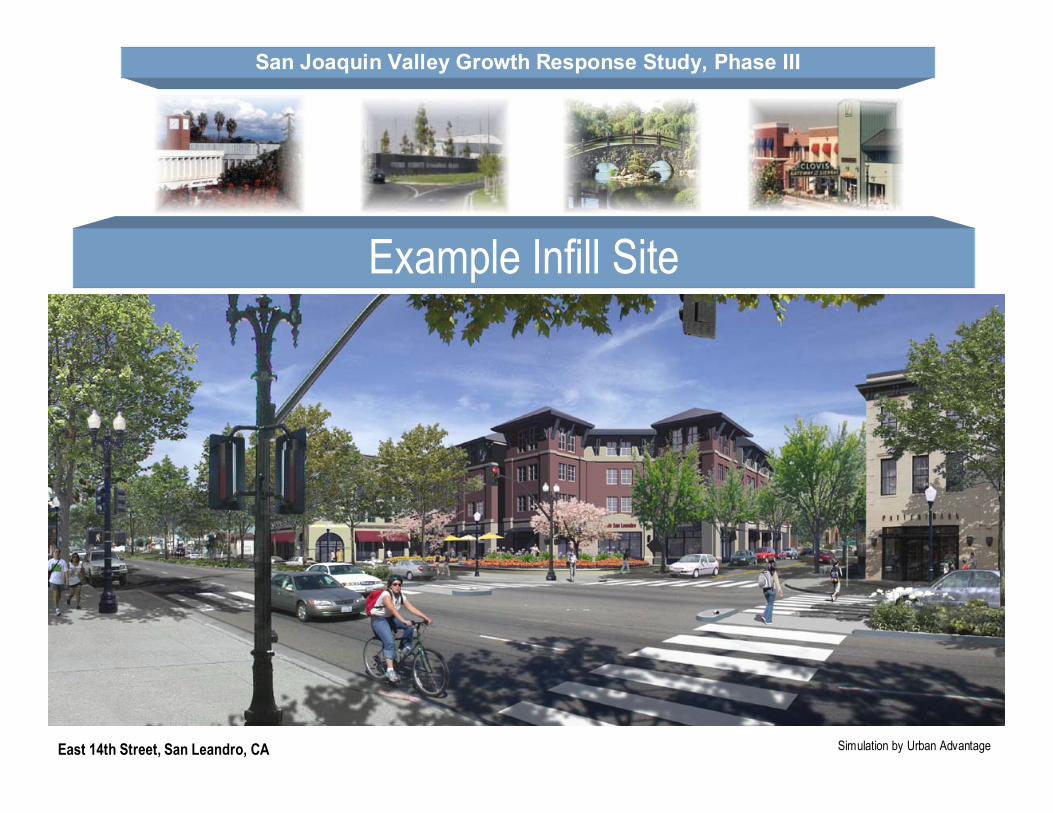
Example Infill Site
East 14th Street, San Leandro, CA Simulation by Urban Advantage
San Joaquin Valley Growth Response Study, Phase III
Example Infill Site
East 14th Street, San Leandro, CA Simulation by Urban Advantage
San Joaquin Valley Growth Response Study, Phase III
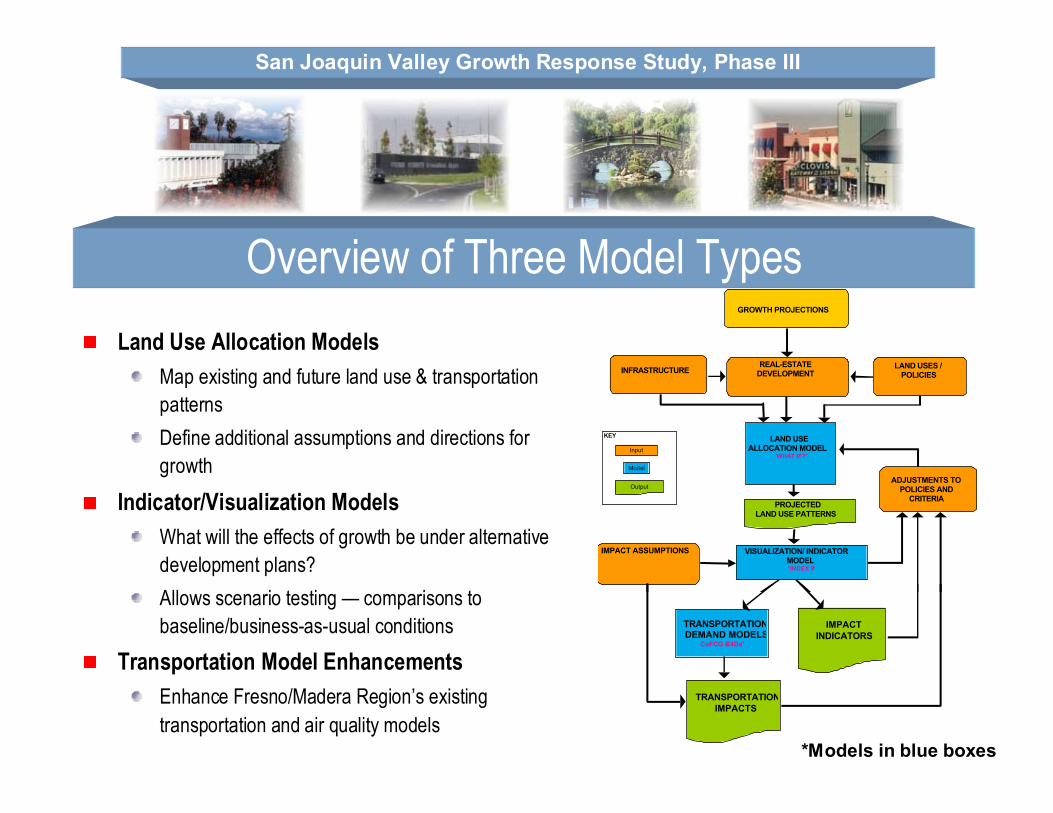
Overview of Three Model TypesLand Use Allocation Models
Map existing and future land use & transportation patternsDefine additional assumptions and directions for growth
Indicator/Visualization ModelsWhat will the effects of growth be under alternative development plans?Allows scenario testing — comparisons to baseline/business-as-usual conditions
Transportation Model EnhancementsEnhance Fresno/Madera Region’s existing transportation and air quality models
KEY LAND USE ALLOCATION MODEL
"WHAT IF?"
PROJECTED LAND USE PATTERNS
Model
Input
Output
VISUALIZATION/ INDICATOR MODEL"INDEX 8"
GROWTH PROJECTIONS
IMPACT ASSUMPTIONS
REAL-ESTATE DEVELOPMENT
ADJUSTMENTS TOPOLICIES AND
CRITERIA
INFRASTRUCTURE LAND USES / POLICIES
TRANSPORTATIONDEMAND MODELS
CoFCG & "4Ds"
IMPACT INDICATORS
TRANSPORTATIONIMPACTS
*Models in blue boxes
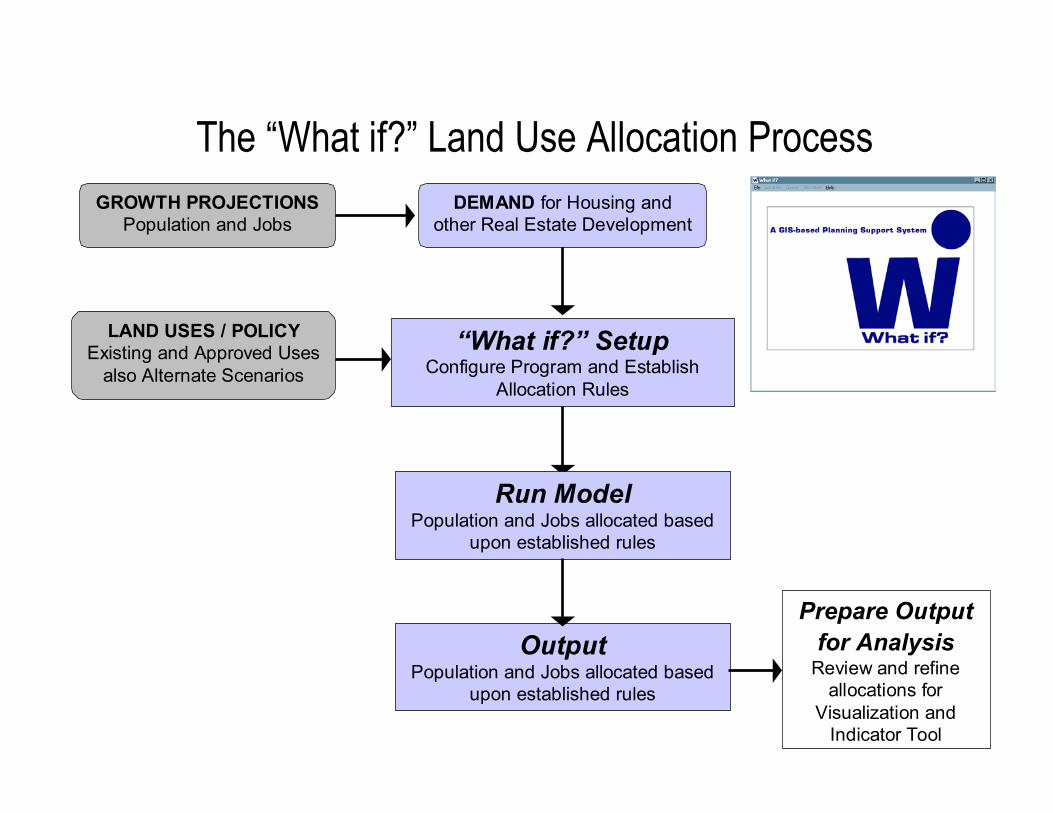
“What if?” SetupConfigure Program and Establish
Allocation Rules
Run ModelPopulation and Jobs allocated based
upon established rules
GROWTH PROJECTIONSPopulation and Jobs
DEMAND for Housing and other Real Estate Development
LAND USES / POLICYExisting and Approved Uses
also Alternate Scenarios
OutputPopulation and Jobs allocated based
upon established rules
The “What if?” Land Use Allocation Process
Prepare Output for Analysis
Review and refine allocations for
Visualization and Indicator Tool
San Joaquin Valley Growth Response Study, Phase III
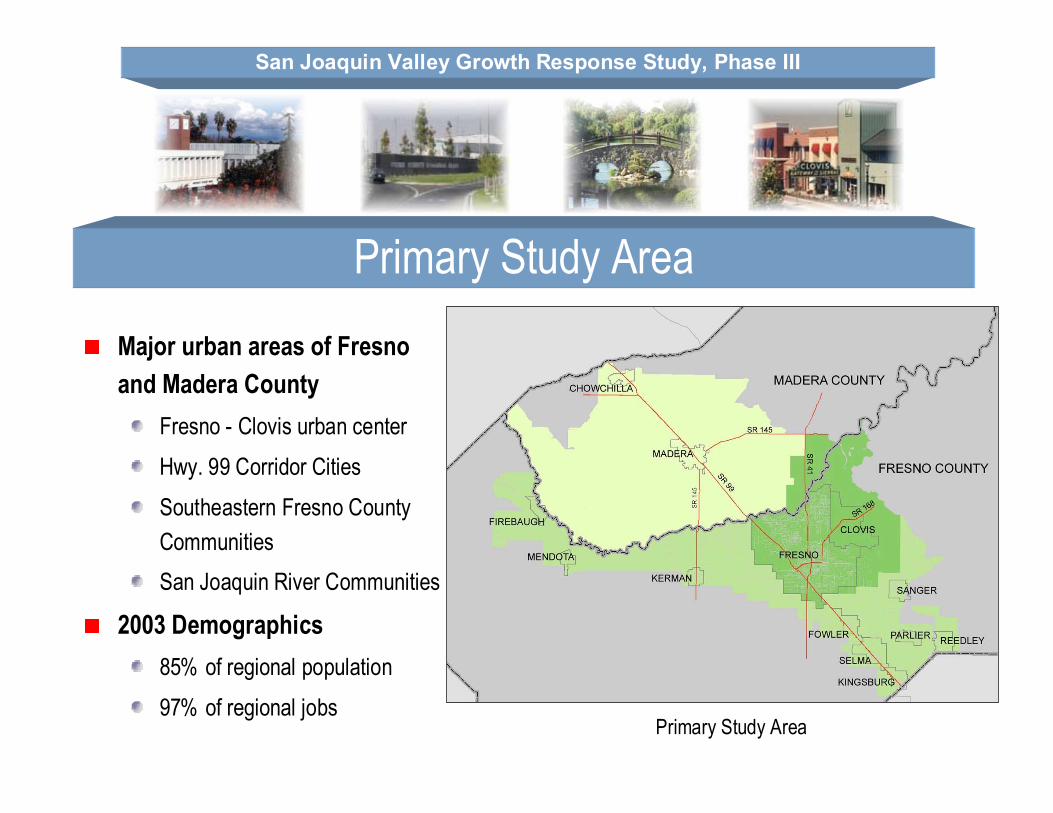
Primary Study Area
Primary Study AreaMajor urban areas of Fresno and Madera County
Fresno - Clovis urban centerHwy. 99 Corridor CitiesSoutheastern Fresno County CommunitiesSan Joaquin River Communities
2003 Demographics85% of regional population97% of regional jobs
San Joaquin Valley Growth Response Study, Phase III
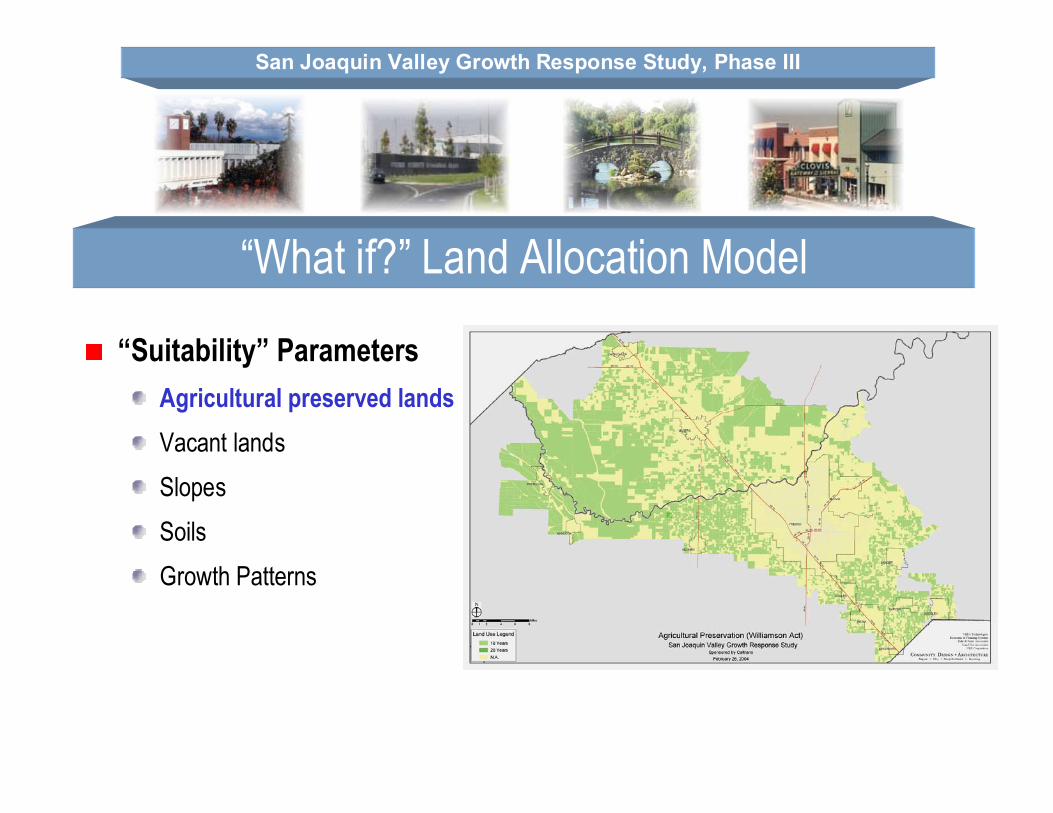
“What if?” Land Allocation Model
“Suitability” ParametersAgricultural preserved landsVacant lands Slopes SoilsGrowth Patterns
San Joaquin Valley Growth Response Study, Phase III
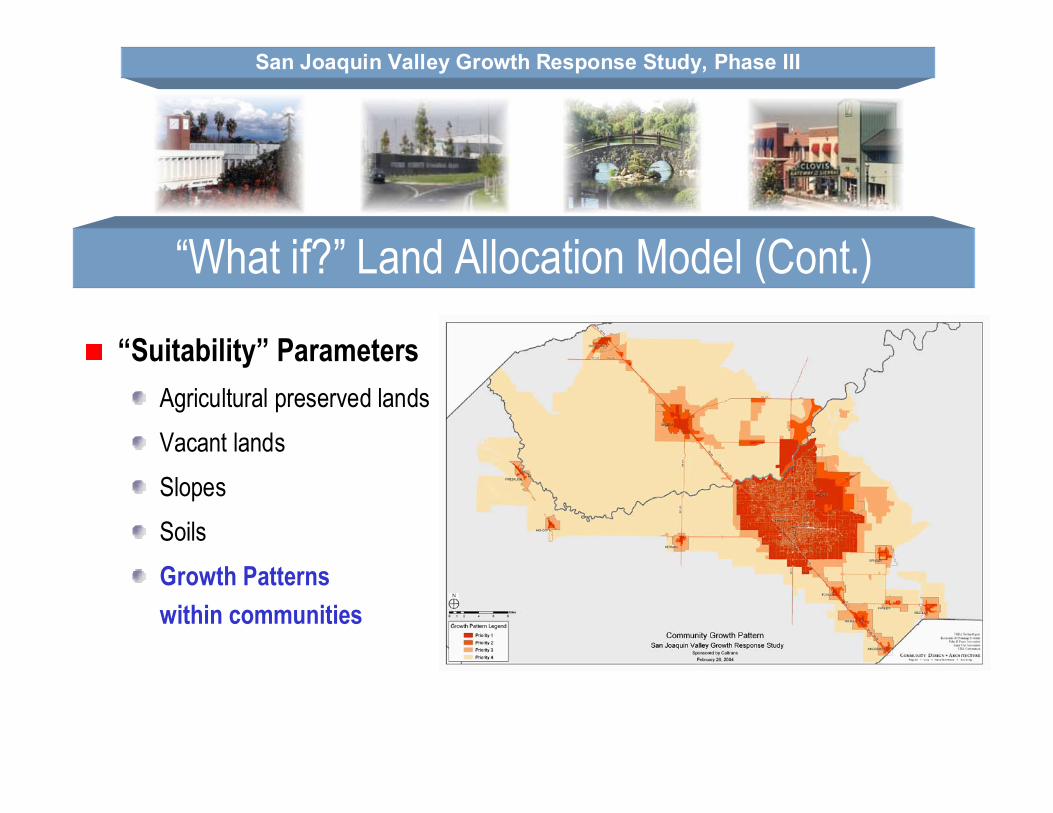
“What if?” Land Allocation Model (Cont.)
“Suitability” ParametersAgricultural preserved landsVacant lands Slopes SoilsGrowth Patternswithin communities

San Joaquin Valley Growth Response Study, Phase III
INDEX Evaluation ModelMeasuring the success of each Alternative Scenario
Evaluating indicators of success
Results from land use allocation model input into INDEX
Allows visual and numerical comparisons of Alternative Scenario performance
San Joaquin Valley Growth Response Study, Phase III
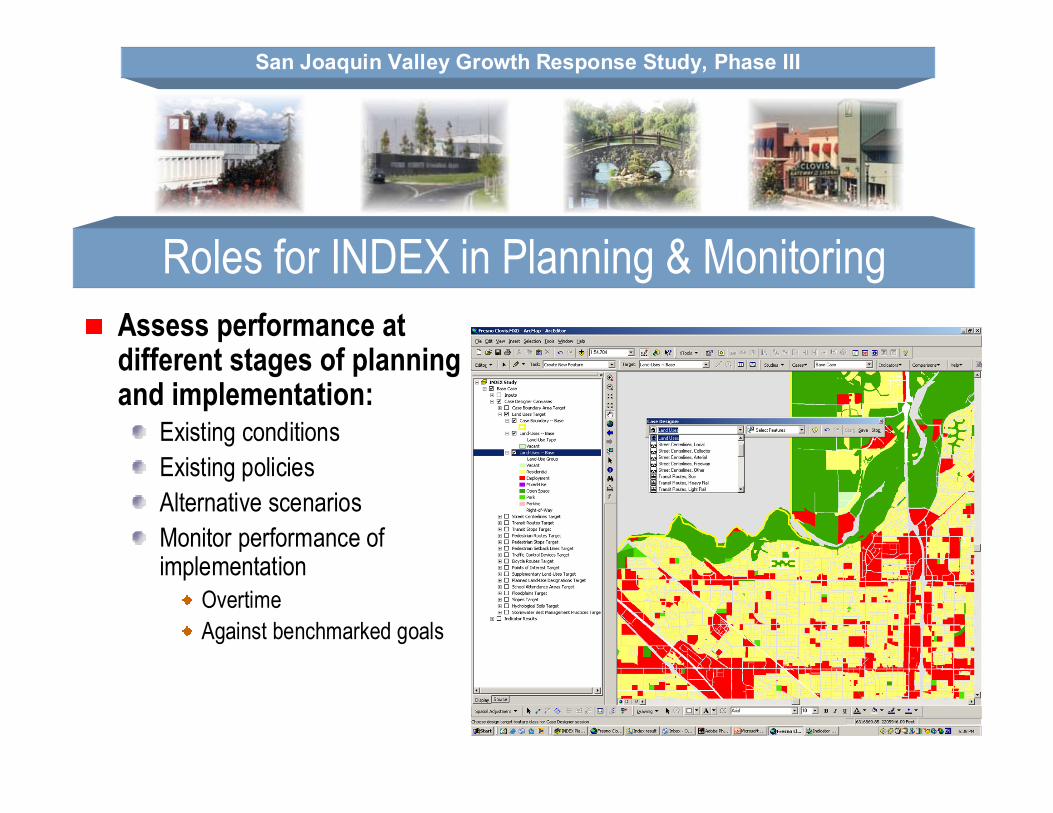
Roles for INDEX in Planning & MonitoringAssess performance at different stages of planning and implementation:
Existing conditionsExisting policiesAlternative scenariosMonitor performance of implementation
OvertimeAgainst benchmarked goals
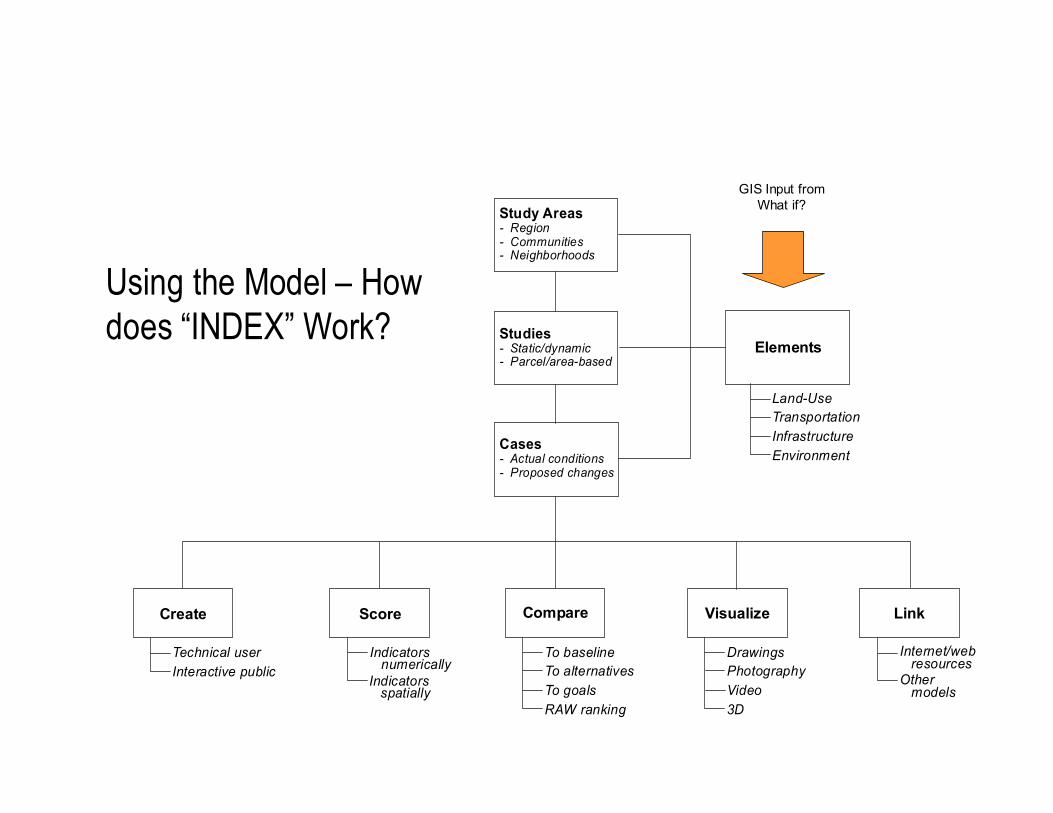
Using the Model – How does “INDEX” Work?
Elements
Study Areas- Region- Communities- Neighborhoods
Studies- Static/dynamic- Parcel/area-based
Cases- Actual conditions- Proposed changes
Land-UseTransportationInfrastructureEnvironment
Create
Technical userInteractive public
Compare
To baselineTo alternatives
RAW rankingTo goals
Visualize
DrawingsPhotographyVideo3D
Link
Internet/web resourcesOther models
Score
Indicators numericallyIndicators spatially
GIS Input from What if?
San Joaquin Valley Growth Response Study, Phase III
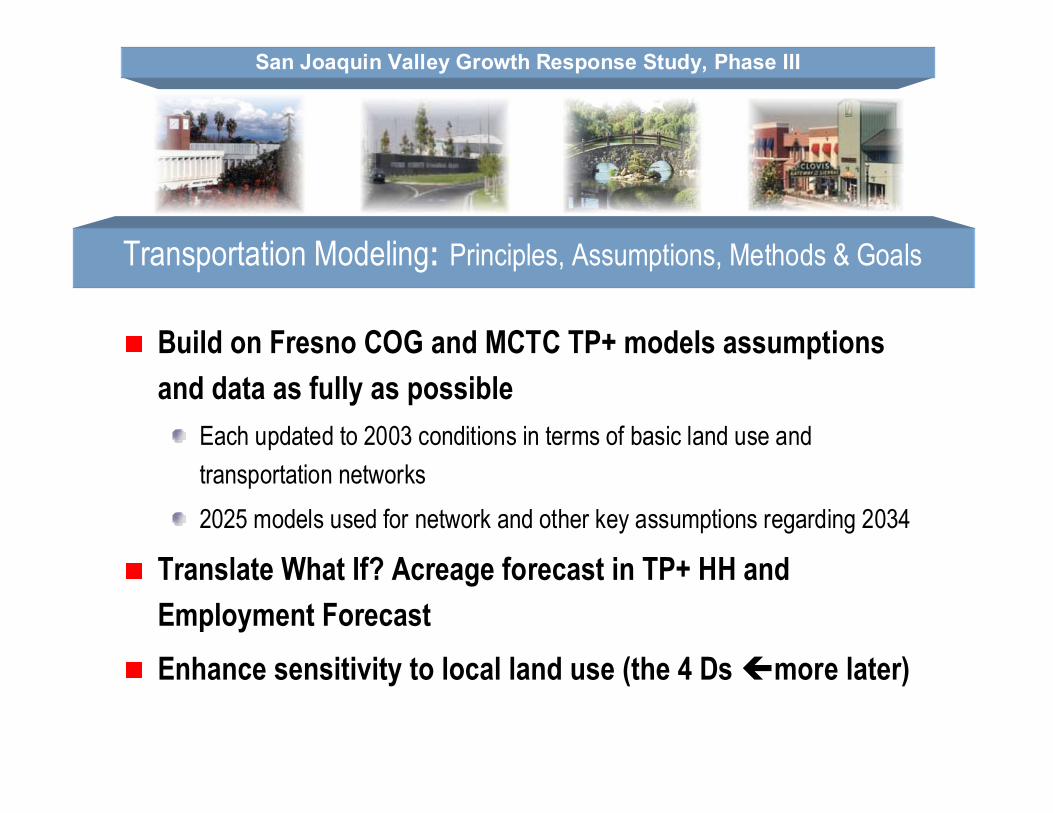
Transportation Modeling: Principles, Assumptions, Methods & Goals
Build on Fresno COG and MCTC TP+ models assumptions and data as fully as possible
Each updated to 2003 conditions in terms of basic land use and transportation networks2025 models used for network and other key assumptions regarding 2034
Translate What If? Acreage forecast in TP+ HH and Employment ForecastEnhance sensitivity to local land use (the 4 Ds more later)
San Joaquin Valley Growth Response Study, Phase III
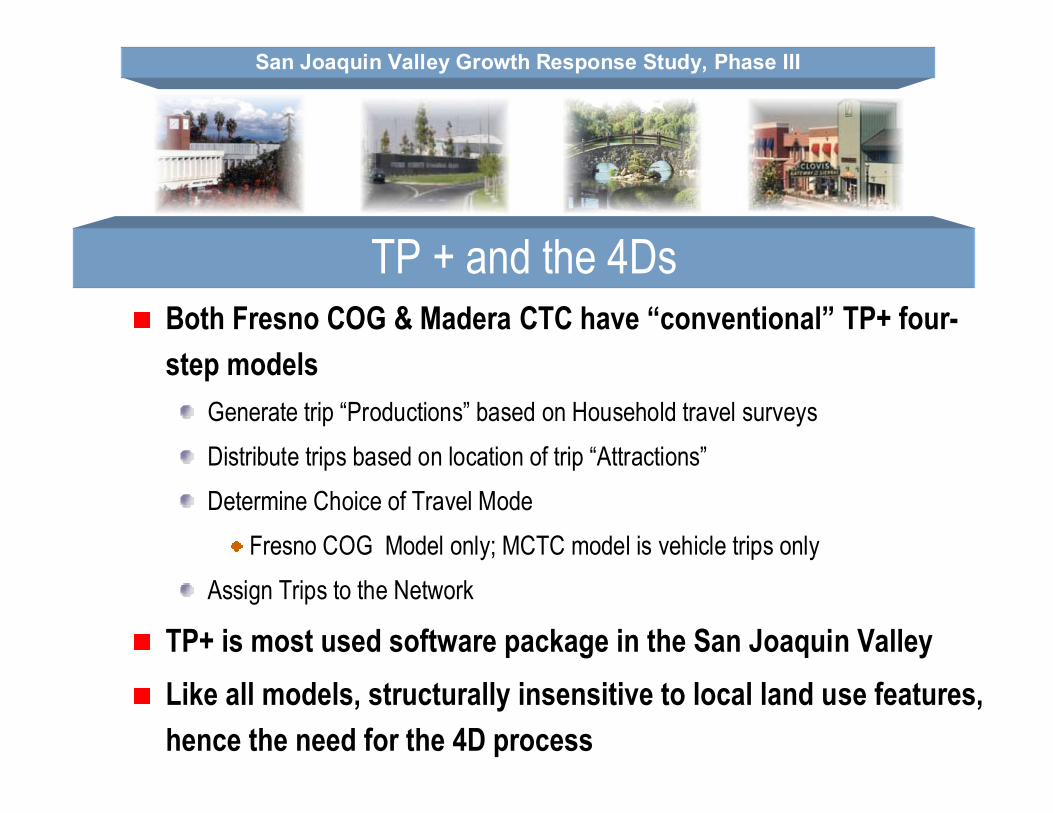
TP + and the 4DsBoth Fresno COG & Madera CTC have “conventional” TP+ four-step models
Generate trip “Productions” based on Household travel surveysDistribute trips based on location of trip “Attractions”Determine Choice of Travel Mode
Fresno COG Model only; MCTC model is vehicle trips onlyAssign Trips to the Network
TP+ is most used software package in the San Joaquin ValleyLike all models, structurally insensitive to local land use features, hence the need for the 4D process
San Joaquin Valley Growth Response Study, Phase III
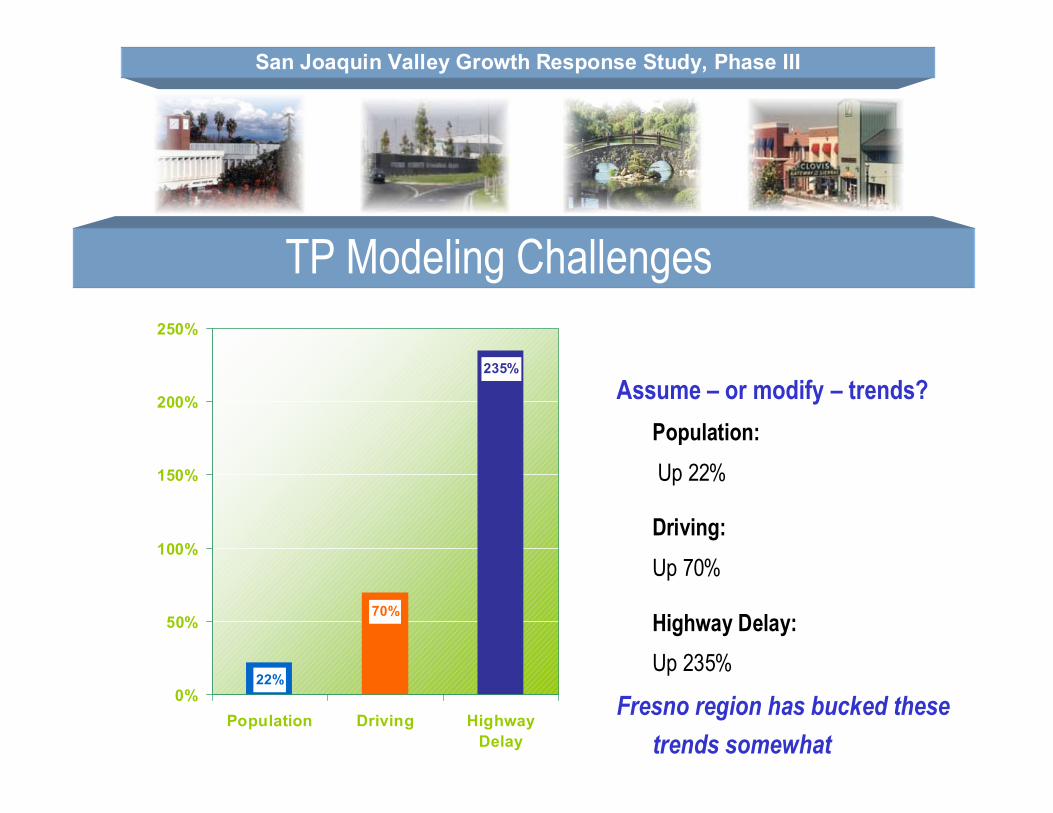
US Travel Trends Since 1982Based on Data From the Texas Transportation Institute)
Assume – or modify – trends?Population: Up 22%
Driving: Up 70%
Highway Delay: Up 235%
Fresno region has bucked these trends somewhat
22%
70%
235%
0%
50%
100%
150%
200%
250%
Population Driving HighwayDelay
TP Modeling Challenges
San Joaquin Valley Growth Response Study, Phase III
1098
1028
1098
1097
1025
853
1101
10261099850
851109510941093
849
11001027
1001
10231022
848
217
218
10001002
1024
1029
854
1003
216
997 219
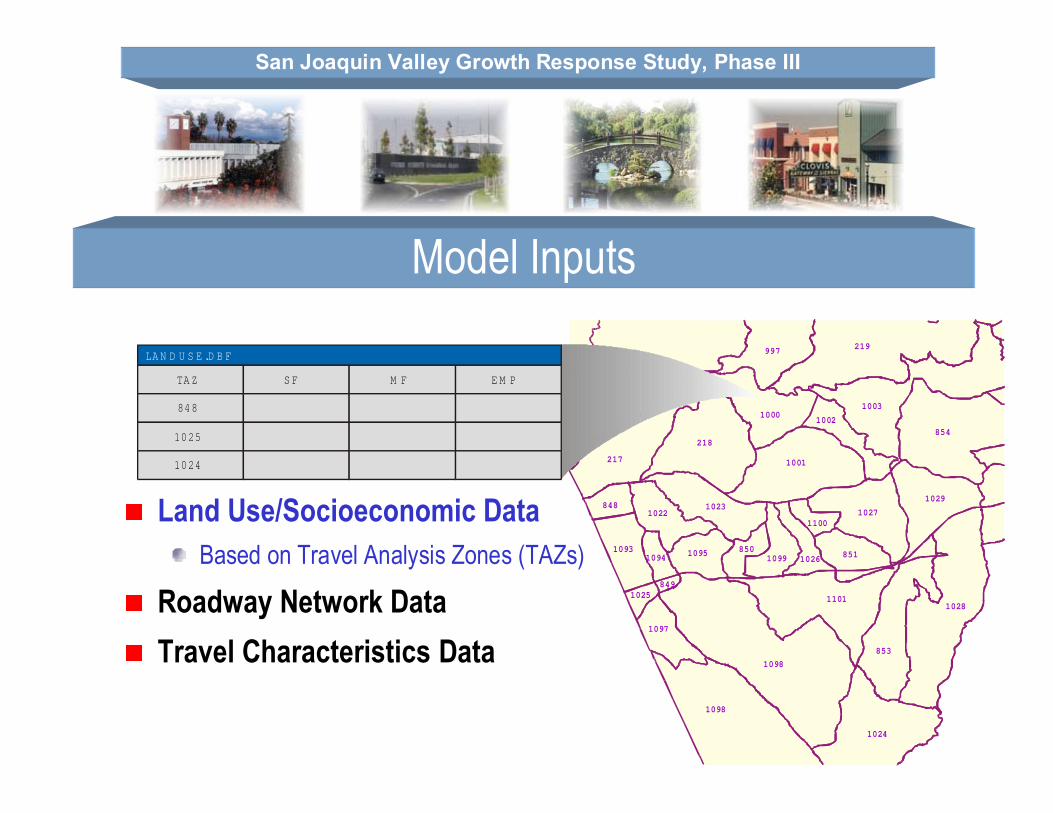
Land Use/Socioeconomic DataBased on Travel Analysis Zones (TAZs)
Roadway Network DataTravel Characteristics Data
TA Z S F M F E M P
848
1025
1024
LA N D U S E .D B F
Model Inputs
San Joaquin Valley Growth Response Study, Phase III
1098
1028
1098
1097
1025
853
1101
10261099850
851109510941093
849
11001027
1001
10231022
848
217
218
10001002
1024
1029
854
1003
216
997 219
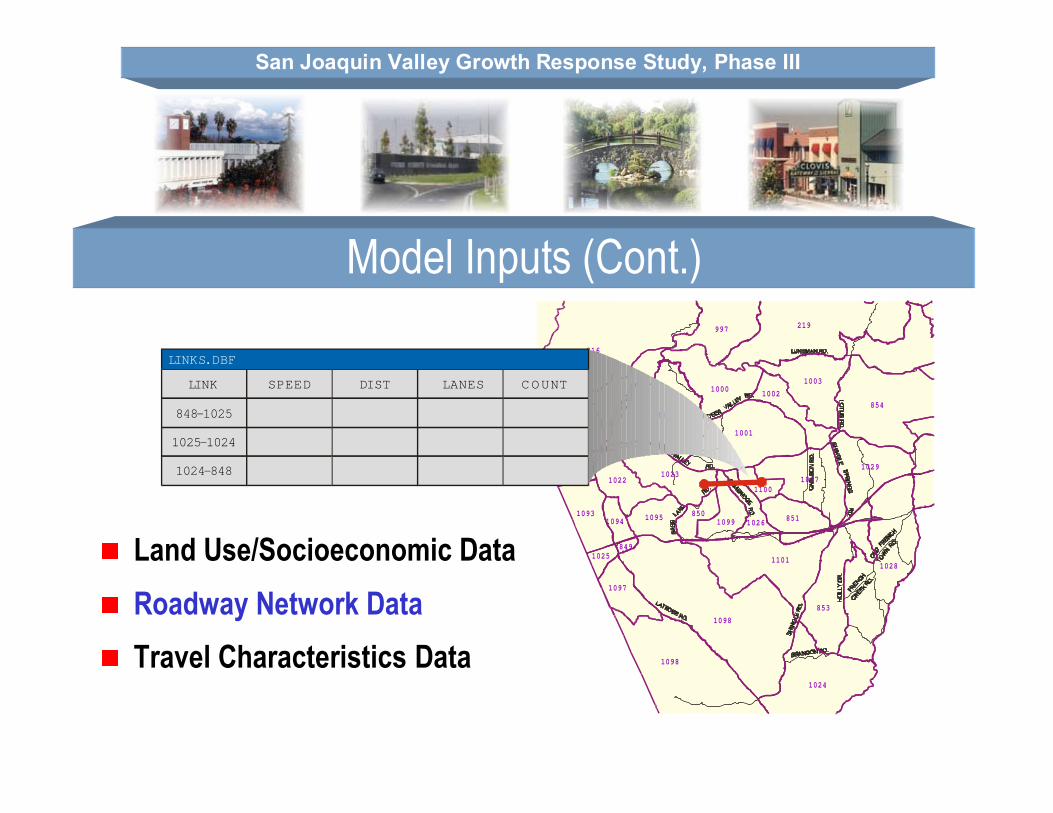
Land Use/Socioeconomic DataRoadway Network DataTravel Characteristics Data
LINK
848-1025
1025-1024
1024-848
LINKS.DBF
SPEED DIST LANES COUNT
Model Inputs (Cont.)

San Joaquin Valley Growth Response Study, Phase III
1098
1028
1098
1097
1025
853
1101
10261099850
851109510941093
849
11001027
1001
10231022
848
217
218
10001002
1024
1029
854
1003
216
997 219
IX
XI XX
I
I
Land Use/Socioeconomic DataRoadway Network DataTravel Characteristics Data
In the end, based on surveys of travelersMust include assumptions about trips that are both internal and external to the study area
Model Inputs (Cont.)

San Joaquin Valley Growth Response Study, Phase III
4Ds: Capturing Local Land Use Impacts on TravelMany factors affect travel demand that are not easily reflected in traditional four-step models, e.g., due to scale of the TAZsFocusing on land use, we may speak of several “D-factors” that at the neighborhood scale, shift travel demand away from driving
DensityDiversity (complementary mixing of land uses)
Sacramento studies suggest that nearby retail and personal services are especially effective in reducing midday trips and trips to and from work
Design (to encourage walking and biking)Destinations (how many attractions are you near?)
The TP+ modeling process was adjusted to account for the 4Ds
San Joaquin Valley Growth Response Study, Phase III
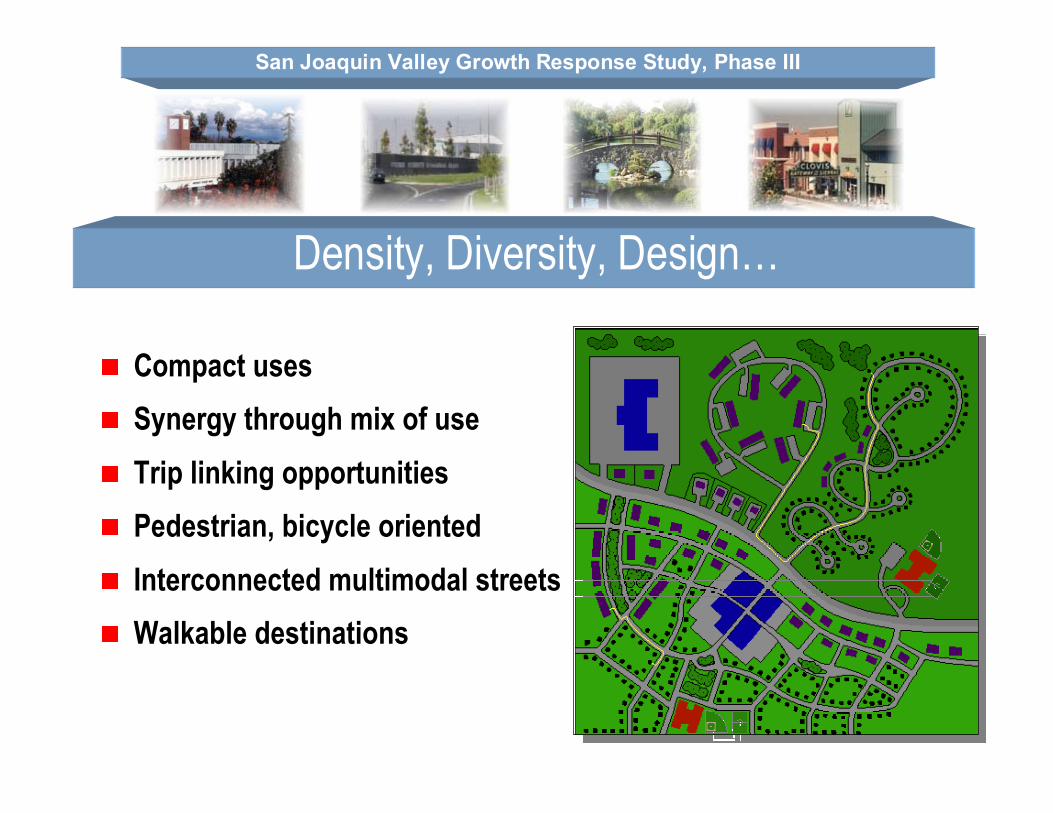
Density, Diversity, Design…
Compact usesSynergy through mix of useTrip linking opportunitiesPedestrian, bicycle oriented Interconnected multimodal streetsWalkable destinations
San Joaquin Valley Growth Response Study, Phase III
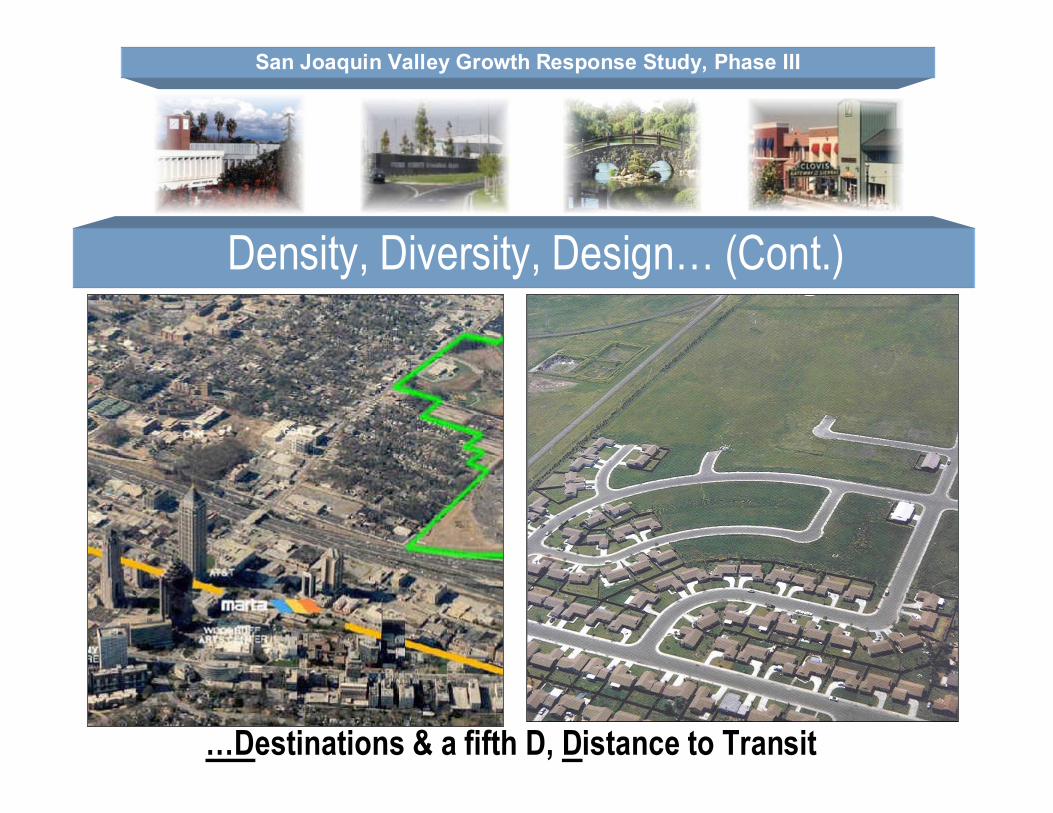
…Destinations & a fifth D, Distance to Transit
Density, Diversity, Design… (Cont.)
San Joaquin Valley Growth Response Study, Phase III
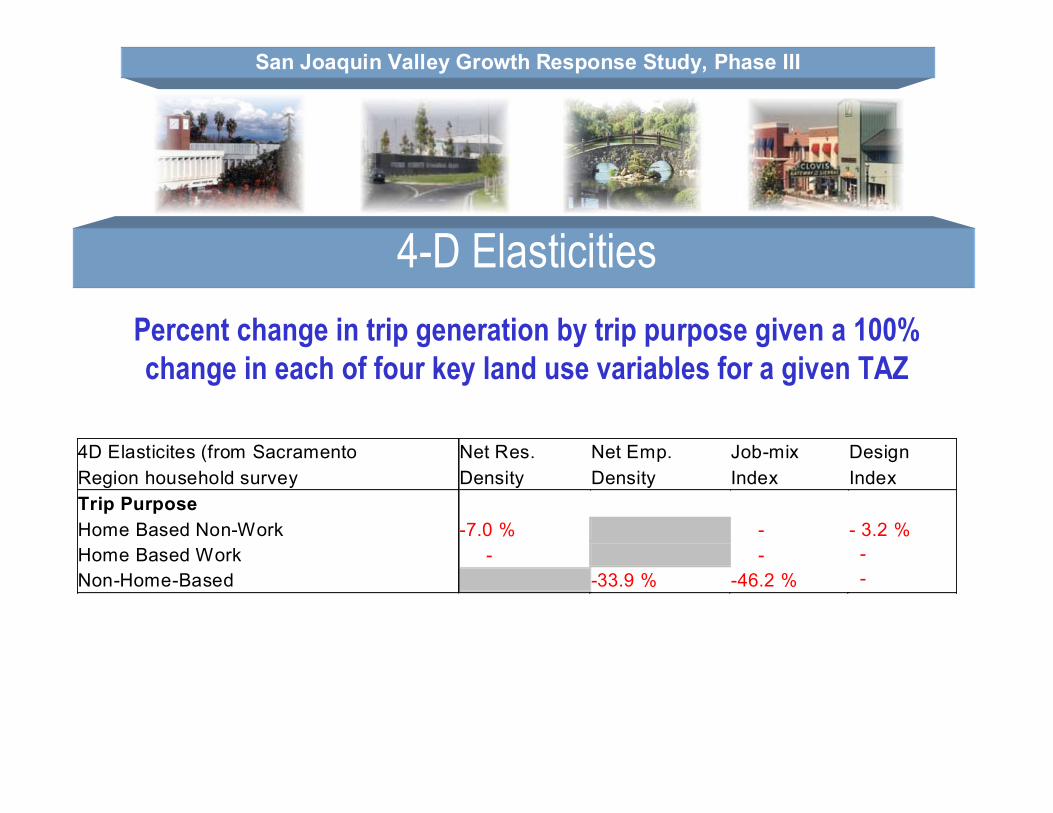
4-D Elasticities Percent change in trip generation by trip purpose given a 100% change in each of four key land use variables for a given TAZ
4D Elasticites (from Sacramento Net Res. Net Emp. Job-mix Design Region household survey Density Density Index Index Trip Purpose Home Based Non-Work -7.0 % - - 3.2 % Home Based Work - - - Non-Home-Based -33.9 % -46.2 % -

San Joaquin Valley Growth Response Study, Phase III
Smart Growth IndicatorsPurpose: To display the impacts of land use patterns
Examples of Indicators:Population DensityPercent of dwellings within 1/4 mile of transit
Enables comparison of Alternative Scenarios in terms of their success in meeting stakeholder goalsNarrowed list of potential indicators down to 13 to address key community concerns
Worked with stakeholders, elected officials, interest groups, government agencies and general public to define indicators important to the region
San Joaquin Valley Growth Response Study, Phase III
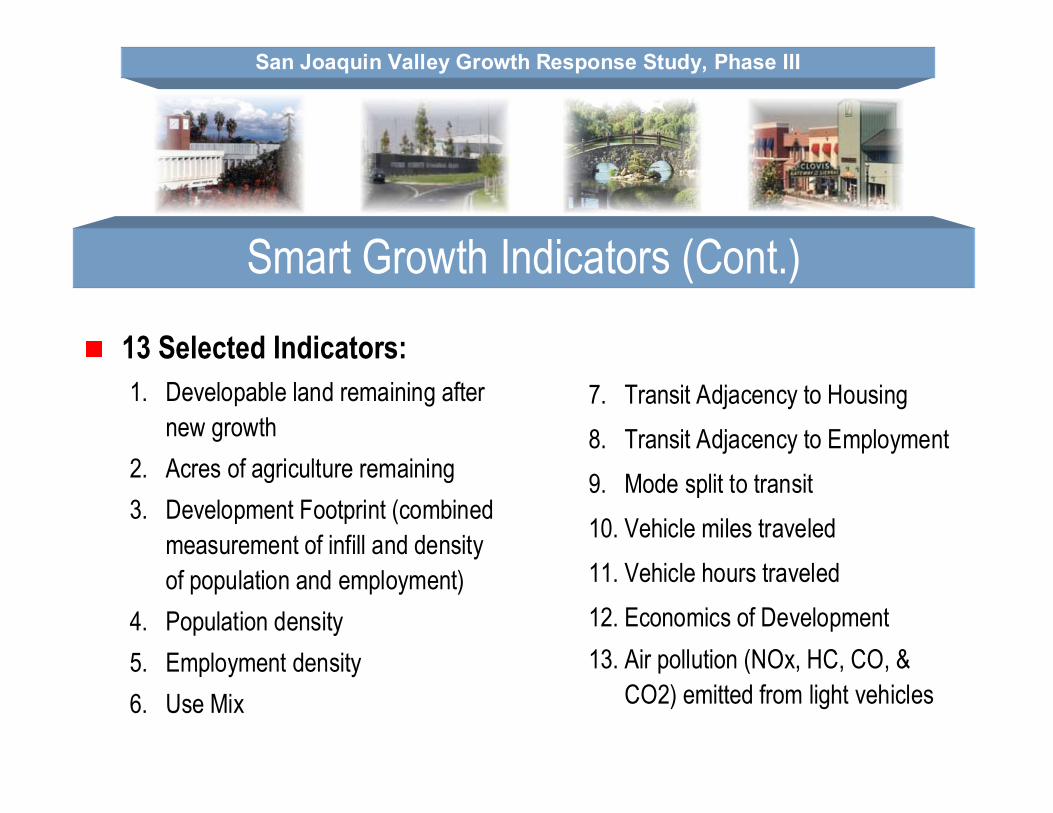
Smart Growth Indicators (Cont.)
13 Selected Indicators:1. Developable land remaining after
new growth2. Acres of agriculture remaining 3. Development Footprint (combined
measurement of infill and density of population and employment)
4. Population density 5. Employment density6. Use Mix
7. Transit Adjacency to Housing 8. Transit Adjacency to Employment 9. Mode split to transit 10. Vehicle miles traveled 11. Vehicle hours traveled 12. Economics of Development13. Air pollution (NOx, HC, CO, &
CO2) emitted from light vehicles
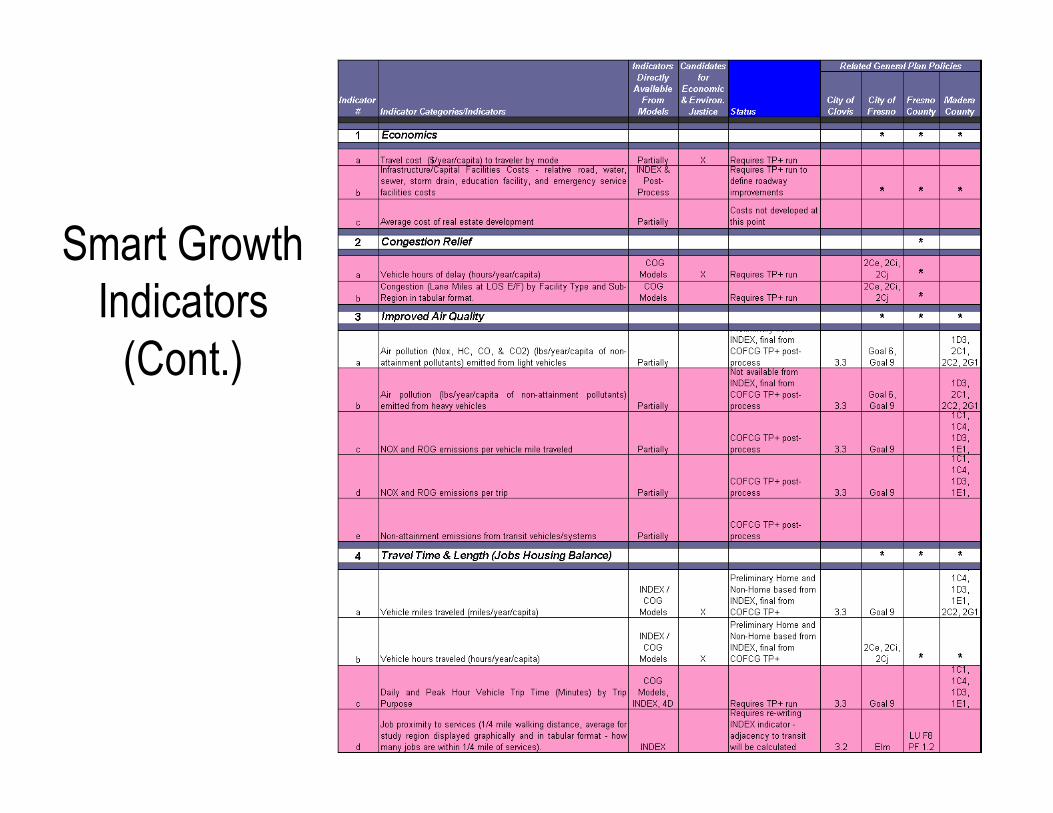
Smart Growth Indicators
(Cont.)

Smart Growth Indicators
(Cont.)
San Joaquin Valley Growth Response Study, Phase III
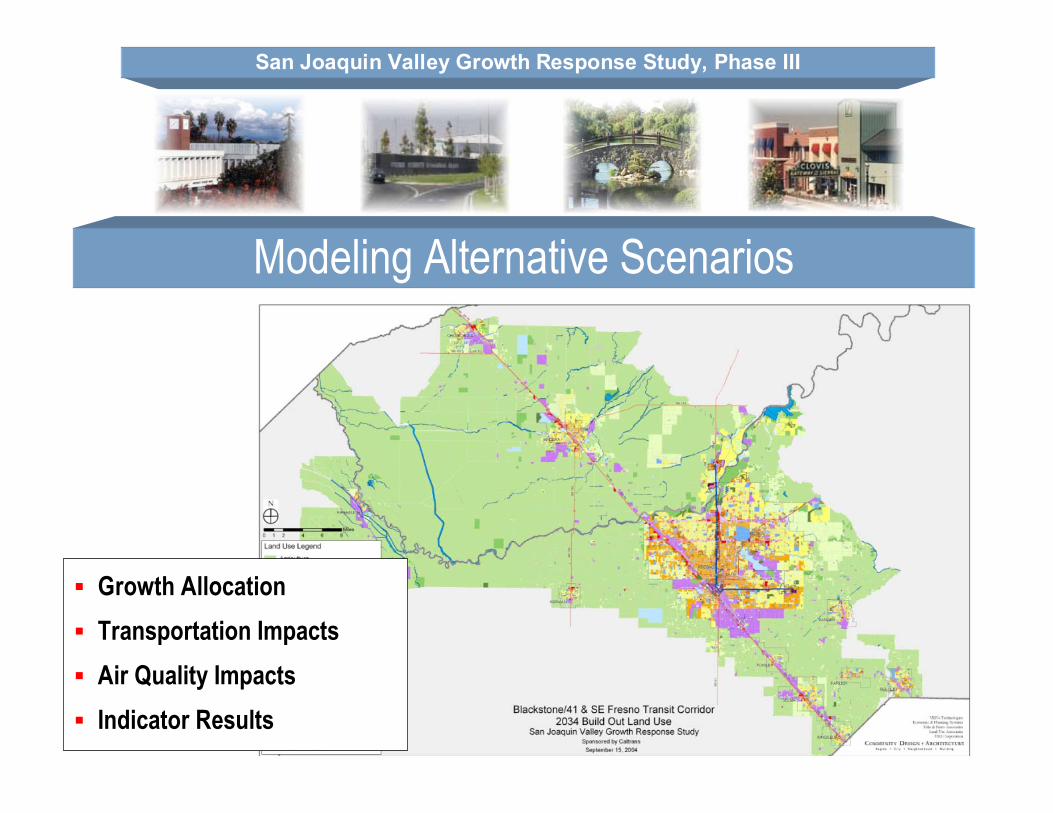
Growth AllocationTransportation ImpactsAir Quality ImpactsIndicator Results
Modeling Alternative Scenarios
San Joaquin Valley Growth Response Study, Phase III
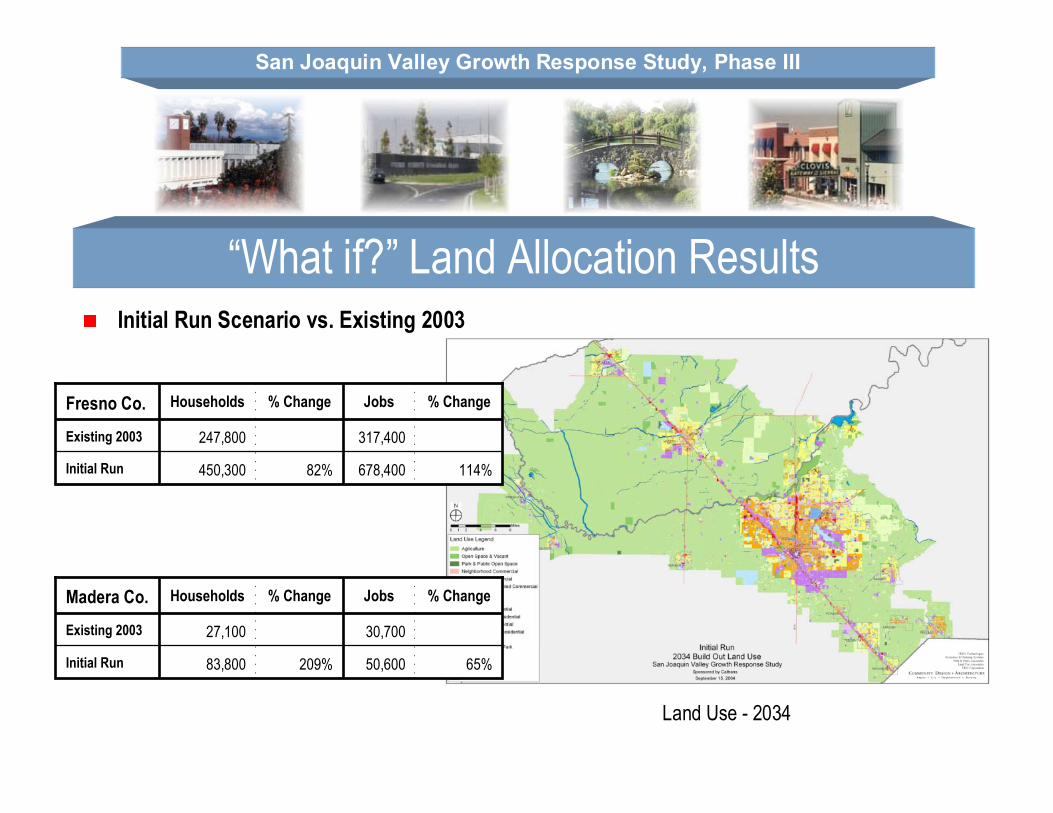
Land Use - 2034
“What if?” Land Allocation ResultsInitial Run Scenario vs. Existing 2003
114%
% Change
678,400
317,400
Jobs
82%450,300Initial Run
247,800Existing 2003
% ChangeHouseholdsFresno Co.
65%
% Change
50,600
30,700
Jobs
209%83,800Initial Run
27,100Existing 2003
% ChangeHouseholdsMadera Co.
San Joaquin Valley Growth Response Study, Phase III
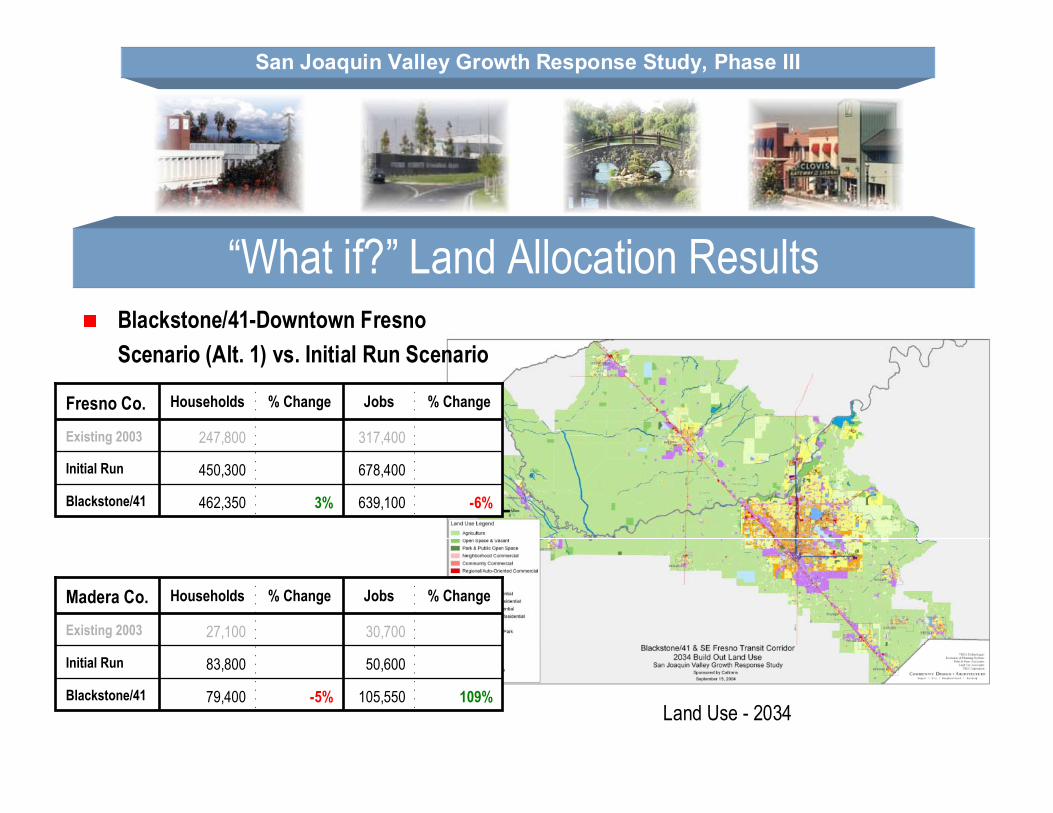
Land Use - 2034
“What if?” Land Allocation ResultsBlackstone/41-Downtown Fresno Scenario (Alt. 1) vs. Initial Run Scenario
-6%
% Change
639,100
678,400
317,400
Jobs
3%462,350Blackstone/41
450,300Initial Run
247,800Existing 2003
% ChangeHouseholdsFresno Co.
109%
% Change
105,550
50,600
30,700
Jobs
-5%79,400Blackstone/41
83,800Initial Run
27,100Existing 2003
% ChangeHouseholdsMadera Co.

San Joaquin Valley Growth Response Study, Phase III
“What if?” Land Allocation ResultsHigh Capacity Transit Network Scenario (Alt. 2) vs. Initial Run Scenario
Land Use - 2034
-8%
-6%
% Change
622,600
639,100
678,400
317,400
Jobs
-2%440,750HCT Network
3%462,350Blackstone/41
450,300Initial Run
247,800Existing 2003
% ChangeHouseholdsFresno Co.
131%
109%
% Change
117,120
105,550
50,600
30,700
Jobs
9%91,650HCT Network
-5%79,400Blackstone/41
83,800Initial Run
27,100Existing 2003
% ChangeHouseholdsMadera Co.

San Joaquin Valley Growth Response Study, Phase III
Developable Land Remaining After New GrowthInitial Run Scenario vs. Existing 2003
-90%7,060Initial Run
70,200Existing
% Change“Developable” Land AreaFresno Co.
-87%4,100Initial Run
32,200Existing
% Change“Developable” Land AreaMadera Co.
Note: “Developable” Land is vacant, rural residential, agriculture, and open space with urban General Plan Designations.

San Joaquin Valley Growth Response Study, Phase III
Developable Land Remaining After New GrowthBlackstone/41-Downtown Fresno Scenario (Alt. 1) vs. Initial Run Scenario
98%14,000Blackstone/41
7,060Initial Run
70,200Existing
% Change“Developable” Land AreaFresno Co.
176%11,300Blackstone/41
4,100Initial Run
32,200Existing
% Change“Developable” Land AreaMadera Co.
Note: “Developable” Land is vacant, rural residential, agriculture, and open space with urban General Plan Designations.
San Joaquin Valley Growth Response Study, Phase III
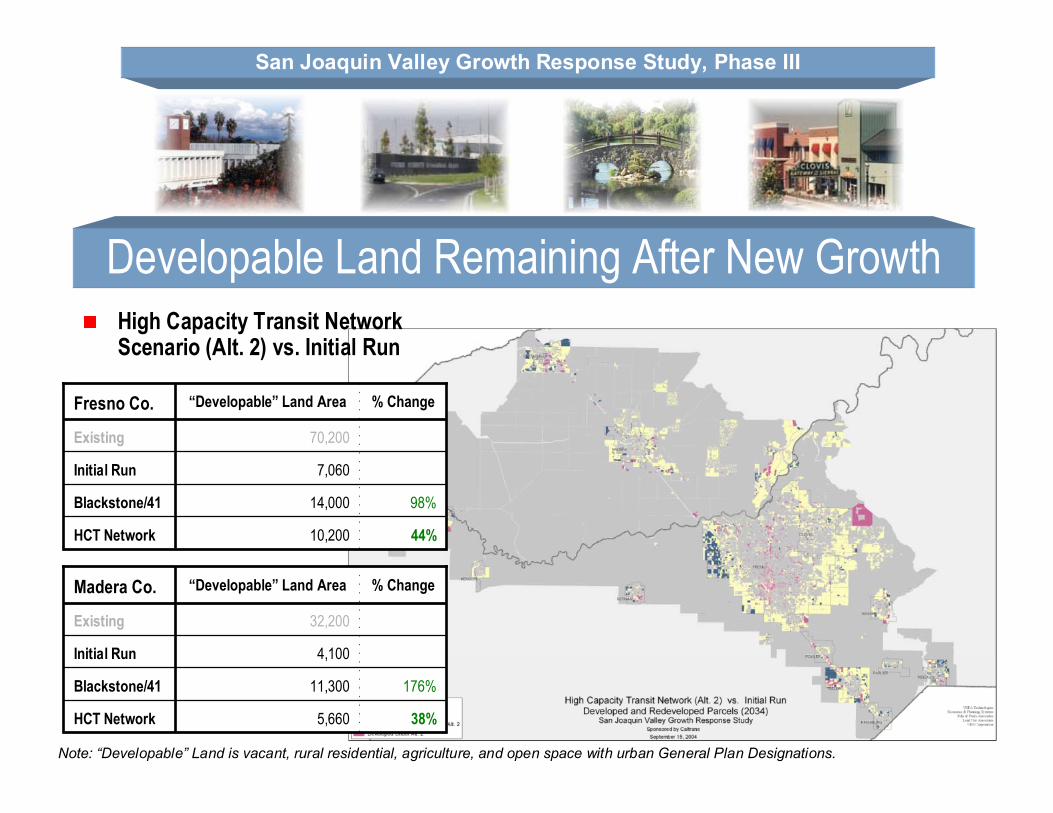
Developable Land Remaining After New GrowthHigh Capacity Transit Network Scenario (Alt. 2) vs. Initial Run
44%10,200HCT Network
98%14,000Blackstone/41
7,060Initial Run
70,200Existing
% Change“Developable” Land AreaFresno Co.
38%5,660HCT Network
176%11,300Blackstone/41
4,100Initial Run
32,200Existing
% Change“Developable” Land AreaMadera Co.
Note: “Developable” Land is vacant, rural residential, agriculture, and open space with urban General Plan Designations.

San Joaquin Valley Growth Response Study, Phase III
Acres of Agriculture Land RemainingAll Scenarios vs. Existing 2003
-7.0%
% Change
634,000
378,500
255,500
2034 Acres
682,000Total Study Area
393,400Madera County
288.600Fresno County
2003 Acres
San Joaquin Valley Growth Response Study, Phase III
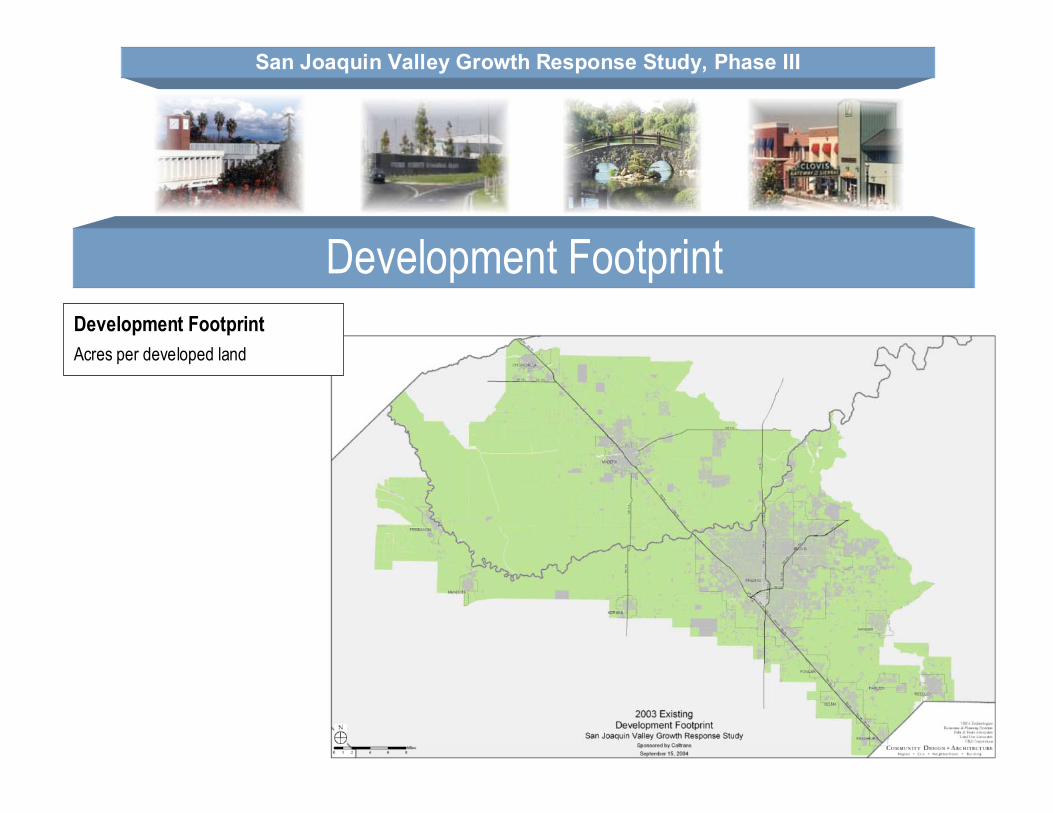
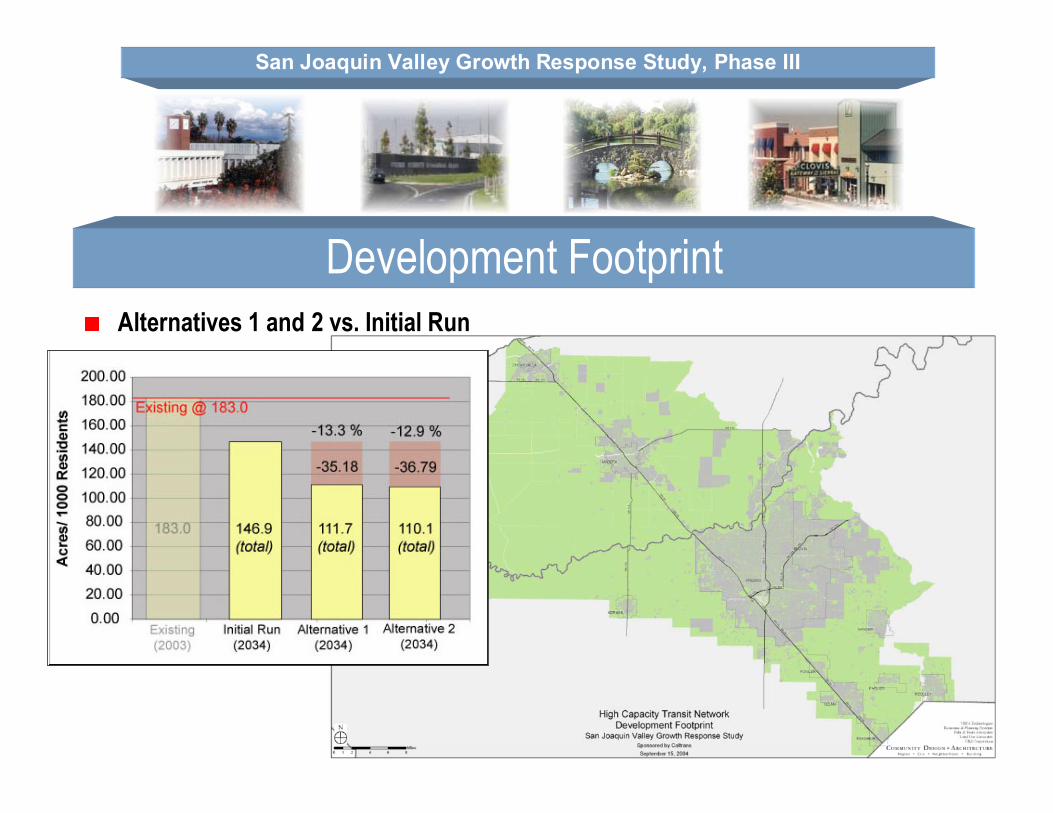
Development FootprintDevelopment FootprintAcres per developed land
San Joaquin Valley Growth Response Study, Phase III
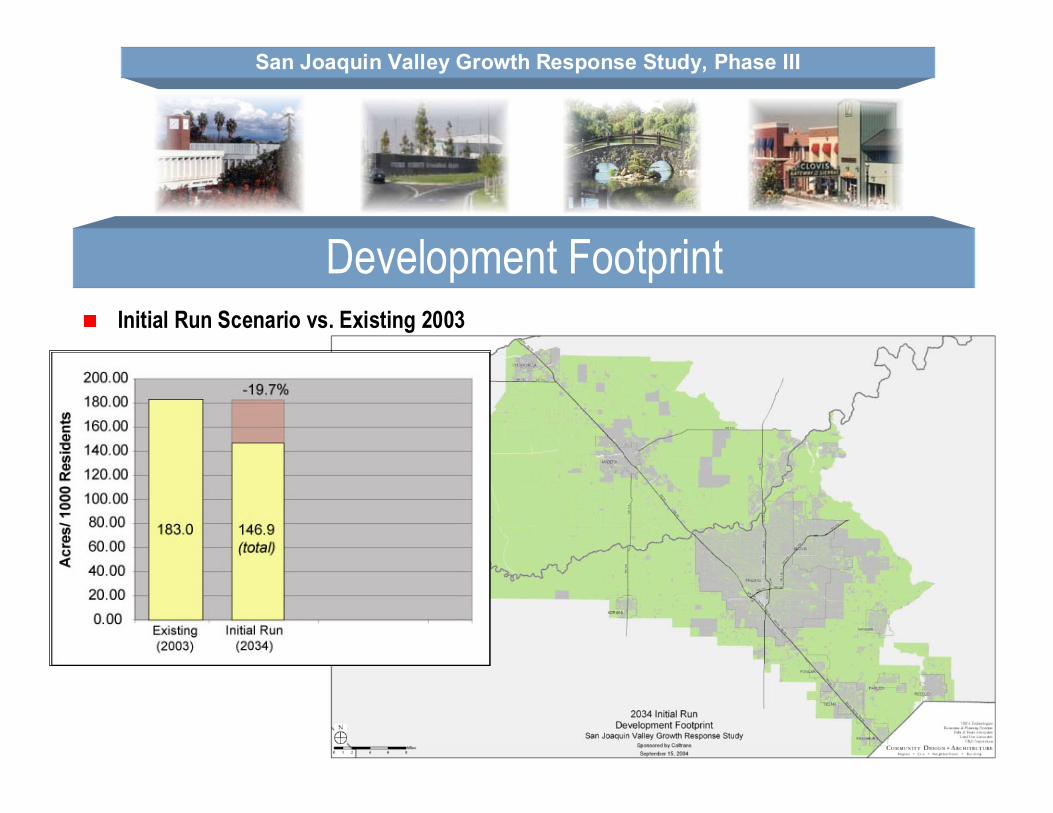
Development FootprintInitial Run Scenario vs. Existing 2003
San Joaquin Valley Growth Response Study, Phase III
Development FootprintAlternatives 1 and 2 vs. Initial Run

San Joaquin Valley Growth Response Study, Phase III
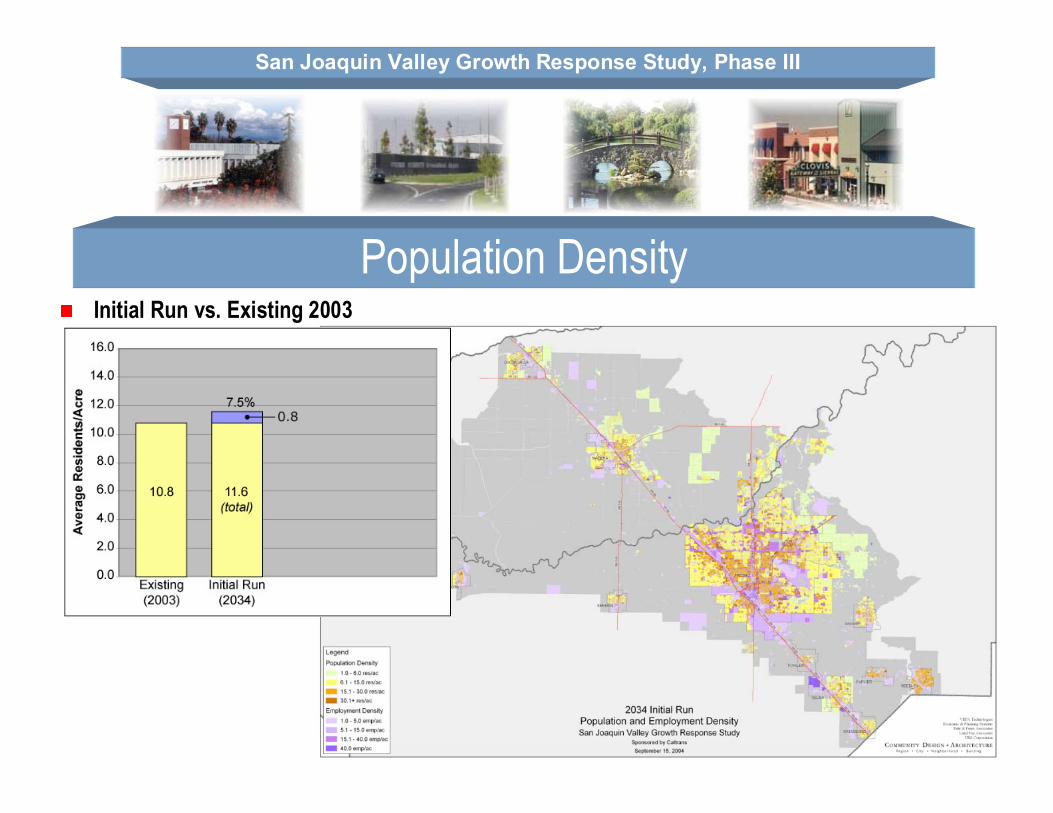
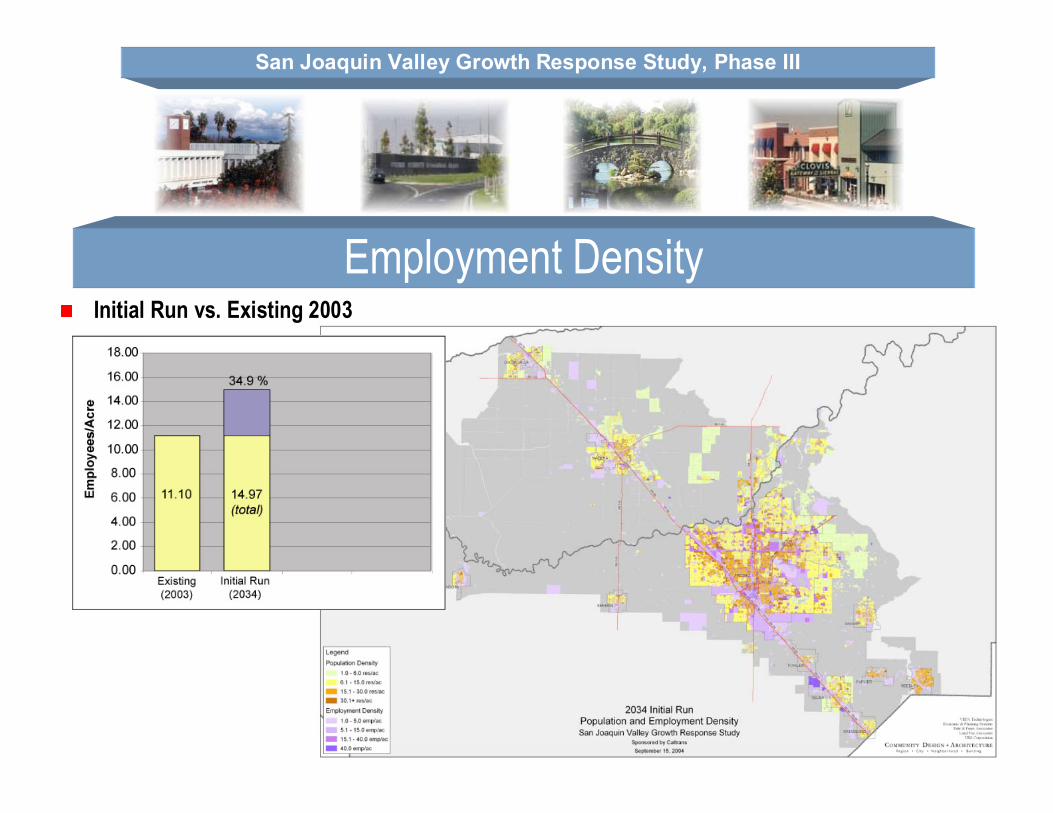
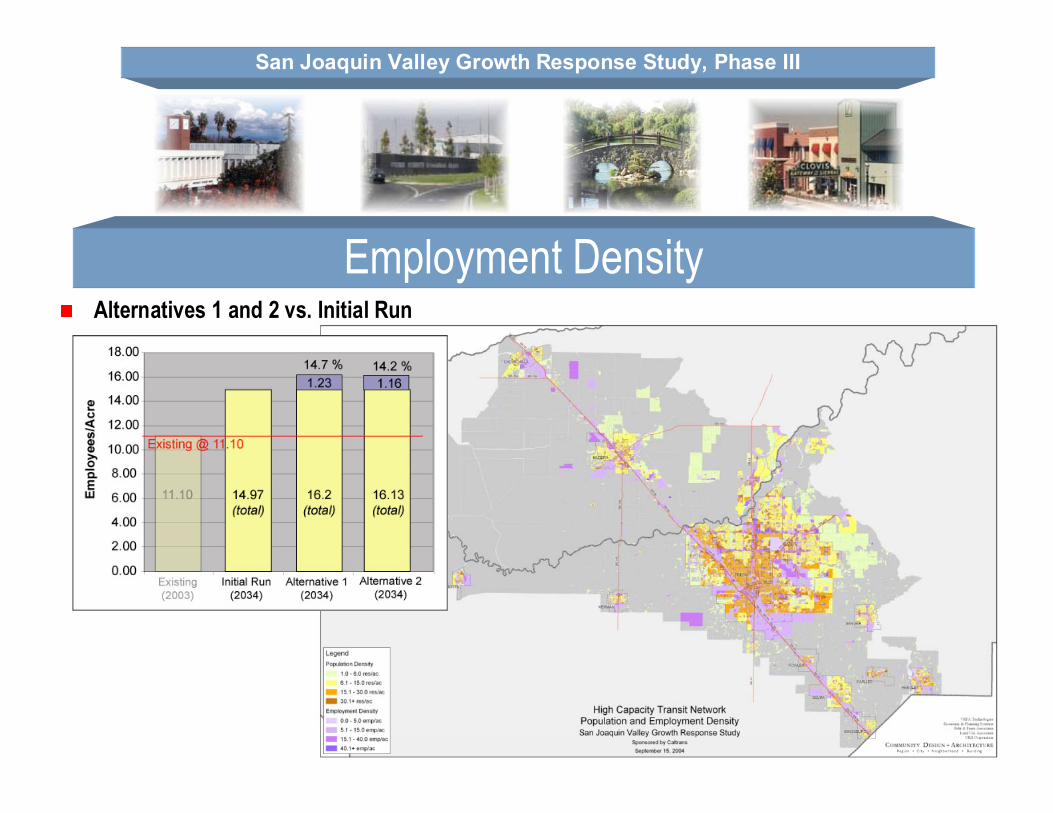
Population and Employment Density
Population and Employment DensityPopulation Density - population per gross developed acre of residential developmentEmployment Density - employees per gross acre of employment use
San Joaquin Valley Growth Response Study, Phase III
Population DensityInitial Run vs. Existing 2003

San Joaquin Valley Growth Response Study, Phase III
Population DensityAlternatives 1 and 2 vs. Initial Run
San Joaquin Valley Growth Response Study, Phase III
Employment DensityInitial Run vs. Existing 2003
San Joaquin Valley Growth Response Study, Phase III
Employment DensityAlternatives 1 and 2 vs. Initial Run

San Joaquin Valley Growth Response Study, Phase III
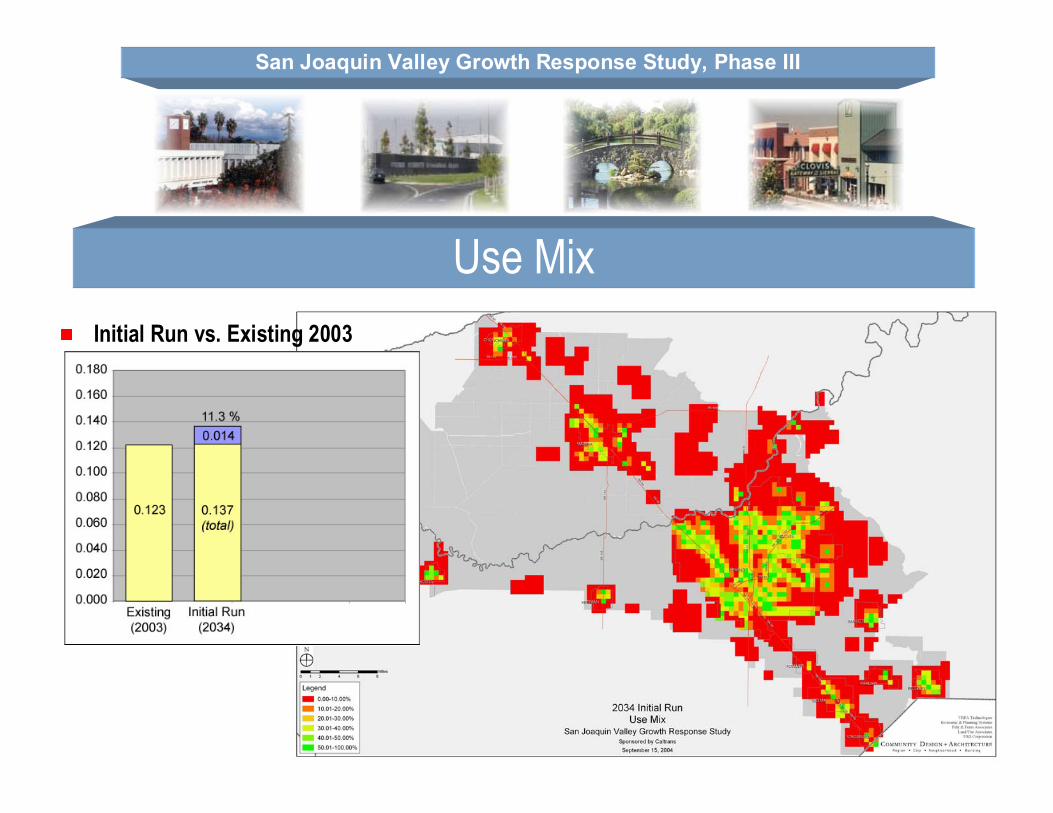
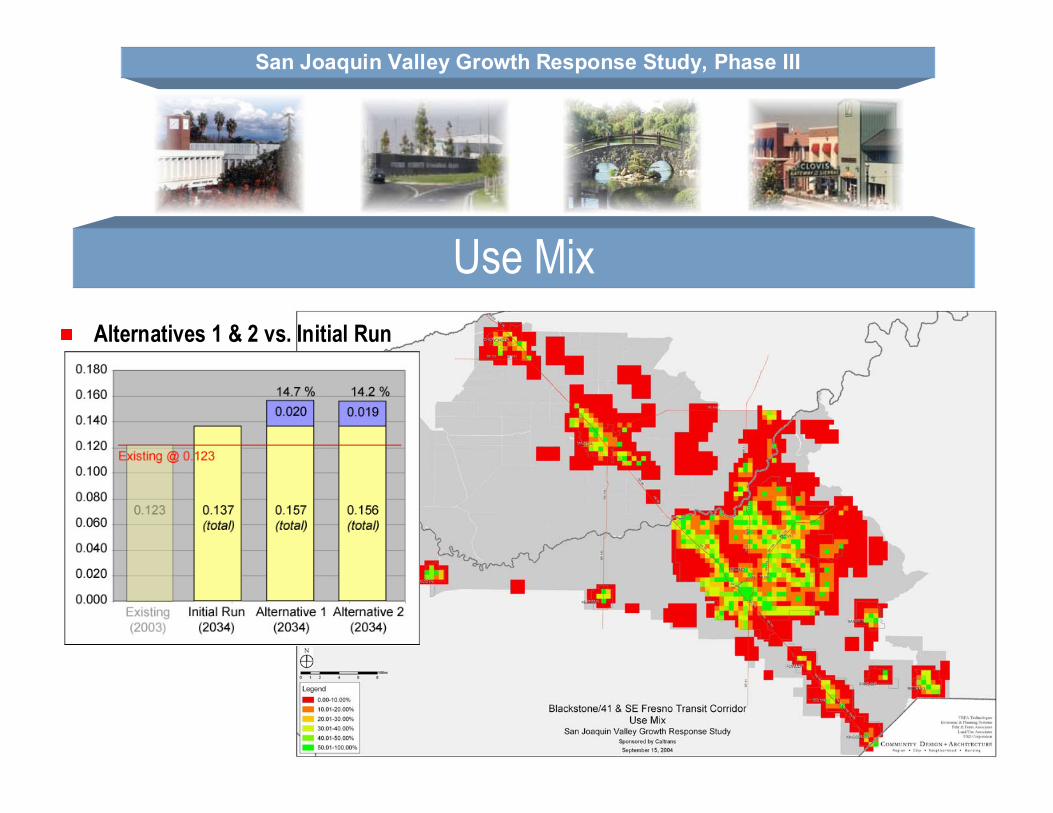
Use Mix
Use MixMix of land uses within a 1/4-mile grid
San Joaquin Valley Growth Response Study, Phase III
Use MixInitial Run vs. Existing 2003
San Joaquin Valley Growth Response Study, Phase III
Use MixAlternatives 1 & 2 vs. Initial Run

San Joaquin Valley Growth Response Study, Phase III
Use MixAlternatives 1 & 2 vs. Initial Run

San Joaquin Valley Growth Response Study, Phase III
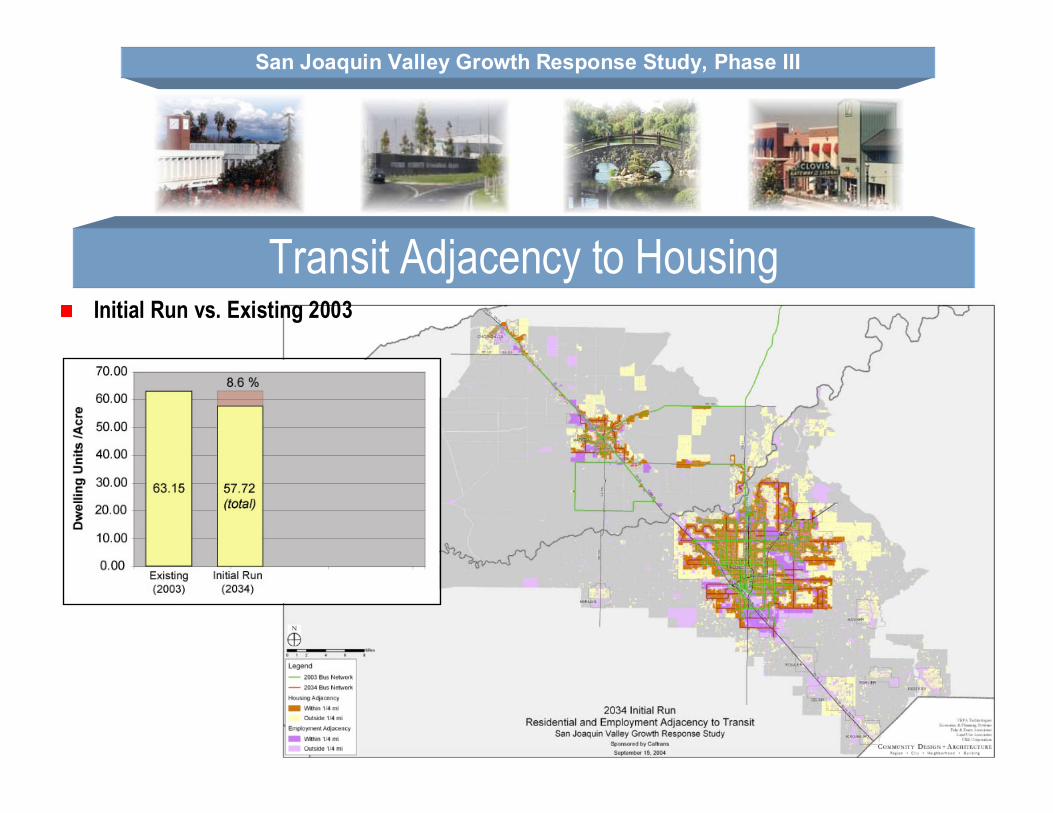
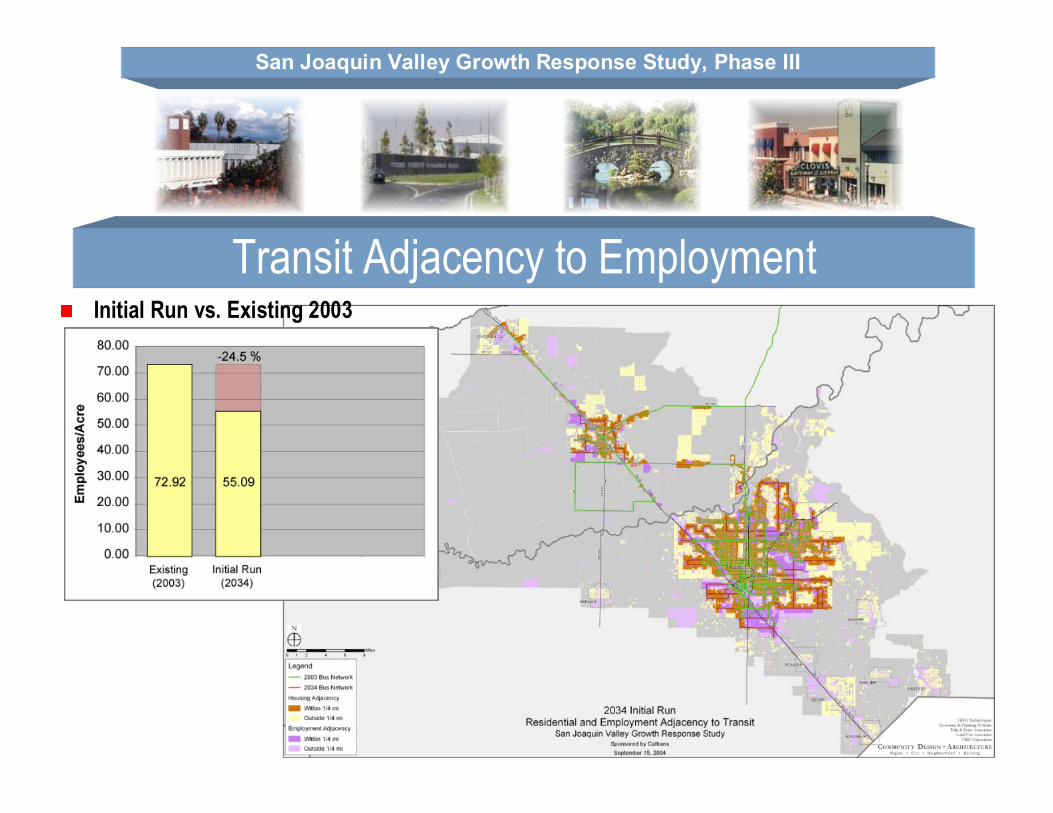
Housing & Employment Adjacency to Transit
Housing & Employment Adjacency to Transit
Percent of households and jobs within 1/4 mile of a transit line
San Joaquin Valley Growth Response Study, Phase III
Transit Adjacency to HousingInitial Run vs. Existing 2003

San Joaquin Valley Growth Response Study, Phase III
Transit Adjacency to HousingAlternatives 1 and 2 vs. Initial Run
San Joaquin Valley Growth Response Study, Phase III
Transit Adjacency to EmploymentInitial Run vs. Existing 2003

San Joaquin Valley Growth Response Study, Phase III
Transit Adjacency to EmploymentAlternatives 1 and 2 vs. Initial Run

San Joaquin Valley Growth Response Study, Phase III
Transportation Indicators
Each Scenario was compared in terms of:Vehicle Trips (VT)Vehicle Miles Traveled (VMT)Roadway SpeedsMode Split
San Joaquin Valley Growth Response Study, Phase III
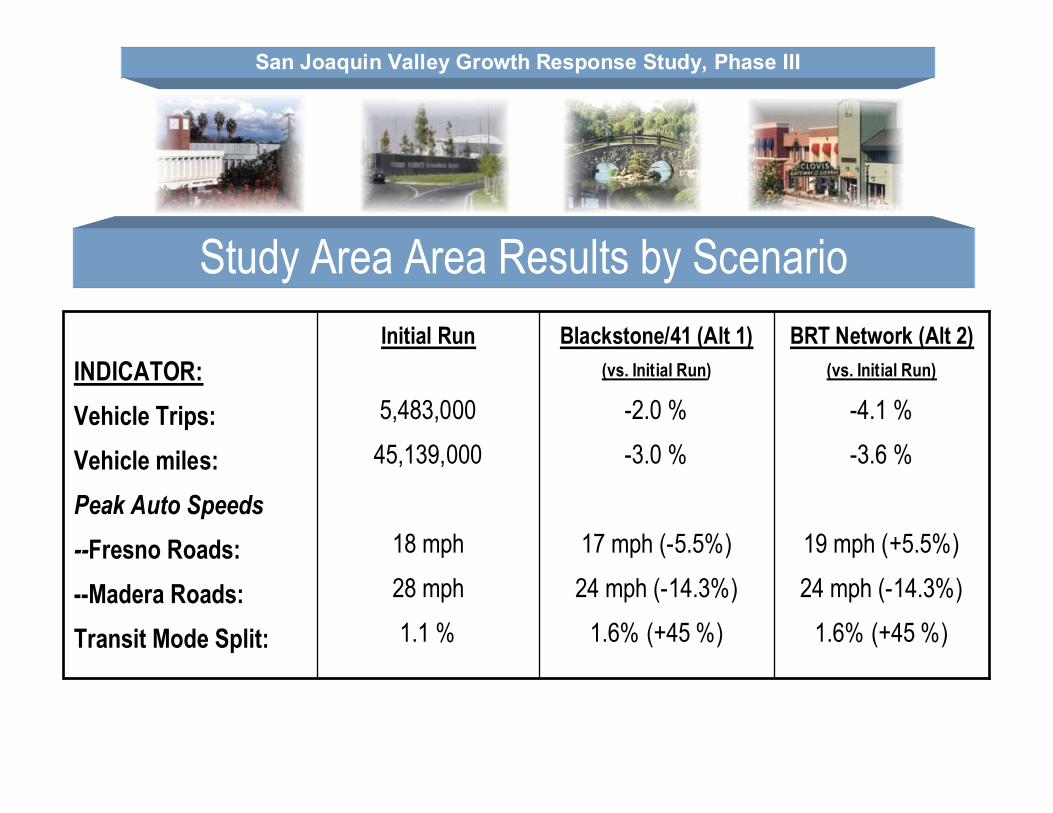
Study Area Area Results by ScenarioBRT Network (Alt 2)
(vs. Initial Run)
-4.1 %-3.6 %
19 mph (+5.5%)24 mph (-14.3%)
1.6% (+45 %)
Blackstone/41 (Alt 1)(vs. Initial Run)
-2.0 %-3.0 %
17 mph (-5.5%)24 mph (-14.3%)
1.6% (+45 %)
Initial Run
5,483,00045,139,000
18 mph28 mph1.1 %
INDICATOR:Vehicle Trips:Vehicle miles:Peak Auto Speeds--Fresno Roads:--Madera Roads:Transit Mode Split:
San Joaquin Valley Growth Response Study, Phase III
Interpreting the Bridge Constraint
Bay Bridge Congestion Levels In Fresno-Madera!?!Land Use is better balanced, but trip generation is higher in SR 41 Corridor (+65%, nearly half a million new vehicle trips under Alt. 1)Model shows auto still the most convenient mode despite speeds of under 10 mph in the morning and afternoon peak periods.Model projected Trans-Bridge Transit Mode Split of 5-7% may be low
Similar to 2020 transit mode split projection for Altamont PassMaximum likely split ~ 15% (midpoint of projected Altamont Pass and current Caldecott Tunnel transit shares)

San Joaquin Valley Growth Response Study, Phase III
TP+ and 4Ds
Summary Results:Most indicators are going in the expected direction: overall vehicle trips and vmt are down; transit ridership increases
Slower speeds in Madera County due to more development
Non-residential uses add more attraction trip ends (demand) in intensification zones than the residential uses added on the production end
Keeping employment and population levels at approximately the same for all alternatives has unintended effects

San Joaquin Valley Growth Response Study, Phase III
TP+ and 4Ds (Cont.)
Summary Results:Blackstone/41 (Alternative 1) Scenario - The concentration of intensification zones in the SR 41 corridor increases opportunities to walk and use transit, but also increases vehicular traffic and congestion in this corridor.
BRT Network (Alternative 2) Scenario - Wider dispersal of intensification zones in SR 41 corridor reduces vehicular traffic and congestion in the intensification areas.
San Joaquin Valley Growth Response Study, Phase III
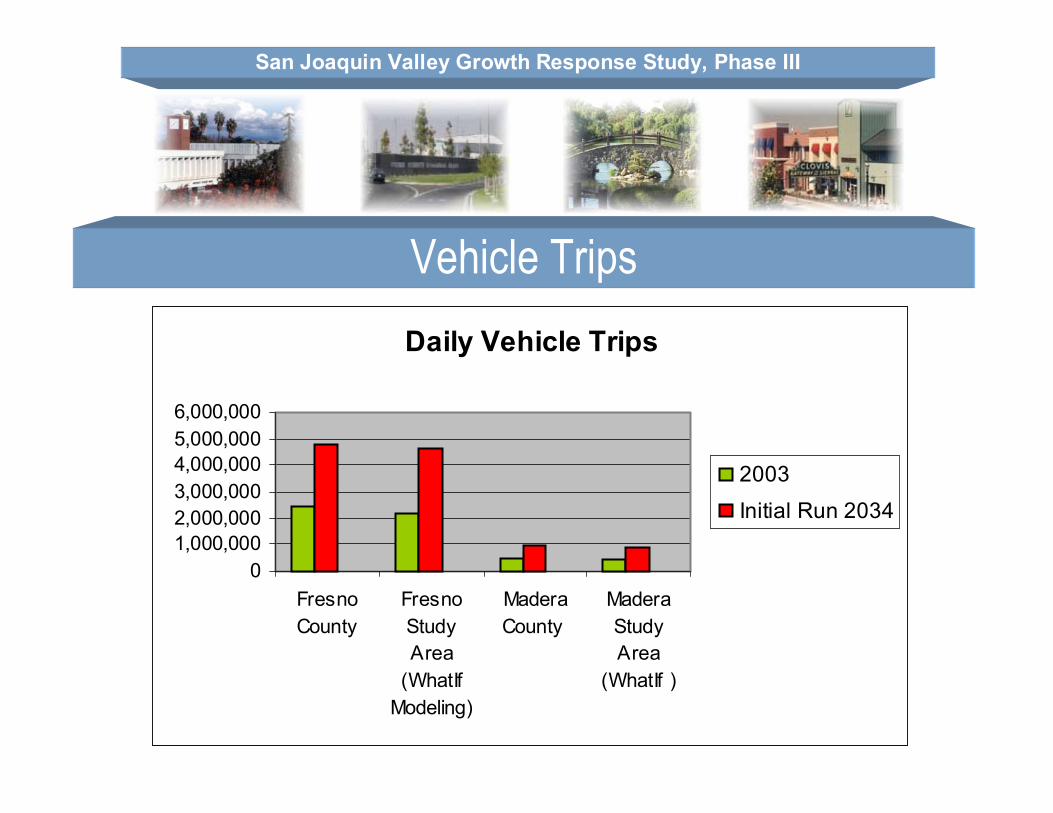
Vehicle TripsDaily Vehicle Trips
01,000,0002,000,0003,000,0004,000,0005,000,0006,000,000
FresnoCounty
FresnoStudyArea
(WhatIfModeling)
MaderaCounty
MaderaStudyArea
(WhatIf )
2003Initial Run 2034

San Joaquin Valley Growth Response Study, Phase III
Vehicle Trips (Cont.)
Daily Vehicle Trips
01,000,0002,000,0003,000,0004,000,0005,000,0006,000,000
Fres
noCo
unty
Fres
no S
tudy
Are
a (W
hatIf
Mod
elin
g)
Fres
noIn
tens
ifica
tion
Are
a
Mad
era
Coun
ty
Mad
era
Stud
yA
rea
(Wha
tIfM
odel
ing)
Initial RunAlternative 1Alternative 2
San Joaquin Valley Growth Response Study, Phase III
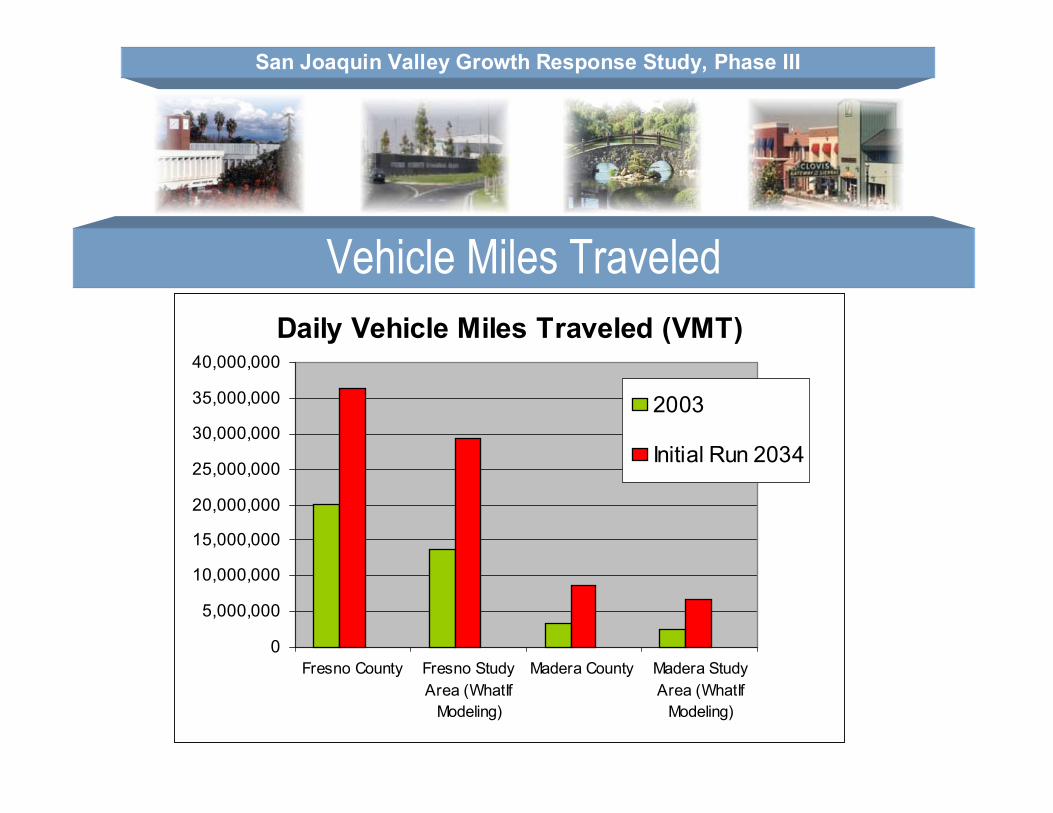
Vehicle Miles Traveled Daily Vehicle Miles Traveled (VMT)
0
5,000,000
10,000,000
15,000,000
20,000,000
25,000,000
30,000,000
35,000,000
40,000,000
Fresno County Fresno StudyArea (WhatIf
Modeling)
Madera County Madera StudyArea (WhatIf
Modeling)
2003
Initial Run 2034
San Joaquin Valley Growth Response Study, Phase III
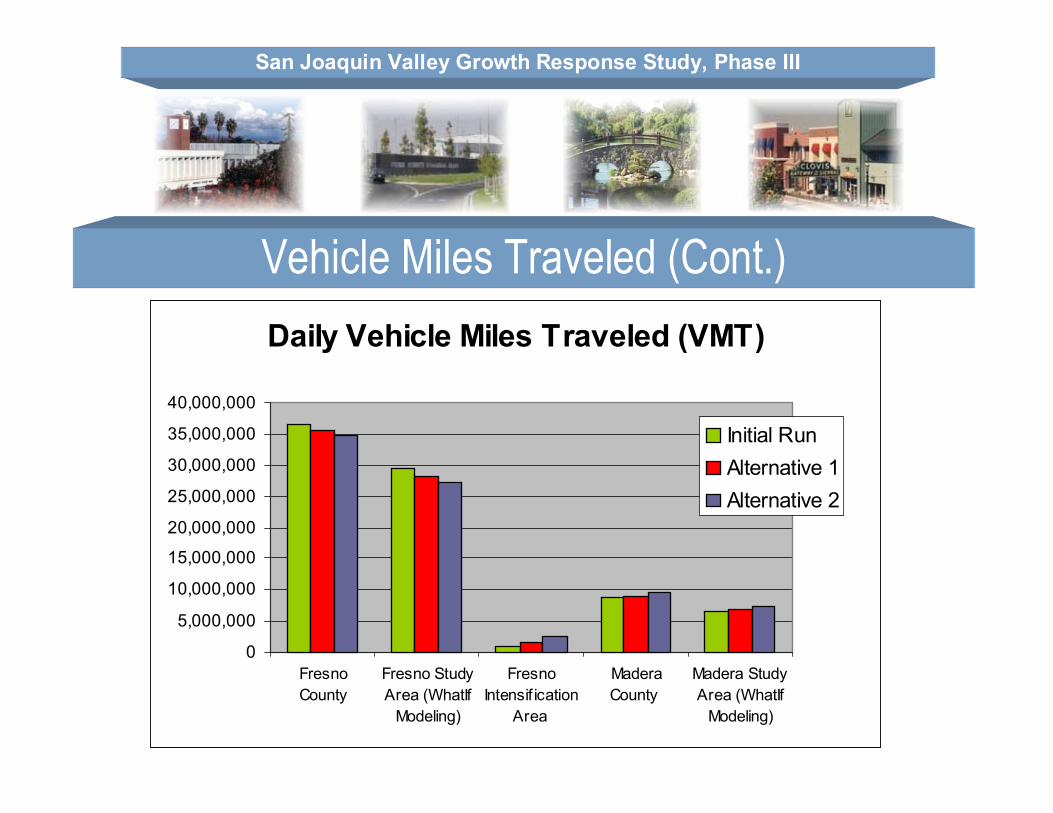
Vehicle Miles Traveled (Cont.)Daily Vehicle Miles Traveled (VMT)
0
5,000,000
10,000,000
15,000,000
20,000,000
25,000,000
30,000,000
35,000,000
40,000,000
FresnoCounty
Fresno StudyArea (WhatIf
Modeling)
FresnoIntensif ication
Area
MaderaCounty
Madera StudyArea (WhatIf
Modeling)
Initial RunAlternative 1Alternative 2
San Joaquin Valley Growth Response Study, Phase III
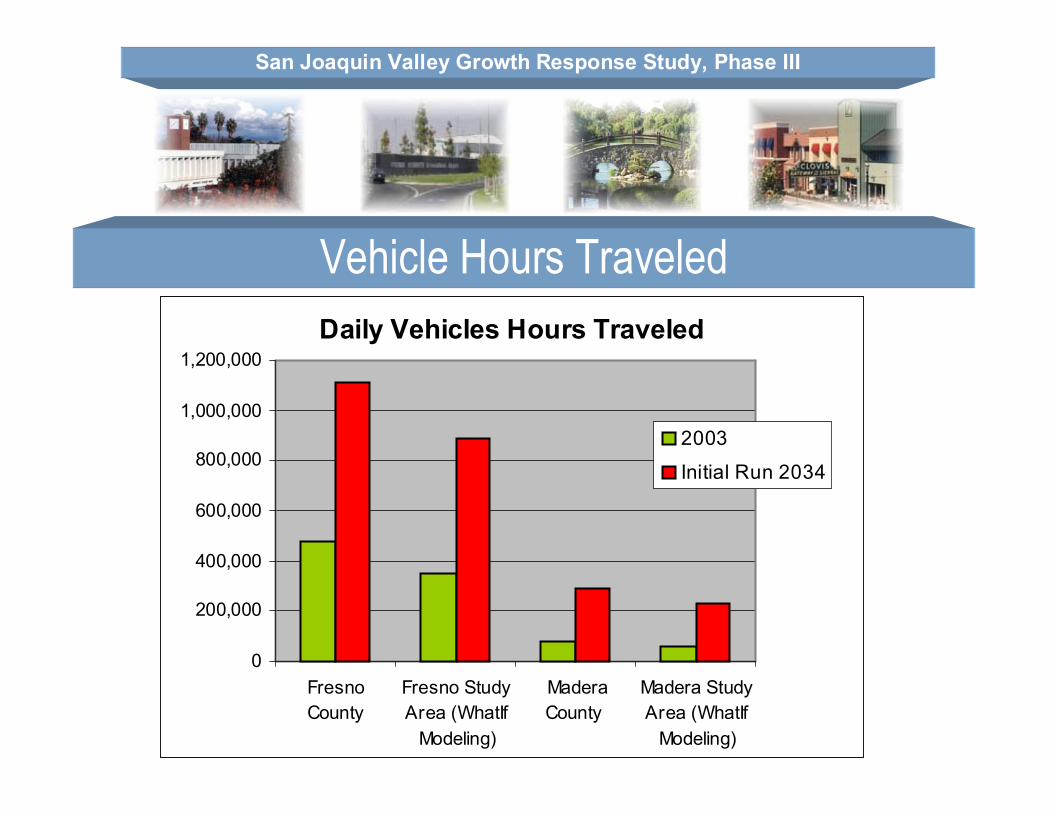
Vehicle Hours TraveledDaily Vehicles Hours Traveled
0
200,000
400,000
600,000
800,000
1,000,000
1,200,000
FresnoCounty
Fresno StudyArea (WhatIf
Modeling)
MaderaCounty
Madera StudyArea (WhatIf
Modeling)
2003Initial Run 2034
San Joaquin Valley Growth Response Study, Phase III
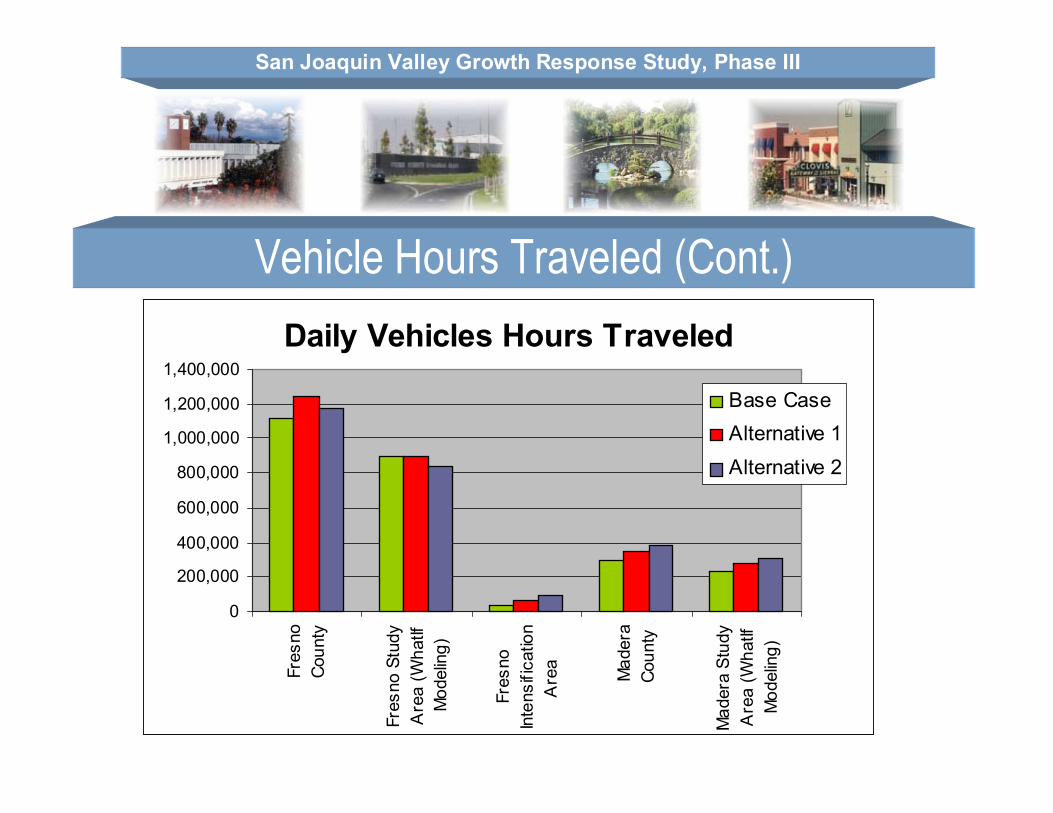
Vehicle Hours Traveled (Cont.)Daily Vehicles Hours Traveled
0
200,000
400,000
600,000
800,000
1,000,000
1,200,000
1,400,000
Fres
noCo
unty
Fres
no S
tudy
Are
a (W
hatIf
Mod
elin
g)
Fres
noIn
tens
ifica
tion
Are
a
Mad
era
Coun
ty
Mad
era
Stud
yA
rea
(Wha
tIfM
odel
ing)
Base CaseAlternative 1Alternative 2
San Joaquin Valley Growth Response Study, Phase III
Economic Indicators
Daily Transportation CostsRelative Infrastructure CostsReal Estate Development Costs
San Joaquin Valley Growth Response Study, Phase III
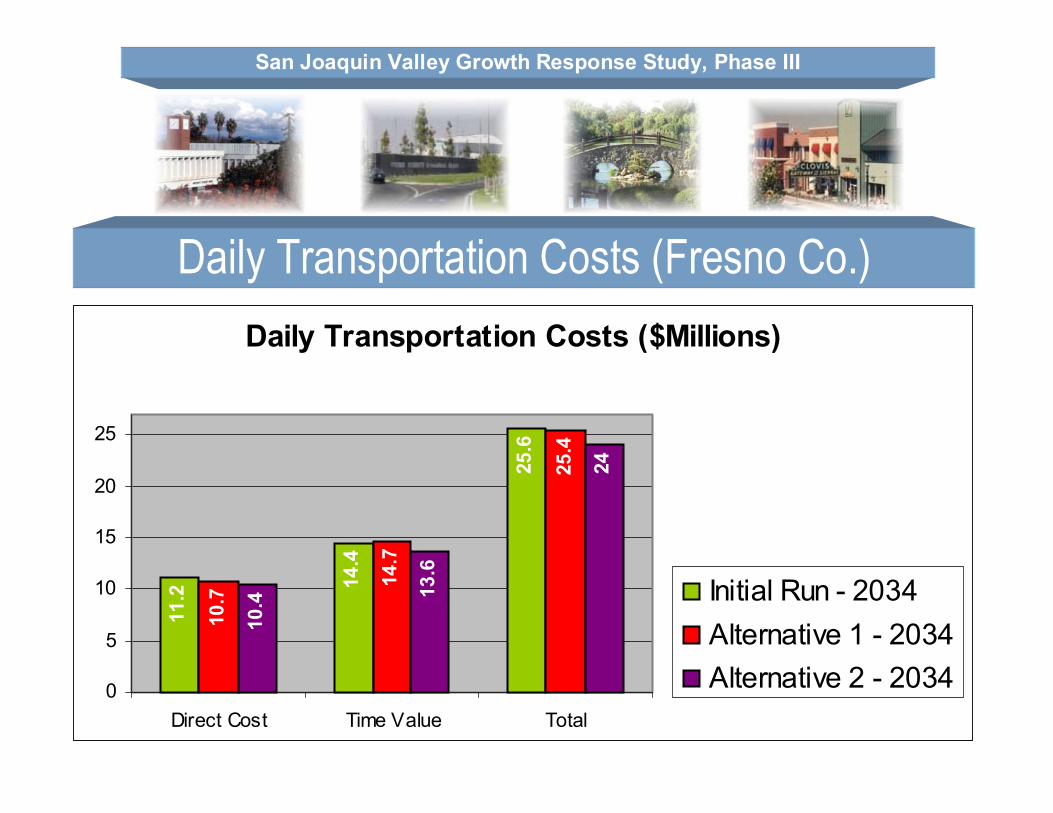
Daily Transportation Costs (Fresno Co.)Daily Transportation Costs ($Millions)
11.2 14
.4
25.6
10.7
14.7
25.4
10.4 13
.6
24
0
5
10
15
20
25
Direct Cost Time Value Total
Initial Run - 2034Alternative 1 - 2034Alternative 2 - 2034

San Joaquin Valley Growth Response Study, Phase III
Relative Infrastructure Costs (Study Area)Relative Infrastructure Costs - Study Area
100%
100%
100%
93%
96%
92%
97% 98
%
97%
88%
90%
92%
94%
96%
98%
100%
Water/Sew er Storm Drain Roads
Initial Run - 2034Alternative 1 - 2034Alternative 2 - 2034
San Joaquin Valley Growth Response Study, Phase III
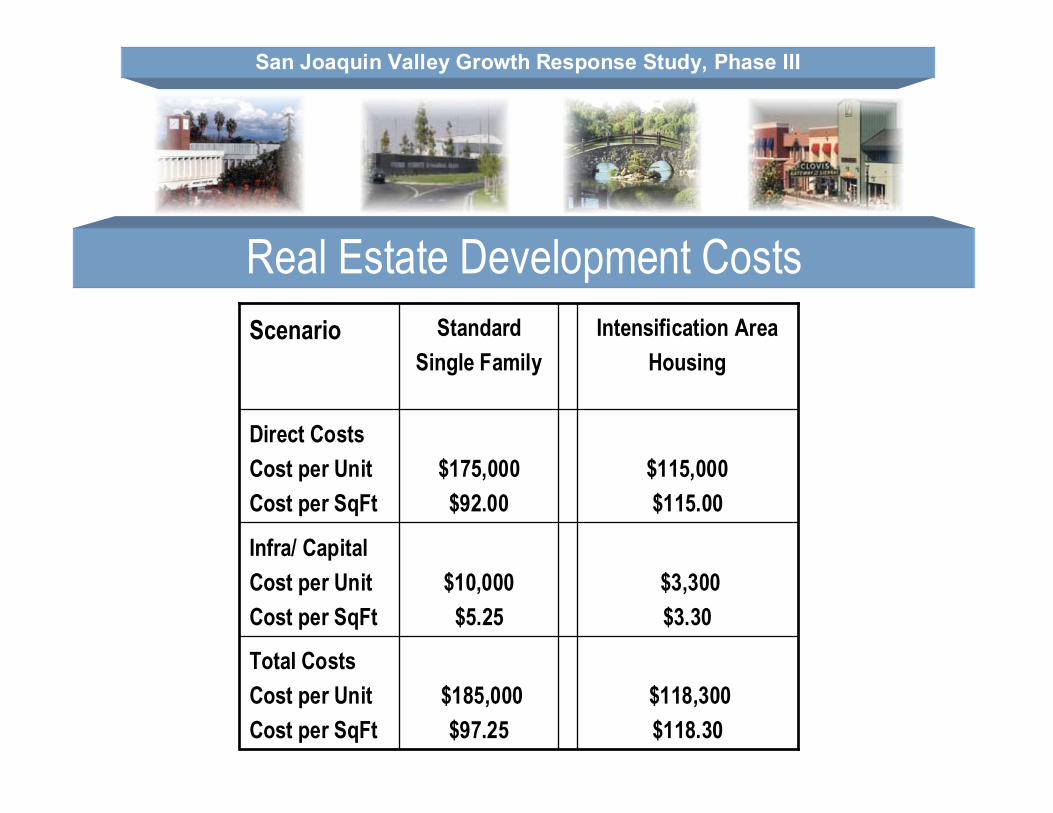
Real Estate Development Costs
$118,300$118.30
$185,000$97.25
Total CostsCost per UnitCost per SqFt
$3,300$3.30
$10,000$5.25
Infra/ Capital Cost per UnitCost per SqFt
$115,000$115.00
$175,000$92.00
Direct CostsCost per UnitCost per SqFt
Intensification Area Housing
Standard Single Family
Scenario
San Joaquin Valley Growth Response Study, Phase III
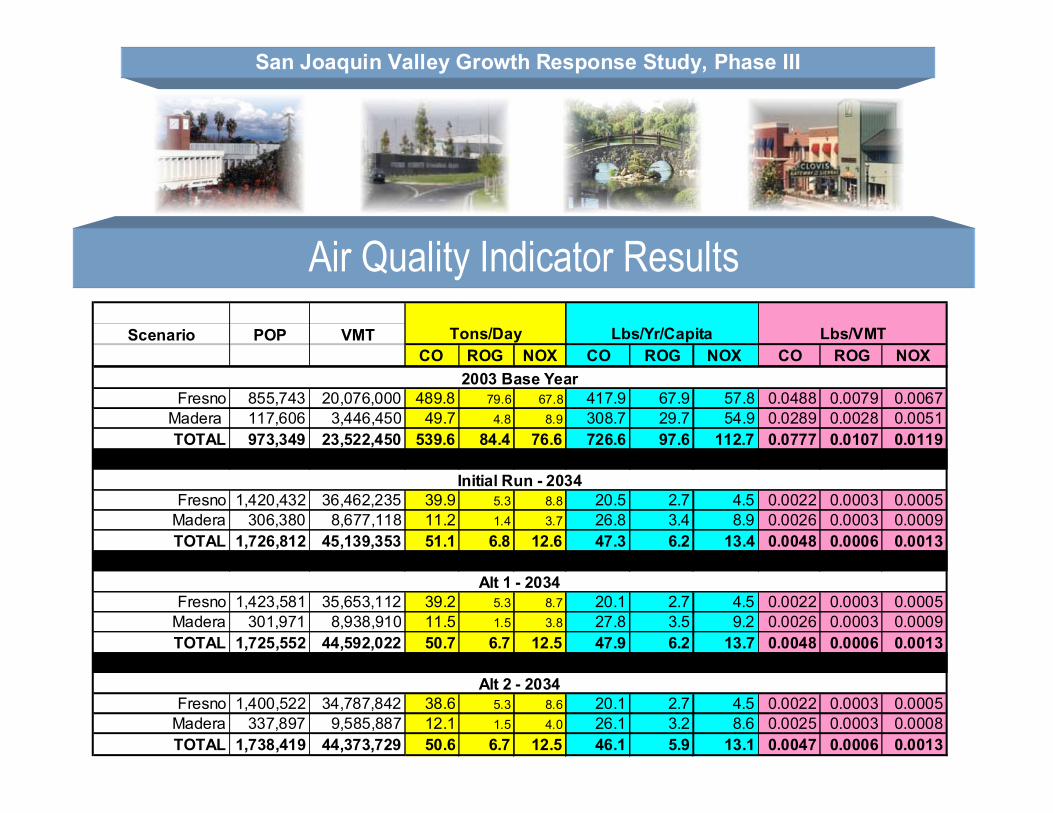
Air Quality Indicator Results
Scenario POP VMTCO ROG NOX CO ROG NOX CO ROG NOX
Fresno 855,743 20,076,000 489.8 79.6 67.8 417.9 67.9 57.8 0.0488 0.0079 0.0067Madera 117,606 3,446,450 49.7 4.8 8.9 308.7 29.7 54.9 0.0289 0.0028 0.0051TOTAL 973,349 23,522,450 539.6 84.4 76.6 726.6 97.6 112.7 0.0777 0.0107 0.0119
Fresno 1,420,432 36,462,235 39.9 5.3 8.8 20.5 2.7 4.5 0.0022 0.0003 0.0005Madera 306,380 8,677,118 11.2 1.4 3.7 26.8 3.4 8.9 0.0026 0.0003 0.0009TOTAL 1,726,812 45,139,353 51.1 6.8 12.6 47.3 6.2 13.4 0.0048 0.0006 0.0013
Fresno 1,423,581 35,653,112 39.2 5.3 8.7 20.1 2.7 4.5 0.0022 0.0003 0.0005Madera 301,971 8,938,910 11.5 1.5 3.8 27.8 3.5 9.2 0.0026 0.0003 0.0009TOTAL 1,725,552 44,592,022 50.7 6.7 12.5 47.9 6.2 13.7 0.0048 0.0006 0.0013
Fresno 1,400,522 34,787,842 38.6 5.3 8.6 20.1 2.7 4.5 0.0022 0.0003 0.0005Madera 337,897 9,585,887 12.1 1.5 4.0 26.1 3.2 8.6 0.0025 0.0003 0.0008TOTAL 1,738,419 44,373,729 50.6 6.7 12.5 46.1 5.9 13.1 0.0047 0.0006 0.0013
Alt 1 - 2034
Alt 2 - 2034
Lbs/VMTLbs/Yr/CapitaTons/Day
2003 Base Year
Initial Run - 2034
San Joaquin Valley Growth Response Study, Phase III
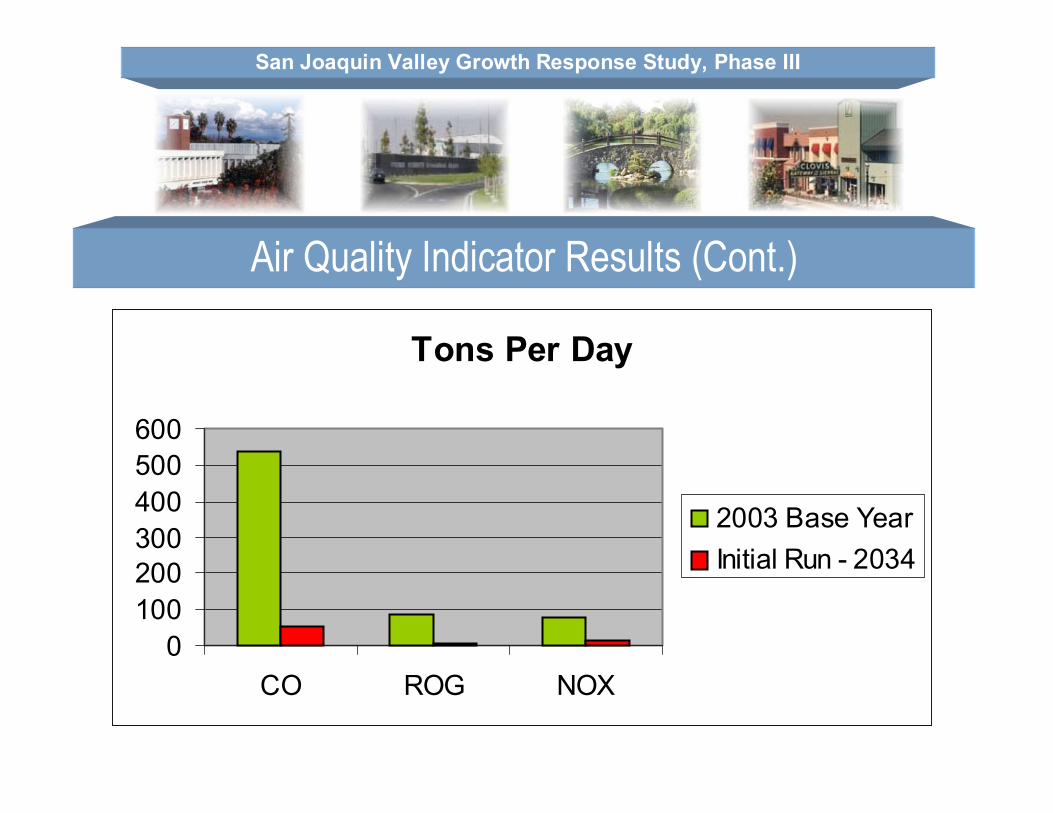
Air Quality Indicator Results (Cont.)
Tons Per Day
0100200300400500600
CO ROG NOX
2003 Base YearInitial Run - 2034

San Joaquin Valley Growth Response Study, Phase III
Air Quality Indicator Results (Cont.)
Carbon Monoxide (CO)Pounds / Year / Capita
47.3 47
.9
46.1
4546474849
Initial Run - 2034 Alt 1 - 2034 Alt 2 - 2034
San Joaquin Valley Growth Response Study, Phase III
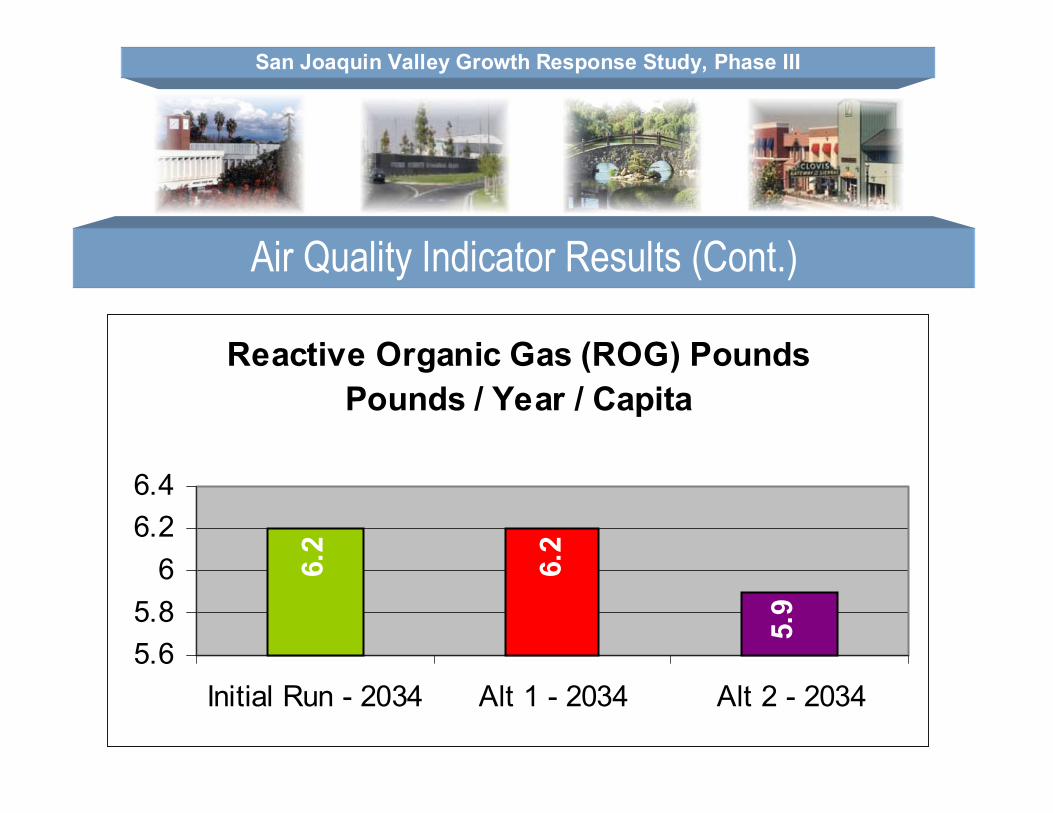
Air Quality Indicator Results (Cont.)
Reactive Organic Gas (ROG) Pounds Pounds / Year / Capita
6.2
6.2
5.9
5.65.8
66.26.4
Initial Run - 2034 Alt 1 - 2034 Alt 2 - 2034

San Joaquin Valley Growth Response Study, Phase III
Air Quality Indicator Results (Cont.)
Oxides of Nitrogen (NOX)Pounds / Year / Capita
13.4
13.7
13.1
12.813
13.213.413.613.8
Initial Run - 2034 Alt 1 - 2034 Alt 2 - 2034
San Joaquin Valley Growth Response Study, Phase III
Model BenefitsModeling tools provide a new level of analysis that can better inform land use and transportation decisions
Allow stakeholders to evaluate growth scenarios at a large scale both visually and statistically with results that are not overly technicalNew indicators can be evaluated more easilyINDEX provides input to 4-D process improving standard transportation models
Modeling tools encourage comprehensive and integrated planning approachTranslation of land use policy to model inputs is more directInput requirements encourage more clarity in land use policies Require higher-level of interaction between land use and transportation planners
San Joaquin Valley Growth Response Study, Phase III
Next Steps to Model Refinement
Modeling tools and data inputs need further refinementWhat If? and INDEX are new tools that are continuing to be developed and refined, similarly to early transportation modeling tools
Region and jurisdictions need to continue commitment to refining GIS dataWill help future use of What If? and INDEXWill be helpful as transportation modeling practices shift to GIS-based modeling packages
Bring land use designations into “alignment”Similar employment and residential densities from jurisdiction to jurisdictionProvide more clarity in capacity for mixed-use designationsVerify employment densities
San Joaquin Valley Growth Response Study, Phase III
Potential Application of ToolsTest Additional Alternatives
Increase employment and services in Madera County?Refine transit corridors to better link growing employment areas to denser residential neighborhoods?Increase employment densities to reflect market and transition some employment designations to housing and services?
Possible Next Applications:Caltrans SR 41 Corridor Study – City of Fresno and Caltrans to undertake a micro scale analysis using the Tool Box City of Fresno General Plan Implementation Program – Activity Center AnalysisDowntown Fresno Transportation StudyPublic Transportation Infrastructure Study (PTIS)
San Joaquin Valley Growth Response Study, Phase III
Your Modeling Ideas
What would you like to see these tools used for –Additional micro-scale analysis of new developments?Test additional alternative scenarios at the “regional” level?To test the RTP and other Circulation Plans and Studies?Assess residential access to services?
San Joaquin Valley Growth Response Study, Phase III
Closing
Thank you for attending and participating!
For additional information contact:Georgiena Vivian at (559) 259-9257 or [email protected] Site: www.vrpatechnologies.comThe Phase III Report will be available in NovemberWeb Site: www.dot.ca.gov/dist6/projects.htm
The “Tool Box” will be housed at Fresno COG and at the Madera County Transportation Commission (MCTC)
San Joaquin Valley Growth Response Study, Phase III
Special Thank You
Special thank you to: Darrell Unruh, Fresno Development Dept.Jon Elam – Fresno Public WorksJohn Downs – Fresno Area ExpressJohn Wright – Clovis Planning & Development ServicesLynn Gorman – Fresno County Public Works Dept.Tony Boren and Mike Bitner – Fresno COGDerek Winning – MCTCStakeholders!
San Joaquin Valley Growth Response Study, Phase III
Questions and Answers