world bank document - ncddp.dswd.gov.ph · dis c u s s ion p a per s philippines the kalahi-cidss...
TRANSCRIPT

D I S C U S S I O N P A P E R S
P h I l I P P I N E SThe KALAHI-CIDSS Impact Evaluation A Revised Synthesis Report
Sust
aina
ble
Dev
elop
men
t —
Eas
t A
sia
and
Paci
fic
Reg
ion
January 2013
Pub
lic D
iscl
osur
e A
utho
rized
Pub
lic D
iscl
osur
e A
utho
rized
Pub
lic D
iscl
osur
e A
utho
rized
Pub
lic D
iscl
osur
e A
utho
rized

© 2013 The World Bank GroupJanuary 2013Printed in the United StatesAll rights reserved.
The World Bank Group World Bank Office Manila1818 H. Street, N.W. 25th Floor, One Global PlaceWashington DC 20433, USA 5th Avenue, Bontacio Global CityTel: (202) 473 1000 Taguig City, PhilippinesFax: (202) 477 6391 Tel: (632) 465 2500 www.worldbank.org Fax: (632) 465 2505 www.worldbank.org.ph
This note has been prepared by Julien Labonne. Thanks to Fermin Adriano, Mae Arevalo Radu Ban, Amanda Beatty, Sean Bradley, Cliff Burkley, Robert Chase, Patricia Fernandes, Alex Glova, Malu Padua, Anne Pizer, Matt Stephens, Lawrence Tang, Susan Wong, and Mark Woodward for comments on previous drafts.
This publication is available online at http://www.worldbank.org/.
The pictures on the cover page were taken from: http://kalahi.dswd.gov.ph/index.php?option=com_phocagal-lery.
This volume is a product of the staff and consultants of the Sustainable Development Department of the East Asia and Pacific Region of the World Bank / The World Bank. The findings, interpretations and conclusions expressed herein are those of the author(s) and do not necessarily reflect the views of the Executive Directors of The World Bank or the governments they represent.
The World Bank does not guarantee the accuracy of the data included in this work. The boundaries, colors, denomi-nations, and other information shown on any map in this work do not imply any judgment on the part of the World Bank concerning the legal status of any territory or the endorsement or acceptance of such boundaries.
Rights and Permissions
The material in this publication is copyrighted. Copying and/or transmitting portions or all of this work without permission may be a violation of applicable law. The World Bank encourages dissemination of its work and will normally grant permission to reproduce portions of the work promptly.
For permission to photocopy or reprint any part of this work, please send a request with complete information to the Copyright Clearance Center, Inc., 222 Rosewood Drive, Danvers, MA 01923, USA, telephone 978-750-8400, fax 978-750-4470, www.copyright.com.
All other queries on rights and licenses, including subsidiary rights, should be addressed to the Office of the Pub-lisher, The World Bank, 1818 H Street NW, Washington, DC 20433, USA; fax 202-522-2422; e-mail [email protected].
Note: This report presents revised estimates of the KALAHI-CIDSS impacts on household welfare, access to services, social capital and local governance. Earlier estimates were reported in a report prepared by Asia Pacic Policy Center (2011) and summarized in World Bank (2011a). The original estimates of APPC were revised as an error was made in generating the results.

The KALAHI-CIDSS Impact Evaluation: A Revised Synthesis Report*
PHILIPPINESJanuary 2013
* This report was prepared by Julien Labonne. I am grateful to Fermin Adriano, Mae Arevalo, Radu Ban, Amanda Beatty, Sean Bradley, Cliff Burkley, Robert Chase, Patricia Fernandes, Alex Glova, Malu Padua, Anne Pizer, Simon Quinn, Matt Stephens, Lawrence Tang, Susan Wong, and Mark Woodward for comments on previous versions of this note.


The KALAHI-CIDSS Impact Evaluation: A Revised Synthesis Report 3
Table of ContentsExecutive Summary ..................................................................................................................5
1. KALAHI-CIDSS ........................................................................................................................9
2. Background on the Evaluation Strategy ........................................................................ 12
2.1 Design ......................................................................................................................................................................... 12
2.2 Testing the Parallel Trend Hypothesis .............................................................................................................. 13
2.3 The Regressions ....................................................................................................................................................... 13
2.4 Implementation and Challenges ...................................................................................................................... 14
3. Results of KALAHI-CIDSS in terms of Welfare ................................................................ 16
3.1 Who did the project reach? ................................................................................................................................. 16
3.2 Key welfare impacts ............................................................................................................................................... 16
3.3 Access to basic services ........................................................................................................................................ 18
4. The Results of KALAHI-CIDSS in terms of Governance and Social Capital .............. 19
5. Areas for Improvement ..................................................................................................... 21
5.1 Implications for project expansion ................................................................................................................... 21
5.2 Suggestions for additional analytical work ................................................................................................... 22
References................................................................................................................................ 23
Annexes .................................................................................................................................... 63
List of Tables
Table 1. KALAHI-CIDSS Impact Evaluation Report Card ......................................................................................7
Table 2. Distribution of subproject types (December, 2010) ......................................................................... 10
Table 3: Impacts on log per capita expenditures .............................................................................................. 25
Table 4: Impacts on log per capita expenditures (poor households) ........................................................ 26
Table 5: Impacts on log per capita expenditures (non-poor households) ............................................... 27
Table 6: Impacts on poverty levels .......................................................................................................................... 28
Table 7: Impacts on non-food share of total consumption ............................................................................ 29
Table 8: Impacts on log per capita food expenditures ..................................................................................... 30
Table 9: Impacts on log per capita non-food expenditures ........................................................................... 31
Table 10: Impacts on self-rated poverty levels .................................................................................................... 32
Table 11: Impacts on employment .......................................................................................................................... 33
Table 12: Impacts on male employment ............................................................................................................... 34
Table 13: Impacts on female employment ........................................................................................................... 35
Table 14: Impacts on house accessibility .............................................................................................................. 36
Table 15: Impacts on number of trips to municipal center............................................................................. 37

List of Boxes and Figures
Box 1. Political Engagement: Virgie Niebres, Barangay Rawis, Pio Duran.................................................. 20
Figure 1. Distribution of subproject types in sample municipalities .......................................................... 24
Figure A-1: Project Coverage ..................................................................................................................................... 63
Table 16: Impacts on log per capita transportation expenditures ............................................................... 38
Table 17: Impacts on access to level II and III water supply ............................................................................ 39
Table 18: Impacts on access to safe water ............................................................................................................ 40
Table 19: Impacts on access to water-sealed toilets ......................................................................................... 41
Table 20: Impacts on access to health services ................................................................................................... 42
Table 21: Impacts on access to health services (Male sample) ...................................................................... 43
Table 22: Impacts on access to health services (Female sample) ................................................................. 44
Table 23: Impacts on school enrollment ............................................................................................................... 45
Table 24: Impacts on school enrollment for boys .............................................................................................. 46
Table 25: Impacts on school enrollment for girls ............................................................................................... 47
Table 26: Impacts on attendance in village assemblies ................................................................................... 48
Table 27: Impacts on willingness to contribute money to community projects .................................... 49
Table 28: Impacts on trust that others are willing to help if needed .......................................................... 50
Table 29: Impacts on willingness to contribute time to community projects ......................................... 51
Table 30: Impacts on participation in bayanihan ............................................................................................... 52
Table 31: Impacts on group membership ............................................................................................................. 53
Table 32: Impacts on trust of community members ......................................................................................... 54
Table 33: Impacts on need to be alert .................................................................................................................... 55
Table 34: Impacts on trust of other with money ................................................................................................ 56
Table 35: Impacts on trust of local officials ........................................................................................................... 57
Table 36: Impacts on trust of national officials .................................................................................................... 58
Table 37: Impacts on trust of strangers .................................................................................................................. 59
Table 38: Impacts on perceptions of peace .......................................................................................................... 60
Table 39: Impacts on knowledge of village budget .......................................................................................... 61
Table 40: Impacts on participation in planning of development activities .............................................. 62
Table A-1: Comparing treatment and control municipalities at baseline (Welfare indicators) ......... 64
Table A-2: Comparing treatment and control municipalities at baseline (Access indicators) ........... 65
Table A-3: Comparing treatment and control municipalities at baseline (Social capital and local governance indicators) ................................................................................................................................................ 66
Table A-4: Parallel Trend Hypothesis: Consumption ......................................................................................... 67
Table A-5: Parallel Trend Hypothesis: Asset .......................................................................................................... 68
Table A-6: Are the determinants of attrition different in treatment and control municipalities? (Welfare indicators) ....................................................................................................................................................... 69
Table A-7: Are the determinants of attrition different in treatment and control municipalities? (Access indicators) ......................................................................................................................................................... 70
Table A-8: Are the determinants of attrition different in treatment and control municipalities? (Social capital and local governance indicators) ................................................................................................ 71

The KALAHI-CIDSS Impact Evaluation: A Revised Synthesis Report 5
T he KALAHI-CIDSS program was set up in 2002 to alleviate rural poverty. The program, following a Community-Driven
Development (CDD) approach, aims to achieve this by pro viding resources to poor rural munici-palities to invest in public goods and by reviving local institutions to enhance peoples’ participa-tion in governance. KALAHI-CIDSS originally targeted the poorest 25 percent of municipalities in 42 of the poorest provinces. As of December 2010, the project had covered 4,583 barangays (communities) in 200 municipali ties and sup-ported 5,645 sub-projects, worth PHP 5.7 billion (about USD 140 million)1 and benefiting about 1.26 million households.2 Communities follow very detailed participatory processes to secure resources for planning and implementation of public investments.
A rigorous impact evaluation was designed in 2003 to evaluate general impacts on poverty re-duction, social capital, empowerment, and gov-ernance. Quantitative and qualitative data were collected in 2003, 2006 and 2010 on a broad range of indicators from a sample of KALAHI-CIDSS municipalities and of comparable muni- cipalities that did not receive project support. The report presents the main results from the final quantitative and qualitative impact evalua-tions as well as from other studies that were car-ried out throughout project implementation.
Available data indicate that participation rates in project activities were relatively high, sug-gesting that households and local elected offi-cials in targeted municipalities see value in the KALAHI-CIDSS approach. About 80 percent of
1 The exchange rate is USD 1 = PHP 40.6 on 01/26/2013.
2 A barangay is the lowest administrative unit in the Philippines; corresponding to a village.
households in treated municipalities indicated being aware of the project and three in every five of them expressed their satisfaction with the project. Local, elected officials also viewed the project in a positive light, with 75 percent of Lo-cal Government Units (LGUs) officials indicat-ing being satisfied with the project. Respondents identify infrastructure improvement, better ac-cess to services and community empowerment as key project benefits. Feedback from baran-gays that were not prioritized by the Municipal Inter-Barangay Forum (MIBF), and therefore did not receive sub-project financing, was more negative.
The KALAHI-CIDSS was designed to minimize the risk of elite capture and it appears to have been successful in doing so. At the national lev-el, the program directed resources to some of the poorest municipalities in the country, identified through a ranking process undertaken by Dr. Balisacan at the University of the Philippines School of Economics. At the local level, avail-able evidence indicates that project processes were not subject to elite capture, at least in its most malign form. First, barangay captains do not appear to be a driving force behind proposals put forward in the MIBF. Their preferences and those of community members are equally repre-sented in community proposals. Second, the im-pact evaluation reveals that, within municipali-ties, KALAHI-CIDSS targeted the poorest and best-organized villages, suggesting that better-off and connected individuals and villages did not receive a disproportionate share of project benefits.
The project had a positive impact on household consumption. Specifically, per capita consump-tion increased by about 12 percent as a result of the project, which is consistent with findings from the evaluation of the Kecamatan Develop-ment Program (KDP), a similar CDD project
Executive Summary

6 Philippines
in Indonesia. Those impacts are stronger for households that were classified as poor in 2003; which experienced a 19 percent increase in per capita consumption. The impacts on per capita consumption are associated with a 6 percentage-point decline in the probability that households are classified as poor. There is some evidence that individuals, especially women, are more likely to be employed as a result of the project which could explain how per capita consump-tion increased.
The project also had a positive impact on ac-cessibility. Specifically, a 9 percentage-point increase in the proportion of households whose house is accessible year-long can be attributed to the project. This is associated with greater mo-bility. Households in treatment areas were going to the municipal center more regularly as a result of the project. However, no effects were detected on other measures of access to basic services, in-cluding access to improved water sources, sani-tation and use of health facilities. In addition, the program led to a decline in school enrollment.
Results from the qualitative evaluation indicate that the project led to changes in how village assemblies (a feature of the lowest level of lo-cal government) are perceived. Prior to project implementation, they were, at best, considered avenues for reporting, while now they tend to be seen as mechanisms for participation, transpar-ency and accountability. This change seems to be partly driven by a new breed of village lead-ers. Indeed, especially in villages that received financing for a sub-project, some of the village volunteers have been empowered. This new pool of leaders can effectively engage elected village offcials. They are considered to be more service-oriented and committed than previous village leaders and, in some cases, they have been elect-ed to village offce. Ensuring the sustainability of those impacts once project implementation has ended appears more challenging, however.
The quantitative evaluation was able to detect positive impacts on the proportion of house-holds willing to contribute money to projects
that benefit the community and on the propor-tion of respondents who thought that most peo-ple in the village are willing to help if need be. No impacts were detected on other measures of barangay governance and social capital, such as group membership or trust levels.
Finally, findings from the evaluation suggest ar-eas for improvement. First, despite signifi cant investment in water systems in treatment muni- cipalities, no impacts on access to water systems were detected. Further qualitative field work suggests that it is due to the fact that some of the sub-projects were unable to reach all community members and some barangays did not manage to adequately maintain the investment. This, in turn, may be the result of project resources be-ing allocated on a per barangay, rather than on a per capita, basis, which in some cases led to limited per capita allocations. The evaluation also showed that the key impact on increased consumption levels is stronger on poorer house-holds, suggesting that it might make sense to vary municipal allocation by poverty levels (adjustments incorporated into the new national CDD program).
Second, there are challenges in sustaining em-powerment and barangay-level governance impacts, and in affecting improvements in mu-nicipal-level governance. This could require greater LGU involvement and better integra-tion of project processes with the local planning cycle, along the lines currently being followed by the Makamasang Tugong initiative. Fur ther, findings from the qualitative study suggest that the project was relatively successful at empow-ering project volunteers but that the broader citi-zenry was not as positively affected.
Third, while a large proportion of barangays in targeted municipalities receive at least one sub-project during the 3 cycles, some do not. Project volunteers who engaged in the relatively time-consuming KALAHI-CIDSS processes and did not manage to get a project for their barangay, might be reluctant to engage in similar processes in the future.

The KALAHI-CIDSS Impact Evaluation: A Revised Synthesis Report 7
Table 1. KALAHI-CIDSS Impact Evaluation Report Card
Key Indicators Sign Size* Comments/Explanation
Household Welfare
Per capita consumption (log)—overall Positive Medium
Per capita consumption (log)— poor households Positive Medium
Per capita consumption (log)— non-poor households None
Poverty levels Negative Small Poverty levels are lower as a result of the project
Non-food share to total consumption Positive Small
Labor force participation Positive Small Stronger for women
Access to Services
Year-long road access Positive Medium Stronger in prioritized barangays
Visits to health stations None
Access to water None Issues with subproject maintenance
School enrollment Negative Small Low level of investments in sample barangays
Social Capital and Local Governance
Contribution to community projects Positive Medium
Others are willing to help Positive Small
* Size refers to the difference in the changes between baseline and endline in the treatment and control groups, taking into account the baseline value of the relevant indicator.

8 Philippines
The KALAHI-CIDSS Impact Evaluation: A Revised Synthesis Report 9
1. KALAHI-CIDSS
T his report reviews available evidence on the KALAHI-CIDSS program with the aim of identifying both its strengths
and weaknesses. It will serve as an input into the planned revisions to project operating pro-cedures and for the on-going scaling up of the program. The report starts by indicating the pro-grams main achievements in terms of outputs. It then briefly presents the systems put in place to measure project impacts and to learn from the various studies that were implemented during the course of the program. The report presents the main results from the final quantitative and qualitative impact evaluations with a special fo-cus on the project impacts on poverty, access to basic services, local governance and social capi-tal. The last section of this report indicates areas for potential improvement.
At the turn of the new millennium, poverty in the Philippines, on the increase due to the aftermath of the 1997 Asian Crisis, was mostly a rural phenomenon. In 2000, about 44 percent of the rural population was poor and about three-fourth of the poor lived in rural areas (World Bank 2002). The passage of the 1991 Local Government Code (RA 7160) provided opportunities for local poverty reduction efforts but implementation fell short of original expectations. While significant responsibilities were devolved to Local Government Units (LGUs), transfers were not deemed sufficient to pay for these services. Further, poor rural communities often lacked opportunities to effectively engage in local development processes.
The KALAHI-CIDSS program sought to respond to some of these short-comings. Set up in 2002, the program aimed at alleviating rural poverty by providing resources to poor rural municipali-ties for public goods investment and reviving
local institutions mandated by the 1991 Local Government Code. Specifically, the project had the objectives of strengthening local communi-ties’ participation in barangay governance, and developing their capacity to design, implement and manage development activities that reduce poverty (World Bank 2002).
The government of the Philippines commit-ted USD 82 milllion to the project, which was complemented by a USD 100 million loan from the World Bank. Given the project emphasis on alleviating rural poverty, it targeted the poor-est 25 percent of municipalities in each of the poorest 42 provinces.3 At first, the project was implemented in 184 municipalities and then expanded to an additional 16 municipalities in 2010. The project is currently being expanded through a USD 120 million grant from the Mil-lennium Challenge Corporation and a USD 59 million loan from the World Bank. Selection of municipalities for project expansion took place in the first half of 2011.
As of December 2010, the project had sup-ported 5,645 subprojects, worth PHP 5.7 billion (about USD 140 million) and benefiting about 1.26 million households. The five most common subproject types were roads, water systems, school buildings, health stations and pre/post agricultural production facilities. The distribu-tion of subprojects financed under the program is shown in Table 2.
3 Concerns about the capacity of regional DSWD of-fices to cover a large number of municipalities prevented the program from targeting the poorest municipalities regardless of their province of origin. In addition, a deci-sion was made not to implement the project in ARMM. A similar project, the ARMM Social Fund, was implemented instead.

10 Philippines
KALAHI-CIDSS applied a detailed participa-tory process to the identification, prioritization, implementation and evaluation of community-level subproject investments. The process fol-lows what is known as the community empow-erment activity cycle (CEAC), which consists of five main stages:4
Social Preparation Stage1. —during which communities participate in a series of activi-ties to identify and prioritize their problems and needs.
Subproject Identification Stage2. —during which community members are technically trained to design and package subproject proposals that hope to address their needs.
Subproject Preparation, Selection, and Ap-3. proval stage—during which community representatives through the Municipal Inter-Barangay Forum select which proposals will be funded by KALAHI-CIDSS using a set
4 http://kalahi.dswd.gov.ph/index.php?option=com content&view=article&id=3&Itemid=3 visited on 12/16/2010.
of criteria they themselves developed.
Subproject Implementation, Monitoring, 4. and Evaluation (M&E), and Operations and Maintenance stage for approved subproject proposals.
Transition stage5. to enter into the sec-ond implementation of the CEAC after subprojects are completed.
The program has a number of noteworthy de-sign features that are consistent with Commu-nity Driven Development programs worldwide. First, once a barangay has been prioritized for subproject investment, a community bank ac-count is opened and funds from the project flow directly from the Philippine Government’s implementing agency (the Department of Social Welfare and Development; DSWD) accounts into the community account. Second, commu-nity volunteers are fully responsible for pro-curement of subproject inputs and reporting to community at large and municipal authorities on the usage of funds. Third, municipal mayors role in approving subprojects is limited by their non-voting status in the Municipal Inter-Baran-
Table 2. Distribution of subproject types (December, 2010)
% of Subprojects
% of HH Beneficiaries
% Total Cost
Basic social services (e.g., health, edu-cation, water) 50.1 49.1 44.5
Basic access infrastructure (e.g., roads, bridges) 27.5 26.1 36.5
Community production, economic support, and common service facili-ties
11.4 12.7 8.9
Environmental protection and conser-vation 10.2 11.7 9.6
Other 0.8 0.5 0.5
Source: KALAHI-CIDSS National Project Management Office. Data on beneficiaries are taken from sub-project proposals and correspond to the number of households in each barangay that are expected to benefit directly from the sub-project.

The KALAHI-CIDSS Impact Evaluation: A Revised Synthesis Report 11
gay Forum. Fourth, communities are required to provide local counterpart contributions either in cash or in-kind that are pooled from various sources (province, municipality, barangay and community), and which develops community capacity for resource leveraging/mobilization.
In reviewing the impact of the KALAHI-CIDSS in participating municipalities, it is important to consider a few key aspects of the program. First, participating municipalities receive an annual grant equivalent to PHP 300,000 (about USD 7,400) for each barangay; the total municipal grant is then allocated competitively between barangays in the municipality. This corresponds to about 19 percent of Internal Revenue Allot-ment (IRA), i.e. regular fiscal transfers from the central government, in KALAHI-CIDSS munic-ipalities and to an average annual per capita al-location of approximately PHP 300 (about USD 7.40). Given the small size of the per capita allo-cation, expectations of the likely poverty reduc-tion impact of the program should be similarly modest.
Second, given the competitive nature of the prioritization process to allocate funding to vil-lages within municipalities, one is unable to know ex-ante which villages will receive a sub-project and which villages will not. As a result, among the treatment municipalities surveyed, the sample covers both villages that were pri-oritized and villages that did not receive any subproject financing (but which did receive so-
cial preparation and project identification and design training).
Third, common to all CDD operations, the KA-LAHI-CIDSS finances a number of different subprojects, which are likely to affect different dimensions of household welfare. Indeed, one would not expect similar impacts for a farm-to-market road and for a school building. As a result, project impacts are diluted over a broad range of outcome indicators and one should ex-pect relatively smaller impacts on a number of indicators. Due to sample size restrictions, no attempts were made to assess impacts by types of subprojects.
Fourth, to better understand the impacts of KA-LAHI-CIDSS, ideally these results should be compared to those of similar efforts to support basic community infrastructure and services in the Philippines. Unfortunately, a limited number of such programs in the Philippines have been subjected to this kind of robust analysis. As a result, it is difficult to judge whether the KALA-HI-CIDSS is a cost-effective way of achieving the observed impacts. However, the large-scale impact evaluation of the Pantawid Pamilyang Pilipino Program (4Ps), also implemented by the DSWD, will generate useful comparative information.

12 Philippines
2.1 Design5
As part of the project’s overall M&E efforts, a rigorous impact evaluation was designed in 2003 to evaluate project impacts on poverty reduction, social capital, empowerment, and governance and, to examine processes by which poverty has been reduced and communities empowered. The evaluation followed best practices in that it col-lected quantitative and qualitative data before, during and after project implementation in a sample of KALAHI-CIDSS municipalities that received support (treatment municipalities) and of comparable municipalities that did not receive support (control municipalities). Data were col-lected on a broad range of indicators: service delivery (access to health, education), poverty (employment, per capita consumption, self-rated poverty) and empowerment/governance (group membership, participation in barangay assem-blies, collective action). The quantitative sample includes 2,400 households in 135 barangays in 16 municipalities in 4 provinces. The qualitative assessment, using focus group discussions, key informant interviews and direct observations, took place in a subset of 20 barangays in 4 mu-nicipalities in 2 provinces.
The control group was selected through cluster analysis and, as discussed in more detail below, provides a credible estimate of what would have happened in the treatment municipalities in the absence of the project.6 The team used cluster
5 This sections builds on Chase and Holmemo (2005) and Labonne and Chase (2011).
6 Cluster analysis is a statistical method that allows re-searchers to pair together similar municipalities along a set of chosen indicators. More details can be found in
analysis to select two pairs of comparison and treatment municipalities in each of four provinc-es. The pairs with the best match were selected. Chase and Holmemo (2006) report results indi-cating that, unsurprisingly, given the strict pov-erty targeting procedures used by the project, control municipalities are slightly richer than the treatment municipalities but appear similar along other dimensions. We provide further baseline descriptive statistics on the main household-lev-el outcomes of interest and test for differences between the treatment and control at baseline. Results, available in Tables A-1-A-3, are simi-lar to the ones obtained by Chase and Holmemo (2006). As discussed below, the analysis will be carried out using either municipal or household fixed-effects which will be picking up any pre-existing differences between the treatment and control municipalities. More importantly, we also provide evidence that the two sets of mu-nicipalities were on similar paths before project implementation (Section 2.2).
The evaluation was designed to capture medi-um-term impacts. Therefore, while baseline data collection took place in 2003, endline data were not collected until early 2010. More than a year went by between the end of project activities in the sample municipalities and endline data col-lection. As such, the design was able to pick up lasting impacts that materialize more slowly.7
Chase and Holmemo (2006).
7 A large number of evaluations are designed to cap-ture impacts within a relatively short time-frame (e.g., one or two years). As King and Behrman (2009) and Woolcock (2009) judiciously pointed out, this can lead to unreliable results if either project impacts take time to materialize, with short-term evaluations underestimating project im-pacts, or if they fade away quickly, with short-term evalu-
2. Background on the Evaluation Strategy5

The KALAHI-CIDSS Impact Evaluation: A Revised Synthesis Report 13
2.2 Testing the Parallel Trend Hypothesis
The key identifying assumption in the impact evaluation is that, without the program, the two groups of municipalities would have evolved similarly. While it is impossible to test this hy-pothesis directly, it is possible to test if prior to the project the two groups evolved similarly, the so-called parallel trend hypothesis (Bertrand, Duflo and Mullainathan 2004). Rejection of the parallel trend hypothesis would cast doubts on the validity of our estimation strategy.
For this purpose, we use data from the Family Income and Expenditure Survey (FIES). The FIES is a large-scale nationally representative survey carried out every three years by the Na-tional Statistics Office (NSO). We have access to the 2000 and 2003 data. Out of the 16 mu-nicipalities included in the KALAHI-CIDSS impact evaluation sample, 13 were included in the 2000 and in the 2003 FIES. This leaves a repeated cross-section of households in 13 of our sample municipalities. We run the following placebo test:
Yijt = αTijt + βXijt + γt + uij + vijt (1)
where, Yijt is the parameter of interest for house-hold i in municipality j at time t, Tijt is a dummy equal to one in 2003 for our sample treatment municipalities and zero otherwise, Yijt is a set of household characteristics.
For each outcome indicator, we run four dif-ferent regressions (with and without municipal dummies; with and without household controls). Results are available in Table A-4 and A-5. We are unable to reject the parallel trend hypothesis. For none of the 24 regressions are the estimated coefficients on the placebo treatment dummy statistically different from zero at the usual lev-els of confidence. This gives credence to the view that the two groups would have evolved
ations overestimating project impacts.
similarly in the absence of the project and that the observed differences can be attributed to the project. Combined with previous tests compar-ing treatment and control municipalities at base-line, this suggests that there is a need to control for either municipal or household fixed-effects. They will pick up any differences between treat-ment and control municipalities at baseline.
2.3 The Regressions
Taking advantage of the panel structure of the data, we estimate a series of regressions of the form:
Yijt = αKCjt + βXijt + γt + uij + vijt (2)
Where Yijt is the outcome of interest for house-hold i in municipality j at time t, KCjt is a dummy equal to one if the KALAHI-CIDSS program was implemented in municipality j at time t, uij
captures household fixed-effects and vijt is the idiosyncratic error term. For each outcome of interest, we start with a simple OLS regression (Column 1 of each table), we then include mu-nicipal fixed effects (Column 2) and household fixed effects (Column 3 of each table). We then add controls for overall time trends (Column 4 of each table), basic household controls (Col-umn 5 of each table) and regional time trends (Column 6 of each table).8
For each outcome of interest, we report results on various samples and with different estima-tors. Specifically, we estimate equation (2) on both the balanced sample (Panels A and B of each table) and on the full sample (Panels C and D of each table). In each case, we report results both with (Panels B and D) and without survey weights (Panels A and C). Given that the pro-
8 In the household-level regression, the set of house-hold controls includes the number of female in the household, the number of household members age 0-5, age 6-14, age 15-24, age 25-34, age 35-59 and age 60+. In the individuals-level regression, the set of controls in-cludes a full set of age dummies and a gender dummy.

14 Philippines
gram was implemented at the municipal-level, standard errors are clustered at that level. For completeness, we also provide standard errors clustered at the village-level.9
In each table, the preferred specification is the one with the most controls, clustering of stan-dard errors at the municipal-level, on the full sample with survey weights. That is, the pre-ferred estimates of project impacts are the ones presented in Column 6 of Panel D in each of the regression tables.
2.4 Implementation and Challenges
The impact evaluation, carried out in three phases between 2003 and 201110, faced challen- ges in implementation. Implementation was not without challenges, however. First, due to budgetary and logistical constraints, data were only collected in 16 municipalities for the quan-titative surveys and in 4 municipalities for the qualitative survey. As a result, one could ques-tion whether results from the evaluation are externally valid, that is, whether results from the evaluation would carry over in other project areas. While it is not possible to adequately answer this question, available data indicate
9 There is an additional challenge associated with the limited number of municipalities. Indeed, with less than 40 clusters, standard methods to account for clustering will provide downward biased standard errors, and as a result will tend to over-reject the null hypothesis of no effect. While some bootstrap methods have been devel-oped, an alternative is to use a t-distribution with G − c degree of freedoms; with G= # of clusters(16) and c = # of variables that are fixed within clusters (1: the constant). The relevant critical values for a t-distribution with 14 de-grees of freedom are 1.75 (10 percent), 2.13 (5 percent) and 2.95 (1 percent). The main results, discussed below, are robust to using those critical values to determine sig-nificance.
10 The actual timing of data collection was as follows: Quantitative baseline in Sept/Oct 2003; Qualitative base-line in April/June 2005; Quantitative midterm: Oct/Nov 2006; Qualitative and quantitative endlines: Feb/March 2010.
that treatment municipalities in our sample were similar to other KALAHI-CIDSS municipalities prior to project implementation.11
Second, to reap the benefits from having a household panel dataset, efforts were devoted to keeping attrition to a minimum. Nonetheless, the sample size was reduced from 2,400 house-holds during the baseline survey to a little less than 1,900 households during the endline sur-vey, mostly due to migration and deaths. Lev-els of attrition are similar in the treatment and control group (21 percent vs. 22 percent). In ad-dition, we test whether the determinants of at-trition are similar in the treatment and control groups. Specifically, for each household-level outcome of interest, we run a probit regression of a dummy indicating whether the household drops out of the sample between 2003 and 2010 on the interaction of the outcome of interest with the treatment dummy, its interaction with the control dummy, the treatment dummy and a full set of province dummies. The interaction terms are reported in Columns 1 and 2 of Tables A-6-A-8. Results from a chi-square test of equality of the coefficients are available in Column 3. Results suggest that such attrition is unlikely to significantly bias the results as the determinants of attrition do not appear to differ between the control and treatment groups.
Third, one of the original control municipality in the Province of Albay (Malinao) ended up be-ing included in the PODER project, a KALAHI-CIDSS-type program supported by the Spanish aid agency. As a result, baseline data had to be collected in a replacement control municipal-ity (Oas).
In the impact evaluation sample, about two-
11 For example, the small area estimates released by National Statistical Coordination Board indicate that in 2000 poverty incidence was 64.8 percent in the 8 treat-ment municipalities in the sample and 62.8 percent in the other KALAHI-CIDSS municipalities, a difference that is not different from zero at usual levels of statistical sig-nificance.

The KALAHI-CIDSS Impact Evaluation: A Revised Synthesis Report 15
thirds of treatment barangays were prioritized for subproject investment at least once. Put dif-ferently, about a third of the sample barangays in treatment municipalities did not receive a single subproject throughout the three subproj-ect cycles thereby reducing likely measurable impacts in these areas.
The actual distribution of subprojects in the sample barangays is shown in Figure 1. The relative importance, and level of investment by subproject type, should be borne in mind when interpreting results. Specifically, in our sample, project impacts should only be expected on out-comes that can be affected by subprojects that were chosen by the community. The impacts might differ in areas where communities select-ed a different mix of subprojects.
Available data indicate that participation rates in project activities are relatively high, suggesting that households in targeted municipalities see value in the KALAHI-CIDSS approach. About 80 percent of households in treated municipali-ties indicated being aware of the project and
three in every five of them expressed their sat-isfaction in the project. Participation rates were around 65 percent in the preparatory and plan-ning phases and 31 percent in the sub-project implementation phase. Of particular interest, women are more likely to participate in proposal selection and preparation. Conversely, men are more likely to participate in subproject imple-mentation. This might reflect traditional gender roles in those communities. Interestingly, wom-en volunteers belong to the same socio-econom-ic status as most of the constituents but are more available for and interested in barangay projects. This is consistent with the view that project pro-cesses are not dominated by local elites.
Local elected officials also view the project in a positive light. About 75 percent of barangay and municipal officials indicated being satisfied with the project. When asked about the benefits of the KALAHI-CIDSS, the most common responses are infrastructure improvement and better access to services; community empowerment also fig-ures among the top responses. Not surprisingly, feedback from barangays not prioritized to re-ceive subproject financing was less positive.

16 Philippines
3.1 Who did the project reach?
This section of the report reviews the program targeting procedures both at the provincial, municipal and barangay level. A map of proj-ect areas for the period 2002-2009 is shown in Annex 1.
As previously noted, the project targeted the poorest 25 percent of municipalities in 42 of the poorest provinces identified through a cus-tomized index developed in collaboration with Dr. Balisacan at the University of the Philip-pines, School of Economics. The rankings used for targeting municipalities proved to be con-sistent with official rankings released by the National Statistical Coordination Board (NSCB) in 2005 (World Bank n.d.)
While the program was successful in directing resources to the poorest municipalities, the pos-sibility of elite capture -i.e., better-off and con-nected individuals dominating project processes and receiving a disproportionate share of proj-ect benefits (Mansuri and Rao 2004) remained a concern. To avoid this risk, KALAHI-CIDSS was specifically designed to help ensure that poor households and communities within eli-gible municipalities could benefit from the proj-ect. For example, the specific poverty concerns of the program were emphasized in the social preparation and subproject design phases of the project, and in the meetings in which communi-ties developed criteria to rank project proposals. Facilitators were also instructed to encourage participation of marginalized households.
Available evidence indicates that KALAHI-CI-DSS subprojects were not subject to elite cap-ture, at least in its most malign form (Labonne and Chase 2009). Barangay captains (elected
village officials) did not appear to be an over-whelming force behind proposals put forward to the MIBF (subproject prioritizing committee), as their preferences and those of community members were equally represented in commu-nity proposals. Not surprisingly, however, indi-viduals who were already active in community affairs prior to the project are more likely to have their preferences represented in the submit-ted community proposal. Moreover, and consis-tent with the challenges of engaging marginal-ized groups, the survey found that women and individuals who had not attended school were less likely to have their preferences represented in the subproject proposal. However, this result was obtained after only one subproject cycle and DSWD revised its operating procedures shortly afterwards to promote greater inclusiveness. There is no evidence available on the effects of those revisions, however.
The impact evaluation also reveals that KALA-HI-CIDSS was successful in targeting the poor-est, best-organized villages. Surprisingly, how-ever, more unequal villages were more likely to have their proposals funded. This appears to be due to the fact that the barangay captain was more likely to take control of a disorganized community preference, and to influence inter-village competition at the MIBF. This is akin to benevolent forms of elite capture as the com-munity, as well as the barangay captain, benefits from receiving a subproject, which might not otherwise happen.
3.2 Key welfare impacts
This section of the report reviews program im-pacts on per capita consumption. Results are shown in Tables 3-13. As indicated above, the preferred estimates of project impacts are the
3. Results of KALAHI-CIDSS in terms of Welfare

The KALAHI-CIDSS Impact Evaluation: A Revised Synthesis Report 17
ones presented in Column 6 of Panel D in each of the regression tables.
Per capita consumption increased by about 12 percent as a result of the project (Table 3). This is strikingly similar to findings from an impact evaluation of a similar CDD project in Indone-sia. Voss (2008) found that the project led to an 11 percent increase in per capita consumption. Once we distinguish between households that were classified as poor in 2003 and those that were not, an interesting pattern emerges.12There is evidence that the project led to a 19 percent increase of per capita consumption for poor households (Table 4) but that it had no impact on non-poor households (Table 5). This further reduces concerns over elite capture of project benefits. Indeed, if project benefits had been captured by local elites, one should expect to observe larger impacts on non-poor households than on poor households.
The impacts on per capita consumption are as-sociated with a 6 percentage-point decline in the probability that the household is poor (Table 6). Again, this is of a similar order of magnitude found on the KDP in Indonesia (Voss 2008).
Findings from the qualitative evaluation high-light how the program could have generated such impacts. In San Ramon, Libon (Albay), community members indicated that, among the development projects in their barangay, the KALAHI-CIDSS-funded road-improvement project created the most impact as more trans-port and utility vehicles are now plying to and from the area. This increased traffic is creating business opportunities in the community, and has also made transportation available at much lower cost than before.
Similary, the barangay of Remedios, Esperanza (Agusan del Sur) built a rice and corn mill, with
12 In the Philippines, households are classified as poor if their per capita income falls below a certain threshold. As a second-best strategy, since no data on income were collected in the survey, households were classified as poor in 2003 if their baseline per capita consumption was lower than their regional poverty line.
the Remedios Farmers Cooperative. Accord-ing to community members, the project has cut corn and rice production costs by 30 percent by bringing the mill (and the grain to be milled) closer to the people. Previously, there were few milling facilities on the western part of the Agu-san river and transport costs to the producers were therefore much higher. The community also noted that because the mills’ services are better, other barangays - i.e., Bakingking, New Gingoog, Tagabase, and Hawilian - are now using it.
The project also led to a 5 percentage-point in-crease in the non-food share of consumption, which some researchers have argued is a better measure of household welfare.13 (Table 7).
On the other hand, the self-perception of pov-erty (i.e., the share of households rating them-selves as poor) does not seem to be affected by the project (Table 10). A potential explanation for this finding is that the increases in per capita consumption are not large enough for house-holds to switch from feeling poor to feeling non-poor. Alternatively, self-reported poverty measures might not be very good measures of household welfare.
One possible source for the increase in per capita consumption is that individuals in treat-ment areas are more likely to be employed as a result of the project. Indeed, there is some evi-dence that a 4 percentage-point increase in the likelihood of employment can be attributed to the project (Table 11). The effect mainly comes from the female sample, who experience an 8 percentage-point increase in their likelihood of employment (Table 13). It is important to note that these improvements in employment more likely reflect greater economic activity gener-ated by the project rather than direct, project related employment opportunities as the survey was conducted at least one year after subproject related employment ended.
13 Measures of per capita consumption do not account for (i) potential economies of scale within the household and (ii) relative needs of children and adults.

18 Philippines
3.3 Access to basic services
This section of the report reviews program im-pacts on access to basic services. Results are shown in Tables 14-25.
Consistent with the large number of roads that were financed by the project in sample areas, the project had a positive impact on accessibility. Specifically, the project resulted in a 9 percent-age-point increase in the proportion of house-holds whose house is accessible year-round (Table 14). This increase translates into greater mobility, with households making more trips to the municipal centers and with higher expendi-tures on transportation (Tables 15-16). While roads financed under the project are most likely driving this impact, no attempts were made to
test that hypothesis directly due to small sample sizes.
The quantitative evaluation did not identify im-pacts on other measures of access to basic ser-vices, such as access to improved water sources (Tables 17-18) , sanitation (Table 19) and use of health services when sick (Tables 20-22).
Surprisingly, individuals in project areas are less likely to be enrolled in school as a result of the project, with the effect concentrated on the male sample (Tables 23-25). This could be due to improved employment opportunities in KALAHI-CIDSS municipalities that increased the opportunity cost of going to school. How-ever, it is important to note that a small number of prioritized barangays in our sample decided to invest in school buildings (cf. Figure 1).

The KALAHI-CIDSS Impact Evaluation: A Revised Synthesis Report 19
T his section of the report reviews pro- gram impacts on village governance and social capital. Results are shown in
Tables 26-40.
While the quantitative evaluation was only able to detect marginally significant effects on house-hold’s participation in barangay assemblies (Table 26), the qualitative evaluation detected changes in how assemblies are perceived. Prior to project implementation, they were, at best, considered avenues for reporting. Now they tend to be seen as mechanisms for participa-tion, transparency and accountability, as reflect-ed in the following quotes from the qualitative evaluation:
“More often, barangay assemblies (…) are reduced to occasions for reporting accom-plishments and expenditures, and for presen-tation of plans, programs, and projects, that are in most cases already approved by the barangay council.” (focus group discussion (FGD) participant in Balangibang, Polan-gui, a control municipality)
“Barangay Assemblies are good and effec-tive venues for the people to be heard.” (FGD participant in Bacolod, Libon, a KALAHI-CIDSS treatment municipality)
This change seems to be partly driven by a new breed of barangay leaders. Indeed, especially in barangays that received subproject financ-ing, some of the community volunteers appear
to have been empowered (See box 1). This new group of leaders can effectively engage elect-ed barangay officials. They are considered to be more service-oriented and committed than previous barangay leaders and, in some cases, they have been elected to barangay office. In-terestingly, most of those volunteers are women. However, as discussed in more detail below, these empowerment benefits have yet to reach the broader community outside of the project volunteers.
Interestingly, according to the qualitative evalu-ation, there is also a shift in how community members perceive their barangay captains. Tra-ditionally, leaders are rated highly if they are available, understanding and able, within limits, to bring resources to the community. Households in treatment barangays in Agusan del Sur now also care about whether leaders are consultative, transparent and able to plan for the future.
Apart from the effects on participation in ba-rangay assemblies discussed above, the quanti-tative impact evaluation did not detect signifi-cant impacts on measures of local governance and social capital. There are two exceptions, however. First, more households indicate being willing to contribute money to projects that will benefit the community as a result of the project (Table 27). Second, the project led to an increase in the proportion of households indicating that others community members are willing to help if needed (Table 28).
4. The Results of KALAHI-CIDSS in terms of Governance and Social Capital

20 Philippines
Box 1. Political Engagement: Virgie Niebres, Barangay Rawis, Pio Duran
Virgie Niebres is a 36-year-old resident of Rawis. She began studying nursing at Bicol University, but due to poverty was forced to stop schooling after only her first semester. Her husband is 37 and an elementary graduate. Together they have five children. Before the KALAHI-CIDSS project, their only source of income was from harvesting copra.
The KALAHI-CIDSS road project in Rawis has created the opportunity for Virgie to improve and diversify her family’s livelihoods options. With a more efficient way to transport copra to market, they were also able to purchase a motorcycle operated by her husband for “habal-habal” (motorcycle rental).
Vergie also has benefited directly by working closely with KALAHI-CIDSS as project prep-aration team chairman and as a bookkeeper. She was then elected as the chair of the Ba-rangay Subproject Management Committee (BSPMC). During project preparation, Virgie learned how to develop project proposals, and assisted with mapping impoverished re-gions. Her experience as a BSPMC chair also taught her various aspects of project imple-mentation. She was able to overcome her shyness and enhance her public relations skills because she had to convince people in the barangay to attend barangay assemblies. She also gained the confidence to talk in front of a large crowd. Because of KALAHI, she learned to participate in barangay affairs. Being a volunteer also allowed her to attend numerous training events and seminars. She has traveled not only within the municipality, but even in other provinces. These experiences resulted in a new career for her as center chief of Simbag sa Pag-asenso, a Catholic social action lending microfinance program.
As center chief, Vergie handles 52 members from four barangays. She is also the Secre-tary of the Barangay Power Association, a local electrification association in charge of the maintenance of the barangay’s electrification. The association’s activities include the col-lection of payments from each household. She also became the manager of the distribu-tion of fertilizers and seedlings provided by the Department of Agriculture in the munici-pality. She also takes part in the decision making in the barangay.
Source: World Bank (2011b).

The KALAHI-CIDSS Impact Evaluation: A Revised Synthesis Report 21
T his section of the report seeks both to highlight implications from the evalua-tion for project expansion and to identify
areas where additional analytical work could prove fruitful.
5.1 Implications for project expansion
Results from the qualitative evaluation indicate that the project did not have any measurable im-pact on governance at the municipal-level. There are two possible explanations for this. First, very little direct capacity building was initially tar-geted at municipalities, therefore great changes in behavior should not have been expected. Sec-ond, the relatively small and short-term nature of the project funding (as compared to other available forms of support) may be insufficient to influence great change in the dynamic be-tween municipalities and barangays. In relation, KALAHI-CIDSS has been experimenting with the so-called Makamasang Tugong initiative that shifts responsibility for management of the program to the municipal LGUs. While it is too early to know whether this has made a differ-ence, the project team might want to review the conditions of this initiative to ensure that they promote the needed transparency and participa-tion in LGU activities.
Findings from the qualitative study suggest that the project was relatively successful at empow-ering project volunteers but that the broader ba-rangay citizenry was not as positively affected. While this might reflect lack of interest by some of the community members, and the unwilling-ness to challenge local leaders that are seen as bridges to resources, this could also indicate that further efforts from the facilitators are necessary throughout social preparation.
While the competitive allocation of resources through the MIBF is a key feature of the proj-ect, some of its downsides need to be acknowl-edged. In practice a large proportion of baran-gays in targeted municipalities receive at least one sub-project during the 3 funding cycles, but some do not. Project volunteers who engaged in the relatively time-consuming KALAHI-CIDSS processes but did not manage to get a project for their barangays might be reluctant to engage in similar processes in the future. There is a need to better manage expectations. Further, the project could systematically consider offering support to non-prioritized communities in seeking fund-ing for their KALAHI-CIDSS proposals through other sources.
Findings from two recent studies suggest that the program might have led to a temporary increase in conflict levels, especially in areas where the New Peoples Army (NPA) is present (Arcand, Bah and Labonne 2010; Crost and Johnston 2010). The first study uses newspaper reports of conflict incidence between the Armed Forces of the Philippines (AFP) and either the NPA or the Moro Islamic Liberation Front (MILF) and finds that the project led to a decline in MILF-related events, but to an increase in NPA-related events. The second study uses AFP data and finds that the program led to an increase in both MILF and NPA-related events. Both studies rely on nationwide conflict data and estimate proj-ect impacts using difference-in-differences and regression discontinuity techniques. The differ-ences between the two sets of results could come from the variation in data sources but also from the different definitions used to classify conflict events. Indeed, the first study looks at events with a 50km radius of eligible municipalities while the second study is only concerned with events in KALAHI-CIDSS municipalities.
5. Areas for Improvement

22 Philippines
While more research is necessary to understand which project component is driving this shift in conflict occurrence, available results call for a more cautious approach in conflict-affected ar-eas. Nonetheless, it is important to keep in mind that there are no similar analyses available for other government programs in the Philippines and, as such, it is impossible to compare the KALAHI-CIDDS approach with other develop-ment interventions in the Philippines along those dimensions.
5.2 Suggestions for additional ana-lytical work
Findings from the evaluation are consistent with the view that subprojects are what drive the proj-ect impacts on poverty reduction. Long-term impacts will require sustained efforts and both social and physical investments. Moreover, the greatest impacts are found where poverty among households and communities is the highest. As a result, to increase the poverty reduction impacts of the project, the project team should explore ways to (i) support local communities access to alternative additional sources of funding and, (ii) differentiate barangay grants by poverty lev-els. An option would be to vary municipal grants with municipal poverty levels. Alternatively, in richer municipalities, communities should be required to provide larger Local Counterpart Contribution (LCC). This is especially impor-tant as the project expands in relatively richer areas. Such options could be carefully piloted and evaluated in a subset of municipalities.
Second, results from the evaluation also suggest that maintenance arrangements for water proj-ects might not be adequate. The project team should carry out a thorough maintenance review of various project types. The study should also propose ways to improve maintenance arrange-ments in the future.
Third the project team should compile and fa-cilitate access to data on the efficiency and ef-fectiveness of different types of sectoral invest-ments. Further, while there is evidence that KALAHI-CIDSS sub-projects are less expen-sive than comparable sectoral investment (Arar-al and Holmemo, 2007), computations should be updated and compiled in a user-friendly format. This could serve as the basis for a long-term en-gagement with sectoral colleagues.
Fourth, the project team should carefully review the questionnaires used in the evaluation to bet-ter capture most relevant data on outcomes and impacts.
A final note of caution is also in order. While a number of studies were carried out through-out the project cycle, some of them were not adequately linked to operations and, as a result, their recommendations were not acted upon. If one wants to build an empirical basis to inform policy and operational decisions, systems need to be put in place to (i) allow DSWD to identify areas where more research is needed, (ii) carry out the studies in close collaboration between the project team and researchers and, most im-portantly, (iii) to act upon the findings.

The KALAHI-CIDSS Impact Evaluation: A Revised Synthesis Report 23
Arcand, Jean-Louis, Adama Bah, and Julien Labonne, “Conflict, Ideology and For-eign Aid,” CERDI Working Paper 2010-21, 2010.
Asia Pacific Policy Center, Final Survey for the KALAHI-CIDSS Impact Evaluation Re-vised Final Report 2011.
Bertrand, Marianne, Esther Duflo, and Send-hil Mullainathan, “How Much Should We Trust Differences-in-Differences Estimates?,” Quarterly Journal of Eco-nomics, 2004, 119 (1), 249–275.
Chase, Robert and Camilla Holmemo, “Com-munity Driven Development and Social Capital: Designing a Baseline Survey in the Philippines,” World Bank -Social Development Department, 2005.
Crost, Benjamin and Patrick Johnston, “Aid Under Fire: Development Projects and Civil Conflict,” University of California – Berkeley, mimeo, 2010.
King, Elizabeth and Jere Behrman, “Timing and Duration of Exposure in Evaluation of Social Programs,” World Bank Re-search Observer, 2009, 24 (1), 55–82.
Labonne, Julien and Robert Chase, “Who’s at the Wheel when Communities Drive Development? The case of the KALA-HI-CIDSS in the Philippines,” World Development, 2009, 37 (1).
___ and ___, “Do Community-Driven Develop-ment Projects Enhance Social Capital? Evidence from the Philippines,” Jour-
nal of Development Economics, 2011, 96 (2), 348–358.
Mansuri, Ghazala and Vijayendra Rao, “Community-Based and -Driven De-velopment,” World Bank Research Ob-server, 2004, 19 (1), 1–40.
Voss, John, “Impact Evaluation of the Second Phase of the Kecamatan Development Program in Indonesia,” The World Bank Indonesia, 2008.
Woolcock, Michael, “Toward a plurality of methods in project evaluation: a con-textualised approach to understanding impact trajectories and efficacy,” The Journal of Development Effectiveness, 2009, 1 (1), 1–14.
World Bank, Project Appraisal Document for the KALAHI-CIDSS, Report No: 24642-PH, 2002.
___, The KALAHI-CIDSS Impact Evaluation: A Synthesis Report, Sustainable Devel-opment -Asia and the Pacific Region, 2011.
___, Making everyone Count: Gender-sensitive Monitoring and Evaluation in a Com-munity-Driven Development Program: The Case of the Philippines’ KALAHI-CIDSS., East Asia and Pacific Social, Rural and Environmentally Sustainable Development Unit, mimeo, 2011.
___, Comparison of Rankings of Municipalities in the Philippines from two poverty-mapping methodologies n.d.
References

24 Philippines
School Buildings
4%
Day Care7%
Other10%
Roads33%
Health Stations9%
Pre- and Post-productions
facilities13%
Water Systems24%
Figure 1. Distribution of subproject types in sample municipalities
Source: KALAHI-CIDSS National Project Management Office.

The KALAHI-CIDSS Impact Evaluation: A Revised Synthesis Report 25
Table 3: Impacts on log per capita expenditures
(1) (2) (3) (4) (5) (6)
Panel A: Balanced panel (no weights)
KALAHI-CIDSS 0.066 0.289 0.289 0.119 0.133 0.133
(0.076) (0.028)*** (0.028)*** (0.031)*** (0.029)*** (0.022)***
[0.038]* [0.022]*** [0.022]*** [0.026]*** [0.024]*** [0.022]***
Fixed effects No Municipal Household Household Household Household
Time trends No No No Overall Overall Regional
Additional controls No No No No Yes Yes
Observations 5,652 5,652 5,652 5,652 5,652 5,652
R-squared 0.003 0.124 0.072 0.121 0.279 0.287
Panel B: Balanced panel (with weights)
KALAHI-CIDSS 0.028 0.279 0.279 0.122 0.135 0.129
(0.075) (0.025)*** (0.025)*** (0.028)*** (0.026)*** (0.019)***
[0.040] [0.023]*** [0.023]*** [0.028]*** [0.025]*** [0.024]***
Fixed effects No Municipal Household Household Household Household
Time trends No No No Overall Overall Regional
Additional controls No No No No Yes Yes
Observations 5,652 5,652 5,652 5,652 5,652 5,652
R-squared 0.000 0.106 0.061 0.105 0.271 0.279
Panel C: Full sample (no weights)
KALAHI-CIDSS 0.077 0.283 0.279 0.110 0.126 0.125
(0.075) (0.027)*** (0.025)*** (0.028)*** (0.028)*** (0.022)***
[0.037]** [0.020]*** [0.021]*** [0.024]*** [0.023]*** [0.022]***
Fixed effects No Municipal Household Household Household Household
Time trends No No No Overall Overall Regional
Additional controls No No No No Yes Yes
Observations 6,402 6,402 6,402 6,402 6,402 6,402
R-squared 0.003 0.133 0.069 0.119 0.274 0.282
Panel D: Full sample (with weights)
KALAHI-CIDSS 0.034 0.272 0.272 0.117 0.130 0.124
(0.074) (0.025)*** (0.023)*** (0.026)*** (0.025)*** (0.019)***
[0.040] [0.021]*** [0.021]*** [0.026]*** [0.024]*** [0.023]***
Fixed effects No Municipal Household Household Household Household
Time trends No No No Overall Overall Regional
Additional controls No No No No Yes Yes
Observations 6,402 6,402 6,402 6,402 6,402 6,402
R-squared 0.001 0.111 0.060 0.103 0.268 0.275
Notes: Results from OLS (Column 1) and fixed-effects (Columns 2-6) regressions. The dependent variable is the log per capita expenditures. In Panels A and B, the sample is restricted to households that are observed three times. In Panels C and D the full sample is used. In Panels B and D sample weights are used. The standard errors (in parentheses) (resp. [brackets]) account for potential correlation within municipality (resp. within village). * denotes significance at the 10 percent, ** at the 5 percent and, *** at the 1 percent level.

26 Philippines
Table 4: Impacts on log per capita expenditures (poor households)
(1) (2) (3) (4) (5) (6)
Panel A: Balanced panel (no weights)
KALAHI-CIDSS 0.185 0.462 0.462 0.204 0.203 0.203
(0.059)*** (0.036)*** (0.036)*** (0.037)*** (0.037)*** (0.031)***
[0.030]*** [0.025]*** [0.025]*** [0.030]*** [0.027]*** [0.026]***
Fixed effects No Municipal Household Household Household Household
Time trends No No No Overall Overall Regional
Additional controls No No No No Yes Yes
Observations 3,126 3,126 3,126 3,126 3,126 3,126
R-squared 0.031 0.159 0.188 0.293 0.418 0.430
Panel B: Balanced panel (with weights)
KALAHI-CIDSS 0.160 0.446 0.446 0.200 0.199 0.196
(0.065)** (0.033)*** (0.033)*** (0.037)*** (0.035)*** (0.028)***
[0.031]*** [0.026]*** [0.026]*** [0.032]*** [0.028]*** [0.026]***
Fixed effects No Municipal Household Household Household Household
Time trends No No No Overall Overall Regional
Additional controls No No No No Yes Yes
Observations 3,126 3,126 3,126 3,126 3,126 3,126
R-squared 0.023 0.151 0.171 0.276 0.406 0.417
Panel C: Full sample (no weights)
KALAHI-CIDSS 0.209 0.463 0.458 0.202 0.202 0.203
(0.058)*** (0.035)*** (0.032)*** (0.034)*** (0.035)*** (0.030)***
[0.028]*** [0.024]*** [0.024]*** [0.028]*** [0.027]*** [0.025]***
Fixed effects No Municipal Household Household Household Household
Time trends No No No Overall Overall Regional
Additional controls No No No No Yes Yes
Observations 3,536 3,536 3,536 3,536 3,536 3,536
R-squared 0.038 0.180 0.188 0.294 0.416 0.428
Panel D: Full sample (with weights)
KALAHI-CIDSS 0.180 0.447 0.445 0.202 0.201 0.199
(0.065)** (0.034)*** (0.030)*** (0.034)*** (0.033)*** (0.027)***
[0.030]*** [0.024]*** [0.024]*** [0.030]*** [0.027]*** [0.025]***
Fixed effects No Municipal Household Household Household Household
Time trends No No No Overall Overall Regional
Additional controls No No No No Yes Yes
Observations 3,536 3,536 3,536 3,536 3,536 3,536
R-squared 0.028 0.167 0.173 0.278 0.406 0.418
Notes: Results from OLS (Column 1) and fixed-effects (Columns 2-6) regressions. The dependent variable is the log per capita expenditures (only for households that were classified as poor in 2003). In Panels A and B, the sample is restricted to households that are observed three times. In Panels C and D the full sample is used. In Panels B and D sample weights are used. The standard errors (in parentheses) (resp. [brackets]) account for potential correlation within municipality (resp. within village). * denotes significance at the 10 percent, ** at the 5 percent and, *** at the 1 percent level.

The KALAHI-CIDSS Impact Evaluation: A Revised Synthesis Report 27
Table 5: Impacts on log per capita expenditures (non-poor households)
(1) (2) (3) (4) (5) (6)
Panel A: Balanced panel (no weights)
KALAHI-CIDSS -0.028 0.048 0.048 -0.019 0.020 0.009
(0.069) (0.052) (0.052) (0.050) (0.047) (0.024)
[0.046] [0.035] [0.035] [0.037] [0.035] [0.031]
Fixed effects No Municipal Household Household Household Household
Time trends No No No Overall Overall Regional
Additional controls No No No No Yes Yes
Observations 2,526 2,526 2,526 2,526 2,526 2,526
R-squared 0.001 0.065 0.002 0.010 0.164 0.184
Panel B: Balanced panel (with weights)
KALAHI-CIDSS -0.064 0.032 0.032 -0.021 0.022 0.009
(0.068) (0.052) (0.052) (0.050) (0.049) (0.025)
[0.053] [0.036] [0.035] [0.041] [0.038] [0.034]
Fixed effects No Municipal Household Household Household Household
Time trends No No No Overall Overall Regional
Additional controls No No No No Yes Yes
Observations 2,526 2,526 2,526 2,526 2,526 2,526
R-squared 0.002 0.060 0.001 0.006 0.179 0.198
Panel C: Full sample (no weights)
KALAHI-CIDSS -0.039 0.031 0.036 -0.033 0.007 -0.004
(0.067) (0.044) (0.050) (0.048) (0.046) (0.023)
[0.044] [0.032] [0.032] [0.034] [0.033] [0.029]
Fixed effects No Municipal Household Household Household Household
Time trends No No No Overall Overall Regional
Additional controls No No No No Yes Yes
Observations 2,866 2,866 2,866 2,866 2,866 2,866
R-squared 0.001 0.069 0.001 0.010 0.159 0.180
Panel D: Full sample (with weights)
KALAHI-CIDSS -0.073 0.023 0.022 -0.031 0.012 0.000
(0.066) (0.045) (0.050) (0.048) (0.048) (0.024)
[0.052] [0.032] [0.033] [0.038] [0.036] [0.031]
Fixed effects No Municipal Household Household Household Household
Time trends No No No Overall Overall Regional
Additional controls No No No No Yes Yes
Observations 2,866 2,866 2,866 2,866 2,866 2,866
R-squared 0.003 0.062 0.000 0.006 0.175 0.194
Notes: Results from OLS (Column 1) and fixed-effects (Columns 2-6) regressions. The dependent variable is the log per capita expenditures (only for households that were classified as non-poor in 2003). In Panels A and B, the sample is restricted to households that are observed three times. In Panels C and D the full sample is used. In Panels B and D sample weights are used. The standard errors (in parentheses) (resp. [brackets]) account for potential correlation within municipality (resp. within village). * denotes significance at the 10 percent, ** at the 5 percent and, *** at the 1 percent level.

28 Philippines
Table 6: Impacts on poverty levels
(1) (2) (3) (4) (5) (6)
Panel A: Balanced panel (no weights)
KALAHI-CIDSS -0.043 -0.190 -0.190 -0.069 -0.079 -0.079
(0.057) (0.023)*** (0.023)*** (0.031)** (0.029)** (0.023)***
[0.026] [0.018]*** [0.018]*** [0.023]*** [0.023]*** [0.022]***
Fixed effects No Municipal Household Household Household Household
Time trends No No No Overall Overall Regional
Additional controls No No No No Yes Yes
Observations 5,652 5,652 5,652 5,652 5,652 5,652
R-squared 0.002 0.106 0.036 0.065 0.151 0.155
Panel B: Balanced panel (with weights)
KALAHI-CIDSS -0.025 -0.184 -0.184 -0.075 -0.085 -0.079
(0.058) (0.020)*** (0.019)*** (0.026)** (0.024)*** (0.020)***
[0.028] [0.017]*** [0.017]*** [0.024]*** [0.023]*** [0.022]***
Fixed effects No Municipal Household Household Household Household
Time trends No No No Overall Overall Regional
Additional controls No No No No Yes Yes
Observations 5,652 5,652 5,652 5,652 5,652 5,652
R-squared 0.001 0.097 0.031 0.056 0.157 0.159
Panel C: Full sample (no weights)
KALAHI-CIDSS -0.049 -0.183 -0.177 -0.056 -0.067 -0.067
(0.055) (0.020)*** (0.018)*** (0.026)** (0.025)** (0.020)***
[0.026]* [0.016]*** [0.016]*** [0.021]*** [0.021]*** [0.020]***
Fixed effects No Municipal Household Household Household Household
Time trends No No No Overall Overall Regional
Additional controls No No No No Yes Yes
Observations 6,402 6,402 6,402 6,402 6,402 6,402
R-squared 0.002 0.104 0.033 0.063 0.150 0.154
Panel D: Full sample (with weights)
KALAHI-CIDSS -0.027 -0.175 -0.173 -0.064 -0.074 -0.069
(0.057) (0.017)*** (0.016)*** (0.022)** (0.021)*** (0.017)***
[0.028] [0.017]*** [0.017]*** [0.023]*** [0.022]*** [0.021]***
Fixed effects No Municipal Household Household Household Household
Time trends No No No Overall Overall Regional
Additional controls No No No No Yes Yes
Observations 6,402 6,402 6,402 6,402 6,402 6,402
R-squared 0.001 0.095 0.029 0.054 0.155 0.157
Notes: Results from OLS (Column 1) and fixed-effects (Columns 2-6) regressions. The dependent variable is a dummy equal to one if the household is classified as poor. In Panels A and B, the sample is restricted to households that are observed three times. In Panels C and D the full sample is used. In Panels B and D sample weights are used. The standard errors (in parentheses) (resp. [brackets]) account for potential cor-relation within municipality (resp. within village). * denotes significance at the 10 percent, ** at the 5 percent and, *** at the 1 percent level.

The KALAHI-CIDSS Impact Evaluation: A Revised Synthesis Report 29
Table 7: Impacts on non-food share of total consumption
(1) (2) (3) (4) (5) (6)
Panel A: Balanced panel (no weights)
KALAHI-CIDSS 3.089 9.187 9.187 5.027 5.078 5.030
(2.076) (1.239)*** (1.238)*** (1.704)*** (1.717)*** (1.391)***
[0.967]*** [0.715]*** [0.714]*** [0.889]*** [0.907]*** [0.799]***
Fixed effects No Municipal Household Household Household Household
Time trends No No No Overall Overall Regional
Additional controls No No No No Yes Yes
Observations 5,652 5,652 5,652 5,652 5,652 5,652
R-squared 0.008 0.100 0.065 0.091 0.098 0.109
Panel B: Balanced panel (with weights)
KALAHI-CIDSS 2.091 9.305 9.305 5.845 5.915 5.752
(2.079) (1.230)*** (1.228)*** (1.613)*** (1.636)*** (1.481)***
[1.021]** [0.742]*** [0.741]*** [0.918]*** [0.943]*** [0.880]***
Fixed effects No Municipal Household Household Household Household
Time trends No No No Overall Overall Regional
Additional controls No No No No Yes Yes
Observations 5,652 5,652 5,652 5,652 5,652 5,652
R-squared 0.003 0.094 0.063 0.082 0.088 0.097
Panel C: Full sample (no weights)
KALAHI-CIDSS 3.525 9.051 9.025 4.861 4.929 4.901
(2.090) (1.134)*** (1.237)*** (1.721)** (1.727)** (1.374)***
[0.947]*** [0.641]*** [0.686]*** [0.867]*** [0.881]*** [0.763]***
Fixed effects No Municipal Household Household Household Household
Time trends No No No Overall Overall Regional
Additional controls No No No No Yes Yes
Observations 6,402 6,402 6,402 6,402 6,402 6,402
R-squared 0.009 0.108 0.065 0.091 0.099 0.110
Panel D: Full sample (with weights)
KALAHI-CIDSS 2.340 9.192 9.163 5.777 5.847 5.680
(2.117) (1.103)*** (1.178)*** (1.574)*** (1.602)*** (1.413)***
[1.004]** [0.643]*** [0.688]*** [0.865]*** [0.891]*** [0.816]***
Fixed effects No Municipal Household Household Household Household
Time trends No No No Overall Overall Regional
Additional controls No No No No Yes Yes
Observations 6,402 6,402 6,402 6,402 6,402 6,402
R-squared 0.004 0.100 0.062 0.081 0.089 0.097
Notes: Results from OLS (Column 1) and fixed-effects (Columns 2-6) regressions. The dependent variable is the share of non-food to total expenditures. In Panels A and B, the sample is restricted to households that are observed three times. In Panels C and D the full sample is used. In Panels B and D sample weights are used. The standard errors (in parentheses) (resp. [brackets]) account for potential correlation within municipality (resp. within village). * denotes significance at the 10 percent, ** at the 5 percent and, *** at the 1 percent level.

30 Philippines
Table 8: Impacts on log per capita food expenditures
(1) (2) (3) (4) (5) (6)
Panel A: Balanced panel (no weights)
KALAHI-CIDSS 0.020 0.127 0.127 0.030 0.043 0.043
(0.040) (0.030)*** (0.030)*** (0.037) (0.034) (0.026)
[0.024] [0.021]*** [0.021]*** [0.026] [0.023]* [0.021]**
Fixed effects No Municipal Household Household Household Household
Time trends No No No Overall Overall Regional
Additional controls No No No No Yes Yes
Observations 5,652 5,652 5,652 5,652 5,652 5,652
R-squared 0.000 0.075 0.020 0.043 0.221 0.227
Panel B: Balanced panel (with weights)
KALAHI-CIDSS 0.003 0.117 0.117 0.021 0.033 0.030
(0.037) (0.030)*** (0.030)*** (0.036) (0.033) (0.025)
[0.025] [0.022]*** [0.022]*** [0.027] [0.023] [0.022]
Fixed effects No Municipal Household Household Household Household
Time trends No No No Overall Overall Regional
Additional controls No No No No Yes Yes
Observations 5,652 5,652 5,652 5,652 5,652 5,652
R-squared 0.000 0.062 0.016 0.039 0.222 0.225
Panel C: Full sample (no weights)
KALAHI-CIDSS 0.024 0.126 0.122 0.025 0.040 0.040
(0.039) (0.031)*** (0.029)*** (0.036) (0.034) (0.026)
[0.023] [0.020]*** [0.020]*** [0.025] [0.022]* [0.020]**
Fixed effects No Municipal Household Household Household Household
Time trends No No No Overall Overall Regional
Additional controls No No No No Yes Yes
Observations 6,402 6,402 6,402 6,402 6,402 6,402
R-squared 0.001 0.082 0.019 0.042 0.212 0.217
Panel D: Full sample (with weights)
KALAHI-CIDSS 0.006 0.114 0.113 0.018 0.030 0.027
(0.036) (0.031)*** (0.028)*** (0.035) (0.032) (0.025)
[0.024] [0.021]*** [0.021]*** [0.026] [0.022] [0.021]
Fixed effects No Municipal Household Household Household Household
Time trends No No No Overall Overall Regional
Additional controls No No No No Yes Yes
Observations 6,402 6,402 6,402 6,402 6,402 6,402
R-squared 0.000 0.067 0.015 0.038 0.216 0.219
Notes: Results from OLS (Column 1) and fixed-effects (Columns 2-6) regressions. The dependent variable is the log per capita food expenditures. In Panels A and B, the sample is restricted to households that are observed three times. In Panels C and D the full sample is used. In Panels B and D sample weights are used. The standard errors (in parentheses) (resp. [brackets]) account for potential correlation within municipality (resp. within village). * denotes significance at the 10 percent, ** at the 5 percent and, *** at the 1 percent level.

The KALAHI-CIDSS Impact Evaluation: A Revised Synthesis Report 31
Table 9: Impacts on log per capita non-food expenditures
(1) (2) (3) (4) (5) (6)
Panel A: Balanced panel (no weights)
KALAHI-CIDSS 0.192 0.588 0.588 0.276 0.292 0.290
(0.134) (0.062)*** (0.062)*** (0.079)*** (0.081)*** (0.070)***
[0.062]*** [0.038]*** [0.038]*** [0.045]*** [0.046]*** [0.042]***
Fixed effects No Municipal Household Household Household Household
Time trends No No No Overall Overall Regional
Additional controls No No No No Yes Yes
Observations 5,652 5,652 5,652 5,652 5,652 5,652
R-squared 0.008 0.138 0.093 0.145 0.213 0.224
Panel B: Balanced panel (with weights)
KALAHI-CIDSS 0.127 0.585 0.585 0.312 0.326 0.317
(0.133) (0.056)*** (0.056)*** (0.071)*** (0.073)*** (0.068)***
[0.065]* [0.039]*** [0.038]*** [0.048]*** [0.049]*** [0.047]***
Fixed effects No Municipal Household Household Household Household
Time trends No No No Overall Overall Regional
Additional controls No No No No Yes Yes
Observations 5,652 5,652 5,652 5,652 5,652 5,652
R-squared 0.003 0.123 0.085 0.127 0.199 0.208
Panel C: Full sample (no weights)
KALAHI-CIDSS 0.219 0.583 0.574 0.261 0.279 0.278
(0.133) (0.057)*** (0.059)*** (0.078)*** (0.081)*** (0.070)***
[0.061]*** [0.035]*** [0.037]*** [0.045]*** [0.045]*** [0.042]***
Fixed effects No Municipal Household Household Household Household
Time trends No No No Overall Overall Regional
Additional controls No No No No Yes Yes
Observations 6,402 6,402 6,402 6,402 6,402 6,402
R-squared 0.010 0.148 0.090 0.142 0.210 0.221
Panel D: Full sample (with weights)
KALAHI-CIDSS 0.142 0.579 0.575 0.305 0.320 0.311
(0.133) (0.050)*** (0.052)*** (0.068)*** (0.071)*** (0.065)***
[0.065]** [0.034]*** [0.036]*** [0.046]*** [0.047]*** [0.045]***
Fixed effects No Municipal Household Household Household Household
Time trends No No No Overall Overall Regional
Additional controls No No No No Yes Yes
Observations 6,402 6,402 6,402 6,402 6,402 6,402
R-squared 0.004 0.131 0.084 0.126 0.197 0.207
Notes: Results from OLS (Column 1) and fixed-effects (Columns 2-6) regressions. The dependent variable is the log per capita non-food expenditures. In Panels A and B, the sample is restricted to households that are observed three times. In Panels C and D the full sample is used. In Panels B and D sample weights are used. The standard errors (in parentheses) (resp. [brackets]) account for potential correlation within mu-nicipality (resp. within village). * denotes significance at the 10 percent, ** at the 5 percent and, *** at the 1 percent level.

32 Philippines
Table 10: Impacts on self-rated poverty levels
(1) (2) (3) (4) (5) (6)
Panel A: Balanced panel (no weights)
KALAHI-CIDSS 0.012 -0.037 -0.037 0.000 -0.002 -0.002
(0.048) (0.036) (0.036) (0.041) (0.042) (0.032)
[0.024] [0.021]* [0.021]* [0.026] [0.026] [0.024]
Fixed effects No Municipal Household Household Household Household
Time trends No No No Overall Overall Regional
Additional controls No No No No Yes Yes
Observations 5,652 5,652 5,652 5,652 5,652 5,652
R-squared 0.000 0.047 0.001 0.004 0.006 0.013
Panel B: Balanced panel (with weights)
KALAHI-CIDSS 0.029 -0.023 -0.023 0.001 -0.001 0.004
(0.050) (0.038) (0.038) (0.041) (0.041) (0.031)
[0.024] [0.021] [0.021] [0.025] [0.025] [0.023]
Fixed effects No Municipal Household Household Household Household
Time trends No No No Overall Overall Regional
Additional controls No No No No Yes Yes
Observations 5,652 5,652 5,652 5,652 5,652 5,652
R-squared 0.001 0.045 0.000 0.002 0.004 0.010
Panel C: Full sample (no weights)
KALAHI-CIDSS 0.003 -0.039 -0.040 -0.004 -0.006 -0.006
(0.047) (0.037) (0.035) (0.039) (0.040) (0.031)
[0.023] [0.021]* [0.020]* [0.025] [0.025] [0.023]
Fixed effects No Municipal Household Household Household Household
Time trends No No No Overall Overall Regional
Additional controls No No No No Yes Yes
Observations 6,402 6,402 6,402 6,402 6,402 6,402
R-squared 0.000 0.046 0.002 0.004 0.006 0.013
Panel D: Full sample (with weights)
KALAHI-CIDSS 0.023 -0.024 -0.027 -0.004 -0.007 -0.001
(0.049) (0.039) (0.038) (0.040) (0.041) (0.030)
[0.023] [0.021] [0.021] [0.024] [0.024] [0.022]
Fixed effects No Municipal Household Household Household Household
Time trends No No No Overall Overall Regional
Additional controls No No No No Yes Yes
Observations 6,402 6,402 6,402 6,402 6,402 6,402
R-squared 0.000 0.043 0.001 0.002 0.004 0.010
Notes: Results from OLS (Column 1) and fixed-effects (Columns 2-6) regressions. The dependent variable is a dummy equal to one if the household classified itself as poor. In Panels A and B, the sample is restricted to households that are observed three times. In Panels C and D the full sample is used. In Panels B and D sample weights are used. The standard errors (in parentheses) (resp. [brackets]) account for potential cor-relation within municipality (resp. within village). * denotes significance at the 10 percent, ** at the 5 percent and, *** at the 1 percent level.

The KALAHI-CIDSS Impact Evaluation: A Revised Synthesis Report 33
Table 11: Impacts on employment
(1) (2) (3) (4) (5) (6)
Panel A: Balanced panel (no weights)
KALAHI-CIDSS -0.006 -0.026 -0.021 0.035 0.040 0.042
(0.021) (0.031) (0.030) (0.032) (0.031) (0.016)**
[0.012] [0.016] [0.016] [0.018]* [0.017]** [0.013]***
Fixed effects No Municipal Household Household Household Household
Time trends No No No Overall Overall Regional
Additional controls No No No No Yes Yes
Observations 17,035 17,035 17,035 17,035 17,035 17,035
R-squared 0.000 0.017 0.000 0.003 0.314 0.319
Panel B: Balanced panel (with weights)
KALAHI-CIDSS -0.013 -0.022 -0.016 0.046 0.050 0.050
(0.029) (0.027) (0.026) (0.029) (0.028)* (0.015)***
[0.013] [0.015] [0.016] [0.017]*** [0.017]*** [0.014]***
Fixed effects No Municipal Household Household Household Household
Time trends No No No Overall Overall Regional
Additional controls No No No No Yes Yes
Observations 17,035 17,035 17,035 17,035 17,035 17,035
R-squared 0.000 0.019 0.000 0.004 0.314 0.318
Panel C: Full sample (no weights)
KALAHI-CIDSS -0.007 -0.025 -0.022 0.031 0.038 0.039
(0.021) (0.029) (0.029) (0.031) (0.030) (0.016)**
[0.011] [0.016] [0.016] [0.017]* [0.017]** [0.013]***
Fixed effects No Municipal Household Household Household Household
Time trends No No No Overall Overall Regional
Additional controls No No No No Yes Yes
Observations 18,928 18,928 18,928 18,928 18,928 18,928
R-squared 0.000 0.016 0.000 0.003 0.317 0.323
Panel D: Full sample (with weights)
KALAHI-CIDSS -0.014 -0.020 -0.014 0.046 0.051 0.050
(0.029) (0.025) (0.026) (0.028) (0.027)* (0.015)***
[0.013] [0.015] [0.015] [0.017]*** [0.016]*** [0.013]***
Fixed effects No Municipal Household Household Household Household
Time trends No No No Overall Overall Regional
Additional controls No No No No Yes Yes
Observations 18,928 18,928 18,928 18,928 18,928 18,928
R-squared 0.000 0.019 0.000 0.004 0.316 0.320
Notes: Results from OLS (Column 1) and fixed-effects (Columns 2-6) regressions. The dependent variable is a dummy equal to one if the individual is employed. In Panels A and B, the sample is restricted to house-holds that are observed three times. In Panels C and D the full sample is used. In Panels B and D sample weights are used. The standard errors (in parentheses) (resp. [brackets]) account for potential correlation within municipality (resp. within village). * denotes significance at the 10 percent, ** at the 5 percent and, *** at the 1 percent level.

34 Philippines
Table 12: Impacts on male employment
(1) (2) (3) (4) (5) (6)
Panel A: Balanced panel (no weights)
KALAHI-CIDSS 0.001 -0.046 -0.044 0.003 0.004 0.004
(0.022) (0.018)** (0.016)** (0.016) (0.015) (0.014)
[0.013] [0.012]*** [0.012]*** [0.013] [0.013] [0.012]
Fixed effects No Municipal Household Household Household Household
Time trends No No No Overall Overall Regional
Additional controls No No No No Yes Yes
Observations 8,970 8,970 8,970 8,970 8,970 8,970
R-squared 0.000 0.017 0.002 0.005 0.304 0.305
Panel B: Balanced panel (with weights)
KALAHI-CIDSS -0.005 -0.044 -0.042 0.010 0.010 0.012
(0.022) (0.016)** (0.014)*** (0.018) (0.017) (0.015)
[0.014] [0.012]*** [0.012]*** [0.015] [0.014] [0.014]
Fixed effects No Municipal Household Household Household Household
Time trends No No No Overall Overall Regional
Additional controls No No No No Yes Yes
Observations 8,970 8,970 8,970 8,970 8,970 8,970
R-squared 0.000 0.016 0.001 0.006 0.311 0.312
Panel C: Full sample (no weights)
KALAHI-CIDSS -0.003 -0.046 -0.042 0.005 0.004 0.004
(0.022) (0.016)** (0.016)** (0.015) (0.014) (0.013)
[0.013] [0.011]*** [0.011]*** [0.013] [0.012] [0.012]
Fixed effects No Municipal Household Household Household Household
Time trends No No No Overall Overall Regional
Additional controls No No No No Yes Yes
Observations 9,910 9,910 9,910 9,910 9,910 9,910
R-squared 0.000 0.018 0.002 0.005 0.300 0.301
Panel D: Full sample (with weights)
KALAHI-CIDSS -0.007 -0.043 -0.040 0.013 0.012 0.013
(0.022) (0.015)*** (0.014)** (0.017) (0.016) (0.014)
[0.014] [0.012]*** [0.012]*** [0.015] [0.014] [0.014]
Fixed effects No Municipal Household Household Household Household
Time trends No No No Overall Overall Regional
Additional controls No No No No Yes Yes
Observations 9,910 9,910 9,910 9,910 9,910 9,910
R-squared 0.000 0.017 0.001 0.006 0.307 0.307
Notes: Results from OLS (Column 1) and fixed-effects (Columns 2-6) regressions. The dependent variable is a dummy equal to one if the individual is employed. In Panels A and B, the sample is restricted to house-holds that are observed three times. In Panels C and D the full sample is used. In Panels B and D sample weights are used. The standard errors (in parentheses) (resp. [brackets]) account for potential correlation within municipality (resp. within village). * denotes significance at the 10 percent, ** at the 5 percent and, *** at the 1 percent level.

The KALAHI-CIDSS Impact Evaluation: A Revised Synthesis Report 35
Table 13: Impacts on female employment
(1) (2) (3) (4) (5) (6)
Panel A: Balanced panel (no weights)
KALAHI-CIDSS -0.013 0.007 0.016 0.075 0.080 0.080
(0.034) (0.048) (0.048) (0.052) (0.049) (0.020)***
[0.018] [0.026] [0.027] [0.029]** [0.028]*** [0.022]***
Fixed effects No Municipal Household Household Household Household
Time trends No No No Overall Overall Regional
Additional controls No No No No Yes Yes
Observations 8,065 8,065 8,065 8,065 8,065 8,065
R-squared 0.000 0.046 0.000 0.005 0.169 0.188
Panel B: Balanced panel (with weights)
KALAHI-CIDSS -0.023 0.011 0.021 0.088 0.092 0.088
(0.041) (0.042) (0.044) (0.049)* (0.044)* (0.021)***
[0.021] [0.025] [0.026] [0.029]*** [0.027]*** [0.023]***
Fixed effects No Municipal Household Household Household Household
Time trends No No No Overall Overall Regional
Additional controls No No No No Yes Yes
Observations 8,065 8,065 8,065 8,065 8,065 8,065
R-squared 0.000 0.045 0.000 0.006 0.162 0.176
Panel C: Full sample (no weights)
KALAHI-CIDSS -0.013 0.008 0.013 0.070 0.075 0.074
(0.034) (0.047) (0.047) (0.051) (0.049) (0.021)***
[0.018] [0.025] [0.026] [0.029]** [0.028]*** [0.021]***
Fixed effects No Municipal Household Household Household Household
Time trends No No No Overall Overall Regional
Additional controls No No No No Yes Yes
Observations 9,018 9,018 9,018 9,018 9,018 9,018
R-squared 0.000 0.048 0.000 0.004 0.168 0.186
Panel D: Full sample (with weights)
KALAHI-CIDSS -0.023 0.014 0.023 0.089 0.093 0.088
(0.041) (0.042) (0.042) (0.047)* (0.043)** (0.019)***
[0.020] [0.024] [0.025] [0.028]*** [0.027]*** [0.022]***
Fixed effects No Municipal Household Household Household Household
Time trends No No No Overall Overall Regional
Additional controls No No No No Yes Yes
Observations 9,018 9,018 9,018 9,018 9,018 9,018
R-squared 0.000 0.046 0.000 0.006 0.160 0.174
Notes: Results from OLS (Column 1) and fixed-effects (Columns 2-6) regressions. The dependent variable is a dummy equal to one if the individual is employed. In Panels A and B, the sample is restricted to house-holds that are observed three times. In Panels C and D the full sample is used. In Panels B and D sample weights are used. The standard errors (in parentheses) (resp. [brackets]) account for potential correlation within municipality (resp. within village). * denotes significance at the 10 percent, ** at the 5 percent and, *** at the 1 percent level.

36 Philippines
Table 14: Impacts on house accessibility
(1) (2) (3) (4) (5) (6)
Panel A: Balanced panel (no weights)
KALAHI-CIDSS -0.016 0.124 0.124 0.094 0.094 0.094
(0.073) (0.040)*** (0.040)*** (0.040)** (0.040)** (0.036)**
[0.037] [0.028]*** [0.028]*** [0.030]*** [0.030]*** [0.029]***
Fixed effects No Municipal Household Household Household Household
Time trends No No No Overall Overall Regional
Additional controls No No No No Yes Yes
Observations 5,652 5,652 5,652 5,652 5,652 5,652
R-squared 0.000 0.144 0.016 0.018 0.019 0.030
Panel B: Balanced panel (with weights)
KALAHI-CIDSS -0.043 0.134 0.134 0.112 0.111 0.108
(0.082) (0.042)*** (0.042)*** (0.050)** (0.050)** (0.034)***
[0.041] [0.030]*** [0.030]*** [0.033]*** [0.033]*** [0.031]***
Fixed effects No Municipal Household Household Household Household
Time trends No No No Overall Overall Regional
Additional controls No No No No Yes Yes
Observations 5,652 5,652 5,652 5,652 5,652 5,652
R-squared 0.002 0.133 0.018 0.020 0.021 0.037
Panel C: Full sample (no weights)
KALAHI-CIDSS -0.004 0.121 0.126 0.093 0.094 0.095
(0.070) (0.041)*** (0.039)*** (0.039)** (0.039)** (0.036)**
[0.035] [0.027]*** [0.027]*** [0.029]*** [0.029]*** [0.029]***
Fixed effects No Municipal Household Household Household Household
Time trends No No No Overall Overall Regional
Additional controls No No No No Yes Yes
Observations 6,402 6,402 6,402 6,402 6,402 6,402
R-squared 0.000 0.141 0.017 0.020 0.021 0.030
Panel D: Full sample (with weights)
KALAHI-CIDSS -0.032 0.132 0.136 0.111 0.110 0.107
(0.080) (0.040)*** (0.040)*** (0.048)** (0.048)** (0.033)***
[0.040] [0.028]*** [0.029]*** [0.033]*** [0.033]*** [0.031]***
Fixed effects No Municipal Household Household Household Household
Time trends No No No Overall Overall Regional
Additional controls No No No No Yes Yes
Observations 6,402 6,402 6,402 6,402 6,402 6,402
R-squared 0.001 0.131 0.019 0.021 0.022 0.037
Notes: Results from OLS (Column 1) and xed-eects (Columns 2-6) regressions. The dependent variable is a dummy equal to one if the respondent’s house is accessible all year. In Panels A and B, the sample is restricted to households that are observed three times. In Panels C and D the full sample is used. In Panels B and D sample weights are used. The standard errors (in parentheses) (resp. [brackets]) account for po-tential correlation within municipality (resp. within village). * denotes signicance at the 10 percent, ** at the 5 percent and, *** at the 1 percent level.

The KALAHI-CIDSS Impact Evaluation: A Revised Synthesis Report 37
Table 15: Impacts on number of trips to municipal center
(1) (2) (3) (4) (5) (6)
Panel A: Balanced panel (no weights)
KALAHI-CIDSS -1.352 0.430 0.513 0.625 0.639 0.639
(0.777) (0.239)* (0.222)** (0.289)** (0.284)** (0.289)**
[0.558]** [0.215]** [0.230]** [0.281]** [0.274]** [0.276]**
Fixed effects No Municipal Household Household Household Household
Time trends No No No Overall Overall Regional
Additional controls No No No No Yes Yes
Observations 5,629 5,629 5,629 5,629 5,629 5,629
R-squared 0.007 0.085 0.001 0.002 0.008 0.008
Panel B: Balanced panel (with weights)
KALAHI-CIDSS -1.455 0.415 0.496 0.656 0.677 0.675
(0.667)** (0.235)* (0.215)** (0.241)** (0.233)** (0.233)**
[0.581]** [0.218]* [0.232]** [0.289]** [0.280]** [0.277]**
Fixed effects No Municipal Household Household Household Household
Time trends No No No Overall Overall Regional
Additional controls No No No No Yes Yes
Observations 5,629 5,629 5,629 5,629 5,629 5,629
R-squared 0.008 0.069 0.001 0.001 0.009 0.009
Panel C: Full sample (no weights)
KALAHI-CIDSS -1.271 0.405 0.458 0.571 0.587 0.587
(0.775) (0.176)** (0.210)** (0.268)* (0.265)** (0.268)**
[0.544]** [0.187]** [0.213]** [0.264]** [0.257]** [0.259]**
Fixed effects No Municipal Household Household Household Household
Time trends No No No Overall Overall Regional
Additional controls No No No No Yes Yes
Observations 6,376 6,376 6,376 6,376 6,376 6,376
R-squared 0.006 0.087 0.001 0.001 0.008 0.008
Panel D: Full sample (with weights)
KALAHI-CIDSS -1.435 0.363 0.445 0.590 0.614 0.619
(0.676)* (0.169)** (0.202)** (0.217)** (0.214)** (0.213)**
[0.578]** [0.187]* [0.215]** [0.273]** [0.264]** [0.261]**
Fixed effects No Municipal Household Household Household Household
Time trends No No No Overall Overall Regional
Additional controls No No No No Yes Yes
Observations 6,376 6,376 6,376 6,376 6,376 6,376
R-squared 0.007 0.070 0.001 0.001 0.009 0.009
Notes: Results from OLS (Column 1) and xed-eects (Columns 2-6) regressions. The dependent variable is the number of trips to the municipal center taken by the respondent in the month before the survey took place. In Panels A and B, the sample is restricted to households that are observed three times. In Panels C and D the full sample is used. In Panels B and D sample weights are used. The standard errors (in paren-theses) (resp. [brackets]) account for potential correlation within municipality (resp. within village). * denotes signicance at the 10 percent, ** at the 5 percent and, *** at the 1 percent level.

38 Philippines
Table 16: Impacts on log per capita transportation expenditures
(1) (2) (3) (4) (5) (6)
Panel A: Balanced panel (no weights)
KALAHI-CIDSS 0.146 0.579 0.579 0.353 0.364 0.366
(0.169) (0.095)*** (0.094)*** (0.141)** (0.145)** (0.138)**
[0.097] [0.081]*** [0.080]*** [0.105]*** [0.105]*** [0.103]***
Fixed effects No Municipal Household Household Household Household
Time trends No No No Overall Overall Regional
Additional controls No No No No Yes Yes
Observations 5,652 5,652 5,652 5,652 5,652 5,652
R-squared 0.001 0.050 0.017 0.023 0.034 0.036
Panel B: Balanced panel (with weights)
KALAHI-CIDSS 0.033 0.597 0.597 0.405 0.417 0.399
(0.168) (0.068)*** (0.068)*** (0.108)*** (0.111)*** (0.108)***
[0.091] [0.081]*** [0.081]*** [0.100]*** [0.100]*** [0.099]***
Fixed effects No Municipal Household Household Household Household
Time trends No No No Overall Overall Regional
Additional controls No No No No Yes Yes
Observations 5,652 5,652 5,652 5,652 5,652 5,652
R-squared 0.000 0.045 0.018 0.022 0.033 0.034
Panel C: Full sample (no weights)
KALAHI-CIDSS 0.180 0.576 0.559 0.325 0.338 0.340
(0.172) (0.090)*** (0.102)*** (0.147)** (0.149)** (0.145)**
[0.096]* [0.074]*** [0.079]*** [0.103]*** [0.102]*** [0.101]***
Fixed effects No Municipal Household Household Household Household
Time trends No No No Overall Overall Regional
Additional controls No No No No Yes Yes
Observations 6,402 6,402 6,402 6,402 6,402 6,402
R-squared 0.002 0.051 0.016 0.022 0.032 0.034
Panel D: Full sample (with weights)
KALAHI-CIDSS 0.055 0.581 0.568 0.372 0.383 0.365
(0.164) (0.068)*** (0.072)*** (0.109)*** (0.114)*** (0.114)***
[0.089] [0.070]*** [0.075]*** [0.095]*** [0.094]*** [0.094]***
Fixed effects No Municipal Household Household Household Household
Time trends No No No Overall Overall Regional
Additional controls No No No No Yes Yes
Observations 6,402 6,402 6,402 6,402 6,402 6,402
R-squared 0.000 0.045 0.016 0.020 0.031 0.032
Notes: Results from OLS (Column 1) and xed-eects (Columns 2-6) regressions. The dependent variable is the log per capita transport expenditures. In Panels A and B, the sample is restricted to households that are observed three times. In Panels C and D the full sample is used. In Panels B and D sample weights are used. The standard errors (in parentheses) (resp. [brackets]) account for potential correlation within municipality (resp. within village). * denotes signicance at the 10 percent, ** at the 5 percent and, *** at the 1 percent level.
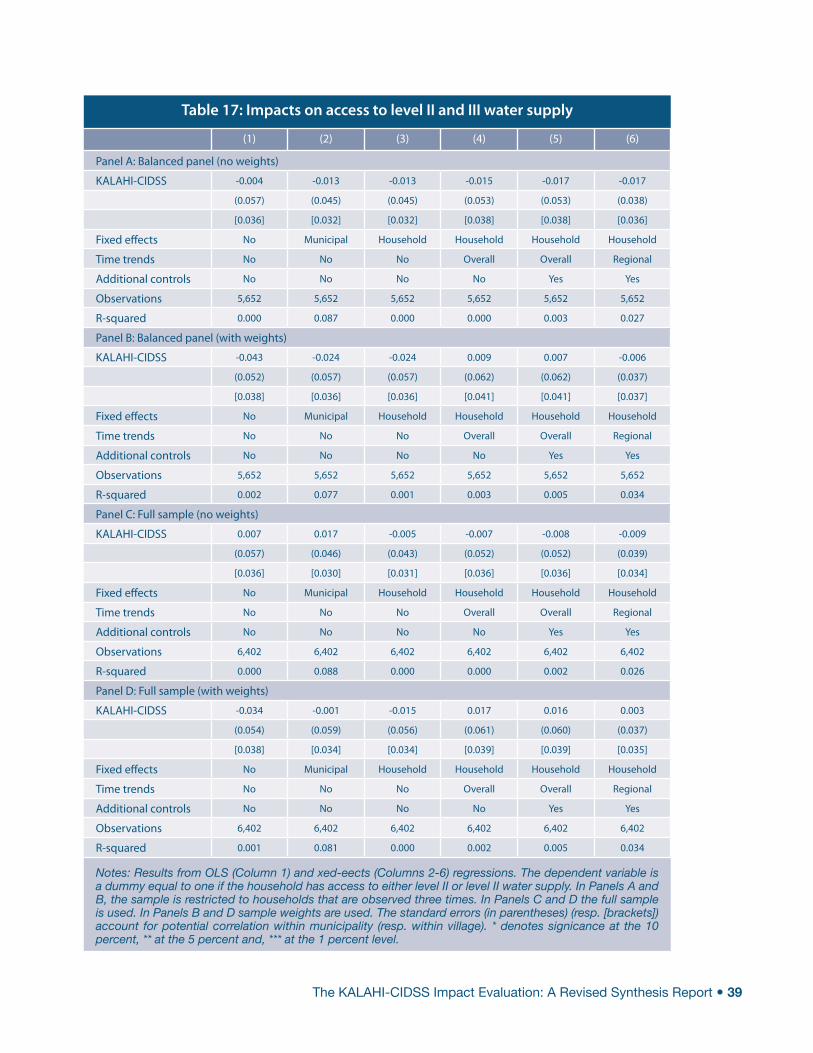
The KALAHI-CIDSS Impact Evaluation: A Revised Synthesis Report 39
Table 17: Impacts on access to level II and III water supply
(1) (2) (3) (4) (5) (6)
Panel A: Balanced panel (no weights)
KALAHI-CIDSS -0.004 -0.013 -0.013 -0.015 -0.017 -0.017
(0.057) (0.045) (0.045) (0.053) (0.053) (0.038)
[0.036] [0.032] [0.032] [0.038] [0.038] [0.036]
Fixed effects No Municipal Household Household Household Household
Time trends No No No Overall Overall Regional
Additional controls No No No No Yes Yes
Observations 5,652 5,652 5,652 5,652 5,652 5,652
R-squared 0.000 0.087 0.000 0.000 0.003 0.027
Panel B: Balanced panel (with weights)
KALAHI-CIDSS -0.043 -0.024 -0.024 0.009 0.007 -0.006
(0.052) (0.057) (0.057) (0.062) (0.062) (0.037)
[0.038] [0.036] [0.036] [0.041] [0.041] [0.037]
Fixed effects No Municipal Household Household Household Household
Time trends No No No Overall Overall Regional
Additional controls No No No No Yes Yes
Observations 5,652 5,652 5,652 5,652 5,652 5,652
R-squared 0.002 0.077 0.001 0.003 0.005 0.034
Panel C: Full sample (no weights)
KALAHI-CIDSS 0.007 0.017 -0.005 -0.007 -0.008 -0.009
(0.057) (0.046) (0.043) (0.052) (0.052) (0.039)
[0.036] [0.030] [0.031] [0.036] [0.036] [0.034]
Fixed effects No Municipal Household Household Household Household
Time trends No No No Overall Overall Regional
Additional controls No No No No Yes Yes
Observations 6,402 6,402 6,402 6,402 6,402 6,402
R-squared 0.000 0.088 0.000 0.000 0.002 0.026
Panel D: Full sample (with weights)
KALAHI-CIDSS -0.034 -0.001 -0.015 0.017 0.016 0.003
(0.054) (0.059) (0.056) (0.061) (0.060) (0.037)
[0.038] [0.034] [0.034] [0.039] [0.039] [0.035]
Fixed effects No Municipal Household Household Household Household
Time trends No No No Overall Overall Regional
Additional controls No No No No Yes Yes
Observations 6,402 6,402 6,402 6,402 6,402 6,402
R-squared 0.001 0.081 0.000 0.002 0.005 0.034
Notes: Results from OLS (Column 1) and xed-eects (Columns 2-6) regressions. The dependent variable is a dummy equal to one if the household has access to either level II or level II water supply. In Panels A and B, the sample is restricted to households that are observed three times. In Panels C and D the full sample is used. In Panels B and D sample weights are used. The standard errors (in parentheses) (resp. [brackets]) account for potential correlation within municipality (resp. within village). * denotes signicance at the 10 percent, ** at the 5 percent and, *** at the 1 percent level.

40 Philippines
Table 18: Impacts on access to safe water
(1) (2) (3) (4) (5) (6)
Panel A: Balanced panel (no weights)
KALAHI-CIDSS 0.052 0.004 0.004 -0.001 0.000 0.000
(0.031) (0.015) (0.015) (0.024) (0.024) (0.024)
[0.020]** [0.014] [0.014] [0.021] [0.021] [0.021]
Fixed effects No Municipal Household Household Household Household
Time trends No No No Overall Overall Regional
Additional controls No No No No Yes Yes
Observations 5,652 5,652 5,652 5,652 5,652 5,652
R-squared 0.005 0.048 0.000 0.000 0.002 0.005
Panel B: Balanced panel (with weights)
KALAHI-CIDSS 0.051 0.005 0.005 -0.004 -0.003 -0.001
(0.039) (0.013) (0.013) (0.021) (0.021) (0.023)
[0.023]** [0.014] [0.014] [0.020] [0.020] [0.021]
Fixed effects No Municipal Household Household Household Household
Time trends No No No Overall Overall Regional
Additional controls No No No No Yes Yes
Observations 5,652 5,652 5,652 5,652 5,652 5,652
R-squared 0.004 0.050 0.000 0.000 0.003 0.005
Panel C: Full sample (no weights)
KALAHI-CIDSS 0.048 0.001 0.000 -0.003 -0.002 -0.002
(0.029) (0.014) (0.014) (0.022) (0.022) (0.022)
[0.019]** [0.013] [0.014] [0.020] [0.020] [0.020]
Fixed effects No Municipal Household Household Household Household
Time trends No No No Overall Overall Regional
Additional controls No No No No Yes Yes
Observations 6,402 6,402 6,402 6,402 6,402 6,402
R-squared 0.004 0.047 0.000 0.000 0.002 0.005
Panel D: Full sample (with weights)
KALAHI-CIDSS 0.047 0.003 0.001 -0.006 -0.004 -0.003
(0.037) (0.013) (0.013) (0.021) (0.021) (0.023)
[0.022]** [0.013] [0.013] [0.019] [0.019] [0.020]
Fixed effects No Municipal Household Household Household Household
Time trends No No No Overall Overall Regional
Additional controls No No No No Yes Yes
Observations 6,402 6,402 6,402 6,402 6,402 6,402
R-squared 0.003 0.047 0.000 0.000 0.003 0.005
Notes: Results from OLS (Column 1) and xed-eects (Columns 2-6) regressions. The dependent variable is a dummy equal to one if the water is safe for drinking. In Panels A and B, the sample is restricted to house-holds that are observed three times. In Panels C and D the full sample is used. In Panels B and D sample weights are used. The standard errors (in parentheses) (resp. [brackets]) account for potential correlation within municipality (resp. within village). * denotes signicance at the 10 percent, ** at the 5 percent and, *** at the 1 percent level.

The KALAHI-CIDSS Impact Evaluation: A Revised Synthesis Report 41
Table 19: Impacts on access to water-sealed toilets
(1) (2) (3) (4) (5) (6)
Panel A: Balanced panel (no weights)
KALAHI-CIDSS 0.007 0.107 0.107 0.023 0.022 0.022
(0.041) (0.029)*** (0.029)*** (0.032) (0.032) (0.029)
[0.029] [0.023]*** [0.023]*** [0.026] [0.026] [0.026]
Fixed effects No Municipal Household Household Household Household
Time trends No No No Overall Overall Regional
Additional controls No No No No Yes Yes
Observations 5,652 5,652 5,652 5,652 5,652 5,652
R-squared 0.000 0.068 0.015 0.034 0.036 0.039
Panel B: Balanced panel (with weights)
KALAHI-CIDSS 0.002 0.107 0.107 0.034 0.033 0.027
(0.051) (0.025)*** (0.025)*** (0.029) (0.030) (0.026)
[0.032] [0.021]*** [0.020]*** [0.025] [0.025] [0.025]
Fixed effects No Municipal Household Household Household Household
Time trends No No No Overall Overall Regional
Additional controls No No No No Yes Yes
Observations 5,652 5,652 5,652 5,652 5,652 5,652
R-squared 0.000 0.072 0.014 0.029 0.033 0.036
Panel C: Full sample (no weights)
KALAHI-CIDSS 0.016 0.118 0.095 0.011 0.011 0.011
(0.039) (0.025)*** (0.030)*** (0.032) (0.032) (0.029)
[0.029] [0.023]*** [0.024]*** [0.027] [0.027] [0.027]
Fixed effects No Municipal Household Household Household Household
Time trends No No No Overall Overall Regional
Additional controls No No No No Yes Yes
Observations 6,402 6,402 6,402 6,402 6,402 6,402
R-squared 0.000 0.064 0.013 0.032 0.035 0.037
Panel D: Full sample (with weights)
KALAHI-CIDSS 0.008 0.112 0.096 0.023 0.022 0.016
(0.051) (0.023)*** (0.026)*** (0.030) (0.030) (0.026)
[0.032] [0.020]*** [0.020]*** [0.025] [0.025] [0.025]
Fixed effects No Municipal Household Household Household Household
Time trends No No No Overall Overall Regional
Additional controls No No No No Yes Yes
Observations 6,402 6,402 6,402 6,402 6,402 6,402
R-squared 0.000 0.070 0.012 0.027 0.031 0.034
Notes: Results from OLS (Column 1) and xed-eects (Columns 2-6) regressions. The dependent variable is a dummy equal to one if the household has water sealed toilets. In Panels A and B, the sample is restricted to households that are observed three times. In Panels C and D the full sample is used. In Panels B and D sample weights are used. The standard errors (in parentheses) (resp. [brackets]) account for potential cor-relation within municipality (resp. within village). * denotes signicance at the 10 percent, ** at the 5 percent and, *** at the 1 percent level.

42 Philippines
Table 20: Impacts on access to health services
(1) (2) (3) (4) (5) (6)
Panel A: Balanced panel (no weights)
KALAHI-CIDSS -0.020 -0.005 -0.008 0.001 -0.003 -0.003
(0.052) (0.048) (0.045) (0.059) (0.058) (0.058)
[0.024] [0.028] [0.026] [0.032] [0.031] [0.031]
Fixed effects No Municipal Household Household Household Household
Time trends No No No Overall Overall Regional
Additional controls No No No No Yes Yes
Observations 16,136 16,136 16,136 16,136 16,136 16,136
R-squared 0.000 0.044 0.000 0.000 0.041 0.041
Panel B: Balanced panel (with weights)
KALAHI-CIDSS -0.013 0.021 0.023 0.044 0.038 0.038
(0.069) (0.062) (0.060) (0.067) (0.068) (0.064)
[0.030] [0.031] [0.032] [0.036] [0.036] [0.035]
Fixed effects No Municipal Household Household Household Household
Time trends No No No Overall Overall Regional
Additional controls No No No No Yes Yes
Observations 16,136 16,136 16,136 16,136 16,136 16,136
R-squared 0.000 0.054 0.000 0.001 0.043 0.043
Panel C: Full sample (no weights)
KALAHI-CIDSS -0.020 -0.011 -0.012 -0.003 -0.007 -0.007
(0.052) (0.046) (0.041) (0.053) (0.051) (0.051)
[0.024] [0.028] [0.025] [0.030] [0.029] [0.029]
Fixed effects No Municipal Household Household Household Household
Time trends No No No Overall Overall Regional
Additional controls No No No No Yes Yes
Observations 18,040 18,040 18,040 18,040 18,040 18,040
R-squared 0.000 0.045 0.000 0.000 0.042 0.042
Panel D: Full sample (with weights)
KALAHI-CIDSS -0.012 0.012 0.017 0.036 0.031 0.032
(0.069) (0.057) (0.056) (0.062) (0.062) (0.059)
[0.030] [0.030] [0.030] [0.034] [0.034] [0.033]
Fixed effects No Municipal Household Household Household Household
Time trends No No No Overall Overall Regional
Additional controls No No No No Yes Yes
Observations 18,040 18,040 18,040 18,040 18,040 18,040
R-squared 0.000 0.055 0.000 0.001 0.042 0.043
Notes: Results from OLS (Column 1) and xed-eects (Columns 2-6) regressions. The dependent variable is a dummy equal to one if the individual visited a health clinic when sick. In Panels A and B, the sample is restricted to households that are observed three times. In Panels C and D the full sample is used. In Panels B and D sample weights are used. The standard errors (in parentheses) (resp. [brackets]) account for po-tential correlation within municipality (resp. within village). * denotes signicance at the 10 percent, ** at the 5 percent and, *** at the 1 percent level.

The KALAHI-CIDSS Impact Evaluation: A Revised Synthesis Report 43
Table 21: Impacts on access to health services (Male sample)
(1) (2) (3) (4) (5) (6)
Panel A: Balanced panel (no weights)
KALAHI-CIDSS -0.017 0.006 0.001 0.026 0.017 0.017
(0.048) (0.045) (0.046) (0.060) (0.058) (0.058)
[0.024] [0.028] [0.029] [0.034] [0.033] [0.034]
Fixed effects No Municipal Household Household Household Household
Time trends No No No Overall Overall Regional
Additional controls No No No No Yes Yes
Observations 8,296 8,296 8,296 8,296 8,296 8,296
R-squared 0.000 0.039 0.000 0.001 0.050 0.050
Panel B: Balanced panel (with weights)
KALAHI-CIDSS -0.011 0.029 0.034 0.073 0.062 0.063
(0.064) (0.055) (0.060) (0.069) (0.068) (0.065)
[0.030] [0.033] [0.036] [0.041]* [0.040] [0.039]
Fixed effects No Municipal Household Household Household Household
Time trends No No No Overall Overall Regional
Additional controls No No No No Yes Yes
Observations 8,296 8,296 8,296 8,296 8,296 8,296
R-squared 0.000 0.048 0.001 0.003 0.051 0.052
Panel C: Full sample (no weights)
KALAHI-CIDSS -0.019 -0.002 -0.008 0.016 0.009 0.009
(0.047) (0.043) (0.042) (0.054) (0.051) (0.051)
[0.024] [0.028] [0.027] [0.032] [0.031] [0.031]
Fixed effects No Municipal Household Household Household Household
Time trends No No No Overall Overall Regional
Additional controls No No No No Yes Yes
Observations 9,231 9,231 9,231 9,231 9,231 9,231
R-squared 0.000 0.039 0.000 0.001 0.051 0.051
Panel D: Full sample (with weights)
KALAHI-CIDSS -0.012 0.020 0.025 0.062 0.052 0.052
(0.063) (0.052) (0.056) (0.063) (0.061) (0.059)
[0.030] [0.031] [0.034] [0.038] [0.037] [0.036]
Fixed effects No Municipal Household Household Household Household
Time trends No No No Overall Overall Regional
Additional controls No No No No Yes Yes
Observations 9,231 9,231 9,231 9,231 9,231 9,231
R-squared 0.000 0.048 0.000 0.002 0.052 0.052
Notes: Results from OLS (Column 1) and xed-eects (Columns 2-6) regressions. The dependent variable is a dummy equal to one if the individual visited a health clinic when sick. In Panels A and B, the sample is restricted to households that are observed three times. In Panels C and D the full sample is used. In Panels B and D sample weights are used. The standard errors (in parentheses) (resp. [brackets]) account for po-tential correlation within municipality (resp. within village). * denotes signicance at the 10 percent, ** at the 5 percent and, *** at the 1 percent level.

44 Philippines
Table 22: Impacts on access to health services (Female sample)
(1) (2) (3) (4) (5) (6)
Panel A: Balanced panel (no weights)
KALAHI-CIDSS -0.024 -0.017 -0.015 -0.022 -0.017 -0.018
(0.057) (0.053) (0.050) (0.062) (0.061) (0.059)
[0.027] [0.030] [0.030] [0.036] [0.035] [0.035]
Fixed effects No Municipal Household Household Household Household
Time trends No No No Overall Overall Regional
Additional controls No No No No Yes Yes
Observations 7,840 7,840 7,840 7,840 7,840 7,840
R-squared 0.001 0.051 0.000 0.000 0.051 0.051
Panel B: Balanced panel (with weights)
KALAHI-CIDSS -0.016 0.014 0.018 0.021 0.025 0.026
(0.075) (0.069) (0.068) (0.076) (0.072) (0.068)
[0.032] [0.035] [0.034] [0.040] [0.040] [0.038]
Fixed effects No Municipal Household Household Household Household
Time trends No No No Overall Overall Regional
Additional controls No No No No Yes Yes
Observations 7,840 7,840 7,840 7,840 7,840 7,840
R-squared 0.000 0.062 0.000 0.000 0.052 0.053
Panel C: Full sample (no weights)
KALAHI-CIDSS -0.021 -0.021 -0.014 -0.020 -0.014 -0.015
(0.057) (0.049) (0.045) (0.056) (0.054) (0.052)
[0.027] [0.030] [0.028] [0.034] [0.033] [0.032]
Fixed effects No Municipal Household Household Household Household
Time trends No No No Overall Overall Regional
Additional controls No No No No Yes Yes
Observations 8,809 8,809 8,809 8,809 8,809 8,809
R-squared 0.000 0.053 0.000 0.000 0.050 0.050
Panel D: Full sample (with weights)
KALAHI-CIDSS -0.013 0.004 0.016 0.017 0.022 0.023
(0.075) (0.063) (0.063) (0.069) (0.066) (0.062)
[0.032] [0.032] [0.032] [0.038] [0.037] [0.036]
Fixed effects No Municipal Household Household Household Household
Time trends No No No Overall Overall Regional
Additional controls No No No No Yes Yes
Observations 8,809 8,809 8,809 8,809 8,809 8,809
R-squared 0.000 0.065 0.000 0.000 0.051 0.052
Notes: Results from OLS (Column 1) and xed-eects (Columns 2-6) regressions. The dependent variable is a dummy equal to one if the individual visited a health clinic when sick. In Panels A and B, the sample is restricted to households that are observed three times. In Panels C and D the full sample is used. In Panels B and D sample weights are used. The standard errors (in parentheses) (resp. [brackets]) account for po-tential correlation within municipality (resp. within village). * denotes signicance at the 10 percent, ** at the 5 percent and, *** at the 1 percent level.

The KALAHI-CIDSS Impact Evaluation: A Revised Synthesis Report 45
Table 23: Impacts on school enrollment
(1) (2) (3) (4) (5) (6)
Panel A: Balanced panel (no weights)
KALAHI-CIDSS 0.002 0.001 -0.067 -0.021 -0.031 -0.031
(0.012) (0.014) (0.012)*** (0.014) (0.014)** (0.011)**
[0.012] [0.014] [0.013]*** [0.015] [0.013]** [0.013]**
Fixed effects No Municipal Household Household Household Household
Time trends No No No Overall Overall Regional
Additional controls No No No No Yes Yes
Observations 12,573 12,573 12,573 12,573 12,573 12,573
R-squared 0.000 0.004 0.003 0.006 0.453 0.454
Panel B: Balanced panel (with weights)
KALAHI-CIDSS 0.007 0.005 -0.061 -0.021 -0.031 -0.030
(0.012) (0.017) (0.017)*** (0.015) (0.016)* (0.013)**
[0.013] [0.014] [0.014]*** [0.016] [0.015]** [0.015]**
Fixed effects No Municipal Household Household Household Household
Time trends No No No Overall Overall Regional
Additional controls No No No No Yes Yes
Observations 12,573 12,573 12,573 12,573 12,573 12,573
R-squared 0.000 0.003 0.002 0.005 0.451 0.452
Panel C: Full sample (no weights)
KALAHI-CIDSS 0.000 -0.002 -0.068 -0.025 -0.038 -0.037
(0.013) (0.011) (0.012)*** (0.013)* (0.014)** (0.011)***
[0.011] [0.011] [0.012]*** [0.014]* [0.012]*** [0.012]***
Fixed effects No Municipal Household Household Household Household
Time trends No No No Overall Overall Regional
Additional controls No No No No Yes Yes
Observations 13,961 13,961 13,961 13,961 13,961 13,961
R-squared 0.000 0.004 0.003 0.006 0.449 0.449
Panel D: Full sample (with weights)
KALAHI-CIDSS 0.005 0.001 -0.061 -0.024 -0.035 -0.033
(0.012) (0.014) (0.016)*** (0.014) (0.016)** (0.013)**
[0.013] [0.013] [0.014]*** [0.016] [0.015]** [0.015]**
Fixed effects No Municipal Household Household Household Household
Time trends No No No Overall Overall Regional
Additional controls No No No No Yes Yes
Observations 13,961 13,961 13,961 13,961 13,961 13,961
R-squared 0.000 0.003 0.002 0.005 0.448 0.449
Notes: Results from OLS (Column 1) and xed-eects (Columns 2-6) regressions. The dependent variable is a dummy equal to one if the individual is enrolled in school. In Panels A and B, the sample is restricted to households that are observed three times. In Panels C and D the full sample is used. In Panels B and D sample weights are used. The standard errors (in parentheses) (resp. [brackets]) account for potential cor-relation within municipality (resp. within village). * denotes signicance at the 10 percent, ** at the 5 percent and, *** at the 1 percent level.

46 Philippines
Table 24: Impacts on school enrollment for boys
(1) (2) (3) (4) (5) (6)
Panel A: Balanced panel (no weights)
KALAHI-CIDSS -0.025 -0.015 -0.124 -0.047 -0.052 -0.052
(0.015) (0.016) (0.013)*** (0.018)** (0.017)*** (0.013)***
[0.016] [0.019] [0.018]*** [0.020]** [0.017]*** [0.017]***
Fixed effects No Municipal Household Household Household Household
Time trends No No No Overall Overall Regional
Additional controls No No No No Yes Yes
Observations 6,847 6,847 6,847 6,847 6,847 6,847
R-squared 0.001 0.007 0.011 0.020 0.406 0.407
Panel B: Balanced panel (with weights)
KALAHI-CIDSS -0.024 -0.015 -0.123 -0.054 -0.053 -0.052
(0.014) (0.019) (0.016)*** (0.017)*** (0.017)*** (0.012)***
[0.019] [0.020] [0.018]*** [0.021]** [0.018]*** [0.018]***
Fixed effects No Municipal Household Household Household Household
Time trends No No No Overall Overall Regional
Additional controls No No No No Yes Yes
Observations 6,847 6,847 6,847 6,847 6,847 6,847
R-squared 0.001 0.006 0.010 0.017 0.409 0.411
Panel C: Full sample (no weights)
KALAHI-CIDSS -0.032 -0.023 -0.126 -0.051 -0.060 -0.059
(0.016)* (0.014) (0.012)*** (0.017)*** (0.016)*** (0.012)***
[0.016]** [0.017] [0.017]*** [0.019]*** [0.017]*** [0.017]***
Fixed effects No Municipal Household Household Household Household
Time trends No No No Overall Overall Regional
Additional controls No No No No Yes Yes
Observations 7,525 7,525 7,525 7,525 7,525 7,525
R-squared 0.001 0.007 0.011 0.020 0.403 0.404
Panel D: Full sample (with weights)
KALAHI-CIDSS -0.028 -0.021 -0.122 -0.055 -0.056 -0.055
(0.015)* (0.017) (0.016)*** (0.017)*** (0.017)*** (0.012)***
[0.018] [0.019] [0.018]*** [0.021]** [0.019]*** [0.019]***
Fixed effects No Municipal Household Household Household Household
Time trends No No No Overall Overall Regional
Additional controls No No No No Yes Yes
Observations 7,525 7,525 7,525 7,525 7,525 7,525
R-squared 0.001 0.006 0.010 0.017 0.406 0.407
Notes: Results from OLS (Column 1) and xed-eects (Columns 2-6) regressions. The dependent variable is a dummy equal to one if the individual is enrolled in school. In Panels A and B, the sample is restricted to households that are observed three times. In Panels C and D the full sample is used. In Panels B and D sample weights are used. The standard errors (in parentheses) (resp. [brackets]) account for potential cor-relation within municipality (resp. within village). * denotes signicance at the 10 percent, ** at the 5 percent and, *** at the 1 percent level.

The KALAHI-CIDSS Impact Evaluation: A Revised Synthesis Report 47
Table 25: Impacts on school enrollment for girls
(1) (2) (3) (4) (5) (6)
Panel A: Balanced panel (no weights)
KALAHI-CIDSS 0.027 0.014 -0.056 0.000 -0.020 -0.020
(0.013)* (0.014) (0.008)*** (0.013) (0.012) (0.012)
[0.015]* [0.016] [0.014]*** [0.017] [0.014] [0.014]
Fixed effects No Municipal Household Household Household Household
Time trends No No No Overall Overall Regional
Additional controls No No No No Yes Yes
Observations 5,726 5,726 5,726 5,726 5,726 5,726
R-squared 0.001 0.007 0.003 0.009 0.466 0.466
Panel B: Balanced panel (with weights)
KALAHI-CIDSS 0.035 0.023 -0.047 0.007 -0.021 -0.019
(0.013)** (0.015) (0.011)*** (0.016) (0.013) (0.012)
[0.016]** [0.017] [0.016]*** [0.020] [0.017] [0.016]
Fixed effects No Municipal Household Household Household Household
Time trends No No No Overall Overall Regional
Additional controls No No No No Yes Yes
Observations 5,726 5,726 5,726 5,726 5,726 5,726
R-squared 0.002 0.007 0.002 0.008 0.456 0.457
Panel C: Full sample (no weights)
KALAHI-CIDSS 0.031 0.018 -0.053 -0.001 -0.024 -0.024
(0.013)** (0.011) (0.007)*** (0.012) (0.011)* (0.011)**
[0.014]** [0.014] [0.013]*** [0.016] [0.013]* [0.013]*
Fixed effects No Municipal Household Household Household Household
Time trends No No No Overall Overall Regional
Additional controls No No No No Yes Yes
Observations 6,436 6,436 6,436 6,436 6,436 6,436
R-squared 0.001 0.007 0.003 0.008 0.460 0.460
Panel D: Full sample (with weights)
KALAHI-CIDSS 0.039 0.023 -0.046 0.005 -0.025 -0.023
(0.013)*** (0.012)* (0.010)*** (0.015) (0.012)* (0.011)*
[0.015]** [0.016] [0.015]*** [0.019] [0.016] [0.015]
Fixed effects No Municipal Household Household Household Household
Time trends No No No Overall Overall Regional
Additional controls No No No No Yes Yes
Observations 6,436 6,436 6,436 6,436 6,436 6,436
R-squared 0.002 0.007 0.002 0.007 0.453 0.453
Notes: Results from OLS (Column 1) and xed-eects (Columns 2-6) regressions. The dependent variable is a dummy equal to one if the individual is enrolled in school. In Panels A and B, the sample is restricted to households that are observed three times. In Panels C and D the full sample is used. In Panels B and D sample weights are used. The standard errors (in parentheses) (resp. [brackets]) account for potential cor-relation within municipality (resp. within village). * denotes signicance at the 10 percent, ** at the 5 percent and, *** at the 1 percent level.

48 Philippines
Table 26: Impacts on attendance in village assemblies
(1) (2) (3) (4) (5) (6)
Panel A: Balanced panel (no weights)
KALAHI-CIDSS 0.115 0.124 0.124 0.109 0.107 0.107
(0.060)* (0.048)** (0.048)** (0.056)* (0.055)* (0.052)*
[0.033]*** [0.031]*** [0.031]*** [0.036]*** [0.035]*** [0.034]***
Fixed effects No Municipal Household Household Household Household
Time trends No No No Overall Overall Regional
Additional controls No No No No Yes Yes
Observations 5,652 5,652 5,652 5,652 5,652 5,652
R-squared 0.013 0.150 0.015 0.015 0.024 0.027
Panel B: Balanced panel (with weights)
KALAHI-CIDSS 0.110 0.101 0.101 0.079 0.078 0.082
(0.060)* (0.051)* (0.051)* (0.056) (0.054) (0.051)
[0.031]*** [0.028]*** [0.028]*** [0.033]** [0.032]** [0.032]**
Fixed effects No Municipal Household Household Household Household
Time trends No No No Overall Overall Regional
Additional controls No No No No Yes Yes
Observations 5,652 5,652 5,652 5,652 5,652 5,652
R-squared 0.011 0.125 0.009 0.010 0.020 0.023
Panel C: Full sample (no weights)
KALAHI-CIDSS 0.112 0.121 0.106 0.090 0.087 0.087
(0.057)* (0.049)** (0.049)** (0.057) (0.055) (0.053)
[0.031]*** [0.029]*** [0.030]*** [0.034]** [0.034]** [0.033]***
Fixed effects No Municipal Household Household Household Household
Time trends No No No Overall Overall Regional
Additional controls No No No No Yes Yes
Observations 6,402 6,402 6,402 6,402 6,402 6,402
R-squared 0.012 0.147 0.011 0.012 0.020 0.024
Panel D: Full sample (with weights)
KALAHI-CIDSS 0.108 0.099 0.088 0.064 0.063 0.068
(0.058)* (0.052)* (0.052) (0.057) (0.055) (0.052)
[0.030]*** [0.027]*** [0.027]*** [0.032]** [0.032]** [0.031]**
Fixed effects No Municipal Household Household Household Household
Time trends No No No Overall Overall Regional
Additional controls No No No No Yes Yes
Observations 6,402 6,402 6,402 6,402 6,402 6,402
R-squared 0.011 0.123 0.007 0.008 0.018 0.021
Notes: Results from OLS (Column 1) and xed-eects (Columns 2-6) regressions. The dependent variable is a dummy equal to one if an household member joined a village assembly in the 6 months preceding the survey. In Panels A and B, the sample is restricted to households that are observed three times. In Panels C and D the full sample is used. In Panels B and D sample weights are used. The standard errors (in paren-theses) (resp. [brackets]) account for potential correlation within municipality (resp. within village). * denotes signicance at the 10 percent, ** at the 5 percent and, *** at the 1 percent level.

The KALAHI-CIDSS Impact Evaluation: A Revised Synthesis Report 49
Table 27: Impacts on willingness to contribute money to community projects
(1) (2) (3) (4) (5) (6)
Panel A: Balanced panel (no weights)
KALAHI-CIDSS 0.090 0.140 0.140 0.104 0.102 0.104
(0.075) (0.072)* (0.072)* (0.079) (0.079) (0.036)**
[0.033]*** [0.036]*** [0.036]*** [0.040]** [0.040]** [0.029]***
Fixed effects No Municipal Household Household Household Household
Time trends No No No Overall Overall Regional
Additional controls No No No No Yes Yes
Observations 5,652 5,652 5,652 5,652 5,652 5,652
R-squared 0.007 0.099 0.015 0.017 0.020 0.082
Panel B: Balanced panel (with weights)
KALAHI-CIDSS 0.062 0.129 0.129 0.116 0.114 0.102
(0.082) (0.073) (0.073)* (0.080) (0.079) (0.037)**
[0.035]* [0.036]*** [0.036]*** [0.042]*** [0.042]*** [0.031]***
Fixed effects No Municipal Household Household Household Household
Time trends No No No Overall Overall Regional
Additional controls No No No No Yes Yes
Observations 5,652 5,652 5,652 5,652 5,652 5,652
R-squared 0.003 0.100 0.012 0.012 0.015 0.068
Panel C: Full sample (no weights)
KALAHI-CIDSS 0.099 0.155 0.146 0.109 0.107 0.107
(0.075) (0.077)* (0.074)* (0.081) (0.081) (0.038)**
[0.032]*** [0.036]*** [0.035]*** [0.040]*** [0.040]*** [0.028]***
Fixed effects No Municipal Household Household Household Household
Time trends No No No Overall Overall Regional
Additional controls No No No No Yes Yes
Observations 6,402 6,402 6,402 6,402 6,402 6,402
R-squared 0.009 0.091 0.017 0.019 0.021 0.084
Panel D: Full sample (with weights)
KALAHI-CIDSS 0.065 0.136 0.131 0.116 0.114 0.101
(0.083) (0.078) (0.075) (0.081) (0.081) (0.037)**
[0.035]* [0.036]*** [0.036]*** [0.042]*** [0.041]*** [0.030]***
Fixed effects No Municipal Household Household Household Household
Time trends No No No Overall Overall Regional
Additional controls No No No No Yes Yes
Observations 6,402 6,402 6,402 6,402 6,402 6,402
R-squared 0.004 0.096 0.012 0.013 0.015 0.069
Notes: Results from OLS (Column 1) and xed-eects (Columns 2-6) regressions. The dependent variable s a dummy equal to one if the respondent indicated being willing to contribute money to community projects. In Panels A and B, the sample is restricted to households that are observed three times. In Panels C and D the full sample is used. In Panels B and D sample weights are used. The standard errors (in parentheses) (resp. [brackets]) account for potential correlation within municipality (resp. within village). * denotes signi-cance at the 10 percent, ** at the 5 percent and, *** at the 1 percent level.

50 Philippines
Table 28: Impacts on trust that others are willing to help if needed
(1) (2) (3) (4) (5) (6)
Panel A: Balanced panel (no weights)
KALAHI-CIDSS 0.028 0.021 0.021 0.055 0.053 0.054
(0.030) (0.037) (0.037) (0.045) (0.044) (0.023)**
[0.017] [0.024] [0.024] [0.030]* [0.030]* [0.025]**
Fixed effects No Municipal Household Household Household Household
Time trends No No No Overall Overall Regional
Additional controls No No No No Yes Yes
Observations 5,652 5,652 5,652 5,652 5,652 5,652
R-squared 0.001 0.012 0.000 0.003 0.007 0.029
Panel B: Balanced panel (with weights)
KALAHI-CIDSS 0.024 0.029 0.029 0.068 0.066 0.066
(0.026) (0.032) (0.032) (0.038)* (0.037)* (0.025)**
[0.016] [0.023] [0.023] [0.029]** [0.029]** [0.026]**
Fixed effects No Municipal Household Household Household Household
Time trends No No No Overall Overall Regional
Additional controls No No No No Yes Yes
Observations 5,652 5,652 5,652 5,652 5,652 5,652
R-squared 0.001 0.010 0.001 0.004 0.008 0.024
Panel C: Full sample (no weights)
KALAHI-CIDSS 0.029 0.027 0.024 0.057 0.055 0.055
(0.031) (0.042) (0.041) (0.048) (0.047) (0.024)**
[0.017]* [0.024] [0.024] [0.029]* [0.029]* [0.024]**
Fixed effects No Municipal Household Household Household Household
Time trends No No No Overall Overall Regional
Additional controls No No No No Yes Yes
Observations 6,402 6,402 6,402 6,402 6,402 6,402
R-squared 0.001 0.012 0.001 0.003 0.007 0.030
Panel D: Full sample (with weights)
KALAHI-CIDSS 0.025 0.032 0.030 0.068 0.066 0.065
(0.027) (0.037) (0.035) (0.039)* (0.038) (0.024)**
[0.017] [0.023] [0.023] [0.029]** [0.028]** [0.025]***
Fixed effects No Municipal Household Household Household Household
Time trends No No No Overall Overall Regional
Additional controls No No No No Yes Yes
Observations 6,402 6,402 6,402 6,402 6,402 6,402
R-squared 0.001 0.010 0.001 0.004 0.008 0.024
Notes: Results from OLS (Column 1) and xed-eects (Columns 2-6) regressions. The dependent variable is a dummy equal to one if the respondent agrees with the statement “Most people in this barangay/neighbor-hood are willing to help if you need it”. In Panels A and B, the sample is restricted to households that are observed three times. In Panels C and D the full sample is used. In Panels B and D sample weights are used. The standard errors (in parentheses) (resp. [brackets]) account for potential correlation within municipality (resp. within village). * denotes signicance at the 10 percent, ** at the 5 percent and, *** at the 1 percent level.

The KALAHI-CIDSS Impact Evaluation: A Revised Synthesis Report 51
Table 29: Impacts on willingness to contribute time to community projects
(1) (2) (3) (4) (5) (6)
Panel A: Balanced panel (no weights)
KALAHI-CIDSS 0.023 0.016 0.016 0.006 0.007 0.007
(0.045) (0.038) (0.038) (0.043) (0.043) (0.032)
[0.020] [0.021] [0.021] [0.027] [0.027] [0.025]
Fixed effects No Municipal Household Household Household Household
Time trends No No No Overall Overall Regional
Additional controls No No No No Yes Yes
Observations 5,652 5,652 5,652 5,652 5,652 5,652
R-squared 0.001 0.040 0.000 0.000 0.002 0.019
Panel B: Balanced panel (with weights)
KALAHI-CIDSS 0.017 0.009 0.009 0.032 0.033 0.027
(0.046) (0.036) (0.036) (0.044) (0.044) (0.038)
[0.022] [0.020] [0.020] [0.027] [0.027] [0.025]
Fixed effects No Municipal Household Household Household Household
Time trends No No No Overall Overall Regional
Additional controls No No No No Yes Yes
Observations 5,652 5,652 5,652 5,652 5,652 5,652
R-squared 0.000 0.039 0.000 0.001 0.002 0.020
Panel C: Full sample (no weights)
KALAHI-CIDSS 0.030 0.024 0.019 0.008 0.010 0.009
(0.043) (0.036) (0.036) (0.041) (0.041) (0.032)
[0.020] [0.022] [0.021] [0.027] [0.027] [0.025]
Fixed effects No Municipal Household Household Household Household
Time trends No No No Overall Overall Regional
Additional controls No No No No Yes Yes
Observations 6,402 6,402 6,402 6,402 6,402 6,402
R-squared 0.001 0.036 0.000 0.001 0.003 0.018
Panel D: Full sample (with weights)
KALAHI-CIDSS 0.021 0.015 0.011 0.033 0.034 0.028
(0.045) (0.035) (0.034) (0.042) (0.042) (0.038)
[0.021] [0.020] [0.020] [0.027] [0.027] [0.025]
Fixed effects No Municipal Household Household Household Household
Time trends No No No Overall Overall Regional
Additional controls No No No No Yes Yes
Observations 6,402 6,402 6,402 6,402 6,402 6,402
R-squared 0.000 0.037 0.000 0.001 0.002 0.019
Notes: Results from OLS (Column 1) and xed-eects (Columns 2-6) regressions. The dependent variable s a dummy equal to one if the respondent indicated being willing to contribute time to community projects. In Panels A and B, the sample is restricted to households that are observed three times. In Panels C and D the full sample is used. In Panels B and D sample weights are used. The standard errors (in parentheses) (resp. [brackets]) account for potential correlation within municipality (resp. within village). * denotes signicance at the 10 percent, ** at the 5 percent and, *** at the 1 percent level.

52 Philippines
Table 30: Impacts on participation in bayanihan
(1) (2) (3) (4) (5) (6)
Panel A: Balanced panel (no weights)
KALAHI-CIDSS 0.037 -0.012 -0.012 -0.002 -0.003 -0.002
(0.095) (0.029) (0.029) (0.050) (0.050) (0.032)
[0.039] [0.021] [0.021] [0.030] [0.030] [0.027]
Fixed effects No Municipal Household Household Household Household
Time trends No No No Overall Overall Regional
Additional controls No No No No Yes Yes
Observations 5,652 5,652 5,652 5,652 5,652 5,652
R-squared 0.001 0.213 0.000 0.000 0.003 0.016
Panel B: Balanced panel (with weights)
KALAHI-CIDSS 0.016 -0.031 -0.031 -0.002 -0.003 -0.012
(0.110) (0.041) (0.041) (0.055) (0.056) (0.039)
[0.042] [0.025] [0.025] [0.033] [0.032] [0.030]
Fixed effects No Municipal Household Household Household Household
Time trends No No No Overall Overall Regional
Additional controls No No No No Yes Yes
Observations 5,652 5,652 5,652 5,652 5,652 5,652
R-squared 0.000 0.216 0.001 0.003 0.007 0.019
Panel C: Full sample (no weights)
KALAHI-CIDSS 0.040 0.004 -0.015 -0.009 -0.009 -0.009
(0.092) (0.033) (0.030) (0.051) (0.051) (0.033)
[0.038] [0.021] [0.021] [0.030] [0.030] [0.026]
Fixed effects No Municipal Household Household Household Household
Time trends No No No Overall Overall Regional
Additional controls No No No No Yes Yes
Observations 6,402 6,402 6,402 6,402 6,402 6,402
R-squared 0.001 0.208 0.000 0.000 0.004 0.018
Panel D: Full sample (with weights)
KALAHI-CIDSS 0.017 -0.017 -0.032 -0.004 -0.005 -0.016
(0.109) (0.046) (0.042) (0.055) (0.056) (0.039)
[0.042] [0.024] [0.024] [0.032] [0.032] [0.029]
Fixed effects No Municipal Household Household Household Household
Time trends No No No Overall Overall Regional
Additional controls No No No No Yes Yes
Observations 6,402 6,402 6,402 6,402 6,402 6,402
R-squared 0.000 0.211 0.001 0.003 0.007 0.020
Notes: Results from OLS (Column 1) and xed-eects (Columns 2-6) regressions. The dependent variable is a dummy equal to one if an household member joined bayanihan activities in the 6 months preceding the survey. In Panels A and B, the sample is restricted to households that are observed three times. In Panels C and D the full sample is used. In Panels B and D sample weights are used. The standard errors (in paren-theses) (resp. [brackets]) account for potential correlation within municipality (resp. within village). * denotes signicance at the 10 percent, ** at the 5 percent and, *** at the 1 percent level.

The KALAHI-CIDSS Impact Evaluation: A Revised Synthesis Report 53
Table 31: Impacts on group membership
(1) (2) (3) (4) (5) (6)
Panel A: Balanced panel (no weights)
KALAHI-CIDSS 0.056 0.113 0.113 0.010 0.008 0.008
(0.060) (0.020)*** (0.020)*** (0.033) (0.032) (0.032)
[0.030]* [0.019]*** [0.019]*** [0.025] [0.025] [0.025]
Fixed effects No Municipal Household Household Household Household
Time trends No No No Overall Overall Regional
Additional controls No No No No Yes Yes
Observations 5,652 5,652 5,652 5,652 5,652 5,652
R-squared 0.003 0.112 0.012 0.032 0.037 0.041
Panel B: Balanced panel (with weights)
KALAHI-CIDSS 0.061 0.116 0.116 0.027 0.024 0.022
(0.070) (0.016)*** (0.016)*** (0.031) (0.030) (0.029)
[0.032]* [0.019]*** [0.019]*** [0.026] [0.026] [0.025]
Fixed effects No Municipal Household Household Household Household
Time trends No No No Overall Overall Regional
Additional controls No No No No Yes Yes
Observations 5,652 5,652 5,652 5,652 5,652 5,652
R-squared 0.003 0.119 0.012 0.028 0.034 0.039
Panel C: Full sample (no weights)
KALAHI-CIDSS 0.062 0.121 0.103 0.005 0.003 0.003
(0.057) (0.019)*** (0.019)*** (0.032) (0.031) (0.031)
[0.029]** [0.019]*** [0.019]*** [0.025] [0.025] [0.025]
Fixed effects No Municipal Household Household Household Household
Time trends No No No Overall Overall Regional
Additional controls No No No No Yes Yes
Observations 6,402 6,402 6,402 6,402 6,402 6,402
R-squared 0.003 0.104 0.011 0.030 0.035 0.038
Panel D: Full sample (with weights)
KALAHI-CIDSS 0.065 0.121 0.109 0.024 0.022 0.019
(0.068) (0.016)*** (0.017)*** (0.030) (0.029) (0.029)
[0.031]** [0.018]*** [0.019]*** [0.025] [0.025] [0.024]
Fixed effects No Municipal Household Household Household Household
Time trends No No No Overall Overall Regional
Additional controls No No No No Yes Yes
Observations 6,402 6,402 6,402 6,402 6,402 6,402
R-squared 0.004 0.114 0.011 0.026 0.032 0.037
Notes: Results from OLS (Column 1) and xed-eects (Columns 2-6) regressions. The dependent variable is a dummy equal to one if an household member is a member of a formal group. In Panels A and B, the sample is restricted to households that are observed three times. In Panels C and D the full sample is used. In Panels B and D sample weights are used. The standard errors (in parentheses) (resp. [brackets]) account for potential correlation within municipality (resp. within village). * denotes signicance at the 10 percent, ** at the 5 percent and, *** at the 1 percent level.

54 Philippines
Table 32: Impacts on trust of community members
(1) (2) (3) (4) (5) (6)
Panel A: Balanced panel (no weights)
KALAHI-CIDSS -0.011 0.022 0.022 0.042 0.043 0.044
(0.045) (0.032) (0.032) (0.038) (0.037) (0.029)
[0.023] [0.023] [0.023] [0.028] [0.028] [0.027]
Fixed effects No Municipal Household Household Household Household
Time trends No No No Overall Overall Regional
Additional controls No No No No Yes Yes
Observations 5,652 5,652 5,652 5,652 5,652 5,652
R-squared 0.000 0.034 0.000 0.001 0.003 0.010
Panel B: Balanced panel (with weights)
KALAHI-CIDSS -0.017 0.023 0.023 0.058 0.059 0.057
(0.040) (0.030) (0.030) (0.035) (0.034) (0.025)**
[0.022] [0.023] [0.023] [0.027]** [0.027]** [0.025]**
Fixed effects No Municipal Household Household Household Household
Time trends No No No Overall Overall Regional
Additional controls No No No No Yes Yes
Observations 5,652 5,652 5,652 5,652 5,652 5,652
R-squared 0.000 0.028 0.000 0.002 0.005 0.011
Panel C: Full sample (no weights)
KALAHI-CIDSS -0.012 0.014 0.015 0.033 0.034 0.034
(0.043) (0.029) (0.030) (0.037) (0.036) (0.029)
[0.022] [0.023] [0.023] [0.029] [0.029] [0.028]
Fixed effects No Municipal Household Household Household Household
Time trends No No No Overall Overall Regional
Additional controls No No No No Yes Yes
Observations 6,402 6,402 6,402 6,402 6,402 6,402
R-squared 0.000 0.034 0.000 0.001 0.003 0.009
Panel D: Full sample (with weights)
KALAHI-CIDSS -0.016 0.017 0.018 0.048 0.049 0.047
(0.038) (0.027) (0.029) (0.033) (0.032) (0.024)*
[0.022] [0.023] [0.023] [0.026]* [0.026]* [0.025]*
Fixed effects No Municipal Household Household Household Household
Time trends No No No Overall Overall Regional
Additional controls No No No No Yes Yes
Observations 6,402 6,402 6,402 6,402 6,402 6,402
R-squared 0.000 0.028 0.000 0.002 0.004 0.011
Notes: Results from OLS (Column 1) and xed-eects (Columns 2-6) regressions. The dependent variable is a dummy equal to one if the respondent agrees with the statement “Most people who live in this barangay/neighborhood can be trusted”. In Panels A and B, the sample is restricted to households that are observed three times. In Panels C and D the full sample is used. In Panels B and D sample weights are used. The standard errors (in parentheses) (resp. [brackets]) account for potential correlation within municipality (resp. within village). * denotes signicance at the 10 percent, ** at the 5 percent and, *** at the 1 percent level.

The KALAHI-CIDSS Impact Evaluation: A Revised Synthesis Report 55
Table 33: Impacts on need to be alert
(1) (2) (3) (4) (5) (6)
Panel A: Balanced panel (no weights)
KALAHI-CIDSS -0.008 -0.054 -0.054 0.028 0.026 0.026
(0.032) (0.052) (0.052) (0.058) (0.058) (0.053)
[0.018] [0.027]** [0.027]** [0.032] [0.032] [0.031]
Fixed effects No Municipal Household Household Household Household
Time trends No No No Overall Overall Regional
Additional controls No No No No Yes Yes
Observations 5,652 5,652 5,652 5,652 5,652 5,652
R-squared 0.000 0.034 0.002 0.011 0.015 0.018
Panel B: Balanced panel (with weights)
KALAHI-CIDSS -0.008 -0.080 -0.080 -0.012 -0.016 -0.010
(0.037) (0.047) (0.047) (0.059) (0.059) (0.046)
[0.019] [0.026]*** [0.026]*** [0.035] [0.035] [0.031]
Fixed effects No Municipal Household Household Household Household
Time trends No No No Overall Overall Regional
Additional controls No No No No Yes Yes
Observations 5,652 5,652 5,652 5,652 5,652 5,652
R-squared 0.000 0.033 0.004 0.011 0.015 0.020
Panel C: Full sample (no weights)
KALAHI-CIDSS -0.013 -0.054 -0.059 0.015 0.013 0.013
(0.036) (0.056) (0.055) (0.059) (0.060) (0.056)
[0.019] [0.027]** [0.027]** [0.032] [0.032] [0.031]
Fixed effects No Municipal Household Household Household Household
Time trends No No No Overall Overall Regional
Additional controls No No No No Yes Yes
Observations 6,402 6,402 6,402 6,402 6,402 6,402
R-squared 0.000 0.038 0.003 0.011 0.014 0.016
Panel D: Full sample (with weights)
KALAHI-CIDSS -0.013 -0.079 -0.084 -0.022 -0.026 -0.022
(0.039) (0.050) (0.050) (0.061) (0.061) (0.048)
[0.020] [0.026]*** [0.026]*** [0.035] [0.034] [0.031]
Fixed effects No Municipal Household Household Household Household
Time trends No No No Overall Overall Regional
Additional controls No No No No Yes Yes
Observations 6,402 6,402 6,402 6,402 6,402 6,402
R-squared 0.000 0.036 0.005 0.011 0.015 0.019
Notes: Results from OLS (Column 1) and xed-eects (Columns 2-6) regressions. The dependent variable is a dummy equal to one if the respondent agrees with the statement “In this barangay/neighborhood, one has to be alert or someone is likely to take advantage of you”. In Panels A and B, the sample is restricted to households that are observed three times. In Panels C and D the full sample is used. In Panels B and D sample weights are used. The standard errors (in parentheses) (resp. [brackets]) account for potential cor-relation within municipality (resp. within village). * denotes signicance at the 10 percent, ** at the 5 percent and, *** at the 1 percent level.
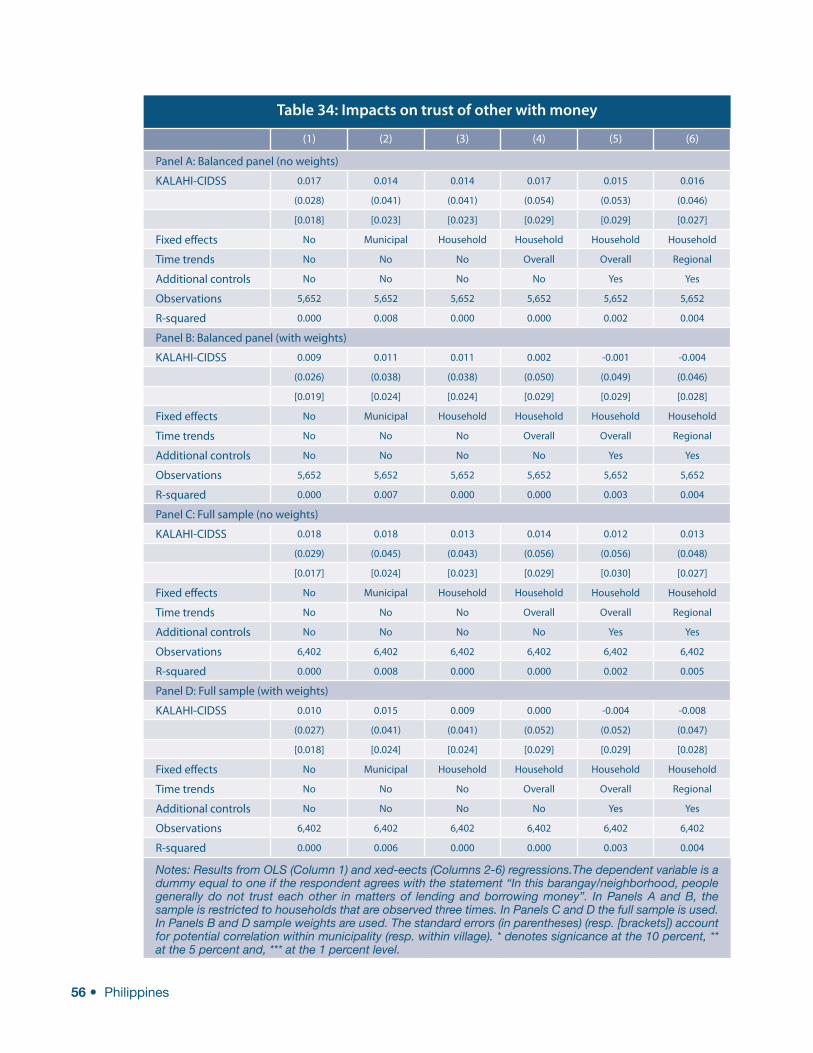
56 Philippines
Table 34: Impacts on trust of other with money
(1) (2) (3) (4) (5) (6)
Panel A: Balanced panel (no weights)
KALAHI-CIDSS 0.017 0.014 0.014 0.017 0.015 0.016
(0.028) (0.041) (0.041) (0.054) (0.053) (0.046)
[0.018] [0.023] [0.023] [0.029] [0.029] [0.027]
Fixed effects No Municipal Household Household Household Household
Time trends No No No Overall Overall Regional
Additional controls No No No No Yes Yes
Observations 5,652 5,652 5,652 5,652 5,652 5,652
R-squared 0.000 0.008 0.000 0.000 0.002 0.004
Panel B: Balanced panel (with weights)
KALAHI-CIDSS 0.009 0.011 0.011 0.002 -0.001 -0.004
(0.026) (0.038) (0.038) (0.050) (0.049) (0.046)
[0.019] [0.024] [0.024] [0.029] [0.029] [0.028]
Fixed effects No Municipal Household Household Household Household
Time trends No No No Overall Overall Regional
Additional controls No No No No Yes Yes
Observations 5,652 5,652 5,652 5,652 5,652 5,652
R-squared 0.000 0.007 0.000 0.000 0.003 0.004
Panel C: Full sample (no weights)
KALAHI-CIDSS 0.018 0.018 0.013 0.014 0.012 0.013
(0.029) (0.045) (0.043) (0.056) (0.056) (0.048)
[0.017] [0.024] [0.023] [0.029] [0.030] [0.027]
Fixed effects No Municipal Household Household Household Household
Time trends No No No Overall Overall Regional
Additional controls No No No No Yes Yes
Observations 6,402 6,402 6,402 6,402 6,402 6,402
R-squared 0.000 0.008 0.000 0.000 0.002 0.005
Panel D: Full sample (with weights)
KALAHI-CIDSS 0.010 0.015 0.009 0.000 -0.004 -0.008
(0.027) (0.041) (0.041) (0.052) (0.052) (0.047)
[0.018] [0.024] [0.024] [0.029] [0.029] [0.028]
Fixed effects No Municipal Household Household Household Household
Time trends No No No Overall Overall Regional
Additional controls No No No No Yes Yes
Observations 6,402 6,402 6,402 6,402 6,402 6,402
R-squared 0.000 0.006 0.000 0.000 0.003 0.004
Notes: Results from OLS (Column 1) and xed-eects (Columns 2-6) regressions.The dependent variable is a dummy equal to one if the respondent agrees with the statement “In this barangay/neighborhood, people generally do not trust each other in matters of lending and borrowing money”. In Panels A and B, the sample is restricted to households that are observed three times. In Panels C and D the full sample is used. In Panels B and D sample weights are used. The standard errors (in parentheses) (resp. [brackets]) account for potential correlation within municipality (resp. within village). * denotes signicance at the 10 percent, ** at the 5 percent and, *** at the 1 percent level.

The KALAHI-CIDSS Impact Evaluation: A Revised Synthesis Report 57
Table 35: Impacts on trust of local officials
(1) (2) (3) (4) (5) (6)
Panel A: Balanced panel (no weights)
KALAHI-CIDSS -0.081 -0.138 -0.138 -0.055 -0.055 -0.055
(0.051) (0.043)*** (0.043)*** (0.054) (0.054) (0.050)
[0.024]*** [0.025]*** [0.025]*** [0.031]* [0.031]* [0.030]*
Fixed effects No Municipal Household Household Household Household
Time trends No No No Overall Overall Regional
Additional controls No No No No Yes Yes
Observations 5,652 5,652 5,652 5,652 5,652 5,652
R-squared 0.006 0.064 0.015 0.025 0.025 0.032
Panel B: Balanced panel (with weights)
KALAHI-CIDSS -0.059 -0.160 -0.160 -0.079 -0.080 -0.083
(0.061) (0.049)*** (0.049)*** (0.060) (0.060) (0.052)
[0.029]** [0.030]*** [0.030]*** [0.035]** [0.035]** [0.033]**
Fixed effects No Municipal Household Household Household Household
Time trends No No No Overall Overall Regional
Additional controls No No No No Yes Yes
Observations 5,652 5,652 5,652 5,652 5,652 5,652
R-squared 0.003 0.069 0.018 0.029 0.030 0.039
Panel C: Full sample (no weights)
KALAHI-CIDSS -0.096 -0.143 -0.143 -0.060 -0.061 -0.062
(0.050)* (0.040)*** (0.042)*** (0.052) (0.052) (0.050)
[0.023]*** [0.024]*** [0.025]*** [0.031]* [0.031]** [0.030]**
Fixed effects No Municipal Household Household Household Household
Time trends No No No Overall Overall Regional
Additional controls No No No No Yes Yes
Observations 6,402 6,402 6,402 6,402 6,402 6,402
R-squared 0.008 0.066 0.016 0.027 0.027 0.033
Panel D: Full sample (with weights)
KALAHI-CIDSS -0.069 -0.156 -0.159 -0.078 -0.079 -0.082
(0.057) (0.042)*** (0.045)*** (0.056) (0.057) (0.050)
[0.027]** [0.027]*** [0.028]*** [0.033]** [0.033]** [0.032]**
Fixed effects No Municipal Household Household Household Household
Time trends No No No Overall Overall Regional
Additional controls No No No No Yes Yes
Observations 6,402 6,402 6,402 6,402 6,402 6,402
R-squared 0.004 0.068 0.019 0.029 0.031 0.039
Notes: Results from OLS (Column 1) and xed-eects (Columns 2-6) regressions. The dependent variable is a dummy equal to one if the respondent trusts local ocials. In Panels A and B, the sample is restricted to households that are observed three times. In Panels C and D the full sample is used. In Panels B and D sample weights are used. The standard errors (in parentheses) (resp. [brackets]) account for potential cor-relation within municipality (resp. within village). * denotes signicance at the 10 percent, ** at the 5 percent and, *** at the 1 percent level.

58 Philippines
Table 36: Impacts on trust of national officials
(1) (2) (3) (4) (5) (6)
Panel A: Balanced panel (no weights)
KALAHI-CIDSS -0.066 -0.110 -0.110 -0.014 -0.014 -0.014
(0.042) (0.038)** (0.038)** (0.051) (0.051) (0.051)
[0.020]*** [0.023]*** [0.023]*** [0.030] [0.030] [0.030]
Fixed effects No Municipal Household Household Household Household
Time trends No No No Overall Overall Regional
Additional controls No No No No Yes Yes
Observations 5,652 5,652 5,652 5,652 5,652 5,652
R-squared 0.004 0.060 0.010 0.026 0.027 0.031
Panel B: Balanced panel (with weights)
KALAHI-CIDSS -0.039 -0.116 -0.116 -0.037 -0.038 -0.030
(0.047) (0.041)** (0.041)** (0.055) (0.055) (0.052)
[0.023]* [0.030]*** [0.030]*** [0.035] [0.035] [0.035]
Fixed effects No Municipal Household Household Household Household
Time trends No No No Overall Overall Regional
Additional controls No No No No Yes Yes
Observations 5,652 5,652 5,652 5,652 5,652 5,652
R-squared 0.002 0.064 0.011 0.022 0.023 0.030
Panel C: Full sample (no weights)
KALAHI-CIDSS -0.078 -0.125 -0.116 -0.024 -0.024 -0.024
(0.040)* (0.037)*** (0.039)*** (0.052) (0.052) (0.053)
[0.019]*** [0.023]*** [0.024]*** [0.030] [0.030] [0.031]
Fixed effects No Municipal Household Household Household Household
Time trends No No No Overall Overall Regional
Additional controls No No No No Yes Yes
Observations 6,402 6,402 6,402 6,402 6,402 6,402
R-squared 0.006 0.064 0.012 0.026 0.027 0.031
Panel D: Full sample (with weights)
KALAHI-CIDSS -0.047 -0.124 -0.117 -0.041 -0.041 -0.033
(0.045) (0.038)*** (0.040)** (0.055) (0.055) (0.053)
[0.022]** [0.028]*** [0.029]*** [0.034] [0.034] [0.034]
Fixed effects No Municipal Household Household Household Household
Time trends No No No Overall Overall Regional
Additional controls No No No No Yes Yes
Observations 6,402 6,402 6,402 6,402 6,402 6,402
R-squared 0.002 0.065 0.011 0.022 0.024 0.030
Notes: Results from OLS (Column 1) and xed-eects (Columns 2-6) regressions. The dependent variable s a dummy equal to one if the respondent trusts national ocials. In Panels A and B, the sample is restricted to households that are observed three times. In Panels C and D the full sample is used. In Panels B and D sample weights are used. The standard errors (in parentheses) (resp. [brackets]) account for potential cor-relation within municipality (resp. within village). * denotes signicance at the 10 percent, ** at the 5 percent and, *** at the 1 percent level.

The KALAHI-CIDSS Impact Evaluation: A Revised Synthesis Report 59
Table 37: Impacts on trust of strangers
(1) (2) (3) (4) (5) (6)
Panel A: Balanced panel (no weights)
KALAHI-CIDSS -0.029 -0.024 -0.024 0.023 0.023 0.022
(0.011)** (0.014) (0.014) (0.023) (0.023) (0.017)
[0.007]*** [0.011]** [0.011]** [0.014] [0.014] [0.012]*
Fixed effects No Municipal Household Household Household Household
Time trends No No No Overall Overall Regional
Additional controls No No No No Yes Yes
Observations 5,652 5,652 5,652 5,652 5,652 5,652
R-squared 0.004 0.020 0.002 0.017 0.018 0.029
Panel B: Balanced panel (with weights)
KALAHI-CIDSS -0.023 -0.027 -0.027 0.008 0.008 0.010
(0.010)** (0.014)* (0.014)* (0.019) (0.019) (0.019)
[0.007]*** [0.011]** [0.011]** [0.014] [0.014] [0.013]
Fixed effects No Municipal Household Household Household Household
Time trends No No No Overall Overall Regional
Additional controls No No No No Yes Yes
Observations 5,652 5,652 5,652 5,652 5,652 5,652
R-squared 0.002 0.019 0.003 0.012 0.015 0.021
Panel C: Full sample (no weights)
KALAHI-CIDSS -0.031 -0.019 -0.021 0.026 0.025 0.025
(0.012)** (0.012) (0.013) (0.023) (0.022) (0.016)
[0.008]*** [0.010]* [0.011]** [0.014]* [0.014]* [0.012]**
Fixed effects No Municipal Household Household Household Household
Time trends No No No Overall Overall Regional
Additional controls No No No No Yes Yes
Observations 6,402 6,402 6,402 6,402 6,402 6,402
R-squared 0.004 0.024 0.002 0.016 0.018 0.029
Panel D: Full sample (with weights)
KALAHI-CIDSS -0.024 -0.022 -0.024 0.011 0.011 0.014
(0.009)** (0.012)* (0.013)* (0.018) (0.018) (0.017)
[0.007]*** [0.011]** [0.011]** [0.014] [0.013] [0.013]
Fixed effects No Municipal Household Household Household Household
Time trends No No No Overall Overall Regional
Additional controls No No No No Yes Yes
Observations 6,402 6,402 6,402 6,402 6,402 6,402
R-squared 0.003 0.020 0.002 0.012 0.014 0.019
Notes: Results from OLS (Column 1) and xed-eects (Columns 2-6) regressions. The dependent variable is a dummy equal to one if the respondent trusts strangers. In Panels A and B, the sample is restricted to households that are observed three times. In Panels C and D the full sample is used. In Panels B and D sample weights are used. The standard errors (in parentheses) (resp. [brackets]) account for potential cor-relation within municipality (resp. within village). * denotes signicance at the 10 percent, ** at the 5 percent and, *** at the 1 percent level.

60 Philippines
Table 38: Impacts on perceptions of peace
(1) (2) (3) (4) (5) (6)
Panel A: Balanced panel (no weights)
KALAHI-CIDSS -0.051 -0.077 -0.077 -0.028 -0.026 -0.026
(0.035) (0.028)** (0.028)** (0.033) (0.033) (0.028)
[0.023]** [0.025]*** [0.025]*** [0.031] [0.031] [0.030]
Fixed effects No Municipal Household Household Household Household
Time trends No No No Overall Overall Regional
Additional controls No No No No Yes Yes
Observations 5,652 5,652 5,652 5,652 5,652 5,652
R-squared 0.003 0.035 0.006 0.011 0.013 0.020
Panel B: Balanced panel (with weights)
KALAHI-CIDSS -0.055 -0.076 -0.076 -0.010 -0.008 -0.016
(0.037) (0.026)** (0.026)*** (0.031) (0.031) (0.025)
[0.023]** [0.023]*** [0.023]*** [0.028] [0.028] [0.026]
Fixed effects No Municipal Household Household Household Household
Time trends No No No Overall Overall Regional
Additional controls No No No No Yes Yes
Observations 5,652 5,652 5,652 5,652 5,652 5,652
R-squared 0.004 0.032 0.006 0.016 0.017 0.025
Panel C: Full sample (no weights)
KALAHI-CIDSS -0.061 -0.082 -0.081 -0.037 -0.035 -0.035
(0.035) (0.026)*** (0.028)** (0.034) (0.034) (0.029)
[0.023]*** [0.026]*** [0.025]*** [0.031] [0.031] [0.030]
Fixed effects No Municipal Household Household Household Household
Time trends No No No Overall Overall Regional
Additional controls No No No No Yes Yes
Observations 6,402 6,402 6,402 6,402 6,402 6,402
R-squared 0.005 0.039 0.008 0.012 0.013 0.020
Panel D: Full sample (with weights)
KALAHI-CIDSS -0.061 -0.078 -0.078 -0.016 -0.014 -0.021
(0.036) (0.025)*** (0.025)*** (0.031) (0.031) (0.026)
[0.022]*** [0.023]*** [0.022]*** [0.027] [0.027] [0.025]
Fixed effects No Municipal Household Household Household Household
Time trends No No No Overall Overall Regional
Additional controls No No No No Yes Yes
Observations 6,402 6,402 6,402 6,402 6,402 6,402
R-squared 0.005 0.034 0.006 0.016 0.017 0.025
Notes: Results from OLS (Column 1) and xed-eects (Columns 2-6) regressions. The dependent variable is the XXXXXXXXXXXXX. In Panels A and B, the sample is restricted to households that are observed three times. In Panels C and D the full sample is used. In Panels B and D sample weightare used. The standard errors (in parentheses) (resp. [brackets]) account for potential correlationwithin municipality (resp. within vil-lage). * denotes signicance at the 10 percent, ** at the 5 percent and, *** at the 1 percent level.

The KALAHI-CIDSS Impact Evaluation: A Revised Synthesis Report 61
Table 39: Impacts on knowledge of village budget
(1) (2) (3) (4) (5) (6)
Panel A: Balanced panel (no weights)
KALAHI-CIDSS 0.019 0.036 0.036 0.007 0.005 0.005
(0.020) (0.020)* (0.020)* (0.033) (0.033) (0.027)
[0.013] [0.013]*** [0.013]*** [0.019] [0.019] [0.018]
Fixed effects No Municipal Household Household Household Household
Time trends No No No Overall Overall Regional
Additional controls No No No No Yes Yes
Observations 5,652 5,652 5,652 5,652 5,652 5,652
R-squared 0.001 0.011 0.002 0.005 0.007 0.022
Panel B: Balanced panel (with weights)
KALAHI-CIDSS 0.018 0.028 0.028 0.011 0.009 0.011
(0.022) (0.022) (0.022) (0.037) (0.037) (0.025)
[0.013] [0.013]** [0.013]** [0.020] [0.020] [0.018]
Fixed effects No Municipal Household Household Household Household
Time trends No No No Overall Overall Regional
Additional controls No No No No Yes Yes
Observations 5,652 5,652 5,652 5,652 5,652 5,652
R-squared 0.001 0.012 0.001 0.002 0.005 0.023
Panel C: Full sample (no weights)
KALAHI-CIDSS 0.022 0.043 0.036 0.006 0.005 0.004
(0.019) (0.020)* (0.019)* (0.032) (0.032) (0.026)
[0.013]* [0.013]*** [0.012]*** [0.018] [0.018] [0.017]
Fixed effects No Municipal Household Household Household Household
Time trends No No No Overall Overall Regional
Additional controls No No No No Yes Yes
Observations 6,402 6,402 6,402 6,402 6,402 6,402
R-squared 0.001 0.013 0.002 0.005 0.007 0.022
Panel D: Full sample (with weights)
KALAHI-CIDSS 0.019 0.034 0.028 0.011 0.009 0.010
(0.021) (0.021) (0.021) (0.035) (0.035) (0.024)
[0.012] [0.014]** [0.013]** [0.019] [0.019] [0.017]
Fixed effects No Municipal Household Household Household Household
Time trends No No No Overall Overall Regional
Additional controls No No No No Yes Yes
Observations 6,402 6,402 6,402 6,402 6,402 6,402
R-squared 0.001 0.013 0.001 0.002 0.005 0.022
Notes: Results from OLS (Column 1) and xed-eects (Columns 2-6) regressions. The dependent variable is a dummy equal to one if the respondent knows the village budget. In Panels A and B, the sample is restricted to households that are observed three times. In Panels C and D the full sample is used. In Panels B and D sample weights are used. The standard errors (in parentheses) (resp. [brackets]) account for potential cor-relation within municipality (resp. within village). * denotes signicance at the 10 percent, ** at the 5 percent and, *** at the 1 percent level.

62 Philippines
Table 40: Impacts on participation in planning of development activities
(1) (2) (3) (4) (5) (6)
Panel A: Balanced panel (no weights)
KALAHI-CIDSS 0.058 0.039 0.039 0.055 0.054 0.054
(0.043) (0.040) (0.040) (0.054) (0.054) (0.055)
[0.024]** [0.025] [0.025] [0.032]* [0.032]* [0.032]*
Fixed effects No Municipal Household Household Household Household
Time trends No No No Overall Overall Regional
Additional controls No No No No Yes Yes
Observations 5,652 5,652 5,652 5,652 5,652 5,652
R-squared 0.004 0.041 0.001 0.002 0.010 0.011
Panel B: Balanced panel (with weights)
KALAHI-CIDSS 0.060 0.020 0.020 0.025 0.023 0.024
(0.043) (0.037) (0.037) (0.052) (0.052) (0.052)
[0.024]** [0.026] [0.026] [0.033] [0.032] [0.032]
Fixed effects No Municipal Household Household Household Household
Time trends No No No Overall Overall Regional
Additional controls No No No No Yes Yes
Observations 5,652 5,652 5,652 5,652 5,652 5,652
R-squared 0.004 0.040 0.000 0.000 0.010 0.012
Panel C: Full sample (no weights)
KALAHI-CIDSS -0.061 -0.082 -0.081 -0.037 -0.035 -0.035
(0.035) (0.026)*** (0.028)** (0.034) (0.034) (0.029)
[0.023]*** [0.026]*** [0.025]*** [0.031] [0.031] [0.030]
Fixed effects No Municipal Household Household Household Household
Time trends No No No Overall Overall Regional
Additional controls No No No No Yes Yes
Observations 6,402 6,402 6,402 6,402 6,402 6,402
R-squared 0.005 0.039 0.008 0.012 0.013 0.020
Panel D: Full sample (with weights)
KALAHI-CIDSS 0.057 0.024 0.018 0.022 0.020 0.020
(0.042) (0.038) (0.039) (0.053) (0.053) (0.053)
[0.023]** [0.023] [0.024] [0.031] [0.031] [0.031]
Fixed effects No Municipal Household Household Household Household
Time trends No No No Overall Overall Regional
Additional controls No No No No Yes Yes
Observations 6,402 6,402 6,402 6,402 6,402 6,402
R-squared 0.003 0.038 0.000 0.000 0.010 0.012
Notes: Results from OLS (Column 1) and xed-eects (Columns 2-6) regressions. The dependent variable is a dummy equal to one if an household member joined planning activities for barangay development programs in the 6 months preceding the survey. In Panels A and B, the sample is restricted to households that are observed three times. In Panels C and D the full sample is used. In Panels B and D sample weights are used. The standard errors (in parentheses) (resp. [brackets]) account for potential correlation within municipality (resp. within village). * denotes signicance at the 10 percent, ** at the 5 percent and, *** at the 1 percent level.

The KALAHI-CIDSS Impact Evaluation: A Revised Synthesis Report 63
Annexes
Figure A-1: Project Coverage

64 Philippines
Table A-1: Comparing treatment and control municipalities at baseline (Welfare indicators)
Variable Treatment Control OLS OLSlog per capita expenditures 9.499 9.623 -0.124 -0.122
(0.583) (0.586) [0.033]** [0.041]**
log per capita expenditures (poor households)
9.121 9.209 -0.094 -0.089
(0.356) (0.314) [0.001]*** [0.000]***
log per capita expenditures (non-poor households)
10.028 10.080 -0.043 -0.039
(0.400) (0.464) [0.401] [0.485]
poverty 0.584 0.525 0.059 0.063
(0.493) (0.500) [0.121] [0.109]
non-food share of total consumption 33.025 34.675 -1.652 -1.683
(15.460) (17.565) [0.530] [0.499]
log per capita food expenditures 9.063 9.149 -0.086 -0.082
(0.508) (0.466) [0.024]** [0.031]**
log per capita non-food expenditures 8.258 8.395 -0.138 -0.135
(1.004) (1.111) [0.331] [0.330]
self-rated poverty 0.708 0.697 0.011 0.018
(0.455) (0.460) [0.689] [0.507]
Notes: Each row presents the 2003 average of the listed variable for the treatment (Column 1) and control (Column 2) groups. Each cell in Columns 3 and 4 is either the coecient on the dummy variable indicating whether the project was implemented in the municipality or the associated p-value in [brackets] from a dif-ferent OLS regression with a full set of province dummies. In Column 3 the full 2003 sample is used while in Column 4, the sample is restricted to households which are still in the sample in 2010.

The KALAHI-CIDSS Impact Evaluation: A Revised Synthesis Report 65
Table A-2: Comparing treatment and control municipalities at baseline (Access indicators)
Variable Treatment Control OLS OLS(1) (2) (3) (4)
house accessibility 0.439 0.542 -0.102 -0.120
(0.496) (0.498) [0.111] [0.073]*
number of trips to municipal center 3.376 5.794 -2.422 -2.561
(6.112) (9.124) [0.009]*** [0.010]***
log per capita transportation expenditures 5.201 5.410 -0.209 -0.258
(2.070) (2.139) [0.447] [0.330]
access to level II and III water supply 0.440 0.447 -0.008 0.015
(0.497) (0.497) [0.905] [0.823]
access to safe water 0.876 0.842 0.034 0.030
(0.330) (0.365) [0.195] [0.224]
access to water-sealed toilets 0.530 0.592 -0.062 -0.064
(0.499) (0.492) [0.307] [0.304]
Notes: Each row presents the 2003 average of the listed variable for the treatment (Column 1) and control (Column 2) groups. Each cell in Columns 3 and 4 is either the coecient on the dummy variable indicating whether the project was implemented in the municipality or the associated p-value in [brackets] from a dif-ferent OLS regression with a full set of province dummies. In Column 3 the full 2003 sample is used while in Column 4, the sample is restricted to households which are still in the sample in 2010.

66 Philippines
Table A-3: Comparing treatment and control municipalities at baseline (Social capital and local governance indicators)
Variable Treatment Control OLS OLSattendance in village assemblies (1) (2) (3) (4)
0.611 0.612 0.000 -0.012
willingness to contribute money to community projects
(0.488) (0.488) [1.000] [0.777]
0.361 0.376 -0.015 -0.018
trust that others are willing to help if needed (0.480) (0.485) [0.723] [0.638]
0.759 0.760 -0.001 -0.002
willingness to contribute time to community projects
(0.428) (0.427) [0.981] [0.946]
0.749 0.706 0.044 0.033
participation in bayanihan (0.434) (0.456) [0.159] [0.228]
0.597 0.484 0.113 0.110
group membership (0.491) (0.500) [0.107] [0.095]*
0.324 0.312 0.012 0.013
trust community members (0.468) (0.464) [0.632] [0.604]
0.545 0.614 -0.070 -0.080
need to be alert (0.498) (0.487) [0.063]* [0.034]**
0.620 0.585 0.035 0.037
trust other with money (0.486) (0.493) [0.541] [0.493]
0.490 0.457 0.033 0.035
trust local officials (0.500) (0.498) [0.314] [0.304]
0.528 0.566 -0.038 -0.028
trust national officials (0.499) (0.496) [0.614] [0.711]
0.418 0.452 -0.034 -0.052
trust strangers (0.493) (0.498) [0.606] [0.426]
0.052 0.125 -0.073 -0.061
perceptions of peace (0.223) (0.331) [0.027]** [0.050]*
0.835 0.857 -0.021 -0.017
knowledge of village budget 0.105 0.111 -0.006 -0.007
(0.307) (0.314) [0.840] [0.821]
participation in development activities 0.284 0.263 0.021 0.018
(0.451) (0.441) [0.604] [0.659]
confidence to participate in development activities
0.416 0.400 0.016 0.010
(0.493) (0.490) [0.649] [0.770]
Notes: Each row presents the 2003 average of the listed variable for the treatment (Column 1) and control (Column 2) groups. Each cell in Columns 3 and 4 is either the coecient on the dummy variable indicating whether the project was implemented in the municipality or the associated p-value in [brackets] from a dif-ferent OLS regression with a full set of province dummies. In Column 3 the full 2003 sample is used while in Column 4, the sample is restricted to households which are still in the sample in 2010.

The KALAHI-CIDSS Impact Evaluation: A Revised Synthesis Report 67
Table A-4: Parallel Trend Hypothesis: Consumption
Panel A: Per capita food consumption
Placebo -1.268 -0.634 -0.643 -0.177
(1.052) (1.079) (0.835) (1.079)
Observations 724 724 724 724
HH controls No No Yes Yes
Mun. Dummies No Yes No Yes
R-squared 0.01 0.15 0.38 0.47
Panel B: Log per capita food consumption
Placebo -0.127 -0.043 -0.060 0.004
(0.130) (0.133) (0.107) (0.126)
Observations 724 724 724 724
Mun. Dummies No Yes No Yes
R-squared 0.01 0.15 0.48 0.56
Panel C: Per capita non-food consumption
Placebo 2.464 4.202 5.969 5.744
(5.633) (5.478) (7.232) (6.971)
Observations 724 724 724 724
HH controls No No Yes Yes
Mun. Dummies No Yes No Yes
R-squared 0.00 0.02 0.07 0.09
Panel D: Log per capita non-food consumption
Placebo -0.188 0.116 -0.052 0.121
(0.199) (0.303) (0.156) (0.287)
Observations 724 724 724 724
HH controls No No Yes Yes
Mun. Dummies No Yes No Yes
R-squared 0.02 0.12 0.46 0.50
Notes: Results from OLS regressions using 2000 and 2003 FIES data. The dependent variable is the per capita food consumption (PHP 1,000) in Panel A, the log per capita food consumption in Panel B, the per capita non-food consumption (PHP 1,000) in Panel C and, the log per capita non-food consumption in Panel D. The standard errors (in parentheses) account for potential correlation within municipality. All re-gressions include time-trends. * denotes signicance at the 10 percent, ** at the 5 percent and, *** at the 1 percent level.

68 Philippines
Table A-5: Parallel Trend Hypothesis: Asset
Panel A: Electricity
Placebo -0.159 0.185 -0.132 0.118
(0.099) ().222) (0.083) (0.190)
Observations 724 724 724 724
HH controls No No Yes Yes
Mun. Dummies No Yes No Yes
R-squared 0.03 0.13 0.20 0.26
Panel B: Index of durable goods
Placebo -0.389 1.124 -0.149 0.789
(0.506) (0.760) (0.356) (0.596)
Observations 724 724 724 724
HH controls No No Yes Yes
Mun. Dummies No Yes No Yes
R-squared 0.01 0.13 0.37 0.42
Notes: Results from OLS regressions using 2000 and 2003 FIES data. The dependent variable is an as-set index in Panel A and a dummy equal to one if the household has access to electricity in Panel B. The standard errors (in parentheses) account for potential correlation within municipality. All regressions include time-trends. * denotes signicance at the 10 percent, ** at the 5 percent and, ***at the 1 percent level.

The KALAHI-CIDSS Impact Evaluation: A Revised Synthesis Report 69
Table A-6: Are the determinants of attrition different in treatment and control municipalities? (Welfare indicators)
Variable Treatment Control Chi-sq(1) (2) (3)
log per capita expenditures 0.007 -0.035 0.185
(0.072) (0.157) [0.667]
log per capita expenditures (poor households) -0.115 -0.111 0.000
(0.160) (0.357) [0.988]
log per capita expenditures (non-poor households) 0.131 0.119 0.003
(0.158) (0.336) [0.955]
poverty -0.005 0.018 0.039
(0.086) (0.187) [0.844]
non-food share of total consumption 0.000 0.000 0.027
(0.003) (0.006) [0.870]
log per capita food expenditures -0.017 -0.081 0.292
(0.083) (0.184) [0.589]
log per capita non-food expenditures -0.008 -0.030 0.164
(0.041) (0.089) [0.685]
self-rated poverty -0.004 -0.050 0.130
(0.092) (0.203) [0.718]
Notes: Each row presents coeffcients from a different probit regression of the probability of dropping out of the sample between 203 and 2010. Each regression includes controls for the interaction of the variable listed with the treatment dummy (Column 2), its interaction with the control dummy (Column 3), the treat-ment dummy and a full set of province dummies. Column 3 reports tests of equality of the two coecients reported in Columns 1 and 2. Standard errors are in (parenthesis) and p-values are in [brackets].

70 Philippines
Table A-7: Are the determinants of attrition different in treatment and control municipalities? (Access indicators)
Variable Treatment Control Chi-sq(1) (2) (3)
house accessibility 0.078 0.263 2.490
(0.086) (0.187) [0.115]
number of trips to municipal center -0.001 0.000 0.027
(0.007) (0.015) [0.869]
log per capita transportation expenditures -0.014 0.003 0.341
(0.020) (0.044) [0.559]
access to level II and III water supply -0.297 -0.576 5.516
(0.086) (0.189) [0.019]**
access to safe water 0.058 0.148 0.273
(0.130) (0.283) [0.601]
access to water-sealed toilets -0.274 -0.327 0.203
(0.084) (0.187) [0.652]
Notes: Each row presents coecients from a different probit regression of the probability of dropping out of the sample between 203 and 2010. Each regression includes controls for the interaction of the variable listed with the treatment dummy (Column 2), its interaction with the control dummy (Column 3), the treat-ment dummy and a full set of province dummies. Column 3 reports tests of equality of the two coecients reported in Columns 1 and 2. Standard errors are in (parenthesis) and p-values are in [brackets].

The KALAHI-CIDSS Impact Evaluation: A Revised Synthesis Report 71
Table A-8: Are the determinants of attrition different in treatment and control municipalities? (Social capital and local governance indicators)
Variable Treatment Control Chi-sq(1) (2) (3)
attendance in village assemblies -0.087 0.092 2.229
(0.090) (0.194) [0.135]
willingness to contribute money to community projects -0.121 -0.110 0.007
(0.088) (0.193) [0.932]
trust that others are willing to help if needed -0.064 -0.083 0.022
(0.095) (0.212) [0.882]
willingness to contribute time to community projects -0.072 0.035 0.687
(0.095) (0.209) [0.407]
participation in bayanihan -0.269 -0.316 0.152
(0.088) (0.190) [0.697]
group membership -0.238 -0.277 0.098
(0.091) (0.200) [0.755]
trust community members 0.114 0.262 1.583
(0.083) (0.186) [0.208]
need to be alert 0.005 0.002 0.001
(0.086) (0.189) [0.980]
trust other with money -0.024 -0.069 0.147
(0.083) (0.184) [0.701]
trust local officials 0.003 -0.135 1.400
(0.083) (0.185) [0.237]
trust national officials 0.171 0.362 2.685
(0.083) (0.185) [0.101]
trust strangers -0.295 -0.628 2.010
(0.202) (0.421) [0.156]
perceptions of peace 0.008 -0.065 0.199
(0.112) (0.254) [0.655]
knowledge of village budget -0.316 -0.318 0.000
(0.147) (0.327) [0.993]
participation in development activities -0.098 -0.037 0.212
(0.092) (0.206) [0.645]
confidence to participate in development activities -0.018 0.021 0.108
(0.084) (0.187) [0.742]
Notes: Each row presents coecients from a different probit regression of the probability of dropping out of the sample between 203 and 2010. Each regression includes controls for the interaction of the variable listed with the treatment dummy (Column 2), its interaction with the control dummy (Column 3), the treat-ment dummy and a full set of province dummies. Column 3 reports tests of equality of the two coecients reported in Columns 1 and 2. Standard errors are in (parenthesis) andp-values are in [brackets].


Sustainable Development DepartmentEast Asia and the Pacific Region
THE WORLD BANK1818 H, Street N.W.Washington, D.C. 20433 USATel: 202 473 1000Fax 202 477 6392Internet URL: www.worldbank.org
WORLD BANK OfficE MANiLA25th Floor, One Global Place 5th Avenue, Bontacio Global City Taguig City, PhilippinesTel: (632) 465 2500Fax: (632) 465 2505Internet URL: www.worldbank.org.ph