world blueberry acreage & production - manic moose...
TRANSCRIPT
© 2015 U.S. Highbush Blueberry Council
World Blueberry Acreage & Production
Cort Brazelton
SE Fruit & Veg 2016

© 2015 U.S. Highbush Blueberry Council Cort Brazelton
Where Have we been? …Where are we now?
2
World Blueberry Volume 1995:
50 Million lbs. – 2005 USHBC World Acreage & Production Report
World Blueberry Volume 2014:
1.2 Billion lbs. – 2014 USHBC World BB Statistics & Global Market Analysis

© 2015 U.S. Highbush Blueberry Council Cort Brazelton
Parallels
Blueberries – Now the #2 Berry • World Blueberry Volume 1995: 50M lbs.
– 2005 USHBC World Acreage & Production Report
• World Blueberry Volume 2014: 1.2Bn lbs. – 2014 USHBC World BB Statistics & Global Market Analysis
Strawberries – Still #1 Berry • World Strawberry Volume 1995: 5.7B lbs.
– USDA ERS
• World Strawberry Volume 2012: 10Bn lbs. – UN FAO
3
© 2015 U.S. Highbush Blueberry Council Cort Brazelton
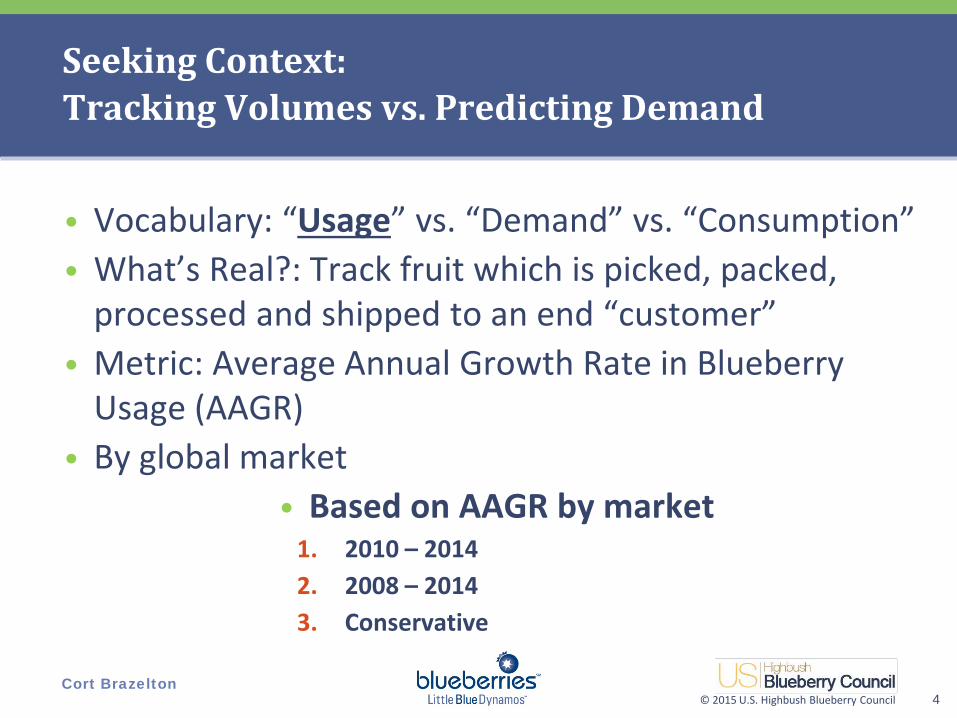
Seeking Context: Tracking Volumes vs. Predicting Demand
• Vocabulary: “Usage” vs. “Demand” vs. “Consumption” • What’s Real?: Track fruit which is picked, packed,
processed and shipped to an end “customer” • Metric: Average Annual Growth Rate in Blueberry
Usage (AAGR) • By global market
• Based on AAGR by market 1. 2010 – 2014 2. 2008 – 2014 3. Conservative
4

© 2015 U.S. Highbush Blueberry Council Cort Brazelton
AAGR Calculations
5
North America Europe
Asia/ Pacific
Only Asia
2008 498 73 29 23
2010 594 123 34 27
2014 900 215 115 97
2008-14 AAGR (6 year Avg.) 13% 32% 49% 54%
2010-14 AAGR (4 year Avg.) 13% 19% 60% 65%
Conservative 8% 13% 15% 20%
Usage by Year, by MarketMillions of lb

© 2015 U.S. Highbush Blueberry Council Cort Brazelton
Usage Projections at Last 4 Years AAGR by Market
6
Highly Improbable
© 2015 U.S. Highbush Blueberry Council Cort Brazelton
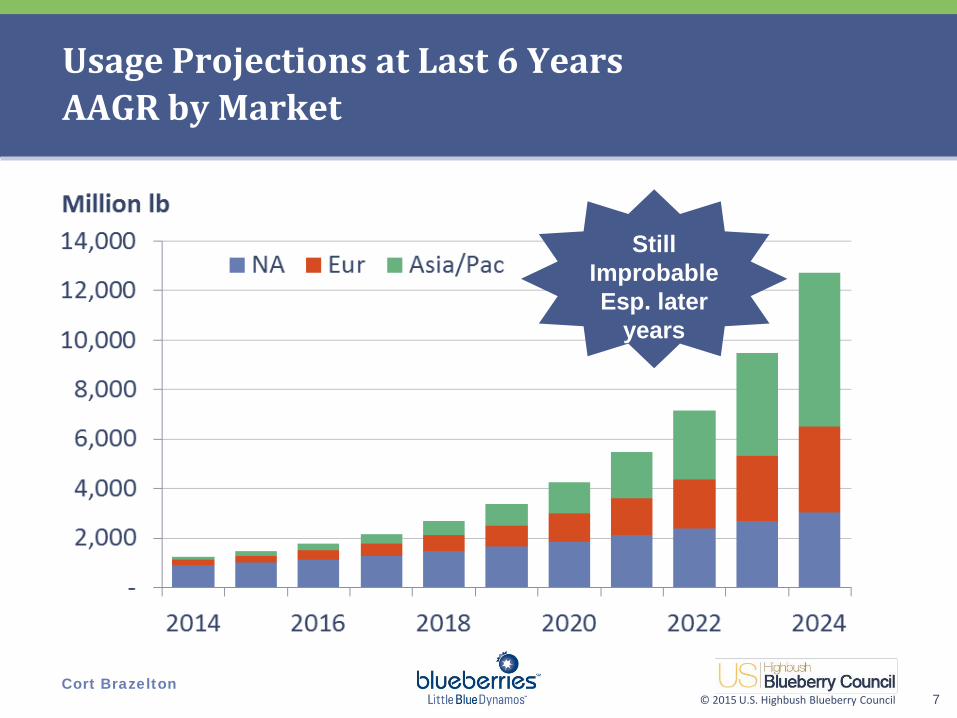
Usage Projections at Last 6 Years AAGR by Market
7
Still Improbable Esp. later
years
© 2015 U.S. Highbush Blueberry Council Cort Brazelton
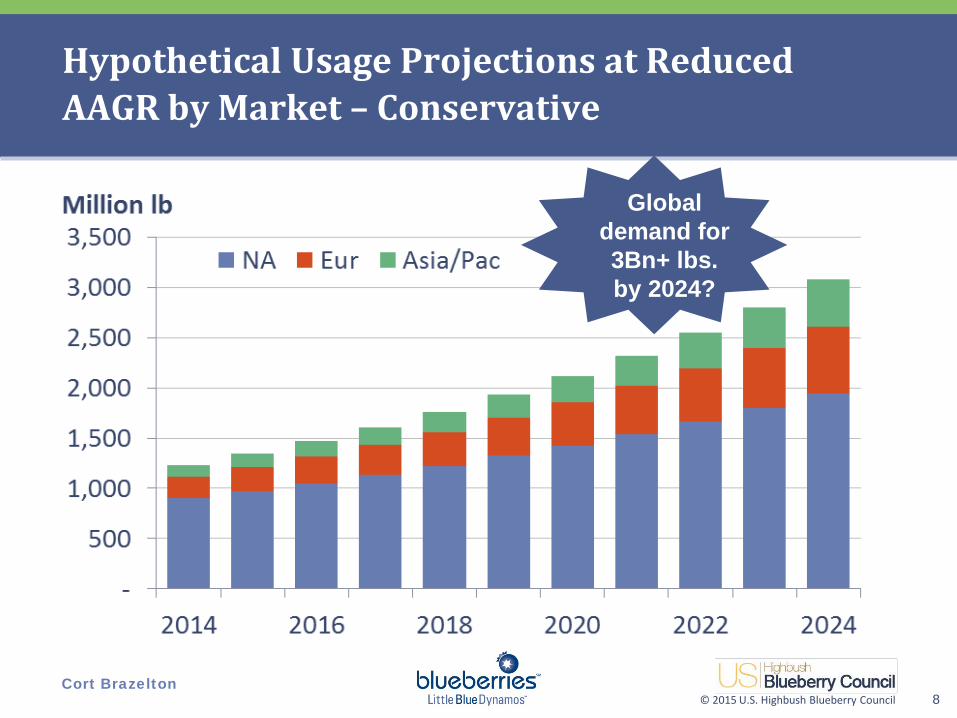
Hypothetical Usage Projections at Reduced AAGR by Market – Conservative
8
Global demand for 3Bn+ lbs. by 2024?

© 2015 U.S. Highbush Blueberry Council Cort Brazelton
Traditional ...
9
Developing…

© 2015 U.S. Highbush Blueberry Council Cort Brazelton
North America
10
© 2015 U.S. Highbush Blueberry Council Cort Brazelton
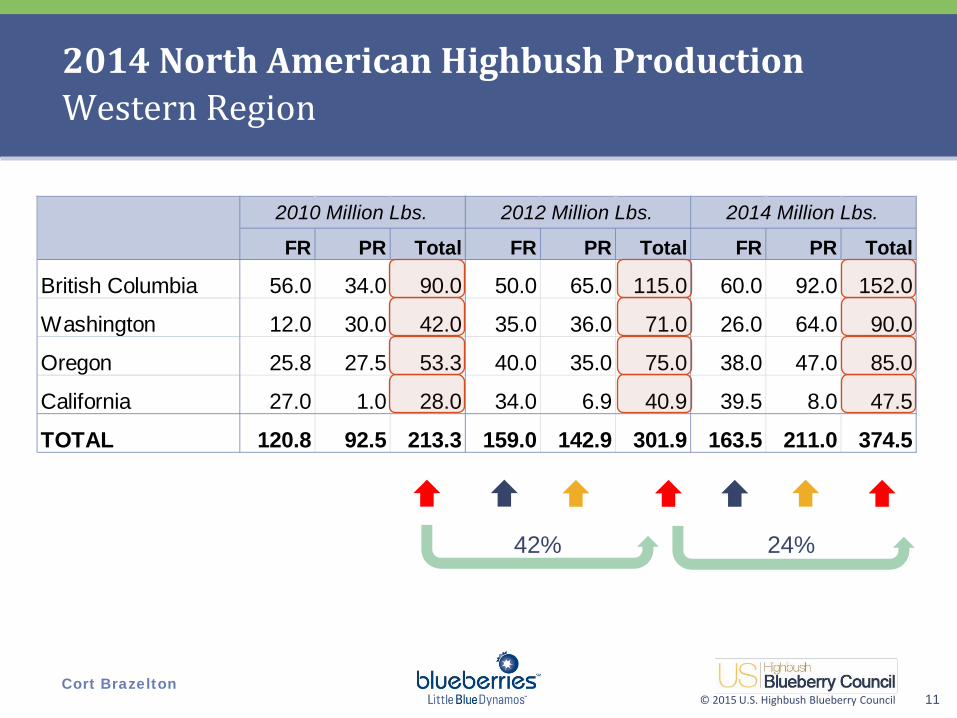
FR PR Total FR PR Total FR PR Total
British Columbia 56.0 34.0 90.0 50.0 65.0 115.0 60.0 92.0 152.0
Washington 12.0 30.0 42.0 35.0 36.0 71.0 26.0 64.0 90.0
Oregon 25.8 27.5 53.3 40.0 35.0 75.0 38.0 47.0 85.0
California 27.0 1.0 28.0 34.0 6.9 40.9 39.5 8.0 47.5
TOTAL 120.8 92.5 213.3 159.0 142.9 301.9 163.5 211.0 374.5
2010 Million Lbs. 2012 Million Lbs. 2014 Million Lbs.
2014 North American Highbush Production Western Region
11
42% 24%
© 2015 U.S. Highbush Blueberry Council Cort Brazelton
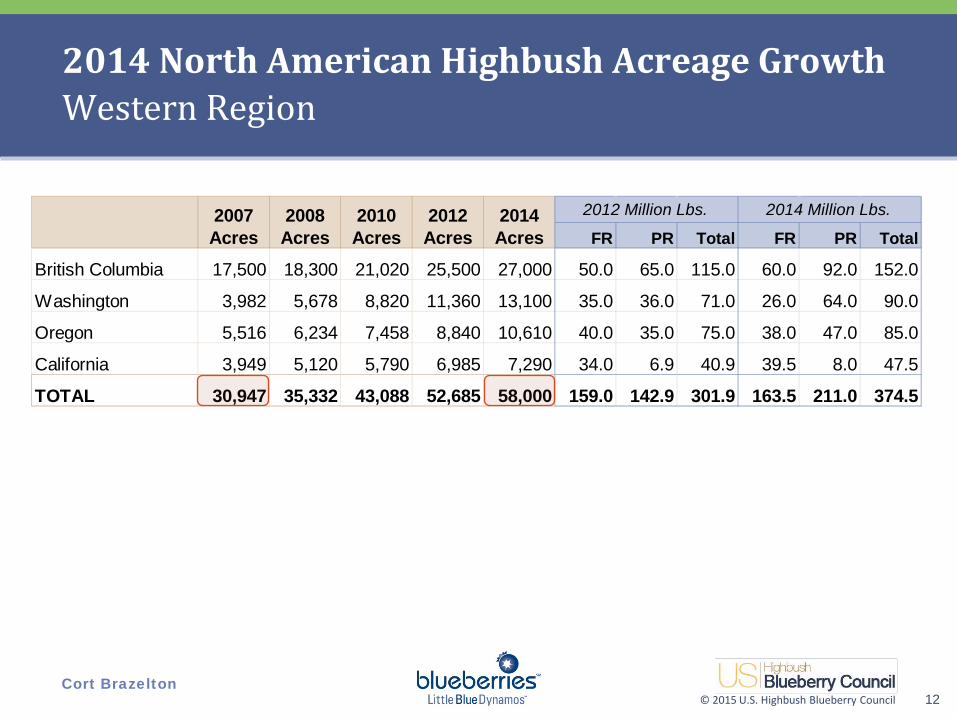
2014 North American Highbush Acreage Growth Western Region
12
FR PR Total FR PR Total
British Columbia 17,500 18,300 21,020 25,500 27,000 50.0 65.0 115.0 60.0 92.0 152.0
Washington 3,982 5,678 8,820 11,360 13,100 35.0 36.0 71.0 26.0 64.0 90.0
Oregon 5,516 6,234 7,458 8,840 10,610 40.0 35.0 75.0 38.0 47.0 85.0
California 3,949 5,120 5,790 6,985 7,290 34.0 6.9 40.9 39.5 8.0 47.5
TOTAL 30,947 35,332 43,088 52,685 58,000 159.0 142.9 301.9 163.5 211.0 374.5
2007 Acres
2008 Acres
2012 Acres
2012 Million Lbs.2010 Acres
2014 Million Lbs.2014 Acres
© 2015 U.S. Highbush Blueberry Council Cort Brazelton
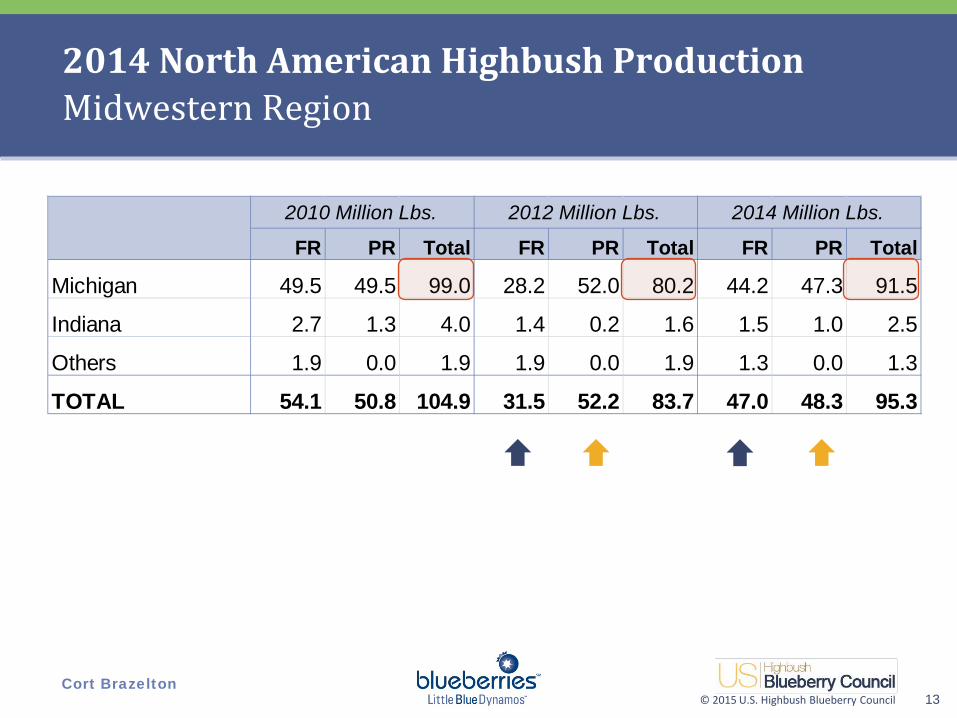
FR PR Total FR PR Total FR PR Total
Michigan 49.5 49.5 99.0 28.2 52.0 80.2 44.2 47.3 91.5
Indiana 2.7 1.3 4.0 1.4 0.2 1.6 1.5 1.0 2.5
Others 1.9 0.0 1.9 1.9 0.0 1.9 1.3 0.0 1.3
TOTAL 54.1 50.8 104.9 31.5 52.2 83.7 47.0 48.3 95.3
2010 Million Lbs. 2012 Million Lbs. 2014 Million Lbs.
2014 North American Highbush Production Midwestern Region
13
© 2015 U.S. Highbush Blueberry Council Cort Brazelton
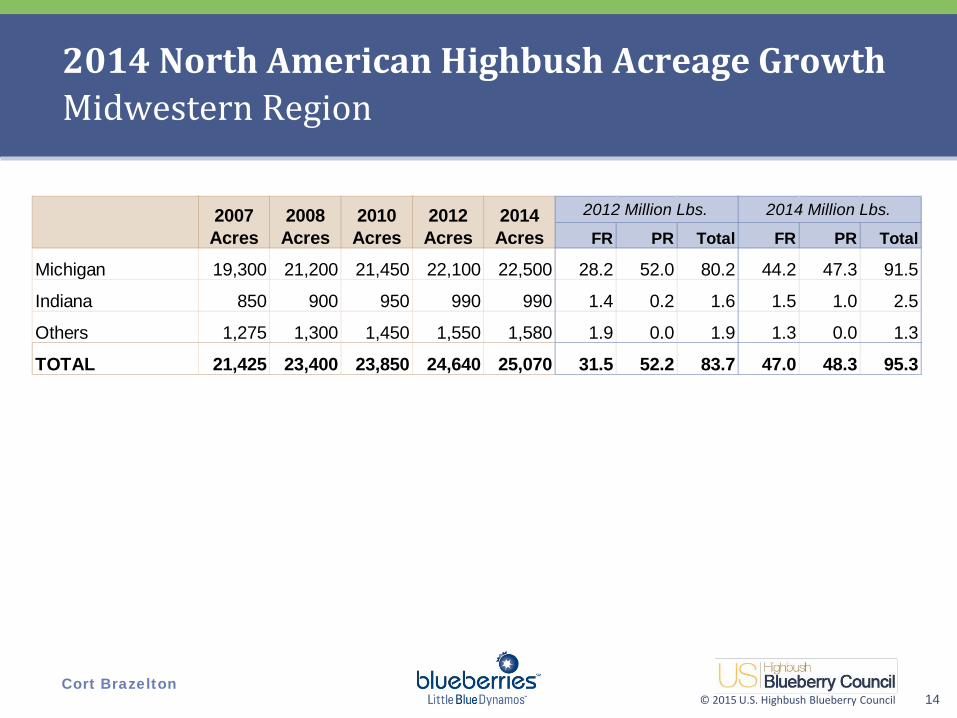
2014 North American Highbush Acreage Growth Midwestern Region
14
FR PR Total FR PR Total
Michigan 19,300 21,200 21,450 22,100 22,500 28.2 52.0 80.2 44.2 47.3 91.5
Indiana 850 900 950 990 990 1.4 0.2 1.6 1.5 1.0 2.5
Others 1,275 1,300 1,450 1,550 1,580 1.9 0.0 1.9 1.3 0.0 1.3
TOTAL 21,425 23,400 23,850 24,640 25,070 31.5 52.2 83.7 47.0 48.3 95.3
2007 Acres
2008 Acres
2012 Acres
2012 Million Lbs.2010 Acres
2014 Million Lbs.2014 Acres
© 2015 U.S. Highbush Blueberry Council Cort Brazelton
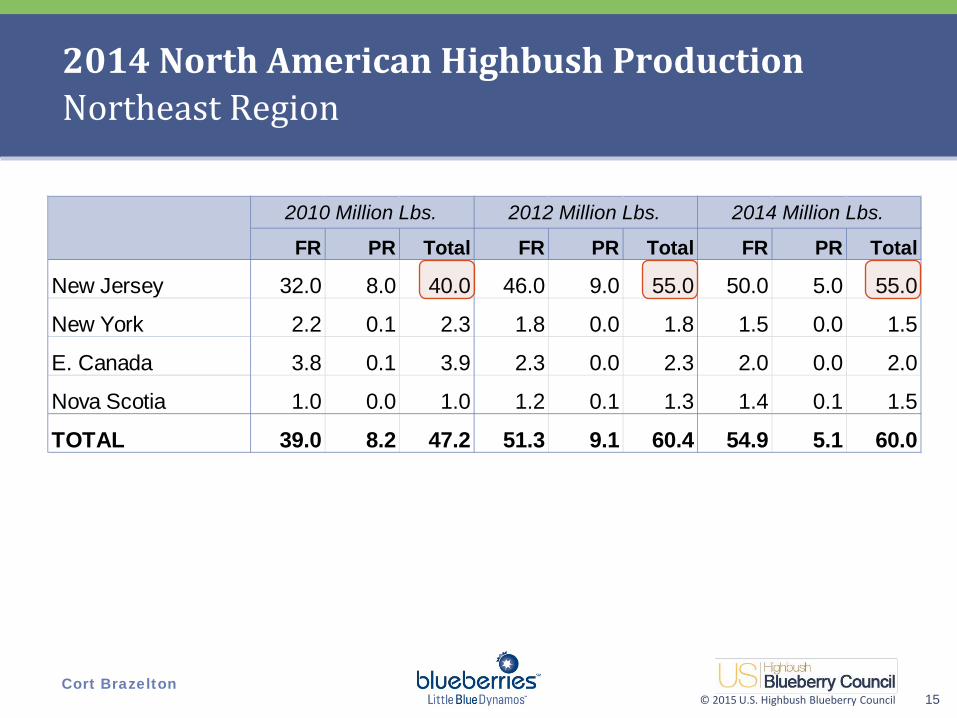
2014 North American Highbush Production Northeast Region
15
FR PR Total FR PR Total FR PR Total
New Jersey 32.0 8.0 40.0 46.0 9.0 55.0 50.0 5.0 55.0
New York 2.2 0.1 2.3 1.8 0.0 1.8 1.5 0.0 1.5
E. Canada 3.8 0.1 3.9 2.3 0.0 2.3 2.0 0.0 2.0
Nova Scotia 1.0 0.0 1.0 1.2 0.1 1.3 1.4 0.1 1.5
TOTAL 39.0 8.2 47.2 51.3 9.1 60.4 54.9 5.1 60.0
2010 Million Lbs. 2012 Million Lbs. 2014 Million Lbs.

© 2015 U.S. Highbush Blueberry Council Cort Brazelton
2014 North American Highbush Acreage Growth Northeast Region
16
FR PR Total FR PR Total
New Jersey 7,900 7,960 8,120 8,170 8,200 46.0 9.0 55.0 50.0 5.0 55.0
New York 1,050 1,100 1,200 1,250 1,300 1.8 0.0 1.8 1.5 0.0 1.5
E. Canada 1,150 1,200 1,260 1,300 1,350 2.3 0.0 2.3 2.0 0.0 2.0
Nova Scotia 300 300 300 320 335 1.2 0.1 1.3 1.4 0.1 1.5
TOTAL 10,400 10,560 10,880 11,040 11,185 51.3 9.1 60.4 54.9 5.1 60.0
2007 Acres
2008 Acres
2012 Acres
2012 Million Lbs.2010 Acres
2014 Million Lbs.2014 Acres
© 2015 U.S. Highbush Blueberry Council Cort Brazelton
FR PR Total FR PR Total FR PR Total
Florida 15.0 0.8 15.8 16.0 3.0 19.0 17.0 0.0 17.0
Arkansas 0.5 0.0 0.5 0.5 0.0 0.5 0.5 0.0 0.5
Miss./Louisiana 3.0 4.5 7.5 3.3 5.0 8.3 4.5 4.7 9.2
Georgia 36.0 20.0 56.0 36.0 35.0 71.0 56.0 40.0 96.0
North Carolina 27.5 11.5 39.0 30.0 10.0 40.0 37.5 11.0 48.5
Texas 1.5 0.0 1.5 2.0 0.1 2.1 1.5 0.0 1.5
Others 0.6 0.0 0.6 0.3 0.0 0.3 1.5 0.5 2.0
TOTAL 84.1 36.8 120.9 88.1 53.1 141.2 118.5 56.2 174.7
2010 Million Lbs. 2012 Million Lbs. 2014 Million Lbs.
2014 North American Highbush Production Southern Region
17
© 2015 U.S. Highbush Blueberry Council Cort Brazelton
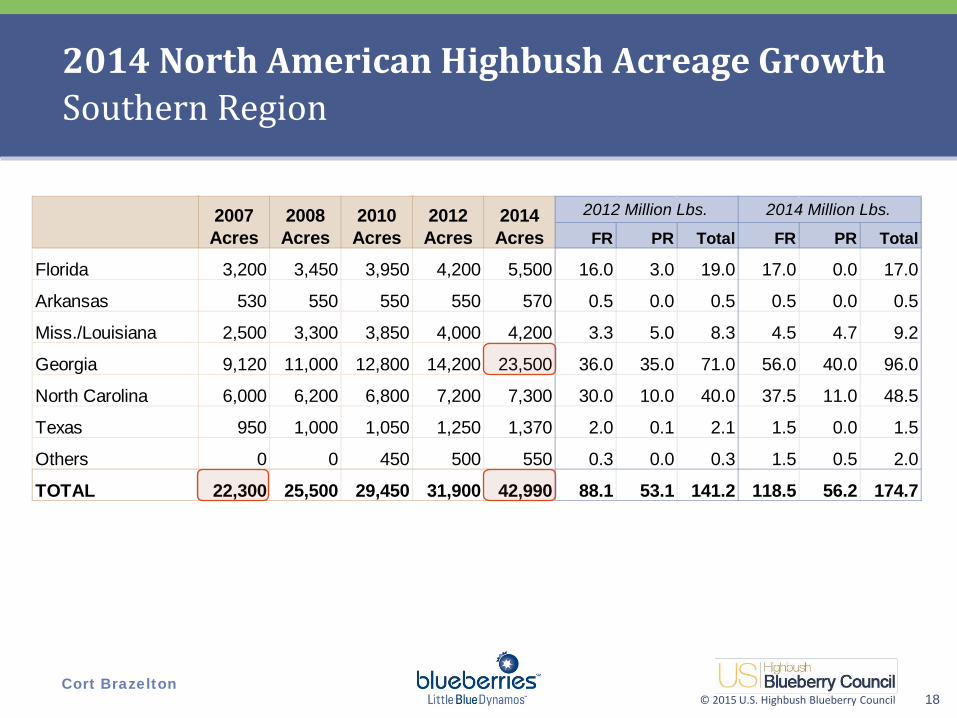
2014 North American Highbush Acreage Growth Southern Region
18
FR PR Total FR PR Total
Florida 3,200 3,450 3,950 4,200 5,500 16.0 3.0 19.0 17.0 0.0 17.0
Arkansas 530 550 550 550 570 0.5 0.0 0.5 0.5 0.0 0.5
Miss./Louisiana 2,500 3,300 3,850 4,000 4,200 3.3 5.0 8.3 4.5 4.7 9.2
Georgia 9,120 11,000 12,800 14,200 23,500 36.0 35.0 71.0 56.0 40.0 96.0
North Carolina 6,000 6,200 6,800 7,200 7,300 30.0 10.0 40.0 37.5 11.0 48.5
Texas 950 1,000 1,050 1,250 1,370 2.0 0.1 2.1 1.5 0.0 1.5
Others 0 0 450 500 550 0.3 0.0 0.3 1.5 0.5 2.0
TOTAL 22,300 25,500 29,450 31,900 42,990 88.1 53.1 141.2 118.5 56.2 174.7
2007 Acres
2008 Acres
2012 Acres
2012 Million Lbs.2010 Acres
2014 Million Lbs.2014 Acres
© 2015 U.S. Highbush Blueberry Council Cort Brazelton
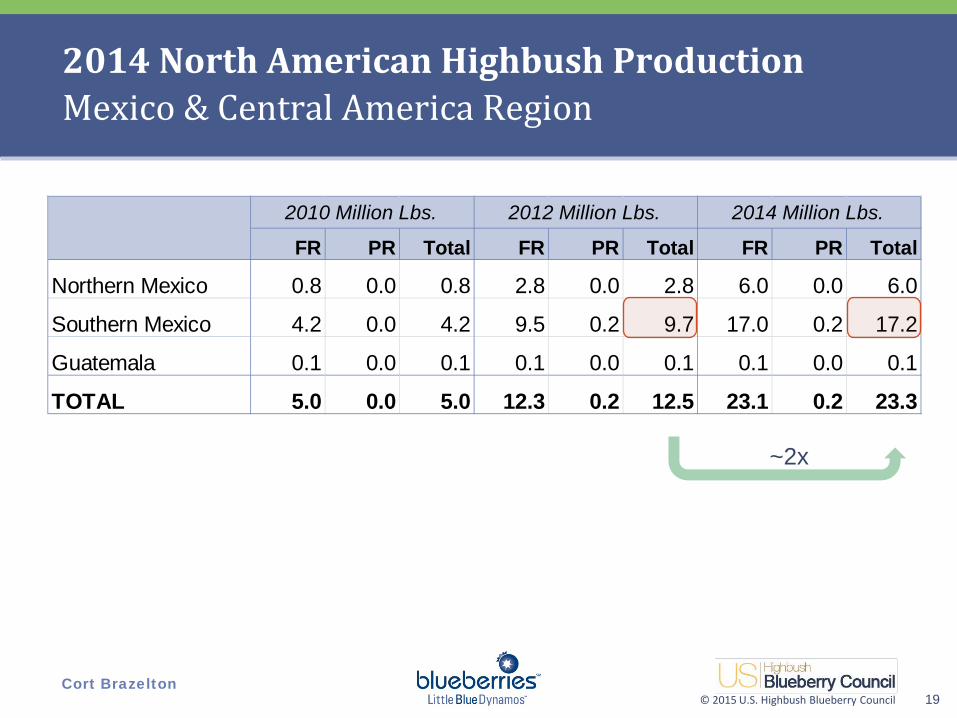
FR PR Total FR PR Total FR PR Total
Northern Mexico 0.8 0.0 0.8 2.8 0.0 2.8 6.0 0.0 6.0
Southern Mexico 4.2 0.0 4.2 9.5 0.2 9.7 17.0 0.2 17.2
Guatemala 0.1 0.0 0.1 0.1 0.0 0.1 0.1 0.0 0.1
TOTAL 5.0 0.0 5.0 12.3 0.2 12.5 23.1 0.2 23.3
2010 Million Lbs. 2012 Million Lbs. 2014 Million Lbs.
2014 North American Highbush Production Mexico & Central America Region
19
~2x

© 2015 U.S. Highbush Blueberry Council Cort Brazelton
2014 North American Highbush Acreage Growth Mexico & Central America Region
20
FR PR Total FR PR Total
Northern Mexico 180 260 295 650 1,580 2.8 0.0 2.8 6.0 0.0 6.0
Southern Mexico 350 530 1,350 2,400 4,790 9.5 0.2 9.7 17.0 0.2 17.2
Guatemala 15 15 18 20 21 0.1 0.0 0.1 0.1 0.0 0.1
TOTAL 545 805 1,663 3,070 6,391 12.3 0.2 12.5 23.1 0.2 23.3
2007 Acres
2008 Acres
2012 Acres
2012 Million Lbs.2010 Acres
2014 Million Lbs.2014 Acres
© 2015 U.S. Highbush Blueberry Council Cort Brazelton
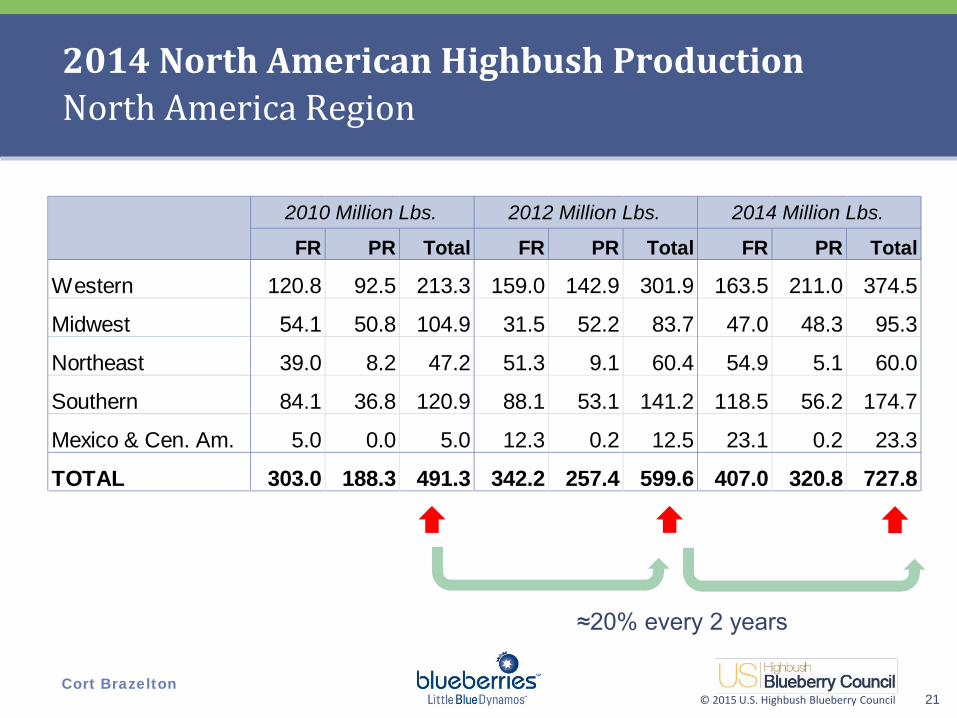
2014 North American Highbush Production North America Region
21
≈20% every 2 years
FR PR Total FR PR Total FR PR Total
Western 120.8 92.5 213.3 159.0 142.9 301.9 163.5 211.0 374.5
Midwest 54.1 50.8 104.9 31.5 52.2 83.7 47.0 48.3 95.3
Northeast 39.0 8.2 47.2 51.3 9.1 60.4 54.9 5.1 60.0
Southern 84.1 36.8 120.9 88.1 53.1 141.2 118.5 56.2 174.7
Mexico & Cen. Am. 5.0 0.0 5.0 12.3 0.2 12.5 23.1 0.2 23.3
TOTAL 303.0 188.3 491.3 342.2 257.4 599.6 407.0 320.8 727.8
2010 Million Lbs. 2012 Million Lbs. 2014 Million Lbs.
© 2015 U.S. Highbush Blueberry Council Cort Brazelton
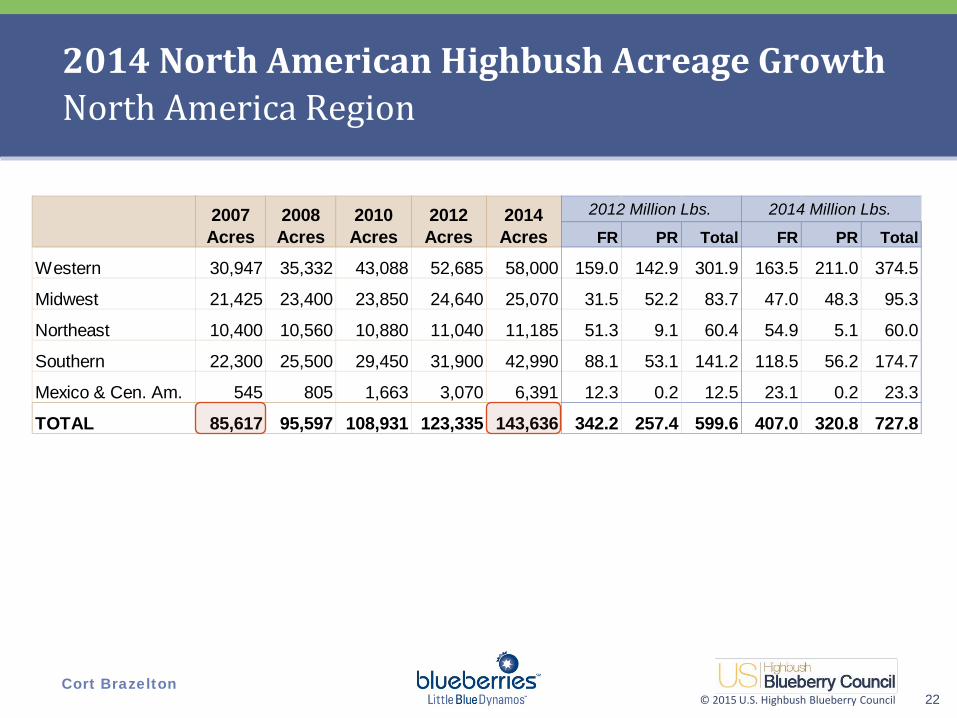
2014 North American Highbush Acreage Growth North America Region
22
FR PR Total FR PR Total
Western 30,947 35,332 43,088 52,685 58,000 159.0 142.9 301.9 163.5 211.0 374.5
Midwest 21,425 23,400 23,850 24,640 25,070 31.5 52.2 83.7 47.0 48.3 95.3
Northeast 10,400 10,560 10,880 11,040 11,185 51.3 9.1 60.4 54.9 5.1 60.0
Southern 22,300 25,500 29,450 31,900 42,990 88.1 53.1 141.2 118.5 56.2 174.7
Mexico & Cen. Am. 545 805 1,663 3,070 6,391 12.3 0.2 12.5 23.1 0.2 23.3
TOTAL 85,617 95,597 108,931 123,335 143,636 342.2 257.4 599.6 407.0 320.8 727.8
2014 Million Lbs.2012 Acres
2010 Acres
2007 Acres
2008 Acres
2012 Million Lbs.2014 Acres

© 2015 U.S. Highbush Blueberry Council Cort Brazelton
North American Acreage Increases 1995 - 2014
23
0
25,000
50,000
75,000
100,000
125,000
150,000
1995 1999 2001 2003 2005 2007 2008 2010 2012 2014
© 2015 U.S. Highbush Blueberry Council Cort Brazelton
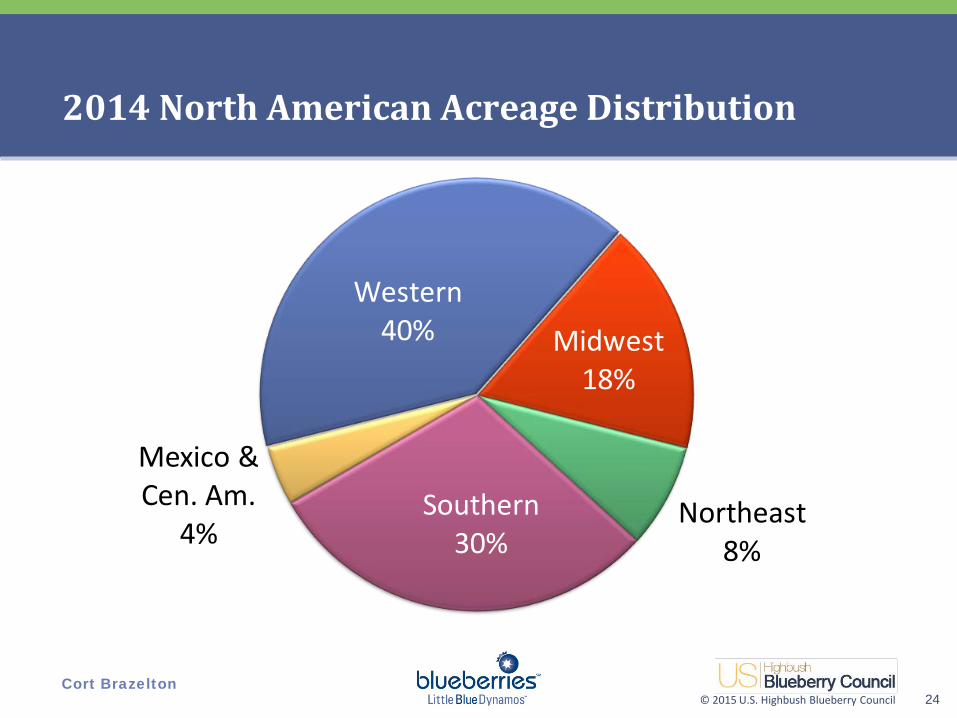
2014 North American Acreage Distribution
24
Western40% Midwest
18%
Northeast8%
Southern30%
Mexico & Cen. Am.
4%
© 2015 U.S. Highbush Blueberry Council Cort Brazelton
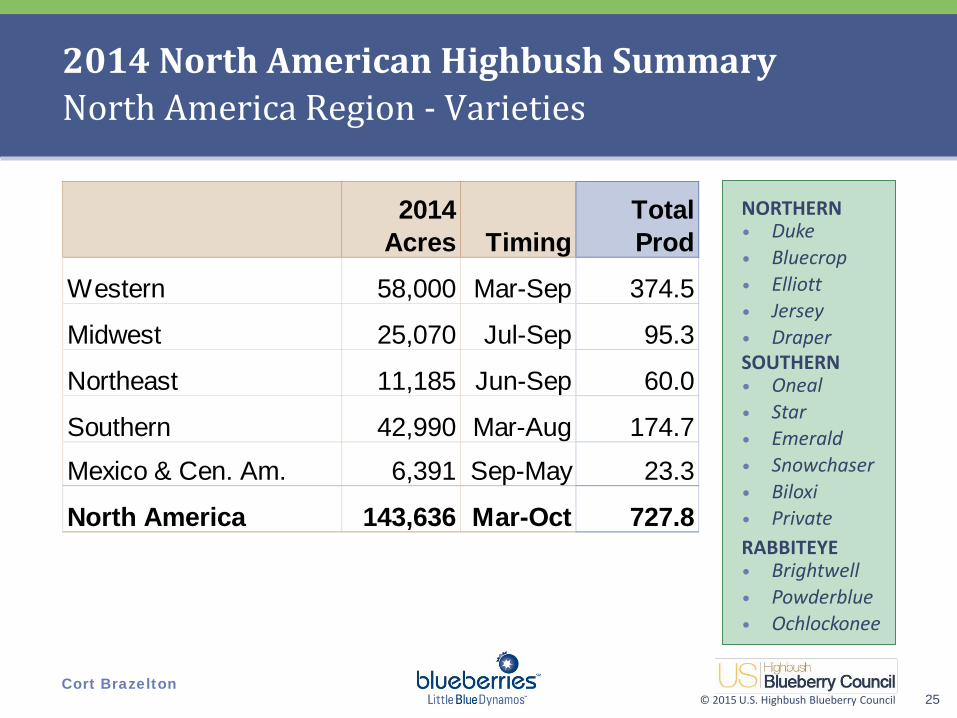
2014 North American Highbush Summary North America Region - Varieties
25
NORTHERN • Duke • Bluecrop • Elliott • Jersey • Draper SOUTHERN • Oneal • Star • Emerald • Snowchaser • Biloxi • Private RABBITEYE • Brightwell • Powderblue • Ochlockonee
Western 58,000 Mar-Sep 374.5
Midwest 25,070 Jul-Sep 95.3
Northeast 11,185 Jun-Sep 60.0
Southern 42,990 Mar-Aug 174.7
Mexico & Cen. Am. 6,391 Sep-May 23.3
North America 143,636 Mar-Oct 727.8
2014 Acres Timing
Total Prod
© 2015 U.S. Highbush Blueberry Council Cort Brazelton
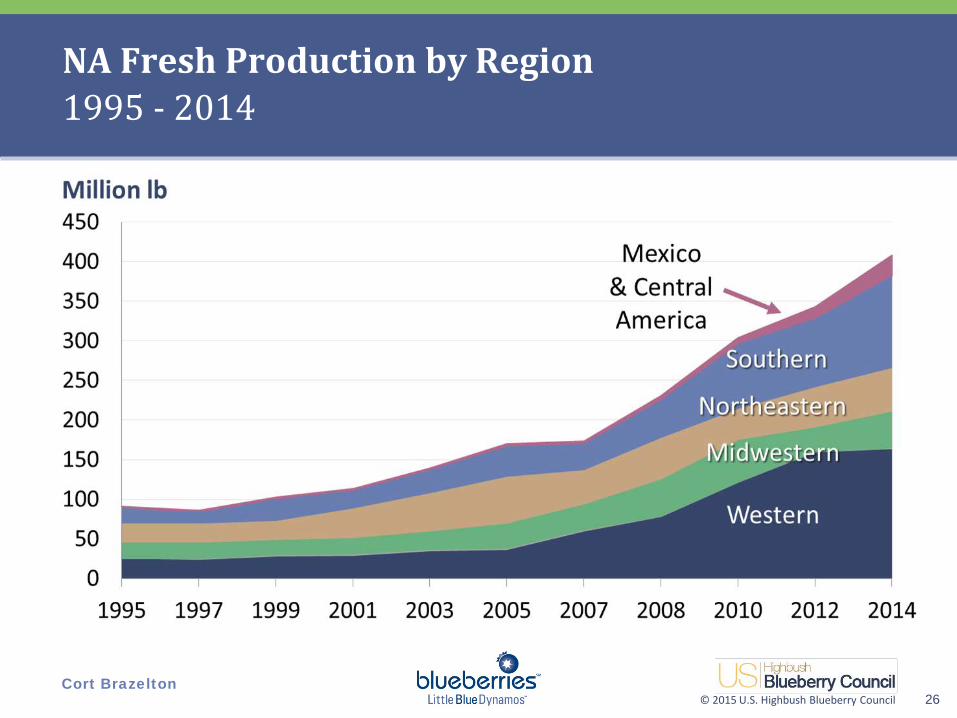
NA Fresh Production by Region 1995 - 2014
26
© 2015 U.S. Highbush Blueberry Council Cort Brazelton
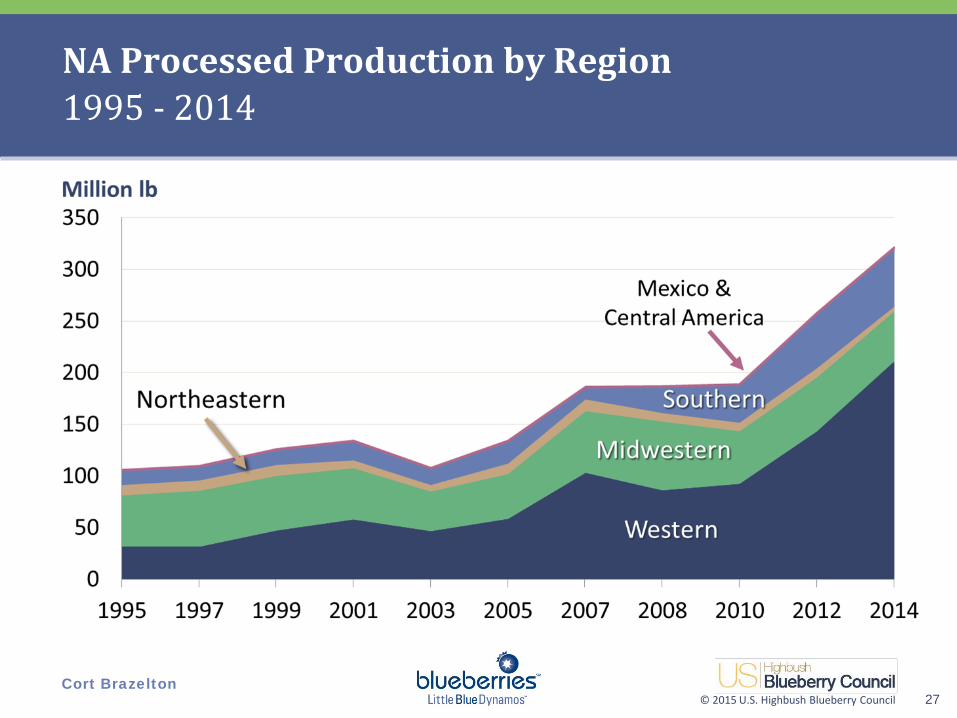
NA Processed Production by Region 1995 - 2014
27

© 2015 U.S. Highbush Blueberry Council Cort Brazelton
New Product Introductions Using Blueberries by Category - North America
28
Source: USHBC & Mintel Global New Product Database (GNPD)
© 2015 U.S. Highbush Blueberry Council Cort Brazelton
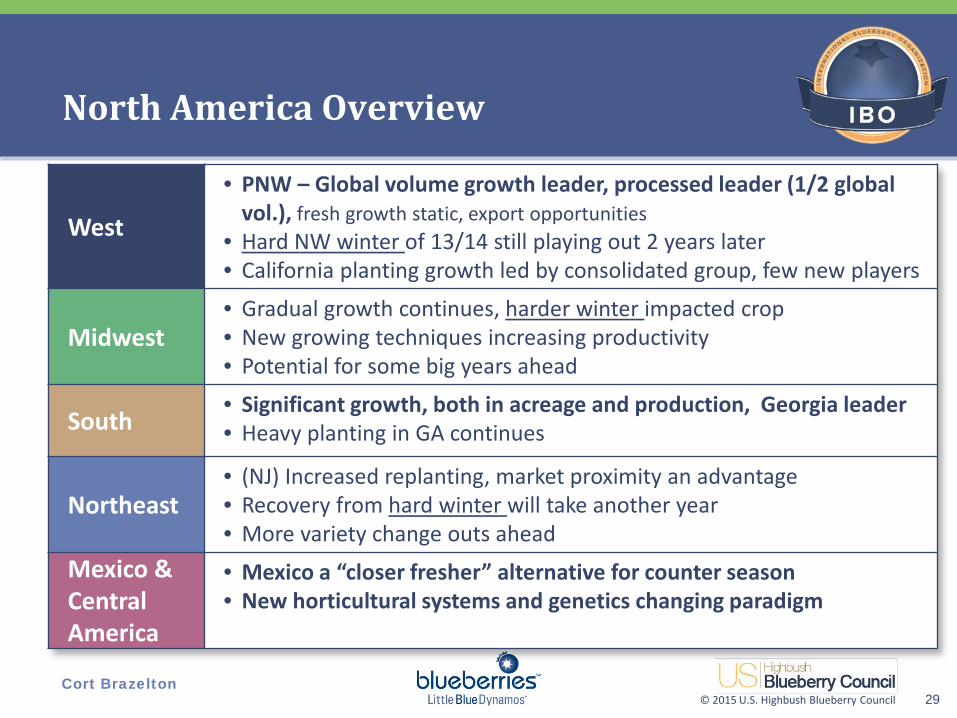
North America Overview
29
West
• PNW – Global volume growth leader, processed leader (1/2 global vol.), fresh growth static, export opportunities
• Hard NW winter of 13/14 still playing out 2 years later • California planting growth led by consolidated group, few new players
Midwest • Gradual growth continues, harder winter impacted crop • New growing techniques increasing productivity • Potential for some big years ahead
South • Significant growth, both in acreage and production, Georgia leader • Heavy planting in GA continues
Northeast • (NJ) Increased replanting, market proximity an advantage • Recovery from hard winter will take another year • More variety change outs ahead
Mexico & Central America
• Mexico a “closer fresher” alternative for counter season • New horticultural systems and genetics changing paradigm

© 2015 U.S. Highbush Blueberry Council Cort Brazelton
North America Overview
30
Domestic Market • 13%+ annual market growth continues
Export Markets • Greatest opportunity for US industry, esp. Pacific Rim (China)
Process • Gradual growth • Entering 3rd year of stable pricing • A-grade scarce
Economics, Policy, Technology
• Labor remains concern long term • Considerable interest in machine harvest for fresh • New varieties and management system beginning to impact
costs vs. returns in some regions
North America - General
• 100 Years of Blueberries! • Competitive advantages for operations of scale • Rapid planting growth can lead to underperformance • Consolidation in some areas • Arrival of Private Investor Capital • Young acres concentrated in West and SE

© 2015 U.S. Highbush Blueberry Council Cort Brazelton
South America
31

© 2015 U.S. Highbush Blueberry Council Cort Brazelton
2013/14 South American Highbush Production
32
119 m lbs. ~
FR PR Total FR PR Total FR PR Total
Chile 109.5 14.0 123.5 154.5 65.9 220.4 163.1 60.1 223.2
Argentina 24.6 2.0 26.6 31.3 14.2 45.5 27.7 6.3 34.0
Uruguay 2.7 0.3 3.0 4.2 1.8 5.9 4.0 1.5 5.5
Peru 0.0 0.0 0.0 0.1 0.0 0.1 4.5 0.1 4.6
Brazil 0.2 0.0 0.2 0.4 0.0 0.4 0.5 0.0 0.5
Colombia 0.0 0.0 0.0 0.0 0.0 0.0 0.2 0.0 0.2
TOTAL 137.1 16.3 153.4 190.5 81.8 272.4 200.0 68.0 268.0
2010 Million Lbs. 2012 Million Lbs. 2014 Million Lbs.
© 2015 U.S. Highbush Blueberry Council Cort Brazelton
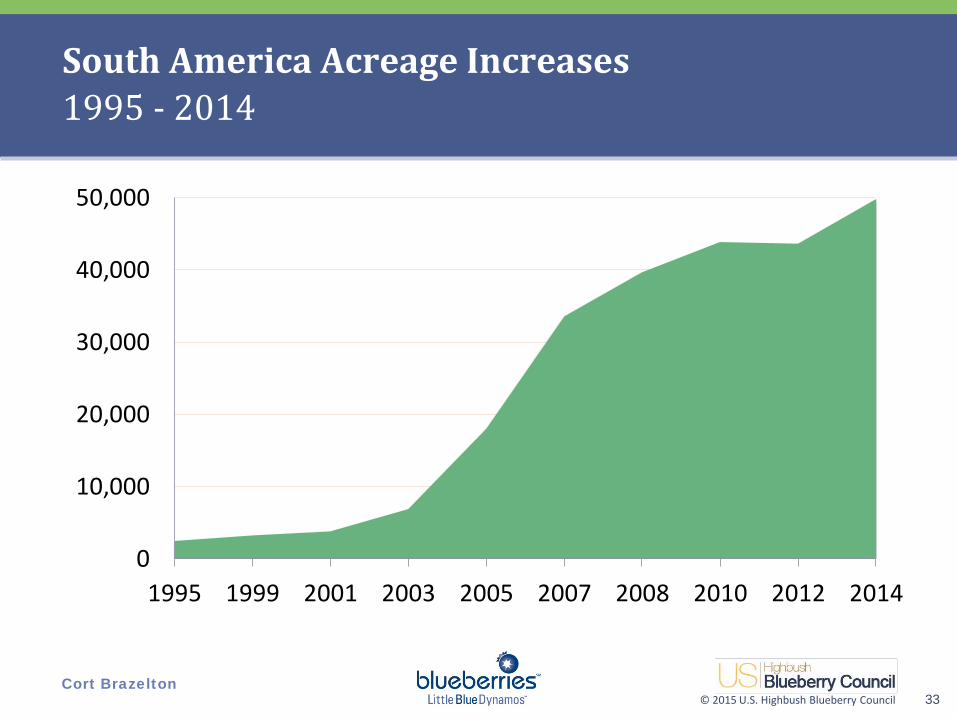
South America Acreage Increases 1995 - 2014
33
0
10,000
20,000
30,000
40,000
50,000
1995 1999 2001 2003 2005 2007 2008 2010 2012 2014

© 2015 U.S. Highbush Blueberry Council Cort Brazelton
2013/14 South American Highbush Acreage Growth
34
FR PR Total FR PR Total
Chile 22,700 26,908 32,250 33,960 38,430 154.5 65.9 220.4 163.1 60.1 223.2
Argentina 9,400 10,900 9,500 7,410 7,420 31.3 14.2 45.5 27.7 6.3 34.0
Uruguay 1,450 1,620 1,850 1,105 910 4.2 1.8 5.9 4.0 1.5 5.5
Peru 40 60 80 780 2,650 0.1 0.0 0.1 4.5 0.1 4.6
Brazil 50 200 250 350 400 0.4 0.0 0.4 0.5 0.0 0.5
Colombia 10 15 20 35 50 0.0 0.0 0.0 0.2 0.0 0.2
TOTAL 33,650 39,703 43,950 43,640 49,860 190.5 81.8 272.4 200.0 68.0 268.0
2014 Million Lbs.2012 Million Lbs.2007 Acres
2008 Acres
11/12 Acres
09/10 Acres
13/14 Acres
© 2015 U.S. Highbush Blueberry Council Cort Brazelton
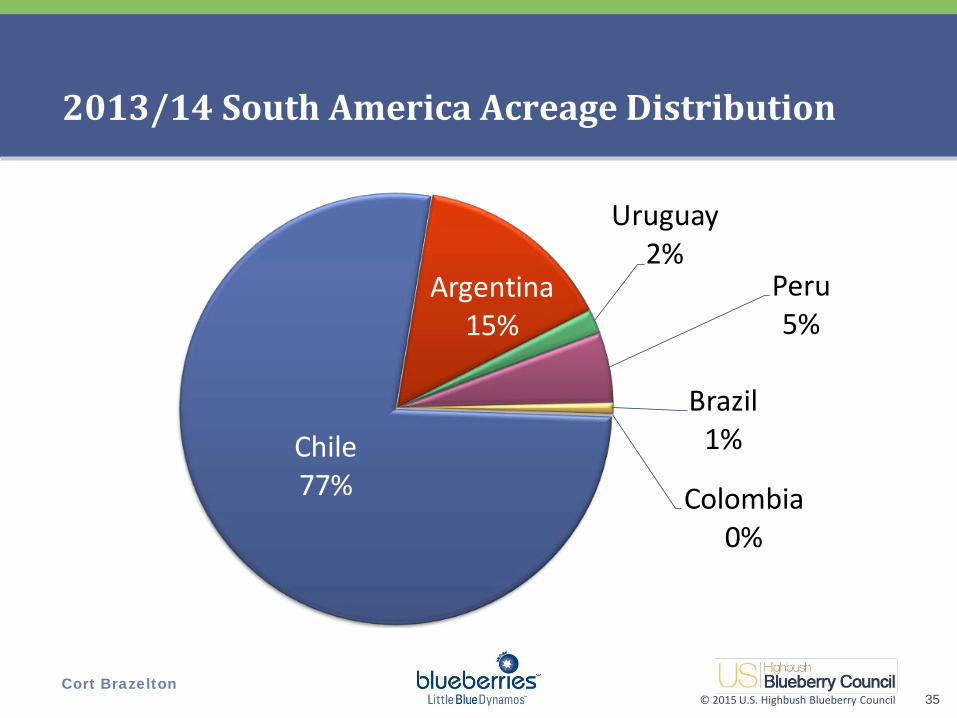
2013/14 South America Acreage Distribution
35
Chile77%
Argentina15%
Uruguay2%
Peru5%
Brazil1%
Colombia0%
© 2015 U.S. Highbush Blueberry Council Cort Brazelton
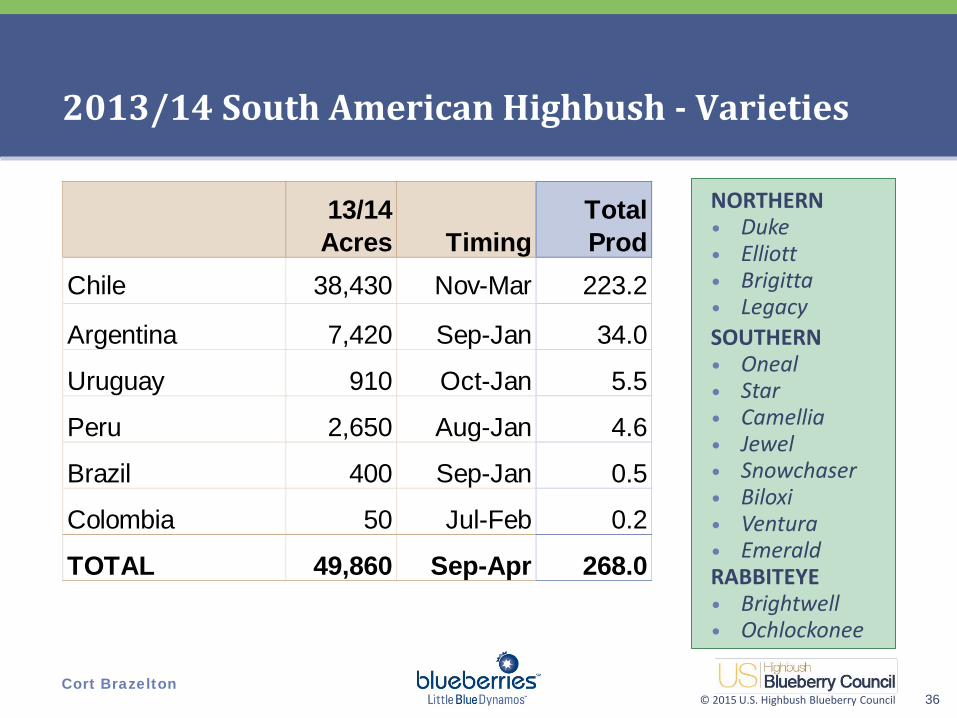
2013/14 South American Highbush - Varieties
36
NORTHERN • Duke • Elliott • Brigitta • Legacy SOUTHERN • Oneal • Star • Camellia • Jewel • Snowchaser • Biloxi • Ventura • Emerald RABBITEYE • Brightwell • Ochlockonee
Chile 38,430 Nov-Mar 223.2
Argentina 7,420 Sep-Jan 34.0
Uruguay 910 Oct-Jan 5.5
Peru 2,650 Aug-Jan 4.6
Brazil 400 Sep-Jan 0.5
Colombia 50 Jul-Feb 0.2
TOTAL 49,860 Sep-Apr 268.0
13/14 Acres Timing
Total Prod
© 2015 U.S. Highbush Blueberry Council Cort Brazelton
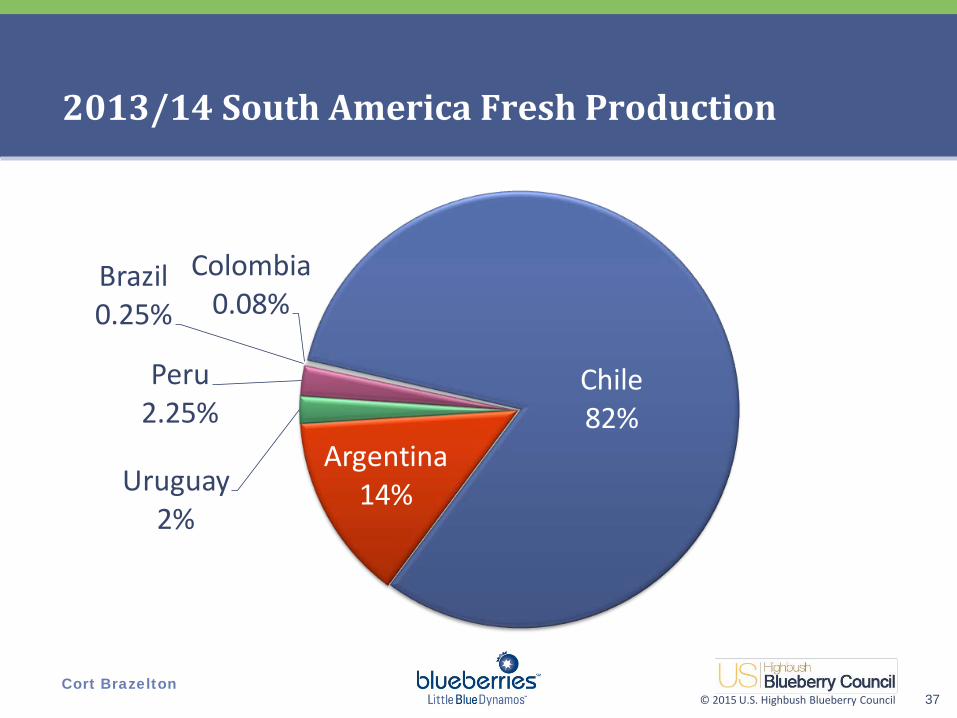
2013/14 South America Fresh Production
37
Chile82%
Argentina14%Uruguay
2%
Peru2.25%
Brazil0.25%
Colombia0.08%

© 2015 U.S. Highbush Blueberry Council Cort Brazelton
2013/14 South America Processed Production
38
Chile89%
Argentina9%
Uruguay2.2%
Peru0.15%

© 2015 U.S. Highbush Blueberry Council Cort Brazelton
New Product Introductions Using Blueberries – Latin America
39
Source: USHBC & Mintel Global New Product Database (GNPD)
© 2015 U.S. Highbush Blueberry Council Cort Brazelton
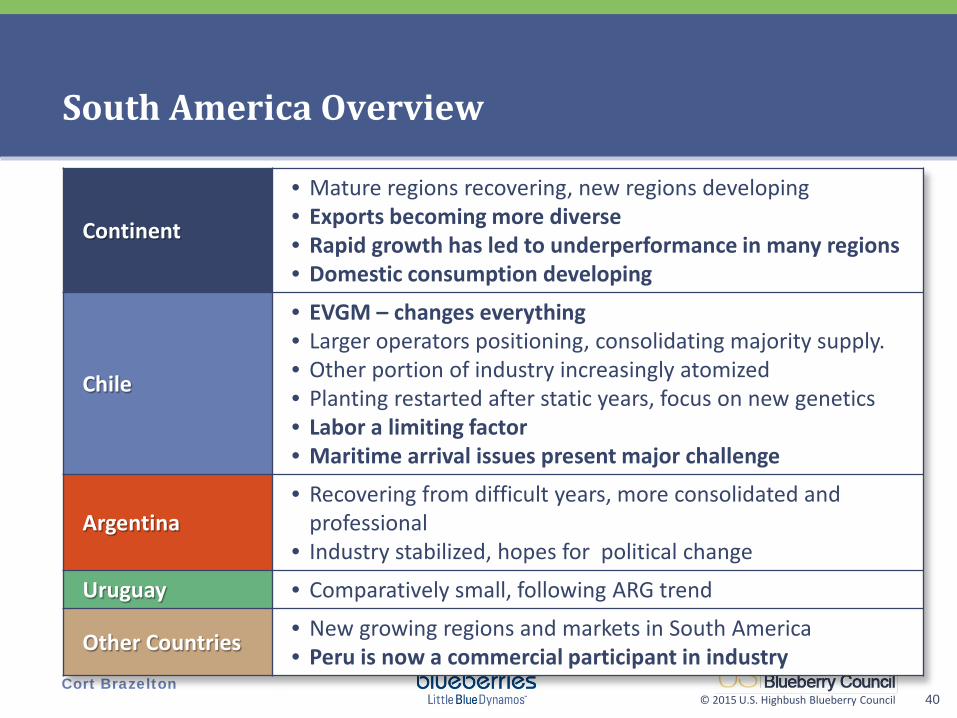
South America Overview
40
Continent
• Mature regions recovering, new regions developing • Exports becoming more diverse • Rapid growth has led to underperformance in many regions • Domestic consumption developing
Chile
• EVGM – changes everything • Larger operators positioning, consolidating majority supply. • Other portion of industry increasingly atomized • Planting restarted after static years, focus on new genetics • Labor a limiting factor • Maritime arrival issues present major challenge
Argentina • Recovering from difficult years, more consolidated and
professional • Industry stabilized, hopes for political change
Uruguay • Comparatively small, following ARG trend
Other Countries • New growing regions and markets in South America • Peru is now a commercial participant in industry

© 2015 U.S. Highbush Blueberry Council Cort Brazelton
Europe
41
© 2015 U.S. Highbush Blueberry Council Cort Brazelton
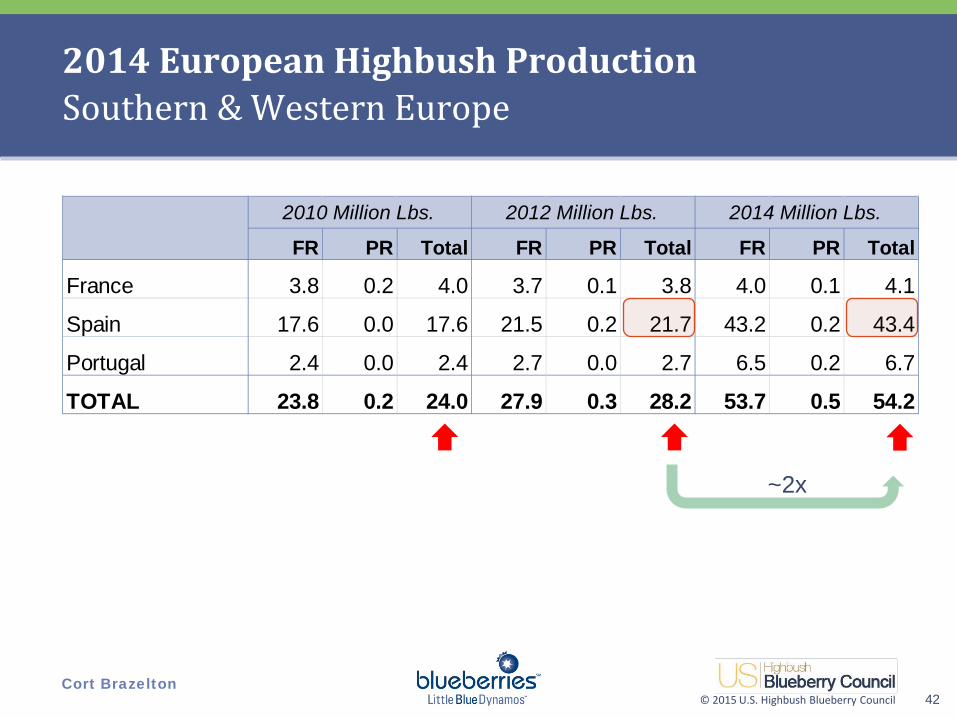
FR PR Total FR PR Total FR PR Total
France 3.8 0.2 4.0 3.7 0.1 3.8 4.0 0.1 4.1
Spain 17.6 0.0 17.6 21.5 0.2 21.7 43.2 0.2 43.4
Portugal 2.4 0.0 2.4 2.7 0.0 2.7 6.5 0.2 6.7
TOTAL 23.8 0.2 24.0 27.9 0.3 28.2 53.7 0.5 54.2
2010 Million Lbs. 2012 Million Lbs. 2014 Million Lbs.
2014 European Highbush Production Southern & Western Europe
42
~2x
© 2015 U.S. Highbush Blueberry Council Cort Brazelton
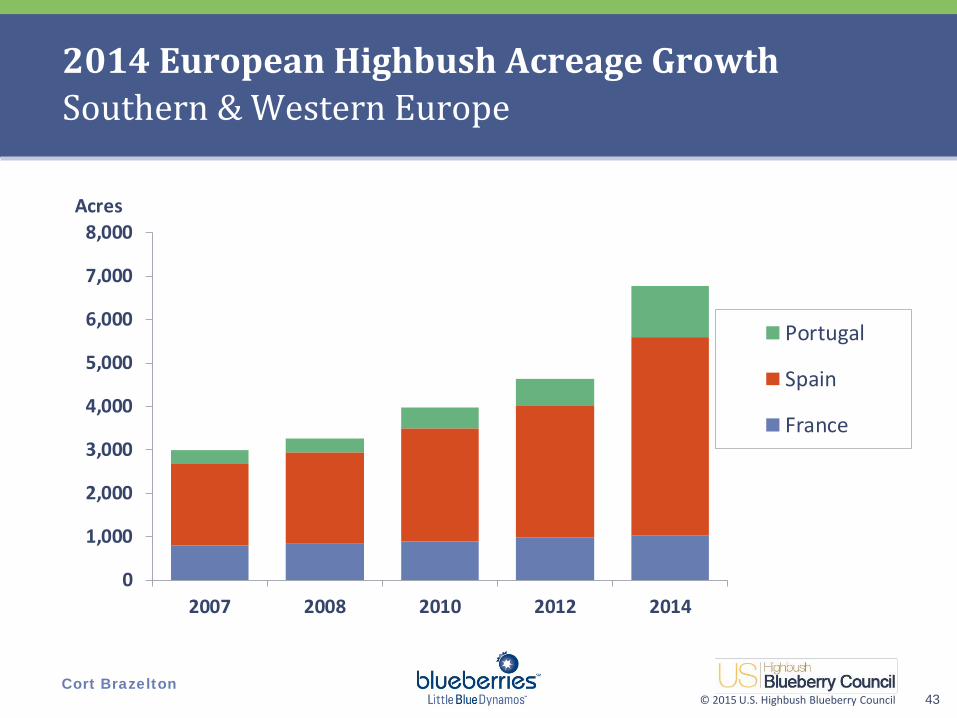
2014 European Highbush Acreage Growth Southern & Western Europe
43
0
1,000
2,000
3,000
4,000
5,000
6,000
7,000
8,000
2007 2008 2010 2012 2014
Portugal
Spain
France
Acres
© 2015 U.S. Highbush Blueberry Council Cort Brazelton
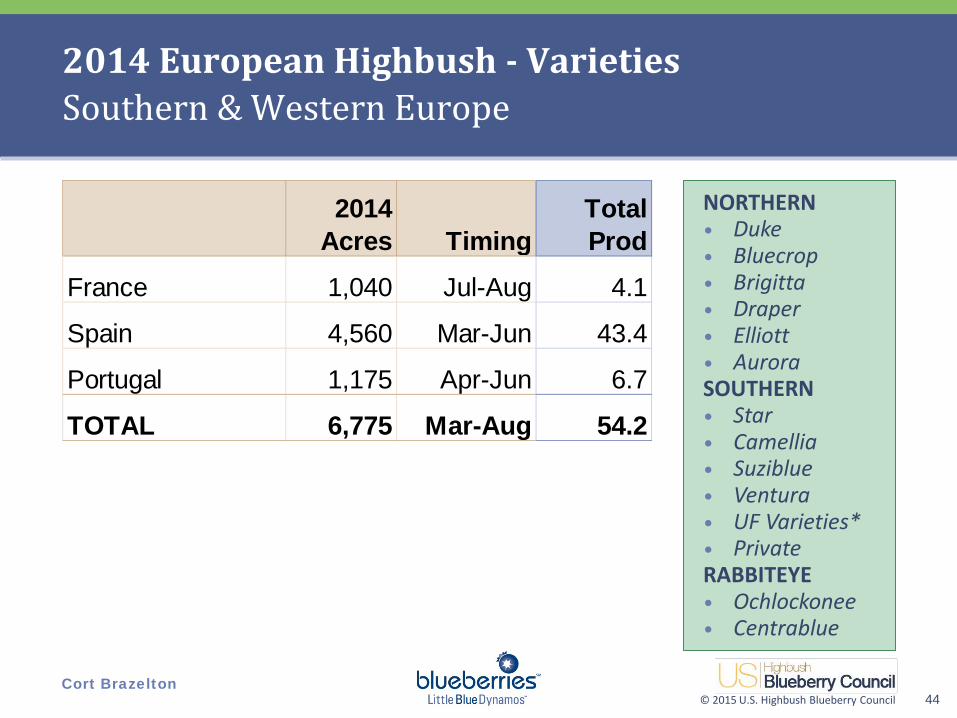
2014 European Highbush - Varieties Southern & Western Europe
44
NORTHERN • Duke • Bluecrop • Brigitta • Draper • Elliott • Aurora SOUTHERN • Star • Camellia • Suziblue • Ventura • UF Varieties* • Private RABBITEYE • Ochlockonee • Centrablue
France 1,040 Jul-Aug 4.1
Spain 4,560 Mar-Jun 43.4
Portugal 1,175 Apr-Jun 6.7
TOTAL 6,775 Mar-Aug 54.2
2014 Acres Timing
Total Prod
© 2015 U.S. Highbush Blueberry Council Cort Brazelton
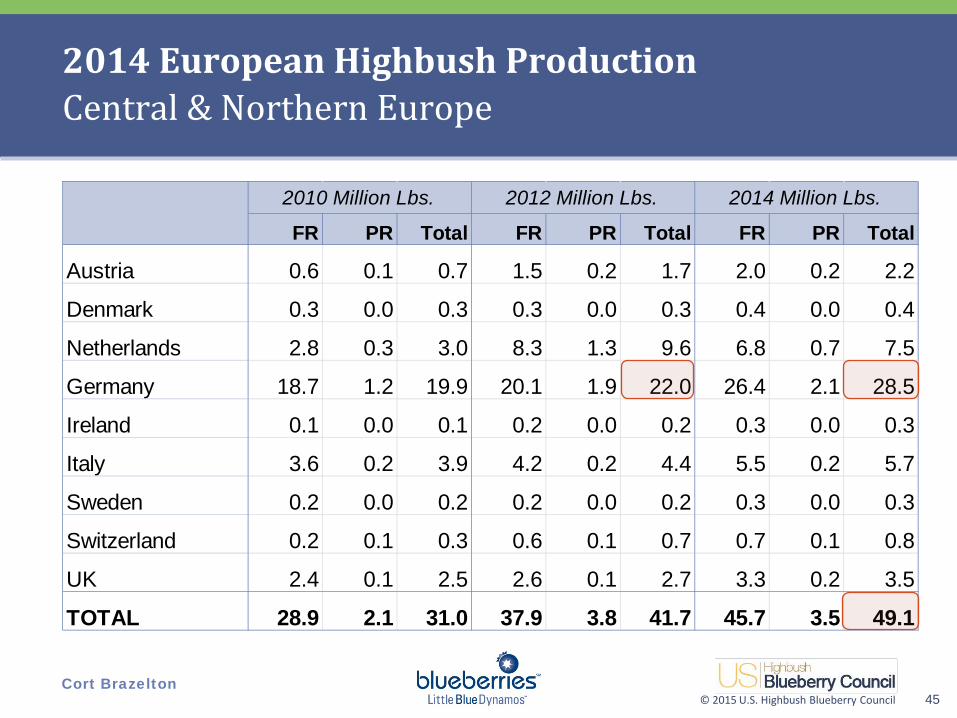
FR PR Total FR PR Total FR PR Total
Austria 0.6 0.1 0.7 1.5 0.2 1.7 2.0 0.2 2.2
Denmark 0.3 0.0 0.3 0.3 0.0 0.3 0.4 0.0 0.4
Netherlands 2.8 0.3 3.0 8.3 1.3 9.6 6.8 0.7 7.5
Germany 18.7 1.2 19.9 20.1 1.9 22.0 26.4 2.1 28.5
Ireland 0.1 0.0 0.1 0.2 0.0 0.2 0.3 0.0 0.3
Italy 3.6 0.2 3.9 4.2 0.2 4.4 5.5 0.2 5.7
Sweden 0.2 0.0 0.2 0.2 0.0 0.2 0.3 0.0 0.3
Switzerland 0.2 0.1 0.3 0.6 0.1 0.7 0.7 0.1 0.8
UK 2.4 0.1 2.5 2.6 0.1 2.7 3.3 0.2 3.5
TOTAL 28.9 2.1 31.0 37.9 3.8 41.7 45.7 3.5 49.1
2010 Million Lbs. 2012 Million Lbs. 2014 Million Lbs.
2014 European Highbush Production Central & Northern Europe
45

© 2015 U.S. Highbush Blueberry Council Cort Brazelton
2014 European Highbush Acreage Growth Central & Northern Europe
46
0
2,000
4,000
6,000
8,000
10,000
12,000
2007 2008 2010 2012 2014
UK
Switzerland
Sweden
Italy
Ireland
Germany
Netherlands
Denmark
Austria
Acres

© 2015 U.S. Highbush Blueberry Council Cort Brazelton
2014 European Highbush - Varieties Central & Northern Europe
47
NORTHERN • Duke • Bluecrop • Draper • Elliott • Brigitta • Aurora
Austria 215 Jul-Aug 2.2
Denmark 75 Jul-Sep 0.4
Netherlands 1,750 Jun-Sep 7.5
Germany 5,790 Jul-Sep 28.5
Ireland 55 Jul-Sep 0.3
Italy 1,180 Jun-Aug 5.7
Sweden 110 Aug-Sep 0.3
Switzerland 140 Jul-Sep 0.8
UK 950 Jul-Sep 3.5
TOTAL 10,265 Jun-Sep 49.1
2014 Acres Timing
Total Prod
© 2015 U.S. Highbush Blueberry Council Cort Brazelton
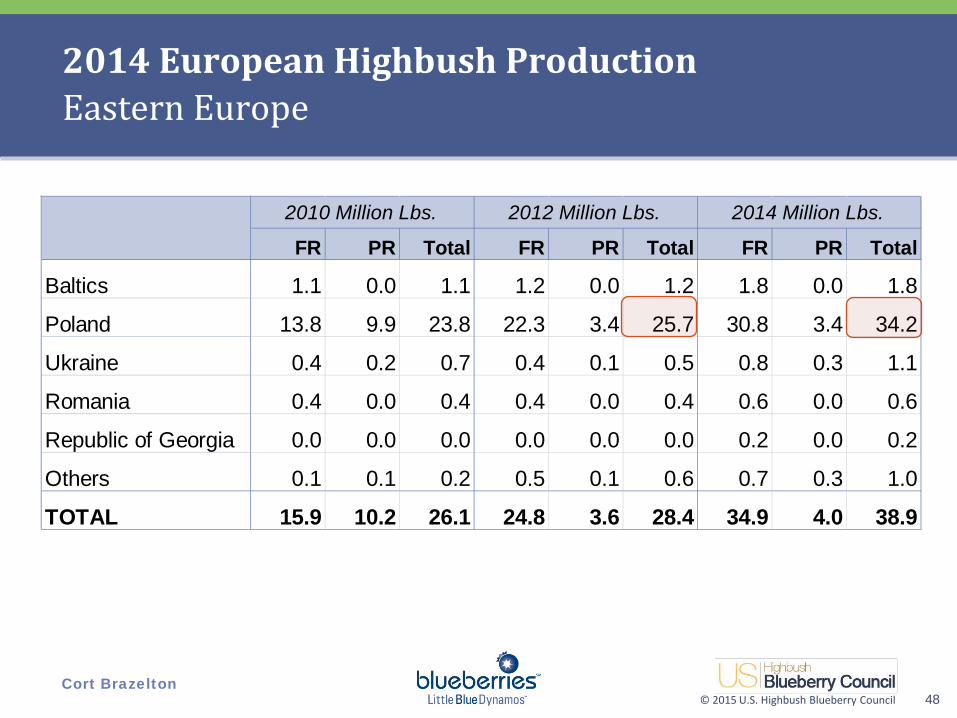
FR PR Total FR PR Total FR PR Total
Baltics 1.1 0.0 1.1 1.2 0.0 1.2 1.8 0.0 1.8
Poland 13.8 9.9 23.8 22.3 3.4 25.7 30.8 3.4 34.2
Ukraine 0.4 0.2 0.7 0.4 0.1 0.5 0.8 0.3 1.1
Romania 0.4 0.0 0.4 0.4 0.0 0.4 0.6 0.0 0.6
Republic of Georgia 0.0 0.0 0.0 0.0 0.0 0.0 0.2 0.0 0.2
Others 0.1 0.1 0.2 0.5 0.1 0.6 0.7 0.3 1.0
TOTAL 15.9 10.2 26.1 24.8 3.6 28.4 34.9 4.0 38.9
2010 Million Lbs. 2012 Million Lbs. 2014 Million Lbs.
2014 European Highbush Production Eastern Europe
48
© 2015 U.S. Highbush Blueberry Council Cort Brazelton
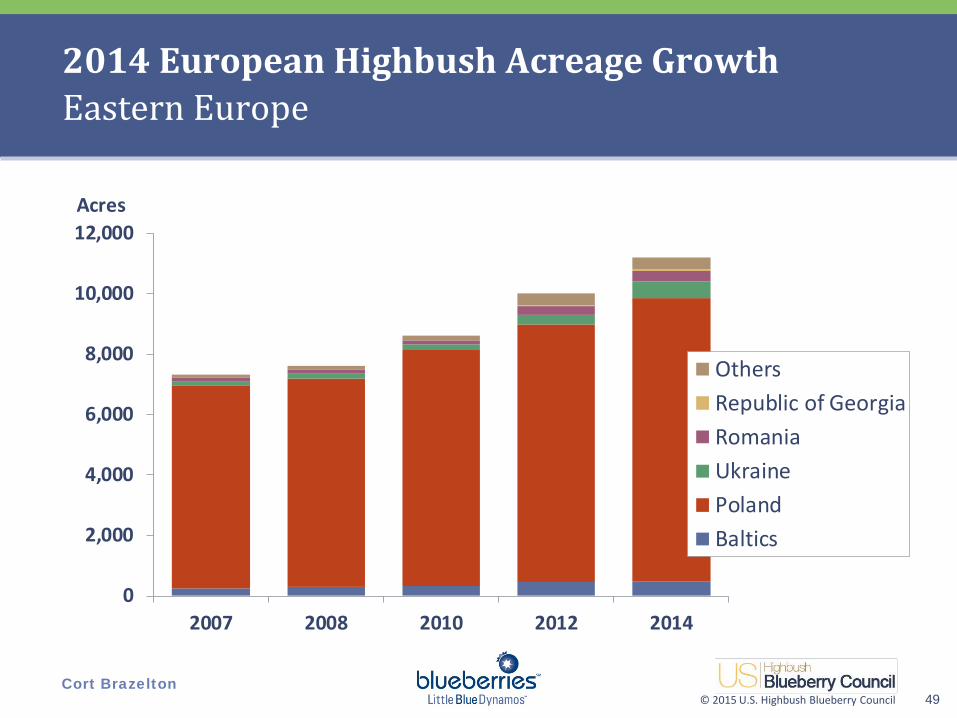
2014 European Highbush Acreage Growth Eastern Europe
49
0
2,000
4,000
6,000
8,000
10,000
12,000
2007 2008 2010 2012 2014
OthersRepublic of GeorgiaRomaniaUkrainePolandBaltics
Acres
© 2015 U.S. Highbush Blueberry Council Cort Brazelton
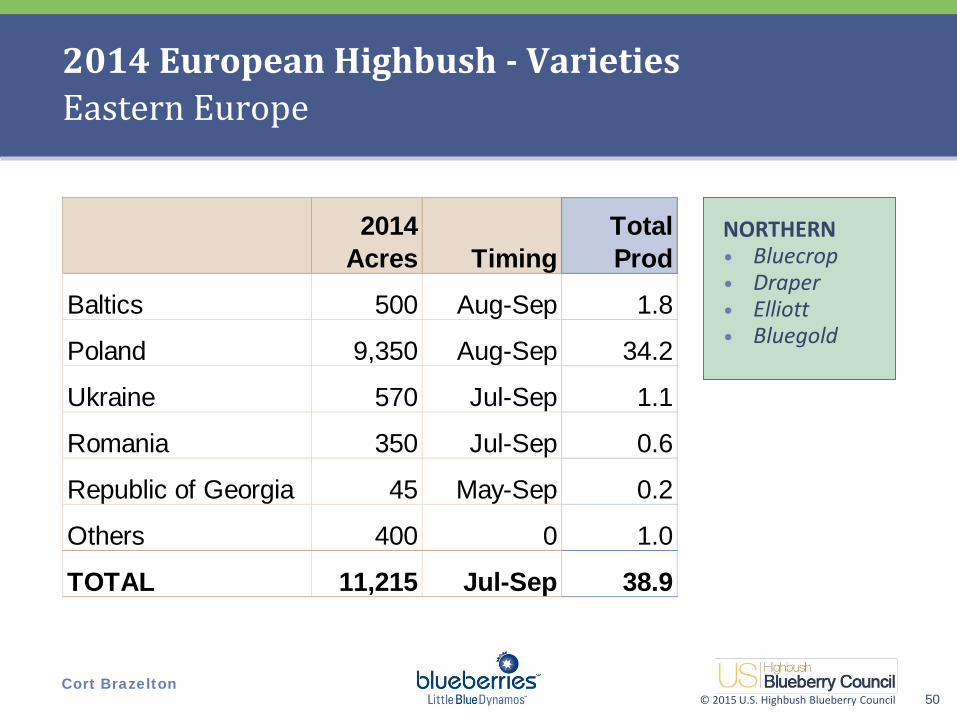
2014 European Highbush - Varieties Eastern Europe
50
NORTHERN • Bluecrop • Draper • Elliott • Bluegold
Baltics 500 Aug-Sep 1.8
Poland 9,350 Aug-Sep 34.2
Ukraine 570 Jul-Sep 1.1
Romania 350 Jul-Sep 0.6
Republic of Georgia 45 May-Sep 0.2
Others 400 0 1.0
TOTAL 11,215 Jul-Sep 38.9
2014 Acres Timing
Total Prod
© 2015 U.S. Highbush Blueberry Council Cort Brazelton
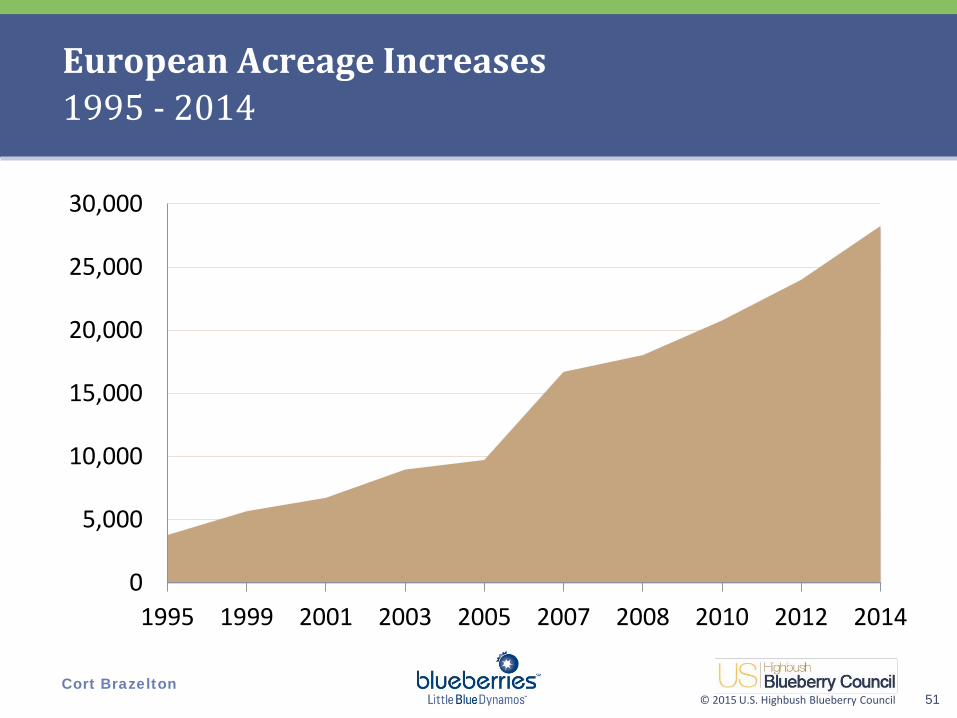
European Acreage Increases 1995 - 2014
51
0
5,000
10,000
15,000
20,000
25,000
30,000
1995 1999 2001 2003 2005 2007 2008 2010 2012 2014
© 2015 U.S. Highbush Blueberry Council Cort Brazelton
2014 European Highbush Acreage Growth
52
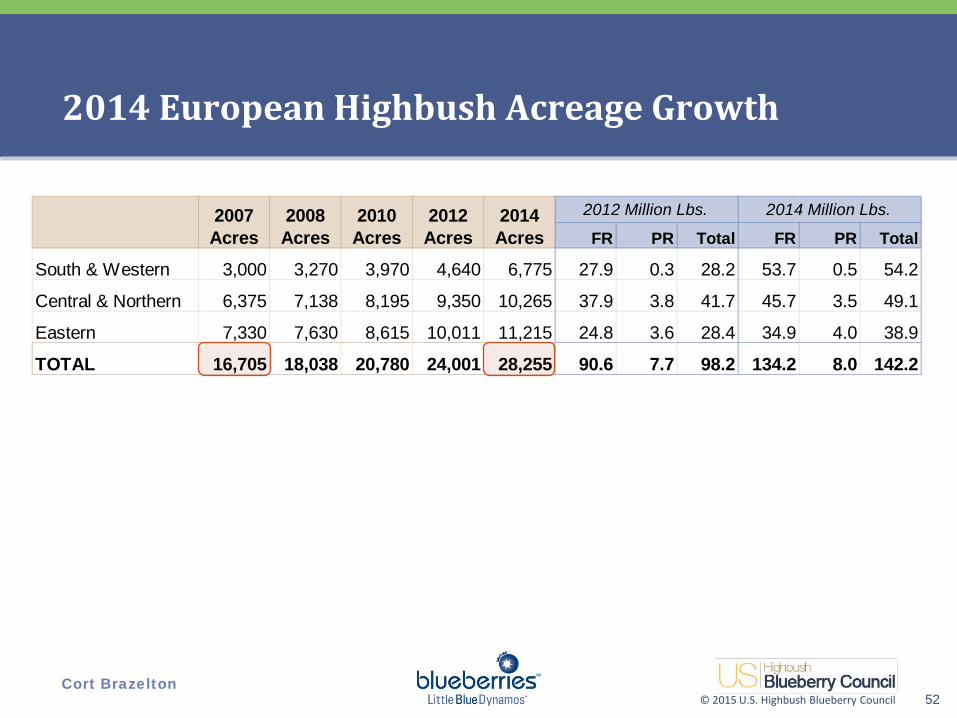
FR PR Total FR PR Total
South & Western 3,000 3,270 3,970 4,640 6,775 27.9 0.3 28.2 53.7 0.5 54.2
Central & Northern 6,375 7,138 8,195 9,350 10,265 37.9 3.8 41.7 45.7 3.5 49.1
Eastern 7,330 7,630 8,615 10,011 11,215 24.8 3.6 28.4 34.9 4.0 38.9
TOTAL 16,705 18,038 20,780 24,001 28,255 90.6 7.7 98.2 134.2 8.0 142.2
2012 Million Lbs.2010 Acres
2014 Acres
2014 Million Lbs.2007 Acres
2008 Acres
2012 Acres
© 2015 U.S. Highbush Blueberry Council Cort Brazelton
2014 European Highbush Acreage Growth
53
0
5,000
10,000
15,000
20,000
25,000
30,000
2007 2008 2010 2012 2014
EasternCentral & NorthernSouth & Western
Acres
© 2015 U.S. Highbush Blueberry Council Cort Brazelton
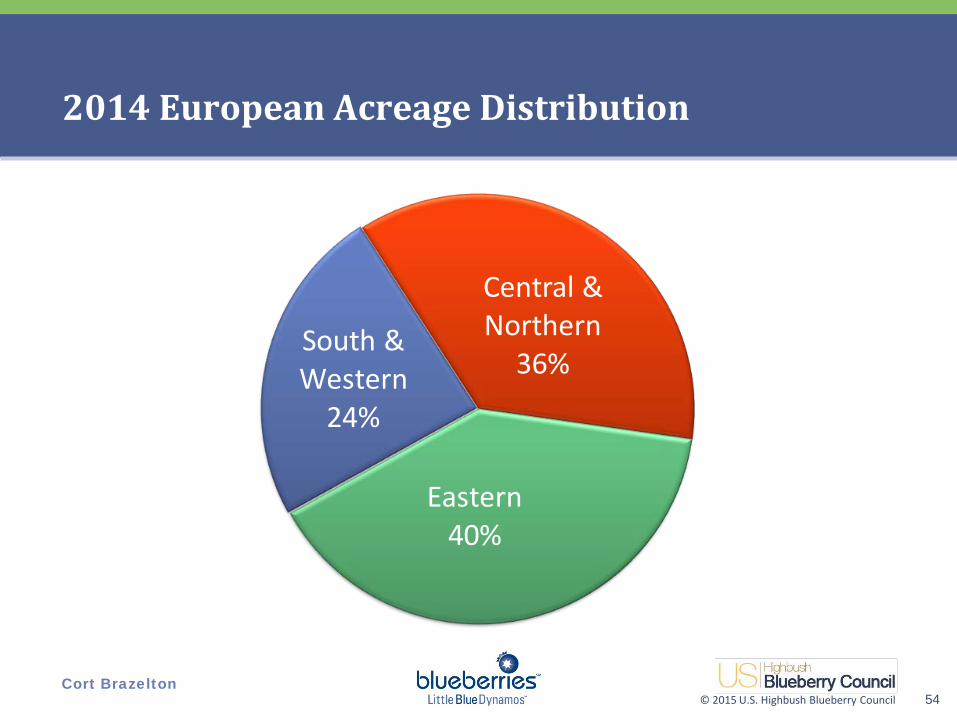
2014 European Acreage Distribution
54
South & Western
24%
Central & Northern
36%
Eastern40%

© 2015 U.S. Highbush Blueberry Council Cort Brazelton
2014 Europe Fresh Production
55
South & Western
40%
Central & Northern
34%
Eastern26%
© 2015 U.S. Highbush Blueberry Council Cort Brazelton
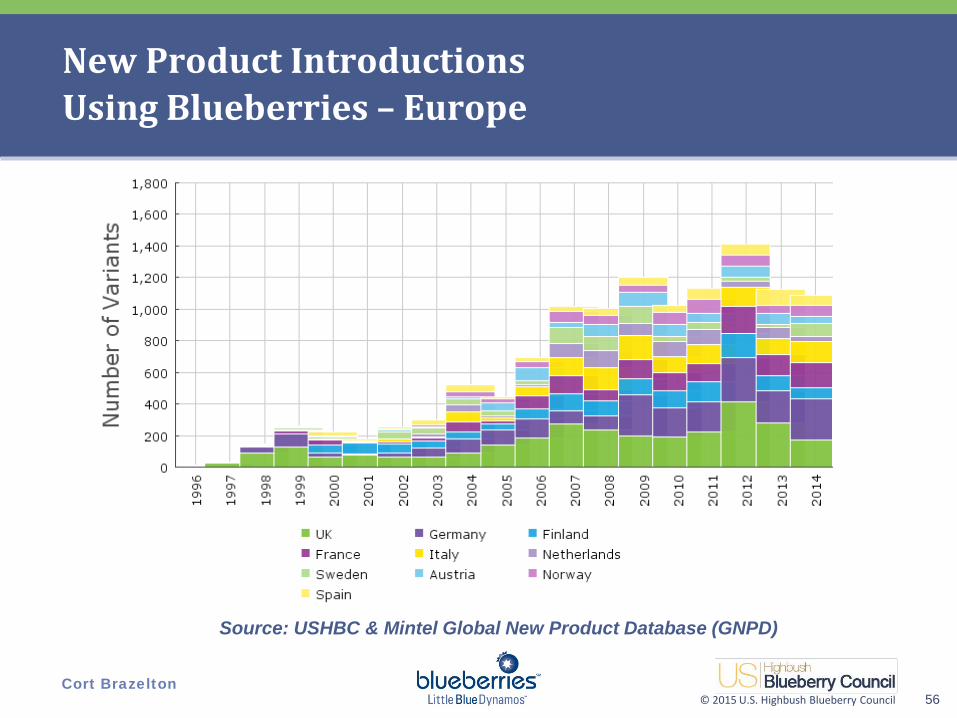
New Product Introductions Using Blueberries – Europe
56
Source: USHBC & Mintel Global New Product Database (GNPD)

© 2015 U.S. Highbush Blueberry Council Cort Brazelton
European Overview
57
Europe • Market growth exceeds 25% led by Netherlands, Nordics, Germany, Austria, Switzerland
• UK growth still strong • Health awareness growing • Production expansion driven by increased consumption,
increased use of berry category at retail • Quality + Value drives the market • Fresh focused
South & Western
• Spain leads Europe in growth • Spring is large and more consolidated than summer deal • France, “the arbiter of quality” still slow but growing
C. & Northern • Growth throughout the north serving local demand
Eastern • Polish growth more gradual • Poland is an important growth market • Eastern growth continues • Geopolitics disrupting sales growth to Russia

© 2015 U.S. Highbush Blueberry Council Cort Brazelton
Mediterranean & North Africa
58

© 2015 U.S. Highbush Blueberry Council Cort Brazelton
2014 Mediterranean & North Africa Highbush Production
59
FR PR Total FR PR Total FR PR Total
Morocco 1.8 0.0 1.8 4.9 0.0 4.9 14.2 0.5 14.7
Egypt 0.1 0.0 0.1 0.1 0.0 0.1 0.1 0.0 0.1
Turkey 0.1 0.0 0.1 0.4 0.1 0.5 0.6 0.2 0.8
Israel 0.1 0.0 0.1 0.1 0.0 0.1 0.1 0.0 0.1
Tunisia 0.0 0.0 0.0 0.0 0.0 0.0 0.1 0.0 0.1
Others 0.1 0.0 0.1 0.0 0.0 0.0 0.0 0.0 0.0
TOTAL 2.2 0.0 2.2 5.4 0.1 5.5 14.9 0.7 15.7
2010 Million Lbs. 2012 Million Lbs. 2014 Million Lbs.
© 2015 U.S. Highbush Blueberry Council Cort Brazelton
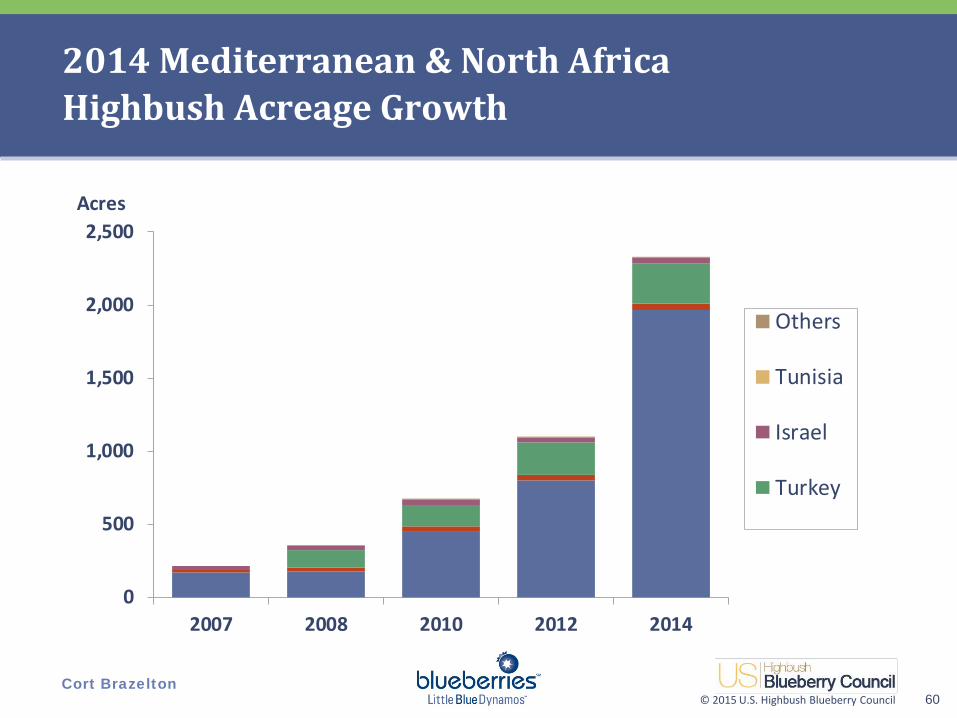
2014 Mediterranean & North Africa Highbush Acreage Growth
60
0
500
1,000
1,500
2,000
2,500
2007 2008 2010 2012 2014
Others
Tunisia
Israel
Turkey
Acres
© 2015 U.S. Highbush Blueberry Council Cort Brazelton
2014 Mediterranean & North Africa Highbush Acreage Growth
61
FR PR Total FR PR Total
Morocco 170 180 450 800 1,970 4.9 0.0 4.9 14.2 0.5 14.7
Egypt 20 25 35 40 40 0.1 0.0 0.1 0.1 0.0 0.1
Turkey 0 120 150 220 280 0.4 0.1 0.5 0.6 0.2 0.8
Israel 25 30 35 35 35 0.1 0.0 0.1 0.1 0.0 0.1
Tunisia 0 0 0 2 2 0.0 0.0 0.0 0.1 0.0 0.1
Others 0 0 2 1 2 0.0 0.0 0.0 0.0 0.0 0.0
TOTAL 215 355 672 1,098 2,329 5.4 0.1 5.5 14.9 0.7 15.7
2012 Million Lbs.2010 Acres
2014 Million Lbs.2014 Acres
2007 Acres
2008 Acres
2012 Acres

© 2015 U.S. Highbush Blueberry Council Cort Brazelton
2014 Mediterranean & North Africa Highbush - Varieties
62
NORTHERN • Chandler • Bluecrop • Patriot • Bluegold SOUTHERN • Star • Biloxi • Sharpblue • Ventura • UF varieties • Private
Morocco 1,970 Feb-Jun 14.68
Egypt 40 Feb-Jun 0.05
Turkey 280 Mar-Sep 0.75
Israel 35 Mar-Jun? 0.10
Tunisia 2 Feb-May 0.05
Others 2 0 0.02
TOTAL 2,329 Feb-Jun 15.65
2014 Acres Timing
TotalProd

© 2015 U.S. Highbush Blueberry Council Cort Brazelton
New Product Introductions Using Blueberries – Middle East & North Africa
63
Source: USHBC & Mintel Global New Product Database (GNPD)
© 2015 U.S. Highbush Blueberry Council Cort Brazelton
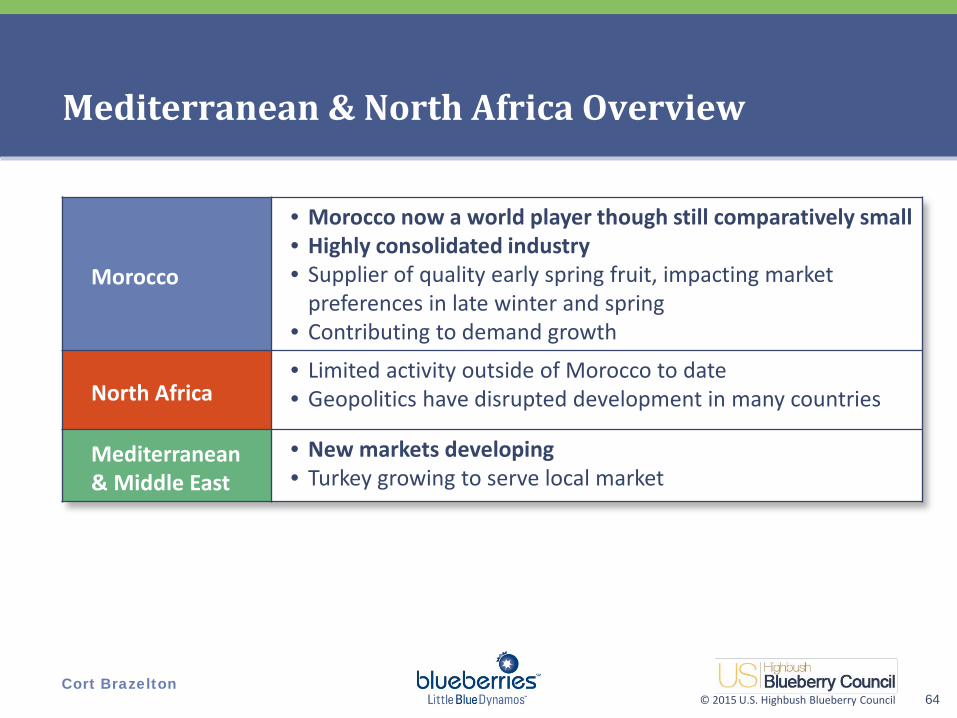
Mediterranean & North Africa Overview
64
Morocco
• Morocco now a world player though still comparatively small • Highly consolidated industry • Supplier of quality early spring fruit, impacting market
preferences in late winter and spring • Contributing to demand growth
North Africa • Limited activity outside of Morocco to date • Geopolitics have disrupted development in many countries
Mediterranean & Middle East
• New markets developing • Turkey growing to serve local market

© 2015 U.S. Highbush Blueberry Council Cort Brazelton
Southern Africa
65

© 2015 U.S. Highbush Blueberry Council Cort Brazelton
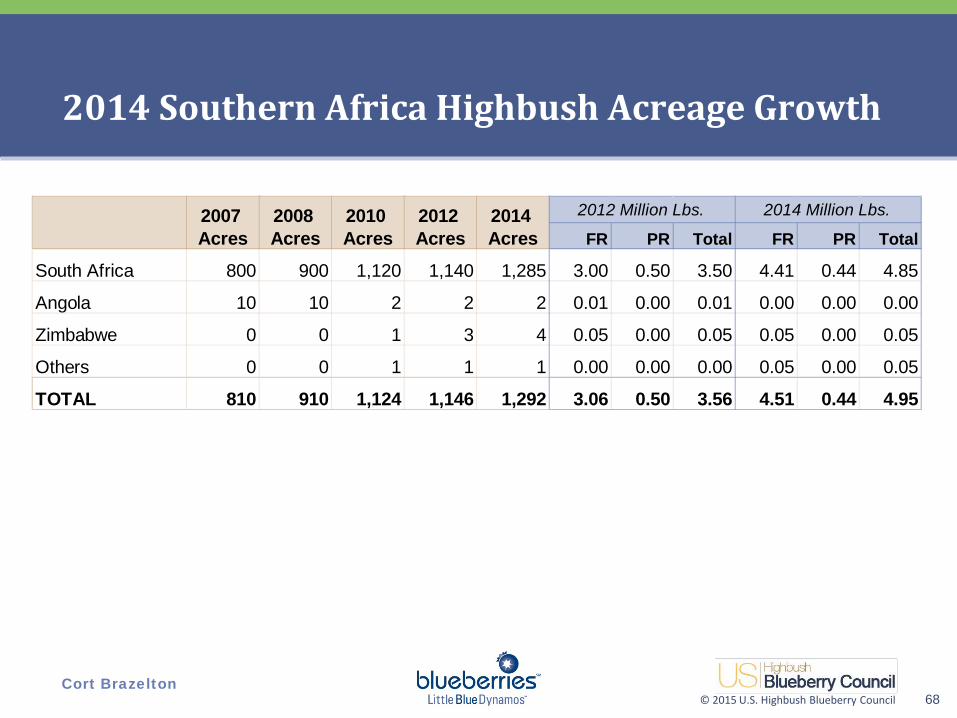
2014 Southern Africa Highbush Production
66
FR PR Total FR PR Total FR PR Total
South Africa 2.10 0.20 2.30 3.00 0.50 3.50 4.41 0.44 4.85
Angola 0.00 0.00 0.00 0.01 0.00 0.01 0.00 0.00 0.00
Zimbabwe 0.00 0.00 0.00 0.05 0.00 0.05 0.05 0.00 0.05
Others 0.00 0.00 0.00 0.00 0.00 0.00 0.05 0.00 0.05
TOTAL 2.10 0.20 2.30 3.06 0.50 3.56 4.51 0.44 4.95
2010 Million Lbs. 2012 Million Lbs. 2014 Million Lbs.

© 2015 U.S. Highbush Blueberry Council Cort Brazelton
2014 Southern Africa Highbush Acreage Growth
67
0
200
400
600
800
1,000
1,200
1,400
2007 2008 2010 2012 2014
OthersZimbabweAngolaSouth Africa
Acres
© 2015 U.S. Highbush Blueberry Council Cort Brazelton
2014 Southern Africa Highbush Acreage Growth
68
FR PR Total FR PR Total
South Africa 800 900 1,120 1,140 1,285 3.00 0.50 3.50 4.41 0.44 4.85
Angola 10 10 2 2 2 0.01 0.00 0.01 0.00 0.00 0.00
Zimbabwe 0 0 1 3 4 0.05 0.00 0.05 0.05 0.00 0.05
Others 0 0 1 1 1 0.00 0.00 0.00 0.05 0.00 0.05
TOTAL 810 910 1,124 1,146 1,292 3.06 0.50 3.56 4.51 0.44 4.95
2012 Million Lbs.2010 Acres
2014 Million Lbs.2014 Acres
2007 Acres
2008 Acres
2012 Acres

© 2015 U.S. Highbush Blueberry Council Cort Brazelton
2014 Southern Africa Highbush - Varieties
69
NORTHERN • Duke • Legacy • Chandler SOUTHERN • Emerald • Jewel • Star • Snowchaser • Ventura • Private RABBITEYE • Ochlockonee • Powerdblue
South Africa 1,285 Aug-Jan 4.85
Angola 2 Aug-Jan 0.00
Zimbabwe 4 Aug-Nov? 0.05
Others 1 0 0.05
TOTAL 1,292 Aug-Jan 4.95
2014 Acres Timing
Total Prod

© 2015 U.S. Highbush Blueberry Council Cort Brazelton
New Product Introductions Using Blueberries – Sub-Saharan Africa
70
Source: USHBC & Mintel Global New Product Database (GNPD)

© 2015 U.S. Highbush Blueberry Council Cort Brazelton
Southern Africa Overview
71
Republic of South Africa
• Positioning as quality counter-seasonal blueberry supplier to Europe, competing with other southern hemisphere suppliers
• Highly consolidated • Some barriers to rapid growth • Political & security concerns
Other Countries • Limited activity up to this point, mainly trials

© 2015 U.S. Highbush Blueberry Council Cort Brazelton
Asia & Pacific
72

© 2015 U.S. Highbush Blueberry Council Cort Brazelton
FR PR Total FR PR Total FR PR Total
China 3.0 3.6 6.6 18.0 7.0 25.0 35.3 8.8 44.1
India 0.2 0.0 0.2 0.3 0.0 0.3 0.0 0.0 0.0
Japan 4.9 0.2 5.1 5.4 1.2 6.6 7.2 1.6 8.8
South Korea 0.5 0.0 0.5 1.7 0.2 1.9 9.6 1.1 10.7
TOTAL 8.6 3.8 12.4 25.4 8.4 33.8 52.1 11.5 63.6
2010 Million Lbs. 2012 Million Lbs. 2014 Million Lbs.
2014 Asia & Pacific Highbush Production Asia
73

© 2015 U.S. Highbush Blueberry Council Cort Brazelton
2014 Asia & Pacific Highbush Acreage Growth Asia
74
0
5,000
10,000
15,000
20,000
25,000
30,000
35,000
40,000
45,000
50,000
2007 2008 2010 2012 2014
South KoreaJapanIndiaChina
Acres

© 2015 U.S. Highbush Blueberry Council Cort Brazelton
2014 Asia & Pacific Highbush Acreage Growth Asia
75
FR PR Total FR PR Total
China 3,275 2,900 8,645 29,800 36,700 18.0 7.0 25.0 35.3 8.8 44.1
India 0 60 80 105 135 0.3 0.0 0.3 0.0 0.0 0.0
Japan 1,300 2,090 2,230 2,970 3,220 5.4 1.2 6.6 7.2 1.6 8.8
South Korea 40 50 180 415 3,950 1.7 0.2 1.9 9.6 1.1 10.7
TOTAL 4,615 5,100 11,135 33,290 44,005 25.4 8.4 33.8 52.1 11.5 63.6
2012 Million Lbs.2010 Acres
2014 Million Lbs.2014 Acres
2007 Acres
2008 Acres
2012 Acres

© 2015 U.S. Highbush Blueberry Council Cort Brazelton
2014 Asia & Pacific Highbush - Varieties Asia
76
NORTHERN • Duke • Bluecrop • Northland • Elliott SOUTHERN • Misty • Sharpblue • Oneal • UF and UG
varieties in Japan
ANGUSTIFOLIUM & HALFHIGHS • Tophat • North Country • Blomindon • Northblue • St. Cloud RABBITEYE • Tifblue • Centurion • Beckyblue
China 36,700 May-Oct 44.1
India 135 Mar-Aug? 0.0
Japan 3,220 May-Aug 8.8
South Korea 3,950 Jun-Aug 10.7
TOTAL 44,005 May-Aug 63.6
2014 Acres Timing
Total Prod
© 2015 U.S. Highbush Blueberry Council Cort Brazelton
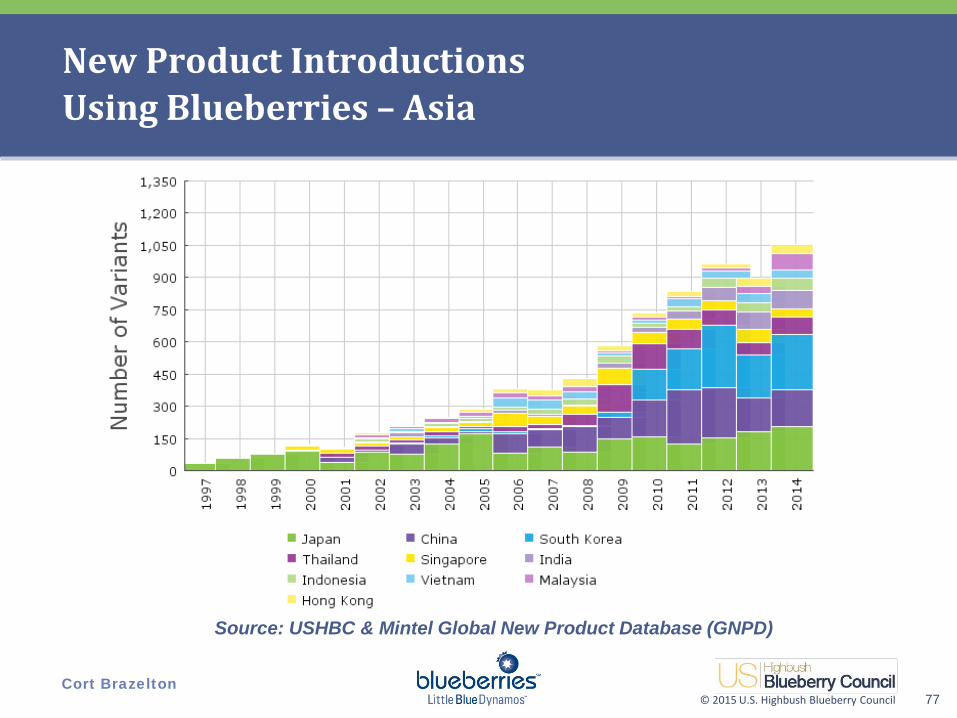
New Product Introductions Using Blueberries – Asia
77
Source: USHBC & Mintel Global New Product Database (GNPD)
© 2015 U.S. Highbush Blueberry Council Cort Brazelton
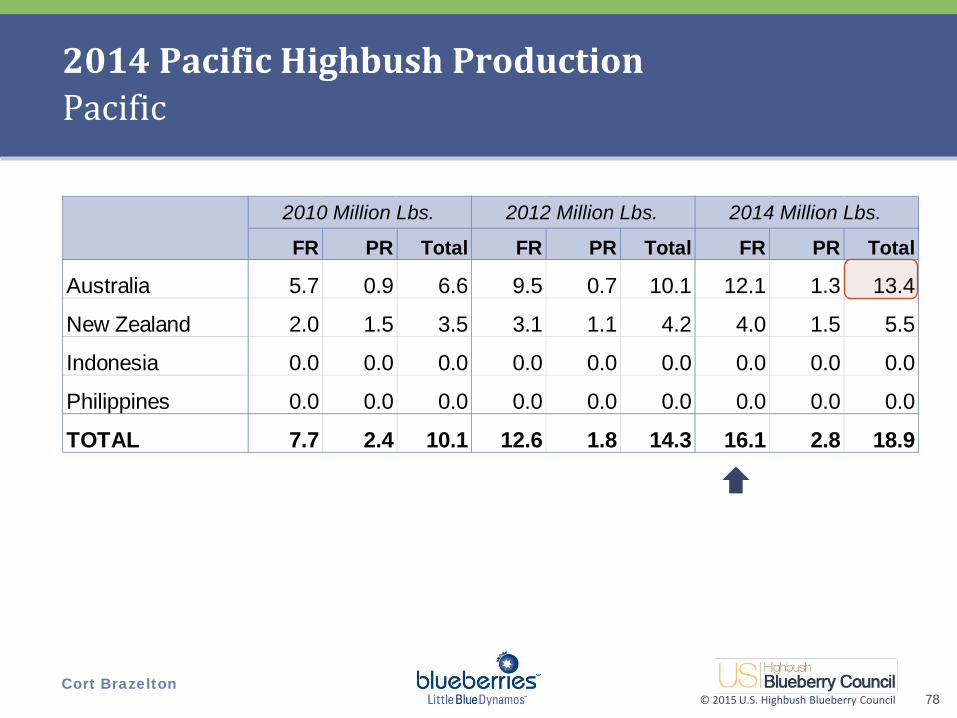
2014 Pacific Highbush Production Pacific
78
FR PR Total FR PR Total FR PR Total
Australia 5.7 0.9 6.6 9.5 0.7 10.1 12.1 1.3 13.4
New Zealand 2.0 1.5 3.5 3.1 1.1 4.2 4.0 1.5 5.5
Indonesia 0.0 0.0 0.0 0.0 0.0 0.0 0.0 0.0 0.0
Philippines 0.0 0.0 0.0 0.0 0.0 0.0 0.0 0.0 0.0
TOTAL 7.7 2.4 10.1 12.6 1.8 14.3 16.1 2.8 18.9
2010 Million Lbs. 2012 Million Lbs. 2014 Million Lbs.
© 2015 U.S. Highbush Blueberry Council Cort Brazelton
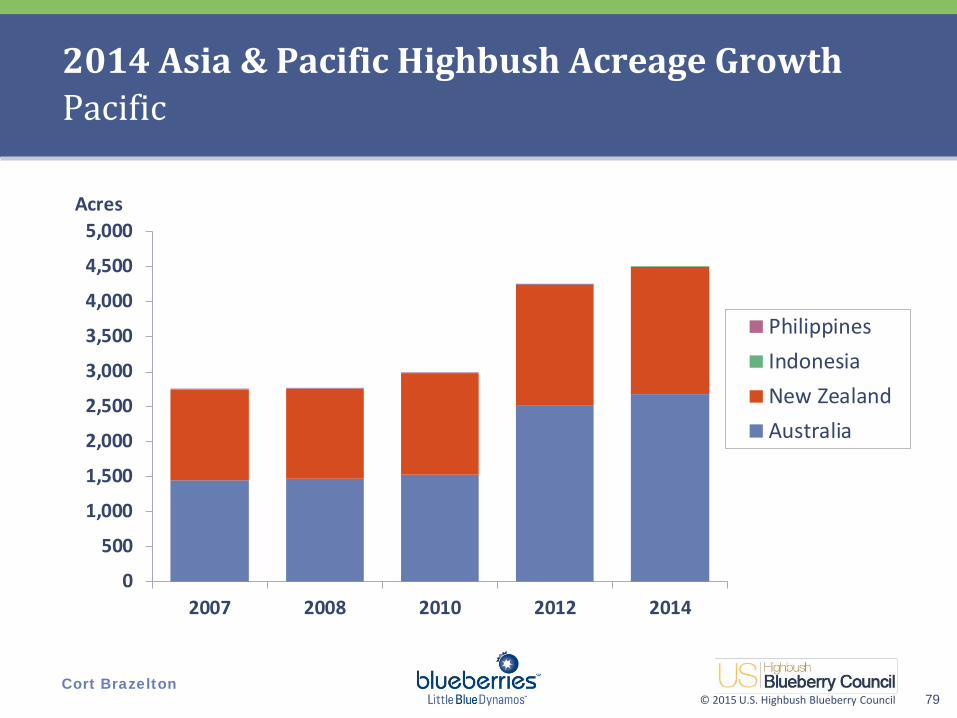
2014 Asia & Pacific Highbush Acreage Growth Pacific
79
0
500
1,000
1,500
2,000
2,500
3,000
3,500
4,000
4,500
5,000
2007 2008 2010 2012 2014
PhilippinesIndonesiaNew ZealandAustralia
Acres
© 2015 U.S. Highbush Blueberry Council Cort Brazelton
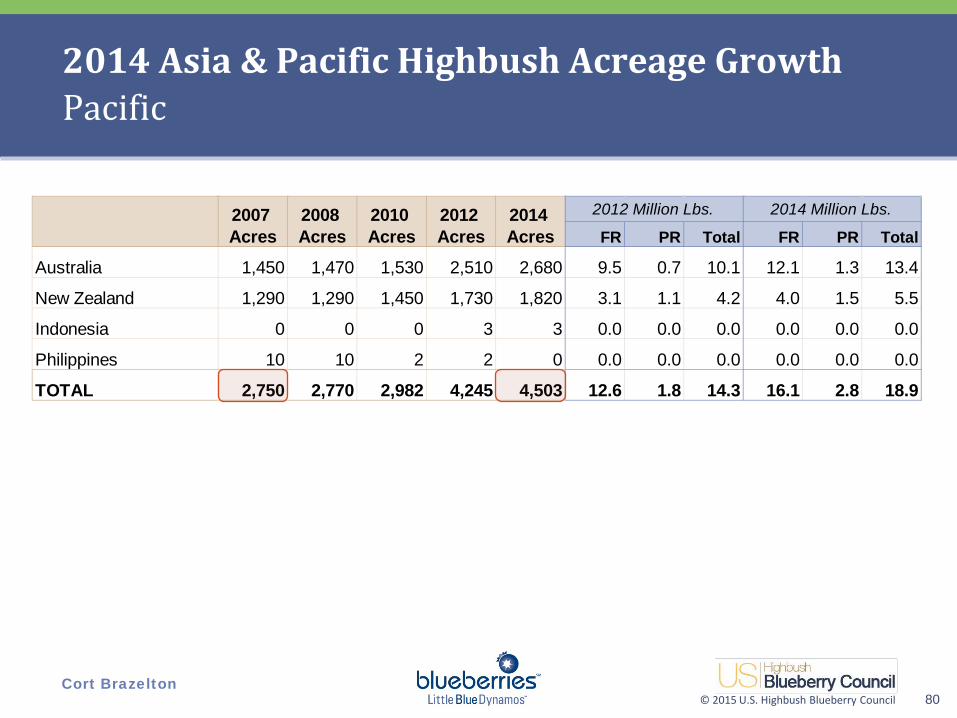
2014 Asia & Pacific Highbush Acreage Growth Pacific
80
FR PR Total FR PR Total
Australia 1,450 1,470 1,530 2,510 2,680 9.5 0.7 10.1 12.1 1.3 13.4
New Zealand 1,290 1,290 1,450 1,730 1,820 3.1 1.1 4.2 4.0 1.5 5.5
Indonesia 0 0 0 3 3 0.0 0.0 0.0 0.0 0.0 0.0
Philippines 10 10 2 2 0 0.0 0.0 0.0 0.0 0.0 0.0
TOTAL 2,750 2,770 2,982 4,245 4,503 12.6 1.8 14.3 16.1 2.8 18.9
2012 Million Lbs.2010 Acres
2014 Million Lbs.2014 Acres
2007 Acres
2008 Acres
2012 Acres
© 2015 U.S. Highbush Blueberry Council Cort Brazelton
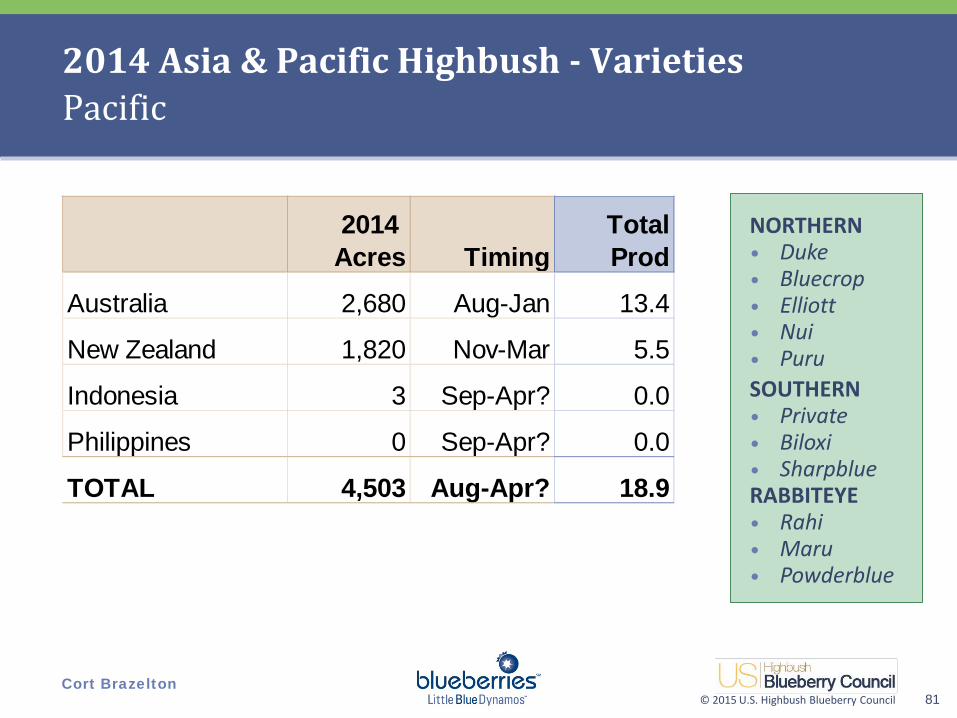
2014 Asia & Pacific Highbush - Varieties Pacific
81
NORTHERN • Duke • Bluecrop • Elliott • Nui • Puru SOUTHERN • Private • Biloxi • Sharpblue RABBITEYE • Rahi • Maru • Powderblue
Australia 2,680 Aug-Jan 13.4
New Zealand 1,820 Nov-Mar 5.5
Indonesia 3 Sep-Apr? 0.0
Philippines 0 Sep-Apr? 0.0
TOTAL 4,503 Aug-Apr? 18.9
2014 Acres Timing
TotalProd

© 2015 U.S. Highbush Blueberry Council Cort Brazelton
New Product Introductions Using Blueberries – Australia/New Zealand
82
Source: USHBC & Mintel Global New Product Database (GNPD)

© 2015 U.S. Highbush Blueberry Council Cort Brazelton
2014 Asia & Pacific Highbush Production
83
FR PR Total FR PR Total FR PR Total
Asia 8.6 3.8 12.4 25.4 8.4 33.8 52.1 11.5 63.6
Pacific 7.7 2.4 10.1 12.6 1.8 14.3 16.1 2.8 18.9
TOTAL 16.3 6.2 22.5 38.0 10.2 48.1 68.2 14.3 82.5
2010 Million Lbs. 2012 Million Lbs. 2014 Million Lbs.
~2x?
© 2015 U.S. Highbush Blueberry Council Cort Brazelton
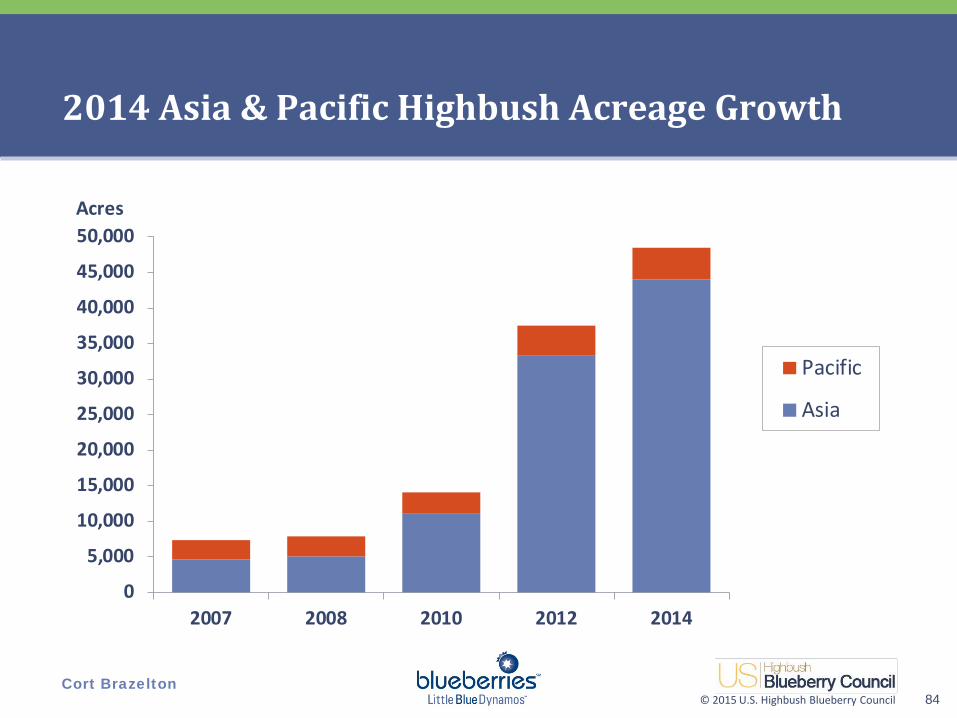
2014 Asia & Pacific Highbush Acreage Growth
84
0
5,000
10,000
15,000
20,000
25,000
30,000
35,000
40,000
45,000
50,000
2007 2008 2010 2012 2014
Pacific
Asia
Acres

© 2015 U.S. Highbush Blueberry Council Cort Brazelton
2014 Asia & Pacific Highbush Acreage Growth
85
FR PR Total FR PR Total
Asia 4,615 5,100 11,135 33,290 44,005 25.4 8.4 33.8 52.1 11.5 63.6
Pacific 2,750 2,770 2,982 4,245 4,503 12.6 1.8 14.3 16.1 2.8 18.9
TOTAL 7,365 7,870 14,117 37,535 48,508 38.0 10.2 48.1 68.2 14.3 82.5
2012 Million Lbs.2010 Acres
2014 Million Lbs.2014 Acres
2007 Acres
2008 Acres
2012 Acres
© 2015 U.S. Highbush Blueberry Council Cort Brazelton
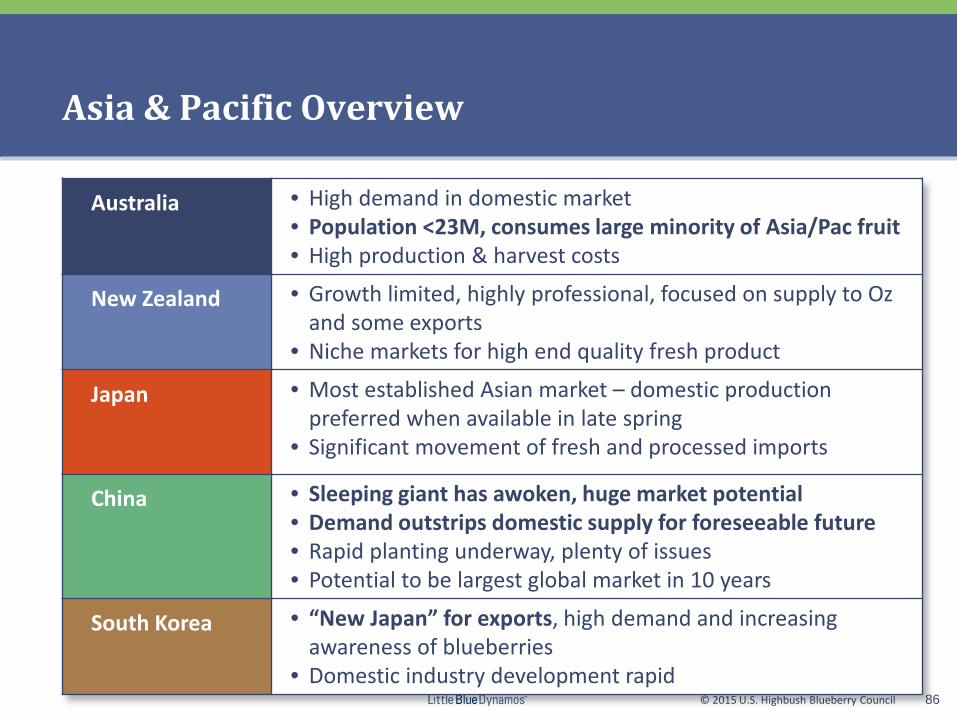
Asia & Pacific Overview
86
Australia • High demand in domestic market • Population <23M, consumes large minority of Asia/Pac fruit • High production & harvest costs
New Zealand • Growth limited, highly professional, focused on supply to Oz and some exports
• Niche markets for high end quality fresh product
Japan • Most established Asian market – domestic production preferred when available in late spring
• Significant movement of fresh and processed imports
China • Sleeping giant has awoken, huge market potential • Demand outstrips domestic supply for foreseeable future • Rapid planting underway, plenty of issues • Potential to be largest global market in 10 years
South Korea • “New Japan” for exports, high demand and increasing awareness of blueberries
• Domestic industry development rapid
© 2015 U.S. Highbush Blueberry Council Cort Brazelton
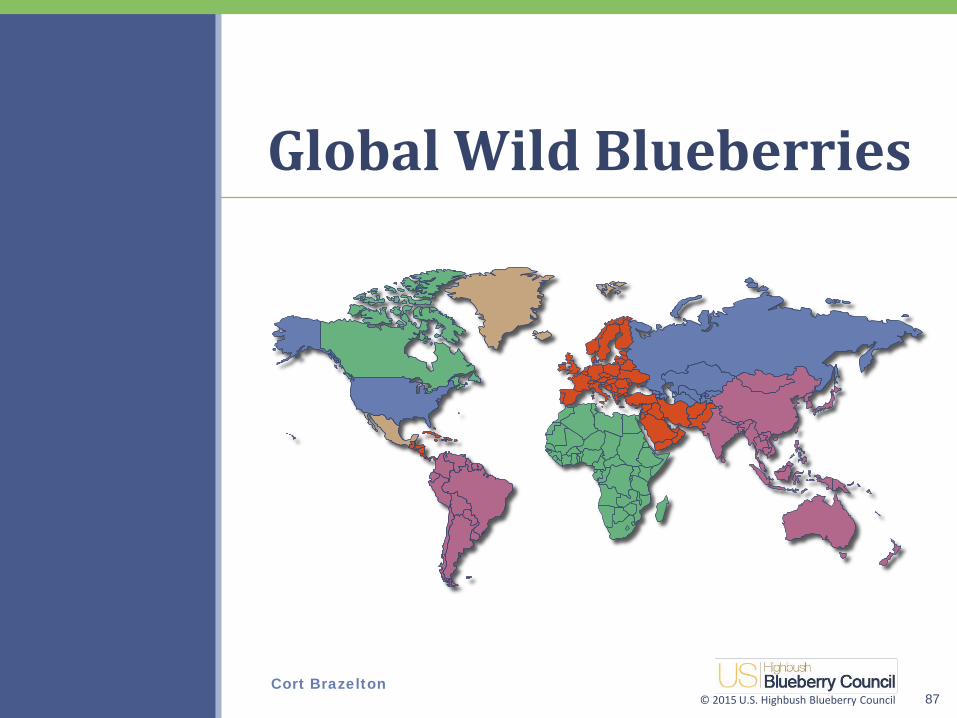
Global Wild Blueberries
87
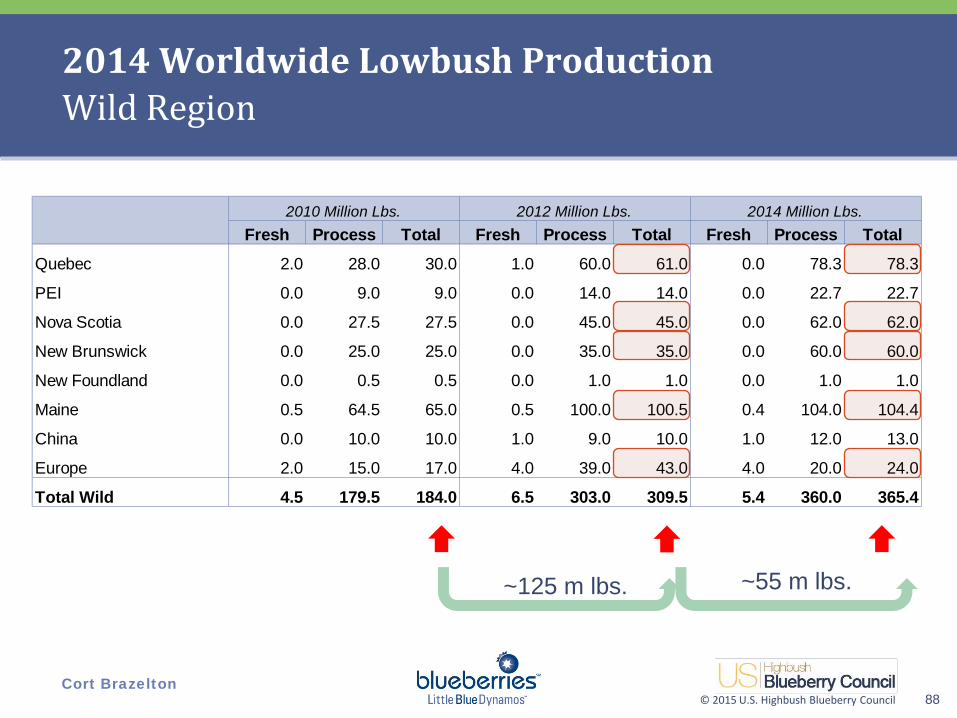
© 2015 U.S. Highbush Blueberry Council Cort Brazelton
Fresh Process Total Fresh Process Total Fresh Process Total
Quebec 2.0 28.0 30.0 1.0 60.0 61.0 0.0 78.3 78.3
PEI 0.0 9.0 9.0 0.0 14.0 14.0 0.0 22.7 22.7
Nova Scotia 0.0 27.5 27.5 0.0 45.0 45.0 0.0 62.0 62.0
New Brunswick 0.0 25.0 25.0 0.0 35.0 35.0 0.0 60.0 60.0
New Foundland 0.0 0.5 0.5 0.0 1.0 1.0 0.0 1.0 1.0
Maine 0.5 64.5 65.0 0.5 100.0 100.5 0.4 104.0 104.4
China 0.0 10.0 10.0 1.0 9.0 10.0 1.0 12.0 13.0
Europe 2.0 15.0 17.0 4.0 39.0 43.0 4.0 20.0 24.0
Total Wild 4.5 179.5 184.0 6.5 303.0 309.5 5.4 360.0 365.4
2010 Million Lbs. 2012 Million Lbs. 2014 Million Lbs.
2014 Worldwide Lowbush Production Wild Region
88
~125 m lbs. ~55 m lbs.

© 2015 U.S. Highbush Blueberry Council Cort Brazelton
Global Wild Overview
89
North America
• 2014 another good Wild crop year • Highly consolidated deal, big players expanding acreage • Perceived ‘scarcity’ • Volumes actually increasing and slated to continue growing • SWD becoming a serious problem, especially in small plots
Europe
• Subject to volume swings dependent on annual forest harvest • Growing demand in much of Europe for Vacc. Myrtillus • Ukraine crop disrupted • High local consumption in east, traditional
China
• Data nebulous • Wild ‘Chinese’ blueberries (Vacc. Ulig.) demand growing
locally (these are red) • ‘Cultivated Wild’ Vacc. Angustifolium acreage growth slowed
but still continues
© 2015 U.S. Highbush Blueberry Council Cort Brazelton
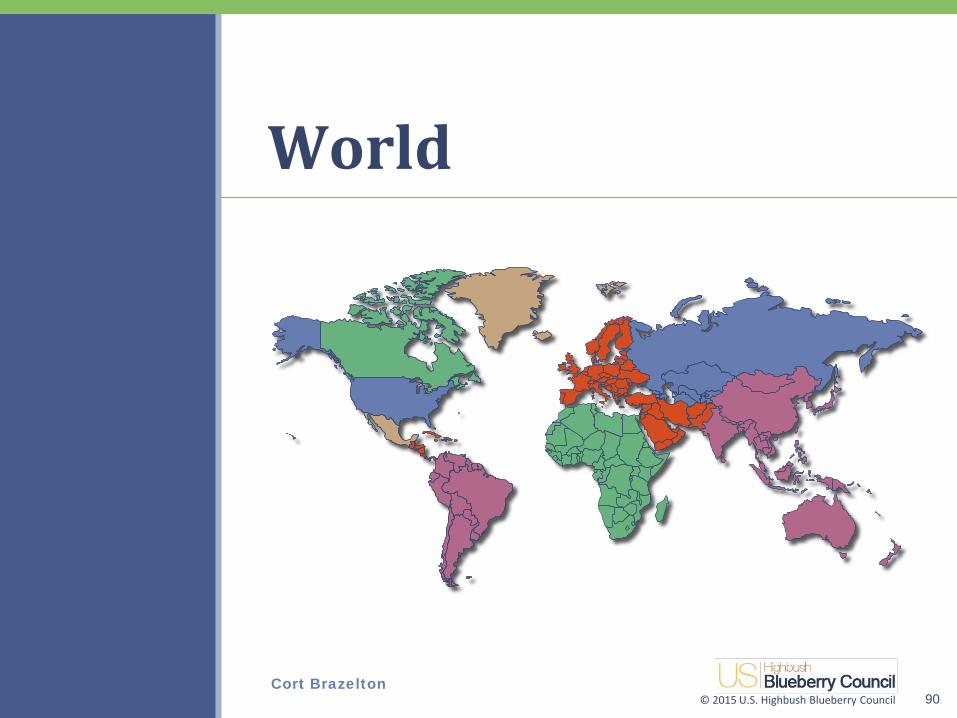
World
90
© 2015 U.S. Highbush Blueberry Council Cort Brazelton
FR PR Total FR PR Total FR PR Total
North America 303.0 188.3 491.3 342.2 257.4 599.6 407.0 320.8 727.8
South America 137.1 16.3 153.4 190.5 81.8 272.4 200.0 68.0 268.0
Europe 68.6 12.5 81.1 90.6 7.7 98.2 134.2 8.0 142.2
Med. & N. Africa 2.2 0.0 2.2 5.4 0.1 5.5 14.9 0.7 15.7
Southern Africa 2.1 0.2 2.3 3.1 0.5 3.6 4.5 0.4 5.0
Asia & Pacific 16.3 6.2 22.5 38.0 10.2 48.1 68.2 14.3 82.5
World Acreage 529.3 223.6 752.9 669.8 357.7 1,027.4 828.8 412.2 1,241.0
2014 Million Lbs.2010 Million Lbs. 2012 Million Lbs.
2014 World Highbush Production by Region
91
≈275 m lbs. ≈215 m lbs. ≈150 m lbs.
≈65% ≈35% ≈67% ≈33%
© 2015 U.S. Highbush Blueberry Council Cort Brazelton
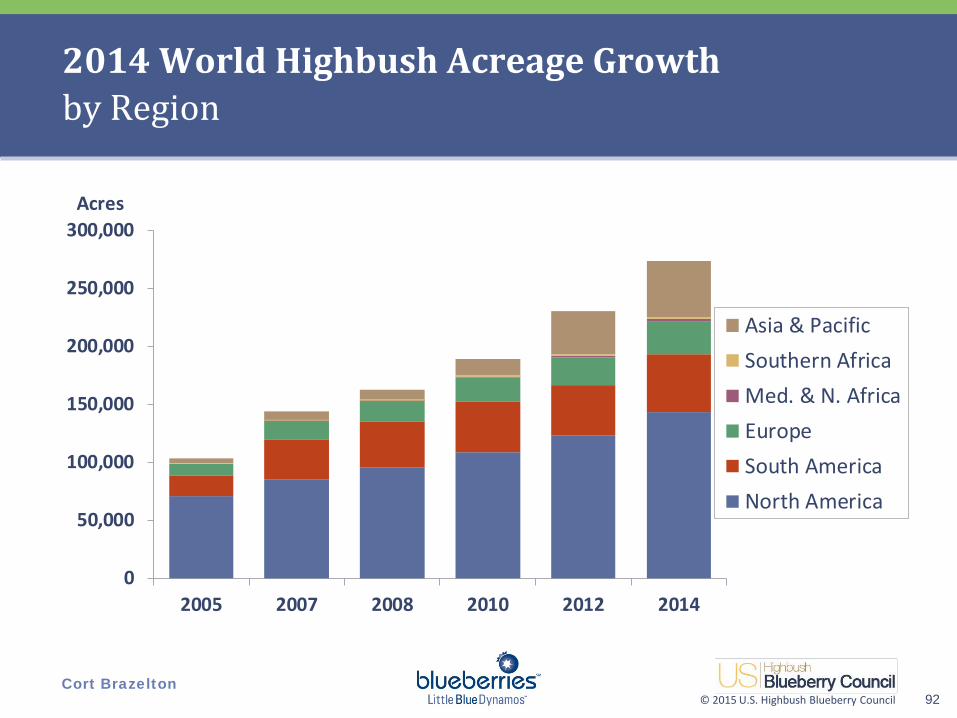
2014 World Highbush Acreage Growth by Region
92
0
50,000
100,000
150,000
200,000
250,000
300,000
2005 2007 2008 2010 2012 2014
Asia & PacificSouthern AfricaMed. & N. AfricaEuropeSouth AmericaNorth America
Acres

© 2015 U.S. Highbush Blueberry Council Cort Brazelton
2014 World Highbush Acreage Growth by Region
93
FR PR Total FR PR Total
North America 71,075 85,617 95,597 108,931 123,335 143,636 342.2 257.4 599.6 407.0 320.8 727.8
South America 18,039 33,650 39,703 43,950 43,640 49,860 190.5 81.8 272.4 200.0 68.0 268.0
Europe 9,736 16,705 18,038 20,780 24,001 28,255 90.6 7.7 98.2 134.2 8.0 142.2
Med. & N. Africa 0 215 355 672 1,098 2,329 5.4 0.1 5.5 14.9 0.7 15.7
Southern Africa 740 810 910 1,124 1,146 1,292 3.1 0.5 3.6 4.5 0.4 5.0
Asia & Pacific 4,188 7,365 7,870 14,117 37,535 48,508 38.0 10.2 48.1 68.2 14.3 82.5
World Acreage 103,778 144,362 162,473 189,574 230,755 273,880 669.8 357.7 1,027.4 828.8 412.2 1,241.0
2012 Million Lbs.2010 Acres
2014 Million Lbs.2014 Acres
2005 Acres
2007 Acres
2008 Acres
2012 Acres
© 2015 U.S. Highbush Blueberry Council Cort Brazelton
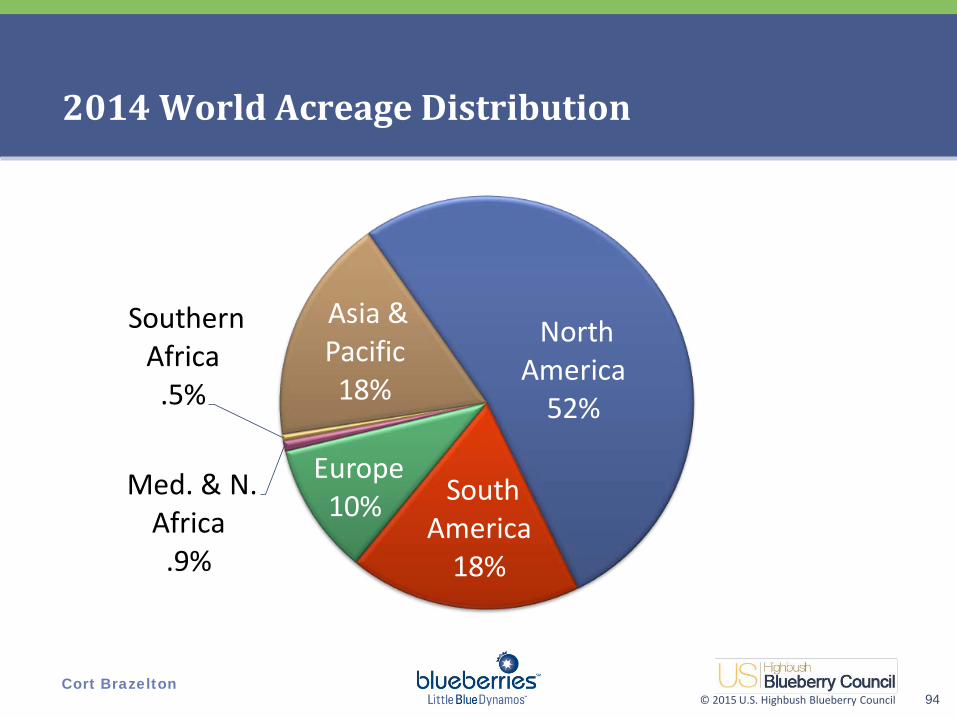
2014 World Acreage Distribution
94
North America
52%
South America
18%
Europe 10%
Med. & N. Africa .9%
Southern Africa .5%
Asia & Pacific 18%

© 2015 U.S. Highbush Blueberry Council Cort Brazelton
World Highbush Acreage Increases 1995 - 2014
95
0
50
100
150
200
250
300
1995 1999 2001 2003 2005 2007 2008 2010 2012 2014
Thousands
North America South AmericaEurope Med. & N. AfricaSouthern Africa AsiaPacific
© 2015 U.S. Highbush Blueberry Council Cort Brazelton
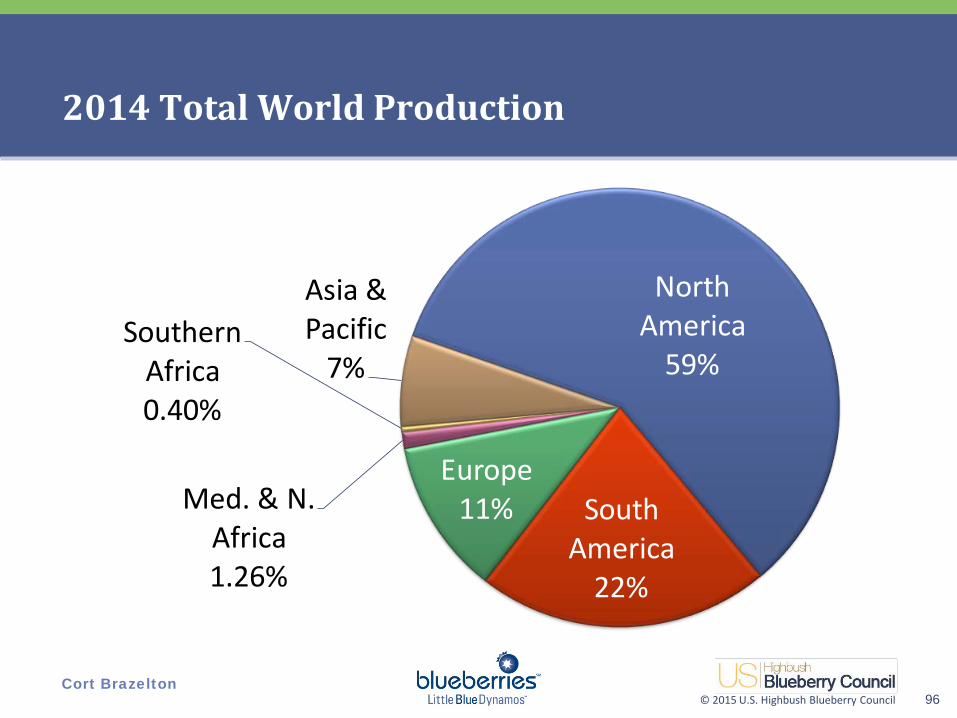
2014 Total World Production
96
North America
59%
South America
22%
Europe11%Med. & N.
Africa1.26%
Southern Africa0.40%
Asia & Pacific
7%
© 2015 U.S. Highbush Blueberry Council Cort Brazelton
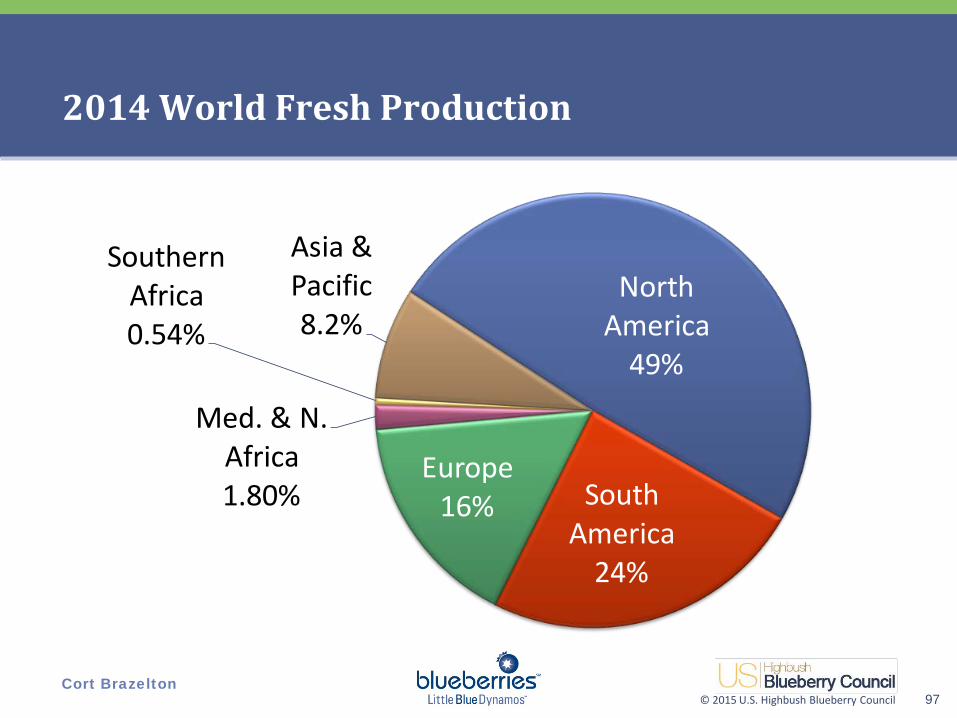
2014 World Fresh Production
97
North America
49%
South America
24%
Europe16%
Med. & N. Africa1.80%
Southern Africa0.54%
Asia & Pacific8.2%
© 2015 U.S. Highbush Blueberry Council Cort Brazelton
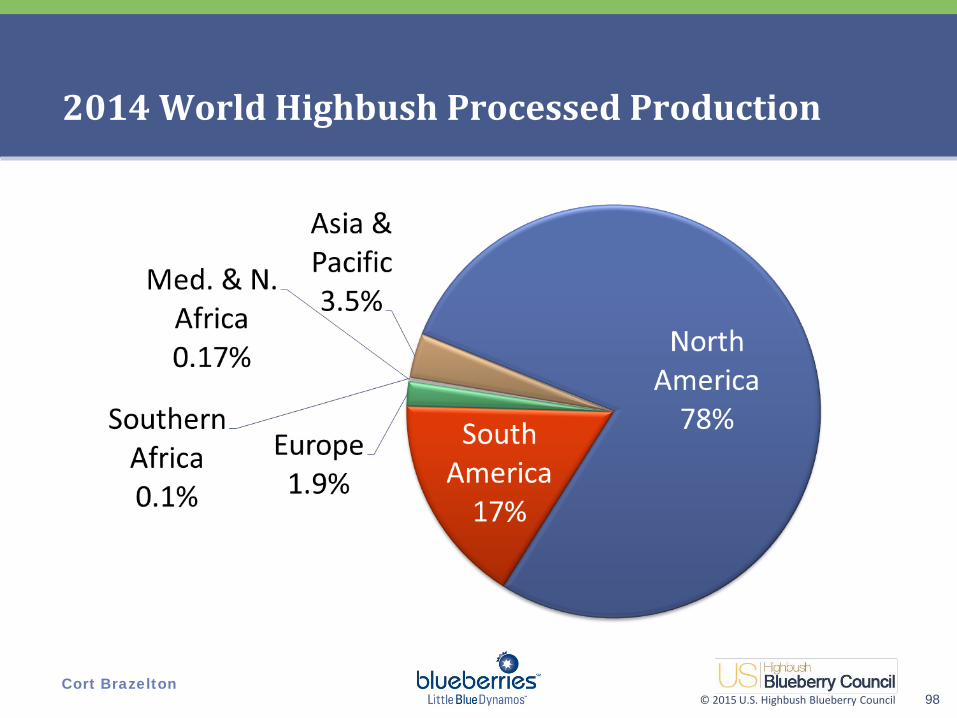
2014 World Highbush Processed Production
98

© 2015 U.S. Highbush Blueberry Council Cort Brazelton
2014 World Highbush & Wild Production Total Global Crop
99
≈50% ≈50%
Fresh Process Total Fresh Process Total Fresh Process Total
North America 305.5 342.8 648.3 343.7 512.4 856.1 407.4 648.8 1,056.2
South America 137.1 16.3 153.4 190.5 81.8 272.4 200.0 68.0 268.0
Europe 70.6 27.5 98.1 94.6 46.7 141.2 138.2 28.0 166.2
Med. & N. Africa 2.2 0.0 2.2 5.4 0.1 5.5 14.9 0.7 15.7
Southern Africa 2.1 0.2 2.3 3.1 0.5 3.6 4.5 0.4 5.0
Asia & Pacific 16.3 16.2 32.5 39.0 19.2 58.1 69.2 26.3 95.5
TOTAL 533.80 403.07 936.87 676.25 660.65 1,336.90 834.21 772.23 1,606.44
2010 Million Lbs. 2012 Million Lbs. 2014 Million Lbs.
≈55% ≈45%

© 2015 U.S. Highbush Blueberry Council Cort Brazelton
2014 World Highbush and Lowbush Processed Production
100
North America HB
41%
No.America Wild42%
SouthAmerica HB
12%
Europe HB1.0%
Europe Wild2.6%
Asia & Pacific HB
2%
Asia Wild1.6%

© 2015 U.S. Highbush Blueberry Council Cort Brazelton
2014 Top Ten Highbush Acreage Growth & Production
101
91% of Global Acreage
FR PR Total FR PR Total
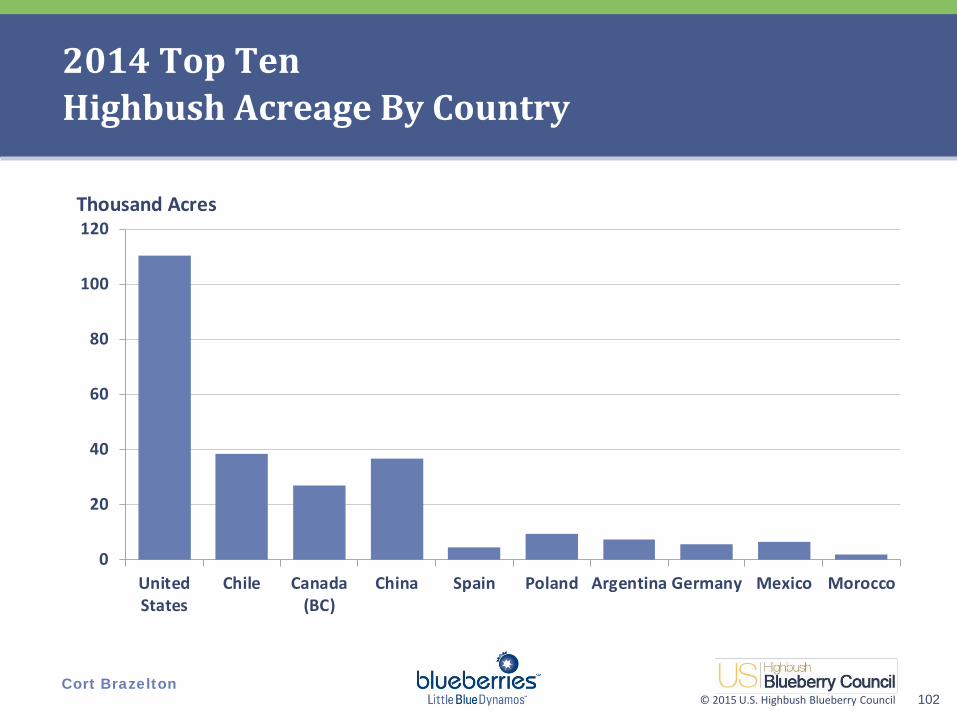
United States 67,572 76,492 86,248 94,765 110,245 279.9 192.3 472.2 323.9 228.6 552.5
Chile 22,700 26,908 32,250 33,960 38,430 154.5 65.9 220 163.1 60.1 223.2
Canada (BC) 17,500 18,300 21,020 25,500 27,000 50.0 65.0 115 60.0 92.0 152.0
China 3,275 2,900 8,645 29,800 36,700 18.0 7.0 25 35.3 8.8 44.1
Spain 1,870 2,100 2,600 3,050 4,560 21.5 0.2 22 43.2 0.2 43.4
Poland 6,700 6,900 7,800 8,545 9,350 22.3 3.4 26 30.8 3.4 34.2
Argentina 9,400 10,900 9,500 7,410 7,420 31.3 14.2 46 27.7 6.3 34.0
Germany 4,400 5,063 5,300 5,580 5,790 20.1 1.9 22 26.4 2.1 28.5
Mexico 545 805 1,663 3,070 6,391 12.3 0.2 12 23.1 0.2 23.3
Morocco 170 180 450 800 1,970 4.9 0.0 4.9 14.2 0.5 14.7
Top 10 Acreage 134,132 150,548 175,476 212,480 247,856 614.8 350.0 964.8 747.6 402.2 1,149.9
2012 Million Lbs. 2014 Million Lbs.2007 Acres
2008 Acres
2010 Acres
2014 Acres
2012 Acres
92% of Global Vol.
© 2015 U.S. Highbush Blueberry Council Cort Brazelton
2014 Top Ten Highbush Acreage By Country
102
0
20
40
60
80
100
120
UnitedStates
Chile Canada(BC)
China Spain Poland Argentina Germany Mexico Morocco
Thousand Acres

© 2015 U.S. Highbush Blueberry Council Cort Brazelton
2014 Top Ten Highbush Production – Fresh vs. Process
103
0
50
100
150
200
250
300
350
UnitedStates
Chile Canada(BC)
China Spain Poland Argentina Germany Mexico Morocco
Fresh Process
Million lb
© 2015 U.S. Highbush Blueberry Council Cort Brazelton
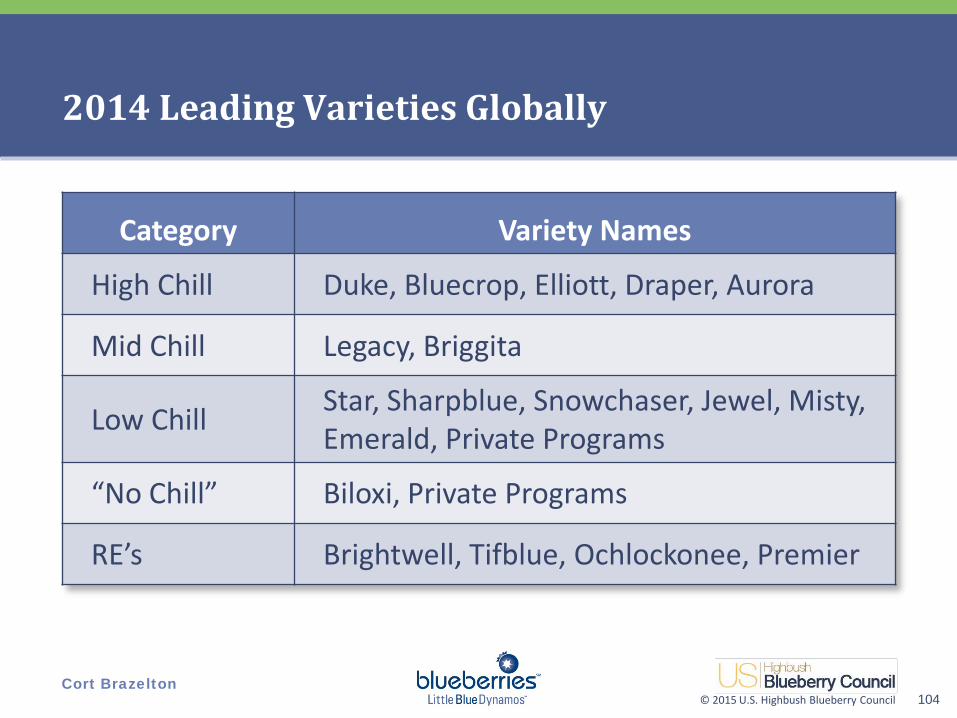
2014 Leading Varieties Globally
104
Category Variety Names
High Chill Duke, Bluecrop, Elliott, Draper, Aurora
Mid Chill Legacy, Briggita
Low Chill Star, Sharpblue, Snowchaser, Jewel, Misty, Emerald, Private Programs
“No Chill” Biloxi, Private Programs
RE’s Brightwell, Tifblue, Ochlockonee, Premier
© 2015 U.S. Highbush Blueberry Council Cort Brazelton
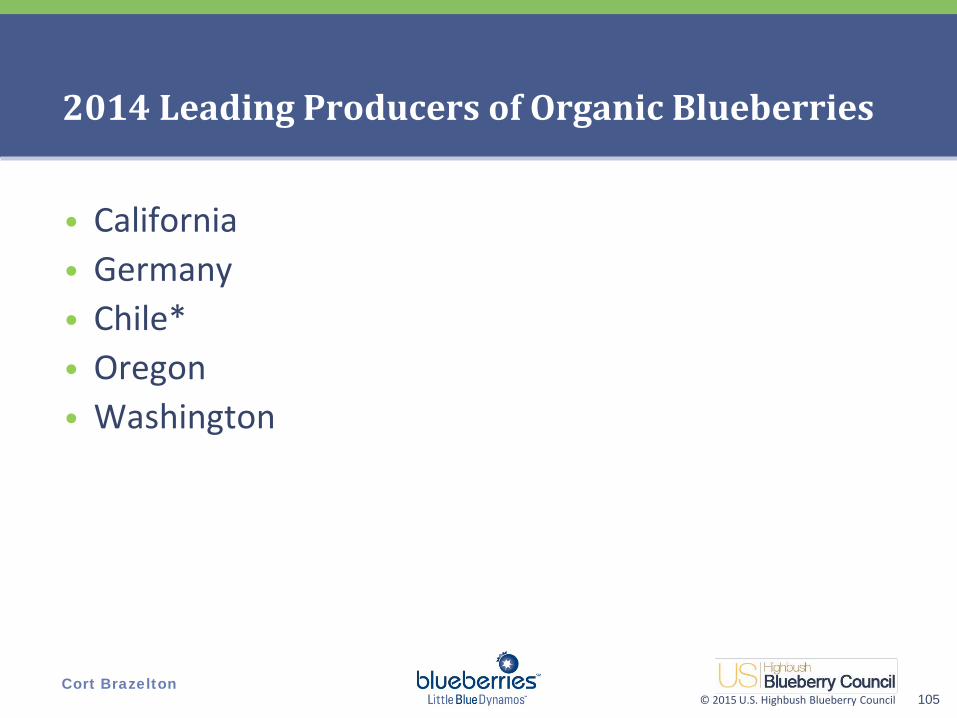
2014 Leading Producers of Organic Blueberries
• California • Germany • Chile* • Oregon • Washington
105
© 2015 U.S. Highbush Blueberry Council Cort Brazelton
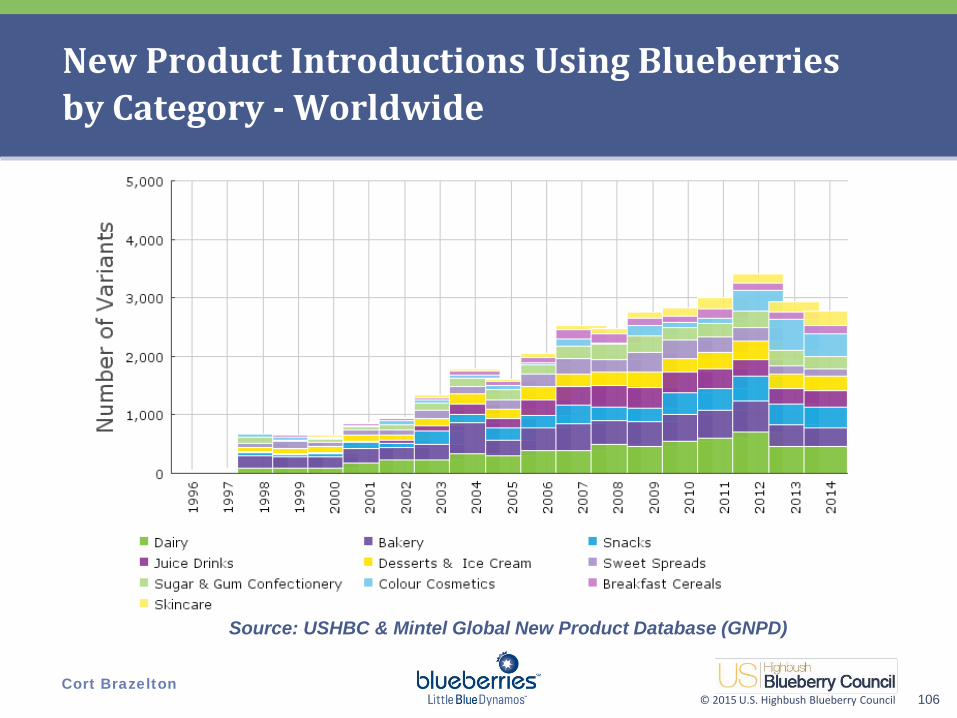
New Product Introductions Using Blueberries by Category - Worldwide
106
Source: USHBC & Mintel Global New Product Database (GNPD)
© 2015 U.S. Highbush Blueberry Council Cort Brazelton
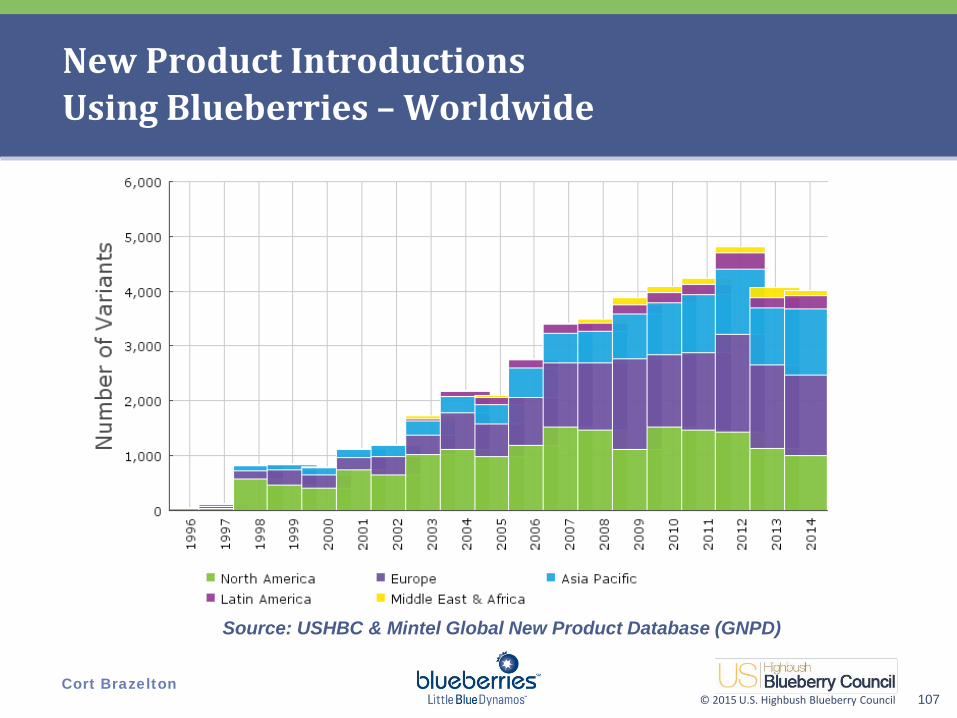
New Product Introductions Using Blueberries – Worldwide
107
Source: USHBC & Mintel Global New Product Database (GNPD)
© 2015 U.S. Highbush Blueberry Council Cort Brazelton
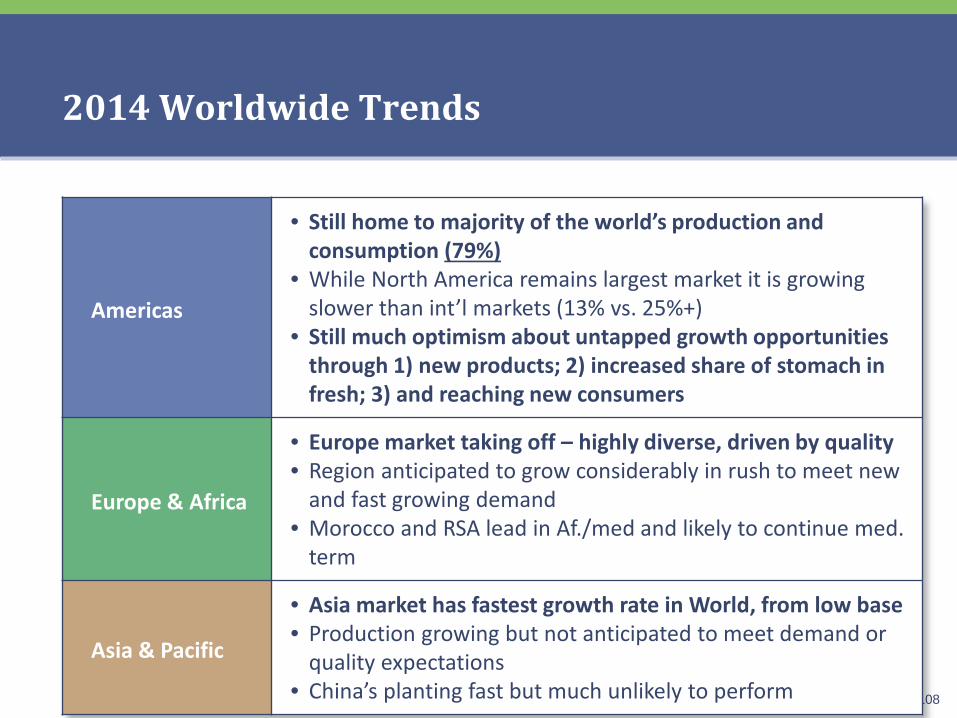
2014 Worldwide Trends
108
Americas
• Still home to majority of the world’s production and consumption (79%)
• While North America remains largest market it is growing slower than int’l markets (13% vs. 25%+)
• Still much optimism about untapped growth opportunities through 1) new products; 2) increased share of stomach in fresh; 3) and reaching new consumers
Europe & Africa
• Europe market taking off – highly diverse, driven by quality • Region anticipated to grow considerably in rush to meet new
and fast growing demand • Morocco and RSA lead in Af./med and likely to continue med.
term
Asia & Pacific
• Asia market has fastest growth rate in World, from low base • Production growing but not anticipated to meet demand or
quality expectations • China’s planting fast but much unlikely to perform
© 2015 U.S. Highbush Blueberry Council Cort Brazelton
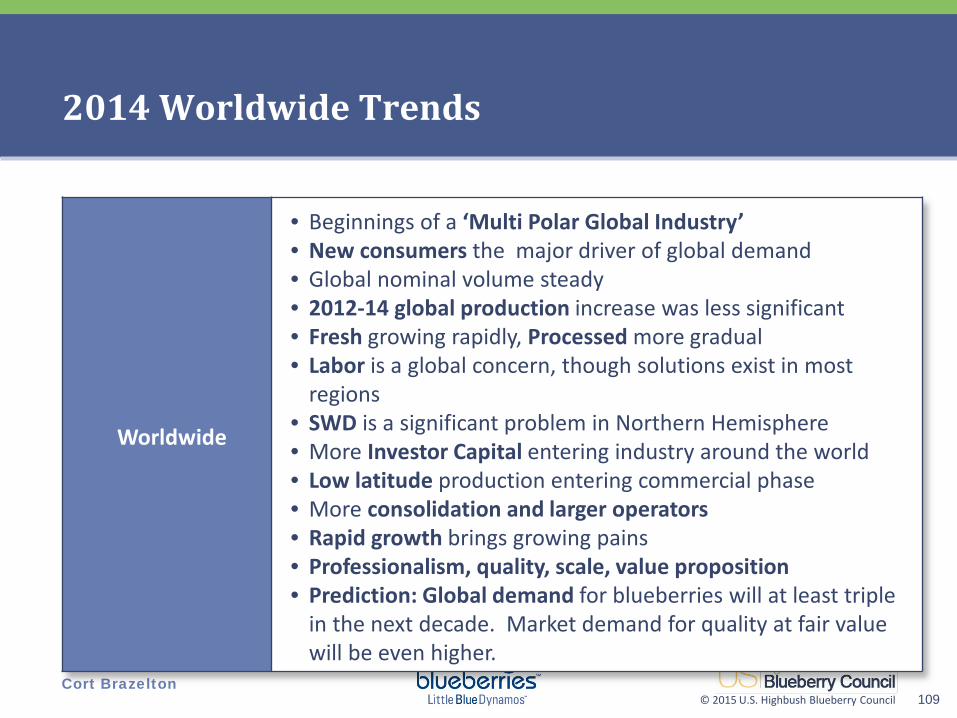
2014 Worldwide Trends
109
Worldwide
• Beginnings of a ‘Multi Polar Global Industry’ • New consumers the major driver of global demand • Global nominal volume steady • 2012-14 global production increase was less significant • Fresh growing rapidly, Processed more gradual • Labor is a global concern, though solutions exist in most
regions • SWD is a significant problem in Northern Hemisphere • More Investor Capital entering industry around the world • Low latitude production entering commercial phase • More consolidation and larger operators • Rapid growth brings growing pains • Professionalism, quality, scale, value proposition • Prediction: Global demand for blueberries will at least triple
in the next decade. Market demand for quality at fair value will be even higher.

© 2015 U.S. Highbush Blueberry Council Cort Brazelton
2012 World Highbush Production Growth Prediction
110
Over 1.3 Bn lb by 2015
Over 1.45 Bn lb by 2017
© 2015 U.S. Highbush Blueberry Council Cort Brazelton
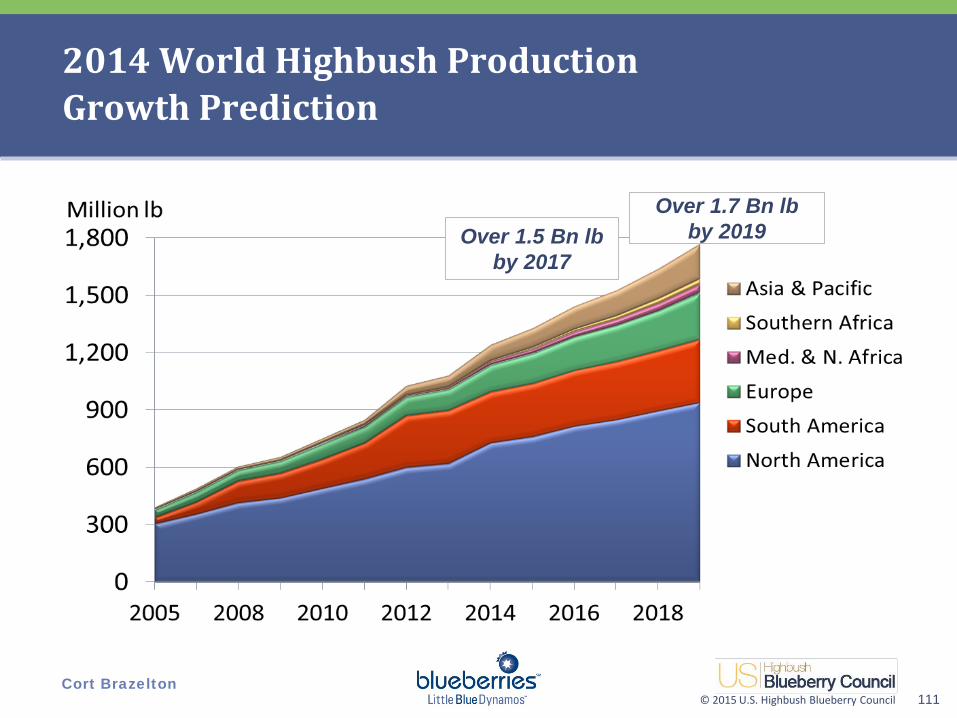
2014 World Highbush Production Growth Prediction
111
Over 1.7 Bn lb by 2019 Over 1.5 Bn lb
by 2017
© 2015 U.S. Highbush Blueberry Council Cort Brazelton
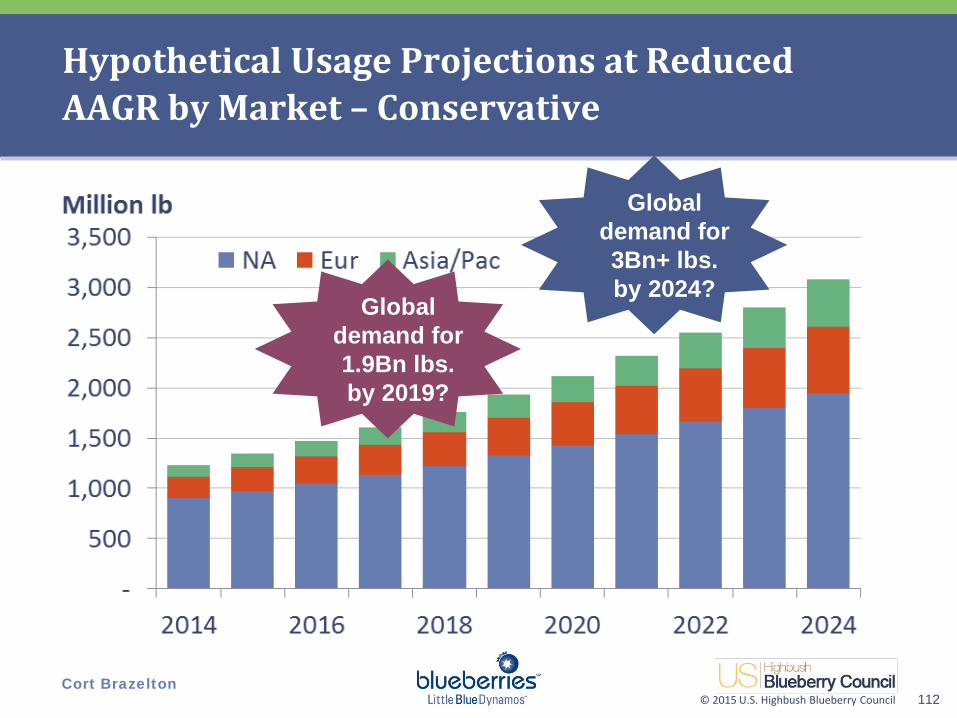
Hypothetical Usage Projections at Reduced AAGR by Market – Conservative
112
Global demand for 3Bn+ lbs. by 2024?
Global demand for 1.9Bn lbs. by 2019?
© 2015 U.S. Highbush Blueberry Council Cort Brazelton
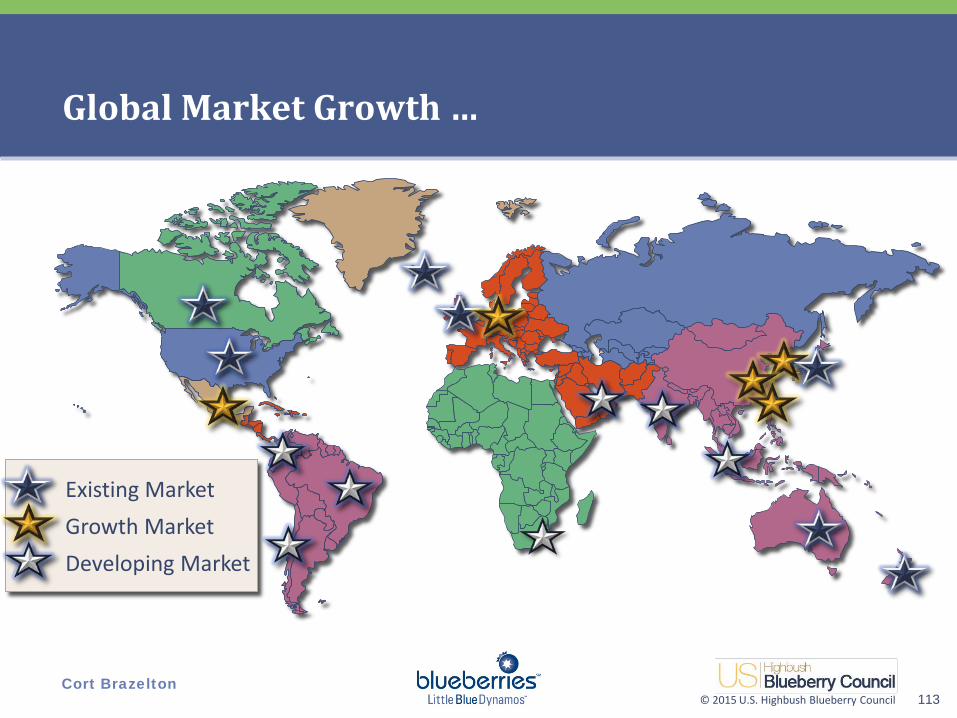
Global Market Growth …
113
Existing Market Growth Market Developing Market
`
© 2015 U.S. Highbush Blueberry Council Cort Brazelton
Special thanks to growers, shippers, packers, officials, suppliers, extension, foreign service, researchers and others from around the world who made this report possible!
Please remember the data in this report is a combination of hard data, soft data, official estimates, not so official estimates, conjecture, best guesses and wild guesses!
Also, thanks to Northwest Visuals and team members at Fall Creek Farm and Nursery for their support in data collection and preparation.
114
Special Thanks to all the Contributors!
Special thanks to growers, shippers, packers, officials, suppliers, extension, foreign service, researchers and others from around the world who made this report possible!