world e-government rankings - public administration and
TRANSCRIPT
9
World e-government rankingsUnited Nations E-Government Survey 2012 1Chapter One
Chapter 1
World e-government rankingsProgress in online service delivery continues in most countries
around the world. Th e United Nations E-Government Survey
2012 fi nds that many have put in place e-government initiatives
and information and communication technologies applications
for the people to further enhance public sector effi ciencies
and streamline governance systems to support sustainable
development. Among the e-government leaders, innovative
technology solutions have gained special recognition as the
means to revitalize lagging economic and social sectors.
Th e overall conclusion that emerges from the 2012 Survey in
today’s recessionary world climate is that while it is important to
continue with service delivery, governments must increasingly
begin to rethink in terms of e-government – and e-governance
– placing greater emphasis on institutional linkages between
and among the tiered government structures in a bid to create
synergy for inclusive sustainable development. An important
aspect of this approach is to widen the scope of e-government
for a transformative role of the government towards cohesive,
coordinated, and integrated processes and institutions through
which such sustainable development takes place.
Chapter 1
World e-government rankings
1.1 Overview of national
e-government development 10
1.2 Global leaders at a glance 10
1.2.1 Countries with a large population 12
1.3 Regional comparisons 14
1.3.1 E-government in Africa 15
1.3.2 E-government in the Americas 19
1.3.3 E-government in Asia 22
1.3.4 E-government in Europe 29
1.3.5 E-government in Oceania 33
1.4 Least developed countries 34
1.5 Post-confl ict countries 35
1.6 Conclusion 35
Eliot Sela
10
World e-government rankings United Nations E-Government Survey 20121 Chapter One
1.1 Overview of national e-government development
Th e United Nations Survey 2012 assessment of prog-ress indicates that e-government is increasingly being viewed among countries in the vanguard as going beyond service delivery towards a framework for a smart, inclusive and sustainable growth for future gen-erations. In countries that follow that trend, a focus on institutional integration coupled with online citizen orientation in public service continues to be dominant. Both in terms of information and services, the citizen is increasingly viewed as ‘an active customer of public services’ with borrowed private sector concepts being applied to improve public sector governance systems.
A key driver for this approach is the need to achieve effi ciency in government at the same time that services are being expanded. Advances in technology, which allow data sharing and effi cient streamlining of cross-agency governance systems are forming the back end of integrated portals where citizens fi nd a myriad of relevant information arranged by theme, life cycle or other preferred use. Th e trend towards personalization of services has gained momentum with more countries tailoring substance and presenta-tion in accord with varied preferences. Multichannel service delivery features were found on several portals in 2012 through which the government conducted business with citizens. Citizen inclusion is also ex-panding both horizontally and vertically with more governments around the world in 2012 accepting and promoting the need to inform – and involve – the citi-zen in the public decision making process.
E-government innovation and development can position the public sector as a driver of demand for ICT infrastructure and applications in the broader economy. Th e eff ect will be more pronounced in cases where government programmes constitute a signifi cant proportion of a country’s GDP and where the regulatory environment is conducive to expansion of ICT manufacturing, soft ware and related services.
E-government programmes can be a catalyst in boosting productivity, thereby speeding up the ben-efi ts of newer technologies to the people. In the last few years many countries have employed ICT in areas such as entrepreneurship, innovation, research and development, promoting distance learning, e-health,
e-agriculture, e-trade and other fi elds. Accessing these new technologies for development is being recog-nized as one of the key sources of economic growth. Of particular importance is the eff ect of cellular tech-nologies. Where national governments have taken a lead, rapid mobile technology proliferation has con-tributed as much as a one per cent annual increase in economic growth over the last few years.1
Notwithstanding these trends, progress re-mains uneven. In the current recessionary climate some countries have been bett er able to continue to invest in ICT infrastructure and service improve-ment. Others are evaluating the marginal utility of such investment, especially taking into account low user uptake of existing services, and reassess-ing service portfolios where demand for online services is low. Many countries with low levels of infrastructure and human capital remain at lower levels of e-government development with serious issues of digital divide.
In all cases, e-government take a prominent role in shaping development making it more in tune with people’s needs and driving the whole process based on their participation.
1.2 Global leaders at a glance
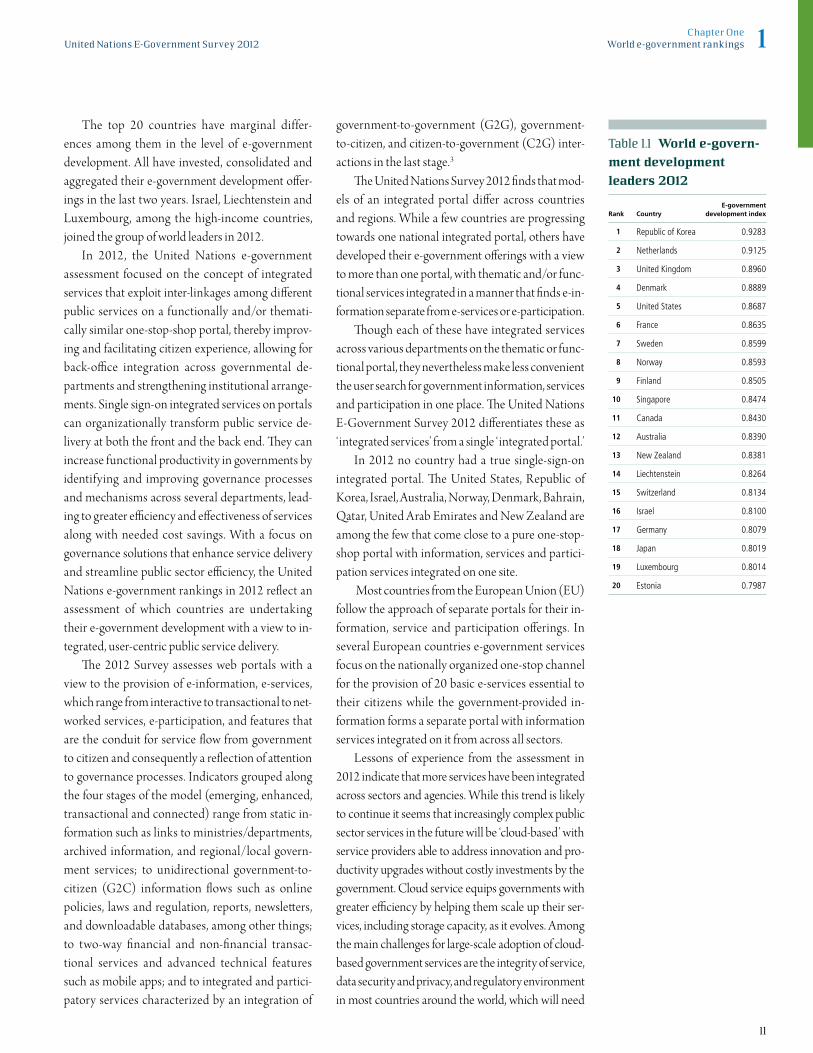
Building upon the transformative nature of ICT and maintaining their focus on e-government develop-ment, all of the top 20 countries in 2012 were high-income developed economies.2 All have values that range from 164 to 190 per cent of the world average. Of the 20, 14 are in Northern America and Europe; 3 in East Asia (Republic of Korea, Singapore and Japan); 2 in Oceania (Australia and New Zealand); and 1 in Western Asia (Israel).
While the Republic of Korea (0.9283) maintains its position as achieving the greatest e-government development, in 2012 it is followed by three European countries, with the Netherlands (0.9125) advancing by three and the United Kingdom of Great Britain and Northern Ireland (0.8960) by one to become the 2nd and 3rd leading e-ready governments in the world. Denmark (0.8889), the United States of America (0.8687), France (0.8635) and Sweden (0.8599) fol-low close behind among the global leaders.
E-government innovation and development can position the public sector as a driver of demand for ICT infrastructure and applications in the broader economy.
11
World e-government rankingsUnited Nations E-Government Survey 2012 1Chapter One
The top 20 countries have marginal differ-ences among them in the level of e-government development. All have invested, consolidated and aggregated their e-government development off er-ings in the last two years. Israel, Liechtenstein and Luxembourg, among the high-income countries, joined the group of world leaders in 2012.
In 2012, the United Nations e-government assessment focused on the concept of integrated services that exploit inter-linkages among diff erent public services on a functionally and/or themati-cally similar one-stop-shop portal, thereby improv-ing and facilitating citizen experience, allowing for back-offi ce integration across governmental de-partments and strengthening institutional arrange-ments. Single sign-on integrated services on portals can organizationally transform public service de-livery at both the front and the back end. Th ey can increase functional productivity in governments by identifying and improving governance processes and mechanisms across several departments, lead-ing to greater effi ciency and eff ectiveness of services along with needed cost savings. With a focus on governance solutions that enhance service delivery and streamline public sector effi ciency, the United Nations e-government rankings in 2012 refl ect an assessment of which countries are undertaking their e-government development with a view to in-tegrated, user-centric public service delivery.
Th e 2012 Survey assesses web portals with a view to the provision of e-information, e-services, which range from interactive to transactional to net-worked services, e-participation, and features that are the conduit for service fl ow from government to citizen and consequently a refl ection of att ention to governance processes. Indicators grouped along the four stages of the model (emerging, enhanced, transactional and connected) range from static in-formation such as links to ministries/departments, archived information, and regional/local govern-ment services; to unidirectional government-to-citizen (G2C) information fl ows such as online policies, laws and regulation, reports, newslett ers, and downloadable databases, among other things; to two-way fi nancial and non-fi nancial transac-tional services and advanced technical features such as mobile apps; and to integrated and partici-patory services characterized by an integration of
government-to-government (G2G), government-to-citizen, and citizen-to-government (C2G) inter-actions in the last stage.3
Th e United Nations Survey 2012 fi nds that mod-els of an integrated portal diff er across countries and regions. While a few countries are progressing towards one national integrated portal, others have developed their e-government off erings with a view to more than one portal, with thematic and/or func-tional services integrated in a manner that fi nds e-in-formation separate from e-services or e-participation.
Th ough each of these have integrated services across various departments on the thematic or func-tional portal, they nevertheless make less convenient the user search for government information, services and participation in one place. Th e United Nations E-Government Survey 2012 diff erentiates these as ‘integrated services’ from a single ‘integrated portal.’
In 2012 no country had a true single-sign-on integrated portal. Th e United States, Republic of Korea, Israel, Australia, Norway, Denmark, Bahrain, Qatar, United Arab Emirates and New Zealand are among the few that come close to a pure one-stop-shop portal with information, services and partici-pation services integrated on one site.
Most countries from the European Union (EU) follow the approach of separate portals for their in-formation, service and participation off erings. In several European countries e-government services focus on the nationally organized one-stop channel for the provision of 20 basic e-services essential to their citizens while the government-provided in-formation forms a separate portal with information services integrated on it from across all sectors.
Lessons of experience from the assessment in 2012 indicate that more services have been integrated across sectors and agencies. While this trend is likely to continue it seems that increasingly complex public sector services in the future will be ‘cloud-based’ with service providers able to address innovation and pro-ductivity upgrades without costly investments by the government. Cloud service equips governments with greater effi ciency by helping them scale up their ser-vices, including storage capacity, as it evolves. Among the main challenges for large-scale adoption of cloud-based government services are the integrity of service, data security and privacy, and regulatory environment in most countries around the world, which will need
Table 1.1 World e-govern-
ment development
leaders 2012
Rank CountryE-government
development index
1 Republic of Korea 0.9283
2 Netherlands 0.9125
3 United Kingdom 0.8960
4 Denmark 0.8889
5 United States 0.8687
6 France 0.8635
7 Sweden 0.8599
8 Norway 0.8593
9 Finland 0.8505
10 Singapore 0.8474
11 Canada 0.8430
12 Australia 0.8390
13 New Zealand 0.8381
14 Liechtenstein 0.8264
15 Switzerland 0.8134
16 Israel 0.8100
17 Germany 0.8079
18 Japan 0.8019
19 Luxembourg 0.8014
20 Estonia 0.7987
12
World e-government rankings United Nations E-Government Survey 20121 Chapter One
continued reform in governance systems and a con-tinued focus on strengthening institutional linkages.
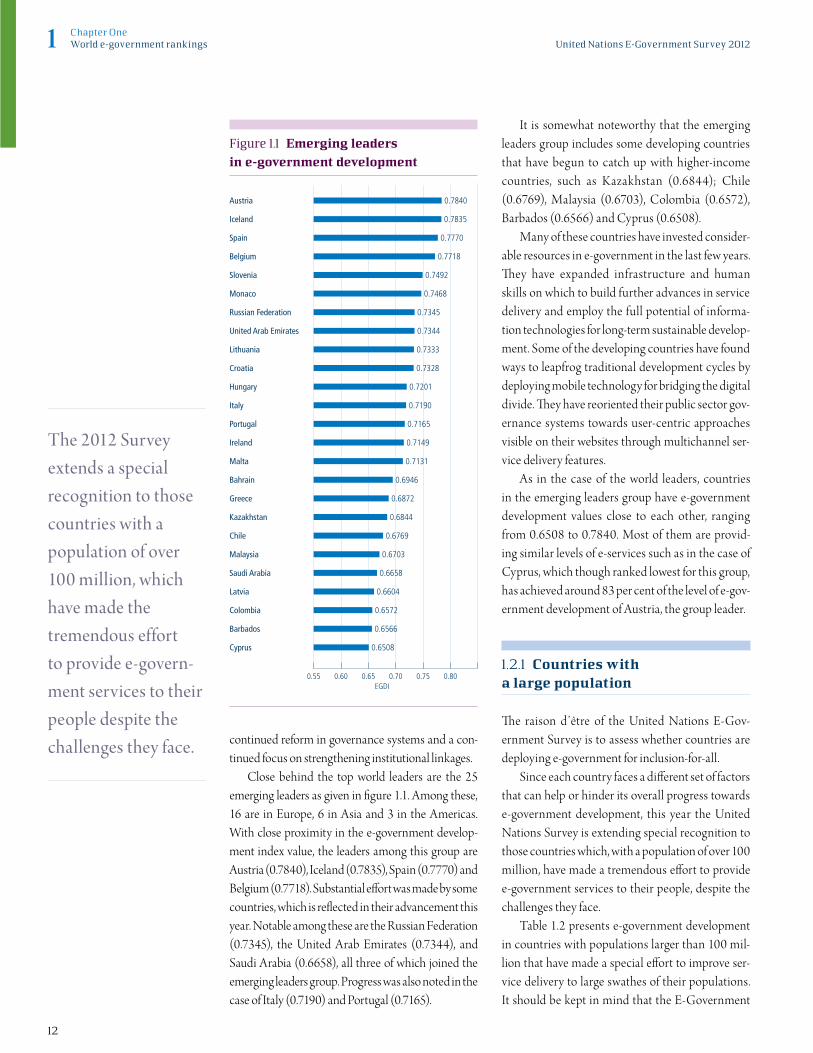
Close behind the top world leaders are the 25 emerging leaders as given in fi gure 1.1. Among these, 16 are in Europe, 6 in Asia and 3 in the Americas. With close proximity in the e-government develop-ment index value, the leaders among this group are Austria (0.7840), Iceland (0.7835), Spain (0.7770) and Belgium (0.7718). Substantial eff ort was made by some countries, which is refl ected in their advancement this year. Notable among these are the Russian Federation (0.7345), the United Arab Emirates (0.7344), and Saudi Arabia (0.6658), all three of which joined the emerging leaders group. Progress was also noted in the case of Italy (0.7190) and Portugal (0.7165).
It is somewhat noteworthy that the emerging leaders group includes some developing countries that have begun to catch up with higher-income countries, such as Kazakhstan (0.6844); Chile (0.6769), Malaysia (0.6703), Colombia (0.6572), Barbados (0.6566) and Cyprus (0.6508).
Many of these countries have invested consider-able resources in e-government in the last few years. Th ey have expanded infrastructure and human skills on which to build further advances in service delivery and employ the full potential of informa-tion technologies for long-term sustainable develop-ment. Some of the developing countries have found ways to leapfrog traditional development cycles by deploying mobile technology for bridging the digital divide. Th ey have reoriented their public sector gov-ernance systems towards user-centric approaches visible on their websites through multichannel ser-vice delivery features.
As in the case of the world leaders, countries in the emerging leaders group have e-government development values close to each other, ranging from 0.6508 to 0.7840. Most of them are provid-ing similar levels of e-services such as in the case of Cyprus, which though ranked lowest for this group, has achieved around 83 per cent of the level of e-gov-ernment development of Austria, the group leader.
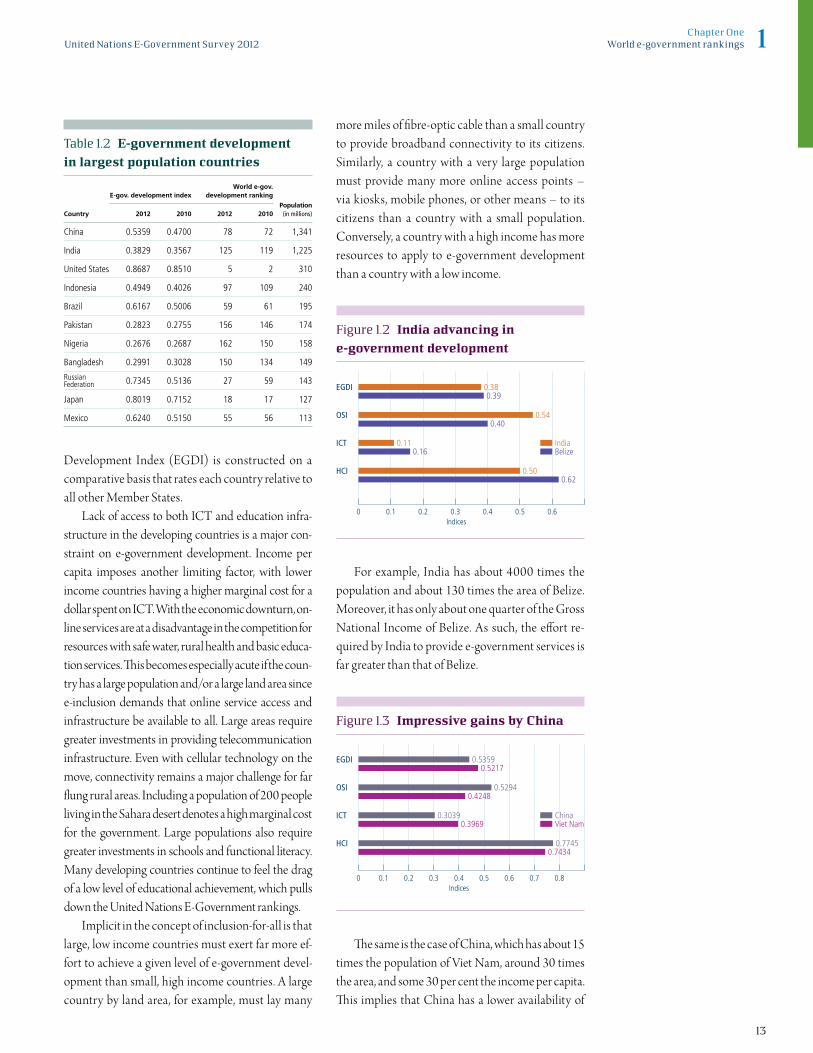
1.2.1 Countries with a large population
Th e raison d’être of the United Nations E-Gov-ernment Survey is to assess whether countries are deploying e-government for inclusion-for-all.
Since each country faces a diff erent set of factors that can help or hinder its overall progress towards e-government development, this year the United Nations Survey is extending special recognition to those countries which, with a population of over 100 million, have made a tremendous eff ort to provide e-government services to their people, despite the challenges they face.
Table 1.2 presents e-government development in countries with populations larger than 100 mil-lion that have made a special eff ort to improve ser-vice delivery to large swathes of their populations. It should be kept in mind that the E-Government
The 2012 Survey extends a special recognition to those countries with a population of over 100 million, which have made the tremendous effort to provide e-govern- ment services to their people despite the challenges they face.
Figure 1.1 Emerging leaders
in e-government development
0.800.750.700.65EGDI
0.600.55
0.7840
0.7835
0.7770
0.7718
0.7492
0.7468
0.7345
0.7344
0.7333
0.7328
0.7201
0.7190
0.7165
0.7149
0.7131
0.6946
0.6872
0.6844
0.6769
0.6703
0.6658
0.6604
0.6572
0.6566
0.6508
Austria
Iceland
Spain
Belgium
Slovenia
Monaco
Russian Federation
United Arab Emirates
Lithuania
Croatia
Hungary
Italy
Portugal
Ireland
Malta
Bahrain
Greece
Kazakhstan
Chile
Malaysia
Saudi Arabia
Latvia
Colombia
Barbados
Cyprus
13
World e-government rankingsUnited Nations E-Government Survey 2012 1Chapter One
Development Index (EGDI) is constructed on a comparative basis that rates each country relative to all other Member States.
Lack of access to both ICT and education infra-structure in the developing countries is a major con-straint on e-government development. Income per capita imposes another limiting factor, with lower income countries having a higher marginal cost for a dollar spent on ICT. With the economic downturn, on-line services are at a disadvantage in the competition for resources with safe water, rural health and basic educa-tion services. Th is becomes especially acute if the coun-try has a large population and/or a large land area since e-inclusion demands that online service access and infrastructure be available to all. Large areas require greater investments in providing telecommunication infrastructure. Even with cellular technology on the move, connectivity remains a major challenge for far fl ung rural areas. Including a population of 200 people living in the Sahara desert denotes a high marginal cost for the government. Large populations also require greater investments in schools and functional literacy. Many developing countries continue to feel the drag of a low level of educational achievement, which pulls down the United Nations E-Government rankings.
Implicit in the concept of inclusion-for-all is that large, low income countries must exert far more ef-fort to achieve a given level of e-government devel-opment than small, high income countries. A large country by land area, for example, must lay many
more miles of fi bre-optic cable than a small country to provide broadband connectivity to its citizens. Similarly, a country with a very large population must provide many more online access points – via kiosks, mobile phones, or other means – to its citizens than a country with a small population. Conversely, a country with a high income has more resources to apply to e-government development than a country with a low income.
For example, India has about 4000 times the population and about 130 times the area of Belize. Moreover, it has only about one quarter of the Gross National Income of Belize. As such, the eff ort re-quired by India to provide e-government services is far greater than that of Belize.
Th e same is the case of China, which has about 15 times the population of Viet Nam, around 30 times the area, and some 30 per cent the income per capita. Th is implies that China has a lower availability of
Table 1.2 E-government development
in largest population countries
Country
E-gov. development indexWorld e-gov.
development ranking
Population(in millions)2012 2010 2012 2010
China 0.5359 0.4700 78 72 1,341
India 0.3829 0.3567 125 119 1,225
United States 0.8687 0.8510 5 2 310
Indonesia 0.4949 0.4026 97 109 240
Brazil 0.6167 0.5006 59 61 195
Pakistan 0.2823 0.2755 156 146 174
Nigeria 0.2676 0.2687 162 150 158
Bangladesh 0.2991 0.3028 150 134 149
RussianFederation 0.7345 0.5136 27 59 143
Japan 0.8019 0.7152 18 17 127
Mexico 0.6240 0.5150 55 56 113
Figure 1.3 Impressive gains by China
0.52170.5359
0.4248
0.3969
0.74340.7745
0.5294
0.3039Viet NamChina
0.1 0.50.4Indices
0.80.30.2 0.70.60
EGDI
OSI
ICT
HCI
Figure 1.2 India advancing in
e-government development
0.390.38
0.40
0.16
0.620.50
0.54
0.11BelizeIndia
0.1 0.4 0.60.3 Indices
0.2 0.50
EGDI
OSI
ICT
HCI

14
World e-government rankings United Nations E-Government Survey 20121 Chapter One
resources, skill levels and connectivity, at the margin, to devote to e-government development compared to Viet Nam, and that it must put forth a greater eff ort to achieve a similar level of e-government develop-ment. Despite these challenges the eff ort made by China has translated into a higher EGDI, at 0.5359.
Th e converse is true too. Countries endowed with a high income per capita, a small population, and high levels of connectivity face fewer challenges. It is to be expected that with fewer constraints, their e-government development eff orts will be more developed so that e-services are available to all, and that high-income developed economies will go the extra mile to deploy ICT for transformation of soci-eties for sustainable development.
Th is brings into sharp focus two aspects of e-government for development. Countries with a high per capita income, an established ICT infra-structure, and high levels of human capital can easily utilize these advantages to leverage the opportunity aff orded by ICT and support sustained socio-eco-nomic development. However, in some cases, they may not be doing so fully. Others with lower levels shown by key indicators no doubt need a greater ef-fort, but also have an opportunity to leapfrog long gestation developmental cycles by adroit utilization of ICT for development.
1.3 Regional comparisons
Sustained integration, expansion and consolida-tion of government online off erings led to more than a 10 per cent increase in the world average of e-government development compared to two years ago. Th e region of Europe (0.7188) shows the high-est e-government development followed by the Americas (0.5403).
Figure 1.4 highlights that despite considerable strides towards bridging the digital divide, infra-structure and human capital limitations in sev-eral parts of the world impinge upon the ability of governments to spread – and the citizens to par-take of – the benefits of information technology in the delivery of services. With a history of high levels of functional education and widespread te-lephony infrastructure, Europe and the Americas
as a whole remain far ahead of the rest of the world regions. Asia, which is home to around three-fifths of the world citizens, has nevertheless only around 70 per cent of the level of e-government in Europe while the level of services in Africa barely squares off at 40 per cent of those in Europe. Within any region, countries at the lower percentile of e-devel-opment do not fare well either. This is especially true of the lower income countries in both Asia and Africa. The 10 least e-ready countries in Asia have barely 37 per cent of the level of e-govern-ment in Europe while in Africa the figure is little more than 20 per cent.
What is encouraging is the worldwide trend during the last decade. Since 2003 all regions of the world have steadily improved their e-government
Figure 1.5 Advances in regional
e-government development in the
last decade4
Asia
0.8
0.7
0.6
0.5
0.4
0.3
0.2201220102008200520042003
WorldaverageOceania
Europe
Americas
Africa
Figure 1.4 Regional averages
in e-government development
0 0.1 0.2 0.3 0.4EGDI
0.5 0.6 0.7 0.8
0.4882
0.4240
0.7188
0.4992
0.5403
0.2780Africa
Americas
Asia
Europe
Oceania
World average
15
World e-government rankingsUnited Nations E-Government Survey 2012 1Chapter One
development off erings with European countries vis-ibly taking off in the last two years (see fi gure 1.5). While some countries have advanced considerably over others, Asia as a whole progressed at a leaner rate till 2010 – almost in line with the advances in the world average – and then took off . With an al-most fl at curve for the period 2003-2012, e-govern-ment off erings in Africa advanced minimally, with the region as a whole still remaining least e-ready.
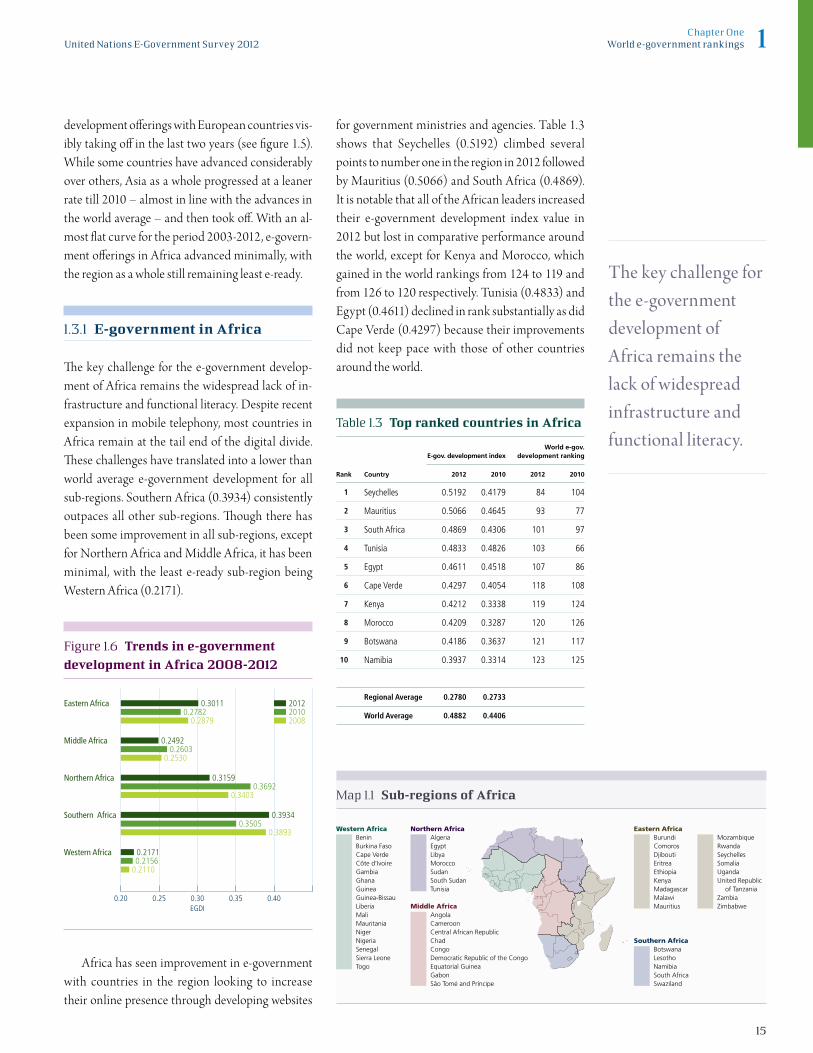
1.3.1 E-government in Africa
Th e key challenge for the e-government develop-ment of Africa remains the widespread lack of in-frastructure and functional literacy. Despite recent expansion in mobile telephony, most countries in Africa remain at the tail end of the digital divide. Th ese challenges have translated into a lower than world average e-government development for all sub-regions. Southern Africa (0.3934) consistently outpaces all other sub-regions. Th ough there has been some improvement in all sub-regions, except for Northern Africa and Middle Africa, it has been minimal, with the least e-ready sub-region being Western Africa (0.2171).
Africa has seen improvement in e-government with countries in the region looking to increase their online presence through developing websites
for government ministries and agencies. Table 1.3 shows that Seychelles (0.5192) climbed several points to number one in the region in 2012 followed by Mauritius (0.5066) and South Africa (0.4869). It is notable that all of the African leaders increased their e-government development index value in 2012 but lost in comparative performance around the world, except for Kenya and Morocco, which gained in the world rankings from 124 to 119 and from 126 to 120 respectively. Tunisia (0.4833) and Egypt (0.4611) declined in rank substantially as did Cape Verde (0.4297) because their improvements did not keep pace with those of other countries around the world.
The key challenge for the e-government development of Africa remains the lack of widespread infrastructure and functional literacy.
Map 1.1 Sub-regions of Africa
Eastern AfricaBurundiComorosDjiboutiEritreaEthiopiaKenyaMadagascarMalawiMauritius
MozambiqueRwandaSeychellesSomaliaUgandaUnited Republic of TanzaniaZambiaZimbabweMiddle Africa
AngolaCameroonCentral African RepublicChadCongoDemocratic Republic of the CongoEquatorial GuineaGabonSão Tomé and Príncipe
Northern AfricaAlgeriaEgyptLibyaMoroccoSudanSouth SudanTunisia
Southern AfricaBotswanaLesothoNamibiaSouth AfricaSwaziland
Western AfricaBeninBurkina FasoCape VerdeCôte d’IvoireGambiaGhanaGuineaGuinea-BissauLiberiaMaliMauritaniaNigerNigeriaSenegalSierra LeoneTogo
Figure 1.6 Trends in e-government
development in Africa 2008-2012
0.20 0.25 0.30EGDI
0.35 0.40
0.30110.2782
0.2879
0.24920.2603
0.31590.3692
201220102008
0.3403
0.21710.2156
0.2110
0.39340.3505
0.3893
0.2530
Eastern Africa
Middle Africa
Northern Africa
Southern Africa
Western Africa
Table 1.3 Top ranked countries in Africa
Rank Country
E-gov. development indexWorld e-gov.
development ranking
2012 2010 2012 2010
1 Seychelles 0.5192 0.4179 84 104
2 Mauritius 0.5066 0.4645 93 77
3 South Africa 0.4869 0.4306 101 97
4 Tunisia 0.4833 0.4826 103 66
5 Egypt 0.4611 0.4518 107 86
6 Cape Verde 0.4297 0.4054 118 108
7 Kenya 0.4212 0.3338 119 124
8 Morocco 0.4209 0.3287 120 126
9 Botswana 0.4186 0.3637 121 117
10 Namibia 0.3937 0.3314 123 125
Regional Average 0.2780 0.2733
World Average 0.4882 0.4406
16
World e-government rankings United Nations E-Government Survey 20121 Chapter One
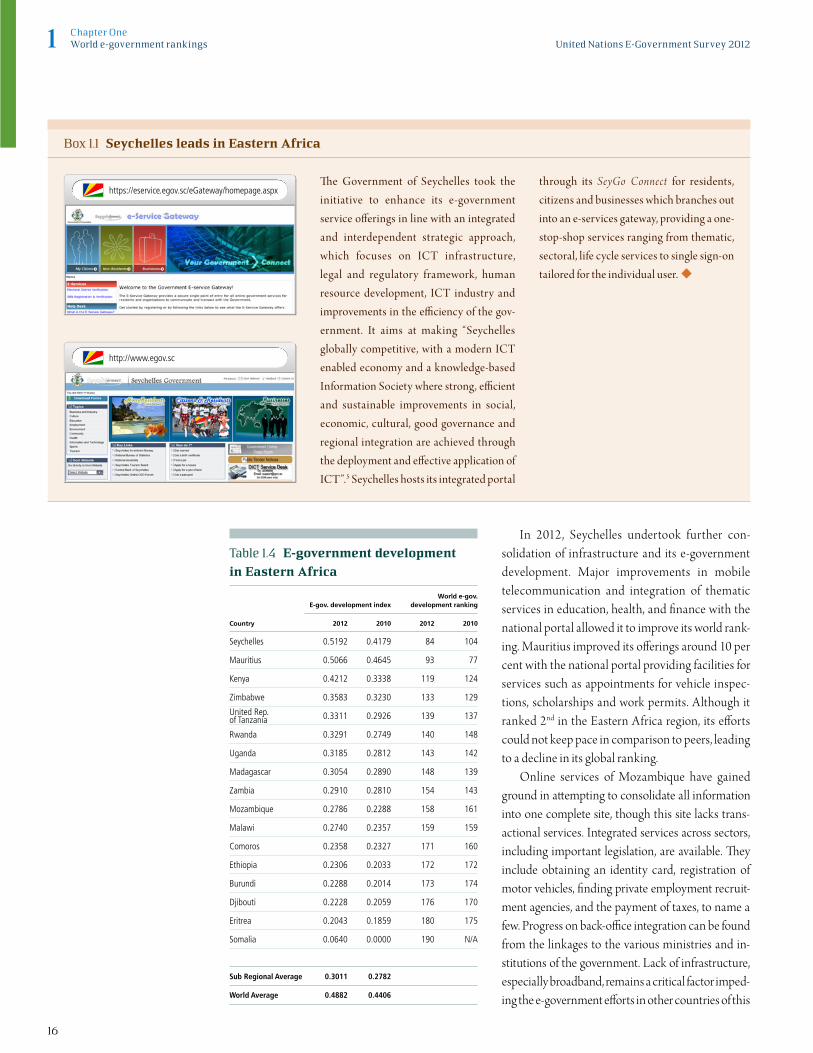
In 2012, Seychelles undertook further con-solidation of infrastructure and its e-government development. Major improvements in mobile telecommunication and integration of thematic services in education, health, and fi nance with the national portal allowed it to improve its world rank-ing. Mauritius improved its off erings around 10 per cent with the national portal providing facilities for services such as appointments for vehicle inspec-tions, scholarships and work permits. Although it ranked 2nd in the Eastern Africa region, its eff orts could not keep pace in comparison to peers, leading to a decline in its global ranking.
Online services of Mozambique have gained ground in att empting to consolidate all information into one complete site, though this site lacks trans-actional services. Integrated services across sectors, including important legislation, are available. Th ey include obtaining an identity card, registration of motor vehicles, fi nding private employment recruit-ment agencies, and the payment of taxes, to name a few. Progress on back-offi ce integration can be found from the linkages to the various ministries and in-stitutions of the government. Lack of infrastructure, especially broadband, remains a critical factor imped-ing the e-government eff orts in other countries of this
Box 1.1 Seychelles leads in Eastern Africa
Th e Government of Seychelles took the initiative to enhance its e-government service off erings in line with an integrated and interdependent strategic approach, which focuses on ICT infrastructure, legal and regulatory framework, human resource development, ICT industry and improvements in the effi ciency of the gov-ernment. It aims at making “Seychelles globally competitive, with a modern ICT enabled economy and a knowledge-based Information Society where strong, effi cient and sustainable improvements in social, economic, cultural, good governance and regional integration are achieved through the deployment and eff ective application of ICT”.5 Seychelles hosts its integrated portal
through its SeyGo Connect for residents, citizens and businesses which branches out into an e-services gateway, providing a one-stop-shop services ranging from thematic, sectoral, life cycle services to single sign-on tailored for the individual user. u
Table 1.4 E-government development
in Eastern Africa
Country
E-gov. development indexWorld e-gov.
development ranking
2012 2010 2012 2010
Seychelles 0.5192 0.4179 84 104
Mauritius 0.5066 0.4645 93 77
Kenya 0.4212 0.3338 119 124
Zimbabwe 0.3583 0.3230 133 129
United Rep. of Tanzania 0.3311 0.2926 139 137
Rwanda 0.3291 0.2749 140 148
Uganda 0.3185 0.2812 143 142
Madagascar 0.3054 0.2890 148 139
Zambia 0.2910 0.2810 154 143
Mozambique 0.2786 0.2288 158 161
Malawi 0.2740 0.2357 159 159
Comoros 0.2358 0.2327 171 160
Ethiopia 0.2306 0.2033 172 172
Burundi 0.2288 0.2014 173 174
Djibouti 0.2228 0.2059 176 170
Eritrea 0.2043 0.1859 180 175
Somalia 0.0640 0.0000 190 N/A
Sub Regional Average 0.3011 0.2782
World Average 0.4882 0.4406
https://eservice.egov.sc/eGateway/homepage.aspx
http://www.egov.sc

17
World e-government rankingsUnited Nations E-Government Survey 2012 1Chapter One
sub-region such as Mozambique and Rwanda as well, despite their progress in expanding services.
Th e top fi ve countries in the Middle Africa sub-region all improved their service off erings in 2011. However the marginal improvement did not trans-late into rank improvements on a world level, except in the case of Cameroon (0.3070). Th e countries of Middle Africa trailed behind other countries of the world.
Gabon (0.3687) was the sub-regional leader followed by Sao Tome and Principe (0.3327) and then Angola (0.3203). Improved features such as Twitter and Facebook on the Gabon national site indicated a move towards greater participation and inclusion of the citizen. The national website
of Sao Tome and Principe, though providing mostly static information, has archived data in-cluding sectoral information on health, education and the economy.
For eff ective e-government to materialize, plan-ning and organization needs to accompany resource availability and an adequate level of human and physical infrastructure on the ground.
Th ough most countries of Northern Africa in-creased their e-government off erings since the last Survey, they slipped in overall world rankings this year primarily because other countries overtook them in infrastructural development, especially in mobile telephone access. Tunisia (0.4833) main-tained its position as the leader of e-government in the sub-region. Morocco improved its e-government
Table 1.5 E-government development
in Middle Africa
Country
E-gov. development indexWorld e-gov.
development ranking
2012 2010 2012 2010
Gabon 0.3687 0.3420 129 123
Sao Tome and Principe 0.3327 0.3258 138 128
Angola 0.3203 0.3110 142 132
Cameroon 0.3070 0.2722 147 149
Equatorial Guinea 0.2955 0.2902 151 138
Congo 0.2809 0.3019 157 135
Democratic Republic of the Congo 0.2280 0.2357 174 158
Chad 0.1092 0.1235 189 182
Central African Republic N/A 0.1399 N/A 181
Sub Regional Average 0.2492 0.2603
World Average 0.4882 0.4406
Table 1.6 E-government development
in Northern Africa
Country
E-gov. development indexWorld e-gov.
development ranking
2012 2010 2012 2010
Tunisia 0.4833 0.4826 103 66
Egypt 0.4611 0.4518 107 86
Morocco 0.4209 0.3287 120 126
Algeria 0.3608 0.3181 132 131
Sudan 0.2610 0.2542 165 154
South Sudan 0.2239 N/A 175 N/A
Libya N/A 0.3799 N/A 114
Sub Regional Average 0.3159 0.3692
World Average 0.4882 0.4406
Box 1.2 Tunisia national portal
Th e national government portal provides a ‘Most Used Services’ section on the home page that pro-vides quick access for citizens to information on services such as obtaining a driver license, and acquiring personal and home loans. Information regarding government services is also laid out by sector, providing quick and effi cient access to com-prehensive data. u
http://www.tunisie.gov.tn
18
World e-government rankings United Nations E-Government Survey 20121 Chapter One
value (0.4209) reaching 120th. Algeria increased its e-government development value by 13 per cent and maintained its global rank. Egypt did not improve
much and declined to 107th. South Sudan became the 193rd United Nations Member State and at the same time came online with a world ranking of 175th. At the same time, domestic political turmoil impacted
upon the virtual presence of the Government in Libya (formerly the Libyan Arab Jamahiriya), which went offl ine at the time of the survey assessment.
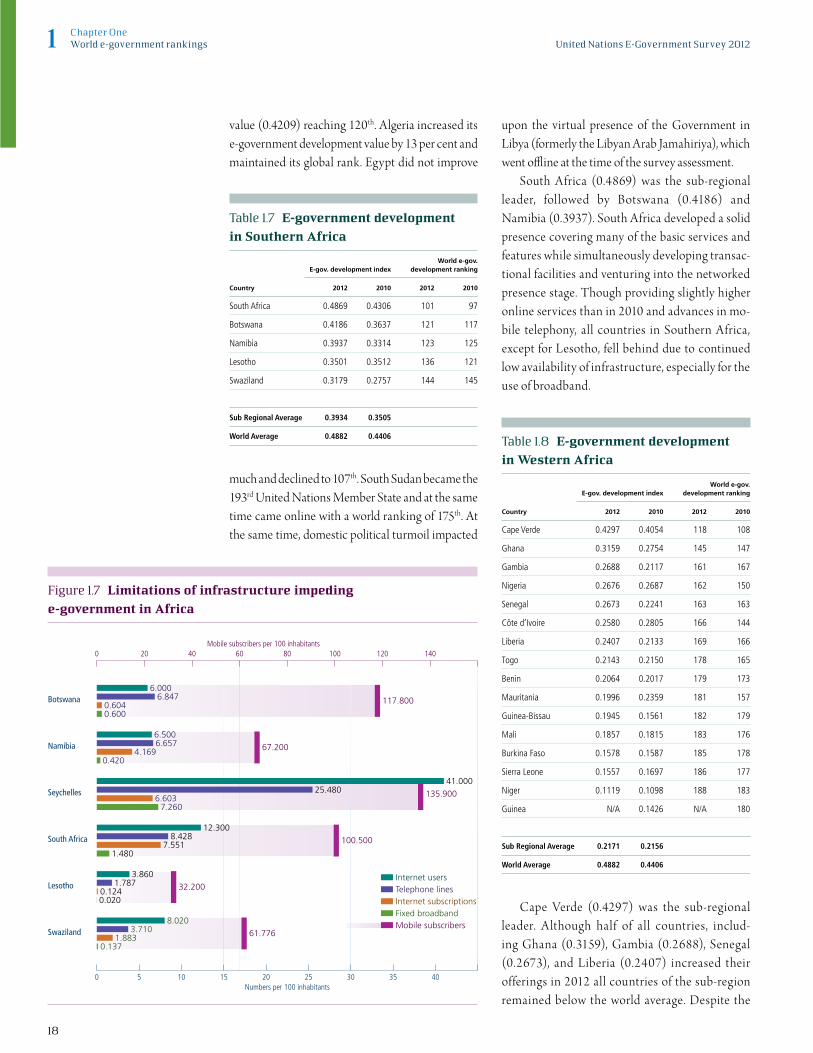
South Africa (0.4869) was the sub-regional leader, fol lowed by Botswana (0.4186) and Namibia (0.3937). South Africa developed a solid presence covering many of the basic services and features while simultaneously developing transac-tional facilities and venturing into the networked presence stage. Though providing slightly higher online services than in 2010 and advances in mo-bile telephony, all countries in Southern Africa, except for Lesotho, fell behind due to continued low availability of infrastructure, especially for the use of broadband.
Cape Verde (0.4297) was the sub-regional leader. A lthough half of al l countries, includ-ing Ghana (0.3159), Gambia (0.2688), Senegal (0.2673), and Liberia (0.2407) increased their offerings in 2012 all countries of the sub-region remained below the world average. Despite the
Table 1.7 E-government development
in Southern Africa
Country
E-gov. development indexWorld e-gov.
development ranking
2012 2010 2012 2010
South Africa 0.4869 0.4306 101 97
Botswana 0.4186 0.3637 121 117
Namibia 0.3937 0.3314 123 125
Lesotho 0.3501 0.3512 136 121
Swaziland 0.3179 0.2757 144 145
Sub Regional Average 0.3934 0.3505
World Average 0.4882 0.4406 Table 1.8 E-government development
in Western Africa
Country
E-gov. development indexWorld e-gov.
development ranking
2012 2010 2012 2010
Cape Verde 0.4297 0.4054 118 108
Ghana 0.3159 0.2754 145 147
Gambia 0.2688 0.2117 161 167
Nigeria 0.2676 0.2687 162 150
Senegal 0.2673 0.2241 163 163
Côte d’Ivoire 0.2580 0.2805 166 144
Liberia 0.2407 0.2133 169 166
Togo 0.2143 0.2150 178 165
Benin 0.2064 0.2017 179 173
Mauritania 0.1996 0.2359 181 157
Guinea-Bissau 0.1945 0.1561 182 179
Mali 0.1857 0.1815 183 176
Burkina Faso 0.1578 0.1587 185 178
Sierra Leone 0.1557 0.1697 186 177
Niger 0.1119 0.1098 188 183
Guinea N/A 0.1426 N/A 180
Sub Regional Average 0.2171 0.2156
World Average 0.4882 0.4406
Figure 1.7 Limitations of infrastructure impeding
e-government in Africa
117.800
67.200
135.900
100.500
32.200
61.776
14012010080Mobile subscribers per 100 inhabitants
6040200
3.8601.787
0.124
0.1371.883
3.7108.020
6.000
6.5006.657
4.1690.420
7.2606.603
12.3008.428
7.5511.480
6.8470.6040.600
41.00025.480
0.020
Internet usersTelephone linesInternet subscriptionsFixed broadbandMobile subscribers
0 5 10 15 20Numbers per 100 inhabitants
25 30 35 40
Botswana
Namibia
Seychelles
South Africa
Lesotho
Swaziland
19
World e-government rankingsUnited Nations E-Government Survey 2012 1Chapter One
upsurge in mobile telephony online in recent years, ser vices in A frica remain circumscribed by lack of infrastructure.
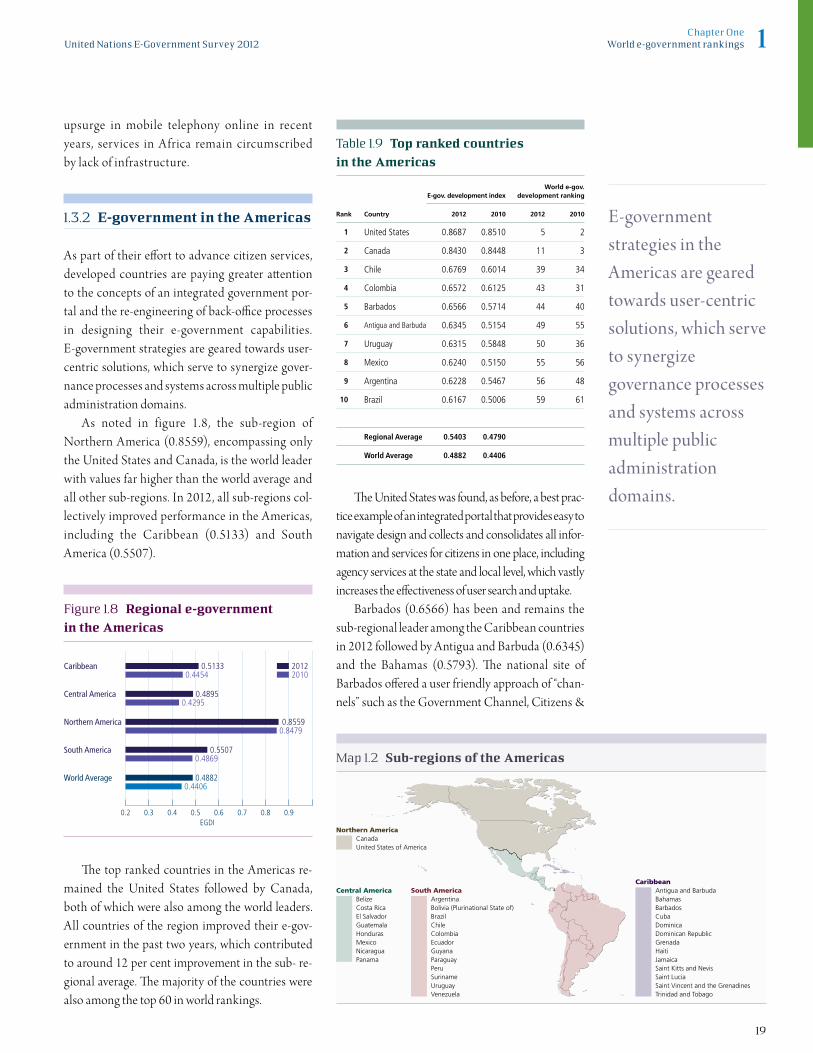
1.3.2 E-government in the Americas
As part of their eff ort to advance citizen services, developed countries are paying greater att ention to the concepts of an integrated government por-tal and the re-engineering of back-offi ce processes in designing their e-government capabilities. E-government strategies are geared towards user-centric solutions, which serve to synergize gover-nance processes and systems across multiple public administration domains.
As noted in figure 1.8, the sub-region of Northern America (0.8559), encompassing only the United States and Canada, is the world leader with values far higher than the world average and all other sub-regions. In 2012, all sub-regions col-lectively improved performance in the Americas, including the Caribbean (0.5133) and South America (0.5507).
Th e top ranked countries in the Americas re-mained the United States followed by Canada, both of which were also among the world leaders. All countries of the region improved their e-gov-ernment in the past two years, which contributed to around 12 per cent improvement in the sub- re-gional average. Th e majority of the countries were also among the top 60 in world rankings.
Th e United States was found, as before, a best prac-tice example of an integrated portal that provides easy to navigate design and collects and consolidates all infor-mation and services for citizens in one place, including agency services at the state and local level, which vastly increases the eff ectiveness of user search and uptake.
Barbados (0.6566) has been and remains the sub-regional leader among the Caribbean countries in 2012 followed by Antigua and Barbuda (0.6345) and the Bahamas (0.5793). Th e national site of Barbados off ered a user friendly approach of “chan-nels” such as the Government Channel, Citizens &
E-government strategies in the Americas are geared towards user-centric solutions, which serve to synergize governance processes and systems across multiple public administration domains.
Map 1.2 Sub-regions of the Americas
CaribbeanAntigua and BarbudaBahamasBarbadosCubaDominicaDominican RepublicGrenadaHaitiJamaicaSaint Kitts and NevisSaint LuciaSaint Vincent and the GrenadinesTrinidad and Tobago
Northern AmericaCanadaUnited States of America
Central AmericaBelizeCosta RicaEl SalvadorGuatemalaHondurasMexicoNicaraguaPanama
South AmericaArgentinaBolivia (Plurinational State of)BrazilChileColombiaEcuadorGuyanaParaguayPeruSurinameUruguayVenezuela
Figure 1.8 Regional e-government
in the Americas
20122010
0.48690.5507
0.8559
0.4895
0.5133
0.4882
0.8479
0.4295
0.4454
0.4406
0.40.30.2 0.5 0.6EGDI
0.7 0.8 0.9
Caribbean
Central America
Northern America
South America
World Average
Table 1.9 Top ranked countries
in the Americas
Rank Country
E-gov. development indexWorld e-gov.
development ranking
2012 2010 2012 2010
1 United States 0.8687 0.8510 5 2
2 Canada 0.8430 0.8448 11 3
3 Chile 0.6769 0.6014 39 34
4 Colombia 0.6572 0.6125 43 31
5 Barbados 0.6566 0.5714 44 40
6 Antigua and Barbuda 0.6345 0.5154 49 55
7 Uruguay 0.6315 0.5848 50 36
8 Mexico 0.6240 0.5150 55 56
9 Argentina 0.6228 0.5467 56 48
10 Brazil 0.6167 0.5006 59 61
Regional Average 0.5403 0.4790
World Average 0.4882 0.4406

20
World e-government rankings United Nations E-Government Survey 20121 Chapter One
Residents Channel, Businesses Channel, etc., mak-ing it easier for the user to fi nd relevant information. Moving towards transactional off erings, it allowed for calculation of land taxes.
Improvements in online off erings along with investments in telecommunications and human capital allowed Antigua and Barbuda to advance to a world ranking of 49th in 2012. Similarly, in Dominica and in Grenada, substantial investments in access infrastructure, especially broadband, con-tributed to an advance in world rankings.
All countries of the Central America sub-region increased their offerings in 2012. Mexico (0.6240) was the leader with e-government offerings around 27 per cent higher than other countries of the sub-region. Closely following Mexico as number two in the sub-region, Panama (0.5733) improved its world ranking from 79 in 2010 to 66 in 2012. It is followed by El Salvador (0.5513) and Costa Rica (0.5397). On the other hand, even as mobile te-lephony increased in El Salvador, broadband and other access infrastructure remained low, imped-ing its online service delivery uptake. Other coun-tries of the sub-region that improved e-services are also demonstrating that the expansion of mobile
infrastructure has allowed them to complement, and indeed supplement, traditional access to nar-row the digital divide.
Mexico upgraded its offerings in 2011 to in-clude a comprehensive search service, which in-dexes federal, state and municipal web portals daily. With more than 400 million registries in its index, the national portal greatly expanded online services to citizens, including an open government initiative, special offerings for vulnerable groups, and a facility for the anonymous reporting of is-sues of concern to authorities. It allows for greater inclusion of the citizen through social media such as Twitter and Facebook and is among the select 19 per cent of world countries providing a single sign-on service.
Th ough Panama improved its online services, the main contributor to its advancement in this year’s rankings is the expansion of mobile infra-structure, which is becoming an aff ordable technol-ogy among other countries as well. Panama has one of the highest penetrations of mobile subscribers in the region. As part of its Modernization Plan, to be completed in 2014, Panama is aiming to provide free access to the Internet for all citizens.
Th e United States (0.8687) leads this sub-region followed closely by Canada (0.8430). Since the United Nations Survey started tracking e-gov-ernment development in 2003 both countries have been among the top world leaders with integrated
Table 1.10 E-government development
in the Caribbean
Country
E-gov. development indexWorld e-gov.
development ranking
2012 2010 2012 2010
Barbados 0.6566 0.5714 44 40
Antigua and Barbuda 0.6345 0.5154 49 55
Bahamas 0.5793 0.4871 65 65
Trinidad and Tobago 0.5731 0.4806 67 67
Dominica 0.5561 0.4149 73 105
Grenada 0.5479 0.4277 75 99
Saint Kitts and Nevis 0.5272 0.4691 81 75
Saint Vincent and the Grenadines 0.5177 0.4355 85 94
Dominican Republic 0.5130 0.4557 89 84
Saint Lucia 0.5122 0.4471 90 88
Jamaica 0.4552 0.4467 108 89
Cuba 0.4488 0.4321 110 96
Haiti 0.1512 0.2074 187 169
Sub Regional Average 0.5133 0.4454
World Average 0.4882 0.4406
Table 1.11 E-government development
in Central America
Country
E-gov. development indexWorld e-gov.
development ranking
2012 2010 2012 2010
Mexico 0.6240 0.5150 55 56
Panama 0.5733 0.4619 66 79
El Salvador 0.5513 0.4700 74 73
Costa Rica 0.5397 0.4749 77 71
Guatemala 0.4390 0.3937 112 112
Honduras 0.4341 0.4065 117 107
Belize 0.3923 0.3513 124 120
Nicaragua 0.3621 0.3630 130 118
Sub Regional Average 0.4895 0.4295
World Average 0.4882 0.4406

21
World e-government rankingsUnited Nations E-Government Survey 2012 1Chapter One
portals and increasingly inclusive citizen services spread across theme, functionally and now by life cycle and events. For example, the United States e-government portal (htt p://www.usa.gov) comes
closest to a pure integrated portal with access to in-terlinked searchable information from the United States Government, state governments, and local governments all in one place. Substantial back-offi ce integration has gone into the user interface, which off ers a simple convenient and easy-to-use fa-cility for everything from government departments and agencies to verifying a social security number, gett ing an employer identifi cation number, multiple online participation eff orts and much more.6 Early recognition of the use of ICT for rolling out citizen
Table 1.12 E-government development
in Northern America
Country
E-gov. development indexWorld e-gov.
development ranking
2012 2010 2012 2010
United States 0.8687 0.8510 5 2
Canada 0.8430 0.8448 11 3
Sub Regional Average 0.8559 0.8479
World Average 0.4882 0.4406
Box 1.3 Mexico’s alternative approach
Mexico takes an alternative approach to e-services. Its portal, simply speaking, is a search engine with integrating services that respond to users’ specifi c search criteria. It contains information fi ltering features that allow users to fi lter content in order to nar-row down searches for specifi c information.Th e portal has the ability to fi lter information by image, videos or news, following the style of Google’s main fi ltering features, as well as
being able to fi lter through other themes such as laws at state and federal levels. Users are also able to fi lter information that narrows down search results to those that are near the user. A translation feature allows users to translate their searches into the various lan-guages that Google off ers. Another feature is ‘Th e Government Recommends’ side-bar that suggests useful pages to users so they can quickly gain access to information. u
Figure 1.9 E-government
in Northern America
201220102008200520042003
1.0
0.9
0.8
0.7
0.6
0.5
0.4
0.3
0.2
0.1
0
0.4020 0.4130 0.4267 0.4514 0.44060.4882
Worldaverage
USACanada
EGDI
Table 1.13 E-government development
in South America
Country
E-gov. development indexWorld e-gov.
development ranking
2012 2010 2012 2010
Chile 0.6769 0.6014 39 34
Colombia 0.6572 0.6125 43 31
Uruguay 0.6315 0.5848 50 36
Argentina 0.6228 0.5467 56 48
Brazil 0.6167 0.5006 59 61
Venezuela 0.5585 0.4774 71 70
Peru 0.5230 0.4923 82 63
Ecuador 0.4869 0.4322 102 95
Paraguay 0.4802 0.4243 104 101
Bolivia (Plurinational State of) 0.4658 0.4280 106 98
Guyana 0.4549 0.4140 109 106
Suriname 0.4344 0.3283 116 127
Sub Regional Average 0.5507 0.4869
World Average 0.4882 0.4406
http://www.gob.mx
22
World e-government rankings United Nations E-Government Survey 20121 Chapter One
centric services has contributed to the United States’ top rankings in the last decade. As the fi gures indicate, both the United States and Canada have consistently had e-government development levels far above the world average from 2003 to 2012.
Chile (0.6769) is the sub-regional leader in South America, followed by Colombia (0.6572). Whereas collectively the sub-region improved its e-government development by 13 per cent, of the 12 countries that make up this sub-region all declined in the world rankings except Brazil (0.6167) and Suriname (0.4344), indicating that countries within the region as well as around the world are investing in – and expanding – services faster than the coun-tries of this sub-region.
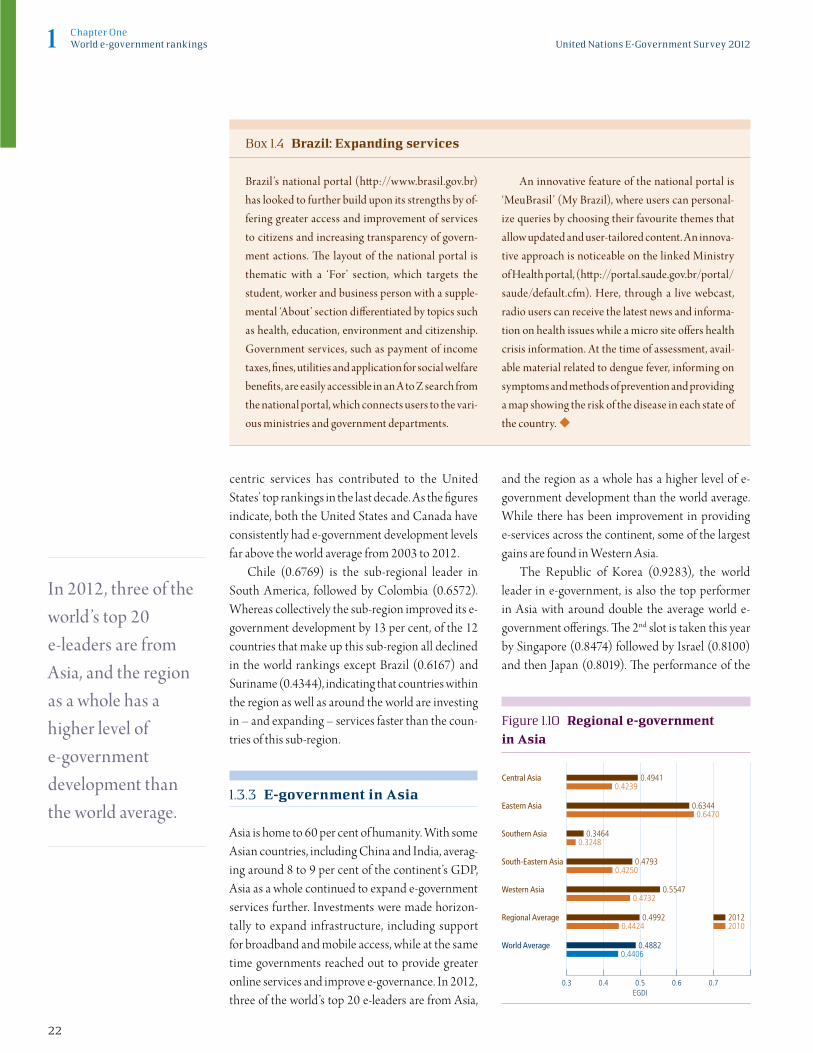
1.3.3 E-government in Asia
Asia is home to 60 per cent of humanity. With some Asian countries, including China and India, averag-ing around 8 to 9 per cent of the continent’s GDP, Asia as a whole continued to expand e-government services further. Investments were made horizon-tally to expand infrastructure, including support for broadband and mobile access, while at the same time governments reached out to provide greater online services and improve e-governance. In 2012, three of the world’s top 20 e-leaders are from Asia,
and the region as a whole has a higher level of e-government development than the world average. While there has been improvement in providing e-services across the continent, some of the largest gains are found in Western Asia.
The Republic of Korea (0.9283), the world leader in e-government, is also the top performer in Asia with around double the average world e-government off erings. Th e 2nd slot is taken this year by Singapore (0.8474) followed by Israel (0.8100) and then Japan (0.8019). Th e performance of the
In 2012, three of the world’s top 20 e-leaders are from Asia, and the region as a whole has a higher level of e-government development than the world average.
Figure 1.10 Regional e-government
in Asia
0.48820.4406
0.47320.5547
0.42500.4793
0.42390.4941
0.64700.6344
0.32480.3464
0.49920.4424
20122010
0.4 0.5EGDI
0.6 0.70.3
Central Asia
Eastern Asia
Southern Asia
South-Eastern Asia
Western Asia
Regional Average
World Average
Box 1.4 Brazil: Expanding services
Brazil’s national portal (htt p://www.brasil.gov.br) has looked to further build upon its strengths by of-fering greater access and improvement of services to citizens and increasing transparency of govern-ment actions. Th e layout of the national portal is thematic with a ‘For’ section, which targets the student, worker and business person with a supple-mental ‘About’ section diff erentiated by topics such as health, education, environment and citizenship. Government services, such as payment of income taxes, fi nes, utilities and application for social welfare benefi ts, are easily accessible in an A to Z search from the national portal, which connects users to the vari-ous ministries and government departments.
An innovative feature of the national portal is ‘MeuBrasil’ (My Brazil), where users can personal-ize queries by choosing their favourite themes that allow updated and user-tailored content. An innova-tive approach is noticeable on the linked Ministry of Health portal, (htt p://portal.saude.gov.br/portal/saude/default.cfm). Here, through a live webcast, radio users can receive the latest news and informa-tion on health issues while a micro site off ers health crisis information. At the time of assessment, avail-able material related to dengue fever, informing on symptoms and methods of prevention and providing a map showing the risk of the disease in each state of the country. u
23
World e-government rankingsUnited Nations E-Government Survey 2012 1Chapter One
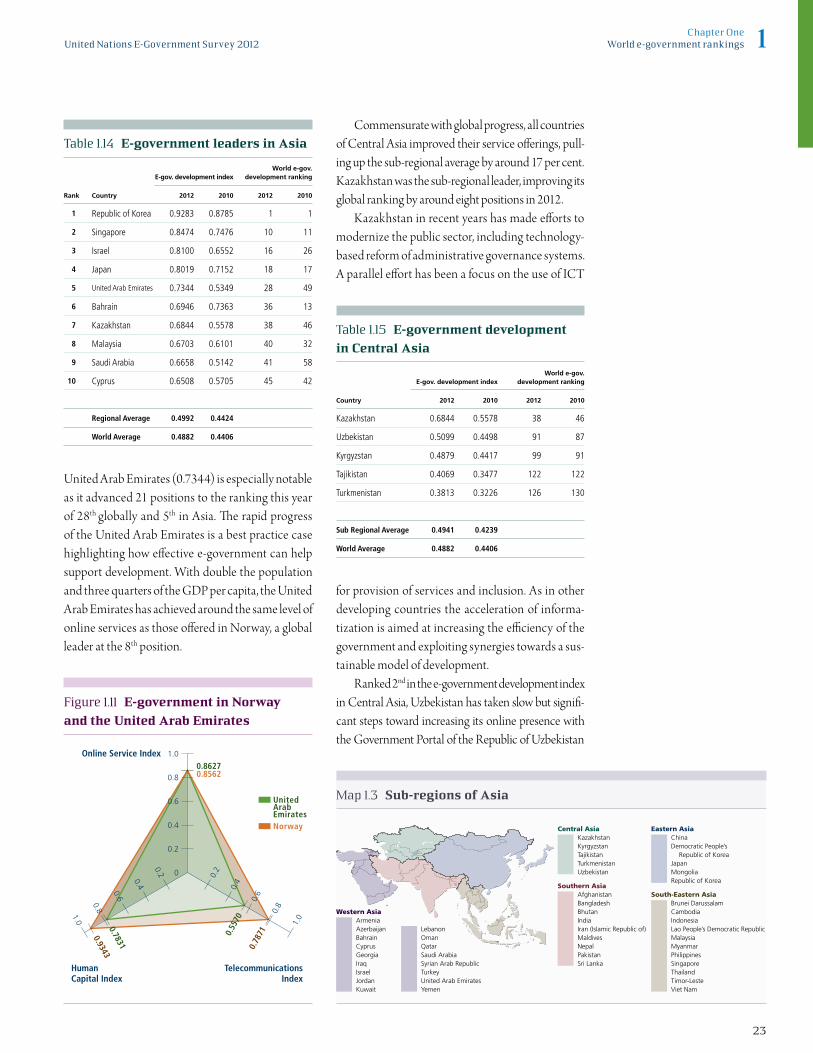
United Arab Emirates (0.7344) is especially notable as it advanced 21 positions to the ranking this year of 28th globally and 5th in Asia. Th e rapid progress of the United Arab Emirates is a best practice case highlighting how eff ective e-government can help support development. With double the population and three quarters of the GDP per capita, the United Arab Emirates has achieved around the same level of online services as those off ered in Norway, a global leader at the 8th position.
Commensurate with global progress, all countries of Central Asia improved their service off erings, pull-ing up the sub-regional average by around 17 per cent. Kazakhstan was the sub-regional leader, improving its global ranking by around eight positions in 2012.
Kazakhstan in recent years has made eff orts to modernize the public sector, including technology-based reform of administrative governance systems. A parallel eff ort has been a focus on the use of ICT
for provision of services and inclusion. As in other developing countries the acceleration of informa-tization is aimed at increasing the effi ciency of the government and exploiting synergies towards a sus-tainable model of development.
Ranked 2nd in the e-government development index in Central Asia, Uzbekistan has taken slow but signifi -cant steps toward increasing its online presence with the Government Portal of the Republic of Uzbekistan
Table 1.14 E-government leaders in Asia
Rank Country
E-gov. development indexWorld e-gov.
development ranking
2012 2010 2012 2010
1 Republic of Korea 0.9283 0.8785 1 1
2 Singapore 0.8474 0.7476 10 11
3 Israel 0.8100 0.6552 16 26
4 Japan 0.8019 0.7152 18 17
5 United Arab Emirates 0.7344 0.5349 28 49
6 Bahrain 0.6946 0.7363 36 13
7 Kazakhstan 0.6844 0.5578 38 46
8 Malaysia 0.6703 0.6101 40 32
9 Saudi Arabia 0.6658 0.5142 41 58
10 Cyprus 0.6508 0.5705 45 42
Regional Average 0.4992 0.4424
World Average 0.4882 0.4406
Map 1.3 Sub-regions of Asia
Eastern AsiaChinaDemocratic People’s Republic of KoreaJapanMongoliaRepublic of Korea
South-Eastern AsiaBrunei DarussalamCambodiaIndonesiaLao People’s Democratic RepublicMalaysiaMyanmarPhilippinesSingaporeThailandTimor-LesteViet Nam
Central AsiaKazakhstanKyrgyzstanTajikistanTurkmenistanUzbekistan
Southern AsiaAfghanistanBangladeshBhutanIndiaIran (Islamic Republic of)MaldivesNepalPakistanSri Lanka
Western AsiaArmeniaAzerbaijanBahrainCyprusGeorgiaIraqIsraelJordanKuwait
LebanonOmanQatarSaudi ArabiaSyrian Arab RepublicTurkeyUnited Arab EmiratesYemen
Figure 1.11 E-government in Norway
and the United Arab Emirates
Norway
UnitedArabEmirates
1.0
0.8
0.6
0.4
0.2
0
0.2
0.4
0.6
0.8
1.0
0.2
0.4
0.6
0.8
1.0
0.85620.8627
0.93430.7831
0.55
70
0.78
71
Online Service Index
Human Capital Index
TelecommunicationsIndex
Table 1.15 E-government development
in Central Asia
Country
E-gov. development indexWorld e-gov.
development ranking
2012 2010 2012 2010
Kazakhstan 0.6844 0.5578 38 46
Uzbekistan 0.5099 0.4498 91 87
Kyrgyzstan 0.4879 0.4417 99 91
Tajikistan 0.4069 0.3477 122 122
Turkmenistan 0.3813 0.3226 126 130
Sub Regional Average 0.4941 0.4239
World Average 0.4882 0.4406

24
World e-government rankings United Nations E-Government Survey 20121 Chapter One
(htt p://www.gov.uz). Th ough the country slipped in overall rank, it improved its services by around 13 per cent. If several years ago the website was merely infor-mative and not at all interactive, government initiative and consequent legislative changes in 2007 and 2009 made possible a more comprehensive e-government portal. Compared to its earlier versions, the national site has added the following notable characteristics and fea-tures: eff ective organization of information; integrated archived information (laws, policies, etc.); an increased number of ministries linked to the portal; technical and web design features (RSS, audio, video, language, etc.) and static online downloadable forms.
Th e Republic of Korea off ers around 87 per cent of all services assessed in the United Nations E-Government Survey 2012. Th e country’s emer-gence as the world leader in information and communication technologies in fi elds such as broad-band, semiconductors and third generation mobile devices – has guaranteed its fast growth and devel-opment in the area of e-government. Japan follows as number two in the sub-region, at 18th in world e-government development rankings. It is notable that all countries of Eastern Asia improved their service off erings and that the Democratic People’s Republic of Korea came online.
Box 1.6 World leader in e-government development 2012: Republic of Korea
Th e Government’s main website has devel-oped into an integrated portal where citizens can fi nd almost every service they want, on both national and local level. The main government portal is a gateway to services through multiple channels, by theme and subjects; citizens can also have a custom-ized channel by inputt ing their own age, gender and services of interest. Back-offi ce integration across many departments brings together a powerful search engine off ering advanced categorizing function, which can list results by websites, services, and news, including at the local level.
A key reason for continued leadership in world e-government progress is signifi cant development and provision of download-able mobile applications that are available from its national portal. Th e cross sector mobile apps for citizens are both iPhone and Android compatible including for e-Learn-ing, which allows students to learn on their mobile phone in areas such as social stud-ies, math and English. For employment op-portunities, Jobcast provides information on availability of jobs in the Republic of Korea along with the relevant legislation govern-ing labour. u
Box 1.5 Integrated services in Kazakhstan
Th e offi cial homepage provides more than 1300 codes, laws, decrees, and orders with all legislation integrated into the main site. Each e-service has several icons stat-ing whether this service can be paid online or obtained through electronic signature. Th ere are other convenient sites such as ePay (http://w w w.epay.gov.kz) and eLicense (http://www.elicense.kz) where you can get specifi c services and payments. Another site, (htt p://www.goszakup.gov.kz), off ers
participation online in almost all procure-ment procedures. Th e main driver behind the improvement in services is the elec-tronic public procurement portal featuring digitization of 59 e-services of state bodies, the e-license database, frequent open public web conferences, oft en with the with active participation of high-level government offi -cials, and blog platforms in many ministries and agencies. u
http://www.korea.go.kr
http://www.e.gov.kz
25
World e-government rankingsUnited Nations E-Government Survey 2012 1Chapter One
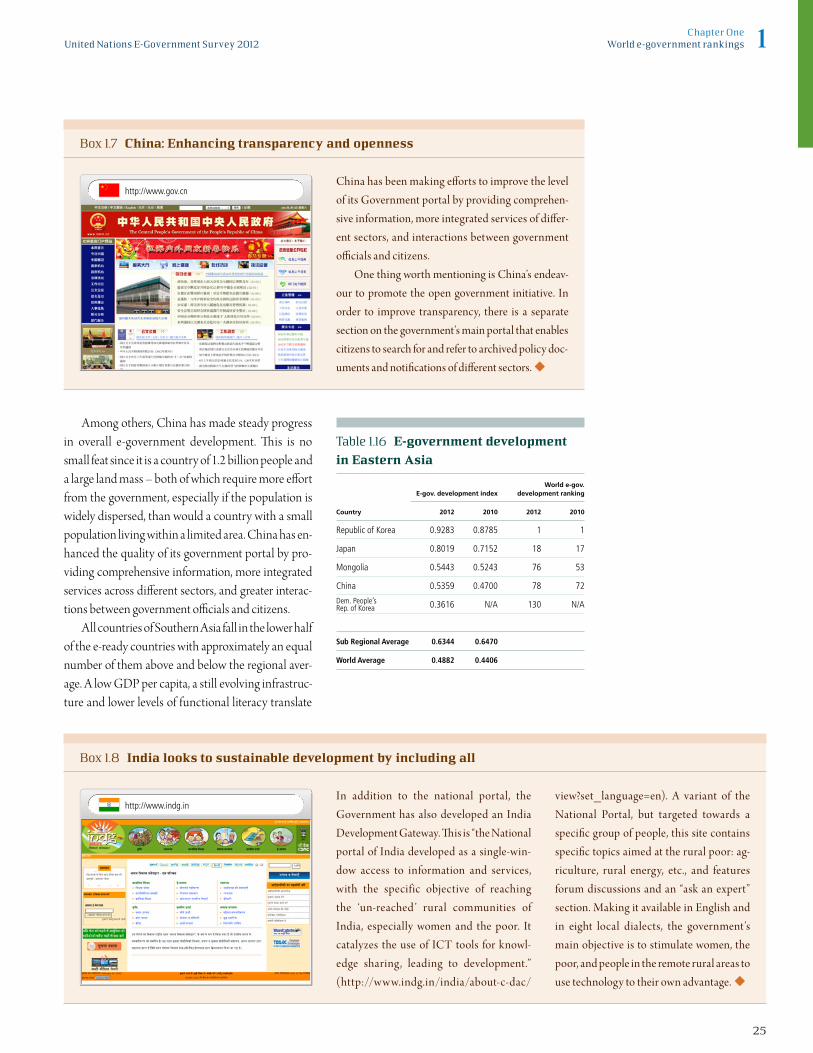
Among others, China has made steady progress in overall e-government development. Th is is no small feat since it is a country of 1.2 billion people and a large land mass – both of which require more eff ort from the government, especially if the population is widely dispersed, than would a country with a small population living within a limited area. China has en-hanced the quality of its government portal by pro-viding comprehensive information, more integrated services across diff erent sectors, and greater interac-tions between government offi cials and citizens.
All countries of Southern Asia fall in the lower half of the e-ready countries with approximately an equal number of them above and below the regional aver-age. A low GDP per capita, a still evolving infrastruc-ture and lower levels of functional literacy translate
Box 1.7 China: Enhancing transparency and openness
China has been making eff orts to improve the level of its Government portal by providing comprehen-sive information, more integrated services of diff er-ent sectors, and interactions between government offi cials and citizens.
One thing worth mentioning is China’s endeav-our to promote the open government initiative. In order to improve transparency, there is a separate section on the government’s main portal that enables citizens to search for and refer to archived policy doc-uments and notifi cations of diff erent sectors. u
Table 1.16 E-government development
in Eastern Asia
Country
E-gov. development indexWorld e-gov.
development ranking
2012 2010 2012 2010
Republic of Korea 0.9283 0.8785 1 1
Japan 0.8019 0.7152 18 17
Mongolia 0.5443 0.5243 76 53
China 0.5359 0.4700 78 72
Dem. People’s Rep. of Korea 0.3616 N/A 130 N/A
Sub Regional Average 0.6344 0.6470
World Average 0.4882 0.4406
Box 1.8 India looks to sustainable development by including all
In addition to the national portal, the Government has also developed an India Development Gateway. Th is is “the National portal of India developed as a single-win-dow access to information and services, with the specific objective of reaching the ‘un-reached’ rural communities of India, especially women and the poor. It catalyzes the use of ICT tools for knowl-edge sharing, leading to development.” (http://w w w.indg.in/india/about-c-dac/
view?set_language=en). A variant of the National Portal, but targeted towards a specifi c group of people, this site contains specifi c topics aimed at the rural poor: ag-riculture, rural energy, etc., and features forum discussions and an “ask an expert” section. Making it available in English and in eight local dialects, the government’s main objective is to stimulate women, the poor, and people in the remote rural areas to use technology to their own advantage. u
http://www.gov.cn
http://www.indg.in

26
World e-government rankings United Nations E-Government Survey 20121 Chapter One
into low service provision and user uptake for the ma-jority of the populations of India, Bangladesh, Bhutan, Pakistan and Nepal, with e-government development levels ranging from 0.2664 to 0.3829.
Maldives (0.4994) leads in the sub-region fol-lowed by the Islamic Republic of Iran (0.4876) and then Sri Lanka (0.4357). Service provision in Maldives builds on providing easy access to informa-tion to citizens and businesses. Th rough an ‘I Want To’ section organized by theme and life cycle, users can fi nd information on service procedures, includ-ing how to obtain driver licenses, obtain ID cards and register vehicles. Th e national site of the Islamic Republic of Iran is available in two languages: Persian and English. Transactional service off erings in the Islamic Republic of Iran are joint public-private part-nerships with some available online but also though banks and other local and national institutions.
Box 1.9 Pakistan in the forefront of e-passport
In Pakistan, the Ministry of Interior and the National Database and Registration Authority (NADRA ) have introduced a chip-based e-passport that would help fur-ther secure the identity of the citizens, making Pakistan one of the fi rst countries in the world to issue the Multi-biometric e-Passport compliant with ICAO standards.Th e e-Passport solution uses security features on the data page supported by sophisticated technology and business logic, which makes it one of the most modern passports of this era. NADRA has already issued the passports to millions of Pakistani citizens. u
Box 1.10 Singapore in the vanguard of countries
Singapore is among the leaders in the use of private cloud computing for leverag-ing ICT infrastructure and services. In September 2009, it became the first gov-ernment in Asia to equip all its teachers with Web 2.0 communication and collabo-ration tools under an open standard cloud platform. Singapore’s citizen’s portal pro-vides an extensive range of online payment
services that lists by agency as well as bill type. Payments range from taxes, fees, fines and licenses that can be made through multichannels such as credit card, direct debit as well as internet banking and even by phone. u
Table 1.17 E-government development
in Southern Asia
Country
E-gov. development indexWorld e-gov.
development ranking
2012 2010 2012 2010
Maldives 0.4994 0.4392 95 92
Iran (Islamic Republic of) 0.4876 0.4234 100 102
Sri Lanka 0.4357 0.3995 115 111
India 0.3829 0.3567 125 119
Bangladesh 0.2991 0.3028 150 134
Bhutan 0.2942 0.2598 152 152
Pakistan 0.2823 0.2755 156 146
Nepal 0.2664 0.2568 164 153
Afghanistan 0.1701 0.2098 184 168
Sub Regional Average 0.3464 0.3248
World Average 0.4882 0.4406
http://www.nadra.gov.pk
http://www.ecitizen.gov.sg
27
World e-government rankingsUnited Nations E-Government Survey 2012 1Chapter One
With 1.2 billion people and challenges associ-ated with a large population, e-services in India are in the formative stage. Th e Government of India has made substantial eff orts in the last few years to overcome the challenges, including that of connec-tivity to its 70 per cent rural population. Looking towards sustainable growth the government has announced that Rural Broadband Connectivity to all 250,000 Panchayats (local governments) in the country will be provided in three years to bridge the digital divide.7
Other countries in the sub-region such as Pakistan are also providing more e-services. In line with the Government of Pakistan’s policy to digitize e-services, the Multi-biometric e-Passport project aims at improving transparency in the public sphere.
Tenth in the world rank ing , Singapore (0.8474) is the leader in the South Eastern Asia region and a best practice example. It is among
Table 1.18 E-government development
in South-Eastern Asia
Country
E-gov. development indexWorld e-gov.
development ranking
2012 2010 2012 2010
Singapore 0.8474 0.7476 10 11
Malaysia 0.6703 0.6101 40 32
Brunei Darussalam 0.6250 0.4796 54 68
Viet Nam 0.5217 0.4454 83 90
Philippines 0.5130 0.4637 88 78
Thailand 0.5093 0.4653 92 76
Indonesia 0.4949 0.4026 97 109
Lao People’s Dem. Rep. 0.2935 0.2637 153 151
Cambodia 0.2902 0.2878 155 140
Myanmar 0.2703 0.2818 160 141
Timor-Leste 0.2365 0.2273 170 162
Sub Regional Average 0.4793 0.4250
World Average 0.4882 0.4406
Box 1.11 Israel consolidates e-services
Israel has improved its e-government development and has now become the leading country in the Western Asia region. Th e Government portal is well organized. Citizens can access information on government services in three diff erent ways: by target audience, topics and life events. Citizens can also use the portal’s electronic identity management feature ‘My Gov’ to fi lter content that interests them and to access the full range of online government services and make online payments. u
Box 1.12 Saudi Arabia off ers innovative e-services
A big development in the Saudi e-services is the eDash-board portal, which verifi es the identity of the citizen (Digital Verifi cation) and serves as a single sign-on portal where citizens can access all services provided. Th e Saudi Government also off ers an Open Data Initiative, which provides citizens with documents and reports from min-istries and government agencies, all publicly available. It encourages e-participation to gather public opinion through surveys, public consultations and blogs. u
http://www.gov.il/fi rstGov
http://www.saudi.gov.sa
28
World e-government rankings United Nations E-Government Survey 20121 Chapter One
the vanguard countries employing advanced technology for innovative future solutions, orga-nizing information in a seamless structured and user-targeted manner. Malaysia (0.6703) contin-ues to be the 2nd leading country in the South-Eastern Asia region in 2012, not least because of its impressive service provision through an A-Z topics section as well as a life cycle feature target-ing the user as a child, teenager, adult or elderly person. A n impressive national health portal, MyHealth , uses ICT to inform citizens on health issues in Malaysia.
Like other leading countries, the key to the ad-vancement of Israel, the leader in Western Asia, is its integrated approach to e-government development. Israel has added 10 points to its ranking, advancing from 26th position in 2010 to 16th in 2012.
Close behind are Saudi Arabia (0.6658) and Qatar (0.6405), both of which have undertaken to expand citizen centric services as refl ected in their notable performance, which raised their global rankings to 41st and 48th respectively. Th e principle goals of the Saudi Arabian e-government off erings are to raise the productivity and effi ciency of the public sector, increase the return on investment in ICT and provide easy-to-use, timely accurate ser-vices. A separate e-payment portal has been devel-oped through which citizens are able to handle all online transactions.
In accordance with the strategy of the Supreme Council of Information and Communication Technology (ictQATAR), Qatar developed a stra-tegic plan for the implementation of an integrated government programme. Th e plan aims to provide
an enabling ICT environment through legislation, policies, guidelines and standards, such as the e-commerce policy, security policy, and data protec-tion policy. It addresses ICT ‘readiness’ by off ering e-services through a unifi ed system of government networks; provides a centralized, secure, govern-ment data centre and a payment platform; and seeks
Box 1.13 Qatar’s Hukoomi: Working towards integration
Hukoomi, Qatar’s offi cial government gate-way that integrates government services, programmes and initiatives. Among its goals are to improve effi ciency, responsive-ness to users and accessible to all. Accessible through the Internet as well as a mobile de-vice, Hukoomi integrates back-offi ce pro-cesses to allow easy access to over 100 topics and articles with detailed information about
Qatari law and society. Th e portal provides direct links to sub-portals, such as on the employment and recruitment service and e-tendering; and links to application forms from a wide range of government ministries, agencies and public services.8 u
Table 1.19 E-government development
in Western Asia
Country
E-gov. development indexWorld e-gov.
development ranking
2012 2010 2012 2010
Israel 0.8100 0.6552 16 26
United Arab Emirates 0.7344 0.5349 28 49
Bahrain 0.6946 0.7363 36 13
Saudi Arabia 0.6658 0.5142 41 58
Cyprus 0.6508 0.5705 45 42
Qatar 0.6405 0.4928 48 62
Kuwait 0.5960 0.5290 63 50
Oman 0.5944 0.4576 64 82
Georgia 0.5563 0.4248 72 100
Turkey 0.5281 0.4780 80 69
Lebanon 0.5139 0.4388 87 93
Armenia 0.4997 0.4025 94 110
Azerbaijan 0.4984 0.4571 96 83
Jordan 0.4884 0.5278 98 51
Syrian Arab Republic 0.3705 0.3103 128 133
Iraq 0.3409 0.2996 137 136
Yemen 0.2472 0.2154 167 164
Sub Regional Average 0.5547 0.4732
World Average 0.4882 0.4406
http://portal.www.gov.qa/wps/portal/frontpage

29
World e-government rankingsUnited Nations E-Government Survey 2012 1Chapter One
to improve ‘usage’ by increasing the number of e-services such as businesses’ registration, visa ser-vices and resident permits. Hukoomi, the national portal of Qatar, integrates back-offi ce processes to allow easy access to over 100 topics and articles with detailed information about Qatari law and society. Online services available include, among others, payment for utilities, renewal of health cards, sett lement of traffi c violations, visa applica-tions, and licenses.
1.3.4 E-government in Europe
Europe as a region has been in the vanguard of in-formation technology and sett ing the pace for others to follow. Building on the existing strength of high levels of human capital and infrastructure, the trans-formative role of ICT has been recognized and ad-opted to further streamline e-government services. Moving beyond improving public sector effi ciency, Europe is now looking to adapt innovative technolo-gies to human development and economic sustain-ability in the future.
Th e European region has the highest level of e-government development, which is around 50 per cent higher than that of the world as a whole. Western and Northern Europe off er the most on-line services but considerable gains were made by Southern and Eastern Europe as well in 2012.
With a common e-government framework, EU countries are encouraged to deploy advanced technologies, institute bett er governance and pro-vide expanded services with concomitant pursuit of greater transparency, effi ciency and inclusion. Notwithstanding, diff erences remain between re-gions and within them. Key European countries spend more than double the EU average amount per capita on ICT; others, around half of it.
The Netherlands (0.9125) made substantial gains, advancing to the top position in Europe and 2nd in world rankings, followed by the United K ingdom (0.8960) in 3rd place and Denmark (0.8889), which also advanced and occupies the
Moving from improving public sector efficiency, Europe looks to take this role further in adapting innovative technologies to human development and economic sustainability in the future.
Map 1.4 Sub-regions of Europe
Eastern EuropeBelarusBulgariaCzech RepublicHungaryPolandRepublic of MoldovaRomaniaRussian FederationSlovakiaUkraine
Northern EuropeDenmarkEstoniaFinlandIcelandIrelandLatviaLithuaniaNorwaySwedenUnited Kingdom of Great Britain and Northern Ireland
Southern EuropeAlbaniaAndorraBosnia and HerzegovinaCroatiaGreeceItalyMaltaMontenegro
PortugalSan MarinoSerbiaSloveniaSpainThe former Yugoslav Republic of Macedonia
Western EuropeAustriaBelgiumFranceGermanyLiechtensteinLuxembourgMonacoNetherlandsSwitzerland
Figure 1.12 Regional e-government
in Europe
0.71650.8142
0.55660.6574
0.8046
0.6333
0.7188
0.4882
0.7113
0.5449
0.6227
0.440620122010
0.5 0.6EGDI
0.7 0.80.4
Eastern Europe
Northern Europe
Southern Europe
Western Europe
Regional Average
World Average
Table 1.20 Top 10 in Europe
Rank Country
E-gov. development indexWorld e-gov.
development ranking
2012 2010 2012 2010
1 Netherlands 0.9125 0.8097 2 5
2 United Kingdom 0.8960 0.8147 3 4
3 Denmark 0.8889 0.7872 4 7
4 France 0.8635 0.7510 6 10
5 Sweden 0.8599 0.7474 7 12
6 Norway 0.8593 0.8020 8 6
7 Finland 0.8505 0.6967 9 19
8 Liechtenstein 0.8264 0.6694 14 23
9 Switzerland 0.8134 0.7136 15 18
10 Germany 0.8079 0.7309 17 15
Regional Average 0.7188 0.6227
World Average 0.4882 0.4406
30
World e-government rankings United Nations E-Government Survey 20121 Chapter One
4th position this year. Within the aforementioned common e-government framework, all of the top countries of Europe off ered more or less the same level of user centric services to their citizens result-ing in marginal assessment diff erence among them. For example, Germany (0.8079), the 10th leading country in Europe as a whole, achieved about 89 per cent of the e-government development level of the regional leader, the Netherlands.
Advancing 32 positions in the world rankings, the Russian Federation (0.7345) became the leader in Eastern Europe followed by Hungary (0.7201) and the Czech Republic (0.6491).
As in other parts of Europe, all countries of the sub-region improved their e-government develop-ment in 2012, advancing the sub-regional average by 16 per cent even though they could not maintain their rankings, except for Belarus and the Russian Federation. Being the largest country in the world and consisting of eight federal districts infl uences the development of e-government in the Russian Federation. Th e Government recently announced investments of around 80 billion rubles for the in-formatization of federal government bodies and other initiatives related to the development of e-government. In Hungary, the focus of programmes to develop the information society encompassed support for improving ICT skills in the labour
market, targeting small and medium enterprises and increasing the number of ICT experts.
E-services were increasingly the norm in other countries as well. In 2010, Moldova, another country that improved its ranking, in collabora-tion with the World Bank, started implementa-tion of a Strategic Programme for Technological Modernization of the Government, aimed at ICT-led
Table 1.21 E-government development
in Eastern Europe
Country
E-gov. development indexWorld e-gov.
development ranking
2012 2010 2012 2010
Russian Federation 0.7345 0.5136 27 59
Hungary 0.7201 0.6315 31 27
Czech Republic 0.6491 0.6060 46 33
Poland 0.6441 0.5582 47 45
Slovakia 0.6292 0.5639 53 43
Bulgaria 0.6132 0.5590 60 44
Belarus 0.6090 0.4900 61 64
Romania 0.6060 0.5479 62 47
Ukraine 0.5653 0.5181 68 54
Republic of Moldova 0.5626 0.4611 69 80
Sub Regional Average 0.6333 0.5449
World Average 0.4882 0.4406
Box 1.14 EU leads the way to innovative application of ICT to sustainable development
Europe 2020, EU’s growth strategy for the coming decade, involves an innovative use of technology to challenges of economic growth, employment, education, social in-clusion and climate/energy. Expanding the reach, EU countries are looking towards ICT as the key enabling technology to un-derpin future development in the region.
The EU Member States have ear-marked a total of € 9.1 billion for fund-ing ICT over the duration of the Seventh Framework Programme.9 One of the three Flagship Initiatives to achieve Smart Growth in Europe 2020 is the Digital agenda for Europe, a blueprint for creating a single
digital market based on fast or ultra-fast internet and interoperable applications. Targets include: • By 2013: broadband access for all by
2020: access for all to much higher Internet speeds (30 Mbps or above)
• By 2020: 50 per cent more European households with Internet connections above 100 Mbps.Th e strategy for the near future aims at
development of common platforms and ref-erence architectures, interoperability and data exchange standards in order to build a competitive advantage in technology solu-tions, which will yield high value added. u
http://www.europe2020.org
31
World e-government rankingsUnited Nations E-Government Survey 2012 1Chapter One
institutional reform to increase access to informa-tion and promote digital services (e-services), and to improve public administration. By improving the governance frameworks the programme is expected
to result in simplifi cation and consolidation of ad-ministrative procedures leading to transparency and eff ectiveness.
Six out of ten countries of Northern Europe were among the world leaders. Number three in the world, United K ingdom (0.8960) was the leader in Northern Europe followed by Denmark (0.8889 – 4th) and Sweden (0.8599 – 7th).Th e focus on integration of back-offi ce departments for
improvement of user interface is evident in the inte-grated services on the United Kingdom’s DirectGov (htt p://www.direct.gov.uk), which provides a one-stop-shop for all government information and ser-vices. Its comprehensive ‘Do It Online’ page lists all public services, forms, tools and transactions that the government provides in a user-friendly manner. Th e Jobcentre Plus page located on the portal allows citizens to search one of the United Kingdom’s larg-est online databases of job vacancies.
With a focus on service delivery, government na-tional portals are organized according to domains in most of the EU countries. Denmark’s overall strategy appears to go well beyond simply providing a single portal. Rather, it seems to be focusing on multiple entry points to government based on various interest groups and constituencies. Early adoption of online transactional services has resulted in substantial cost effi ciencies. In Denmark, for example, electronic in-voicing saves taxpayers €150 million and businesses €50 million a year. According to one estimate, simi-lar eff orts all across the EU would result in annual savings of around €50 billion.10
In Northern Europe, the progress of Finland was especially noteworthy as it gained 10 positions to rank 9th in the world. Th e National Knowledge Society Strategy 2007-2015 in Finland focuses on the provision of multichannel, interactive e-services together with interoperability of information sys-tems in the public administration. Th e suomi.fi (htt p://www.suomi.fi /suomifi /suomi) portal pro-vides a single access point to online public services off ered from both state and local authorities, orga-nized around daily life events.
Table 1.22 E-government development
in Northern Europe
Country
E-gov. development indexWorld e-gov.
development ranking
2012 2010 2012 2010
United Kingdom 0.8960 0.8147 3 4
Denmark 0.8889 0.7872 4 7
Sweden 0.8599 0.7474 7 12
Norway 0.8593 0.8020 8 6
Finland 0.8505 0.6967 9 19
Estonia 0.7987 0.6965 20 20
Iceland 0.7835 0.6697 22 22
Lithuania 0.7333 0.6295 29 28
Ireland 0.7149 0.6866 34 21
Latvia 0.6604 0.5826 42 37
Sub Regional Average 0.8046 0.7113
World Average 0.4882 0.4406
Box 1.15 Denmark: Providing multiple choices
Denmark ’s services portal is the gateway to the entire public sector in Denmark and provides access to an enormous amount of information and services. It paves the way for an efficient user interface with effective streamlining of public sector departments. The slogan of the page is “your access to the public”. It is, for example, possible to report an address change on this website, apply
for student loans and student grants schol-arships, see and modify tax issues, apply for a state pension, and report changes in income or marital status. Feedback is offered through a mailbox called E-Box, which collects all the mail that the citizen receives from both public authorities and private companies. u
http://www.borger.dk
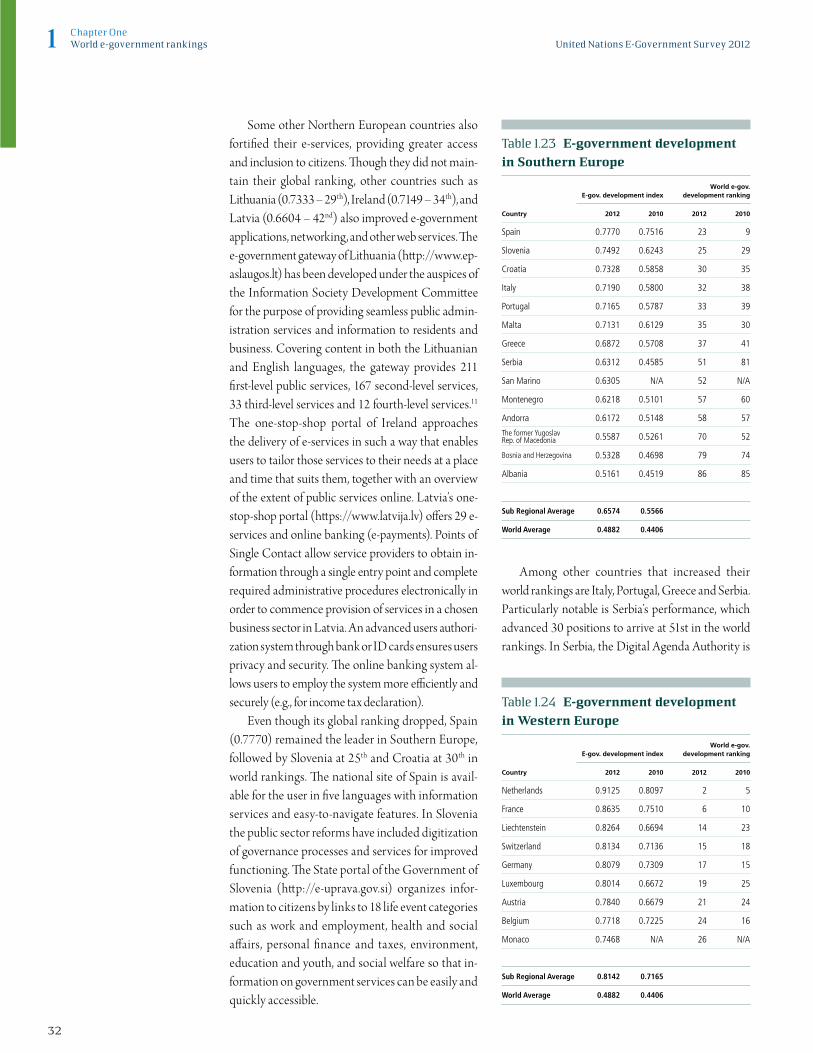
32
World e-government rankings United Nations E-Government Survey 20121 Chapter One
Some other Northern European countries also fortifi ed their e-services, providing greater access and inclusion to citizens. Th ough they did not main-tain their global ranking, other countries such as Lithuania (0.7333 – 29th), Ireland (0.7149 – 34th), and Latvia (0.6604 – 42nd) also improved e-government applications, networking, and other web services. Th e e-government gateway of Lithuania (htt p://www.ep-aslaugos.lt) has been developed under the auspices of the Information Society Development Committ ee for the purpose of providing seamless public admin-istration services and information to residents and business. Covering content in both the Lithuanian and English languages, the gateway provides 211 fi rst-level public services, 167 second-level services, 33 third-level services and 12 fourth-level services.11 The one-stop-shop portal of Ireland approaches the delivery of e-services in such a way that enables users to tailor those services to their needs at a place and time that suits them, together with an overview of the extent of public services online. Latvia’s one-stop-shop portal (htt ps://www.latvija.lv) off ers 29 e-services and online banking (e-payments). Points of Single Contact allow service providers to obtain in-formation through a single entry point and complete required administrative procedures electronically in order to commence provision of services in a chosen business sector in Latvia. An advanced users authori-zation system through bank or ID cards ensures users privacy and security. Th e online banking system al-lows users to employ the system more effi ciently and securely (e.g., for income tax declaration).
Even though its global ranking dropped, Spain (0.7770) remained the leader in Southern Europe, followed by Slovenia at 25th and Croatia at 30th in world rankings. Th e national site of Spain is avail-able for the user in fi ve languages with information services and easy-to-navigate features. In Slovenia the public sector reforms have included digitization of governance processes and services for improved functioning. Th e State portal of the Government of Slovenia (htt p://e-uprava.gov.si) organizes infor-mation to citizens by links to 18 life event categories such as work and employment, health and social aff airs, personal fi nance and taxes, environment, education and youth, and social welfare so that in-formation on government services can be easily and quickly accessible.
Among other countries that increased their world rankings are Italy, Portugal, Greece and Serbia. Particularly notable is Serbia’s performance, which advanced 30 positions to arrive at 51st in the world rankings. In Serbia, the Digital Agenda Authority is
Table 1.24 E-government development
in Western Europe
Country
E-gov. development indexWorld e-gov.
development ranking
2012 2010 2012 2010
Netherlands 0.9125 0.8097 2 5
France 0.8635 0.7510 6 10
Liechtenstein 0.8264 0.6694 14 23
Switzerland 0.8134 0.7136 15 18
Germany 0.8079 0.7309 17 15
Luxembourg 0.8014 0.6672 19 25
Austria 0.7840 0.6679 21 24
Belgium 0.7718 0.7225 24 16
Monaco 0.7468 N/A 26 N/A
Sub Regional Average 0.8142 0.7165
World Average 0.4882 0.4406
Table 1.23 E-government development
in Southern Europe
Country
E-gov. development indexWorld e-gov.
development ranking
2012 2010 2012 2010
Spain 0.7770 0.7516 23 9
Slovenia 0.7492 0.6243 25 29
Croatia 0.7328 0.5858 30 35
Italy 0.7190 0.5800 32 38
Portugal 0.7165 0.5787 33 39
Malta 0.7131 0.6129 35 30
Greece 0.6872 0.5708 37 41
Serbia 0.6312 0.4585 51 81
San Marino 0.6305 N/A 52 N/A
Montenegro 0.6218 0.5101 57 60
Andorra 0.6172 0.5148 58 57
The former Yugoslav Rep. of Macedonia 0.5587 0.5261 70 52
Bosnia and Herzegovina 0.5328 0.4698 79 74
Albania 0.5161 0.4519 86 85
Sub Regional Average 0.6574 0.5566
World Average 0.4882 0.4406
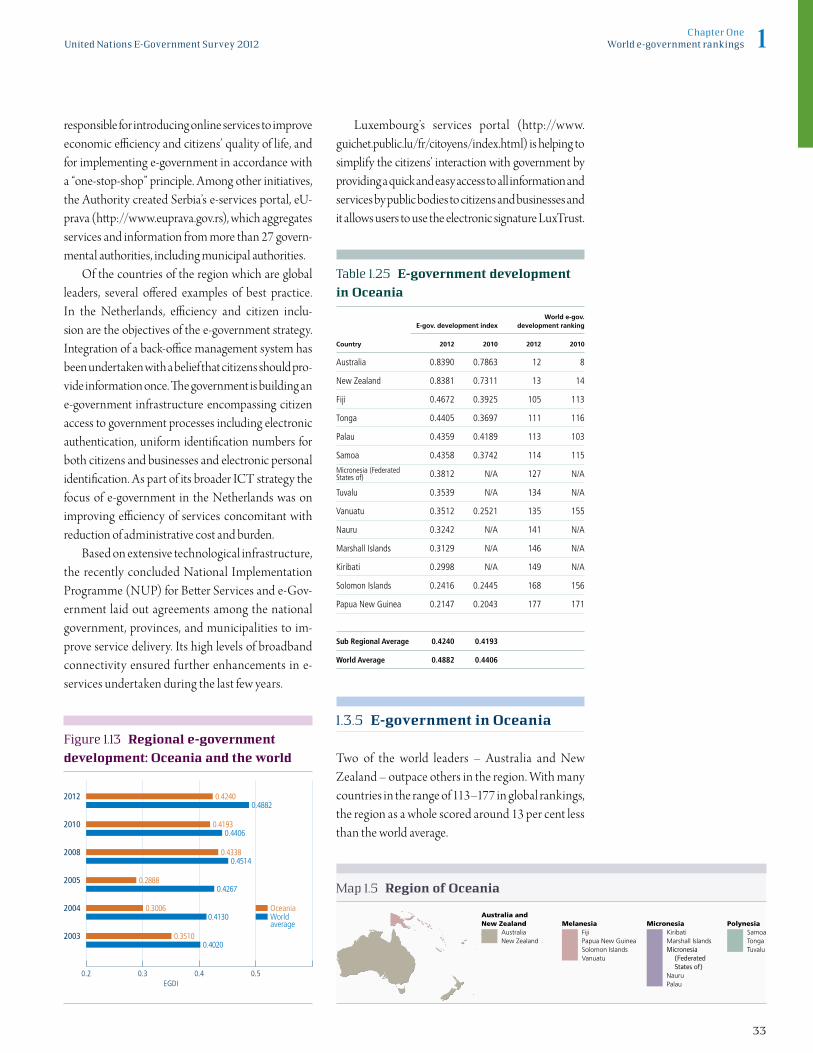
33
World e-government rankingsUnited Nations E-Government Survey 2012 1Chapter One
responsible for introducing online services to improve economic e! ciency and citizens’ quality of life, and for implementing e-government in accordance with a “one-stop-shop” principle. Among other initiatives, the Authority created Serbia’s e-services portal, eU-prava (h" p://www.euprava.gov.rs), which aggregates services and information from more than 27 govern-mental authorities, including municipal authorities.
Of the countries of the region which are global leaders, several o# ered examples of best practice. In the Netherlands, e! ciency and citizen inclu-sion are the objectives of the e-government strategy. Integration of a back-o! ce management system has been undertaken with a belief that citizens should pro-vide information once. $ e government is building an e-government infrastructure encompassing citizen access to government processes including electronic authentication, uniform identi% cation numbers for both citizens and businesses and electronic personal identi% cation. As part of its broader ICT strategy the focus of e-government in the Netherlands was on improving e! ciency of services concomitant with reduction of administrative cost and burden.
Based on extensive technological infrastructure, the recently concluded National Implementation Programme (NUP) for Be" er Services and e-Gov-ernment laid out agreements among the national government, provinces, and municipalities to im-prove service delivery. Its high levels of broadband connectivity ensured further enhancements in e-services undertaken during the last few years.
Luxembourg’s services portal (http://www.guichet.public.lu/fr/citoyens/index.html) is helping to simplify the citizens’ interaction with government by providing a quick and easy access to all information and services by public bodies to citizens and businesses and it allows users to use the electronic signature LuxTrust.
1.3.5 E-government in Oceania
Two of the world leaders – Australia and New Zealand – outpace others in the region. With many countries in the range of 113–177 in global rankings, the region as a whole scored around 13 per cent less than the world average.
Map 1.5 Region of Oceania
Australia and New Zealand
AustraliaNew Zealand
MicronesiaKiribatiMarshall IslandsMicronesia (Federated States of)NauruPalau
MelanesiaFijiPapua New GuineaSolomon IslandsVanuatu
PolynesiaSamoaTongaTuvalu
Figure 1.13 Regional e-government
development: Oceania and the world
0.42400.4882
0.44060.4193
0.4514
0.4267
0.4130
0.40200.3510
0.4338
0.2888
0.3006Worldaverage
Oceania
0.3 0.4EGDI
0.50.2
2012
2010
2008
2005
2004
2003
Table 1.25 E-government development
in Oceania
Country
E-gov. development indexWorld e-gov.
development ranking
2012 2010 2012 2010
Australia 0.8390 0.7863 12 8
New Zealand 0.8381 0.7311 13 14
Fiji 0.4672 0.3925 105 113
Tonga 0.4405 0.3697 111 116
Palau 0.4359 0.4189 113 103
Samoa 0.4358 0.3742 114 115
Micronesia (Federated States of) 0.3812 N/A 127 N/A
Tuvalu 0.3539 N/A 134 N/A
Vanuatu 0.3512 0.2521 135 155
Nauru 0.3242 N/A 141 N/A
Marshall Islands 0.3129 N/A 146 N/A
Kiribati 0.2998 N/A 149 N/A
Solomon Islands 0.2416 0.2445 168 156
Papua New Guinea 0.2147 0.2043 177 171
Sub Regional Average 0.4240 0.4193
World Average 0.4882 0.4406
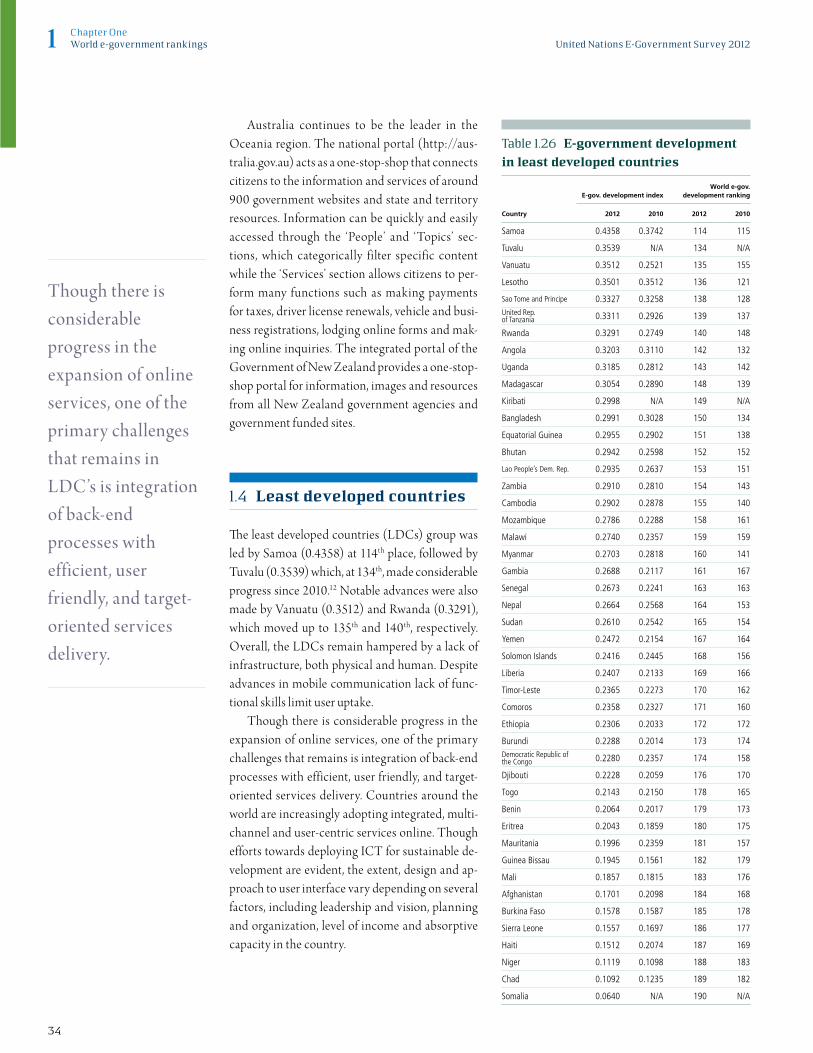
34
World e-government rankings United Nations E-Government Survey 20121 Chapter One
Australia continues to be the leader in the Oceania region. The national portal (http://aus-tralia.gov.au) acts as a one-stop-shop that connects citizens to the information and services of around 900 government websites and state and territory resources. Information can be quickly and easily accessed through the ‘People’ and ‘Topics’ sec-tions, which categorically filter specific content while the ‘Services’ section allows citizens to per-form many functions such as making payments for taxes, driver license renewals, vehicle and busi-ness registrations, lodging online forms and mak-ing online inquiries. The integrated portal of the Government of New Zealand provides a one-stop-shop portal for information, images and resources from all New Zealand government agencies and government funded sites.
1.4 Least developed countries
Th e least developed countries (LDCs) group was led by Samoa (0.4358) at 114th place, followed by Tuvalu (0.3539) which, at 134th, made considerable progress since 2010.12 Notable advances were also made by Vanuatu (0.3512) and Rwanda (0.3291), which moved up to 135th and 140th, respectively. Overall, the LDCs remain hampered by a lack of infrastructure, both physical and human. Despite advances in mobile communication lack of func-tional skills limit user uptake.
Though there is considerable progress in the expansion of online services, one of the primary challenges that remains is integration of back-end processes with efficient, user friendly, and target-oriented services delivery. Countries around the world are increasingly adopting integrated, multi-channel and user-centric services online. Though efforts towards deploying ICT for sustainable de-velopment are evident, the extent, design and ap-proach to user interface vary depending on several factors, including leadership and vision, planning and organization, level of income and absorptive capacity in the country.
Though there is considerable progress in the expansion of online services, one of the primary challenges that remains in LDC’s is integration of back-end processes with efficient, user friendly, and target-oriented services delivery.
Table 1.26 E-government development
in least developed countries
Country
E-gov. development indexWorld e-gov.
development ranking
2012 2010 2012 2010
Samoa 0.4358 0.3742 114 115
Tuvalu 0.3539 N/A 134 N/A
Vanuatu 0.3512 0.2521 135 155
Lesotho 0.3501 0.3512 136 121
Sao Tome and Principe 0.3327 0.3258 138 128United Rep. of Tanzania 0.3311 0.2926 139 137
Rwanda 0.3291 0.2749 140 148
Angola 0.3203 0.3110 142 132
Uganda 0.3185 0.2812 143 142
Madagascar 0.3054 0.2890 148 139
Kiribati 0.2998 N/A 149 N/A
Bangladesh 0.2991 0.3028 150 134
Equatorial Guinea 0.2955 0.2902 151 138
Bhutan 0.2942 0.2598 152 152
Lao People’s Dem. Rep. 0.2935 0.2637 153 151
Zambia 0.2910 0.2810 154 143
Cambodia 0.2902 0.2878 155 140
Mozambique 0.2786 0.2288 158 161
Malawi 0.2740 0.2357 159 159
Myanmar 0.2703 0.2818 160 141
Gambia 0.2688 0.2117 161 167
Senegal 0.2673 0.2241 163 163
Nepal 0.2664 0.2568 164 153
Sudan 0.2610 0.2542 165 154
Yemen 0.2472 0.2154 167 164
Solomon Islands 0.2416 0.2445 168 156
Liberia 0.2407 0.2133 169 166
Timor-Leste 0.2365 0.2273 170 162
Comoros 0.2358 0.2327 171 160
Ethiopia 0.2306 0.2033 172 172
Burundi 0.2288 0.2014 173 174Democratic Republic of the Congo 0.2280 0.2357 174 158
Djibouti 0.2228 0.2059 176 170
Togo 0.2143 0.2150 178 165
Benin 0.2064 0.2017 179 173
Eritrea 0.2043 0.1859 180 175
Mauritania 0.1996 0.2359 181 157
Guinea Bissau 0.1945 0.1561 182 179
Mali 0.1857 0.1815 183 176
Afghanistan 0.1701 0.2098 184 168
Burkina Faso 0.1578 0.1587 185 178
Sierra Leone 0.1557 0.1697 186 177
Haiti 0.1512 0.2074 187 169
Niger 0.1119 0.1098 188 183
Chad 0.1092 0.1235 189 182
Somalia 0.0640 N/A 190 N/A

35
World e-government rankingsUnited Nations E-Government Survey 2012 1Chapter One
1.5 Post-confl ict countries
Post-confl ict situations are associated with weak and fragile states where legitimacy and governance are ineff ective and services non-existent. As a spe-cial case, in table 1.27 the 2012 Survey presents e-government development in a few select countries that have witnessed confl ict in the past decades. For the defi nition of post-confl ict countries, please refer to the United Nations Development Programme’s Crisis Prevention and Recovery Report 2008, avail-able online.13
1.6 Conclusion
In conclusion, the 2012 Survey finds that Member States have begun to move from a decentralized single-purpose organization model of e-govern-ment to an integrated unified whole-of-govern-ment model for the people. This approach supports the strengthening of institutional linkages with in-terconnected departments and divisions; greater efficiency and effectiveness of governance sys-tems; and better public service delivery. However, the efforts of countries at all levels of development are still affected by a lack of integration of admin-istrative simplification with e-government devel-opment plans, lack of infrastructure and human resource capacity and a gap between e-services supply and demand. Low-income countries, in particular, continue to contend with traditional barriers to ICT investment such as lack of techni-cal skills, high costs of technology, and ineffective government regulation. �
Table 1.27 E-government development
in post-confl ict countries
Country
E-gov. development indexWorld e-gov.
development ranking
2012 2010 2012 2010
Croatia 0.7328 0.5858 30 35
Georgia 0.5563 0.4248 72 100
El Salvador 0.5513 0.4700 74 73
Bosnia and Herzegovina 0.5328 0.4698 79 74
Lebanon 0.5139 0.4388 87 93
Azerbaijan 0.4984 0.4571 96 83
Indonesia 0.4949 0.4026 97 109
Guatemala 0.4390 0.3937 112 112
Sri Lanka 0.4357 0.3995 115 111
Tajikistan 0.4069 0.3477 122 122
Namibia 0.3937 0.3314 123 125
Nicaragua 0.3621 0.3630 130 118
Rwanda 0.3291 0.2749 140 148
Angola 0.3203 0.3110 142 132
Uganda 0.3185 0.2812 143 142
Cambodia 0.2902 0.2878 155 140
Congo 0.2809 0.3019 157 135
Mozambique 0.2786 0.2288 158 161
Nepal 0.2664 0.2568 164 153
Côte d’Ivoire 0.2580 0.2805 166 144
Solomon Islands 0.2416 0.2445 168 156
Liberia 0.2407 0.2133 169 166
Timor-Leste 0.2365 0.2273 170 162
Ethiopia 0.2306 0.2033 172 172
Burundi 0.2288 0.2014 173 174
Democratic Republic of the Congo 0.2280 0.2357 174 158
Papua New Guinea 0.2147 0.2043 177 171
Eritrea 0.2043 0.1859 180 175
Guinea-Bissau 0.1945 0.1561 182 179
Afghanistan 0.1701 0.2098 184 168
Sierra Leone 0.1557 0.1697 186 177
Haiti 0.1512 0.2074 187 169
Chad 0.1092 0.1235 189 182