world mobile healthcare (mhealth) market 2013-2018
DESCRIPTION
Includes: Table of ContentSample PagesFor more information on this report go to http://goo.gl/3llEu or contact [email protected]TRANSCRIPT

©noticeThis material is copyright 2010 by visiongain. It is against the law to reproduce any of this material without the prior written agreement of visiongain. You cannot photocopy, fax, download to database or duplicate in any other way any of the material contained in this report. Each purchase and single copy is for personal use only.
World Mobile Healthcare (mHealth) Market 2013-2018:
eHealth, Telemedicine & Health informatics
www.visiongain.com
Contents 1. Executive Summary
1.1 Mobile Communications to Transform Healthcare
1.2 Benefits of mHealth
1.3 mHealth Ecosystem
1.4 Benefits of This Report
1.5 Who is This Report For?
1.6 Methodology
1.7 Points Emerged from This Research
2. Introduction to the mHealth Market
2.1 mHealth Market Structure Overview
2.2 Key Definitions
2.2.1 mHealth Definition
2.2.2 eHealth Definition
2.2.3 Telemedicine Definition
2.2.4 Health Informatics Definition
2.3 mHealth Drivers
2.3.1 Are Emerging Economies a Key Market for mHealth?
2.3.2 The role of Developed Economies on the mHealth Market?
2.4 mHealth Technologies
2.5 Expected Impact of mHealth
2.6 mHealth App Categories
3. Global mHealth Market Forecasts 2013-2018
3.1 The mHealth Initiative
3.2 Global mHealth Revenue Forecast 2013-2018
3.2.1 Global mHealth Revenue Forecast by Ecosystem Member Shares 2013-2018
3.2.2 Global mHealth Revenue Forecast by Ecosystem Members 2013-2018
3.2.2.1 Global mHealth Revenue Forecast for Mobile Operators 2013-2018
www.visiongain.com
Contents 3.2.2.2 Global mHealth Revenue Forecast for Device Vendors 2013
3.2.2.3 Global mHealth Revenue Forecast for Content Developers 2013-2018
3.2.2.4 Global mHealth Revenue Forecast for Healthcare Providers 2013-2018
3.3 Global mHealth Revenues by Services Shares 2013-2018
3.4 Global mHealth Revenues by Services 2013 -2018
3.4.1 Global mHealth Revenues from Monitoring Services 2013-2018
3.4.2 Global mHealth Revenues from Diagnostic Services 2013-2018
3.4.3 Global mHealth Revenues from Healthcare System Processes 2013-2018
3.4.4 Global mHealth Revenues from Other Services 2013-2018
4. Regional mHealth Market Forecasts 2013-2018
4.1 Regional mHealth Revenue Forecast 2013-2018
4.1.1 Regional mHealth Revenue Forecast for Monitoring Services 2013-2018
4.1.2 Regional mHealth Revenue Forecast for Diagnostic Services 2013-2018
4.1.3 Regional mHealth Revenue Forecast for Healthcare System Processes 2013-2018
4.1.4 Regional mHealth Revenue Forecast for Other Services 2013-2018
4.2 North American mHealth Market 2013-2018
4.2.1 HHS mHealth Initiatives
4.2.2 North American mHealth Revenue Forecast 2013-2018
4.2.3 North American mHealth Revenue Forecast for Monitoring Services 2013-2018
4.2.4 North American mHealth Revenue Forecast for Diagnostic Services 2013-2018
4.2.5 North American mHealth Revenue Forecast for Healthcare System Processes 2013-2018
4.2.6 North American mHealth Revenue Forecast for Other Services 2013-2018
4.3 Latin American mHealth Market 2013-2018
4.3.1 Latin American mHealth Revenue Forecast 2013-2018
4.3.2 Latin American mHealth Revenue Forecast for Monitoring Services 2013-2018
4.3.3 Latin American mHealth Revenue Forecast for Diagnostic Services 2013-2018
4.3.4 Latin American mHealth Revenue Forecast for Healthcare System Processes 2013-2018
4.3.5 Latin American mHealth Revenue Forecast for Other Services 2013-2018
4.4 European mHealth Market 2013-2018
www.visiongain.com
Contents 4.4.1 UK Potential mHealth Market
4.4.2 NHS Requires Cost Effective Health Care Services
4.4.3 European and UK Forecast Spend on Telecare and Telehealth 2013-2018
4.4.4 European mHealth Revenue Forecast 2013-2018
4.4.5 European mHealth Revenue Forecast for Monitoring Services 2013-2018
4.4.6 European mHealth Revenue Forecast for Diagnostic Services 2013-2018
4.4.7 European mHealth Revenue Forecast for Healthcare System Processes 2013-2018
4.4.8 European mHealth Revenue Forecast for Other Services 2013-2018
4.5 Asia Pacific mHealth Market 2013-2018
4.5.1 Asia Pacific mHealth Revenue Forecast 2013-2018
4.5.2 Asia Pacific mHealth Revenue Forecast for Monitoring Services 2013-2018
4.5.3 Asia Pacific mHealth Revenue Forecast for Diagnostic Services 2013-2018
4.5.4 Asia Pacific mHealth Revenue Forecast for Healthcare System Processes 2013-2018
4.5.5 Asia Pacific mHealth Revenue Forecast for Other Services 2013-2018
4.6 Middle East and African mHealth Market 2013-2018
4.6.1 Middle East and African mHealth Revenue Forecast 2013-2018
4.6.2 Middle East and African mHealth Revenue Forecast for Monitoring Services 2013-2018
4.6.3 Middle East and African mHealth Revenue Forecast for Diagnostic Services 2013-2018
4.6.4 Middle East and African mHealth Revenue Forecast for Healthcare System Processes 2013-
2018
4.6.5 Middle East and African mHealth Revenue Forecast for Other Services 2013-2018
5. Leading Companies in the mHealth Market
5.1 AliveCor
5.1.1 AliveCor Heart Monitor USPs
5.1.2 AliveCor Gains Extra Investment for International Expansion
5.1.3 AliveCor Heart Monitor Analysis – Apple Monopoly?
5.2 Apple Inc
5.2.1 Apple’s mHealth Strategy

www.visiongain.com
Contents 5.2.2 mHealth Apps – Does Apple Have a Monopoly?
5.2.3 Apple and the Healthcare Industry
5.2.4 Apple’s Standalone mHealth Device
5.3 Athenahealth Inc.
5.3.1 Athenahealth Current Offerings
5.4 Diversinet Corp
5.4.1 Diversinet’s mobiHealth Wallet
5.4.2 Diversinet’s mobiMessenger
5.5 Epocrates
5.5.1 Epocrates mHealth Offerings
5.5.1.1 Epocrates mHealth Offerings – Apple iOS
5.5.1.2 Epocrates mHealth Offerings – Android OS
5.5.1.3 Epocrates mHealth Offerings – Blackberry OS
5.5.2 Epocrates Monetising mHealth Offerings – Analysis
5.6 McKinsey & Company Inc
5.6.1 McKinsey & Company’s mHealth Strategy
5.6.2 Recent Achievements by McKinsey & Company in the mHealth Space
5.7 Motion Computing Inc
5.7.1 Motion Computing mHealth Offerings
5.8 Telcare
5.8.1 Telcare’s Market and Business Model
5.8.2 Telcare’s Current Offerings
5.8.3 Telcare and Telenor Connexion Partner for mHealth
5.9 Vodafone
5.9.1 Vodafone mHealth Solutions
5.10 Voxiva
5.10.1 Voxiva Offerings
6. SWOT Analysis of the mHealth Market
www.visiongain.com
Contents 7. Expert Opinion
7.1 Interview with Justin Sims CEO of Voxiva
7.1.1 Voxiva’s Market Standing and Current Offerings
7.1.2 Drivers for the mHealth Market
7.1.3 Barriers for the mHealth Market
7.1.4 Revenues in the mHealth Market
7.1.5 Who Benefits the Most from mHealth?
7.1.6 How Much Money Can Using mHealth Save?
7.1.7 Upcoming Technological Advances in mHealth
7.1.8 Opportunities in mHealth for Mobile Operators
7.1.9 Opportunities in mHealth for Software Developers and Device Vendors
7.1.10 Opportunities in mHealth for Health Care Providers
7.1.11 Weaknesses in mHealth
7.1.12 Threats to mHealth
7.1.13 Growth of mHealth in Current Health Care services
7.2 Interview with Marianne Braunstein, VP of Product Management at Epocrates
7.2.1 Epocrates Company History and Market Standing
7.2.2 Main Drivers for mHealth
7.2.3 Main Barriers to mHealth
7.2.4 Patients or HCPs to Benefit Most from mHealth
7.2.5 Technological Advancements
7.2.6 Opportunities for Software Developers and Content Providers
7.2.7 Opportunities for Healthcare Providers
8. End User Research - Meeting the Needs of Patients and Healthcare
Practitioners
8.1 Defining Key End Users
8.2 Current Challenges for HCPs and Patients to be Addressed by mHealth
8.3 Current Challenges for Consumers to be Addressed by mHealth

www.visiongain.com
Contents 8.4 End User Belief in Positive Benefits of mHealth
8.4.1 End User Belief in Top Benefits of mHealth
8.5 End User Belief in Barriers to mHealth
8.5.1 HCPs Belief in Barriers to mHealth
8.5.2 Chronic Patients Belief in Barriers to mHealth
8.5.3 General Wellness Consumers Belief in Barriers to mHealth
9. Conclusions and Recommendations for the mHealth Market
9.1 Mobile Devices Have the Potential to Become Powerful Medical Tools
9.2 Untapped Potential for mHealth
9.3 Overcoming Obstacles to mHealth Uptake
9.4 Recommended Actions for Increasing mHealth Uptake
9.4.1 Maintain Low Costs
9.4.2 Gain the Approval of the Healthcare Industry
9.4.3 Solutions Should Offer Ease of Use and Increased Efficiency
10. Glossary
List of Tables
Table 2.2: eHealth Definitions and Variations
Table 2.4: mHealth Technologies and Devices
Table 2.5: mHealth Applications 2013
Table 3.5: Global mHealth Revenue Forecast by Ecosystem Member Shares 2013-2018 (%)
Table 3.10: Global mHealth Revenue Forecast by Ecosystem Members 2013-2018 ($ Billions,
AGR %, CAGR %)
Table 3.12: Global mHealth Revenue Forecast for Mobile Operators 2013-2018 ($ Billions, AGR
%, CAGR %)
Table 3.14: Global mHealth Revenue Forecast for Device Vendors 2013-2018 ($ Billions, AGR %)
www.visiongain.com
Contents Table 3.15: Global mHealth Revenue Forecast for Content Developers 2013-2018 ($ Billions,
AGR %, CAGR %)
Table 3.18: Global mHealth Revenue Forecast for Healthcare Providers 2013-2018 ($ Billions,
AGR %, CAGR %)
Table 3.20: Global mHealth Revenues Forecast by Services Shares 2013-2018 (%)
Table 3.25: Global mHealth Revenues by Services 2013-2018 ($ Billions, AGR %, CAGR %)
Table 3.27: Global mHealth Revenues from Monitoring Services 2013-2018 ($ Billions, AGR %)
Table 3.29: Global mHealth Revenues from Diagnostic Services 2013-2018 ($ Billions, AGR %)
Table 3.31: Global mHealth Revenues from Healthcare System Processes 2013-2018 ($ Billions,
AGR %, CAGR %)
Table 3.33: Global mHealth Revenues from Other Services 2013-2018 ($ Billions, AGR %, CAGR
%)
Table 4.2: Regional mHealth Revenue Forecast 2013-2018 (%)
Table 4.4: Regional mHealth Revenue Forecast 2013-2018 ($ Billions, AGR %, CAGR %)
Table 4.6: Regional mHealth Revenue Forecast Monitoring Services 2013-2018 ($ Millions, AGR
%, CAGR %)
Table 4.8: Regional mHealth Revenue Forecast for Diagnostic Services 2013-2018 ($ Millions,
AGR %, CAGR %)
Table 4.10: Regional mHealth Revenue Forecast for Healthcare System Processes 2013-2018 ($
Millions, AGR %, CAGR %)
Table 4.12: Regional mHealth Revenue Forecast for Other Services 2013-2018 ($ Millions, AGR
%, CAGR %)
Table 4.14: North American mHealth Revenue Forecast 2013-2018 ($ Billions, AGR %, CAGR %)
Table 4.16: North American mHealth Revenue Forecast for Monitoring Services 2013-2018 ($
Millions, AGR %, CAGR)
Table 4.18: North American mHealth Revenue Forecast for Diagnostic Services 2013-2018 ($
Millions, AGR %, CAGR %)
Table 4.20: North American mHealth Revenue Forecast for Healthcare System Processes 2013-
2018 ($ Millions, AGR %, CAGR %)
www.visiongain.com
Contents Table 4.22: North American mHealth Revenue Forecast for Other Services 2013-2018 ($
Millions, AGR %, CAGR %)
Table 4.23: Latin American mHealth Schemes and Operations 2013 (Project, Partners and
Sponsors, Application, Activity)
Table 4.25: Latin American mHealth Revenue Forecast 2013-2018 ($ Billions, AGR %, CAGR %)
Table 4.27: Latin American mHealth Revenue Forecast for Monitoring Services 2013-2018 ($
Millions, AGR %, CAGR %)
Table 4.29: Latin American mHealth Revenue Forecast for Diagnostic Services 2013-2018 ($
Millions, AGR %, CAGR %)
Table 4.31: Latin American mHealth Revenue Forecast for Healthcare System Processes 2013-
2018 ($ Millions, AGR %, CAGR %)
Table 4.33: Latin American mHealth Revenue Forecast for Other Services 2013-2018 ($ Millions,
AGR %, CAGR %)
Table 4.36: UK Elderly Population Forecast 2012-2030 (Millions, %)
Table 4.38: European and UK Forecast Spend on Telecare and Telehealth 2013-2018 ($ Millions,
AGR %)
Table 4.40: European mHealth Revenue Forecast 2013-2018 ($ Billions, AGR %, CAGR %)
Table 4.42: European mHealth Revenue Forecast for Monitoring Services 2013-2018 ($ Millions,
AGR %, CAGR %)
Table 4.44: European mHealth Revenue Forecast for Diagnostic Services 2013-2018 ($ Millions,
AGR %, CAGR %)
Table 4.46: European mHealth Revenue Forecast for Healthcare System Processes 2013-2018 ($
Millions, AGR %, CAGR %)
Table 4.48: European mHealth Revenue Forecast for Other Services 2013-2018 ($ Millions, AGR
%, CAGR %)
Table 4.49: Middle East and African mHealth Initiatives 2013 (Project, Partners and Sponsors,
Application, Activity)
Table 4.51: Asia Pacific mHealth Revenue Forecast 2013-2018 ($ Billions, AGR %, CAGR %)
Table 4.53: Asia Pacific mHealth Revenue Forecast for Monitoring Services 2013-2018 ($
Millions, AGR %, CAGR %)

www.visiongain.com
Contents Table 4.55: Asia Pacific mHealth Revenue Forecast for Diagnostic Services 2013-2018 ($
Millions, AGR %, CAGR %)
Table 4.57: Asia Pacific mHealth Revenue Forecast for Healthcare System Processes 2013-2018
($ Millions, AGR %, CAGR %)
Table 4.59: Asia Pacific mHealth Revenue Forecast for Other Services 2013-2018 ($ Millions,
AGR %, CAGR %)
Table 4.60: Middle East and African mHealth Initiatives 2013 (Project, Partners and Sponsors,
Application, Activity)
Table 4.62: Middle East and African mHealth Revenue Forecast 2013-2018 ($ Billions, AGR %,
CAGR %)
Table 4.64: Middle East and African mHealth Revenue Forecast for Monitoring Services 2013-
2018 ($ Millions, AGR %, CAGR %)
Table 4.66: Middle East and African mHealth Revenue Forecast for Diagnostic Services 2013-
2018 ($ Millions, AGR %, CAGR %)
Table 4.68: Middle East and African mHealth Revenue Forecast for Healthcare System Processes
2013-2018 ($ Millions, AGR %, CAGR %)
Table 4.70: Middle East and African mHealth Revenue Forecast for Other Services 2013-2018 ($
Millions, AGR %, CAGR %)
Table 5.1: AliveCor Company Information (HQ, Website)
Table 5.2: AliveCor’s Heart Monitor USPs (Feature, Benefit)
Table 5.4: Apple Company Information (Revenues, HQ, Ticker, Website)
Table 5.5: Athenahealth Company Information (Revenues, HQ, Ticker, IR, Website)
Table 5.6: athenahealth Current Offerings 2013 (Service, Product, Use)
Table 5.7: Diversinet Company Information (HQ, Ticker, IR, Website)
Table 5.8: Diversinet’s mobiHealth Wallet Key Features and Benefits
Table 5.9: Diversinet mobiMessenger Key Features and Benefits
Table 5.10: Epocrates Company Information (Revenue, HQ, Ticker, IR, Website)
Table 5.11: Epocrates mHealth Offering for devices Running on Apple iOS 2013 (Product, Price
$, Application)
www.visiongain.com
Contents Table 5.12: Epocrates mHealth Offering for devices Running on Android OS 2013 (Product, Price
$, Application)
Table 5.13: Epocrates mHealth Offering for devices Running on Blackberry OS 2013 (Product,
Price $, Application)
Table 5.14: McKinsey & Company Information (Revenues, HQ, Website(
Table 5.15: Motion Computing Company Information (HQ, IR, Website)
Table 5.16: Motion Computing mHealth Solutions Use Cases and Benefits 2013
Table 5.17: Telcare Company Information (HQ, Ticker, IR, Website)
Table 5.18: Telcare Offerings 2013 (Product/Service, Features)
Table 5.19: Vodafone Company Information (Revenues, HQ, Ticker, IR, Website)
Table 5.20: Vodafone mHealth Solutions 2013
Table 5.21: Voxiva Company Information (HQ, IR, Website)
Table 5.22: Voxiva’s mHealth Offerings 2013 (Service, Function, Results)
Table 6.1: SWOT Analysis of mHealth Market 2013
Table 8.1: Key mHealth End Users
List of Charts
Chart 3.1: Global Deaths from NCDs vs. Deaths Not from NCDs 2012 (%)
Chart 3.4: Global mHealth Revenue Forecast by Ecosystem Member Shares 2013-2018 (%)
Chart 3.6: Global mHealth Revenue Forecast by Ecosystem Member Shares 2013 (%)
Chart 3.7: Global mHealth Revenue Forecast by Ecosystem Member Shares 2015 (%)
Chart 3.8: Global mHealth Revenue Forecast by Ecosystem Member Shares 2018 (%)
Chart 3.9: Global mHealth Revenue Forecast by Ecosystem Members 2013-2018 ($ Billions)
Chart 3.11: Global mHealth Revenue Forecast for Mobile Operators 2013-2018 ($ Billions, AGR
%)
Chart 3.13: Global mHealth Revenue Forecast for Device Vendors 2013-2018 ($ Billions, AGR %)
Chart 3.14: Global mHealth Revenue Forecast for Content Developers 2013-2018 ($ Billions,
AGR %)
www.visiongain.com
Contents Chart 3.17: Global mHealth Revenue Forecast for Healthcare Providers 2013-2018 ($ Billions,
AGR %)
Chart 3.19: Global mHealth Revenues by Services Shares 2013-2018 (%)
Chart 3.21: Global mHealth Revenue Forecast by Services Shares 2013 (%)
Chart 3.22: Global mHealth Revenue Forecast by Services Shares 2015 (%)
Chart 3.23: Global mHealth Revenue Forecast by Services Shares 2018 (%)
Chart 3.24: Global mHealth Revenues by Services 2013-2018 ($ Billions)
Chart 3.26: Global mHealth Revenues from Monitoring Services 2013-2018 ($ Billions, AGR %)
Chart 3.28: Global mHealth Revenues from Diagnostic Services 2013-2018 ($ Billions, AGR %)
Chart 3.30: Global mHealth Revenues from Healthcare System Processes 2013-2018 ($ Billions,
AGR %)
Chart 3.32: Global mHealth Revenues from Other Services 2013-2018 ($ Billions, AGR %)
Chart 4.1: Regional mHealth Revenue Forecast 2013-2018 (%)
Chart 4.3: Regional mHealth Revenue Forecast 2013-2018 ($ Billions)
Chart 4.5: Regional mHealth Revenue Forecast Monitoring Services 2013-2018 ($ Millions)
Chart 4.7: Regional mHealth Revenue Forecast for Diagnostic Services 2013-2018 ($ Millions)
Chart 4.9: Regional mHealth Revenue Forecast for Healthcare System Processes 2013-2018 ($
Millions)
Chart 4.11: Regional mHealth Revenue Forecast for Other Services 2013-2018 ($ Millions)
Chart 4.13: North American mHealth Revenue Forecast 2013-2018 ($ Billions, AGR %)
Chart 4.15: North American mHealth Revenue Forecast for Monitoring Services 2013-2018 ($
Millions, AGR %)
Chart 4.17: North American mHealth Revenue Forecast for Diagnostic Services 2013-2018 ($
Millions, AGR %)
Chart 4.19: North American mHealth Revenue Forecast for Healthcare System Processes 2013-
2018 ($ Millions)
Chart 4.21: North American mHealth Revenue Forecast for Other Services 2013-2018 ($
Millions, AGR %)
Chart 4.24: Latin American mHealth Revenue Forecast 2013-2018 ($ Billions, AGR %)
www.visiongain.com
Contents Chart 4.26: Latin American mHealth Revenue Forecast for Monitoring Services 2013-2018 ($
Millions, AGR %)
Chart 4.28: Latin American mHealth Revenue Forecast for Diagnostic Services 2013-2018 ($
Millions, AGR %)
Chart 4.30: Latin American mHealth Revenue Forecast for Healthcare System Processes 2013-
2018 ($ Millions, AGR %)
Chart 4.32: Latin American mHealth Revenue Forecast for Other Services 2013-2018 ($ Millions,
AGR %)
Chart 4.34: UK Residents Aged Over 75 With Chronic Diseases 2013 (%)
Chart 4.35: UK Elderly Population Forecast 2012-2030 (Millions, %)
Chart 4.37: European and UK Forecast Spend on Telecare and Telehealth 2013-2018 ($ Millions,
AGR %)
Chart 4.39: European mHealth Revenue Forecast 2013-2018 ($ Billions, AGR %)
Chart 4.41: European mHealth Revenue Forecast for Monitoring Services 2013-2018 ($ Millions,
AGR %)
Chart 4.43: European mHealth Revenue Forecast for Diagnostic Services 2013-2018 ($ Millions,
AGR %)
Chart 4.45: European mHealth Revenue Forecast for Healthcare System Processes 2013-2018 ($
Millions, AGR %)
Chart 4.47: European mHealth Revenue Forecast for Other Services 2013-2018 ($ Millions, AGR
%)
Chart 4.50: Asia Pacific mHealth Revenue Forecast 2013-2018 ($ Billions, AGR %)
Chart 4.52: Asia Pacific mHealth Revenue Forecast for Monitoring Services 2013-2018 ($
Millions, AGR %)
Chart 4.54: Asia Pacific mHealth Revenue Forecast for Diagnostic Services 2013-2018 ($
Millions, AGR %)
Chart 4.56: Asia Pacific mHealth Revenue Forecast for Healthcare System Processes 2013-2018
($ Millions, AGR %)
Chart 4.58: Asia Pacific mHealth Revenue Forecast for Other Services 2013-2018 ($ Millions,
AGR %)
www.visiongain.com
Contents Chart 4.61: Middle East and African mHealth Revenue Forecast 2013-2018 ($ Billions, AGR %)
Chart 4.63: Middle East and African mHealth Revenue Forecast for Monitoring Services 2013-
2018 ($ Millions, AGR %)
Chart 4.65: Middle East and African mHealth Revenue Forecast for Diagnostic Services 2013-
2018 ($ Millions, AGR %)
Chart 4.67: Middle East and African mHealth Revenue Forecast for Healthcare System Processes
2013-2018 ($ Millions, AGR %)
Chart 4.69: Middle East and African mHealth Revenue Forecast for Other Services 2013-2018 ($
Millions, AGR %)
Chart 5.3: Global Total Smartphone Market Share by OS 2012 (%)
Chart 8.2: Challenges for Patients and HCPs in Managing Chronic Conditions Q4 2012 (%)
Chart 8.3: Challenges for General Wellness Consumers in Maintaining their Overall Health Q4
2012 (%)
Chart 8.4: End User Belief in Benefits of mHealth Q4 2012 (%)
Chart 8.5: Belief in Benefit of mHealth in Modifying Patient Behaviour Q4 2012 (%)
Chart 8.6: Belief in Benefit of mHealth in Improving Care Delivery Q4 2012 (%)
Chart 8.7: Belief in Benefit of mHealth in Reducing Healthcare Costs Q4 2012 (%)
Chart 8.8: Belief in Benefit of mHealth in Empowering Patients Q4 2012 (%)
Chart 8.9: End User Belief in Barriers to mHealth Q4 2012 (%)
Chart 8.10: HCPs Belief in Barriers to mHealth Uptake Q4 2012 (%)
Chart 8.11: Chronic Patients Belief in Barriers to mHealth Uptake Q4 2012 (%)
Chart 8.12: General Wellness Consumers Belief in Barriers to mHealth Uptake Q4 2012 (%)
List of Figures
Figure 2.1 Global mHealth Market Structure Overview
Figure 2.3: Telecare vs. Telehealth Infographic
www.visiongain.com
Contents Companies Mentioned in This Report Accenture Development Partners
Active Health
AED SATELLIFE
AliveCor
Apple
AT&T
Athenahealth Inc.
Burrill & Company.
Cell-Life
CVS
Dimagi Inc.
D-Tree International
Epocrates
Fitbit
Fonemed
FrontlineSMS: Medic
GrameenPhone Ltd.
Hewlett Packard (HP)
Johnson and Johnson
Khosla Ventures
McKinsey & Company
mDhil
MDLinx
MedicallHome
Medscape
Motorola
www.visiongain.com
Contents mPedigree
mPower-health
MTN
Nokia
Novartis
Oklahoma Life Sciences Fund
Optumhealth
Pathfinder International
Qualcomm
Qualcomm Ventures
SmilingSun
Sony Ericsson
Sproxil
Telcare
TelCel
Telenor Connexion
Vodacom
Vodafone
Voxiva
WebMB
Zain
Organisations Mentioned in This Report Accreditation Council for Pharmacy Education (ACPE)
Africa Center for Health and Population Studies KwaZulu Natal
Africa Health Systems Initiative Support to African Research Partnerships (AHSI-RES)
American Academy of Diabetes Educators American Academy of Pediatrics (AAP)
American Diabetes Association
American Medical Association (AMA)
www.visiongain.com
Contents American Nurses Credentialing Center (ANCC)
Association of Diabetes Educators (AADE)
Association of Pakistani Physicians in North America (APPNA)
BabyCenter
Bangladesh's Ministry of Health and Family Welfare
Baylor University
Bhoruka Charitable Trust (BCT)
Bill & Melinda Gates Foundation
California State University
Capacity Kenya
CARE Nicaragua
Carnegie Mellon University Auton Lab
Centers for Disease Control and Prevention (CDC)
Chinese Center for Disease Control and Prevention
ClickDiagnostics
Clinton Health Access Initiative (CHAI)
Colorado State University
Columbia University’s Mailman School of Public Health
Cyber.net
Elsevier Foundation
Evangelical Lutheran Church of Tanzania
Food and Drug Administration (FDA)
George Washington University
Ghana Health Service
Global Business Coalition (GBC)
Government of Kenya
Government of Kerala
Grameen Foundation
Groupe Spéciale Mobile Association (GSMA)
GSM Association Development Fund

www.visiongain.com
Contents Health Insurance Portability and Accountability (HIPPA)
HEC and ISIF Foundation
HHS Office of Minority Health
Hospital Corporation of America
Hospitalito Atitlan
Imperial College London
Indian Institute of Technology
Indus Hospital Karachi
Information Kerala Mission
Innovations in International Health of the Massachusetts Institute of Technology
Instituto Carso Salud
International Development Research Centre (IDRC)
JiVitA Maternal Child Health and Nutrition Research Project
John Hopkins Health & Education in South Africa
Johns Hopkins Bloomberg School of Public Health
Lanka Software Foundation
LIRNEasia
Makerere University
Massachusetts Institute of Technology (MIT)
Mazumdar Shaw Cancer Centre
Medical Clinica
Medical University of Graz
Medicines for Malaria Venture
Millennium Villages Project
Ministry of Health (Mozambique)
Narayana Hrudayalaya Hospitals
National Center for Biological Science (India)
National Diabetes Education Program
National Healthy Mothers Healthy Babies
National Institute of Communicable Diseases (India)
www.visiongain.com
Contents National Institutes of Health (Mozambique)
National Institutes of Health (NIH)
National Latino Research Center
NUST Institute of Information Technology Pakistan,
Office of National Statistics (UK)
Office of the National Coordinator for Health Information Technology (ONC)
PEPFAR
Public Health Evaluation (PHE)
Right to Care
Rockerfeller Foundation
Roll Back Malaria
Rwandan Ministry of Health
San Diego Department of Obstetrics and Gynecology
San Marcos and the University of California
Sana at Harvard
Sarvodaya
SMS2Printer
Sri Lankan Ministry of Health and Nutrition
Stop TB Partnership
Swiss Agency for Development and Cooperation
Tanzania Ministry of Health and Social Welfare
TB REACH Initiative
Telemedicine Reference Center Limited (TRCL)
Text4Health Task Force
The Department of Health (UK Government)
The Earth Institute at Columbia University
The Health Resources and Services Administration (HRSA)
The International Institute for Communication and Development (IICD)
The International Telecommunication Union (ITU)
The Karnataka Health Promotion Trust (KHPT)

www.visiongain.com
Contents The National Cancer Institute (NCI)
The Raith Foundation
The SHM Foundation
The Wellcome Trust
Treatment and Research AIDS Centre (TRAC) Rwanda
U.S. Food and Drug Administration (FDA)
U.S. President's Emergency Plan for AIDS Relief (PEPFAR)
UBS Optimus Foundation
Uganda Chartered HealthNet
UK Department of Health
UK National Health Service (NHS)
UM Healthcare Trust
UNICEF
UNICEF Innovation Group
United States Department of Health and Human Services (HHS)
Universidad Autonoma de Yucatan
Universidad Peruana Cayetano Heredia Lima
University of Alberta
University of Botswana
University of Manitoba
University of Pennsylvania
University of Pennsylvania Libraries
University of Pennsylvania School of Medicine
University of Southern California
University of Southern Maine
University of Washington
US Centers for Disease Control and Prevention (CDC)
USAID
World Health Organization (WHO)

Page 47
www.visiongain.com
World Mobile Healthcare (mHealth) Market 2013-2018: eHealth, Telemedicine & Health informatics
3.2.2.4 Global mHealth Revenue Forecast for Healthcare Providers
2013-2018 We expect the global mHealth revenues for healthcare providers will reach $0.2 billion in 2013,
growing with an AGR of 50% to reach $0.3 billion in 2014. In 2015 we expect revenues of $0.4
billion, growing with an AGR of 50% to reach $0.6 billion in 2016. In 2017 we expect revenues of
$1 billion, growing with an AGR of 70% to reach $1.7 billion in 2018. The CAGR for the 2013-2018
forecast period will be 53.2%. See Chart 3.17 and Table 3.18 below for a detailed summary of
these figures.
Source: visiongain, 2013
2013 2014 2015 2016 2017 2018 CAGR
Revenues in Billions $0.2 $0.3 $0.4 $0.6 $1.0 $1.7
53.2% AGR - 50.0% 33.3% 50.0% 66.7% 70.0%
Source: visiongain, 2013
Chart 3.17: Global mHealth Revenue Forecast for Healthcare Providers 2013-2018
($ Billions, AGR %)
Table 3.18: Global mHealth Revenue Forecast for Healthcare Providers 2013-2018
($ Billions, AGR %, CAGR %)
Page 55
www.visiongain.com
World Mobile Healthcare (mHealth) Market 2013-2018: eHealth, Telemedicine & Health informatics
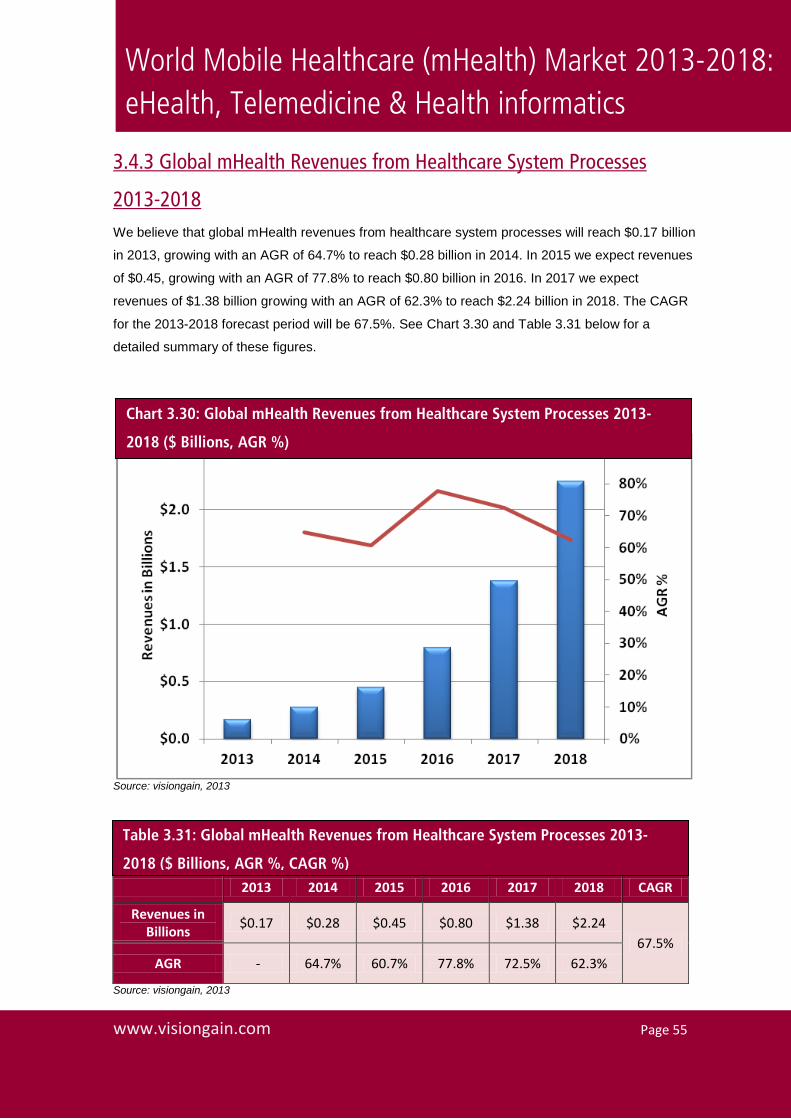
3.4.3 Global mHealth Revenues from Healthcare System Processes
2013-2018 We believe that global mHealth revenues from healthcare system processes will reach $0.17 billion
in 2013, growing with an AGR of 64.7% to reach $0.28 billion in 2014. In 2015 we expect revenues
of $0.45, growing with an AGR of 77.8% to reach $0.80 billion in 2016. In 2017 we expect
revenues of $1.38 billion growing with an AGR of 62.3% to reach $2.24 billion in 2018. The CAGR
for the 2013-2018 forecast period will be 67.5%. See Chart 3.30 and Table 3.31 below for a
detailed summary of these figures.
Source: visiongain, 2013
2013 2014 2015 2016 2017 2018 CAGR
Revenues in Billions $0.17 $0.28 $0.45 $0.80 $1.38 $2.24
67.5% AGR - 64.7% 60.7% 77.8% 72.5% 62.3%
Source: visiongain, 2013
Chart 3.30: Global mHealth Revenues from Healthcare System Processes 2013-
2018 ($ Billions, AGR %)
Table 3.31: Global mHealth Revenues from Healthcare System Processes 2013-
2018 ($ Billions, AGR %, CAGR %)

Page 110
www.visiongain.com
World Mobile Healthcare (mHealth) Market 2013-2018: eHealth, Telemedicine & Health informatics
5. Leading Companies in the mHealth Space
5.1 AliveCor AliveCor are an American company based in San Francisco California. They have developed and
manufactured an iPhone add-on device for monitoring heart rates, called the AliveCor Heart
Monitor. See Table 5.1 for a summary of key information on AliveCor.
Headquarters San Francisco, California, U.S.
Website www.alivecor.com
Source: visiongain, 2013
5.1.1 AliveCor Heart Monitor USPs See Table 5.2 below for a detailed summary of the devices use and benefits.
Feature Benefit
Ease of Use
This Class II medical device snaps onto the users’ iPhone like a protective case and wirelessly communicates with the app on their phone. To generate a Lead I ECG, the user must rest the electrodes on their fingers from each hand. The app senses skin contact on the sensors and when an acceptable connection is made it counts down to initiate the ECG recording.
Clinical Accuracy AliveCor state that in clinical trials the heart monitor demonstrated clinical efficacy.
Power and Portability
The Heart Monitor does not use power from the iPhone, but utilizes a 3.0V coin cell battery that will take up to roughly 10,000, 30-second ECGs before needing replacement. The Heart Monitor also uses AliveCor’s proprietary wireless communication protocol to communicate with the app, and requires no pairing between the iPhone and the Heart Monitor.
Cost Effectiveness The device is priced at $199. Source: AliveCor, visiongain, 2013
Table 5.2: AliveCor’s Heart Monitor USPs (Feature, Benefit)
Table 5.1: AliveCor Company Information (HQ, Website)

Page 135
www.visiongain.com
World Mobile Healthcare (mHealth) Market 2013-2018: eHealth, Telemedicine & Health informatics
7. Expert Opinion
7.1 Interview with Justin Sims CEO of Voxiva What follows below is an exclusive interview that visiongain conducted with Justin Sims CEO of
Voxiva in Q2 2013.
7.1.1 Voxiva’s Market Standing and Current Offerings Visiongain: Can you give us a brief introduction to what services and offerings Voxiva provides in the mHealth field?
Justin Sims: We see Voxiva not as a mobile health company but as a digital health company.
Some of our services are provided directly to consumers, and others are provided to our
customers who then provide our services to consumers.
Our customers include health insurance companies, health care providers and the government
(with their health care delivery responsibilities). We’ve also have both direct and indirect channels
for getting our products into the hands of consumers. For example we offer a service called
Text4Baby directly to the public. We believe this is now the largest consumer focussed mobile
health services anywhere in the world and have now enrolled over 500, 000 people in the service.
We also offer a smoking cessation program, text2quit, but it’s not available directly to the public,
instead we offer that to health insurance companies, employers and state health departments, who
pay us or our channels for the services then offer the program to their members of populations.
Our services include text4baby, for maternal health, text4kids, for childhood health, text4health for
preventative health and wellness, care4life, for diabetes, text2quit, for smoking cessation and
finally connect4health is a bundle offering of three services, that we provide to health insurance
companies to support their member communications efforts.
text4baby is our best known program, because of its size and scale and reach, and we run this in
partnership with the National Healthy Mothers Healthy Babies. We are able to provide it free of
charge to members of the public thanks to a grant from Johnson and Johnson and the support of
the mobile phone industry that is providing the text messages free of charge to us and users. In the
U.S. text4baby been part of a huge public/private partnership. The government has reviewed and
endorsed the program, even though they don’t directly fund it. We have over 100 health insurance
companies that promote it to their members and almost all states health departments. We had