world wheat supply and demand situation
TRANSCRIPT

World Wheat Supply and Demand Situation
Major data source: USDA World Agricultural Supply and Demand Estimates released October 12, 2021, unless otherwise indicated. Projections will change over the course of the year depending on
weather and other developments.

Major Exporters01Import Demand02U.S. Situation by Class03Outlook04

Highlights of USDA’s 2021/22 Wheat S&D Estimates
2021/22 global wheat production forecast to reach 775.87 MMT• Canadian Production is forecast at 21 MMT, 2 MMT less than USDA’s September
estimate
• EU production is forecast at 139.40 MMT, up 11% from 2020/21
• U.S. production is expected to decrease to 44.79 MMT, down 10% compared to 2020/21
Global consumption forecast at 787.1 MMT, down 1% from 2020/21• Domestic consumption in India forecast at 104.5 MMT, 2.2 MMT more than 2020/21
• Domestic consumption in Nigeria is forecast at 5.7 MMT, 200 TMT more than 2020/21
• U.S. domestic consumption forecast to 31.5 MMT, 1.1 MMT more than 2020/21
World wheat trade to reach a record 199.6 MMT, down 1 MMT from
2020/21, if realized • Australian exports are projected at 23.5 MMT, down 0.5 MMT from 2020/21
• Canadian exports are projected at 15 MMT, down 43.2% from 2020/21
• U.S. 2021/22 exports expected to be 23.8 MMT, down 12% from 2020/21
3
Highlights of USDA’s 2021/22 Wheat S&D Estimates
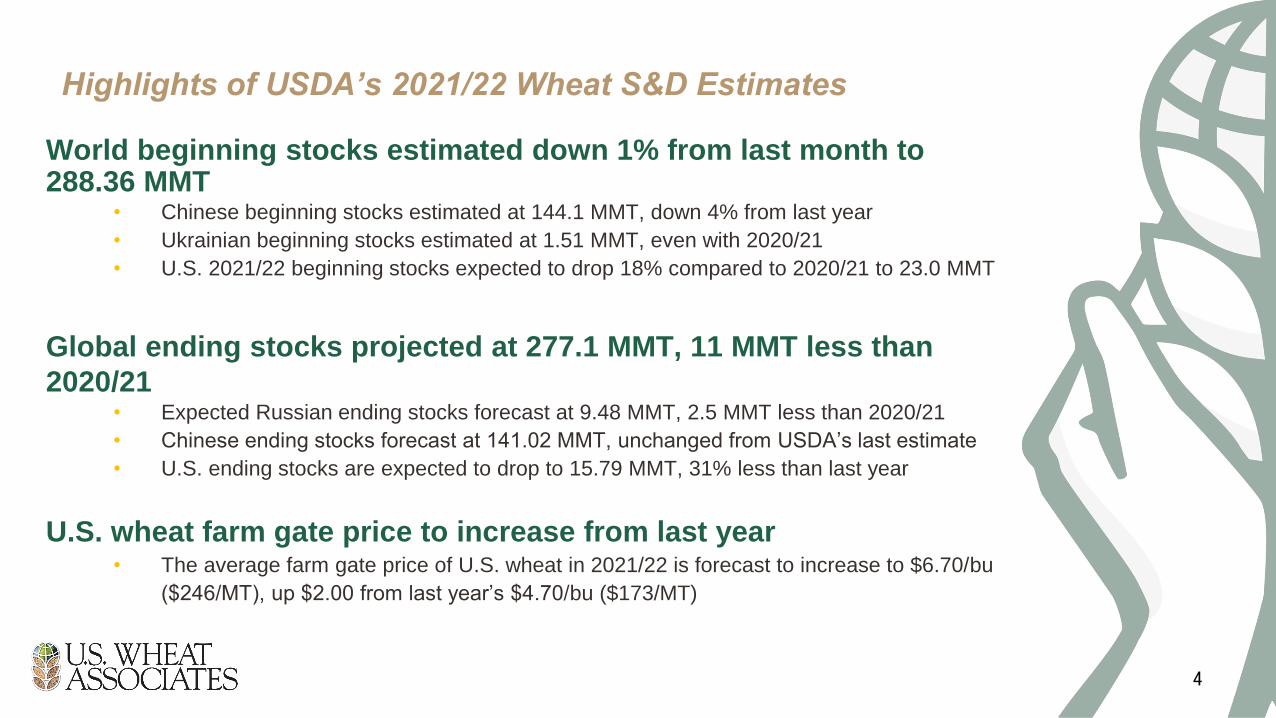
World beginning stocks estimated down 1% from last month to 288.36 MMT
• Chinese beginning stocks estimated at 144.1 MMT, down 4% from last year
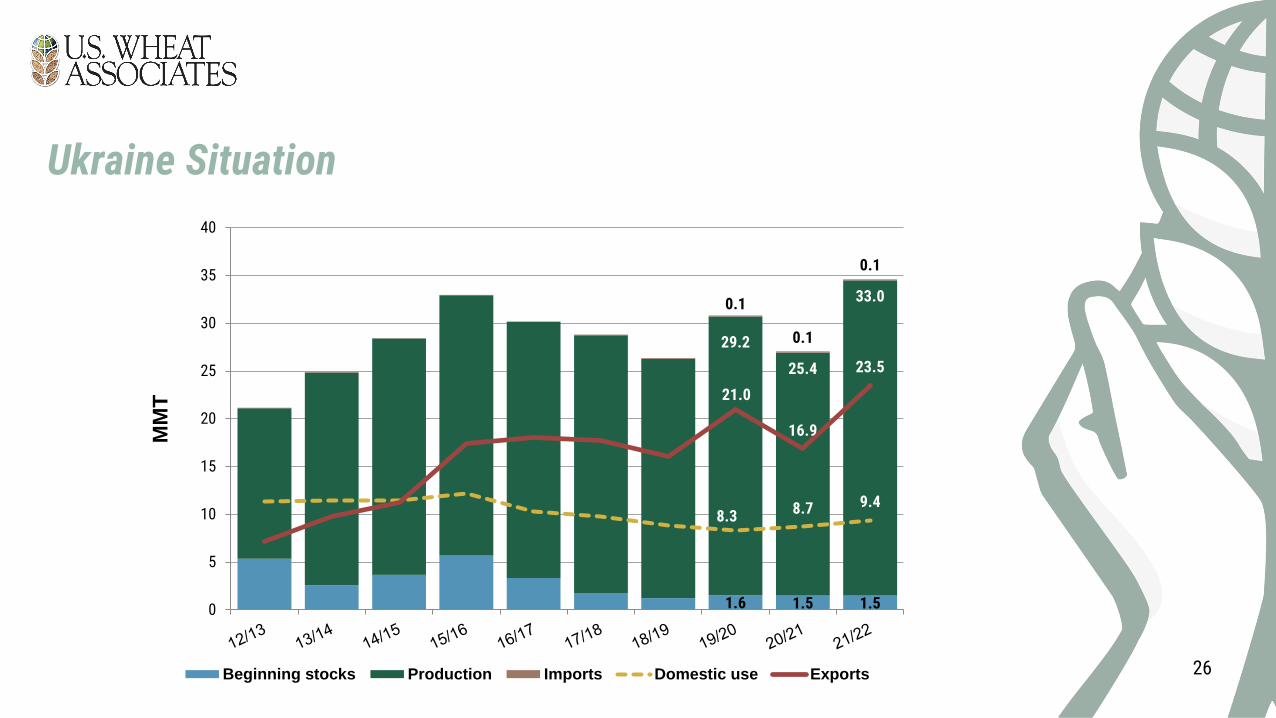
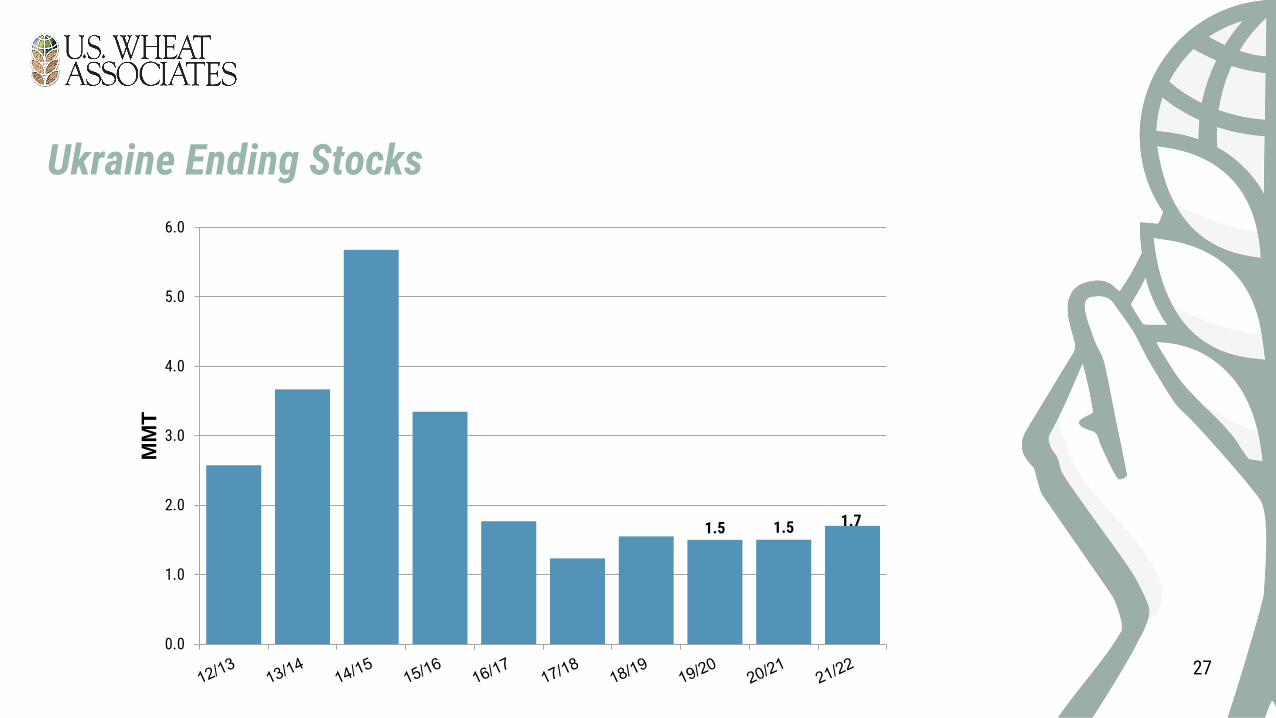
• Ukrainian beginning stocks estimated at 1.51 MMT, even with 2020/21
• U.S. 2021/22 beginning stocks expected to drop 18% compared to 2020/21 to 23.0 MMT
Global ending stocks projected at 277.1 MMT, 11 MMT less than
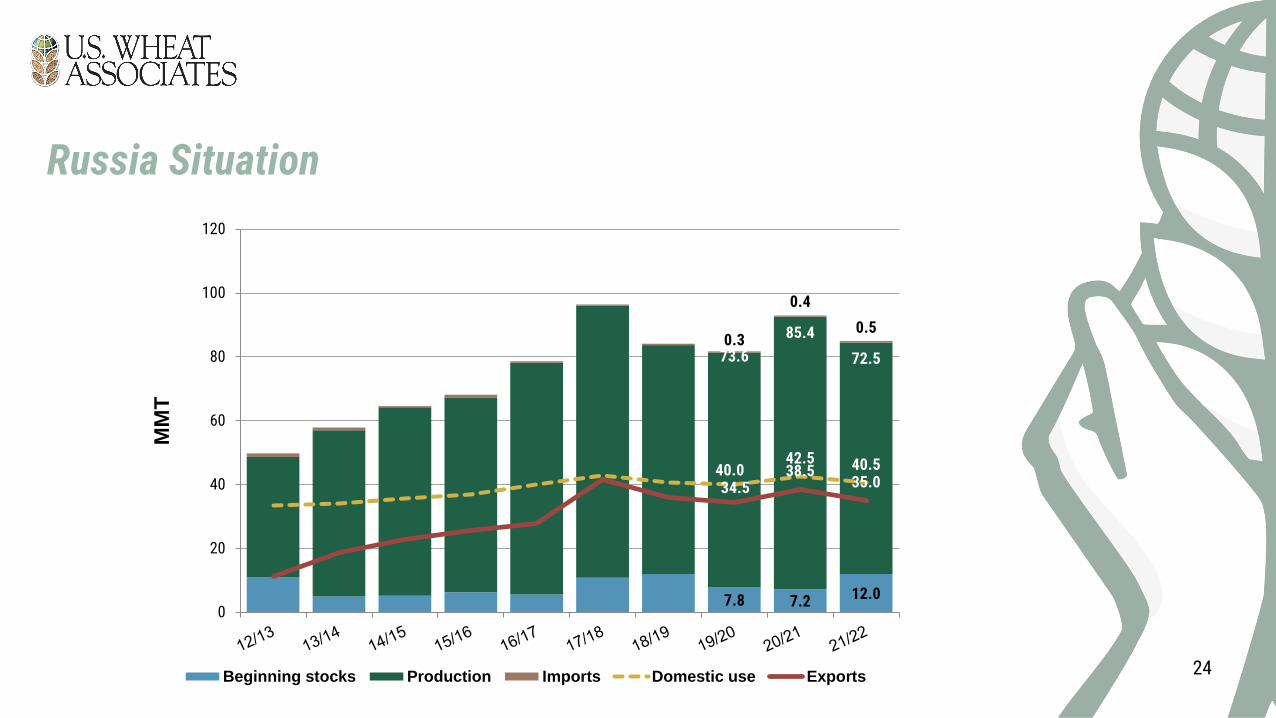
2020/21• Expected Russian ending stocks forecast at 9.48 MMT, 2.5 MMT less than 2020/21
• Chinese ending stocks forecast at 141.02 MMT, unchanged from USDA’s last estimate
• U.S. ending stocks are expected to drop to 15.79 MMT, 31% less than last year
U.S. wheat farm gate price to increase from last year• The average farm gate price of U.S. wheat in 2021/22 is forecast to increase to $6.70/bu
($246/MT), up $2.00 from last year’s $4.70/bu ($173/MT)
4
5
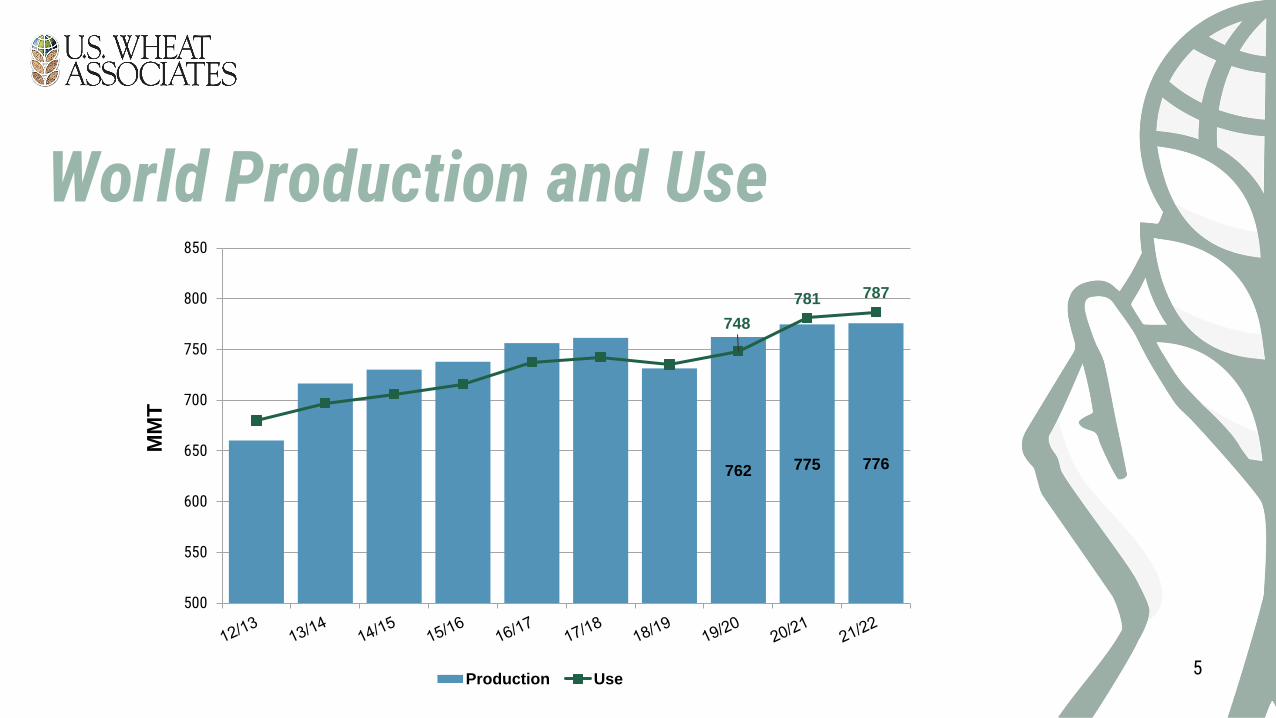
762 775 776
748
781 787
500
550
600
650
700
750
800
850
MM
T
Production Use

6
*Includes U.S., Canada, Australia, Argentina, EU, Russia, Ukraine and Kazakhstan
68 61 60
372 387 374
441447
434
0
50
100
150
200
250
300
350
400
450
500
MM
T
Beginning Stocks Production

7
19/20 20/21 21/22
SUPPLY: Beginning Stocks 281 295 288
Production 762 775 776
Supply Total 1043 1070 1064
Ending Stocks 295 288 277
TRADE: Exports/Imports 194 201 200
DEMAND: Food & Seed 609 624 628
Feed & Residual 139 157 159
Use Total 748 781 787
8
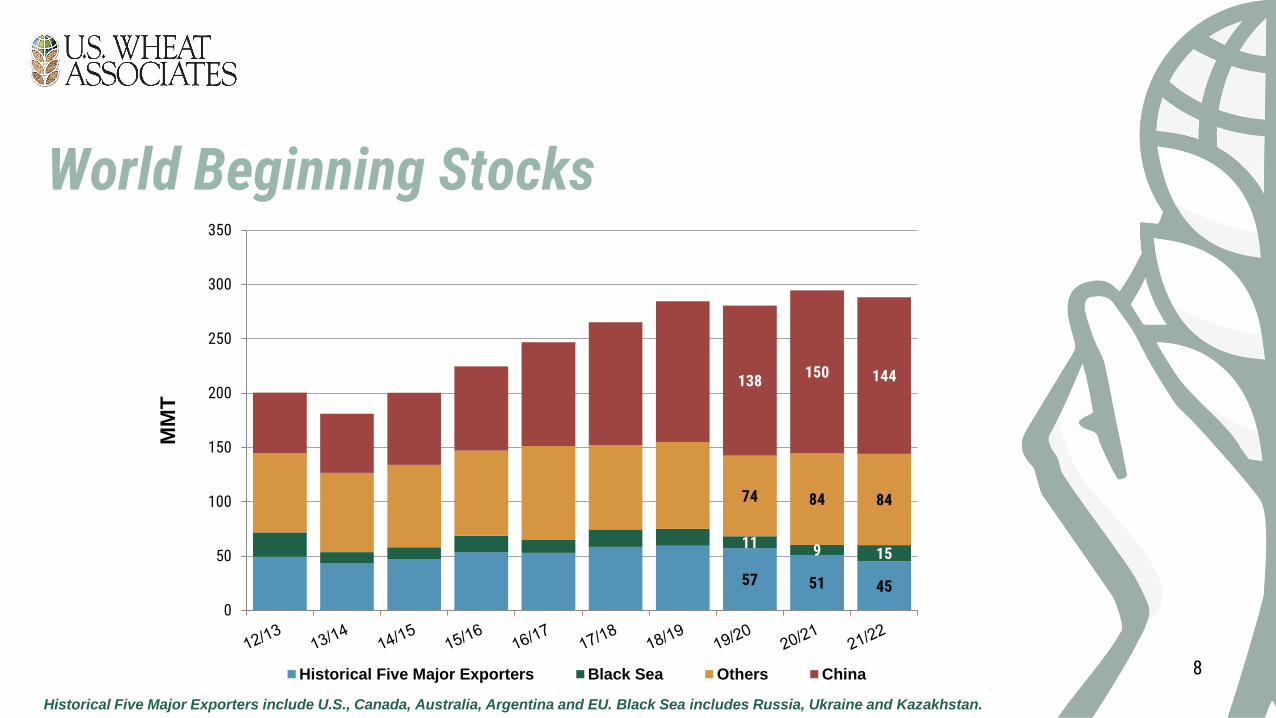
Historical Five Major Exporters include U.S., Canada, Australia, Argentina and EU. Black Sea includes Russia, Ukraine and Kazakhstan.
57 51 45
11 9 15
74 84 84
138150 144
0
50
100
150
200
250
300
350
MM
T
Historical Five Major Exporters Black Sea Others China
9
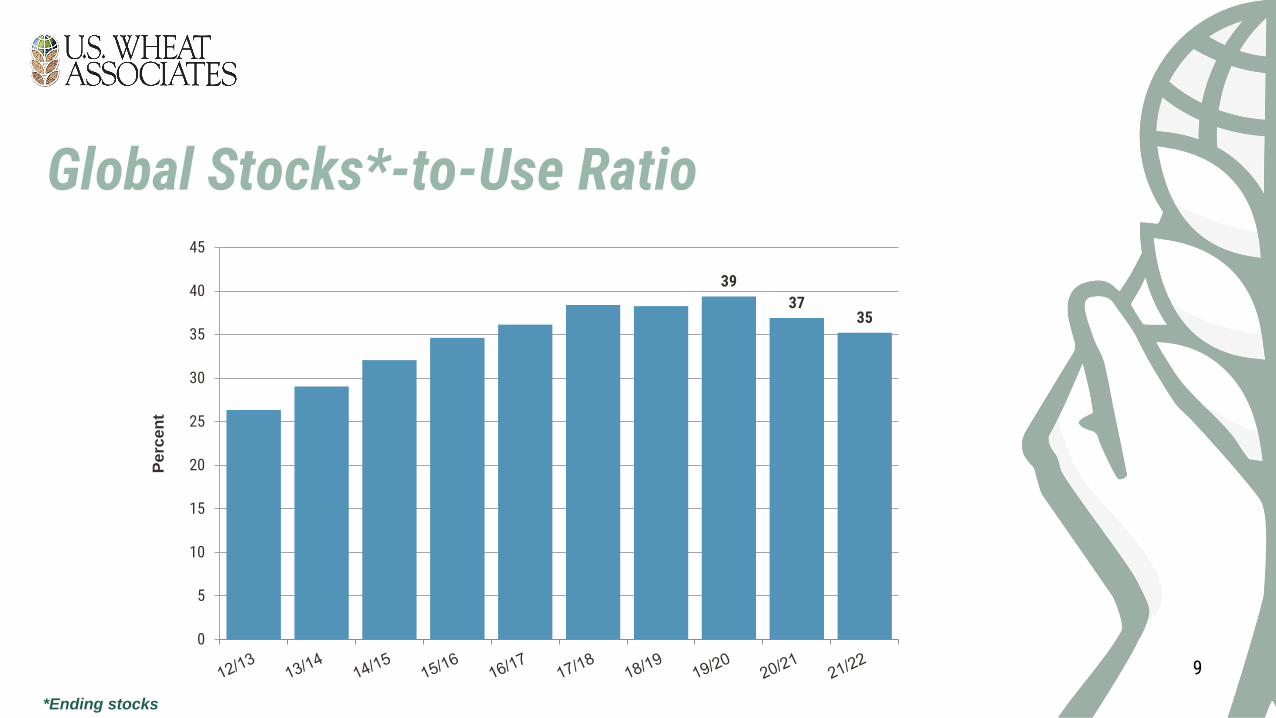
*Ending stocks
39
3735
0
5
10
15
20
25
30
35
40
45
Pe
rce
nt

10
*Ending stocks
23.5
23.1
21.4
19
20
21
22
23
24
25
26
Pe
rce
nt

11
Historical Five Major Exporters include U.S., Canada, Australia, Argentina and EU. Black Sea includes Russia, Ukraine and Kazakhstan.
51 45 38
9 1512
84 8486
150 144141
0
50
100
150
200
250
300
350
MM
T
5 Major Exporters Black Sea Other China

12
Exporters, 59.9
Importers, 94.3
China, 159
Exporters, 63.2
Importers, 92.5
China, 164
Exporters, 63.2
Importers, 92.5
China, 164
Exporters, 63.2
Importers, 92.5
China, 164
Exporters, 63.2
Importers, 92.5
China, 164
Exporters, 63.2
Importers, 92.5
China, 164
Exporters, 63.2
Importers, 92.5
China, 164
Exporters, 63.2
Importers, 92.5
China, 164
Exporters, 63.2
Importers, 92.5
China, 164
Exporters, 63.2
Importers, 92.5
China, 164
Exporters, 63.2
Importers, 92.5
China, 164
Exporters, 59.8
Importers, 89.5
China, 155
Exporters, 59.8
Importers, 89.5
China, 155
Exporters, 60.1
Importers, 90.7
China, 150
Exporters, 60.3
Importers, 89.8
China, 145
Exporters, 63.2
Importers, 91.0
China, 143
Exporters, 63.2
Importers, 91.0
China, 143
Exporters, 63.2
Importers, 91.0
China, 143
Exporters, 63.2
Importers, 91.0
China, 143
Exporters, 50.2
Importers, 87.3
China, 142
Exporters, 53.2
Importers, 89.0
China, 141
Exporters, 50.0
Importers, 86.1
China, 141
Exporters, 50.0
Importers, 86.1
China, 141
Exporters, 50.0
Importers, 86.1
China, 141
Exporters, 50.0
Importers, 86.1
China, 141

13
*Source: Estimated annual average based on U.S. Wheat Associates Price Report data
51 45 38
9 1512
234 228227
$216
$275
$286
$125
$175
$225
$275
$325
$375
0
50
100
150
200
250
300
350
US
D/M
T
MM
T
Historical 5 Majors Black Sea Rest of World HRW Price*

Major Exporters
01

15
*Exportable Supplies = (Beginning Stocks + Production) – Domestic Consumption
52 4736
2218
25
41 5044
7 97
47 3441
2932
19
11 28
27
1514
16
0
50
100
150
200
250
MM
T
Argentina
Australia
Canada
EU
Kazakhstan
Russia
Ukraine
U.S.

16
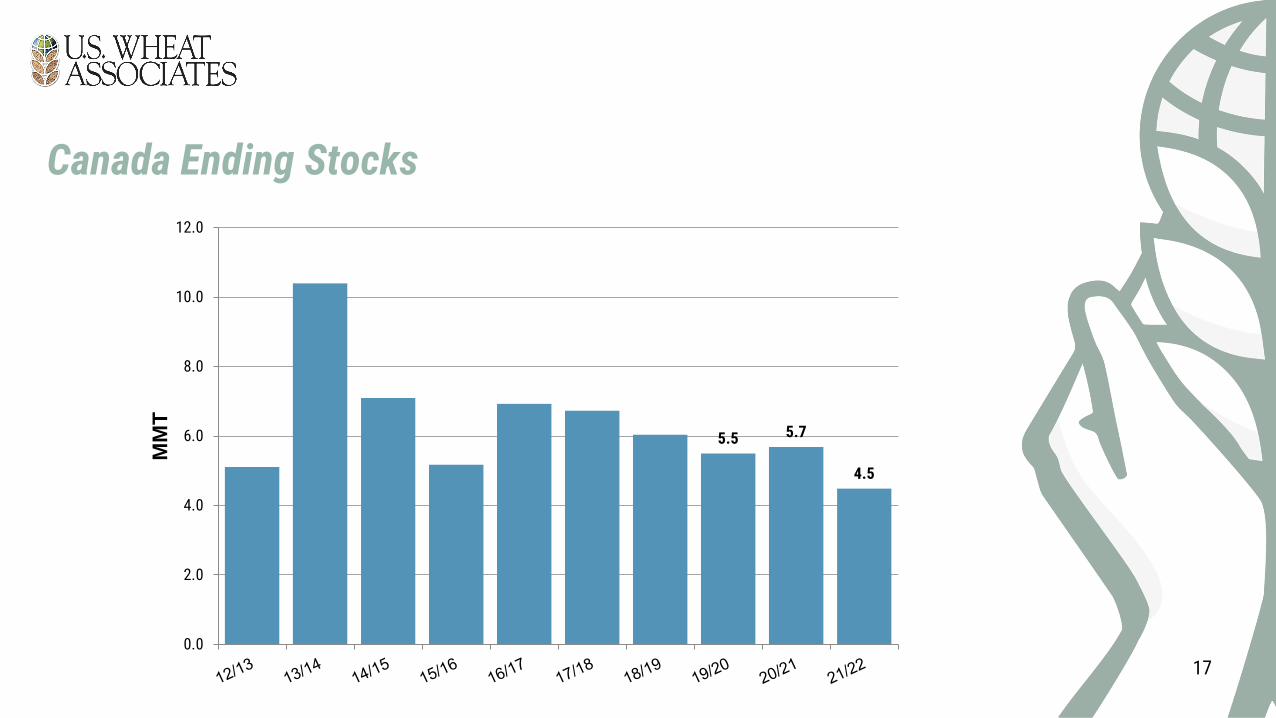
6.0 5.5 5.7
32.735.2
21.0
0.7 0.5
0.7
9.3 9.17.9
24.626.4
15.0
0.0
5.0
10.0
15.0
20.0
25.0
30.0
35.0
40.0
45.0
MM
T
Beginning stocks Production Imports Domestic use Exports
17
5.5 5.7
4.5
0.0
2.0
4.0
6.0
8.0
10.0
12.0
MM
T

18
4.4 2.7 3.9
14.5
33.0 31.5
0.9
0.2 0.2
8.0 8.0 8.0
9.1
24.0 23.5
0.0
5.0
10.0
15.0
20.0
25.0
30.0
35.0
40.0
MM
T
Beginning stocks Production Imports Domestic use Exports

19
2.7
3.94.1
0.0
1.0
2.0
3.0
4.0
5.0
6.0
7.0
MM
T

20
1.7 2.4 2.7
19.8
17.6
20.0
6.4 6.4 6.5
12.8
11.0
13.5
0.0
5.0
10.0
15.0
20.0
25.0
MM
T
Beginning stocks Production Imports Domestic use Exports

21
2.4
2.7 2.7
0.0
0.5
1.0
1.5
2.0
2.5
3.0
3.5
4.0
4.5
5.0
5.5
MM
T

22
15.8 12.6 10.0
138.7
126.0
139.4
5.6
5.4
5.3
107.7 104.3108.5
39.829.7
35.5
0
20
40
60
80
100
120
140
160
180
200
MM
T
Beginning stocks Production Imports Domestic use Exports

23
12.6
10.010.7
0.0
5.0
10.0
15.0
20.0
25.0
MM
T
24
7.8 7.2 12.0
73.6
85.4
72.50.3
0.4
0.5
40.042.5 40.5
34.538.5
35.0
0
20
40
60
80
100
120
MM
T
Beginning stocks Production Imports Domestic use Exports

25
7.2
12.0
9.5
0.0
2.0
4.0
6.0
8.0
10.0
12.0
14.0
MM
T
26
1.6 1.5 1.5
29.2
25.4
33.00.1
0.1
0.1
8.3 8.7 9.4
21.0
16.9
23.5
0
5
10
15
20
25
30
35
40
MM
T
Beginning stocks Production Imports Domestic use Exports
27
1.5 1.5 1.7
0.0
1.0
2.0
3.0
4.0
5.0
6.0
MM
T
28
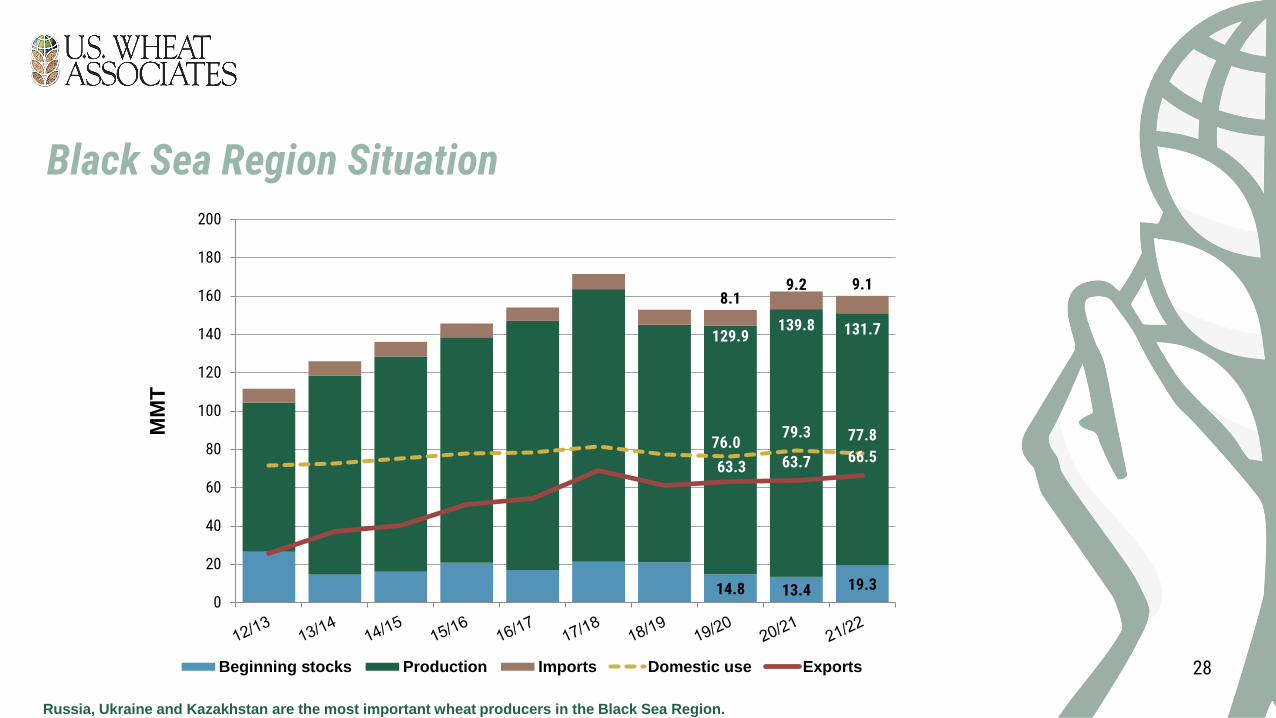
Russia, Ukraine and Kazakhstan are the most important wheat producers in the Black Sea Region.
14.8 13.4 19.3
129.9139.8 131.7
8.19.2 9.1
76.079.3 77.8
63.3 63.7 66.5
0
20
40
60
80
100
120
140
160
180
200
MM
T
Beginning stocks Production Imports Domestic use Exports

29
Russia, Ukraine and Kazakhstan are the most important wheat producers in the Black Sea Region.
34.538.5
35.0
21.016.9 23.5
7.0 8.07.2
0.0
10.0
20.0
30.0
40.0
50.0
60.0
70.0
80.0
MM
T
Russia Ukraine Kazakhstan

30
Russia, Ukraine and Kazakhstan are the most important wheat producers in the Black Sea Region.
13.4
19.3
15.9
0.0
5.0
10.0
15.0
20.0
25.0
30.0
MM
T
31
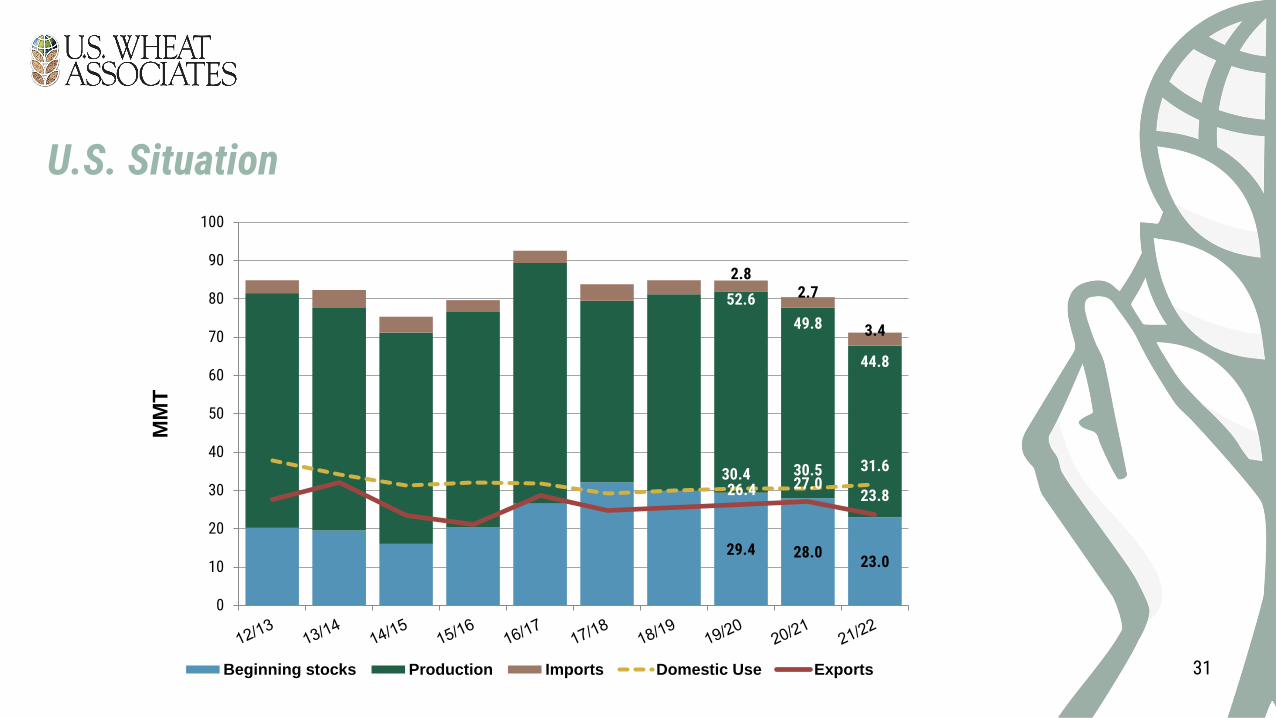
29.4 28.023.0
52.6
49.8
44.8
2.82.7
3.4
30.4 30.5 31.6
26.4 27.023.8
0
10
20
30
40
50
60
70
80
90
100
MM
T
Beginning stocks Production Imports Domestic Use Exports

32
19.5
16.1
0.0
5.0
10.0
15.0
20.0
25.0
30.0
35.0
MM
T

Import Demand
02

34
0.0
1.0
2.0
3.0
4.0
5.0
6.0
7.0
8.0
9.0
10.0
11.0
12.0
13.0
14.0
MM
T
20/21 21/22

35
Source: USDA FAS export sales data as of May 31, 2021
3.17
2.872.78
1.51 1.45
1.18 1.13
0.81 0.800.72
0.0
0.5
1.0
1.5
2.0
2.5
3.0
3.5
MM
T
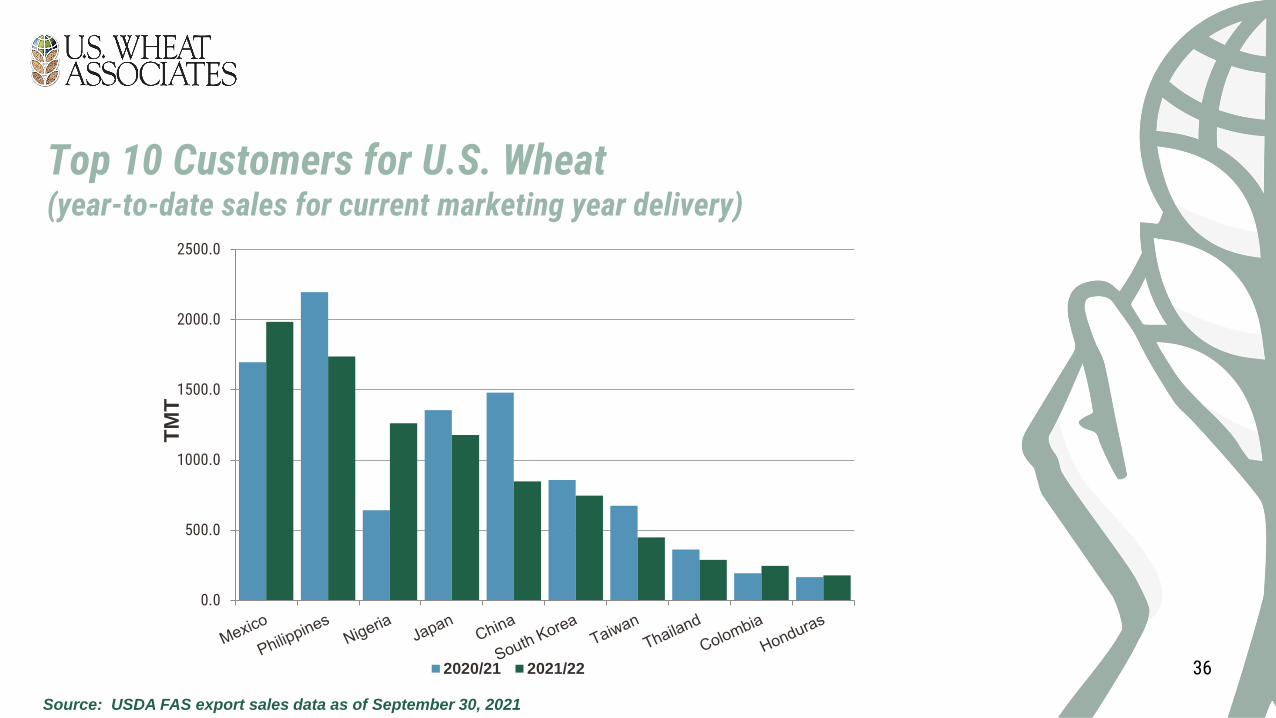
36
Source: USDA FAS export sales data as of September 30, 2021
0.0
500.0
1000.0
1500.0
2000.0
2500.0
TM
T
2020/21 2021/22

37
0
50
100
150
200
250
MM
T
"Other" China FSU EU

U.S. Situation by Class
03

39
*Source: June 2021 USDA Acreage Report
22.50 21.50 23.60
12.00 11.5010.80
5.22 5.636.59
4.12 4.124.301.34 1.681.48
0.0
10.0
20.0
30.0
40.0
50.0
60.0
Millio
n A
cre
s
HRW HRS SRW White Durum

40
Source: USDA FAS export sales data as of September 30, 2021
5.39
4.27
3.16
1.16
0.54
4.36
3.08
2.081.77
0.12
0.0
1.0
2.0
3.0
4.0
5.0
6.0
HRW HRS White SRW Durum
MM
T
2020/21 2021/22

41
13.8 11.6
17.920.4
9.3 9.8
0.0
5.0
10.0
15.0
20.0
25.0
30.0
35.0
40.0
45.0
MM
T
Beginning stocks Production Imports Exports

42
7.66.4
14.4
8.1
1.3
1.6
7.7
6.1
0.0
5.0
10.0
15.0
20.0
25.0
MM
T
Beginning stocks Production Imports Exports
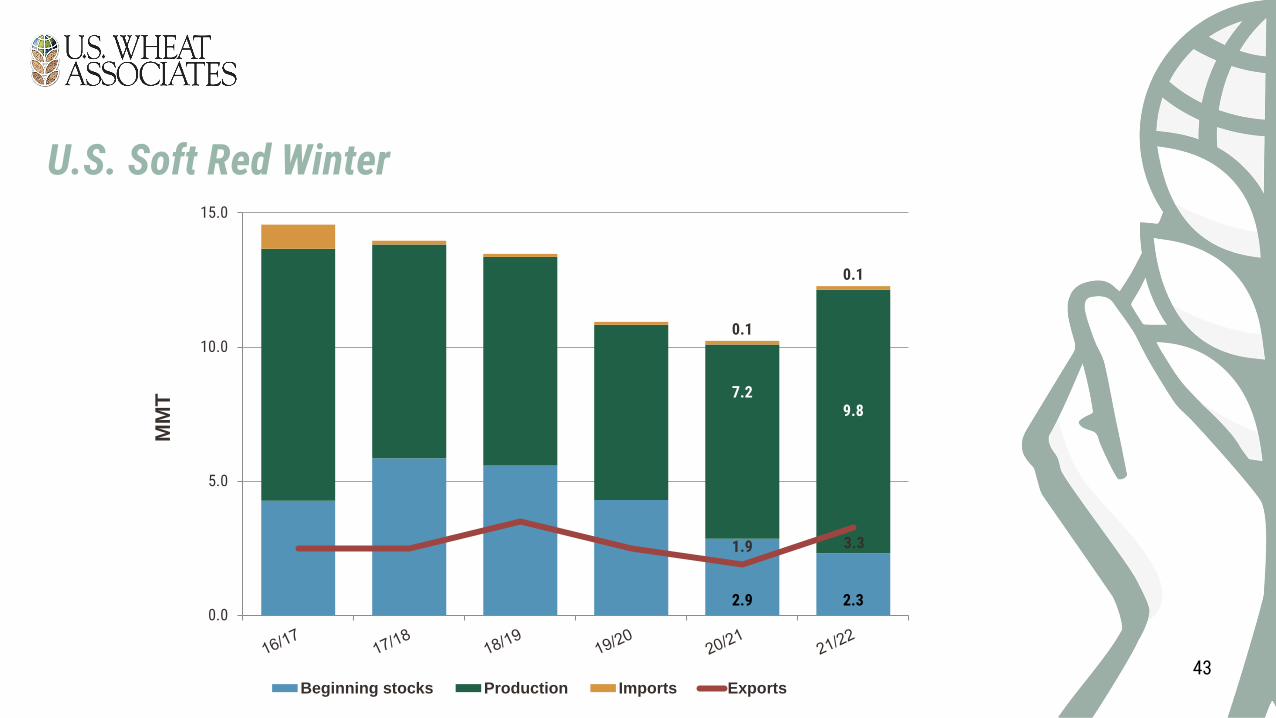
43
2.9 2.3
7.29.8
0.1
0.1
1.9 3.3
0.0
5.0
10.0
15.0
MM
T
Beginning stocks Production Imports Exports

44
2.61.9
8.2
5.5
0.2
0.17.3
4.2
0.0
2.0
4.0
6.0
8.0
10.0
12.0
MM
T
Beginning stocks Production Imports Exports
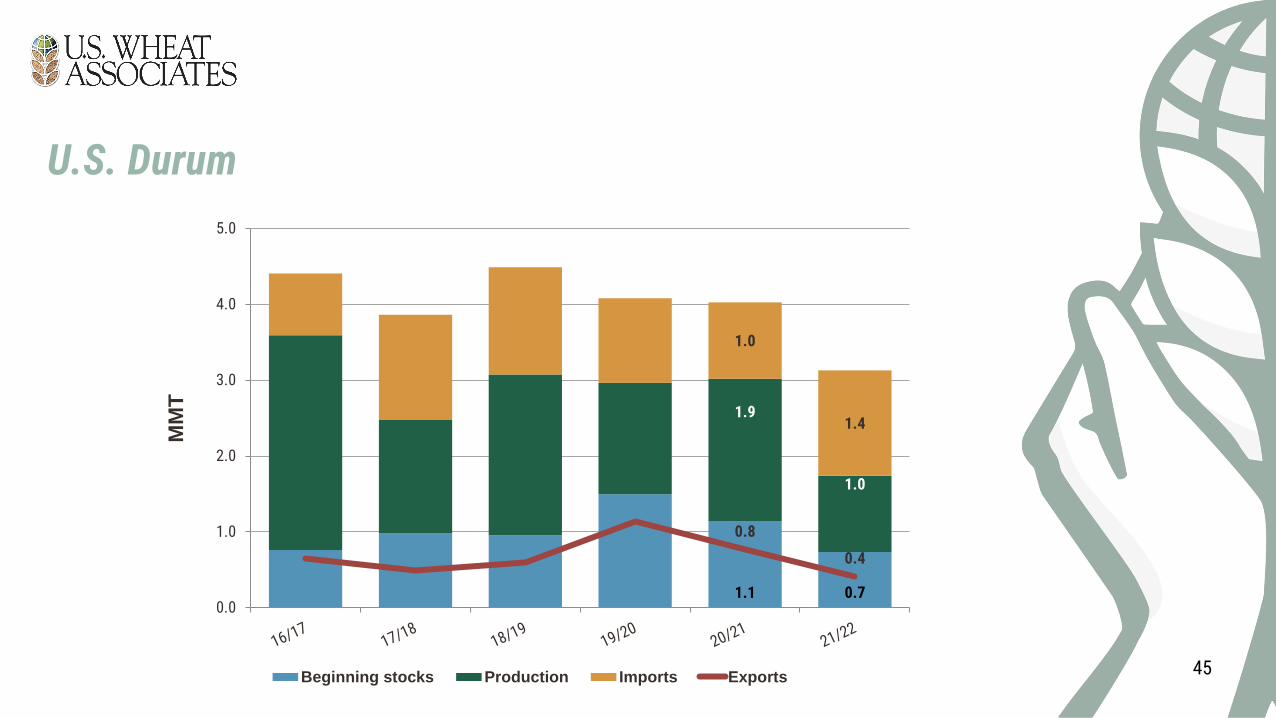
45
1.1 0.7
1.9
1.0
1.0
1.4
0.8
0.4
0.0
1.0
2.0
3.0
4.0
5.0
MM
T
Beginning stocks Production Imports Exports

46
0.0
2.0
4.0
6.0
8.0
10.0
12.0
14.0
16.0
18.0
HRW HRS SRW White Durum
MM
T
16/17 17/18 18/19 19/20 20/21 21/22
47
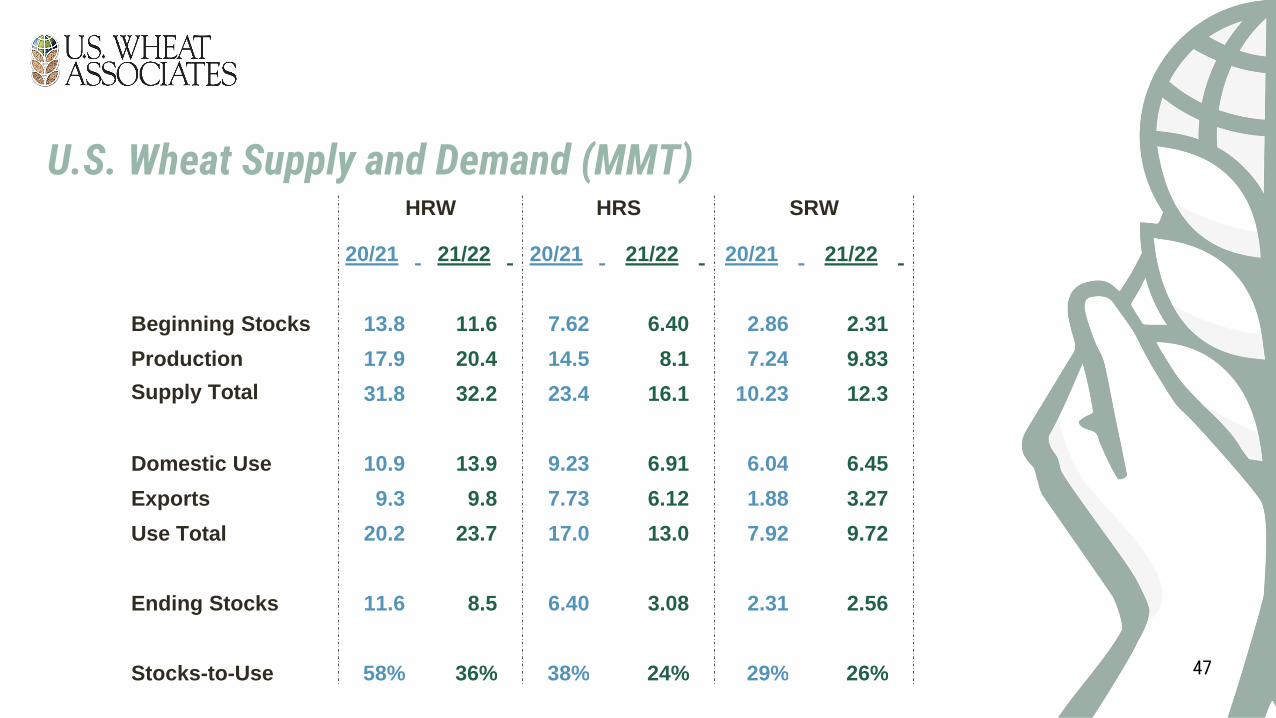
HRW HRS SRW
20/21 21/22 20/21 21/22 20/21 21/22
Beginning Stocks 13.8 11.6 7.62 6.40 2.86 2.31
Production 17.9 20.4 14.5 8.1 7.24 9.83
Supply Total 31.8 32.2 23.4 16.1 10.23 12.3
Domestic Use 10.9 13.9 9.23 6.91 6.04 6.45
Exports 9.3 9.8 7.73 6.12 1.88 3.27
Use Total 20.2 23.7 17.0 13.0 7.92 9.72
Ending Stocks 11.6 8.5 6.40 3.08 2.31 2.56
Stocks-to-Use 58% 36% 38% 24% 29% 26%

48
White Durum Total
20/21 21/22 20/21 21/22 20/21 21/22
Beginning Stocks 2.59 1.91 1.14 0.73 28.0 23.0
Production 8.25 5.47 1.88 1.01 49.8 44.8
Supply Total 11.0 7.51 4.03 3.13 80.5 71.2
Domestic Use 1.74 2.18 2.53 2.18 30.5 31.6
Exports 7.35 4.22 0.76 0.41 27.0 23.8
Use Total 9.09 6.40 3.29 2.59 57.5 55.4
Ending Stocks 1.91 1.12 0.73 0.54 23.0 15.8
Stocks-to-Use 21% 17% 22% 21% 40% 28%
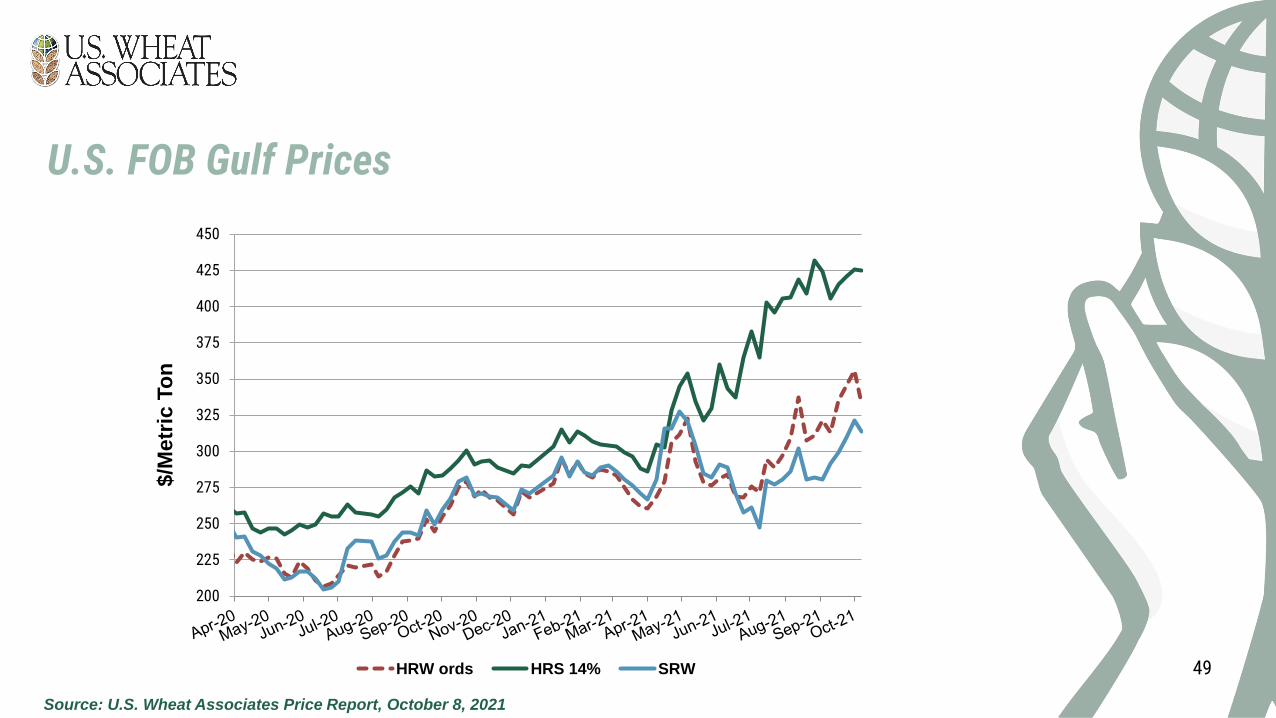
49
Source: U.S. Wheat Associates Price Report, October 8, 2021
200
225
250
275
300
325
350
375
400
425
450
$/M
etr
ic T
on
HRW ords HRS 14% SRW

50
Source: U.S. Wheat Associates Price Report, October 8, 2021
200
225
250
275
300
325
350
375
400
425
450
475
500
525
$/M
etr
ic T
on
HRW 11.5% HRS 14% SW 10.5% Max
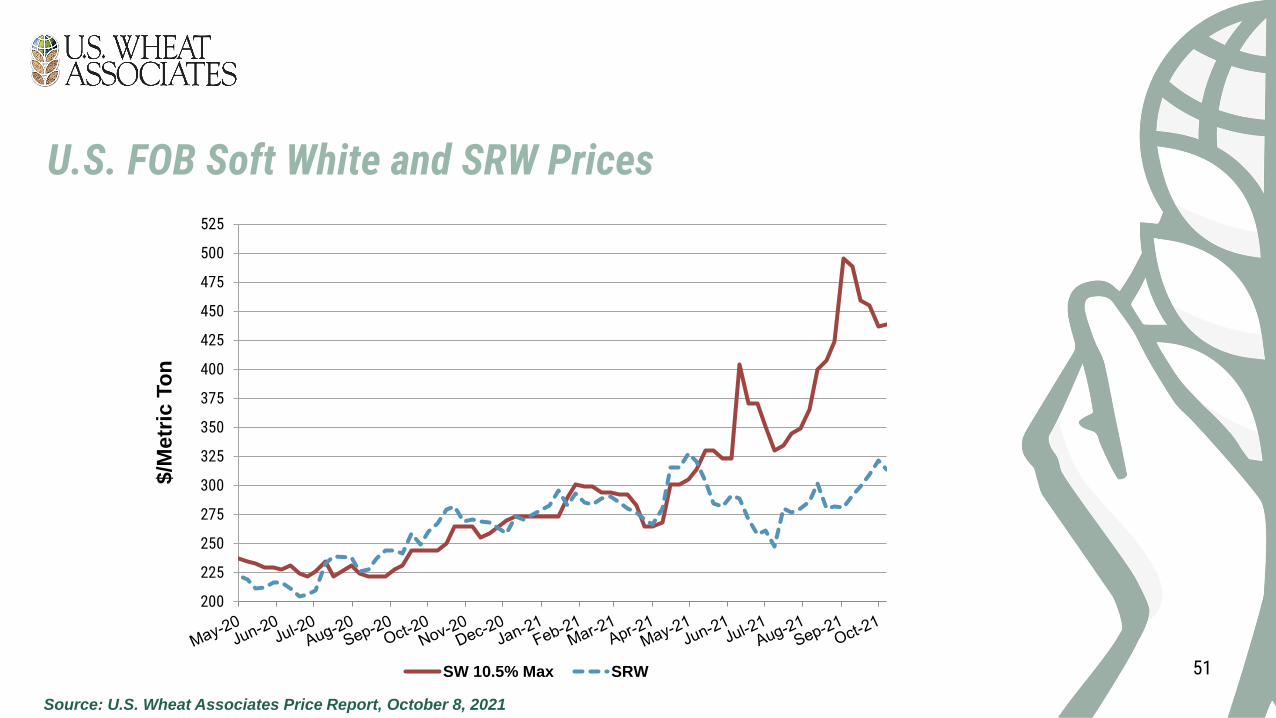
51
Source: U.S. Wheat Associates Price Report, October 8, 2021
200
225
250
275
300
325
350
375
400
425
450
475
500
525
$/M
etr
ic T
on
SW 10.5% Max SRW

52
Source: U.S. Wheat Associates Price Report, October 8, 2021
10
30
50
70
90
$/M
etr
ic T
on
HRS 13.5 HRW 12 SRW
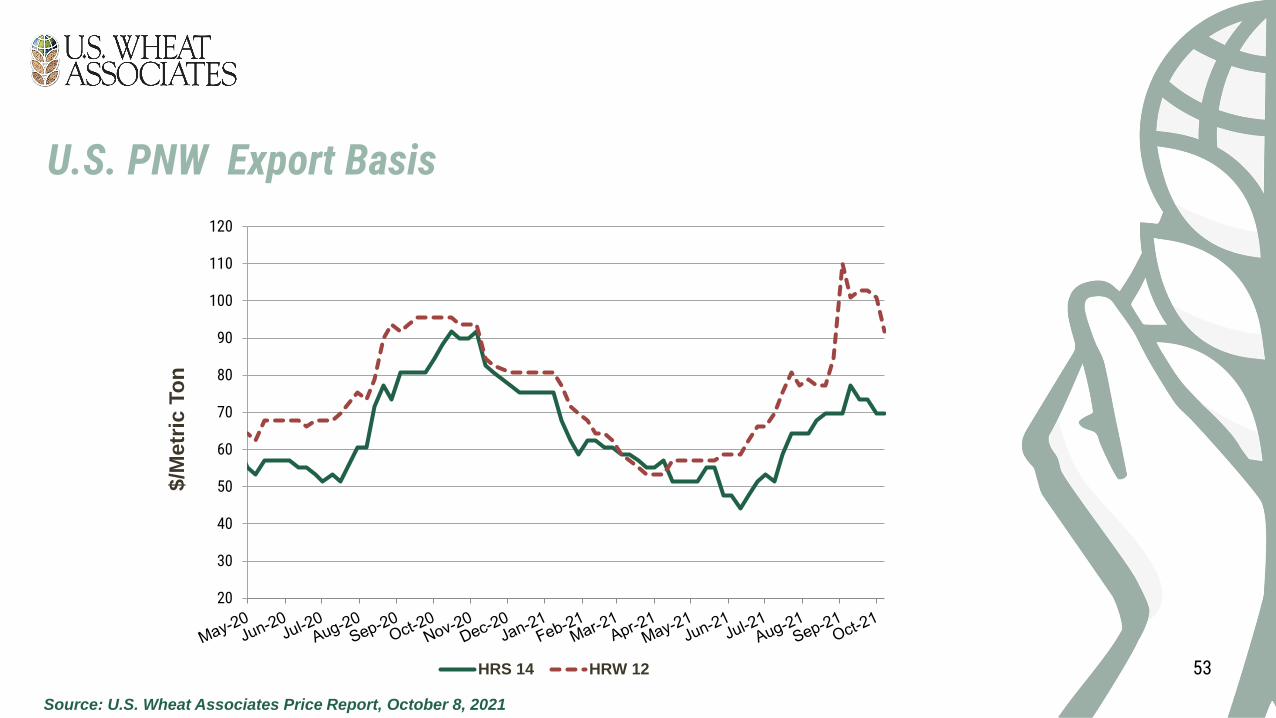
53
Source: U.S. Wheat Associates Price Report, October 8, 2021
20
30
40
50
60
70
80
90
100
110
120
$/M
etr
ic T
on
HRS 14 HRW 12

Outlook
04

55
19.7 18.3 18.8 19.1 17.715.2 16.0 15.1 14.9 15.0
61.358.1
55.1 56.1
62.8
47.4
51.3 52.649.8
44.8
3.13.2
2.9 2.9
3.5
3.13.2
3.5
3.3
3.0
2.0
2.2
2.4
2.6
2.8
3.0
3.2
3.4
3.6
3.8
4.0
10.0
20.0
30.0
40.0
50.0
60.0
70.0
80.0
MT
/hec
tare
Pro
du
cti
on
(M
MT
) a
nd
Ha
rve
ste
d A
rea
(m
h)
Harvested Area Production Yield
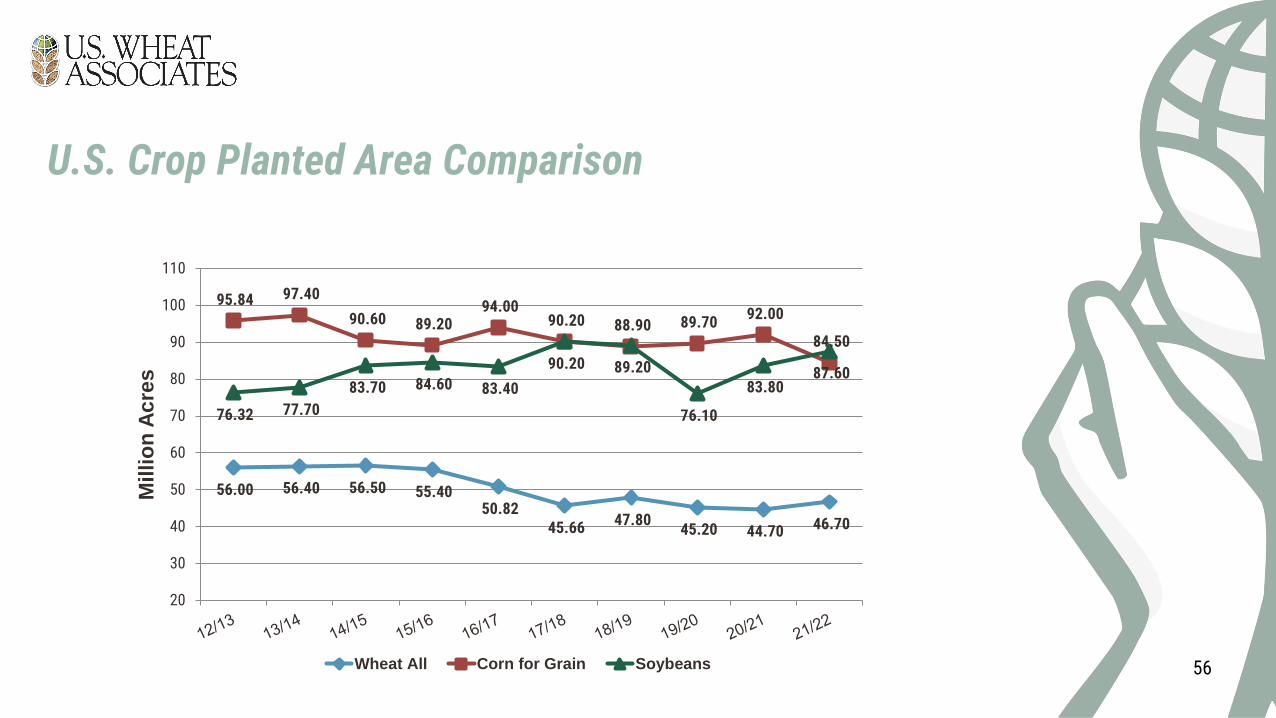
56
56.00 56.40 56.50 55.40 50.82
45.66 47.80 45.20 44.70 46.70
95.84 97.40
90.60 89.20 94.00
90.20 88.90 89.70 92.00
84.50
76.32 77.70
83.70 84.60 83.40
90.20 89.20
76.10
83.80 87.60
20
30
40
50
60
70
80
90
100
110
Millio
n A
cre
s
Wheat All Corn for Grain Soybeans

57
77
5
77
6
78
1
78
7
201 200
100
120
140
160
180
200
220
500
550
600
650
700
750
800
850
Tra
de (
MM
T)
Pro
du
cti
on
an
d U
se
(M
MT
)
Production Use Trade

581
13
0
0
50
100
150
200
250
0
200
400
600
800
1,000
1,200
1,400
Tra
de (
MM
T)
Pro
du
cti
on
an
d U
se (
MM
T)
Production Use Trade
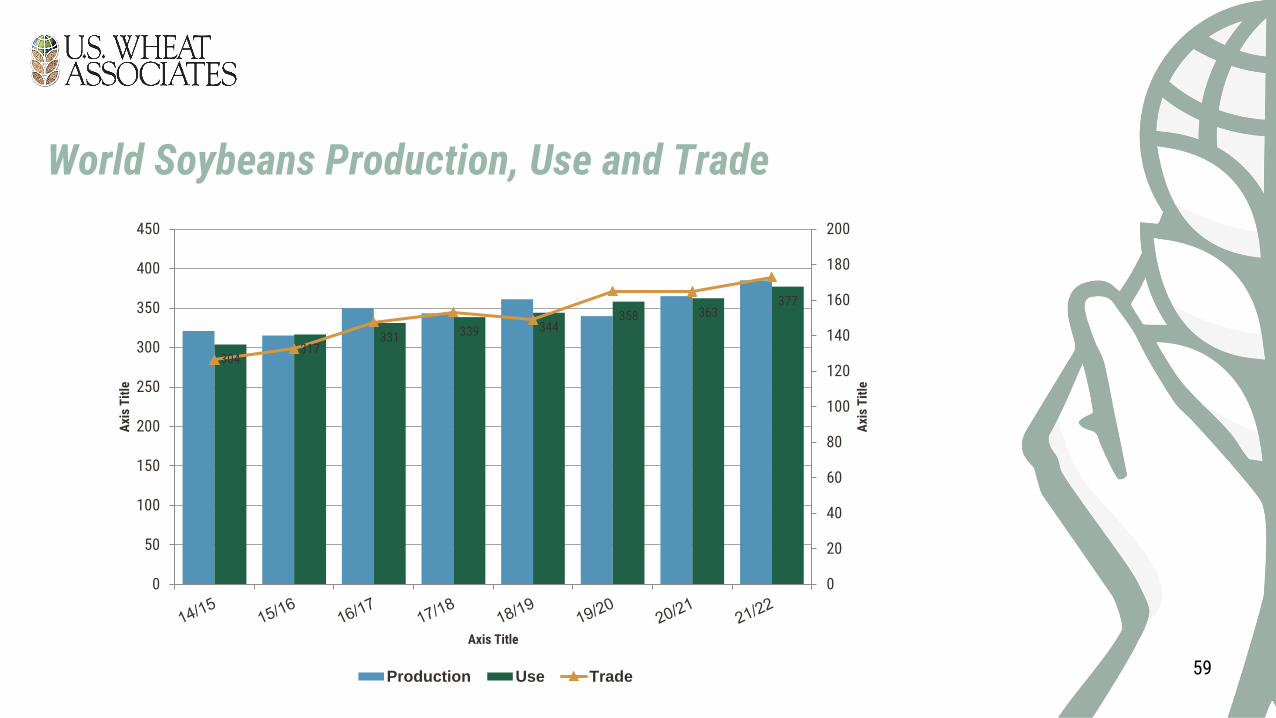
59
304317
331 339 344358 363
377
0
20
40
60
80
100
120
140
160
180
200
0
50
100
150
200
250
300
350
400
450
Axi
s T
itle
Axi
s T
itle
Axis Title
Production Use Trade
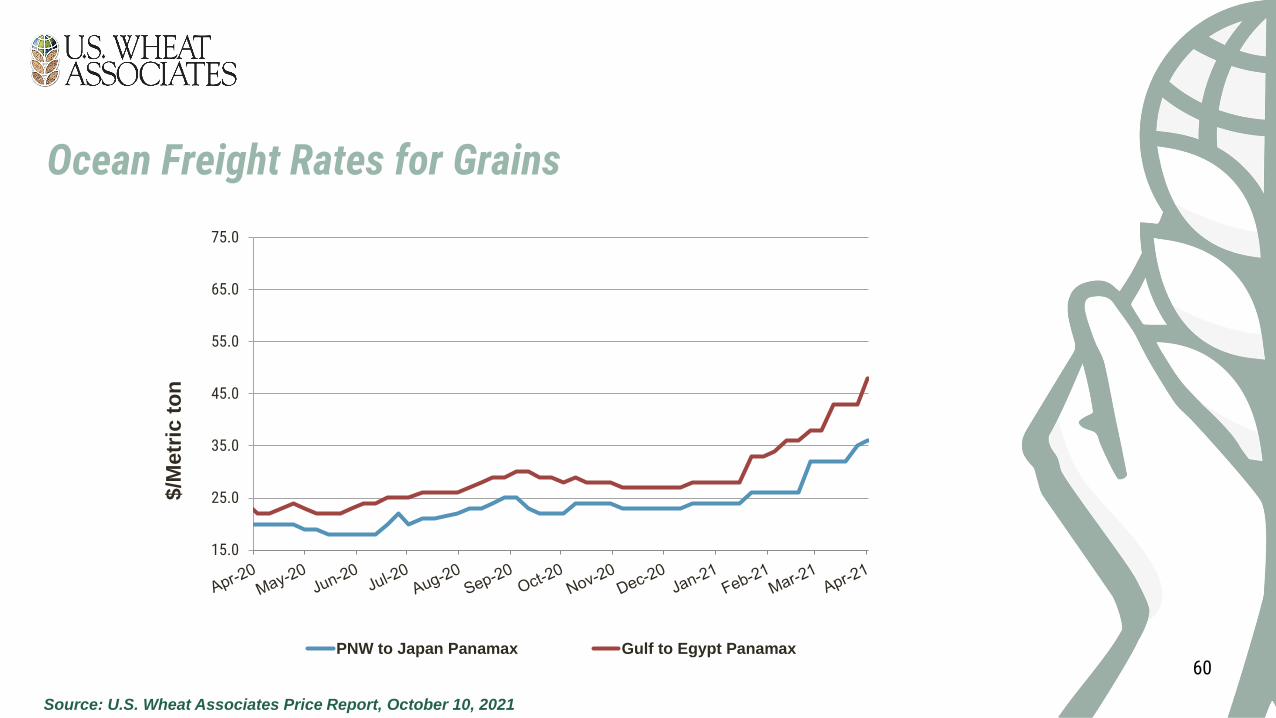
60
Source: U.S. Wheat Associates Price Report, October 10, 2021
15.0
25.0
35.0
45.0
55.0
65.0
75.0
$/M
etr
ic t
on
PNW to Japan Panamax Gulf to Egypt Panamax

Highlights of USDA’s 2021/22 Wheat S&D Estimates
2021/22 global wheat production forecast to reach 775.87 MMT• Production in Canada is forecast at 21 MMT, 2 MMT less than USDA’s September
estimate
• Production in the European Union is forecast at 139.40 MMT, up 11% from 2020/21
• U.S. production is expected to decrease to 44.79 MMT, down 10% compared to 2020/21
Global ending stocks projected at 277.1 MMT, 11 MMT less than 2020/21• Expected Russian ending stocks forecast at 9.48 MMT, 2.5 MMT less than 2020/21
• Chinese ending stocks forecast at 141.02 MMT, unchanged from USDA’s estimate last
month
• U.S. ending stocks are expected to drop to 15.79 MMT, 31% less than last year
Global consumption forecast at 787.1 MMT, down 1% from 2020/21• Domestic consumption in India forecast at 104.5 MMT, 2.2 MMT more than 2020/21
• Domestic consumption in Nigeria is forecast at 5.7 MMT, 200 TMT more than 2020/21
• U.S. domestic consumption forecast to 31.5 MMT, 1.1 MMT more than 2020/21
61

THANK YOU