world wide industry report (sample) industry reports/2017... · process, gathering data for contact...
TRANSCRIPT

World Wide Industry Report (Sample) Industry
January 2017
World Wide Industry Benchmark Report
for Contact Centers in the (Sample) Industry
Bruce Belfiore Senior Research Executive
John Chatterley Senior Research Manager
David Raia Alan Pottkotter Helen Thomas Senior Research Technical Producer Copy Editor Analyst
Current as of: January 26, 2017

i Copyright © 2017 , BenchmarkPortal, LLC.
For internal use only. Distribution beyond purchasing company is strictly prohibited.
Copyright © 2017 BenchmarkPortal, LLC.
Please send detailed questions to: [email protected] This report may not be copied, scanned or reproduced without the written permission of BenchmarkPortal, LLC. Additional copies may be purchased by e-mailing [email protected] or by calling ++(800) 214-8929, extension 1 or extension 5. For internal use only. Distribution beyond purchasing company is strictly prohibited.
Revision: 1/26/2017

ii Copyright © 2017 , BenchmarkPortal, LLC.
For internal use only. Distribution beyond purchasing company is strictly prohibited
Table of Contents
Acknowledgements iv
CHAPTER 1: INTRODUCTION 1
CHAPTER 2: METHODOLOGY 4
CHAPTER 3: HIGHLIGHTS AND INTERPRETATION OF THE WORLDWIDE(SAMPLE INDUSTRY) KEY PERFORMANCE INDICATORS (KPIS) 7
CHAPTER 4: DETAILED BENCHMARK RESULTS FOR THE AMERICAS, EMEA, AND ASIA PACIFIC GEOGRAPHICAL REGIONS 12
CHAPTER 5: TRENDS IN SELECTED CONTACT CENTER METRICS 32
CHAPTER 6: FREQUENTLY ASKED QUESTIONS 49
APPENDIX A: GLOSSARY OF TERMS FOR CONTACT CENTERS 52
APPENDIX B: TONCHEV PERFORMANCE INDEX 70
APPENDIX C: PRINCIPAL INVESTIGATORS 76
APPENDIX D: PARTIAL LIST OF BENCHMARK PARTICIPANTS 81
APPENDIX E: COMMUNITY RESOURCES & PRODUCT LISTING 89
iii Copyright © 2017 , BenchmarkPortal, LLC.
For internal use only. Distribution beyond purchasing company is strictly prohibited.
List of Figures
Figure 1. Inbound Contact Types .........................................................................................................................9 Figure 2. Reasons for Inbound Contacts ........................................................................................................ 10 Figure 3. Average Cost per Inbound Call .......................................... Error! Bookmark not defined. Figure 4. Average Speed of Answer .................................................... Error! Bookmark not defined. Figure 5. Average Call Handle Time .................................................... Error! Bookmark not defined. Figure 6. Average Abandon Rate .......................................................... Error! Bookmark not defined. Figure 7. Percentage of Calls Closed on First Call ......................... Error! Bookmark not defined. Figure 8. Contact Centers That Have a Formal Mechanism to Gather Customer
Feedback ..................................................................................... Error! Bookmark not defined. Figure 9. Percent of Perfect Customer Satisfaction Scores ....... Error! Bookmark not defined. Figure 10. Percent of Lowest Customer Satisfaction Scores ....... Error! Bookmark not defined. Figure 11. Annual Agent Turnover Rate .............................................. Error! Bookmark not defined. Figure 12. Average Handle Time per Channel .................................. Error! Bookmark not defined. Figure 13. Average Cost per Transaction by Channel .................... Error! Bookmark not defined. Figure 14. Average First-Contact Resolution by Channel............. Error! Bookmark not defined. Figure 15. Average First-Contact Resolution by Channel............. Error! Bookmark not defined. Figure 16. ustomer Satisfaction Trends - 2005-2016 (All Industries Averages) .......................... 26 Figure 17. Customer Satisfaction & First-Call Resolution Trends - 2005-2016 (All
Industries Averages) .............................................................. Error! Bookmark not defined. Figure 18. Agent Satisfaction vs. Customer Satisfaction Trends – 2010-2016 (All
Industries Averages) .............................................................. Error! Bookmark not defined. Figure 19. Average Speed of Answer vs. Customer Satisfaction Trends – 2005 –
2016 (All Industries Averages) ......................................... Error! Bookmark not defined. Figure 20. ASA & Customer Satisfaction – Top Box Comparison by Quintile (All
Industries) .................................................................................. Error! Bookmark not defined. Figure 21. Efficiency KPI Trends – 2005 – 2016 (All Industries Averages)Error! Bookmark not defined. Figure 22. Trends in Cost per Call – 2005 – 2016 (All Industries Averages)Error! Bookmark not defined. Figure 23. Average Handle Time Trends – 2005 – 2016 (All Industries Averages)Error! Bookmark not defined. Figure 24. Occupancy & Utilization Trends – 2010 – 2016 (All Industries Averages)Error! Bookmark not defined. Figure 25. Trend in Auxiliary Time – 2010 – 2016 (All Industries Averages)Error! Bookmark not defined. Figure 26. Calls per Agent per Hour Trend – 2012 – 2016 (All Industries Averages)Error! Bookmark not defined. Figure 27. First-Call Resolution Trends by Channel – 2012 – 2016 (All Industries
Averages) ................................................................................. Error! Bookmark not defined. Figure 28. Cost per Contact by Contact Channel Trends – 2012 – 2016 (All
Industries Averages) .............................................................. Error! Bookmark not defined. Figure 29. Average Handle Time per Contact Channel Trends – 2012– 2016 (All
Industries Averages) .............................................................. Error! Bookmark not defined.

iv Copyright © 2017 , BenchmarkPortal, LLC.
For internal use only. Distribution beyond purchasing company is strictly prohibited
Acknowledgements
We wish to extend our thanks to the many contact center managers who have kept our database current and growing over the years. We would also like to acknowledge the contribution of colleagues who have provided both inspiration and perspiration to make this effort useful to managers all over the world. In particular, we note the founding contributions of our former partners, Dr. Jon Anton and David Machin, and the constant support of Professor Richard Feinberg of Purdue University. Bruce L. Belfiore, Senior Research Executive John Chatterley, Senior Research Manager

1 Copyright © 2017 , BenchmarkPortal, LLC.
For internal use only. Distribution beyond purchasing company is strictly prohibited.
Chapter 1: Introduction
2 Copyright © 2017 , BenchmarkPortal, LLC.
For internal use only. Distribution beyond purchasing company is strictly prohibited
Chapter 1: Introduction
“Every enterprise, in every sector, can benefit from comparing itself to other similar operations. This promotes a process of creative soul-searching regarding comparative strengths and weaknesses, which in turn leads to identification and adoption of best practice improvements. We have repeatedly seen the truly transformative power of systematic benchmarking.” ~ Bruce Belfiore, BenchmarkPortal
Benchmarking has proven to be an important management tool, especially since the late 1970’s. Comparing operating metrics and methodologies with other enterprises in the same industry has provided managers with useful insights that, in turn, result in a virtuous process of discovery, action and improvement that leads, in turn, to superior performance. Superior performance in customer contact is more important today than ever. As products become commoditized, it is the service aspect which determines loyalty and repeat sales in more and more industries. Knowing your competitive position on the customer service you provide is key. Contact centers are ideal operations for benchmarking for several reasons: They all have systems (such as Automatic Call Distributors, or ACDs) that
automatically capture reams of data on key performance metrics. Unlike industries where gathering apples-to-apples data is a long and laborious process, gathering data for contact centers is easier - - and can now be largely automated.
Senior managers look to contact centers to prove their value to the organization on a regular basis. Benchmarking the contact center provides management the performance-based information needed to make decisions on staffing, technology acquisition, and other budget-related matters
Contact centers are one of the enterprise’s keys to the customer experience,
satisfaction and, ultimately, loyalty. The center’s relative performance on quality metrics can reveal volumes about its competitive position against its industry.
In addition, we have found that a rigorous methodology, which is based on balancing quality and costs, and which maps negative gaps in key metrics to specific processes and

Chapter 1: Introduction
3 Copyright © 2017 , BenchmarkPortal, LLC.
For internal use only. Distribution beyond purchasing company is strictly prohibited
technologies in the contact center, can reveal much about what is going well - - and what is going poorly - - in a contact center. This, in turn, allows management to study and take actions that will build competitive strength for the center over time. BenchmarkPortal has developed a balanced scorecard process which is explained in Appendix B (The Tonchev Performance Index) and which lies at the heart of benchmark reports which are provided to individual centers that input their data into the BenchmarkPortal database. Our industry reports have evolved over time, and continue to do so. We have recently launched our Multi-Channel Benchmark Survey, which includes more data from the email, chat, white mail and social media channels. It will take time to develop enough data to provide these metrics on an industry-specific basis. In the meantime, we include here metrics that are gathered from all industries. We hope that you find this report useful and a stimulant for improvement. If comparing your metrics to your industry causes you to take just one important action to improve your operations, we will feel we have done our job. If it causes you to consider benchmarking a valuable management tool in your continuous improvement toolbox, we will be even more pleased. Please feel free to contact us with any questions or requests for further assistance. Contact centers are our passion, and we are happy to share our insights with you.

4 Copyright © 2017 , BenchmarkPortal, LLC.
For internal use only. Distribution beyond purchasing company is strictly prohibited
Chapter 2: Methodology

5 Copyright © 2017 , BenchmarkPortal, LLC.
For internal use only. Distribution beyond purchasing company is strictly prohibited
Chapter 2: Methodology The BenchmarkPortal database, founded at Purdue University in 1995, is the world’s first, largest and most respected database of contact center metrics. Data is gathered on a continuous basis using one of three means: Participants can go to the BenchmarkPortal website and input their metrics
into the survey found there; Participants can download the benchmarking survey from the
BenchmarkPortal Website. They can print and complete the survey by hand and then fax it to us for insertion into our database; or
Participants can subscribe to iBenchmark, our automated process that receives the majority of metrics directly from the participants’ systems and enters them into our database. Data that does not come directly from systems (such as budget and agent turnover) is input manually once or twice a year via a survey portal.
Data that are submitted by survey participants are subject to three levels of rigorous quality checking, to ensure that our database remains accurate. The first level involves static parameters, which are set by our statistical experts. The second level of quality assurance involves a series of cross-check formulae, which utilize data provided to validate key pieces of data. For example, if the sum of the average talk time plus the average after call work time multiplied by the average number of calls per agent per hour yields a number over 60 minutes, the anomaly will result in a red flag for our database department. We will then reach out and work with the participant to identify the proper metric from their management reports. The third level of scrutiny is provided directly by our Research team members, who review each survey report for coherence. This commitment to quality distinguishes BenchmarkPortal’s database from other industry sources which simply take in metrics as entered by participants. While this level of scrutiny requires considerable effort, we are committed to providing the best data possible to our industry. We note that, as more centers adopt the patented iBenchmark automated benchmarking, the less impact there will be from human error. Automating the entry of data and provision of reports, utilizing our patent-protected system, ensures that the correct data are being entered “at the source” for the majority of metrics. All individual metrics are held as confidential and are never revealed with the name of the participant to third parties. Only aggregated data are published in our Industry Reports, such as the one you are reading now.

Chapter 2: Methodology
. 6 Copyright © 2017 , BenchmarkPortal, LLC.
For internal use only. Distribution beyond purchasing company is strictly prohibited
The data sets are all tagged by industry sector, as well as by other characteristics, such as country of origin. This allows us to create reports that are drawn entirely from one industry sector. In addition, we can create our World-Wide Industry Reports by gathering data sets by geographical region. Custom reports can be generated by using parameters agreed with the client. The data sets are selected and downloaded from the database. The report generator accesses the data and calculates the industry average. It also segregates the top quartile (25%) of the data sets and shows the average for these top-performing centers under the “Best of Industry” column. To determine which centers to include in the Best of Industry calculation, we do the following:
• We separate the performance metrics into two categories: efficiency metrics that correspond to costs (these are metrics such as cost per call, talk time, after-call work time, etc.) and effectiveness metrics, which correspond to quality (caller satisfaction, first contact resolution, etc.). In this way we place balanced emphasis on the elements that reflect quality of customer service and elements that indicate careful use of company resources.
• The two groupings of metrics are put through separate expert formulas to calculate two coefficients: the cost index (indicating efficiency) and the quality index (indicating relative effectiveness).
• The two indices are added together for each center, and the centers are stack ranked by their combined scores.
• The top quartile of the centers is selected out.
• The averages for each metric are calculated from this upper quartile of centers and presented as "Best of Industry Averages".
Note that use of this methodology means that not every “Best of Industry” average will be better than the overall industry average. Centers that perform better overall may be less strong (compared with the industry) for specific metrics. Thank you for acquiring this report. Please let us know if you have any questions or comments. If you would like to consider benchmarking your own metrics through an individualized report, please feel free to contact us for a chat.

7 Copyright © 2017 , BenchmarkPortal, LLC.
For internal use only. Distribution beyond purchasing company is strictly prohibited
Chapter 3: Highlights and Interpretation
of the Worldwide (Sample) Industry Key Performance Indicators (KPIs)

8 Copyright © 2017 , BenchmarkPortal, LLC.
For internal use only. Distribution beyond purchasing company is strictly prohibited
Chapter 3: Highlights and Interpretation of the (Sample) Industry
Key Performance Indicators (KPIs)
In this chapter, we graphically highlight benchmark comparisons of the averaged responses that call center managers from three global regions – The Americas, EMEA (Europe, Middle East, Africa), and Asia Pacific** - offered to selected questions related to their call centers.
The metrics are grouped according to the following categories:
Section One: Contact Center Classification
Section Two: Contact Center Costs
Section Three: Contact Center Performance
Section Four: Customer Satisfaction
Section Five: Human Resource Management
Section Six: Multi-Channel Metrics

Chapter 2: Methodology
9 Copyright © 2017 , BenchmarkPortal, LLC.
For internal use only. Distribution beyond purchasing company is strictly prohibited.
Section One: Contact Center Classification
In this section we graphically depict the answers that contact center managers gave to questions
related to their contact center classification.
12.13%16.84%
21.21%
89.22%
83.16%78.79%
0%
20%
40%
60%
80%
100%
Americas EMEA Asia Pacific
Inbound Calls by Type
Business to Business Consumer to Business
`
Figure 1. Inbound Contact Types
Question: How do your inbound contacts break down in the following two
categories?
Business to Business (B2B), and
Consumer to Business (C2B).
Interpretation: Consumer to business calls constitute the majority of all inbound
calls for all geographical regions. These calls are most often for
customer service questions and inquiries, which represent the major
reason for inbound calls as shown in the next figure.
.

Chapter 2: Methodology
. 10 Copyright © 2017 , BenchmarkPortal, LLC.
For internal use only. Distribution beyond purchasing company is strictly prohibited
74.9%
6.8% 5.3% 5.4% 6.6%4.1%
75.1%
14.4%
4.0% 3.0%0.7%
3.4%
79.8%
0.0% 0.0% 0.0% 0.0%
20.2%
0%
10%
20%
30%
40%
50%
60%
70%
80%
90%
Customer Service (questions and
inquiries)
Order taking and tracking
Technical support to external customers
Complaints Re-directing Inbound Calls
Other
Reasons for Inbound Calls
Americas EMEA Asia Pacific
Figure 2. Reasons for Inbound Contacts
Question: Which functions do your agents provide regarding inbound contacts?
Interpretation: Between75% and 80% percent of all inbound calls are for customer
service questions and inquiries, as illustrated in the chart above.
Worth noting is that call centers in the EMEA geographical region
average a higher incidence of order taking/tracking than the centers
in the other two regions, and call centers in the Americas
geographical region average the highest incidence of complaints.
.

Chapter 2: Methodology
11 Copyright © 2017 , BenchmarkPortal, LLC.
For internal use only. Distribution beyond purchasing company is strictly prohibited.
There are 15 Additional KPI Industry Highlights in this Chapter
.

12 Copyright © 2017 , BenchmarkPortal, LLC.
For internal use only. Distribution beyond purchasing company is strictly prohibited
Chapter 4: Detailed Benchmark Results for the Americas, EMEA, and Asia Pacific
Geographical Regions

13 Copyright © 2017 , BenchmarkPortal, LLC.
For internal use only. Distribution beyond purchasing company is strictly prohibited
Classification Questions - Americas (Sample) - AmericasBest of (Sample) -
Americas
• Calls Offered * * * * * * * * * *
• Calls Handled Annually * * * * * * * * * *
• Annual Call Volume Handled by Agents * * * * * * * * * *
• Annual Call Volume Handled by IVR * * * * * * * * * *
• Business to Business * * * * * * * * * *
• Business to Consumer * * * * * * * * * *
• Full Time Agents * * * * * * * * * *
• Part Time Agents * * * * * * * * * *
• Full Time Equivalents (FTE's) * * * * * * * * * *
• Labor Union (Yes) * * * * * * * * * *
• Labor Union (No) * * * * * * * * * *
• Call Type (Question & Inquiries) * * * * * * * * * *
• Call Type (Order Taking / Tracking) * * * * * * * * * *
• Call Type (Technical Support) * * * * * * * * * *
• Call Type (Complaints) * * * * * * * * * *
• Call Type (Re-directing Inbound Calls) * * * * * * * * * *
• Call Type (Other) * * * * * * * * * *
0.00% 0.00%
Financial (Sample) - AmericasBest of (Sample) -
Americas
• Annual Budget * * * * * * * * * *
• Agents Base Salary * * * * * * * * * *
• Average Hourly Wage Front Line Agents * * * * * * * * * *
• Average Starting Hourly Wage Front Line Agents * * * * * * * * * *
• Average Cost Per Call * * * * * * * * * *

Chapter 2: Methodology
. 14 Copyright © 2017 , BenchmarkPortal, LLC.
For internal use only. Distribution beyond purchasing company is strictly prohibited
Agent Time Per Channel (Sample) - Americas
Best of (Sample) - Americas
• Inbound Phone * * * * * * * * * *
• Outbound Phone * * * * * * * * * *
• E-mail * * * * * * * * * *
• Web Chat * * * * * * * * * *
• Other * * * * * * * * * *
0.00% 0.00%
Voice Channel Performance Metrics (Sample) - Americas
Best of (Sample) - Americas
• Average Speed of Answer in Seconds * * * * * * * * * *
• Average Talk Time in Minutes * * * * * * * * * *
• Average After Call Work Time in Minutes * * * * * * * * * *
• Average Queue Time in Seconds * * * * * * * * * *
• Average Caller Hold Time in Seconds * * * * * * * * * *
• Average Abandoned Rate in Percent * * * * * * * * * *
• Calls Resolved on First Call In Percent (FCR) * * * * * * * * * *
• Agent Occupancy in Percent * * * * * * * * * *
• Adherence to Schedule in Percent * * * * * * * * * *
• Average Attendance in Percent * * * * * * * * * *
• Average Calls Transferred in Percent * * * * * * * * * *
• Average Auxiliary (AUX) Time in Percent * * * * * * * * * *
• Average Utilization in Percent * * * * * * * * * *
• Calls Per Agent Per Hour * * * * * * * * * *

Chapter 4: Detailed Benchmark Results
15 Copyright © 2017 , BenchmarkPortal, LLC.
For internal use only. Distribution beyond purchasing company is strictly prohibited.
Human Resources Metrics (Sample) - AmericasBest of (Sample) -
Americas
• Span of Control (Agent:Supervisor Ratio) * * * * * * * * * *
• Annual Turnover * * * * * * * * * *
• Promotional Turnover * * * * * * * * * *
• All Other Turnover * * * * * * * * * *
• Number of Shifts (Full Time) * * * * * * * * * *
• Number of Shifts (Part Time) * * * * * * * * * *
• Shift Length in Minutes (Full Time) * * * * * * * * * *
• Shift Length in Minutes (Part Time) * * * * * * * * * *
• Formal Method Collect Agent Satisfaction (Yes) * * * * * * * * * *
• Formal Method Collect Agent Satisfaction (No) * * * * * * * * * *
• Top Box Agent Satisfaction * * * * * * * * * *
• Bottom Box Agent Satisfaction * * * * * * * * * *
Caller Satisfaction Metrics (Sample) - AmericasBest of (Sample) -
Americas
• Formal Method Collect Caller Satisfaction (Yes) * * * * * * * * * *
• Formal Method Collect Caller Satisfaction (No) * * * * * * * * * *
• Top Box Caller Satisfaction * * * * * * * * * *
• Bottom Box Caller Satisfaction * * * * * * * * * *

Chapter 2: Methodology
. 16 Copyright © 2017 , BenchmarkPortal, LLC.
For internal use only. Distribution beyond purchasing company is strictly prohibited
Classification Questions - EMEA (Sample) - EMEA Best of (Sample) - EMEA
• Calls Offered * * * * * * * * * *
• Calls Handled Annually * * * * * * * * * *
• Annual Call Volume Handled by Agents * * * * * * * * * *
• Annual Call Volume Handled by IVR * * * * * * * * * *
• Business to Business * * * * * * * * * *
• Business to Consumer * * * * * * * * * *
• Full Time Agents * * * * * * * * * *
• Part Time Agents * * * * * * * * * *
• Full Time Equivalents (FTE's) * * * * * * * * * *
• Labor Union (Yes) * * * * * * * * * *
• Labor Union (No) * * * * * * * * * *
• Call Type (Question & Inquiries) * * * * * * * * * *
• Call Type (Order Taking / Tracking) * * * * * * * * * *
• Call Type (Technical Support) * * * * * * * * * *
• Call Type (Complaints) * * * * * * * * * *
• Call Type (Re-directing Inbound Calls) * * * * * * * * * *
• Call Type (Other) * * * * * * * * * *
Financial (Sample) - EMEA Best of (Sample) - EMEA
• Annual Budget * * * * * * * * * *
• Agents Base Salary * * * * * * * * * *
• Average Hourly Wage Front Line Agents * * * * * * * * * *
• Average Starting Hourly Wage Front Line Agents * * * * * * * * * *
• Average Cost Per Call * * * * * * * * * *

Chapter 4: Detailed Benchmark Results
17 Copyright © 2017 , BenchmarkPortal, LLC.
For internal use only. Distribution beyond purchasing company is strictly prohibited.
Agent Time Per Channel (Sample) - EMEA Best of (Sample) - EMEA
• Inbound Phone * * * * * * * * * *
• Outbound Phone * * * * * * * * * *
• E-mail * * * * * * * * * *
• Web Chat * * * * * * * * * *
• Other * * * * * * * * * *
Voice Channel Performance Metrics (Sample) - EMEA Best of (Sample) - EMEA
• Average Speed of Answer in Seconds * * * * * 21.00
• Average Talk Time in Minutes * * * * * 2.93
• Average After Call Work Time in Minutes * * * * * 0.25
• Average Queue Time in Seconds * * * * * 15.94
• Average Caller Hold Time in Seconds * * * * * 17.75
• Average Abandoned Rate in Percent * * * * * 6.55%
• Calls Resolved on First Call In Percent (FCR) * * * * * 84.50%
• Agent Occupancy in Percent * * * * * 79.48%
• Adherence to Schedule in Percent * * * * * 93.00%
• Average Attendance in Percent * * * * * 97.35%
• Average Calls Transferred in Percent * * * * * 3.17%
• Average Auxiliary (AUX) Time in Percent * * * * * 10.51%
• Average Utilization in Percent * * * * * 68.16%
• Calls Per Agent Per Hour * * * * * 10.22

Chapter 2: Methodology
. 18 Copyright © 2017 , BenchmarkPortal, LLC.
For internal use only. Distribution beyond purchasing company is strictly prohibited
Human Resources Metrics (Sample) - EMEA Best of (Sample) - EMEA
• Span of Control (Agent:Supervisor Ratio) * * * * * * * * * *
• Annual Turnover * * * * * * * * * *
• Promotional Turnover * * * * * * * * * *
• All Other Turnover * * * * * * * * * *
• Number of Shifts (Full Time) * * * * * * * * * *
• Number of Shifts (Part Time) * * * * * * * * * *
• Shift Length in Minutes (Full Time) * * * * * * * * * *
• Shift Length in Minutes (Part Time) * * * * * * * * * *
• Formal Method Collect Agent Satisfaction (Yes) * * * * * * * * * *
• Formal Method Collect Agent Satisfaction (No) * * * * * * * * * *
• Top Box Agent Satisfaction * * * * * * * * * *
• Bottom Box Agent Satisfaction * * * * * * * * * *
Caller Satisfaction Metrics (Sample) - EMEA Best of (Sample) - EMEA
• Formal Method Collect Caller Satisfaction (Yes) * * * * * * * * * *
• Formal Method Collect Caller Satisfaction (No) * * * * * * * * * *
• Top Box Caller Satisfaction * * * * * * * * * *
• Bottom Box Caller Satisfaction * * * * * * * * * *
Chapter 4: Detailed Benchmark Results
19 Copyright © 2017 , BenchmarkPortal, LLC.
For internal use only. Distribution beyond purchasing company is strictly prohibited.
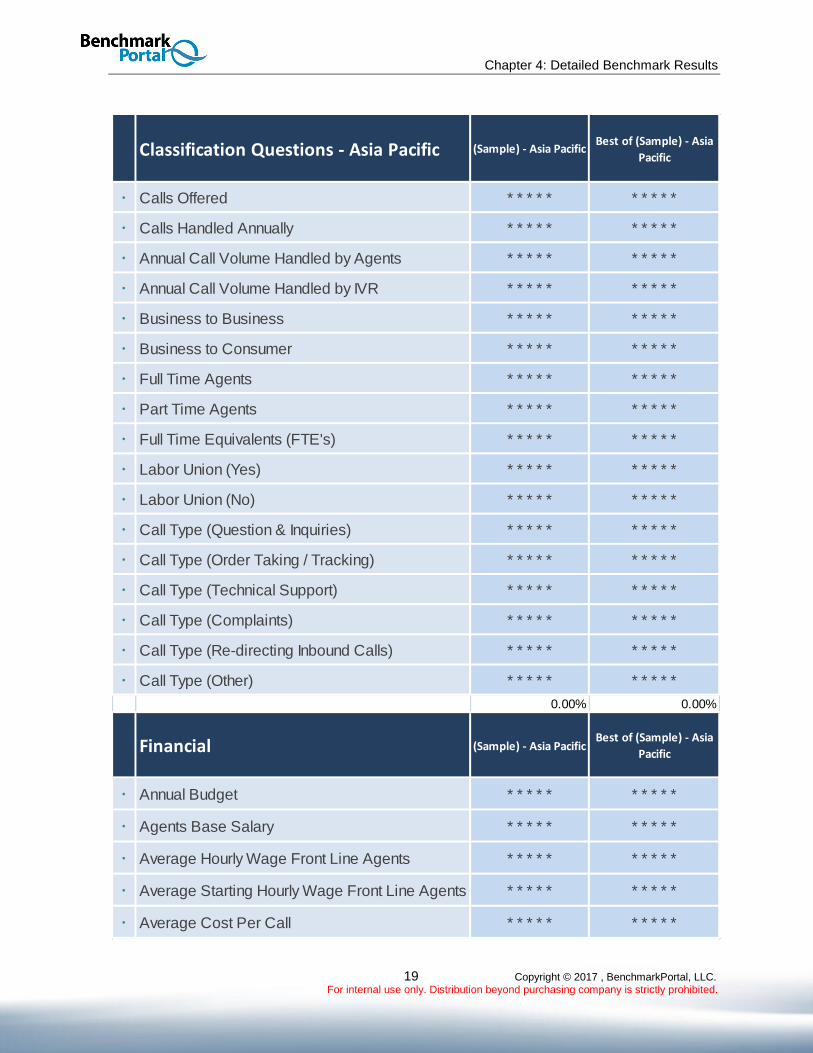
Classification Questions - Asia Pacific (Sample) - Asia PacificBest of (Sample) - Asia
Pacific
• Calls Offered * * * * * * * * * *
• Calls Handled Annually * * * * * * * * * *
• Annual Call Volume Handled by Agents * * * * * * * * * *
• Annual Call Volume Handled by IVR * * * * * * * * * *
• Business to Business * * * * * * * * * *
• Business to Consumer * * * * * * * * * *
• Full Time Agents * * * * * * * * * *
• Part Time Agents * * * * * * * * * *
• Full Time Equivalents (FTE's) * * * * * * * * * *
• Labor Union (Yes) * * * * * * * * * *
• Labor Union (No) * * * * * * * * * *
• Call Type (Question & Inquiries) * * * * * * * * * *
• Call Type (Order Taking / Tracking) * * * * * * * * * *
• Call Type (Technical Support) * * * * * * * * * *
• Call Type (Complaints) * * * * * * * * * *
• Call Type (Re-directing Inbound Calls) * * * * * * * * * *
• Call Type (Other) * * * * * * * * * *
0.00% 0.00%
Financial (Sample) - Asia PacificBest of (Sample) - Asia
Pacific
• Annual Budget * * * * * * * * * *
• Agents Base Salary * * * * * * * * * *
• Average Hourly Wage Front Line Agents * * * * * * * * * *
• Average Starting Hourly Wage Front Line Agents * * * * * * * * * *
• Average Cost Per Call * * * * * * * * * *

Chapter 2: Methodology
. 20 Copyright © 2017 , BenchmarkPortal, LLC.
For internal use only. Distribution beyond purchasing company is strictly prohibited
Agent Time Per Channel (Sample) - Asia PacificBest of (Sample) - Asia
Pacific
• Inbound Phone * * * * * * * * * *
• Outbound Phone * * * * * * * * * *
• E-mail * * * * * * * * * *
• Web Chat * * * * * * * * * *
• Other * * * * * * * * * *
Voice Channel Performance Metrics (Sample) - Asia PacificBest of (Sample) - Asia
Pacific
• Average Speed of Answer in Seconds * * * * * * * * * *
• Average Talk Time in Minutes * * * * * * * * * *
• Average After Call Work Time in Minutes * * * * * * * * * *
• Average Queue Time in Seconds * * * * * * * * * *
• Average Caller Hold Time in Seconds * * * * * * * * * *
• Average Abandoned Rate in Percent * * * * * * * * * *
• Calls Resolved on First Call In Percent (FCR) * * * * * * * * * *
• Agent Occupancy in Percent * * * * * * * * * *
• Adherence to Schedule in Percent * * * * * * * * * *
• Average Attendance in Percent * * * * * * * * * *
• Average Calls Transferred in Percent * * * * * * * * * *
• Average Auxiliary (AUX) Time in Percent * * * * * * * * * *
• Average Utilization in Percent * * * * * * * * * *
• Calls Per Agent Per Hour * * * * * * * * * *

Chapter 4: Detailed Benchmark Results
21 Copyright © 2017 , BenchmarkPortal, LLC.
For internal use only. Distribution beyond purchasing company is strictly prohibited.
Human Resources Metrics (Sample) - Asia PacificBest of (Sample) - Asia
Pacific
• Span of Control (Agent:Supervisor Ratio) * * * * * * * * * *
• Annual Turnover * * * * * * * * * *
• Promotional Turnover * * * * * * * * * *
• All Other Turnover * * * * * * * * * *
• Number of Shifts (Full Time) * * * * * * * * * *
• Number of Shifts (Part Time) * * * * * * * * * *
• Shift Length in Minutes (Full Time) * * * * * * * * * *
• Shift Length in Minutes (Part Time) * * * * * * * * * *
• Formal Method Collect Agent Satisfaction (Yes) * * * * * * * * * *
• Formal Method Collect Agent Satisfaction (No) * * * * * * * * * *
• Top Box Agent Satisfaction * * * * * * * * * *
• Bottom Box Agent Satisfaction * * * * * * * * * *
Caller Satisfaction Metrics (Sample) - Asia PacificBest of (Sample) - Asia
Pacific
• Formal Method Collect Caller Satisfaction (Yes) * * * * * * * * * *
• Formal Method Collect Caller Satisfaction (No) * * * * * * * * * *
• Top Box Caller Satisfaction * * * * * * * * * *
• Bottom Box Caller Satisfaction * * * * * * * * * *

Chapter 2: Methodology
. 22 Copyright © 2017 , BenchmarkPortal, LLC.
For internal use only. Distribution beyond purchasing company is strictly prohibited
Multi-Channel Metrics
Outbound Call Metrics Average Upper Quartile
• Average Annual Volume (Outbound) * * * * * * * * * *
• Average Talk Time in (Minutes) * * * * * * * * * *
• Average After Call Work Time (Minutes) * * * * * * * * * *
• Average Cost Per Call (US Dollars) * * * * * * * * * *
E-mail Metrics Average Upper Quartile
• Average Annual Volume (E-Mail) * * * * * * * * * *
• Average Speed of Answer (Hours) * * * * * * * * * *
• Average Handle Time (Minutes) * * * * * * * * * *
•Average First Contact Resolution - FCR
(Percent)* * * * * * * * * *
• Average Cost Per E-mail (US Dollars) * * * * * * * * * *
Web Chat Metrics Average Upper Quartile
• Average Annual Volume (Web Chat) * * * * * * * * * *
• Average Speed of Answer (Seconds) * * * * * * * * * *
• Average Handle Time (Minutes) * * * * * * * * * *
• Average First Contact Resolution (Percent) * * * * * * * * * *
• Average Cost Per Web Chat (US Dollars) * * * * * * * * * *

Chapter 4: Detailed Benchmark Results
23 Copyright © 2017 , BenchmarkPortal, LLC.
For internal use only. Distribution beyond purchasing company is strictly prohibited.
Social Media Metrics Average Upper Quartile
• Average Annual Volume (Social Media) * * * * * * * * * *
• Average Speed of Answer (Hours) * * * * * * * * * *
• Average Handle Time (Minutes) * * * * * * * * * *
• Average Cost Per Social Media (US Dollars) * * * * * * * * * *
FaxAll Industry
AverageUpper Quartile
• Average Annual Volume (Fax) * * * * * * * * * *
• Average Handle Time (Minutes) * * * * * * * * * *
• Average Cost Per Fax (US Dollars) * * * * * * * * * *
Postal Mail Average Upper Quartile
• Average Annual Volume (Postal Mail) * * * * * * * * * *
• Average Handle Time (Minutes) * * * * * * * * * *
• Average Cost Per Postal Mail (US Dollars) * * * * * * * * * *
Other Average Upper Quartile
• Average Annual Volume (Other) * * * * * * * * * *
• Average Handle Time (Minutes) * * * * * * * * * *
• Average Cost Per E-mail (US Dollars) * * * * * * * * * *

24 Copyright © 2017 , BenchmarkPortal, LLC.
For internal use only. Distribution beyond purchasing company is strictly prohibited
Chapter 5: Trends in Selected Contact Center Metrics
(All Industries Averages)

25 Copyright © 2017 , BenchmarkPortal, LLC.
For internal use only. Distribution beyond purchasing company is strictly prohibited
Introduction
As heir to the industry’s first call center benchmark studies, launched at Purdue
University over two decades ago, BenchmarkPortal has a wealth of data of interest to
contact center managers and consultants. The statistical trends in this section reflect
yearly changes in contact center KPIs across All Industries, with focus on the past
decade.
The first groups of graphics look at quality-related items, while the second group
considers cost-related metrics over time.
Effectiveness (Quality) Performance Trends
1. Customer Satisfaction:
Customer Satisfaction (CSAT) is the metric used by the majority of contact centers to
measure customer sentiment. It is typically derived from the survey question: “Overall,
how satisfied were you with the transaction you had with ABC contact center.” The
industry has largely standardized on a 1 to 5 scale, where 5 represents “very satisfied”
and 1 represents “very dissatisfied”. A 5 rating (also called “top box” rating) is seen as a
good indicator of future loyalty, although a reliable, consistent correlation is not
something that has been proven across industries.
Other measures of customer sentiment include Net Promoter Score (NPS), which uses the
question “How likely would you be to recommend ABC Company to your family and
friends.” It uses a 0 to 10 scale where 0 is highly unlikely and 10 is highly likely.
Analysts will then subtract the sum of the 0-6 scores, expressed as a percent, from the
sum of the 9 and 10 scores, again as a percent, to compute the “net” score. While it has
become popular over the last decade as a loyalty indicator, NPS is considered by many to
be a better measure of a customer’s overall impression of a company and its products
than a measure useful for a specific contact center transaction. That is, it does a better
job of indicating overall “relationship” than performance on a specific transaction and is
more commonly used on annual relationship surveys. If the question is used on a
transactional survey, it needs the following qualifier: “Based on this most recent
interaction with the contact center, how likely would you be to recommend ABC Company
to your family and friends?” Even with this adjustment, it may still measure the overall
relationship more than the sentiment left from the transaction.
Finally, Customer Effort Score (CES) is a newer metric, which has been adopted by a
smaller number of centers. It assumes that the most loyal customers are those who
invest the least effort in resolving issues with you, and uses the question "The company
made it easy for me to handle my issue”, posed on a 1-to-7 Agreement scale.
Note that the research studies underpinning both NPS and CES have drawn criticism
from academic and industry researchers, and the ability of either metric to predict loyalty
and repurchase more reliably and consistently than Customer Satisfaction has not been
convincingly established.

Chapter 6: Contact Center Trends
. 26 Copyright © 2017 , BenchmarkPortal, LLC.
For internal use only. Distribution beyond purchasing company is strictly prohibited
Currently, not enough centers use NPS and CES to provide a statistically robust basis for
benchmarking across industries. However, BenchmarkPortal is following the situation
closely and will report those metrics when we can.
Top Box Customer Satisfaction
Note that while top box customer satisfaction is the traditional “gold standard” for
excellent customer service, bottom box dissatisfaction is the glowing red flag. Not only do
these dissatisfied customers tend to take their business elsewhere, they also let their
feelings be known through word-of-mouth and through social media. In this way, their
loss may portend the loss of other business as well. When analyzing the survey results,
focus strongly on those who give you low scores. Therein lay the most immediate
opportunities for improvement.
Analysis: The following chart suggests that contact center managers understand the importance of
customer satisfaction and have been focused on improving this metric over time. Top box
scores have risen by a very impressive 17.3 percentage points on average over the last
decade, while the bottom box average has decreased by 1.7 percentage points.
Figure 16. Customer Satisfaction Trends - 2005-2016 (All Industries Averages)
51.3%
67.7%
68.6%
0.00%
10.00%
20.00%
30.00%
40.00%
50.00%
60.00%
70.00%
80.00%
2005 2006 2007 2008 2009 2010 2011 2012 2013 2014 2015
Customer Satisfaction
Top Box CSat Bottom Box CSat Linear (Top Box CSat)

Chapter 4: Detailed Benchmark Results
27 Copyright © 2017 , BenchmarkPortal, LLC.
For internal use only. Distribution beyond purchasing company is strictly prohibited.
There Are 13 Additional Trends Charts & KPI Analysis in this Chapter

28 Copyright © 2017 , BenchmarkPortal, LLC.
For internal use only. Distribution beyond purchasing company is strictly prohibited
Chapter 6: Frequently Asked Questions

29 Copyright © 2017 , BenchmarkPortal, LLC.
For internal use only. Distribution beyond purchasing company is strictly prohibited
This FAQ contains common questions asked by Contact Center Professionals who have purchased our Industry Reports
Question Answer How are your Industry Reports produced? Benchmark members are constantly providing us
data via surveys. When a Contact Center Professional participates in our flagship survey, the In-Depth RealityCheck (IDRC), their data is scrubbed, validated, cataloged in their industry, and then housed in our databases. We then take the data and run the averages that appear in the Industry Reports.
What Industries are reported on within an Industry Report?
Each standard Industry Report covers a single Industry. Please refer to our website at www.BenchmarkPortal.com/store and click on Industry Reports at the top for a complete list of the industries offered.
What kind of Key Performance Indicators (KPIs) are measured within your Industry Reports?
We report metrics for the following Contact Center areas: general classification (i.e. size, business orientation), Contact Center costs (operational), Contact Center performance measures, customer satisfaction, human resources, and alternate contact channel KPIs. You may download a sample Industry Report at the following Web address: http://www.benchmarkportal.com/ store_files/IndustryReportSAMPLE.zip
What geographical regions do the Industry Reports cover?
Our standard Industry Reports cover North America only (USA & Canada). Our World Wide Industry Reports cover The Americas, Europe/ Middle-East/Africa (EMEA), and Asia Pacific geographical regions. Custom reports for other geographical regions can be produced on a custom basis.
I’m looking for a report that can breakdown the performance of Contact Centers within specific geographical regions. Do you have any reports that will suit my needs?
Our World Wide Industry Reports cover the Americas, Europe/ Middle-East/Africa, and Asia Pacific geographical regions. Chapter 5 of the report depicts the KPIs broken out separately for each geographical region. Custom reports for other geographical regions can be produced on a custom basis.
How current is the data contained in your Industry Reports?
The reports are updated every 6 months.
Question Answer
Chapter 5: Frequently Asked Questions
. 30 Copyright © 2017 , BenchmarkPortal, LLC.
For internal use only. Distribution beyond purchasing company is strictly prohibited
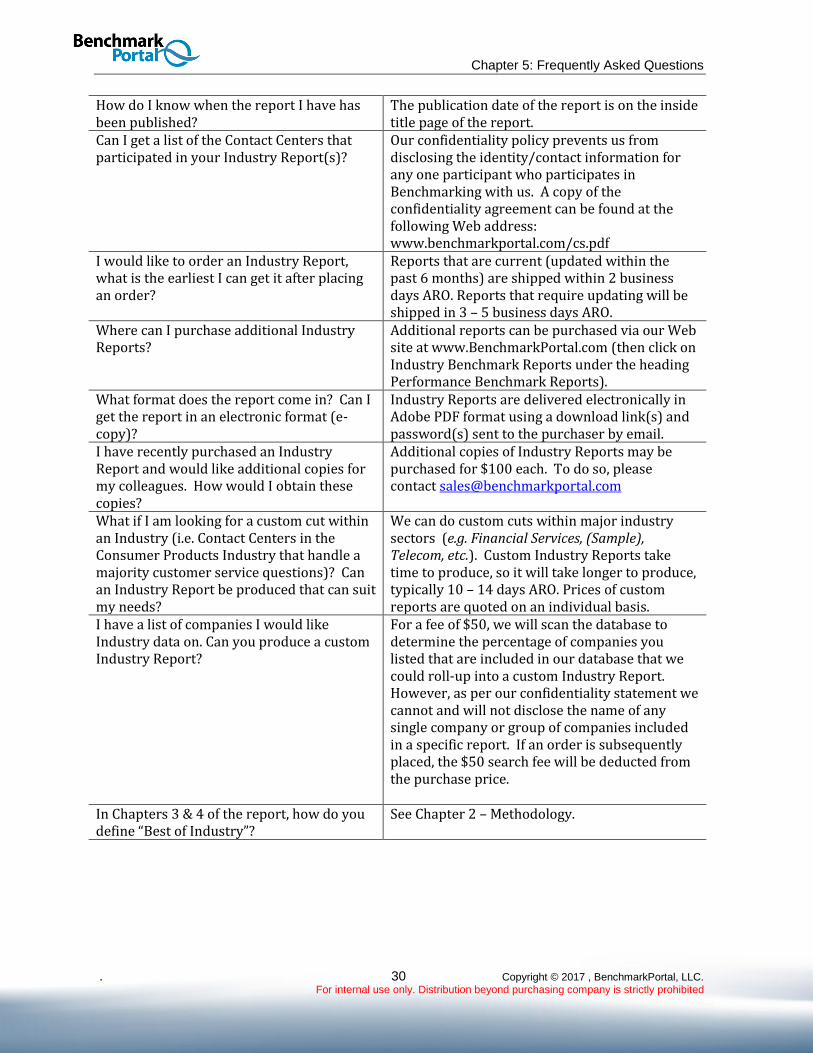
How do I know when the report I have has been published?
The publication date of the report is on the inside title page of the report.
Can I get a list of the Contact Centers that participated in your Industry Report(s)?
Our confidentiality policy prevents us from disclosing the identity/contact information for any one participant who participates in Benchmarking with us. A copy of the confidentiality agreement can be found at the following Web address: www.benchmarkportal.com/cs.pdf
I would like to order an Industry Report, what is the earliest I can get it after placing an order?
Reports that are current (updated within the past 6 months) are shipped within 2 business days ARO. Reports that require updating will be shipped in 3 – 5 business days ARO.
Where can I purchase additional Industry Reports?
Additional reports can be purchased via our Web site at www.BenchmarkPortal.com (then click on Industry Benchmark Reports under the heading Performance Benchmark Reports).
What format does the report come in? Can I get the report in an electronic format (e-copy)?
Industry Reports are delivered electronically in Adobe PDF format using a download link(s) and password(s) sent to the purchaser by email.
I have recently purchased an Industry Report and would like additional copies for my colleagues. How would I obtain these copies?
Additional copies of Industry Reports may be purchased for $100 each. To do so, please contact [email protected]
What if I am looking for a custom cut within an Industry (i.e. Contact Centers in the Consumer Products Industry that handle a majority customer service questions)? Can an Industry Report be produced that can suit my needs?
We can do custom cuts within major industry sectors (e.g. Financial Services, (Sample), Telecom, etc.). Custom Industry Reports take time to produce, so it will take longer to produce, typically 10 – 14 days ARO. Prices of custom reports are quoted on an individual basis.
I have a list of companies I would like Industry data on. Can you produce a custom Industry Report?
For a fee of $50, we will scan the database to determine the percentage of companies you listed that are included in our database that we could roll-up into a custom Industry Report. However, as per our confidentiality statement we cannot and will not disclose the name of any single company or group of companies included in a specific report. If an order is subsequently placed, the $50 search fee will be deducted from the purchase price.
In Chapters 3 & 4 of the report, how do you define “Best of Industry”?
See Chapter 2 – Methodology.

Worldwide Industry Benchmark Report - (Sample) Industry
31 Copyright © 2017 , BenchmarkPortal, LLC.
For internal use only. Distribution beyond purchasing company is strictly prohibited.
Question Answer In looking at my report I noticed the “Best of Industry” average was lower than the Industry average for a certain metric when it is advantageous to have the “Best of Industry” average for this metric as low as attainable. How is this possible?
See Chapter 2 – Methodology. Also see more on the Tonchev Performance Index in Appendix B.

32 Copyright © 2017 , BenchmarkPortal, LLC.
For internal use only. Distribution beyond purchasing company is strictly prohibited
Appendix A: Glossary of Terms for Contact Centers

33 Copyright © 2017 , BenchmarkPortal, LLC.
For internal use only. Distribution beyond purchasing company is strictly prohibited
A
Abandon Rate: This is the percentage of calls that get connected to the ACD, but get
disconnected by the caller before reaching an Agent, or before completing a process within the
IVR. The abandon rate is the percentage of calls that are abandoned compared to calls received.
ACD: See Automatic Call Distributor.
Adherence to Schedule: A measure of whether Agents are “on the job” as scheduled. This
percentage represents how closely an Agent adheres to his/her detailed work schedule as
provided by the workforce management system. 100% adherence means that the Agent was
exactly where they were supposed to be at the time projected in their schedule. The scheduled
time allows for meetings with the supervisor, education, plus answering customer phone calls
and supporting other channels. The question, “how often do Agents deviate from their schedule”
is answered by this metric.
After Call Work Time: Call-related work that is done when an Agent is not on a call. This is the
cumulative amount of time Agents spend on performing follow-up work after the Agent has
disconnected from the caller, divided by the total number of calls handled by Agents. The data for
after call work time is taken from the system.
Agent: A general term for someone who handles telephone calls and/or other channel
transactions in a Contact center. Other common names for the same job include, but are not
limited to: operator, associate, sales associate, collections specialist, customer service
representative (CSR), or customer care representative.
Agent Development: A process designed to address the Agent’s individual needs, and to help
them build their work skills and achieve their career objectives. This may include, but not be
limited to, work behaviors expected, taught, measured and tracked; continuous education offered
and encouraged; and career planning.
Agent Occupancy: The percentage of total paid hours of an Agent’s shift during which the Agent
is logged in to the ACD or other technology and is available to handle inbound phone, outbound
phone, e-mail, chat and other productive work (white mail or back office work), divided by the
total scheduled hours at work.
Agent Turnover: The number of Agents who left their “Agent job” (voluntarily or involuntarily)
during the previous 12-month period, divided by the total number of Agents working, expressed
as a percentage. Track those who were hired during the period, minus those who left their job
during the same period. The average number of Agents working is calculated by taking the
beginning-of-the-year Agent head count plus the end-of-year Agent head-count and dividing that
number by two. Do not include attrition during training.
100%
PRA
PTurnoverAnnual
Where: A = the total number of Agents working during the specified period; R = the number of new-hires during the specified period; and P = the number of Agents that left the center during the specified period.
Appendix A: Glossary of Terms for Contact Centers
. 34 Copyright © 2017 , BenchmarkPortal, LLC.
For internal use only. Distribution beyond purchasing company is strictly prohibited
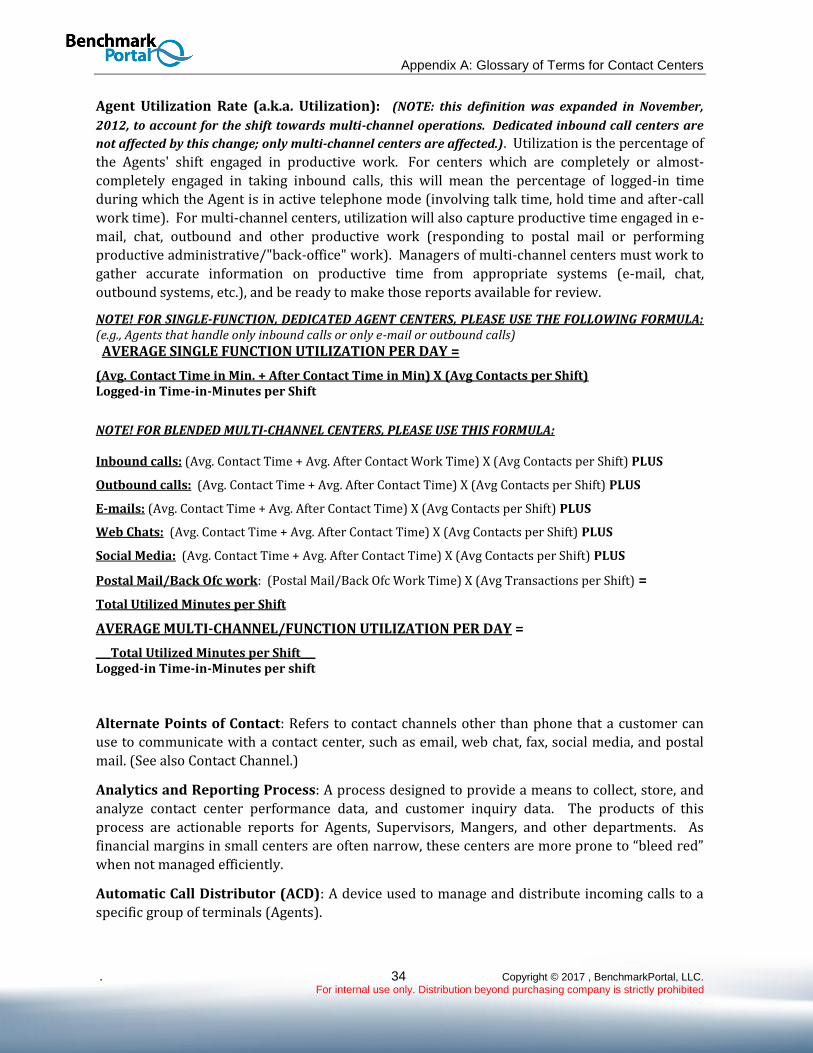
Agent Utilization Rate (a.k.a. Utilization): (NOTE: this definition was expanded in November,
2012, to account for the shift towards multi-channel operations. Dedicated inbound call centers are
not affected by this change; only multi-channel centers are affected.). Utilization is the percentage of
the Agents' shift engaged in productive work. For centers which are completely or almost-
completely engaged in taking inbound calls, this will mean the percentage of logged-in time
during which the Agent is in active telephone mode (involving talk time, hold time and after-call
work time). For multi-channel centers, utilization will also capture productive time engaged in e-
mail, chat, outbound and other productive work (responding to postal mail or performing
productive administrative/"back-office" work). Managers of multi-channel centers must work to
gather accurate information on productive time from appropriate systems (e-mail, chat,
outbound systems, etc.), and be ready to make those reports available for review.
NOTE! FOR SINGLE-FUNCTION, DEDICATED AGENT CENTERS, PLEASE USE THE FOLLOWING FORMULA: (e.g., Agents that handle only inbound calls or only e-mail or outbound calls)
AVERAGE SINGLE FUNCTION UTILIZATION PER DAY =
(Avg. Contact Time in Min. + After Contact Time in Min) X (Avg Contacts per Shift) Logged-in Time-in-Minutes per Shift
NOTE! FOR BLENDED MULTI-CHANNEL CENTERS, PLEASE USE THIS FORMULA:
Inbound calls: (Avg. Contact Time + Avg. After Contact Work Time) X (Avg Contacts per Shift) PLUS
Outbound calls: (Avg. Contact Time + Avg. After Contact Time) X (Avg Contacts per Shift) PLUS
E-mails: (Avg. Contact Time + Avg. After Contact Time) X (Avg Contacts per Shift) PLUS
Web Chats: (Avg. Contact Time + Avg. After Contact Time) X (Avg Contacts per Shift) PLUS
Social Media: (Avg. Contact Time + Avg. After Contact Time) X (Avg Contacts per Shift) PLUS
Postal Mail/Back Ofc work: (Postal Mail/Back Ofc Work Time) X (Avg Transactions per Shift) =
Total Utilized Minutes per Shift
AVERAGE MULTI-CHANNEL/FUNCTION UTILIZATION PER DAY =
___Total Utilized Minutes per Shift___ Logged-in Time-in-Minutes per shift
Alternate Points of Contact: Refers to contact channels other than phone that a customer can
use to communicate with a contact center, such as email, web chat, fax, social media, and postal
mail. (See also Contact Channel.)
Analytics and Reporting Process: A process designed to provide a means to collect, store, and
analyze contact center performance data, and customer inquiry data. The products of this
process are actionable reports for Agents, Supervisors, Mangers, and other departments. As
financial margins in small centers are often narrow, these centers are more prone to “bleed red”
when not managed efficiently.
Automatic Call Distributor (ACD): A device used to manage and distribute incoming calls to a
specific group of terminals (Agents).

Worldwide Industry Benchmark Report – (Sample) Industry
35 Copyright © 2017 , BenchmarkPortal, LLC.
For internal use only. Distribution beyond purchasing company is strictly prohibited.
Automatic Dialer (aka, Autodialer): A device used to generate outbound calls based on a call
list, and distribute answered outbound calls to a specific group of terminals (Agents) for
completion.
Automatic Number Identification (ANI): ANI is a service of telecommunications carriers, which
identifies the telephone number of the calling party. It is commonly used for billing, call routing
and database synchronization. There are several specific technologies that fit under the umbrella
of ANI, including caller ID.
Auto Response: An auto-response system automatically returns a prewritten message to
anyone who submits e-mail to a particular address, whether an individual or a Web site. Auto-
response systems are widely used by Web sites for the purpose of responding to visitor
comments and suggestions in a preliminary way. You may see an auto-responder in cases where
you purchase something online, receiving a "thank you for your order" e-mail, etc.
Auxiliary (AUX) Time in Percent: This is the average amount of time per shift, in percent, that
an Agent is logged into an AUX state. Auxiliary time may include, but is not limited to, work in
non-call channels, times for training, meetings, assigned off-line work, e-mails, or other job-
related tasks. After Call Work Time and Outbound dialing activity is work related, therefore it is
not considered Auxiliary Time and therefore it is inappropriate for AUX-codes to be used as such.
Average Attendance in Percent: Actual number of shifts worked divided by the planned
number of shifts multiplied by 100. This is a percentage representing how often Agents are NOT
absent from work due to an unplanned absence (not to include excused absences, i.e., vacation,
authorized leave, FMLA, jury duty, etc.). This is calculated by dividing the total number of
unexcused absences by the total number of planned shifts, then subtracting the resulting number
from 100.
Average Cost per Call/Contact: See Cost per Call/Contact.
Average Dials per Hour per Agent. This is the sum of all outbound calls manually or
automatically dialed and connected to an Agent divided by the total of the Agent hours devoted to
outbound calls.
Average Handle Time: See Handle Time.
Average Hold Time: The time during which an Agent placed a call on hold during the body of a
call. This is the cumulative total of all hold time, divided by the number of calls placed on hold,
for the period that is measured (please use annual metrics).
Average Occupancy in Percent: See Occupancy.
Average Paid Shift Length in Hours: The average length of an Agent shift, including lunch and
breaks, e.g., 8 hours, 10 hours, etc.
Average Response Time: This is an average of the amount of time, rounded to hours, that elapse
while a contact center to respond to a non-voice inbound customer contact (E-mail, Web Chat,
FAX, White Mail, etc.).

Appendix A: Glossary of Terms for Contact Centers
. 36 Copyright © 2017 , BenchmarkPortal, LLC.
For internal use only. Distribution beyond purchasing company is strictly prohibited
Average Sale Value per Call: This number is determined by taking the total sales in dollars and
dividing it by the total number of calls handled that result in a sale during the same period of
time.
Average Sale Value per Contact: This number is determined by taking the total sales in dollars
and dividing it by the total number of contacts by channel or total contacts handled that result in
a sale during the same period of time.
Average Speed of Answer (ASA): This is the cumulative total length of time of calls that are in
queue or that are ringing before being answered by an Agent, divided by the total numbers of
calls answered. This includes both IVR-handled calls and calls handled by an Agent.
Average Talk Time: This is the sum total of Agents’ time-in-talk mode, divided by the total
number of calls handled by Agents.
Average Time between Calls (a.k.a. Idle Time): This is the average number of minutes during
which the Agent is logged into the system in a ready state, waiting for the next call. In other
words, it is the average idle time in minutes an Agent spends in waiting mode between calls.
Average Time between Contacts (a.k.a. Idle Time): This is the average number of minutes
during which the Agent is logged into a system in a ready state, waiting for the next contact. In
other words, it is the average idle time in minutes an Agent spends in waiting mode between
contacts.
Average Time in Queue: This is the cumulative total length of time of calls spend in queue
before being answered by an Agent. It is the time-in-wait time incurred by a call directed to a
split/skill, which includes the time of wait during transfers. This is the average wait time that a
caller endures waiting for an Agent to answer the telephone after being placed in the queue by
the ACD. This differs from average speed of answer, because this calculation includes only calls
that actually had a wait time. This metric is also known as Average Time of Delay. Most ACD
systems provide this number.
Average Time to Abandonment: This is the average amount of time a customer will wait in
queue before abandoning.
Average Total Live Connects per Agent per Hour: This is the sum of Live Outbound Call
Connects divided by total Agent hours. This includes all live conversations to numbers dialed.
Average Total Right Party Connects (RPC) per Agent per Hour: This is the sum of all Right
Party (Decision-Maker) Outbound Call Connects divided by total of all Agent hours. (Typically,
the correct party connection is able to lead to a resolution.)
B
Base Salary per Year: This is the gross annual base earnings (or guaranteed earnings before
incentive pay) of an Agent. (Based on 2080 annual paid hours for a full time employee).
Benchmarking: A structured, analytical methodology that is designed to establish a reference
point for performance measures. The outcomes of this process enable managers to identify,

Worldwide Industry Benchmark Report – (Sample) Industry
37 Copyright © 2017 , BenchmarkPortal, LLC.
For internal use only. Distribution beyond purchasing company is strictly prohibited.
assess, and deploy those proven practices that are highly likely to enable them to gain and
maintain a competitive advantage.
Best Practice: Best practice is used to describe the best performing metric in a category, or a
proven process or technology that results in optimal performance as measured through
benchmarking.
Blended Agents: The term “Blended Agents” refers to Agents that are scheduled to split their
workload between handling inbound calls and making outbound calls. Blended Agents can also
refer to Agents who spend a portion of their work schedule engaged in non-telephone activities
such as handling e-mails, chat sessions, back-office work, and so forth.
Bonus or Incentive Compensation: Annual compensation that is over and above the base wage.
This is measured, per Agent, by dollar or percentage above the hourly wage.
Bottom Box Agent Satisfaction: The percentage of lowest possible scores received on the
question: “Overall, how satisfied are you with your position?” (a “lowest” score of 1 out of 5, or
the bottom of whatever scale you use.)
Bottom Box Customer Satisfaction: The percentage of lowest possible scores received on the
question: “Overall, how satisfied were you with the service you received during your contact to
our center?” (A “lowest” score of 1 out of 5, or the bottom of whatever scale you use.)
Budget: The annual contact center budget is the total annual dollar amount attributed to and
allocated for all expenses associated with the operation of the contact center for which the
contact center manager is accountable. The annual budget should include all fully loaded direct
and indirect costs for budgetary line items such as: labor, benefits, and incentives for Agents,
management, training, and support personnel; HR costs (e.g., recruiting, screening, training);
telephony expenses (toll, trunks, equipment); technology purchases/installation (hardware, and
software); technology maintenance (hardware and software) network; furniture, fixtures,
decorations, etc.; utilities (gas, water, power, UPS backup); maintenance (repair, janitorial,
upkeep); supplies; overhead expenses and charge-backs for shared corporate costs (e.g., legal,
risk management, payroll administration, IT support, security, accounting, groundskeeping, real
estate, floor space, common areas, etc.) as applicable.)
Burdened Cost per Agent: The annualized average cost of an Agent, including salary,
commissions, bonus, and benefits.
Business to Business: This is the percentage of contacts exchanged with other businesses as
opposed to end-users (individual customer).
C
Calculated Cost per Call in Dollars: The Annual Budget divided by Annual Calls Handled (total
of IVR-handled and Agent-handled calls). In blended outbound activity, include the percent of the
Annual Budget dedicated to outbound call-occupied time, divided by live outbound calls handled.

Appendix A: Glossary of Terms for Contact Centers
. 38 Copyright © 2017 , BenchmarkPortal, LLC.
For internal use only. Distribution beyond purchasing company is strictly prohibited
Calculated Cost per Call Minute in Dollars: The quotient of Annual Budget divided by Annual
Calls Handled (both technology-handled and Agent-handled calls), divided by Average Call
Handle Time (the sum of Talk Time + Hold Time + After Call Work Time).
Annual Budget Live calls handled Live call time per call Cost per minute
$800,000 / 200,000 = $4 cost per call / 5 minutes $4 / 5 = $0.80
Calculated Cost per Contact in Dollars: The Annual Budget divided by Annual Contacts
Handled by channel and Total.
Calculated Cost per Contact Minute in Dollars: The quotient of Annual Budget divided by
Annual Contacts Handled (both technology-handled and Agent-handled calls), divided by Average
Contact Handle Time.
Annual Budget Live contacts handled Live handle time per
contact
Cost per minute
$800,000 / 200,000 = $4 cost per call / 5 minutes $4 / 5 = $0.80
Calculated Cost per Contact in Dollars: The Annual Budget divided by total Annual Contacts
from all channels (Agent handled and automated) that are handled by the contact center or
location.
Calculated Cost per Full-Time Equivalent (FTE) in Dollars: The value derived from dividing
the annual budget by the total number of FTE’s. (Annual Budget / Total FTE’s)
Calculated Self-Service in Percent: The value given from total number of annual calls handled
by the IVR divided by the sum of all IVR-handled calls and Agent-handled calls, expressed as a
percent.
((Annual IVR-Handled Calls) / (Annual IV-R Handled Calls + Annual Agent-Handled Calls) X 100)
Contact Center Performance Evaluation: This is a process designed to provide a visible means
to manage the contact center and report its accomplishments to upper management. Properly
implemented, it defines those key performance indicators (KPIs) that are optimal to manage the
contact center, determines the frequency with which to collect and analyze performance KPIs,
and provides an understanding and guidance of how to manage the center if KPIs fall below goals.
Contact Quality Monitoring: A process designed to observe and evaluate from 5 to 10 contacts
per month for each Agent, and to record the evaluations on a monitoring form to be discussed by
the Supervisor and the Agent during the coaching process.
Call Recording: A technology that enables contact centers to capture and record most
customer/Agent telephone interactions. See Call Quality Monitoring Process.
Call Routing Process: (See also ACD) This is a process designed to ensure that each call is routed
to the next available Agent with the proper skills and training to handle the call in the most

Worldwide Industry Benchmark Report – (Sample) Industry
39 Copyright © 2017 , BenchmarkPortal, LLC.
For internal use only. Distribution beyond purchasing company is strictly prohibited.
effective and efficient manner possible. Call routing often includes identifying “high-value callers”
and routing them to a shorter queue.
Caller Satisfaction: This is a state of mind that a customer has regarding his or her most recent
voice interaction with a call center. It is typically measured by asking the question: “Overall, how
satisfied were you with the telephone interaction you just had?”
Caller Satisfaction Collection Process: An established, routine process of gathering customer
feedback regarding a recent call center contact experience. This process includes after-call IVR
surveys, follow-up outbound (live Agent) calls, follow-up email surveys, and the like.
Caller Satisfaction Outbound Process: A standard (1 to 5) rating process of gathering customer
feedback regarding a recent contact center-initiated call experience. This process includes after-
call IVR surveys, follow-up outbound (live Agent) calls, follow-up e-mail surveys, and the like.
Caller Self-Service Process: This is a process designed to a) to have the caller input into the IVR
information about themselves and the reason for their call in order to minimize live-Agent time,
and b) to migrate low-value calls to the IVR, where the caller’s question can be answered by the
IVR without the caller talking to an-Agent.
Customer Satisfaction (Customer Experience Survey-CES): This is a state of mind that a
customer has regarding his or her most recent interaction with a contact center regardless of
channel. It is typically measured by asking the question: “Overall, how satisfied were you with the
experience you just had?”
Customer Service Recovery: This process is designed ensure that follow-up to “disgruntled”
customers is properly executed, that their issues are understood and, where possible and
reasonable, their issues are acted upon and resolved with a win-win solution. This process is
different from that of Service Improvement in that it, Service Recovery, is designed to win back
disgruntled or lost customers.
Calls Blocked in Percent: The total number of calls that did not connect with the ACD divided by
the total number of calls offered plus blocked calls multiplied by 100. These are calls that never
make it to the ACD. Examples of blocked calls are: “busy signals,” “number not in service”
messages, etc. This number is commonly furnished by the telecommunications provider.
Calls Handled: These are the total number of unique inbound calls received in a given year by
the center that are completed by an Agent, plus those completed by the IVR. The numeric value
for calls handled must be equal to or less than calls offered, and should be approximate to the
numeric value of calls offered less those abandoned. (This number is often provided by your
ACD.)
Contacts Handled: These are the total number of unique contacts received in a given year by the
center that are completed by an Agent, plus those completed by the IVR. The numeric value for
contacts handled must be equal to or less than contacts offered, and should be approximate to the
numeric value of contacts offered less those abandoned. (This number is often provided by your
channel reporting systems.)

Appendix A: Glossary of Terms for Contact Centers
. 40 Copyright © 2017 , BenchmarkPortal, LLC.
For internal use only. Distribution beyond purchasing company is strictly prohibited
Calls Handled by Agent-Inbound: These are the total number of unique inbound calls received
in a given year by the center that are completed by an Agent. The sum of this value, when added
to the sum of calls handled by the IVR, should equal the value for calls handled by the center.
(This number is often provided by your ACD.)
Calls Handled by Agent-Outbound: These are the total number of outbound calls connected
during a given period of time by the center that are completed by an Agent.
Calls Handled by IVR: These are the total number of unique inbound calls received in a given
year by the center that are completed by the IVR. The sum of this value, when added to the sum of
calls handled by Agents, should equal the value for calls handled by the center. (This number is
often provided by your ACD.)
Calls Offered: This is the total number of inbound calls received at the ACD in a given year by the
center. (This number is provided by your ACD.)
Calls per Hour: The total number of calls handled per Agent per shift divided by the total
number hours worked; i.e., 48 live calls per shift / 6 hours occupied per shift = 8 calls per hour
Calls Resolved on First Call: This is the total numbers of calls that were completely resolved
during the course of the first inbound call initiated by the customer (and that therefore do not
require a call back to resolve the issue) divided by total numbers of calls handled by Agents –
expressed as a percent. Also known as first call resolution (FCR) and first time final.
Calls Transferred in Percent: The total number of calls transferred by Agents (due to their
inability to properly or completely handle the call – for whatever reason), divided by the total
number of unique calls handled by Agents. This would not include voluntary transfers to other
departments after resolution occurs for the initial call reason.
Campaign: See Outbound Call Campaign
Campaign List: Outbound call dialing list(s) used in connection with Automatic (Predictive)
Outbound Dialers. These lists are fed into the automatic dialer throughout the calling day until all
calls have been completed or until an answering machine response protocol has been employed.
Uncompleted campaigns are carried over to the next day(s).
Chat Session: See Web Chat.
Computer-Telephony Integration (CTI): This refers to the technology that enables the
coordination and integration of computers with telephone systems. Functions of CTI include:
Calling Line Information Display, Screen Population (on call answer), On Screen Dial, Preview and
Predictive Dial, and On Screen Call Control. For outbound calling such as telemarketing, CTI pre-
dials the callers, matches the number of a called party with a customer record and displays it for
reference by the Agent when talking to the customer.
Connects: See Live Connect Percent.
Consumer to Business: This is the percentage of calls exchanged with people working for
businesses as opposed to calls from individuals contacts in their private capacity.

Worldwide Industry Benchmark Report – (Sample) Industry
41 Copyright © 2017 , BenchmarkPortal, LLC.
For internal use only. Distribution beyond purchasing company is strictly prohibited.
Contact Channel: See Customer Access Channels.
Contacts per Hour: The total number of customer contacts from all channels handled per Agent
per shift, divided by the total hours worked- i.e., 48 live contacts per shift / 6 hours occupied per
shift = 8 contacts per hour
Contacts Resolved on First Contact: This is the total numbers of customer contacts from all
channels that were completely resolved during the course of the first contact initiated by the
customer (and therefore do not require a follow-up contact to resolve the issue) divided by total
numbers of contacts from all channels handled by Agents – expressed as a percent (Also known
as First Contact Resolution (FCR) or First Time Final).
Cost per Call: This is the sum of all costs for running the contact center for the period divided by
the number of calls handled in the contact center for the same period. This includes all calls for all
reasons whether handled by an Agent or technology, such as IVR. You can also just calculate the
cost per call for Agent-handled calls. The number of calls received will be captured by the ACD.
The total cost of the center can be obtained from your accounting department.
Cost per Contact:
a) Across all channels: This is the sum of all costs for running the contact center for the specified period, divided by the number of contacts handled in the contact center for the same period for all contact channels, including phone (live Agent and IVR), e-mail, web-chat.
b) By channel: This is the sum of all costs for running the contact center for the specified period divided by the number of contacts handled in the contact center for the same period for each contact channel, factored by its percentage of total contacts for all channels for the period, as follows:
1. Cost per Agent Handled phone contact = (Budget / # Agent Handled phone contacts) x (# Agent Handled phone contacts / total sum of all contacts)
2. Cost per IVR Self-Service contact = (Budget / # IVR Self-Service contacts) x (# IVR Self-Service contacts / total sum of all contacts)
3. Cost per E-mail contact = (Budget / # E-mail contacts) x (# E-mail contacts / total sum of all contacts)
4. Cost per Web Chat contact = (Budget / # Web Chat contacts) x (# Web Chat contacts / total sum of all contacts)
Cross-Sell: A cross-sell occurs when an Agent recognizes that the customer might be able to use a
product from the same company, but in a totally different product line. For instance, an Agent at a
banking contact center who is opening a savings account for a customer might recognize the
advantage for the customer to purchase a CD from the bank at a higher interest rate.
CTI: See Computer-Telephony Integration.
Customer Access Channels: Customer access channels are the multiple ways that customers can
reach out and contact a company. A few of the obvious access channels are telephone, e-mail, fax,
normal mail, kiosk, and face-to-face.
Customer Centric: Placing the wants and needs of the customer as the central focus of all
business practices within the firm. Seeing your business through the “eyes of the customer.”

Appendix A: Glossary of Terms for Contact Centers
. 42 Copyright © 2017 , BenchmarkPortal, LLC.
For internal use only. Distribution beyond purchasing company is strictly prohibited
Customer Lifetime Value: The imputed dollar revenues or profits (depending on formula)
generated by the customer for as long as the customer remains with the firm.
Customer Relationship Management (CRM): This process is designed to ensure that the Agent
taking a contact is aware of all aspects of the customer’s information, including such things as
purchasing history, previous contacts, credit rating, channel preferences, value to the company,
and many more. The CRM process allows the Agent to use this customer information to better
serve the customer’s needs during the contact handling experience.
Customer Retention: The process of keeping a customer as opposed to losing the customer to
the competition. A percentage of this figure would be the tenure of the average customer with the
firm as computed by the sum of the time of all customers with the firm divided by the number of
customers.
Customer Satisfaction: This is a state of mind that a customer has about a company in which
their expectations have been met or exceeded over the lifetime of the product. This leads to
company loyalty and product repurchase.
Customer Share: The percent of those who purchase the item of interest from a given firm. This
is computed as the number of customers who purchase the item from a given firm divided by the
number of customers who purchase the item from all firms combined.
Customer Value Segment: Customer value segmentation strives to segment customers based on
their financial value to the company. This value is usually based on a combination of the total
amount of money that a customer spends with the company, and the profitability of that revenue
stream. The best example would be the frequent flyer programs that the airlines have. United, for
instance, has the following value segments with its frequent flyer program: a) regular frequent
flyer, b) premium frequent flyer, and c) 1K frequent flyer.
D
Dedicated Outbound Agent: This describes the differentiated skill of an Agent who is assigned and occupied full time to an outbound team or department in the Contact Center. Such Agents typically will not switch to inbound calls or other activity during the day. This is in contrast with Blended Agent activity. Dial Attempts: A volume measure of all dials made to a predetermined customer list. The attempt includes the ring, no answer, voice mail, and/or connects. It becomes the baseline of outbound activity typically used for occupancy confirmation.
DNIS: Dialed Number Identification Service. A carrier service for 800/888 and 900 numbers that
forwards the number dialed by the caller to the called party.
E
Effectiveness Index: The index is calculated by statistically combining into an index those
metrics that are indicative of effective performance. This is considered to be a quality metric and
impacts customer-focused processes.

Worldwide Industry Benchmark Report – (Sample) Industry
43 Copyright © 2017 , BenchmarkPortal, LLC.
For internal use only. Distribution beyond purchasing company is strictly prohibited.
Efficiency Index: The index is calculated by statistically combining into an index those metrics
that are indicative of efficient performance. This is considered to be a productivity metric and
focuses on the cost investment of time or money in operating the business.
E-Mail Auto Response: See Auto Response.
External Metrics: These are usually characterized as “soft” numbers as they are the collected
attitudes, opinions, and emotions of customers or other interested parties. The data may be
collected by survey, focus group, or interview methods. This represents the customer
perspective.
F
Full-time Agents: A full-time Agent is one who works 40 hours or more per week, or for
whatever comparable equivalent is used. In some cases, full-time Agents are counted at 36 hour
per week. As this is an operational metric, the specific hours worked is less important than the
number of Agents working in the capacity of a full-time Agent.
Full-time Equivalent (FTE): This is an operations and workforce metric that aggregates the
amount of all labor used in terms of a full-time workforce. It is derived by adding the cumulative
sum of labor hours for both full-time and part-time employees for a specified period and dividing
its sum by 40.
Total FTE’s = (total average hours of full-time Agents + total average hours of part-time
Agents)/40
Agent Type Agent Head-Count
Average Hrs
Worked /Wk /
Agent
Total Weekly
Hours
Full-Time
Equivalent
Hours
Total FTE’s
Full-time 50 40 2000 50
Part-time 20 30 600 40 15
Totals 70 70 2600 40 65
H
Handle Time:
Inbound Call: The sum of talk time, hold time, and after-call work time.
IVR: The average amount of time a caller spends in the IVR before the caller either hangs up
or is forwarded to the Agent queue.
Outbound Call: The sum of talk time and after-call work time.
E-mail: This is the total time, including after work time to process an e-mail transaction.

Appendix A: Glossary of Terms for Contact Centers
. 44 Copyright © 2017 , BenchmarkPortal, LLC.
For internal use only. Distribution beyond purchasing company is strictly prohibited
FAX: This is the total time, including after work time to process a facsimile transaction.
Web Chat: This is the total time, including after work time to process a web chat transaction.
White Mail: This is the total time, including after work time to process a White Mail
transaction.
Social Media: This is the total time, including after work time to process a social media
transaction.
Help Desk: The term typically applied to a contact center that primarily handles contacts from
employees about technical problems with their computer, monitor, printer, and the like.
Hold Time: The cumulative sum total of all hold time, divided by the number of calls placed on
hold for the period measured. This measurement may also be derived from percent of calls held.
Hours per Shift (a.k.a. Shift Hours): See Average Paid Shift Length in Hours.
I
Idle Time: (See also Average Time between Contacts.) This is the average number of minutes
during which the Agent is logged into a system in a “ready” state waiting for the next contact, or
in other words, the average idle time in minutes an Agent is in waiting mode between contacts.
Information Access: An internal process designed to make all information needed by the Agent
easily accessible on the Agent’s desktop for quick and accurate answers to customer’s questions.
In theory, the Information Access process defines those access points used by Agents to tap into
the knowledge base management system (KBMS) of the company.
Internal Metrics: These are generated by computers internal to contact center technology (PBS,
ACD, or VRU) or by departments such as Accounting, Finance, or Human Resources. Internal
metrics are commonly perceived as “hard” numbers. Examples include average handle time,
queue time, and abandon rate. These metrics generally do not reflect the view the customer has
of your company.
IVR (Interactive Voice Response): Technology that both routes calls and allows a customer to
interact with the data systems by responding to a menu of options. Responses are typically
entered by pressing the keys on the telephone keypad; however, voice recognition is becoming
more commonly integrated into the process.
IVR Containment: See Percent IVR Containment.
IVR Opt Out: Measured in percent, this is the number of callers who, during their call to your
center, initially attempt to find solutions via the IVR, but then elect to speak with an Agent. This is
not the same as those who choose to speak to an Agent as an initial menu option.
K
Key Performance Indicator (a.k.a. KPI): A set of quantifiable measures that a contact center
uses to gauge or compare performance in terms of meeting their operational and strategic goals.
Common KPI metrics include cost per call, average speed of answer, hold time, occupancy, and
utilization.

Worldwide Industry Benchmark Report – (Sample) Industry
45 Copyright © 2017 , BenchmarkPortal, LLC.
For internal use only. Distribution beyond purchasing company is strictly prohibited.
L
Labor Union: A legally recognized professional body organized for the purpose of supporting the
needs of its members through the collective bargaining of wages, benefits, and working
conditions.
List Penetration: (See also Campaign List.) A telemarketing metric that measures the percentage
of the daily calling list (or “campaign”) that result in a completed live call.
Live Connect Percent: This is the percentage of calls made where a person answers divided by
the total calls attempted. Within the live connects, you can measure “Right-Party (Decision
Maker) Connect.” Live connects do not to include hang-ups, voice-recorders, call intercepts, busy
tones, etc.).
M
Minutes of Telephone Usage: This is the annual number of minutes of telephone usage by the
call center for calls. This does not include the phone usage for executive, administrative, and
support personnel. This number is often provided by your telecommunications service provider
(the phone company).
Moment of Truth: MOT is a critical interaction between the customer and the product or service
or employee that determines whether the customer will continue to purchase from the vendor.
Multi-Channel Center: In a multi-channel contact center, an Agent handles incoming and outgoing calls, e-mail, live chats, and other tasks such as letters, Faxes etc. as needed. Need is determined by contact center traffic levels as they occur randomly throughout the shift. This differs from a blended contact center in that the traffic flow is not forecasted, regulated, or managed on a business-rules driven, scheduled basis.
O
Occupancy: This is the total staffed time logged in to the ACD (including ready/available,
engaged on call, in ACW, or other active states) or other technology and is available to handle
inbound phone, outbound phone, e-mail, chat and other productive work (white mail or back
office work), divided by the total scheduled (paid) hours at work.
Order Taking and Tracking: This is a specific function of customer service and it means that
this contact center specializes in taking and tracking orders.
Outbound Call Campaign: For outbound call centers, a campaign is a specific operation to call a
pre-selected list of individuals for a specific purpose. (See Outbound Call Types below.)
Outbound Call Types: In benchmarking you can compare to others by call function in three
distinct service call types: (1) Sales / Leads / Telemarketing; (2) Collections; (3) Surveys
/Research / Follow-up Contacts.
Outbound Performance Metrics: These are all the measurements that indicate the performance
of an outbound telephone Agent or contact center. Examples include Sales per Agent per Shift or
measures related to results, revenue, or resolution.
Appendix A: Glossary of Terms for Contact Centers
. 46 Copyright © 2017 , BenchmarkPortal, LLC.
For internal use only. Distribution beyond purchasing company is strictly prohibited
Outsourcing: The process of contracting through a third-party, teleservices company to manage
the contact-handling experience for a company that: a) doesn’t have the core competency to
handle various or multiple contacts from its customers, and/or b) has too many contacts to
handle for its existing base of trained Agents. The third-party teleservices company typically
specializes in contact handling as their only core competency.
P
Part-time Agents: A Part-time Agent is one who works a schedule of less than 36 hours per week
or whatever equivalent part-time cap is used by your center. As this is an operational metric, the
specific hours worked is less important than the number of Agents working in the capacity of a
part-time Agent, e.g.,. if an Agent works 30 hours part-time compared to 40 hours full-time, they
are .75 equivalent.
PBX: A telephone switching device owned by a private company vs. one owned by a common
carrier.
Peer Group: Peer Group most often refers to the contact centers that have the same profile of
activities as your company. For instance, a peer group might be all contact centers handling
mostly inbound contacts that are mostly business-to-business in a contact center of over 100
Agents for a company with annual revenues of over one billion dollars. Peer group does not
necessarily connote competitors.
Penetration Level: See List Penetration.
Percent Abandoned: See Abandon Rate.
Percent Agent Utilization: See Agent Utilization Rate.
Percent Attendance: See Average Attendance in Percent.
Percent Blocked Calls: See Calls Blocked.
Percent Contacts Handled on the First Contact (a.k.a. First Time Final): See Contacts
Resolved on First Contact.
Percent IVR Containment (aka, Percentage of IVR Self-Service): This is the percentage of calls
that were completely resolved within the IVR and were not forwarded to an Agent.
Percentage Live Connects to Total Attempts: This is the total number of calls answered by an
person divided by the total number of calls attempted. This is not the same as Right-Party
Connects.
Percentage of Calls Placed in Queue: See Average Time in Queue.
Percentage of Calls Transferred: See Calls Transferred in Percent.
Power Dialer: A power dialer is more than simply an automatic dialer. It not only helps connect
and manage the call; it can personalize calls to existing customers by bringing up related
customer history and personal preferences. This can help to convey the feeling that each
customer is receiving preferential treatment.

Worldwide Industry Benchmark Report – (Sample) Industry
47 Copyright © 2017 , BenchmarkPortal, LLC.
For internal use only. Distribution beyond purchasing company is strictly prohibited.
Predictive Dialer: A type of autodialer. A predictive dialer dials ahead of Agents becoming
available or when the predictive dialer matches a forecast number of available Agents with a
forecast number of available called parties. These processes provide large increases in dial rates
and Agent productivity.
Preview Dialer: A preview dialer automatically presents an Agent with contact information
prior to dialing the number. The Agent has complete control over the dialing process and can
inform the preview dialer if and when the call is to be placed. If the Agent does not wish to
proceed with the call, the preview dialer can present another contact for the Agent to review.
Preview dialing is an effective automated dialing technique when the Agent requires more
control over the call process and may prioritize which contacts are to be made. Also, if the Agent
requires additional time prior to the call to read through notes or call history, this technique is
useful because it lets the Agent manage contact preview time.
Public Business (or Branch) eXchange : See PBX.
Q
Queue Time: See Average Time in Queue.
R
Real-Time Expert Hub: A process designed to enhance the probability that each contact is
completed on the first contact. A Real-Time Expert Hub is often staffed by subject matter experts
(SME).
Right-Party Connects (RPC): This is the percentage of calls made where the intended party
answers, divided by the total calls attempted. This is not to be confused with “Live Connect”
which measures anyone providing a response to an outbound call connection
Rejection: The customer’s state of mind such that disengagement from the current relationship
has already been decided and has been or soon will be implemented. Negative word of mouth is
likely to occur.
S
Semi-automatic Dialer: An Agent-controlled dialer. All actions (dialing, playing audio message,
recording, and the like) are initiated by an Agent, normally with the press of a key. It is a
productivity tool for telemarketing Agents.
Service Improvement: A process designed to use customer feedback from the contact-handling
experience to improve how future contacts are handled. Properly implemented, it involves
conducting customer feedback surveys, documenting complaints, fixing the customer’s problem,
and the process that caused the problems of the customer.
Service Level: This is a broad-based term that is used to measure productivity; however, its use
is not exclusive to the productivity of contact handling. In contact centers it commonly defines X
amounts of output in Y amounts of time. For example, 80 percent of calls answered in 20 seconds.
Shifts per Year: On average, a full-time Agent works approximately 250 shifts per year for an 8-
hour shift, or 200 shifts per year for a 10-hour shift. However, the number of shifts worked by
Appendix A: Glossary of Terms for Contact Centers
. 48 Copyright © 2017 , BenchmarkPortal, LLC.
For internal use only. Distribution beyond purchasing company is strictly prohibited
part-time Agents may actually be more or less than this, depending upon the average length of
shifts and numbers of shifts worked per year. This may also be interpreted as the average
number of times that an Agent reports to work.
Single Channel Center: Contact Centers that support a single contact channel and/or Customer
function only. (e.g., Inbound Telephone calls, Outbound Calls, e-mail, etc.).
Skills-based Routing: A technology enabling the routing of contacts to Agents assigned a
particular skill or set of skills. A common component of most ACD systems.
Smart Autodialer: A Smart Autodialer is an autodialer capable of personalizing messages and
collecting touchtone or speech feedback. A speech engine is usually included for converting text
to speech and recognizing speech over the phone.
Span of Control (Agents to Supervisor Ratio): This is the total number of Agents, including
leads (if used,) assigned to the control of each supervisor, expressed as a ratio.
Speech Recognition: A technology designed to use interpreted human speech that enables
people to interact with a computerized (telephone) system.
Staffing Model: The Workforce Management method employed by contact center management
to determine the optimal number of Agents to schedule per shift by using a third-party workforce
management system or an in-house scheduling system. Blended staffing models are used to
assign time spent on inbound vs. outbound contact activity and occupancy.
Subject Matter Expert (SME): This is a designation specific to an organization, business unit,
process, or item this is assigned to someone who demonstrates exceptional levels of expertise,
knowledge, and abilities in the performance of a particular job-skill, task, or function related to
the topic: a person that has an extended sense or in-depth knowledge of a particular subject.
T
Talk Time: See Average Talk Time.
Telephone Grade of Service (80% of calls answered in xx seconds): This is a productivity
measure of the average time in seconds it requires for a center to answer 80% of its calls offered.
This differs from standard service level measurements that set a goal in time to which the center
shall attempt to handle a prescribed volume of calls within.
Use the following formula to calculate this value: Let X = your service level time; let Y = your
service level percentage; S = the time in which 80% of calls are answered. S = (X .80)/Y). For
example, if you answer 93% of your calls in 20 seconds, the results are as follows: S = (20
.80)/.93 = 17.20 seconds.)
Top Box Agent Satisfaction: The percentage of perfect scores received on the question, “Overall,
how satisfied are you with your position?” (A “highest” score of 5 out of 5, or the top of whatever
scale you use.)

Worldwide Industry Benchmark Report – (Sample) Industry
49 Copyright © 2017 , BenchmarkPortal, LLC.
For internal use only. Distribution beyond purchasing company is strictly prohibited.
Top Box Customer Satisfaction: The percentage of perfect scores received on the question,
“Overall, how satisfied were you with the service you received during your contact with our
center?” (A “highest” score of 5 out of 5, or the top of whatever scale you use.)
Total Calls Offered: See Calls Offered.
Touch-point: Touch-point is a “buzzword” for customer access channels. (See also Alternate
Points of Contact, Customer Access Channels.)
U
Up-Sell: To sell a higher value product to an existing customer. For example, to lease a more
expensive copier to an existing customer. (Also see Cross Sell).
Utilization: See Agent Utilization Rate.
V
Value-based Routing: A programmable form of Skills Based Routing targeted at Customer Value
where customers are ranked in revenue or sensitivity value and their contacts are handled by
designated Agents.
Value Creating Gap: This represents a performance gap where your contact center is doing
better than your peer group.
Value Destroying Gap: This represents a performance gap where your contact center is doing
worse than your peer group.
Voice Response Unit (VRU): See IVR.
W
Web Chat: An interactive keyboard messaging exchange between a customer / client / individual
and a customer support representative (CSR) conducted over the company’s Internet web site.
Web Chat Session: This is the total elapsed time from the beginning to the conclusion of an
interactive Web Chat exchange, expressed in minutes.
Workforce Management: Related to Workforce Optimization, a process often used for contact
forecasting and Agent scheduling using historical contact data. Other functions of workforce
management may include skills-based scheduling, schedule adherence, time-off administrations,
performance management tools and reporting
Workforce Optimization: A process designed to ensure that all Contact Center personnel with
the right skills are in the right seats at the right times to maximize the contact center’s
productivity with the fewest possible resources.
Wrap-Up Time (a.k.a. Wrap time): See: “After Contact Work Time”.

50 Copyright © 2017 , BenchmarkPortal, LLC.
For internal use only. Distribution beyond purchasing company is strictly prohibited
Appendix B:
Tonchev Performance Index
51 Copyright © 2017 , BenchmarkPortal, LLC.
For internal use only. Distribution beyond purchasing company is strictly prohibited
1. Introduction Indexes have been widely used to measure the market performance of companies active in
diverse industry sectors. However, as the business processes become more complex and inter-
dependent there is an emerging need for a structural analytical methodology that thoroughly
examines all the aspects of the company’s performance. In response to this challenge, the
Tonchev Performance Index (TPI) was developed to match the performance requirements of the
Contact Center Industry. The index’s objectives, structure, calculation and characteristics are
briefly described in this paper to facilitate its understanding and utilization.
2. Objectives The Tonchev Performance Index (TPI) has the following six objectives:
1. Business Performance Measurement: to quickly and quantitatively describe a
company’s Contact Center as compared with its industry peers.
2. Effectiveness and Efficiency Balance: to take into consideration the balance needed
between effectiveness (quality) and efficiency (productivity).
3. Industry and Operations Sensitivity: to evaluate the Contact Center’s performance based
on both industry and business criteria.
4. Mathematical Normalization: to normalize all key performance indicators so that metrics
are expressed in identical and comparative units.
5. Simplified Calculation: to be easily comprehended, calculated and believed
6. Adjustment Allowances: to allow adjustments and updates without major re-design.
3. Index Structure Considering the above-mentioned objectives, the TPI index has a multi-level division of its composite metrics. The first division is by types of Contact Centers. Here, there are three possibilities: inbound, outbound, and both. For each of these three categories, there is a further split into equal amounts of effectiveness and efficiency key performance indicators. The idea behind this separation is to achieve a balanced model that realistically measures a Contact Centers’ performance. Finally, the last metrical division is by industry types. (Please, see the two figures below.)

Appendix B: Tonchev Performance Index
52 Copyright © 2017 , BenchmarkPortal, LLC. For internal use only. Distribution beyond purchasing company is strictly prohibited
4. Index Calculation The main TPI index’s formula is:
Metrics
I nbound
Outbound
Both
Effectiveness : Efficiency
Effectiveness : Efficiency
Effectiveness : Efficiency
I ndustries
I ndustries
I ndustries
A Balanced Model (example)
Effectiveness Metrics:
% of Calls Resulting in Complaints
80% of All Calls Answered in Sec .
Average Abandoned Calls in %
Average Time in Queue in Sec.
Calls closed on First Call in %
Calls blocked in %
Average Time Before Abandoning in Sec.
% Handled by Self-Service
Average Sale Value in $
Average TRS Cubical Workspace in Sq Feet
% of Call Up-Sell/Cross-Sell Opportunities
Average Data Entry Error Rate per 1K calls
% of Highest Score for Customer Satisfaction
New-hire Training in Hours
Efficiency Metrics:
Inbound Tel. Usage in Min
Average Speed of Answer in Sec.
Average Talk Time in Min.
Average After Call Work in Min.
TSR Occupancy in %
Adherence to Schedule in %
Average Attendance in %
Average Inb. Calls per 8h Shift per TSR
Annual Turnover of Inb. Full-Time TSRs in %
Annual Turnover of Inb. Part-Time TSRs in %
Cost per Call in $
Cost to Bring a New TSR $
% of TSRs Participating in Labor Unions
% of Work Space/Total Avail. Space
=

Worldwide Industry Benchmark Report - (Sample) Industry
53 Copyright © 2017 , BenchmarkPortal, LLC. For internal use only. Distribution beyond purchasing company is strictly prohibited
k PQ
P)(QTBPI
Q = Effectiveness Metrics
P = Efficiency Metrics
k = “Out-of-Balance” Penalty Factor
n
1i i_f or_av erage_industry,q
i_f or_av erage_industry,qi,qi,q
KPI
KPIKPICQ
m
1i i_f or_av erage_industry,p
i_f or_av erage_industry,pi,pi,p
KPI
KPIKPICP
KPI = Key Performance Indicator
n = Total Number of Effectiveness KPIs
m = Total Number of Efficiency KPIs
n = m (Balanced Model)
KPIq,i = Effectiveness KPI
KPIp,i = Efficiency KPI
Cq,i = Gap Direction Coefficient
Cp,i = Gap Direction Coefficient
5. Graphical Presentation of the TPI index The Tonchev Performance Index is graphically represented by “The Leaf Diagram” (See the figure
below). This diagram is a type of matrix with two axis: effectiveness and efficiency. Diagonally,
across the center of the matrix, there is a yellow line that shows the balance between the two

Appendix B: Tonchev Performance Index
54 Copyright © 2017 , BenchmarkPortal, LLC. For internal use only. Distribution beyond purchasing company is strictly prohibited
parameters. Additionally, there are “Line 0” and “Target Line”. The first line shows the
combination of points with TPI index equal to zero, whereas the second line points the desired
performance. The slope of these lines determines how much a particular company is penalized
for not being able to balance quality with productivity. The closer a given point is to the upper
right side of the balance line, the higher the TPI index and therefore the better the performance.

Worldwide Industry Benchmark Report - (Sample) Industry
55 Copyright © 2017 , BenchmarkPortal, LLC. For internal use only. Distribution beyond purchasing company is strictly prohibited
6. Advantages and Limitations of the TPI Index The TPI index differs substantially from the conventional performance indexes. Its main advantages and limitations can be summarized as follows: Advantages:
Balance between effectiveness and efficiency - Equal attention is paid on both goals.
Therefore, if there is an imbalance between effectiveness and efficiency, the company’s
performance is penalized, and the index is lower.
Transparent Results – The index value tells exactly the company’s deviation from the
industry average. Depending on the performance, this value can be positive, neutral, or
negative.
Normalization – All metrics included in the index calculation have the same units,
namely they are all in percent, (%).
Adjustability – When necessary, the index allows updates and corrections.
Comparability – Since the company performance is measured by percentage deviation
from the industry average, the index compares “apples with apples”.
Dynamics – Except for the penalty factor, the index does not rely on static coefficients.
Instead, it is based on dynamic industry data.
Limitations:
Database Requirement – The index requires a large database.
Pair Principle – Since the index’s effectiveness-efficiency balance must exist, the addition of
new effectiveness metrics always has to correspond with the inclusion of equal amounts of
efficiency metrics.
Penalty Factor – Even though the penalty factor has a logical justification its value can be
biased.
7. Conclusion
The TPI index is a performance benchmark tool that gives a numerical value of the Contact Centers’ performance. It is a balanced index that can be used for comparisons of different types of Contact Centers with various business operations. The strength of the TPI index is its simplicity and dynamic nature. It can help organizations to identify their weak areas and show the path leading to improved financial and market results. In conclusion, just as the finish time determines the performance of the long-distance runner, the TPI index is a single aggregate value that measures a Contact Center’s competitive performance.

56 Copyright © 2017 , BenchmarkPortal, LLC.
For internal use only. Distribution beyond purchasing company is strictly prohibited
Appendix C:
Principal Investigators

57 Copyright © 2017 , BenchmarkPortal, LLC.
For internal use only. Distribution beyond purchasing company is strictly prohibited
Bruce Belfiore is CEO of BenchmarkPortal and Senior Research
Executive at the Center for Customer-Driven Quality, founded at Purdue
University. BenchmarkPortal provides best practices information to the customer
contact industry worldwide.
A dual national, Bruce has divided his career between North America and Europe,
and has fulfilled work assignments in Asia and Africa as well. He has worked in the finance sector
with international commercial and investment banks. Bruce worked with the Bain & Co.
management consulting group in Italy and formed a specialty unit advising clients in the field of
corporate finance. While in Europe, Bruce was also a speaker and writer on business topics in
English and Italian.
Bruce first became involved in the contact center sector over a decade ago and joined
BenchmarkPortal, Inc. in 2000. Bruce is the author of the books Benchmarking for Profits!, a
manual for best practices contact center benchmarking, as well as its sequel, Benchmarking at its
Best for Contact Centers. He is currently working on another book, Shareholder Value and
Customer Contact with Dr. Jon Anton of Purdue University.
He is involved with the certification of Contact Centers of Excellence under the Center of
Customer-Driven Quality (Purdue Research Park, Purdue University), administered by
BenchmarkPortal. He is also Dean of the College of Contact Center Excellence, which provides
advanced curricula to contact center managers and supervisors.
Bruce is Co.-inventor of a patent for a symbolic language system, Simbly™, with important
contact center applications. Simbly, which uses nested symbols to encapsulate and standardize
frequently used text “chunks” has been shown in research to lower data entry time by 17 to 20%,
and offers advantages to operations that must deal with more than one language.
Bruce holds an A.B. degree from Harvard College, a J.D degree from Harvard Law School, and
an MBA degree from Harvard Business School, where he also attended the HBS Entrepreneur’s
Tool Kit program in 2000. He has published numerous articles and has been a featured speaker
in both English and Italian on a variety of business topics.
Bruce can be reached at [email protected].

Appendix C: Principal Investigators
58 Copyright © 2017 , BenchmarkPortal, LLC. For internal use only. Distribution beyond purchasing company is strictly prohibited
John Chatterley is a Senior Consultant and Director of Research and
Analysis for BenchmarkPortal, specializing contact center performance
research, analysis, technical writing, and content editing. John has published
numerous customized benchmarking reports, research reports, One-Minute™
Survey reports, and White Papers.
Mr. Chatterley is editor/writer/analyst of BenchmarkPortal’s annual
series of 42 detailed industry reports covering the spectrum of contact center industry sectors,
and Chief editor/analyst of BenchmarkPortal’s series of One-Minute™ Surveys. He authored a
comprehensive White Paper study entitled “Improving Contact Center Performance through
Optimized Site Selection.” Mr. Chatterley has been and continues to be retained for his contact
center expertise with numerous contact centers and consulting firms, both domestically and
internationally. He is a faculty member with the College of Contact Center Excellence.
Mr. Chatterley co-authored numerous books with Dr. Jon Anton, including:
1. “Coaching Call Center Agents,”
2. “Defining Customer Care,”
3. “Automated Self-Service Using Speech Recognition,”
4. “Listening to the Voice of the Customer,
5. ”Contact Center Management by the Numbers”
6. “Offshore Outsourcing Opportunities,“
7. “Selecting a Teleservices Partner,”
and is currently working on several others.
John’s professional career spans more than 20 years of experience in contact center
management and consulting. Mr. Chatterley designed, implemented, staffed and managed three
500+ seat contact center sites in Arizona, Nevada, and California, and has extensive contact
center operational management experience. He possesses first-hand experience at all levels of a
contact center including front-line technical support agent, supervisor, team lead, analyst,
designer, contact center manager, and operations director.
John is a Purdue Certified Contact Center Auditor, Certified AT&T Call Center College
Instructor, BenchmarkPortal Certified Benchmarking Instructor and Analyst. John’s professional
education was in Electrical Engineering & Computer Science at Southern Utah University, and
subsequently at the University of Utah.
John can be reached at [email protected]
Worldwide Industry Benchmark Report - (Sample) Industry
59 Copyright © 2017 , BenchmarkPortal, LLC.
For internal use only. Distribution beyond purchasing company is strictly prohibited
David Raia is highly regarded in the industry as a Contact Center
Operations Improvement Specialist. He began his consulting career in 1995
and has spent the past 15 years successfully driving a variety of complex
Contact Center Optimization engagements across Federal Government and
Fortune 500 companies in the United States and Canada. He has successfully
delivered People, Process and Technology Improvement projects for Contact
Center functions that include: Sales and Service, Credit and Collections,
Campaign Management and CRM Strategies and Tactics. He and his project
teams have met or exceeded Business Case commitments in each completed engagement. His
areas of expertise include Virtual Consolidations, Market Segmentation, Contact Management,
Quality Assurance, Agent and Supervisor Training, Reporting and Performance Management and
related workforce optimization. Mr. Raia has been a featured speaker on many of these topics at a
variety of national Contact Center and Management Seminars.
David enjoyed a successful thirty-year career in the telecommunications industry; holding a
variety of line and staff managerial positions in Sales, Service, Strategic Planning and Finance. In
his last assignment, he was the General Manager for a 1,500 seat multichannel and multi-
functional National Sales and Service Assistance Center. He was responsible for introducing a
leading edge Expert Systems Knowledge and Contact Management platform to his organization
that, with modifications, is still operating effectively today.
He joined a major Contact Center CRM consultancy in 1995 and spent 15 years primarily
managing varied and complex Contact Center engagements across the United States and Canada.
His areas of expertise include Contact Center: Assessments, Operations, Organizational Design,
Strategies and Tactics, Business Case Development, Measurements and Metrics, Migration
Planning and Project/Program Management. He has been a featured speaker on many of these
topics at a variety of national Contact Center and Management Seminars. He is currently Skill
Group lead for eLoyalty’s Contact Center Professional Services Consultants and Thought Leader
for the firm’s Contact Center Optimization Proficiency.
David can be reached at [email protected]

60 Copyright © 2017 , BenchmarkPortal, LLC.
For internal use only. Distribution beyond purchasing company is strictly prohibited
Appendix D:
Partial List of Benchmark Participants

Worldwide Industry Benchmark Report - (Sample) Industry
61 Copyright © 2017 , BenchmarkPortal, LLC.
For internal use only. Distribution beyond purchasing company is strictly prohibited
Catalog-Wholesale/Retail 1-800-flowers ALJ Blair Corporation Bob Barker Company Bodybuilding.com Buyseasons Inc. Central Power Systems Chico's Eddie Bauer Gopher Sport Home Décor Products, Inc. Horace Mann Integrated Merchandising Systems - Group II Logicom Bilgi Teknoloji Dagitim Ltd Sti Manpower EU MidwayUSA Miles Kimball MSC Industrial Supply Musictoday Network Direct Inc PRC - Philip Morris R&B, INC Rent A Center Silhouette Optical Sleeman Breweries Ltd/CAC Southern Fulfillment Services Sysco Business Services The Bradford Exchange Ultradent Products Victoria’s Secret VWR International Wine Country Gift Chemicals / Pharma Ecolab Monsanto Mylan Pharmaceuticals, Inc. Novo Nordisk Inc. SABIC Scherzinger Pest Control Computer Hardware
Caleris Cornerstone Medical Care DB Sync Testing Dell HCL Technologies HP IBM Motorola Solutions RMZ Siemens Government Technologies VeriFone, Inc. Computer Software asknet AG Beeline BidSync CCC Information Services DealerTrack ExpressDigital ezybus Intuit MakeMusic, Inc. McKesson Automation Systems McKesson Pharmacy Systems Midwest Real Estate Data Mitchell International Ovid PLATO Edmentum RealPage, Inc. Sterling Commerce Symantec.com TaxSlayer The SAVO Group Thomson West TREND Wolters Kluwer Health Consumer Products- Consumables Alaven Consumer Healthcare E J Gallo Winery Giant Eagle Inc. Herbalife Internacional Herbalife USA
illy Caffe, N.A. Inc. Jostens Labatt Breweries of Canada Mannatech Meda Consumer Healthcare Nestle Purina PetCare Nutri-Health Supplements Sleeman Breweries Ltd Starbucks Coffee Company Thorntons Oil Wawa Inc. Winn-Dixie Consumer Products Durables a c s Acushnet Company Advance Auto Parts Alta Resources Blinds.com Braun Corporation Cemcol Columbia Sportswear Euro-Pro Event Photography Group EXEO Consulting John Deere Kohler Co. Multi Pure International Corp Nebs Business Products (Canada) Newell Rubbermaid Oreck Shaw Industries Inc Snap-On Incorporated The great courses The RoomPlace Vistaprint Consumer Products- Electronics Jawbone Motorola Solutions OSRAM Sylvania Panasonic

Appendix D: Partial List of Benchmark Participants
62 Copyright © 2017 , BenchmarkPortal, LLC. For internal use only. Distribution beyond purchasing company is strictly prohibited
Research In Motion Samsung Snap-on Diagnostics Sony of Canada Ltd Wasla outsourcing WDC Consumer Products-Non Durable British Petroleum Edward Don & Company L'Oreal USA Payless ShoeSource Sephora Unilever Consumer Products-Other AASA Affinion Group Bass Pro Shops Defender Direct Emery Waterhouse Entertainment Publications Giant Eagle, Inc Neill Corporation NEW Customer Service Companies Nutri-Health Supplements Staples, Inc. Water Pik, Inc Education Academic Partnerships Academy of General Dentistry Athabasca University DiGi Georgia Perimeter College Normandale Community College Northern Virginia Community College Plante-Moran, LLP Rasmussen College Whitney International University Systems
Financial Services-Annuities Allianz Life (Sample) E F G call center FATCO Fremont Investment & Loan HomeBanc Mortgage Corporation Horace Mann Lincoln Financial Group Mortgage Lenders Network Portico Benefit Services RES-Direct Standard Bank TIAA-Cref USAA SMS Life, Health & Annuity Service USAA Specialized Members Services Western National Life ZC Sterling- Lincoln Center Financial Services - Banking New Mexico Educators Federal Credit Union NYCB Orient Express Bank Pacific Capital Bancorp Pentagon Federal Credit Union Purdue Federal Credit Union RCU Member Loans Regions Bank Regions Financial Corporation Royal Credit Union Scotiabank Seacoast National Bank State Department FCU Synovus TD Bank Financial Group Teachers Credit Union The Bank of New York The Mauritius Commercial Bank Limited The Washington Trust Company
U.S. Bank Umpqua Bank Vantage Credit Union Webster Bank Wells Fargo Zion Bank Financial Services -
Brokerage Albridge Solutions Cambridge Investment Research Figliola Consulting Genworth GuideStone Merrill Lynch MetLife TD Ameritrade USAA SMS Brokerage & Mutual Funds Svc. Wells Fargo - Wealth Management Group Financial Services-Credit Card Alliance Data Alliance Data Systems Charming Shoppe Contact Centre Coach Desjardins Fidelity National Information Services - STP GE Capital Horace Mann Merchante-Solutions National Bank of Canada Pitney Bowes, Inc. RCI Leasing Vantiv-Financial WEX Inc Wright Express Financial Services - Other ARC Corp. Barri Financial Group Canon Financial Services Corporate Reimbursement

Worldwide Industry Benchmark Report - (Sample) Industry
63 Copyright © 2017 , BenchmarkPortal, LLC.
For internal use only. Distribution beyond purchasing company is strictly prohibited
Services Inc CRS Corporate Reimbursement Services Inc. Delage Landen Fairheads Benefit Services Fidelis Recovery Solutions FiServ VB CST Ford Motor Credit GE Capital Hunter Warfield ING JP Morgan Retirement Plan MassMutual Financial Group Mutual & Federal National Bank of Canada NT Services Ltd. Proctor Financial Inc. Provident Credit Union Runzheimer International Securian Financial Service Triad Financial Corp Unifica Freight- Rail/Trucking/Shipping Aditya Birla Minacs BNSF Railway Company DHL International Pte Ltd Integrated Merchandising Systems - Group II Pasha Denali Alaskan FCU Government - Federal BH Services Inc. Department of Defense (DFAS) Department of Veterans Affairs Financial Mgmt Serv. - US Dpt. of Treas. Federal Reserve FOD Economie Pearson Govt. Solutions Security Assistance Corp Peninsula Inc. United States Coast Guard
US Department of Labor USPS Veterans Administration Vangent Inc Government, Local Austin 3-1-1 City of Austin City of Berkeley City of Chesapeake City of Edmonton City of Fort Wayne Durham One Call Halton Region NYC HHC New York City Health and Hospitals RTA Government- State/Provincial Department of Veteran Affairs - Health Resource Center Michigan Department of Treasury North Carolina Department of State Treasurer OCSS (Office of Child Support Services) Ontario Lottery & Gaming Corporation OPS State of Ohio Dept of Taxation Texas Department of Licensing and Registration Vic Roads VWCEdcor Government-Service Providers Anthem 4 - Med B CBC Empire Medicare Services Fidelity National Home Warranty Oak Hill Technology, Inc.
Ontario Ministry of Government Services Oxford Properties Group Sentinel Offender Services Tri-County Metropolitan United Government Services- WI Government: Service Providers, Health Care American Medical Association Amerigroup Colorado HCPF Health Net Federal Services Maximus-(multiple locations) Health Care-Medical Equipment Abbott Labs Bio Rad Laboratories Broan-Nutone LLC Coughlin & co Dental Fix Rx Hear USA KCI Medtronic MLSNI Parata Systems LLC Roche-Multiple locations Ultradent Products Health Care- Provider/Hospitals Advocate Health Care Allina Hospitals - SB CCHMC Fairview Health Services Gamma Dynacare Medical Laboratories Great-West Healthcare Hennepin County Medical Center I. U. Heath Physicians LabCorp-Multiple locations Lombardia

Appendix D: Partial List of Benchmark Participants
64 Copyright © 2017 , BenchmarkPortal, LLC. For internal use only. Distribution beyond purchasing company is strictly prohibited
Mayo Medical Laboratories McKesson Medical University of So Car. Methodist Health System MultiCare Health System Oakwood Healthcare response marketing Rural Metro Corp Santa Clara Family Health University of Michigan Health System WakeMed WellSpan Health West Monroe Health Care-Support Services Acclaris ADP American Medical Response Ascension Health BenchmarkPortal Blue Cross Blue Shield of IL BlueCross BlueShield of FL Bright Horizons Brother International-OmniJoin Cardiovascular Consultants Clarient a GE Healthcare Company Crothall Healthcare at BIDMC CustomerElation Department of Veterans Affairs ECardio Diagnostics EPBS Intermedix LabCorp-Multiple locations LCA Vision LifeCare Inc. LifeScan Maximus-Multiple locations Mayo Medical Laboratories McKesson-Multiple locations MedAssets Onlife Health Optum Health PAREXEL Pharmacy Solutions Abbott Philippine Psychiatric
Association Quest Diagnostics Quest Diagnostics RC Restat Scan Health Plan SXC Health Solutions United BioSource Corporation University of Michigan Viracor-IBT Virtua Health Immediate Response Services AAA (Multiple locations) ACP Services, LLC. Auto Club Enterprises MedicAlert Foundation Intl (Sample) - Health AFLAC AMA (Sample) Agency Amalgamated Life Assurant Employee Benefits Blue Cross Blue Shield- (Various locations) Caresource Cigna Combined (Sample) Companies/ an AON CO. Community Health Group Community Health Plan of WA CoreSource, Inc Corvesta Services, Inc. Deloitte Delta Dental-Multiple locations EyeMed VisionCare-Multiple locations Hallmark Services Corporation Inland Empire Health Plan LifeSecure (Sample) Company Mayo Medical Center Medica MESSA Michigan Education Special Servicess Assoc. - MESSA Molina Healthcare of
Washington Neighborhood Health Plan New Directions Behavioral Health Northeast Delta Dental POMCO Group Samaritan Health Plans Sento Corporation South Central Preferred Southland Benefit Solutions The Regence Group Tufts Health Plan United Concordia Companies United HealthCare USHEALTH Group (Sample) - Life AAA Member Services Abc consultants ACE Allianz Life - C.S. American National AXA Equitable Bankers Life and Casualty, a
Conseco Company CNO Financial Group Farmer's New World (Sample) Company Forethought Life (Sample) Guarantee Trust Life (Sample) Company Horace Mann Lincoln Financial Group Metlife Mutual of America Mutual of Omaha New York Life-Multiple locations New York Life Mutual NYLAARP PPS Principal Life (Sample) Securian Financial Group Sun Life Financial Symetra The Foresters (Sample) - Other

Worldwide Industry Benchmark Report - (Sample) Industry
65 Copyright © 2017 , BenchmarkPortal, LLC.
For internal use only. Distribution beyond purchasing company is strictly prohibited
1dental Aflac AIG United Guaranty American Family Ameritas Group ARAG Banesco Seguros Corvesta Services EMPLOYERS Hagerty (Sample) HSG CodeBlue LLC Hyatt Legal Plans, Inc. MetLife-Multiple locations Industrielle Alliance Motion Picture & TV Fund NTUC Income PFP Services Proctor Financial Inc. Revolv Safe Auto (Sample) Company Travelex (Sample) services ZC Sterling – Raleigh (Sample) - Property & Casualty AAA-Multiple locations Allied Solutions Allstate American Family (Sample) Amica (Sample) Church Mutual (Sample) Company GE Fleet Services Grange (Sample) Company Hagerty (Sample) Horace Mann Liberty Mutual Claim Contact Center Mang/NBT (Sample) Agency QBE –Multiple locations SafeCo (Sample) Sterling National Corporation The Hartford Travelers (Sample) Company Veterinary Pet (Sample). Level 1 Tech Support-Help
Desk Media Temple American University Applied Systems Apriva ARC Corp - CHD Blue Cross and Blue Shield of Minnesota Bright Horizons Brother International-Software Support Canon Canada Inc. Canon U.S.A. Inc. Cars.com C-net Datamatic Delta Dental of MI, OH and IN Ecolab - Aqua Balance Support Center Farmers (Sample)-Services FARO Technologies, Inc. Federal Reserve Bank of St. Louis InsideSales.com McKesson-Help Desk McKesson Pharmacy Systems Snap-on-Technical Support Motorola Solutions Northwestern Mutual O1 Communications OE Connection, LLC OneSource Oxford Properties-Support Plato Edmentum Pontoon (formerly Adecco Solutions, Inc.) Portico Benefit Services-Help Desk Quality Sourcing Samsung IT United Guaranty USCG Operations Systems Center Vantiv-Merchants Vivint
Manufacturing – Industrial/Construction ADI Atlantic Power, Inc. Briggs & Stratton Corp Emaar MGF Land Limited Ferris Industries GAF Kennametal Mid-West Engine Warehouse OTIS Elevator Company Pella Corporation Power Source Canada Preferred Power SEDCO, Inc. Snapper The Timken Co Zurn Wilkins Manufacturing - Light AOPA CFE Datamatic Datamax Corporation Dee Zee, Inc FARO Technologies, Inc. Johnson Controls Inc. Moen Inc Netafim USA Rain Bird Remington Arms Company Sauder Woodworking Techsonic Industries Tyco Safety Products Uniforms To You Vita-Mix Corporation . Manufacturing- Transportation Bombardier Aerospace Chevron Fiat Prestolite Volkswagen of America

Appendix D: Partial List of Benchmark Participants
66 Copyright © 2017 , BenchmarkPortal, LLC. For internal use only. Distribution beyond purchasing company is strictly prohibited
Media - Infomercial/Direct Marketing Alliance Teleservices, Inc Costco MX eHarmony.com ShopNBC Teligence Communications Inc. Media-Publishing/ Newspaper/Magazine AutoTrader.com - Consumer Division Concordia Publishing House ETS Harlequin Distribution Center John Harland The Arizona Republic The Teaching Company Media- TV/ISP/ Cable/Dish/Radio AG Young & Associates, Inc Arbitron BenchmarkPortal CBC Comcast HOT Look Communications Inc. SelectSource Shaw Cable Systems The RM Factory Not for Profit ABC Academy of General Dentistry AOPA Bobby Dodd Institute Inc BloodCenter of WI Family Life Corporation MedicAlert Foundation Intl NurseAdvice New Mexico The Arc of the Virginia The Relationship Mktg Factory
Other 3M Company Adecco NA Answer 1 Communications AnswerNet Associates BloodCenter of Wisconsin Carondelet Health CBN CDS Global City of Regina Convergys Co-Operations Customer Research, Inc Cyber City eBay Ecolab Inc. Fantasy Entertainment Foundation CCC Hallmark Business Connections Hammersmith Mudd Advertising Neill Corporation Nestle USA Pfizer QIAGEN Quiznos Sub RDI Marketing Services, Inc. RealPage Inc Redcats USA Sonda Procwork Trialcard West Corporation Professional Services aca research Adecco Solutions, Inc. Affinion Group Aon Hewitt ASQ Asseco Callmax Dominicana CDW CSC Deloitte Consulting Grandtech Technology
Hear USA LegalZoom Orrick Herrington PWC Reliance Industries Securitas Securitas USA Thriving Business Solutions Unicom Teleservices Telecom - Cellular/Wireless ACC AT&T WiFi Services CCCL Globe Telecom-Innove Communications Harte-Hanks (Samsung STA) I-Contacts Corporation Maksen Samsung STA SingTel STC Sykes U.S. Cellular Verizon VIPnet Warid Telecom Telecom - Service/Landline Access Integrated Networks Algotech Beijing 95teleweb.com Belize Telemedia Limited Birch Communications BroadStar Broadview Networks BullsEye Telecom Cablevision MX Cooperative Response Center, Inc. Farlep Focus Services Fusion Contact Centers, LLC Group O IPA MCCI MTS Allstream

Worldwide Industry Benchmark Report - (Sample) Industry
67 Copyright © 2017 , BenchmarkPortal, LLC.
For internal use only. Distribution beyond purchasing company is strictly prohibited
Nevada Power Nextel Communications Argentina S.A. Senture, LLC Shieff services Socket TBayTel Tunisia Telecom Telecom - Technology Assistt Azerfon LLC CJSC Comfortel CSG Systems Digitrust Group LLC Encompass Teleservices FIS HCL Iowa Telecom NII Holdings - Argentina PeopleNet Perfect Presentation Co PLDT PT Infomedia Siemens Enterprise Communications TechTeam Toll Operators 91 Express Lanes ACS for E-ZPass New York ACS-Fastrak E-470 Public Highway Authority Egis Projects Canada Inc. ITR Concession Company Transroute International VE Systems Xerox-Multiple State Toll Road locations Travel & Hospitality Accor North America ACS - Red Lion Hotels Airbnb
AvisBudget Group Best Western Intl. British Columbia Ferrys Carlson Hotels - Omaha Cendant Coasts Hotel and Resorts Delaware North Companies Delta Hotels Diamond Resorts International Diamond Resorts International HERTZ Hyatt Hyatt Hotels and Resorts InnLink Central Reservation Services JetsGo P&O Ferries Ltd Promociones Marriott RCI Starwood Hotels & Resorts Starwood Vacation Ownership Transat Travel Focus vegas.com Viator Utilities - Energy Reseller Chilquinta Energia S.A Compania Nacional de Fuerza y Luz Dayton Power and Light Direct Energy-TX Electrabel Manpower OGE Petrobras ProCore Solutions Reliant Energy Telus –Multiple locations Union Energy Utilities - Investor Owned AGL Resources Inc. American Electric Power Aqua America, Inc. CenterPoint Energy
E. On US
Florida Power and Light
Company
Louisville Gas and Electric
and Kentucky Utilities
Minnesota Power
San Antonio Water System
Transat
Vectren
Utilities - Municipal
Blue Stakes of Utah
Citizens Energy Group
Citizens Gas
City of Atlanta
Greenville Utilities
Indianapolis Power & Light
Company

68 Copyright © 2017 , BenchmarkPortal, LLC.
For internal use only. Distribution beyond purchasing company is strictly prohibited
Appendix E:
Community Resources & Product Listing from BenchmarkPortal

69 Copyright © 2017 , BenchmarkPortal, LLC.
For internal use only. Distribution beyond purchasing company is strictly prohibited
BenchmarkPortal’s Mission
BenchmarkPortal's mission is to provide contact center professionals with the information and training they need to make their centers more effective and more efficient. To fulfill this mission, we conduct original research on the contact center sector and offer a menu of products and services, which have proven useful to managers around the world.
Contact Center Certification
The Center of Excellence recognition is one of the most prestigious awards in the customer service and support industry. The certification process is management's best path to a world class customer contact operation.
A contact center that has been certified as a Center of Excellence by BenchmarkPortal has met and/or surpassed rigorous standards of efficiency and effectiveness. This certification is unique in that its achievement is ascertained strictly “by the numbers.” This means that the BenchmarkPortal team audits and verifies the center’s key performance indicators and compares that data to data from other peer organizations. This is different from other types of contact center certifications that typically focus on less results-oriented measures, such as process handling methods and procedures.
Contact Center Benchmarking
Benchmarking is now recognized as an essential function for a properly managed customer contact center. The competitive insights and aids to decision-making that are offered through benchmarking are so compelling that managers cannot do without it and still consider themselves in line with professional standards.
In 1995, BenchmarkPortal's founders conducted the first scientific, industry-wide benchmark study at Purdue University, under a grant from IBM. Now custodian of the world's largest and most respected database of contact center metrics, BenchmarkPortal uses this data to provide Contact Center managers with individualized reports. These reports provide managers the information to:
Compare their performance against an appropriate peer group of Contact Centers Make optimal, fact-based decisions regarding capital investment, personnel, procedures,
etc. Formulate recommendations on how to improve their contact center Determine if they qualify for BenchmarkPortal's Contact Center of Excellence
Certification

Appendix E: Community Resources and Product Listing from BenchmarkPortal
70 Copyright © 2017 , BenchmarkPortal, LLC. For internal use only. Distribution beyond purchasing company is strictly prohibited
Through our reports, as well as our leading edge research, we aim to contribute to the continual improvement processes of individual customer Contact Centers, and ultimately to improve the performance of this vital sector as a whole, worldwide.
Contact Center Training
BenchmarkPortal manages The College of Contact Center Excellence (originally developed by us for AT&T) to offer training and certification for Managers, Supervisors, and Agents. The College of Contact Center Excellence offers one of the most highly sought after Contact Center Training Certification programs in the world, led by the industry's top-rated instructors, with over 150 years combined experience. These courses will equip you with the skill set that you need to improve your Contact Center's performance. You will be able to return to your business and drive effective change for your contact center.
Contact Center Campus Week
BenchmarkPortal’s College of Contact Center Excellence will conduct its Contact Center Campus Week this November in Las Vegas. This annual, unique Contact Center industry event presents an opportunity for attendees to get on the fast track to upgrade customer service and to drive their Contact Centers’ performance to the top.
Industry experts, along with BenchmarkPortal’s premier team of instructors, will lead and guide classes and group discussions that explore Contact Center challenges and emerging trends in the industry. The two-day symposium - unlike any other - features talks and discussions to inspire innovative thinking and engage participants in exploring compelling avenues for advancing the Contact Center industry
Contact Center Assessments and Customized Consulting
BenchmarkPortal will help your contact center balance customer expectations and financial objectives by identifying the metrics that will drive success. Our assessment process will make performance gaps more obvious and will help pinpoint the initiative that commits a minimum of resources to achieve the best performance results. Note that BenchmarkPortal also offers customized consulting on a range of contact center issues (IVR optimization, WFM, consolidation, multi-center organization, center reengineering, HR issues, training improvement, technology selection, outsourcer selection, etc.)
Industry Reports, White Papers, Research Reports
We have turned many of our best practice research initiatives into Industry Reports, White Papers and Books. BenchmarkPortal's Industry reports are America's richest source of Contact Center information. As the economy and business goals change, our reports can provide critical information that will ultimately affect your bottom line.

Worldwide Industry Benchmark Report - (Sample) Industry
71 Copyright © 2017 , BenchmarkPortal, LLC.
For internal use only. Distribution beyond purchasing company is strictly prohibited
iBenchmark
iBenchmark automates the process of benchmarking, transforming a valuable but time-consuming, manual process into an automated, user-friendly service that allows managers to monitor performance on a monthly basis. Monitoring your Contact Center performance on a monthly basis will allow you to make decisions and select improvement initiatives that will have measurable impacts on the financial and operational performance of the contact center. iBenchmark thus represents a major step forward for Contact Center decision-makers.
Top 100 Contact Centers Contest
BenchmarkPortal sponsors this Annual Contact Center Benchmarking Study, which features the "Top 100 Contact Centers" Contest for centers located in North America. Thanks to your participation, our benchmarking surveys and reports have become the recognized data source for forward-looking managers around the world.
CallTalk Online Radio Show A fun and exciting on-line program for education and learning, for the customer service industry. Broadcast monthly, directly over the Internet to your desktop, CallTalk covers informative and educational topics that impact today's Contact Center. CallTalk airs without the participation of vendors so that topics will be free from their influence and guided by the needs of its listeners.