worldpay group plc results for the 12 months ended...
TRANSCRIPT

1
8 March 2016
WORLDPAY GROUP PLC
Results for the 12 months ended 31 December 2015
2015 2014 Change
Number of transactions (bn) 13.1 11.5 +14%
Transaction value (£bn) 401.9 369.5 +9% Revenue (£m) 3,963.0 3,626.6 +9% Net revenue1 (£m) 981.7 863.4 +14%
Gross profit (£m) 860.4 765.3 +12%
Underlying EBITDA2 (£m) 406.1 374.7 +8%
Operating profit (£m) 166.9 125.0 +34%
Profit/(loss) before tax (£m) 19.1 (47.1) +£66.2m
Underlying pro forma EPS3 (p) 6.9 4.6 +50% Free cash flow4 (£m) 32.4 0.7 +£31.7m
Substantial progress on our strategy, with our presence strengthened and deepened in our
chosen growth markets
Growth in all key customer segments with 13.1 billion transactions processed (up 14%) and
transaction value of £401.9bn (up 9%)
Significant investment in new and innovative products for our customers worldwide, including
enhanced mobile offerings, fraud prevention tools and data analytics
New technology platform build substantially completed; customer on-boarding to commence in
summer 2016
Global eCom and UK divisions outperformed against expectations; good revenue performance in
US division but costs of transformation higher than expected
Successful completion of £2.5bn IPO; new committed financing; inaugural issue of €500m senior
unsecured notes
Strong financial performance in 2015, in line with guidance given at the IPO
Good start to 2016, in line with expectations; guidance for the medium term unchanged
“We made significant operational and financial progress in 2015. It was a year of considerable
achievement, in the implementation of our strategy, in strengthening and deepening our market
presence, capabilities and technology, and helping our customers prosper. The Group has made a
good start to 2016, in line with expectations, and these results provide a strong platform for
continued growth over the medium term.”
Philip Jansen, Chief Executive Officer
1 Net revenue is defined as revenue less interchange and scheme fees.
2 Underlying EBITDA is defined as earnings before interest, tax, depreciation and amortisation. It also excludes separately
disclosed items which are discussed in note 3 to appendix 1. 3 Underlying pro forma earnings per share is calculated by taking the profit/loss for the period before separately disclosed
items, divided by the number of shares in issue at the end of 2015. 4 Free cash flow represents the Group’s net cash inflow from operating activities, after accounting for the Group’s net
capital expenditure and underlying finance costs. It excludes any working capital movements associated with the IPO.

2
Enquiries:
Analysts and Investors:
Charles King, Investor Relations Director Tel: +44 (0) 203 664 6171
Media:
Claire Hardy, External Communications Tel: +44 (0) 203 664 4902 James Murgatroyd, Finsbury Tel: +44 (0) 207 251 3801
Results presentation
The Full Year 2015 results presentation for analysts and investors will be held in London at 9:30am
today and a simultaneous webcast will be available at http://investors.worldpay.com
About Worldpay
Worldpay is a leading payments company with global reach. We provide an extensive range of
technology-led payment products and services to over 400,000 customers, enabling their businesses
to grow and prosper. We manage the increasing complexity of the payments landscape for our
customers, allowing them to accept the widest range of payment types around the world. Using our
network and technology, we are able to process payments from geographies covering 99% of global
GDP, across 146 countries and 126 currencies. We help our customers to accept more than 300
different payment types.
For more information, visit www.worldpay.com
Forward-looking statements
This announcement contains certain forward-looking statements with respect to the financial
condition, results of operations and businesses of Worldpay Group plc. Such statements and
forecasts by their nature involve risk and uncertainty because they relate to future events and
circumstances. There are a number of factors that could cause actual results or developments to
differ materially from those expressed or implied by these forward-looking statements. Worldpay
Group plc cautions readers that no forward-looking statement is a guarantee of future
performance. Nothing in this announcement should be construed as a profit forecast. These
forward-looking statements are made at the date of this announcement. Except as required by law
or regulation, Worldpay Group plc has no obligation to update the forward-looking statements or to
correct any inaccuracies in them.

3
Chief Executive’s statement
2015 was a year of strong operational and financial performance as well as considerable
achievement in the further implementation of our strategy.
An increasingly complex and dynamic payments market
We delivered this strong performance against a backdrop of an increasingly complex and dynamic
payments landscape. This is presenting significant challenges to our customers, from the smallest
traders to some of the largest global businesses.
This growing complexity is partly being driven by the higher expectations of merchants’ own
customers. For example, they are increasingly demanding improved mobile functionality as
smartphone and tablet use continues to grow, and a unified view of transactions across physical,
online and mobile channels.
At the same time, our merchants’ markets are becoming ever more international, requiring them to
accept more currencies and payment methods than ever before. As a result, they also need to
manage the associated regulation and increased risk, fraud and security issues. With increasingly
global competition, successful merchants are also looking at how they can improve their use of data
to gain deeper insight into their customers’ buying habits and to drive efficiency.
Worldpay is well positioned to support our customers in meeting these challenges. I am confident
that we have the capabilities, talent and resources to be at the forefront of innovation and to deliver
securely and reliably the services and products our customers need.
Substantial progress on the implementation of our strategy
Our strategy is designed to maximise the benefits of our strong competitive position in our markets,
in order to deliver sustainable, predictable growth, profitability and shareholder returns. We aim to
do this by ensuring that we have a deep understanding of the needs of our customers in core
segments. We differentiate our offering through technology and innovative products, and aim to
expand in existing markets, as well as enter new ones.
Realising the full potential of our business model should result in strong cash flow generation,
allowing us to reinvest in our business, as well as enhance our growth through acquisitions and
investments.
In 2015, we made substantial progress on the implementation of our strategy, resulting in growth in
all key customer segments. We deepened and strengthened our customer relationships, resulting in
strong growth in Global eCom, with transactions up 31%; 9% transaction growth in the US; and
transaction growth of 8% in the UK.
We also delivered new and innovative products, and updated existing ones, for our customers. We
obtained processing licenses in Canada and Japan, while new customer products and services
included an update to RiskGuardian, our fraud prevention tool; improved mobile-friendly payments
through Hosted Payment Pages; rich data analytics for UK SMEs through My Business Dashboard;
and delivery of an omni-channel offering through Worldpay Total. In the US, the technology
integration of the SecureNet acquisition is progressing to plan, and we signed over 80 new partners
4
in the year. These partners will be important in enabling us to deliver new, integrated
payment products focused on specific customer segments in the US market. We aim to be at the
forefront of innovation and in 2015 we continued to invest in our Pazien joint venture and filed
three patent applications.
The UK saw the successful launch, towards the end of the year, of Worldpay Business Finance (in
partnership with Liberis), with over £2m committed so far to UK companies looking to invest in and
grow their businesses. We are also now delivering an ecommerce solution to more than 40% of new
UK SME customers, against less than 20% of existing customers.
Another key area of achievement was in the further strengthening of our technological capabilities,
which are a key source of differentiation for us. In terms of progress on our new technology
platform, which will deliver significant enhancements to our agility, flexibility and efficiency, we
migrated the off-host servicing and data applications to our own systems, so that only one
component now remains on RBS’ systems: the clearing and settlement engine. We have now
completed the build of the core platform of the new system to replace this, and expect to start
boarding our first customers onto it in the summer of 2016.
Strong financial performance
I am pleased to report that we delivered a strong financial performance, consistent with the
guidance that we gave at the time of our IPO.
Across the Group, we processed over 13 billion transactions, an increase of 14% compared to 2014.
Total transaction value was £401.9bn, while the net revenue we earned from processing these
transactions rose by 14%, to £981.7m.
In terms of Group profitability, underlying EBITDA increased 8% to £406.1m, a strong performance.
At a divisional level, Global eCom and WPUK outperformed against our expectations. Global eCom
net revenue grew 17% compared to 2014, driven by both the growth of the market and new
customer wins. In the UK, net revenue grew 11%, driven by improved customer retention, new
products and increased penetration of ecommerce solutions.
In the US, net revenue grew 15%. Excluding the benefit of the SecureNet acquisition and currency
movements, the growth was 3%. We are making progress in transforming the business into one
with an integrated customer offering, supported by a partner and developer-led business model,
however, it is taking longer and costing more than expected. Floris de Kort, who previously headed
our Global eCom division, is now leading the US business, and in 2016 will focus on the completion
of this transformation and the normalisation of the cost base.
Our people: making Worldpay a great place to work
I am proud of the further progress we made in 2015 to improve our organisational effectiveness and
make Worldpay a great place to work. The culture of the Worldpay Way, which encourages
colleagues to work smart, be spirited and be supportive, is driving significant improvements in
employee engagement. In our latest survey, our engagement score rose substantially and we are
now rated a “1* Best Companies to Work For”. However, we aspire to improve further to ensure we
engage great talent, drive a culture of innovation, and enhance colleague performance, satisfaction
and retention.

5
I would like to thank all of our colleagues for their hard work in making 2015 such a
successful year for the Group. Looking to the future, I am pleased that they will now share in our
success, with 67% of our employees being Worldpay shareholders.
Outlook
The Group has made a good start to 2016, in line with expectations. We remain confident in our
prospects over the medium term. These prospects are reflected in the guidance we gave at the time
of our IPO, including targeting net revenue growth of approximately 9% to 11% CAGR over the
medium to long term, which remains unchanged.
Worldpay is an innovative payments technology company, and we are investing heavily to deliver
strong, sustainable growth. We aim for world-class performance, reliability and security in seeking to
solve payments complexity for our customers. With market-leading global reach and product
coverage, a modern and scalable technology platform, strong customer propositions and a talented
and engaged workforce, I am confident that we will be able to realise our vision of being the world’s
most progressive, reliable payments partner, sharing insights and helping customers prosper.

6
Financial review
The information presented and discussed in this section includes a number of measures that are not
defined or recognised under IFRS including net revenue, underlying EBITDA, underlying pro forma
earnings per share and free cash flow. These are considered to be key measures of the Group’s
financial performance and as such have been included here to aid comparability and enhance
usefulness.
Net revenue, defined as revenue less interchange and scheme fees, is presented and discussed in
this section as the Directors believe that this best reflects the relationship between revenue and
profitability. Underlying EBITDA, being earnings before interest, tax, depreciation and amortisation,
excluding separately disclosed items, is considered by the Directors to give a fairer view of the year-
on-year comparison of underlying trading performance. Separately disclosed items are costs or
income that have been recognised in the income statement which the Directors believe, due to their
nature or size, should be disclosed separately to give a more comparable view of the year-on-year
underlying financial performance. These are explained further later in this section.
Underlying pro forma earnings per share is calculated by taking profit/loss for the period before
separately disclosed items, divided by the number of shares in issue at the end of 2015. Free cash
flow represents the Group’s net cash inflow from operating activities, after accounting for the
Group’s net capital expenditure and underlying finance costs. It excludes any working capital
movements associated with the IPO. The Directors believe that free cash flow provides a better
reflection of the cash being generated by the business.
On 3 July 2015, in contemplation of the IPO, the Company changed its financial year end from 30
November to 31 December. As a result, the statutory comparative period to the 2015 financial
statements is the one month to 31 December 2014. To aid comparability and understanding of
performance, however, we have presented pro forma comparative information for the 12 months to
31 December 2014 in this section. The statutory one month comparative information can be found
in the appendix to this document.

7
Income statement
Year ended Pro forma year ended Year-on-year 31 December 2015 31 December 2014 change £m £m %
Revenue 3,963.0 3,626.6 9% Interchange and scheme fees (2,981.3) (2,763.2) (8)%
Net revenue5 981.7 863.4 14% Gross profit 860.4 765.3 12% Underlying EBITDA6 406.1 374.7 8% Underlying depreciation and amortisation
(65.6) (78.4) 16%
Underlying finance costs (151.2) (163.2) 7% Share of result of joint venture and associate
(1.2) (0.3)
Underlying profit before tax 188.1 132.8 42% Separately disclosed items: - affecting EBITDA (103.7) (88.6) - affecting depreciation and amortisation
(69.9) (82.7)
- affecting finance (costs)/income 4.6 (8.6)
(169.0) (179.9) 6%
Profit/(loss) before tax 19.1 (47.1) Tax charge (48.9) (2.9)
Loss for the year (29.8) (50.0) 40%
Earnings per share Underlying pro forma EPS (p)7 6.9 4.6 50% Reported EPS (p) (1.8) (3.1) 42%
Revenue
Revenue in the year of £3,963.0m (2014: £3,626.6m) was £336.4m, or 9%, higher than in the prior
year. Excluding the impact of acquisitions during the current and prior period (SecureNet and Cobre
Bem) and the foreign currency translation impact on our WPUS revenue, growth was 5%. This
5 Net revenue is defined as revenue less interchange and scheme fees.
6 Underlying EBITDA is defined as earnings before interest, tax, depreciation and amortisation. It also excludes separately
disclosed items which are discussed in note 3 to appendix 1. 7 Underlying pro forma earnings per share is calculated by taking profit/loss for the period before separately disclosed
items, divided by the number of shares in issue at the end of 2015.

8
growth reflects a 23% increase in our Global eCom business and a 6% increase in WPUS,
partly offset by an 8% reduction in WPUK.
The increase in Global eCom reflects strong volume growth across all verticals, particularly in
acquiring, treasury management and foreign exchange services and gateway income. The decline in
WPUK reflects the impact on customers of reductions in cross-border acquired interchange costs in
January 2015 and Visa and MasterCard repricing in 2015. The 6% underlying growth in WPUS was
driven principally by growth in acquiring income reflecting an increase in transaction volumes.
SecureNet contributed £31.5m (2014: £1.0m) to revenue in the year and Cobre Bem contributed
£1.4m (2014: £nil). The foreign exchange impact on translation of our WPUS results accounted for
£127.1m of revenue growth year-on-year.
Net revenue
Net revenue increased by £118.3m, or 14% year-on-year, to £981.7m (2014: £863.4m). Excluding
the impact of acquisitions and foreign currency translation on our WPUS revenue, growth was 10%.
This growth reflects a 16% increase in our Global eCom business, an 11% increase in WPUK and a 3%
increase in WPUS.
The increase in Global eCom reflects the same factors as for revenue above. In WPUK, an increase in
transaction volumes and net acquiring income accounted for the majority of the increase. In WPUS,
the 6% growth in revenue was partly offset by higher interchange and scheme fees.
SecureNet contributed £9.7m (2014: £0.3m) to net revenue in the year and Cobre Bem contributed
£1.3m (2014: £nil). The foreign exchange impact on translation of our WPUS results accounted for
£17.0m of net revenue growth year-on-year.
Further details on the segmental breakdown of net revenue performance is provided later in this
report.
Gross profit
Gross profit increased by £95.1m, or 12% year-on-year, to £860.4m (2014: £765.3m). Excluding the
impact of acquisitions and foreign currency translation on our WPUS gross profit, growth was 10%.
This reflects an 18% increase in our Global eCom business, an 8% increase in WPUK and a 1%
increase in WPUS.
The increase in Global eCom was driven from the revenue improvements noted above. In WPUK
and WPUS, increased referral commission payments to partners reduced the underlying gross profit
growth.

9
Underlying personnel and net operating expenses
Underlying personnel and net operating expenses increased by £63.7m, or 16% year-on-year, to
£454.3m (2014: £390.6m). Excluding the impact of acquisitions and foreign currency translation on
our WPUS expenses, the increase was 11%.
The increase year-on-year reflects higher wages and salaries due to a higher average number of
employees, as well as other operating costs associated with supporting the growth in revenue,
including the costs of organisational investments made in 2014. In addition, bad debt expenses
increased by £6.3m, to £22.5m, in the year.
The average number of employees increased to 4,982 from 4,518 in the prior year. The increase was
principally driven by recruitment of personnel to enhance capabilities in sales, marketing and lead
generation, product development, product management and data analytics.
Underlying personnel and net operating expenses in SecureNet amounted to £10.7m (2014: £0.4m)
in the year with costs in Cobre Bem amounting to £2.8m (2014: £0.5m). The foreign exchange
impact on translation of our WPUS results accounted for an increase of £7.9m year-on-year.
Underlying EBITDA
Underlying EBITDA increased by £31.4m, or 8% year-on-year, to £406.1m (2014: £374.7m).
Excluding the impact of acquisitions and foreign currency translation on our WPUS EBITDA, the
growth was 8%. This reflects an increase in net revenue for the Group of 10%, partly offset by higher
third-party commission expenses and higher underlying personnel and net operating costs as we
continue to invest in organisational capability to support future growth.
The underlying EBITDA growth of 8% reflected a 15% increase in Global eCom and WPUK, partly
offset by a 17% decline in WPUS and a 7% increase in Corporate costs.
SecureNet reported a loss at the underlying EBITDA level of £4.4m (2014: loss of £0.2m) and Cobre
Bem reported a loss of £1.5m (2014: loss of £0.5m). The foreign exchange impact on translation of
our WPUS results accounted for £5.4m of underlying EBITDA growth year-on-year.
Further details on the segmental breakdown of underlying EBITDA performance is provided later in
this report.
Underlying depreciation and amortisation
Underlying depreciation and amortisation decreased by £12.8m, or 16% year-on-year, to £65.6m
(2014: £78.4m). The decrease largely reflects lower charges in 2015 on items of software, computer
equipment and terminals that existed at the time of the divestment from RBS and that had been
fully depreciated at the end of 2014. While additions to computer software have increased during
the year, this includes intangible assets under the course of construction relating to our new
technology platform which are not being amortised as they are not yet available for use. At 31
December 2015, the total value relating to intangible assets under the course of construction
amounted to £235.3m, compared with £145.1m at 31 December 2014. We expect that, as these
assets become available for use, this will lead to a substantial increase in the underlying depreciation
and amortisation charge. Once in use, these assets will be depreciated over 10 years.

10
Underlying finance costs
Underlying finance costs decreased by £12.0m, or 7%, year-on-year to £151.2m (2014: £163.2m).
The decrease reflects the reduction in borrowings following the IPO, whereby the overall debt fell by
£833m and, as a result of the refinancing, the average cost of debt fell from an average of 5.7% in
2014 to 3.1%. The Directors expect underlying finance costs to fall substantially in 2016 as we see a
full year benefit from the change in capital structure.
Share of results of joint venture and associate
The share of results of joint venture and associate was a loss of £1.2m (2014: loss of £0.3m) and
reflects our investments in Pazien Inc. and SPay, Inc.
On 15 May 2015, the Group purchased 499 Class A shares in SPay, a referral company specialising in
the sport sector, representing a 49.9% shareholding based on the shares in issue at that date. On 18
December, SPay issued further shares to another investor, reducing Worldpay’s shareholding to
25%.
On 4 June 2015, the Group purchased a further 65,402 shares in Pazien Inc., an innovative start-up
company creating products using transaction data to enable more intelligent routing, automated
optimisation and reconciliation for our Global eCom merchants. Although the Group holds 51% of
shares in Pazien Inc., it does not represent control over the entity as the Board is shared equally
between the Group and the founders of the business.

11
Separately disclosed items
Year ended Pro forma year ended Year-on-year 31 December 2015 31 December 2014 change £m £m £m
Affecting EBITDA Separation – platform costs (33.3) (35.1) 1.8 Separation – other costs (20.1) (24.1) 4.0 IPO-related costs (35.0) - (35.0) Reorganisation and restructuring costs
(6.4) (18.2) 11.8
Other costs (8.9) (11.2) 2.3
Total affecting EBITDA (103.7) (88.6) (15.1) Affecting depreciation and amortisation
Amortisation of business combination intangibles
(67.9) (73.1) 5.2
Impairment of platform assets - (9.6) 9.6 Impairment of other intangibles (2.0) - (2.0)
Total affecting depreciation and amortisation
(69.9) (82.7) 12.8
Affecting finance (costs)/income Costs associated with refinancing (44.7) - (44.7) Net revaluation gain on Visa Europe asset and related CVRs
54.8 - 54.8
Foreign exchange losses (5.5) (8.6) 3.1
Total affecting finance (costs)/income
4.6 (8.6) 13.2
Total (pre-tax) (169.0) (179.9) 10.9 Tax credit 0.8 38.2 (37.4)
Total (post-tax) (168.2) (141.7) (26.5)
Separately disclosed items in the year amounted to a pre-tax net cost of £169.0m (2014: £179.9m),
of which £103.7m (2014: £88.6m) affected EBITDA, £69.9m (2014: £82.7m) affected depreciation
and amortisation and a net gain of £4.6m (2014: cost of £8.6m) affected finance costs. Separately
disclosed items are costs or profits that have been recognised in the year which the Directors
believe, due to their nature or size, should be disclosed separately to give a more comparable view
of the year-on-year underlying financial performance.
The separately disclosed items affecting EBITDA comprise platform-related and other costs incurred
in the separation from RBS; non-capitalisable costs of the IPO; reorganisation and restructuring
costs; and other costs.
Platform-related separation costs of £33.3m (2014: £35.1m) are non-capitalised costs associated
with the upgrade and migration of the Group’s core systems from RBS. They are principally
personnel, maintenance and consultancy costs. Total costs incurred to date on the platform
12
programme are £449.8m (2014: £361.9m), of which £289.4m (2014: £234.8m) has been
included within tangible and intangible assets on the balance sheet, with the remainder charged
directly to the income statement.
Other costs related to the separation from RBS of £20.1m (2014: £24.1m) principally relate to
system implementation and remediation, double running of property, and the excess costs of
interim staff.
In 2016, we expect a further reduction in platform-related and other costs incurred in the separation
from RBS as the programme nears completion.
The non-capitalisable costs of the IPO in the year amounted to £35.0m (2014: £nil) and reflect the
costs of various share awards granted as part of the IPO, including the all-employee free share award
and additional awards given to management.
Reorganisation and restructuring costs of £6.4m (2014: £18.2m) represent costs associated with a
variety of projects to develop and implement the strategy of establishing Worldpay as a stand-alone
business. Costs in 2015 include the restructuring and further integration of the Cardsave business in
WPUK and the sales force reorganisation in WPUS. These are partially offset by the release of
provisions for contingent consideration payable on acquisitions no longer required.
Other costs of £8.9m (2014: £11.2m) include fees payable to shareholders incurred prior to the IPO
in relation to the previous ownership structure and a number of other smaller one-off items.
Separately disclosed items affecting depreciation and amortisation amounted to £69.9m (2014:
£82.7m). These predominantly relate to the amortisation of business combination intangibles which
is a non-cash charge relating to intangible assets recognised on the divestment of the business from
RBS, as well as subsequent strategic business acquisitions. In addition, in the year, software
development in WPUS of £2.0m was deemed to be impaired and written-off following the
integration of the SecureNet business.
Separately disclosed items affecting finance costs in the year were a net gain of £4.6m (2014: cost of
£8.6m) and comprise costs associated with the refinancing of the Group (£44.7m), a net revaluation
gain on fair value of the Visa Europe shares and related Contingent Value Rights (£54.8m), and FX
losses resulting from the translation of the Group’s assets and liabilities denominated in currencies
other than Sterling (£5.5m). The £44.7m of costs associated with the refinancing represent the
write-off of previously capitalised finance costs on repayment of the debt that was in place prior to
the IPO. The net revaluation gain on the Visa Europe shares and related Contingent Value Rights is
explained in more detail later in this report.
We expect most separately disclosed items to be eliminated from the end of 2016, with the
exception of the non-cash charge for amortisation of business combination intangibles, a charge for
residual migration activity and the charge for the transitional share award plan, awarded at IPO,
which will cease part-way through 2018.

13
Profit/(loss) before tax
The profit before tax for the year was £19.1m (2014: loss of £47.1m). The improvement year-on-
year reflects strong trading performance, together with a reduction in underlying depreciation and
amortisation and underlying finance costs and the net gain in relation to the Visa Europe shares.
Tax
The tax charge on underlying results for the Group increased by £8.6m, or 21%, to a charge of
£49.7m in the year ended 31 December 2015 (2014: £41.1m), representing both current tax and
deferred tax charges. The underlying tax charge was driven principally by taxable profits arising in
the UK and the Netherlands, partly offset by taxable losses in the United States.
The charge reflects an effective tax rate on underlying results of 26%, which is higher than the UK
headline rate for the year of 20.25% primarily due to higher overseas tax rates and non-deductible
financing costs.
The tax credit of £0.8m (2014: £38.2m) arising on separately disclosed items includes a deferred tax
charge of £39.2m arising on the proposed disposal of the interest in Visa Europe in 2016.
After including separately disclosed items, the Group’s total tax charge increased by £46.0m to
£48.9m in the year ended 31 December 2015 (2014: £2.9m), inclusive of the Visa Europe deferred
tax liability referred to above.
Earnings per share and dividends
Basic and diluted underlying pro forma earnings per share in the year was 6.9p, an increase of 50%
on the pro forma prior year earnings per share. Underlying pro forma earnings per share is
calculated by taking profit/loss before separately disclosed items, divided by the number of shares in
issue at the end of 2015. The year end number of shares has been used as this avoids the distortion
caused by the pre-IPO position and therefore aids comparability this year and in the following year.
On a reported basis, the basic and diluted loss per share for 2015 was 1.8p compared with a loss per
share in the prior year of 3.1p.
In line with the guidance given at the time of the IPO, the Directors are not recommending the
payment of a dividend in relation to the year ended 31 December 2015. The Group’s first dividend
as a public company is expected to be declared at the 2016 half year results and paid in November
2016. The Group’s dividend policy is based on a pay-out ratio of 20% to 30% of reported profit after
tax per annum, with approximately one third of any annual dividend to be paid in respect of the first
half and two thirds in respect of the second half.

14
Cash and liquidity
Cash flow
Year ended Pro forma year ended Year-on-year 31 December 2015 31 December 2014 change £m £m £m
Underlying EBITDA 406.1 374.7 31.4 Separately disclosed items affecting EBITDA
(103.7) (88.6) (15.1)
Working capital8 29.2 (30.5) 59.7 Tax paid (8.6) (19.1) 10.5 Non-cash items (10.9) (4.5) (6.4)
Net cash inflow from operating activities
312.1 232.0 80.1
Capital expenditure (179.0) (142.7) (36.3) Underlying finance costs paid (100.7) (88.6) (12.1)
Free cash flow9 32.4 0.7 31.7 Acquisitions (16.6) (99.4) 82.8 Underlying movement in borrowings
(59.1) 94.4 (153.5)
Net impact of IPO and refinancing
37.7 - 37.7
Net cash flow (5.6) (4.3) (1.3)
The net cash inflow from operations in the year increased by £80.1m, or 35%, to £312.1m (2014:
£232.0m). The increase reflects improvements to underlying trading and working capital and lower
tax payments, partly offset by increased separately disclosed items affecting EBITDA and higher
foreign exchange losses. The working capital inflow in the year of £29.2m (2014: outflow of £30.5m)
largely reflects an increase in trade payables and accruals as a result of the growth in the underlying
business and investment in people and infrastructure. The corresponding growth in trade debtors
we would expect to see was partly offset by the impact of reductions in interchange rates during the
year, resulting in lower levels of customer funding.
Expenditure on tangible fixed assets and software in the year was £179.0m (2014: £142.7m). The
increase year-on-year reflects investment in a number of customer propositions to support the
growth plans of our operating divisions; and spend to enhance our data security and improve our
data analytics capability. These have been partially offset by lower investment in platform-related
expenditure as we transition from the “build” to the “test” phase of this project. Total capital
8 Working capital shown here excludes any movements associated with the IPO.
9 Free cash flow represents the Group’s net cash inflow from operating activities, after accounting for the Group’s net
capital expenditure and underlying finance costs. It excludes any working capital movements associated with the IPO.

15
expenditure is expected to remain between 16% and 20% of net revenue in 2016 and to
decline to approximately 9% to 10% of net revenue in 2017.
Underlying finance costs paid in the year were £100.7m (2014: £88.6m). The increase year-on-year
reflects the phasing of interest repayments.
As a result of the above movements, free cash flow increased to £32.4m in 2015 compared with
£0.7m in 2014.
Expenditure on acquisitions in the year reflects payments in relation to the Cardsave earnout,
settlement of deferred consideration for YesPay, and investments made in SPay and Pazien.
The underlying movement in borrowings of £59.1m outflow (2014: inflow of £94.4m) included the
repayment, in the first half of 2015, of £50.0m that had been drawn under the Group’s revolving
credit facility in 2014.
The net impact of the IPO and refinancing in the year was an inflow of £37.7m (2014: £nil) and
principally reflects the proceeds received on issue of shares and the inflows from the refinancing,
offset by the amounts paid to previous shareholders and the repayment of pre-IPO debt.
Debt and financing
As at As at Year-on-year 31 December 2015 31 December 2014 change £m £m £m
Own cash 165.3 168.7 (3.4) Senior borrowings: Term Facility 1 (247.1) - (247.1) Term Facility 2 (910.3) - (910.3) Revolving credit facility (38.4) - (38.4) Senior unsecured notes (365.6) - (365.6) Other - (1,826.1) 1,826.1
(1,561.4) (1,826.1) 264.7 Finance leases (29.2) (28.2) (1.0) Subordinated borrowings - (450.5) 450.5 Loan notes - (118.0) 118.0
Net debt (1,425.3) (2,254.1) 828.8
On 16 October, as part of the IPO process, all existing borrowings were repaid and the Group
arranged new borrowing facilities totalling £1.7bn. These new borrowings comprised a £600m
three-year term facility (Term Facility 1); a £900m five-year term facility (Term Facility 2); and a
£200m revolving credit facility. The rates of interest are LIBOR based plus a margin dependent on
leverage. The maximum margin for Term Facility 1 is 2.00% and for Term Facility 2 is 2.50%.

16
On 10 November 2015, the Group issued €500m 3.75% senior unsecured notes due 2022,
the proceeds of which were used to reduce Term Facility 1. The issue extended the average term of
the Group’s debt, diversified its funding sources and fixed the interest rate on this portion of debt.
Net debt at 31 December 2015 was £1,425.3m (2014: £2,254.1m). The reduction year-on-year
reflects the IPO and the resultant refinancing activity.
Proposed disposal of interest in Visa Europe
On 2 November 2015, we announced the proposed disposal of our approximate 5.9% interest in Visa
Europe to Visa Inc. The disposal, which is expected to complete in Q2 2016, is a result of Visa Inc.'s
agreement to purchase 100% of Visa Europe, subject to the satisfaction of certain conditions.
Under the terms of the disposal, Worldpay will receive a mixture of cash and non-cash consideration
currently estimated to be worth in aggregate up to €1.2 billion. This is made up of up-front
consideration of approximately €544m of cash and €375m of Series B Preferred Stock in Visa Inc. In
addition, if the earnout pays out in full, Worldpay could receive in the region of €283m in earnout
conditional upon achieving certain criteria relating to the incremental net revenue of Visa Europe
during the earnout period. The up-front consideration will be reduced by any final settlement of
potential liabilities relating to ongoing interchange related litigation involving Visa Europe. Potential
losses from interchange litigation liabilities will be set against the Preferred Stock which can be
reduced to absorb those losses. A Loss Sharing Agreement entered into by Worldpay, along with the
ten other largest UK members of Visa Europe, provides a second level of protection to Visa Inc.,
capped at the value of the cash consideration received. The Group’s share of such liabilities arising
from the UK interchange related litigation is capped at the Group’s up-front consideration.
As set out in our IPO Prospectus dated 13 October 2015, the holders of the contingent value rights
(the "CVRs") (a separate class of shares in the Company) will be entitled to 90% of the net post-tax
proceeds of the disposal in accordance with the terms of the CVRs (subject to the Company's right of
retention), with Worldpay retaining 10% of the net proceeds. Further details of the CVRs are set out
in our Prospectus.
Following the disposal, Worldpay will continue to be a participant in the Visa payments system. It is
anticipated that Worldpay will no longer have representation on the Board of Visa Europe following
completion of the disposal as a result of Visa Europe ceasing to be a member-owned association.
As at 30 June 2015 and on IPO completion, the Visa Europe asset was recognised in the Group’s
balance sheet as a financial asset with a fair value of £nil. In accordance with IAS 39, financial assets
should be re-measured at each reporting date. In performing the revaluation at 31 December 2015,
the offer by Visa Inc. to purchase Visa Europe has been taken into account in the subsequent
measure of fair value, despite the fact that there remains some uncertainty around both the
likelihood of completion of the deal (which is still subject to anti-trust clearance), and the amount of
pre-transaction operational liabilities which would reduce the up-front consideration received.
The CVR liabilities were recognised at £nil fair value on initial recognition. At year end, they were re-
measured at amortised cost based on a re-estimation of future cash flows, with any changes being
recognised in the income statement.

17
Based on the above, the fair value of the Visa Europe asset on the Group’s balance sheet has
increased to £195.7m and the corresponding CVR liabilities have been valued at £140.9m. A
deferred tax liability of £39.2m has also been recognised. A net pre-tax revaluation gain of £54.8m
has been recognised in finance costs as a separately disclosed item.

18
Segmental review of performance
The Group reports four segments: Global eCom, WPUK, WPUS and Corporate. Further details about
the three trading segments are provided below. The information presented and discussed is based
on underlying financial performance and includes pro forma prior year comparatives. Corporate
principally contains central personnel costs and consultancy spend.
Our Global eCom division focuses on large, internet-led multinationals that operate in fast-growing
markets and have complex payment needs. We provide a wide range of payment services, both
online and by mobile, to accept, validate and settle payments in 126 currencies across 146 countries,
using any one of over 300 payment methods. Our customers also use our payments technology to
maximise the rate at which payments are approved, manage the risk of fraud, and optimise their
costs of operating globally. We focus on five priority verticals: Digital Content, Global Retail, Airlines,
Regulated Gambling and Travel.
WPUK provides in-store, phone, online and mobile payment acceptance solutions for approximately
300,000 UK and Ireland-based customers, from SMEs to large corporates (including Tesco, Asda and
Next).
WPUS provides in-store, online and mobile payment acceptance solutions for US-based customers,
with a focus on developing omni-channel and integrated payment solutions for its approximately
109,000 SME customers, and vertical-specific solutions for its approximately 13,000 enterprise
customers in the Grocery, Petroleum, Restaurant and Retail industries. In addition, we provide ATM
services to approximately 100 organisations across the United States.
Year ended Pro forma year ended Year-on-year 31 December 2015 31 December 2014 change
£m £m Net revenue Global eCom 317.7 272.0 17% WPUK 405.2 366.0 11% WPUS 258.8 225.4 15%
Group net revenue 981.7 863.4 14% Underlying EBITDA Global eCom 184.2 161.5 14% WPUK 179.2 156.1 15% WPUS 62.3 75.4 (17)% Corporate (19.6) (18.3) (7)%
Group underlying EBITDA 406.1 374.7 8%

19
Global eCom
Year ended Pro forma year ended Year-on-year 31 December 2015 31 December 2014 change
Net revenue (£m) 317.7 272.0 17% Underlying EBITDA (£m) 184.2 161.5 14% Total transactions (bn) 3.8 2.9 31% Total transaction value (£bn) 99.3 85.5 16% Average transaction value (£) 25.9 29.3 (12)% Net revenue/transaction value (%) 0.32% 0.32% -
Our Global eCom division had another strong year of growth in 2015 with transactions up 31% to 3.8
billion, driven by increased volumes across a range of products and verticals. Average transaction
values fell 12% year-on-year, however, as a significant proportion of the volume growth came from
verticals where high volume, low value transactions dominate, such as Digital Content and Global
Retail.
Net revenue increased by £45.7m, or 17%, to £317.7m in the year ended 31 December 2015 (2014:
£272.0m), with net acquiring income10, treasury management and foreign exchange services11 and
gateway income accounting for the majority of the increase.
Net acquiring income grew by 20% in 2015 as a result of new business wins and growth of existing
customers, particularly in Digital Content, Travel and Global Retail. Scheme fees increased
significantly during the period, largely as a result of volume growth and country mix. In addition, a
number of new rules and fees were implemented by the schemes in the year which increased fees
further. The majority of these increases were charged on to customers.
Revenue from treasury management and foreign exchange services grew by 22% year-on-year as a
result of increased volumes in Airlines, Travel and Digital Content. Gateway income was also up
26%, driven by volume increases in Global Retail and Travel and the contribution from Cobre Bem,
our provider of gateway service solutions in Latin America.
Global eCom’s underlying net revenue as a percentage of total transaction value remained strong at
0.32% for the year ended 31 December 2015, in line with the prior year.
Underlying EBITDA increased by £22.7m, or 14%, to £184.2m in the year ended 31 December 2015
(2014: £161.5m). This increase was driven principally by the growth in net revenue noted above but
was offset, in part, by £22.9m higher operating costs year-on-year. This increase in operating costs
partly reflects the growth in revenue, but also the investments we have made in people and
capability, in both 2014 and 2015, to develop the organisation and deliver further sales growth in
the future. In addition, bad debts increased compared to the prior year.
10
Net acquiring income is defined as transaction service charges less interchange and scheme fees. Transaction service charges are payable for services provided to process transactions between the customer and an acquiring bank, which is a bank that accepts card payments from the card-issuing banks. 11
Income from treasury management and foreign exchange services is generated on settling foreign currency transactions on behalf of customers.

20
WPUK
Year ended Pro forma year ended Year-on-year 31 December 2015 31 December 2014 change
Net revenue (£m) 405.2 366.0 11% Underlying EBITDA (£m) 179.2 156.1 15% Total transactions (bn) 5.4 5.0 8% Total transaction value (£bn) 202.8 196.6 3% Average transaction value (£) 37.5 39.2 (4)% Net revenue/transaction value (%) 0.20% 0.19% -
Our WPUK division grew strongly in 2015 with transactions up 8% to 5.4 billion, driven by new
customer wins in both the Corporate and SME sectors and continuing growth in the use of cards as a
payment mechanism. Average transaction values fell 4% year-on-year, however, reflecting high
street price competition, particularly in the supermarket sector where Worldpay has a high market
share, and changing consumer behaviour as the use of contactless increases.
Net revenue increased by £39.2m, or 11%, to £405.2m in the year ended 31 December 2015 (2014:
£366.0m), with net acquiring income accounting for the majority of the increase. Net acquiring
income grew by 18% reflecting the impact of higher transaction volumes and effective management
of pricing on new business and renewals, as well as a net positive impact of lower interchange costs
on the acquiring margin which funded the enhancement of our propositions for customers.
Ancillary income12 grew by 9% year-on-year as a result of increases in authorisation, gateway and
other fees.
WPUK’s net revenue as a percentage of total transaction value increased slightly to 0.20% for the
year ended 31 December 2015 from 0.19% in the prior year, reflecting a change in mix to more
credit card transactions and commercial pricing decisions.
Underlying EBITDA increased by £23.1m, or 15%, to £179.2m in the year ended 31 December 2015
(2014: £156.1m). This improvement was driven by the growth in net revenue noted above and
strong cost control, underpinned by a drive towards greater efficiency. Operating costs increased in
the year by £4.7m, or 3%, reflecting the higher volumes as well as investment to drive future growth.
The cost growth was at a significantly lower rate than the net revenue growth, leading to an overall
improvement in profit margin.
12
Ancillary income includes fees charged per transaction for providing gateway services, fraud and risk management services, float income, and charges levied for the acceptance of alternative payments. Gateway services work in the same manner as transaction processing services, but are provided for online transactions only.
21
WPUS
Year ended Pro forma year ended Year-on-year 31 December 2015 31 December 2014 change
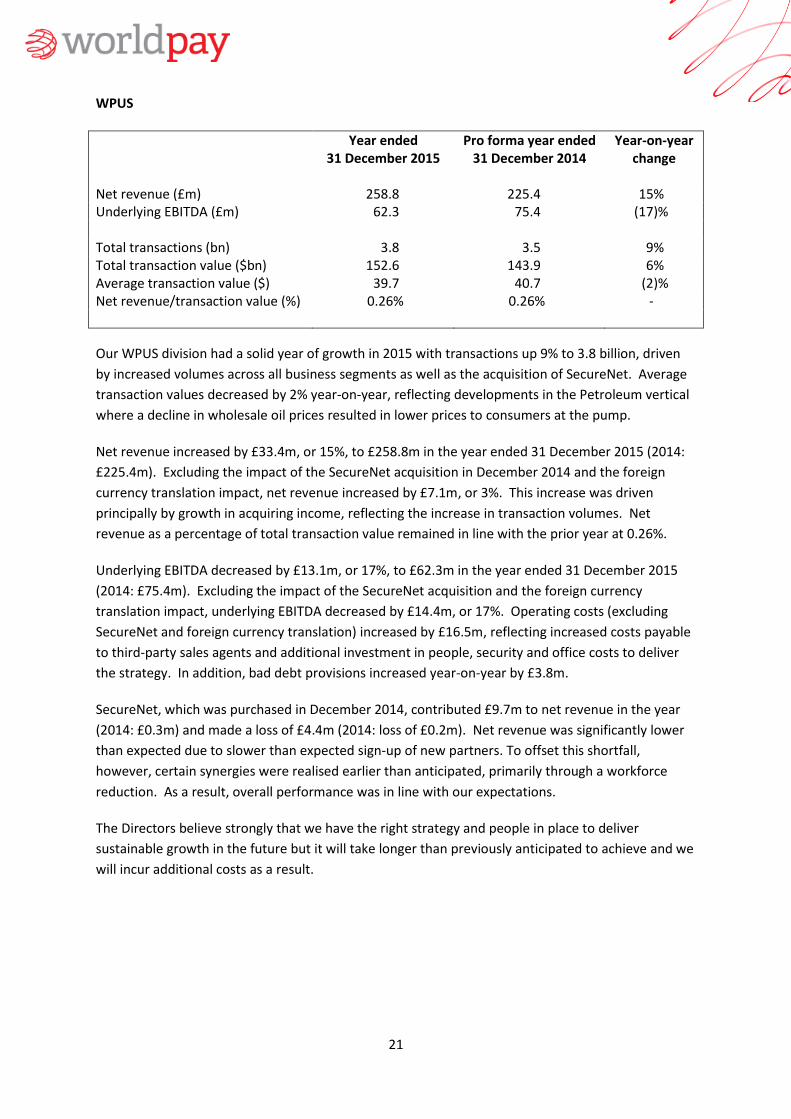
Net revenue (£m) 258.8 225.4 15% Underlying EBITDA (£m) 62.3 75.4 (17)% Total transactions (bn) 3.8 3.5 9% Total transaction value ($bn) 152.6 143.9 6% Average transaction value ($) 39.7 40.7 (2)% Net revenue/transaction value (%) 0.26% 0.26% -
Our WPUS division had a solid year of growth in 2015 with transactions up 9% to 3.8 billion, driven
by increased volumes across all business segments as well as the acquisition of SecureNet. Average
transaction values decreased by 2% year-on-year, reflecting developments in the Petroleum vertical
where a decline in wholesale oil prices resulted in lower prices to consumers at the pump.
Net revenue increased by £33.4m, or 15%, to £258.8m in the year ended 31 December 2015 (2014:
£225.4m). Excluding the impact of the SecureNet acquisition in December 2014 and the foreign
currency translation impact, net revenue increased by £7.1m, or 3%. This increase was driven
principally by growth in acquiring income, reflecting the increase in transaction volumes. Net
revenue as a percentage of total transaction value remained in line with the prior year at 0.26%.
Underlying EBITDA decreased by £13.1m, or 17%, to £62.3m in the year ended 31 December 2015
(2014: £75.4m). Excluding the impact of the SecureNet acquisition and the foreign currency
translation impact, underlying EBITDA decreased by £14.4m, or 17%. Operating costs (excluding
SecureNet and foreign currency translation) increased by £16.5m, reflecting increased costs payable
to third-party sales agents and additional investment in people, security and office costs to deliver
the strategy. In addition, bad debt provisions increased year-on-year by £3.8m.
SecureNet, which was purchased in December 2014, contributed £9.7m to net revenue in the year
(2014: £0.3m) and made a loss of £4.4m (2014: loss of £0.2m). Net revenue was significantly lower
than expected due to slower than expected sign-up of new partners. To offset this shortfall,
however, certain synergies were realised earlier than anticipated, primarily through a workforce
reduction. As a result, overall performance was in line with our expectations.
The Directors believe strongly that we have the right strategy and people in place to deliver
sustainable growth in the future but it will take longer than previously anticipated to achieve and we
will incur additional costs as a result.

22
APPENDIX 1
CONSOLIDATED INCOME STATEMENT For the year ended 31 December 2015 (with prior year pro forma 12 month comparatives)
Pro forma
Year ended 31 December Year ended 31 December
2015 2014
Underlying result
Separately disclosed
items Total Underlying
result
Separately disclosed
items Total
£m £m £m £m £m £m
Revenue 3,963.0 - 3,963.0 3,626.6 - 3,626.6 Interchange and scheme fees (2,981.3) - (2,981.3) (2,763.2) - (2,763.2)
Net revenue 981.7 - 981.7 863.4 - 863.4
Other cost of sales (121.3) - (121.3) (98.1) - (98.1)
Gross profit 860.4 - 860.4 765.3 - 765.3 Personnel expenses (271.9) (62.6) (334.5) (230.8) (32.2) (263.0) General, selling and administrative expenses (182.4) (41.1) (223.5) (159.8) (56.4) (216.2)
EBITDA* 406.1 (103.7) 302.4 374.7 (88.6) 286.1 Depreciation, amortisation and impairment (65.6) (69.9) (135.5) (78.4) (82.7) (161.1)
Operating profit 340.5 (173.6) 166.9 296.3 (171.3) 125.0 Finance (costs)/income (151.2) 4.6 (146.6) (163.2) (8.6) (171.8) Share of results of joint venture and associate (1.2) - (1.2) (0.3) - (0.3)
Profit/(loss) before tax 188.1 (169.0) 19.1 132.8 (179.9) (47.1)
Tax (charge)/credit (49.7) 0.8 (48.9) (41.1) 38.2 (2.9)
Profit/(loss) for period 138.4 (168.2) (29.8) 91.7 (141.7) (50.0)
Total earnings/(loss) per share (pence) Basic 8.2 (1.8) 5.7 (3.1) Diluted 8.2 (1.8) 5.7 (3.1)
*EBITDA is defined as earnings before interest, tax, depreciation and amortisation.

23
CONSOLIDATED INCOME STATEMENT (CONTINUED) For the year ended 31 December 2015 (with prior year statutory one month comparatives)
Year ended 31 December One month ended 31 December
2015 2014
Underlying result
Separately disclosed
items Total Underlying
result
Separately disclosed
items Total
£m £m £m £m £m £m
Revenue 3,963.0 - 3,963.0 364.2 - 364.2 Interchange and scheme fees (2,981.3) - (2,981.3) (273.0) - (273.0)
Net revenue 981.7 - 981.7 91.2 - 91.2
Other cost of sales (121.3) - (121.3) (9.1) - (9.1)
Gross profit 860.4 - 860.4 82.1 - 82.1 Personnel expenses (271.9) (62.6) (334.5) (17.6) (3.6) (21.2) General, selling and administrative expenses (182.4) (41.1) (223.5) (11.7) (3.5) (15.2)
EBITDA* 406.1 (103.7) 302.4 52.8 (7.1) 45.7 Depreciation, amortisation and impairment (65.6) (69.9) (135.5) (8.9) (9.1) (18.0)
Operating profit 340.5 (173.6) 166.9 43.9 (16.2) 27.7 Finance (costs)/income (151.2) 4.6 (146.6) (14.8) (1.2) (16.0) Share of results of joint venture and associate (1.2) - (1.2) - - -
Profit/(loss) before tax 188.1 (169.0) 19.1 29.1 (17.4) 11.7
Tax (charge)/credit (49.7) 0.8 (48.9) (5.0) 3.7 (1.3)
Profit/(loss) for period 138.4 (168.2) (29.8) 24.1 (13.7) 10.4
Total earnings/(loss) per share (pence) Basic 8.2 (1.8) 1.5 0.6 Diluted 8.2 (1.8) 1.5 0.6
*EBITDA is defined as earnings before interest, tax, depreciation and amortisation.

24
CONSOLIDATED STATEMENT OF COMPREHENSIVE INCOME
For the year ended 31 December 2015
Year ended 31 December
Pro forma Year ended 31
December
One month ended 31 December
2015 2014 2014
£m £m £m
(Loss)/profit for the period (29.8) (50.0) 10.4
Items that are or may subsequently be reclassified to profit or loss: Currency translation movement on net investment in subsidiary undertakings 1.2 1.7 (4.8) Currency translation movement due to net investment hedging (8.2) (4.5) 2.1
Total comprehensive income for the period (36.8) (52.8) 7.7

25
CONSOLIDATED BALANCE SHEET
As at 31 December 2015
31 December
2015 2014
£m £m Non-current assets
Goodwill 1,275.3 1,260.9 Other intangible assets 719.4 673.7 Property, plant and equipment 122.3 126.7 Investment in joint venture and associate 5.2 3.2
Deferred tax assets 12.9 25.0
2,135.1 2,089.5
Current assets Inventory 0.4 1.3 Trade and other receivables 396.5 382.5 Financial assets – Visa Europe shares 195.7 - Scheme debtors 534.5 414.9 Current tax asset 7.5 - Merchant float 696.4 769.9
Own cash and cash equivalents 165.3 168.7
1,996.3 1,737.3
Current liabilities Trade and other payables (334.3) (268.8) Merchant creditors (1,230.9) (1,184.8) Current tax liabilities (9.6) (9.5) Derivative financial instruments (0.2) (1.2) Financial liabilities – CVR liabilities (140.9) - Borrowings (9.2) (117.1) Finance leases (15.0) (12.7)
Provisions (8.0) (13.1)
(1,748.1) (1,607.2)
Non current liabilities Borrowings (1,552.2) (2,277.5) Finance leases (14.2) (15.5) Provisions (0.7) (8.3)
Deferred tax liabilities (145.1) (110.4)
(1,712.2) (2,411.7)
Net assets/(liabilities) 671.1 (192.1)
Equity Called-up share capital 60.0 50.0 Share premium 883.8 818.7 Own shares (23.7) - Capital contribution reserve 38.1 6.7 Merger reserve (374.5) (374.5) Foreign exchange reserve (9.3) (2.3)
Retained earnings surplus/(deficit) 96.7 (690.7)
Total equity 671.1 (192.1)

26
CONSOLIDATED STATEMENT OF CHANGES IN EQUITY
For the year ended 31 December 2015
Called up share
capital Share
premium Own
shares
Capital contribution
reserve Merger reserve
Foreign exchange reserve
Retained earnings/ (deficit) Total
£m £m £m £m £m £m £m £m
At 1 December 2014 50.0 818.7 - 6.7 (374.5) 0.4 (701.1) (199.8)
Profit for the period - - - - - - 10.4 10.4
Foreign currency translation - - - - - (4.8) - (4.8)
Foreign currency translation - net investment hedging - -
- - - 2.1 - 2.1
Total comprehensive income for the period - - - - - (2.7) 10.4 7.7
At 31 December 2014 50.0 818.7 - 6.7 (374.5) (2.3) (690.7) (192.1)
Loss for the period - - - - - - (29.8) (29.8)
Capital reduction - (818.7) - - - - 818.7 -
Ordinary shares conversion (1.8) - - - - - - (1.8)
Ordinary shares issuance 11.8 936.0 - - - - - 947.8
IPO fees capitalised - (52.2) - - - - - (52.2)
Capital contributions received from former parent companies - - - 31.4 - - - 31.4
Dividend paid - - - - - - (1.5) (1.5)
Investment in own shares - - (23.7) - - - - (23.7)
Foreign currency translation - - - - - 1.2 - 1.2
Foreign currency translation - net investment hedging - -
- - - (8.2) - (8.2)
Total comprehensive income for the period 10.0 65.1 (23.7) 31.4 - (7.0) 787.4 863.2
At 31 December 2015 60.0 883.8 (23.7) 38.1 (374.5) (9.3) 96.7 671.1

27
CONSOLIDATED CASH FLOW STATEMENT
For the year ended 31 December 2015
Year ended 31 December
Pro forma Year ended
31 December
One month ended
31 December
2015 2014 2014
£m £m £m Cash flows from operating activities
Cash generated by/(used in) operations 345.7 251.1 (43.4)
Tax paid (8.6) (19.1) (2.9)
Net cash inflow/(outflow) from operating activities 337.1 232.0
(46.3)
Investing activities Purchase of intangible assets (148.8) (116.3) (13.1) Purchases of property, plant and equipment (30.2) (26.4) (4.4)
Acquisitions (16.6) (99.4) (80.0)
Net cash used in investing activities (195.6) (242.1) (97.5)
Financing activities Finance costs paid (208.7) (89.4) - New finance leases 15.8 10.8 2.7 Repayment of finance lease obligations (14.5) (10.0) (1.4) Repayment of loan notes (101.8) (0.2) - Proceeds on issue of shares 947.8 - - Costs incurred for the issue of shares, taken directly to equity (52.2) -
-
Proceeds on new borrowings 1,895.3 139.6 - Repayment of borrowings (2,615.4) (41.2) (7.2) Payment of new borrowing fees (19.6) (3.8) - Equity contributions received from shareholders 31.4 - - Investment in own shares (23.7) - -
Payment of dividend (1.5) - -
Net cash (used in)/from financing activities (147.1) 5.8 (5.9)
Net decrease in own cash and cash equivalents (5.6) (4.3) (149.7) Own cash and cash equivalents at beginning of
period 168.7 181.6
321.6
Effect of foreign exchange rate changes 2.2 (8.6) (3.2)
Own cash and cash equivalents at end of period 165.3 168.7 168.7

28
Note 1
General information and basis of preparation
General information
The Company was incorporated and registered in England and Wales on 5 November 2013 under the
Companies Act 2006 as a private company limited by shares. The Company was re-registered as a public
limited company under the name Worldpay Group plc on 30 September 2015.
On 16 October 2015, the Company's shares were admitted to the London Stock Exchange through a placing of
1,035,000,000 ordinary shares of £0.03 each.
The financial information, which comprises the consolidated income statement, consolidated statement of
comprehensive income, consolidated balance sheet, consolidated statement of changes in equity,
consolidated cash flow statement and related notes, does not constitute full accounts within the meaning of
s435 (1) and (2) of the Companies Act 2006.
The Company only statutory accounts for the period ended 30 November 2014 were prepared for the
purposes of UK company law in accordance with UK GAAP, and they were the first set of statutory accounts
prepared for the Company since its incorporation on 4 November 2013. Since then, the Company changed its
financial year end to 31 December and prepared the statutory accounts for one month ended 31 December
2014 accordingly. These financial statements have been retrospectively presented in accordance with
International Financial Reporting Standards as adopted by the EU (IFRS) and aligned to period ends of the
Group it heads. Consolidated statutory financial statements for the year ended 31 December 2014 were
prepared at Ship Luxco 3 S.à r.l. level which is within this Group. These statutory financial statements were
prepared in accordance with IFRS. There is one intermediate holding company, Ship Luxco 2 S.à r.l., above Ship
Luxco 3 S.à r.l. and below Worldpay Group Limited. Statutory financial statements for Ship Luxco 2 S.à r.l. for
the year ended 31 December 2014 have been prepared in accordance with IFRS. No consolidated financial
statements for statutory accounts purposes have been prepared for the Group for these periods. The
Company is exempt under IAS 27 Consolidated and Separate Financial Statements and section 400 of the
Companies Act 2006 from such requirement.
The reports of the auditor in respect of the statutory financial statements above for the year ended 31
December 2014 were unqualified, did not include a reference to any matters to which the auditor drew
attention by way of emphasis without qualifying their report, and where applicable (statutory accounts for
Worldpay Group Limited for the period ended 30 November 2014 and 31 December 2014) did not contain a
statement under section 498 (2) or (3) of the Companies Act 2006.
Basis of preparation
The Group's consolidated financial information includes that of the Company and its subsidiaries (together
referred to as the 'Group') with equity accounting for the Group's interest in joint ventures and associates.
On 3 July 2015, the Company changed its financial year end from 30 November to 31 December. As a result,
the comparative period to this financial information is 1 December 2014 to 31 December 2014.
To aid comparability and understanding of performance, however, we have also presented pro forma
comparative information for the 12 months to 31 December 2014.
The consolidated financial information for all periods has been prepared in accordance with International
Financial Reporting Standards as adopted by the European Union ("IFRS").

29
Note 1 (continued)
The financial information is presented in Sterling which is the Company's functional currency. All information is
given to the nearest one hundred thousand pounds. It is prepared on the historical cost basis except for the
derivative financial instruments and the Group's membership stake in Visa Europe, which are stated at their
fair value.
On 12 December 2013, the Company acquired all of the issued share capital of Ship Luxco 2 S.à r.l. and its
subsidiaries. The acquisition has been accounted for using the principles of reverse acquisition accounting.
Therefore when preparing the financial information, it has been assumed that the Company has always been
the ultimate parent company of the Group.
The Group includes a column for separately disclosed items on the face of its consolidated income statement.
Separately disclosed items are costs or income that have been recognised in the income statement which the
Directors believe, due to their nature or size, should be disclosed separately to give a more comparable view of
the year-on-year underlying financial performance. They are presented in their relevant income statement
category, but highlighted through separate disclosure.
Net revenue which is defined as revenue less interchange and scheme fees, is presented on the face of the
income statement as the Directors believe that this best reflects the relationship between revenue and
profitability.
The Group's cash flow statement is presented excluding merchant float. Merchant float represents surplus
cash balances that the Group holds on behalf of its customers when the incoming amount from the card
schemes or networks precedes when the funding to customers falls due.
The funds are held in a fiduciary capacity and cannot be utilised by the Group to fund its own cash
requirements. The merchant float is also subject to significant period by period fluctuations depending on the
day of the week a period end falls. For these reasons, the Directors have excluded the merchant float from the
cash flow statement to allow a better understanding of the Group's underlying own cash flows.
30
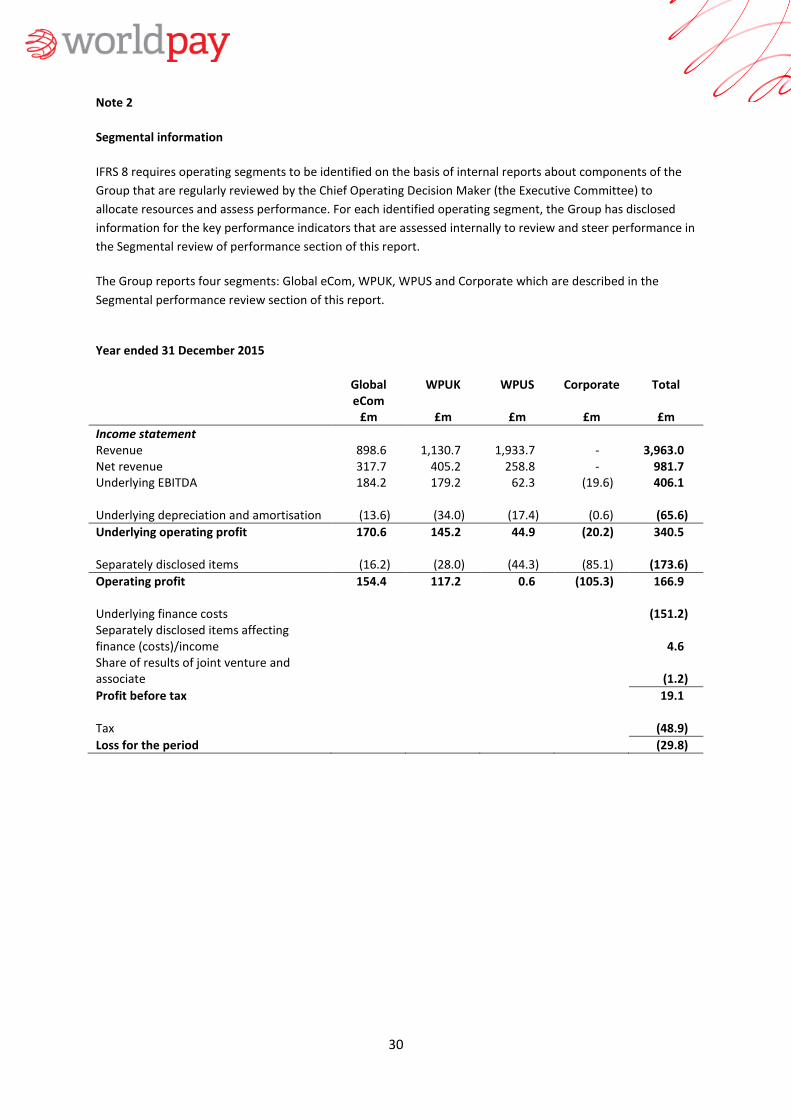
Note 2
Segmental information
IFRS 8 requires operating segments to be identified on the basis of internal reports about components of the
Group that are regularly reviewed by the Chief Operating Decision Maker (the Executive Committee) to
allocate resources and assess performance. For each identified operating segment, the Group has disclosed
information for the key performance indicators that are assessed internally to review and steer performance in
the Segmental review of performance section of this report.
The Group reports four segments: Global eCom, WPUK, WPUS and Corporate which are described in the
Segmental performance review section of this report.
Year ended 31 December 2015
Global
eCom WPUK WPUS Corporate Total
£m £m £m £m £m
Income statement Revenue 898.6 1,130.7 1,933.7 - 3,963.0 Net revenue 317.7 405.2 258.8 - 981.7 Underlying EBITDA 184.2 179.2 62.3 (19.6) 406.1 Underlying depreciation and amortisation (13.6) (34.0) (17.4) (0.6) (65.6)
Underlying operating profit 170.6 145.2 44.9 (20.2) 340.5 Separately disclosed items (16.2) (28.0) (44.3) (85.1) (173.6)
Operating profit 154.4 117.2 0.6 (105.3) 166.9 Underlying finance costs (151.2) Separately disclosed items affecting finance (costs)/income
4.6
Share of results of joint venture and associate
(1.2)
Profit before tax 19.1 Tax (48.9)
Loss for the period (29.8)

31
Note 2 (continued) Pro forma information for year ended 31 December 2014
Global
eCom WPUK WPUS Corporate Total
£m £m £m £m £m
Income statement Revenue 731.2 1,229.0 1,666.4 - 3,626.6 Net revenue 272.0 366.0 225.4 - 863.4 Underlying EBITDA 161.5 156.1 75.4 (18.3) 374.7 Underlying depreciation and amortisation (28.5) (36.7) (12.2) (1.0) (78.4)
Underlying operating profit 133.0 119.4 63.2 (19.3) 296.3 Separately disclosed items (16.7) (49.3) (32.6) (72.7) (171.3)
Operating profit 116.3 70.1 30.6 (92.0) 125.0 Underlying finance costs (163.2) Separately disclosed items affecting finance (costs)/income
(8.6)
Share of results of joint venture (0.3)
Loss before tax (47.1) Tax (2.9)
Loss for the period (50.0)

32
Note 2 (continued)
One month ended 31 December 2014
Global
eCom WPUK WPUS Corporate Total
£m £m £m £m £m
Income statement Revenue 70.5 135.1 158.6 - 364.2 Net revenue 27.6 39.3 24.3 - 91.2 Underlying EBITDA 19.0 23.7 12.1 (2.0) 52.8 Underlying depreciation and amortisation (3.1) (0.8) (4.9) (0.1) (8.9)
Underlying operating profit 15.9 22.9 7.2 (2.1) 43.9 Separately disclosed items (1.4) (6.9) (2.9) (5.0) (16.2)
Operating profit 14.5 16.0 4.3 (7.1) 27.7 Underlying finance costs (14.8) Separately disclosed items affecting finance (costs)/income
(1.2)
Profit before tax 11.7 Tax (1.3)
Profit for the period 10.4
33
Note 3
Separately disclosed items
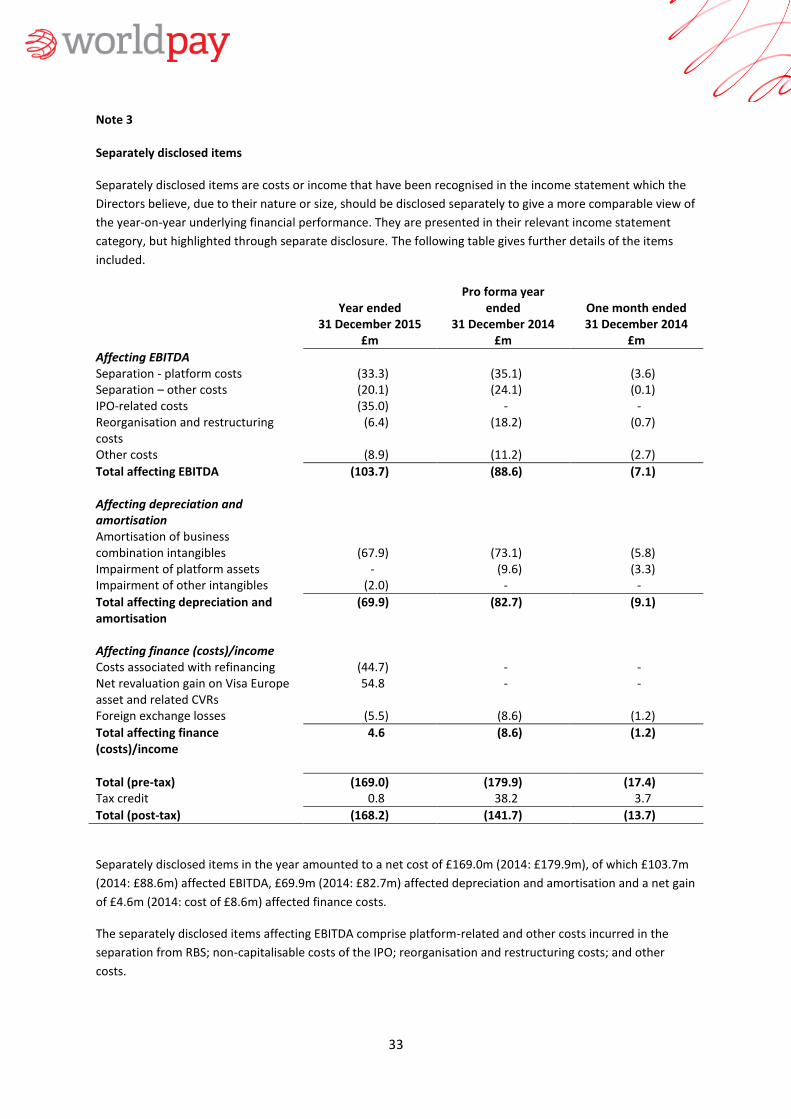
Separately disclosed items are costs or income that have been recognised in the income statement which the
Directors believe, due to their nature or size, should be disclosed separately to give a more comparable view of
the year-on-year underlying financial performance. They are presented in their relevant income statement
category, but highlighted through separate disclosure. The following table gives further details of the items
included.
Year ended
Pro forma year ended
One month ended
31 December 2015 31 December 2014 31 December 2014 £m £m £m
Affecting EBITDA Separation - platform costs (33.3) (35.1) (3.6) Separation – other costs (20.1) (24.1) (0.1) IPO-related costs (35.0) - - Reorganisation and restructuring costs
(6.4) (18.2) (0.7)
Other costs (8.9) (11.2) (2.7)
Total affecting EBITDA (103.7) (88.6) (7.1) Affecting depreciation and amortisation
Amortisation of business combination intangibles
(67.9)
(73.1)
(5.8)
Impairment of platform assets - (9.6) (3.3) Impairment of other intangibles (2.0) - -
Total affecting depreciation and amortisation
(69.9) (82.7) (9.1)
Affecting finance (costs)/income Costs associated with refinancing (44.7) - - Net revaluation gain on Visa Europe asset and related CVRs
54.8 - -
Foreign exchange losses (5.5) (8.6) (1.2)
Total affecting finance (costs)/income
4.6 (8.6) (1.2)
Total (pre-tax) (169.0) (179.9) (17.4) Tax credit 0.8 38.2 3.7
Total (post-tax) (168.2) (141.7) (13.7)
Separately disclosed items in the year amounted to a net cost of £169.0m (2014: £179.9m), of which £103.7m
(2014: £88.6m) affected EBITDA, £69.9m (2014: £82.7m) affected depreciation and amortisation and a net gain
of £4.6m (2014: cost of £8.6m) affected finance costs.
The separately disclosed items affecting EBITDA comprise platform-related and other costs incurred in the
separation from RBS; non-capitalisable costs of the IPO; reorganisation and restructuring costs; and other
costs.

34
Note 3 (continued)
Platform-related separation costs of £33.3m (2014: £35.1m) are non-capitalised costs associated with the
upgrade and migration of the Group’s core systems from RBS. They are principally personnel, maintenance
and consultancy costs. Total costs incurred to date on the platform programme are £449.8m (2014: £361.9m),
of which £289.4m (2014: £234.8m) has been included within tangible and intangible assets on the balance
sheet, with the remainder charged directly to the income statement.
Other costs related to the separation from RBS of £20.1m (2014: £24.1m) principally relate to system
implementation and remediation, double running of property, and the excess costs of interim staff.
The non-capitalisable costs of the IPO in the year amounted to £35.0m (2014 £nil) and reflect the costs of
various share awards granted as part of the IPO, including the all-employee free share award and additional
awards given to management.
Reorganisation and restructuring costs of £6.4m (2014: £18.2m) represent costs associated with a variety of
projects to develop and implement the strategy of establishing Worldpay as a stand-alone business. Costs in
2015 include the restructuring and further integration of the Cardsave business in WPUK and the sales force
reorganisation in WPUS. These are partially offset by the release of provisions for contingent consideration no
longer required.
Other costs of £8.9m (2014: £11.2m) include fees payable to shareholders incurred prior to the IPO in relation
to the previous ownership structure and a number of other smaller one-off items.
Separately disclosed items affecting depreciation and amortisation amounted to £69.9m (2014: £82.7m).
These predominantly relate to the amortisation of business combination intangibles which is a non-cash
charge relating to intangible assets recognised on the divestment of the business from RBS, as well as
subsequent strategic business acquisitions. In addition, in the year, software development in WPUS of £2.0m
was deemed to be impaired and written off following the integration of the SecureNet business.
Separately disclosed items affecting finance costs in the year were a net gain of £4.6m (2014: cost of £8.6m)
and comprise costs associated with the refinancing of the Group (£44.7m), a net revaluation fair value gain on
the Visa Europe shares and related Contingent Value Rights (£54.8m), and FX losses resulting from the
translation of the Group’s assets and liabilities denominated in currencies other than Sterling (£5.5m). The
£44.7m of costs associated with the refinancing represent the write-off of previously capitalised finance costs
on repayment of the debt that was in place prior to the IPO. The net revaluation gain on the Visa Europe
shares and related Contingent Value Rights is discussed in more detail in note 5.
The tax credit of £0.8m arising on separately disclosed items (2014: £38.2m) includes a deferred tax charge of
£39.2m arising on the proposed disposal of the interest in Visa Europe in 2016.

35
Note 4
Finance (costs)/income
Year ended 31 December
Pro forma Year ended
31 December
One month ended
31 December
2015 2014 2014
£m £m £m Underlying finance costs
Effective interest on borrowings (119.8) (133.6) (11.9) Effective interest on finance leases (1.1) (2.7) (0.2) Loan notes - interest (12.1) (15.4) (1.3) Amortisation of banking facility fees (11.9) (7.0) (1.5) Fair value losses (0.6) (0.6) -
Other finance (costs)/income (5.7) (3.9) 0.1
(151.2) (163.2) (14.8)
Separately disclosed finance (costs)/income Finance income on Visa Europe asset 195.7 - - Finance costs on CVRs (140.9) - - Write-off of banking facility fees on refinancing (44.7) - -
Foreign exchange losses (5.5) (8.6) (1.2)
4.6 (8.6) (1.2)
Total finance (costs)/income (146.6) (171.8) (16.0)
Note 5
Visa Europe
On 2 November 2015, we announced the proposed disposal of our interest in Visa Europe to Visa Inc. The
disposal, which is expected to complete in Q2 2016, is a result of Visa Inc.'s agreement to purchase 100% of
Visa Europe, subject to the satisfaction of certain conditions.
Under the terms of the disposal, Worldpay will receive a mixture of cash and non-cash consideration currently
estimated to be worth in aggregate up to €1.2 billion. This is made up of up-front consideration of
approximately €544m of cash and €375m of Series B Preferred Stock in Visa Inc. In addition, if the earnout
pays out in full, Worldpay could receive in the region of €283m in earnout conditional upon achieving certain
criteria relating to the incremental net revenue of Visa Europe during the earnout period. The up-front
consideration will be reduced by any final settlement of potential liabilities relating to ongoing interchange
related litigation involving Visa Europe. Potential losses from interchange litigation liabilities will be set against
the Preferred Stock which can be reduced to absorb those losses. A Loss Sharing Agreement entered into by
Worldpay, along with the ten other largest UK members of Visa Europe, provides a second level of protection
to Visa Inc., capped at the value of the cash consideration received. The Group’s share of such liabilities arising
from the UK interchange related litigation is capped at the Group’s up-front consideration.
As set out in our IPO Prospectus dated 13 October 2015, the holders of the Contingent Value Rights (the
“CVRs”) (a separate class of shares in the Company) will be entitled to 90% of the net post-tax proceeds of the
disposal in accordance with the terms of the CVRs (subject to the Company's right of retention), with Worldpay
retaining 10% of the net proceeds. Further details of the CVRs are set out in our Prospectus.

36
Note 5 (continued)
Following the disposal, Worldpay will continue to be a participant in the Visa payments system. It is
anticipated that Worldpay will no longer have representation on the Board of Visa Europe following
completion of the disposal as a result of Visa Europe ceasing to be a member-owned association.
As at 30 June 2015 and on IPO completion, the Visa Europe asset was recognised in the Group’s balance sheet
as a financial asset with a fair value of £nil. In accordance with IAS 39, financial assets should be re-measured
at each reporting date. In performing the revaluation at 31 December 2015, the offer by Visa Inc. to purchase
Visa Europe has been taken into account in the subsequent measure of fair value, despite the fact that there
remains some uncertainty around both the likelihood of completion of the deal (which is still subject to anti-
trust clearance), and the amount of pre-transaction operational liabilities which would reduce the up-front
consideration received.
The CVR liabilities were recognised at £nil fair value on initial recognition. At year end, they were re-measured
at amortised cost based on a re-estimation of future cash flows, with any changes being recognised in the
income statement.
Based on the above, the following has been recognised in the Group's 2015 financial statements:
Year ended 31 December
2015
£m Balance sheet Financial assets – Visa Europe shares 195.7 Financial liabilities – CVR liabilities (140.9)
Deferred tax liabilities (39.2)
Net assets 15.6 Income statement Finance income – Visa Europe shares 195.7
Finance costs – CVR liabilities (140.9)
Profit before tax 54.8
Taxation (39.2)
Profit after tax 15.6
37
Note 6
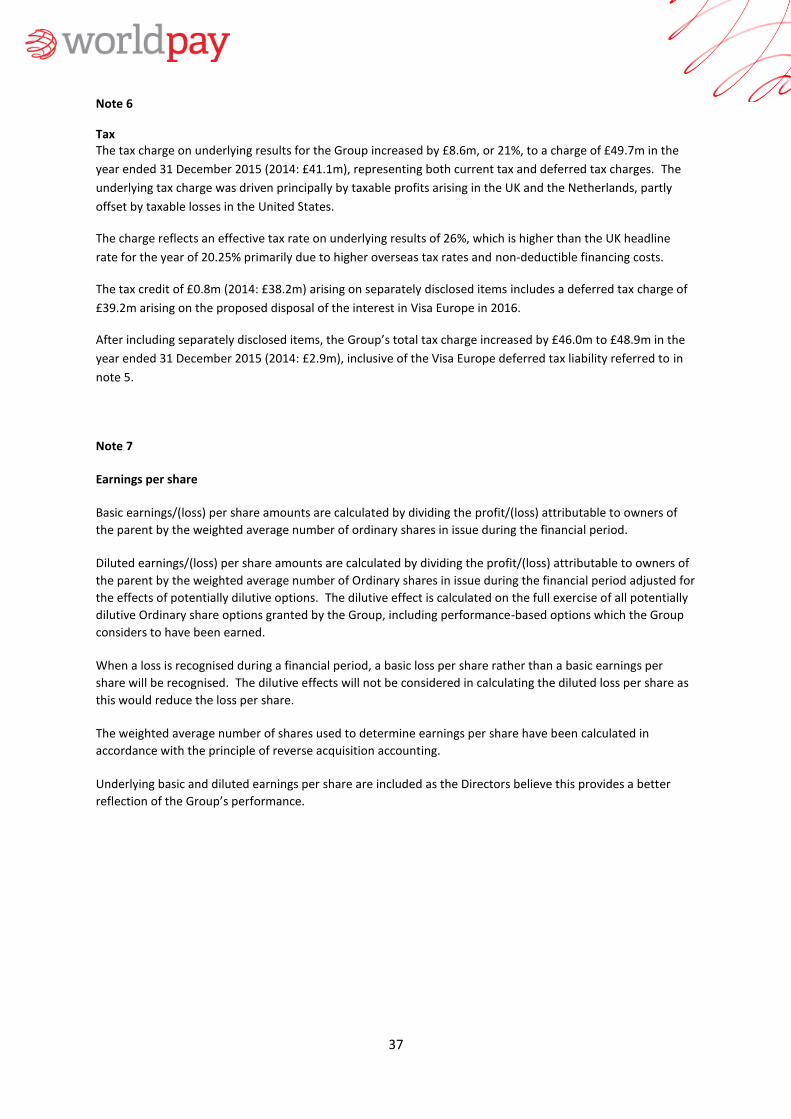
Tax The tax charge on underlying results for the Group increased by £8.6m, or 21%, to a charge of £49.7m in the
year ended 31 December 2015 (2014: £41.1m), representing both current tax and deferred tax charges. The
underlying tax charge was driven principally by taxable profits arising in the UK and the Netherlands, partly
offset by taxable losses in the United States.
The charge reflects an effective tax rate on underlying results of 26%, which is higher than the UK headline
rate for the year of 20.25% primarily due to higher overseas tax rates and non-deductible financing costs.
The tax credit of £0.8m (2014: £38.2m) arising on separately disclosed items includes a deferred tax charge of
£39.2m arising on the proposed disposal of the interest in Visa Europe in 2016.
After including separately disclosed items, the Group’s total tax charge increased by £46.0m to £48.9m in the
year ended 31 December 2015 (2014: £2.9m), inclusive of the Visa Europe deferred tax liability referred to in
note 5.
Note 7
Earnings per share
Basic earnings/(loss) per share amounts are calculated by dividing the profit/(loss) attributable to owners of
the parent by the weighted average number of ordinary shares in issue during the financial period.
Diluted earnings/(loss) per share amounts are calculated by dividing the profit/(loss) attributable to owners of
the parent by the weighted average number of Ordinary shares in issue during the financial period adjusted for
the effects of potentially dilutive options. The dilutive effect is calculated on the full exercise of all potentially
dilutive Ordinary share options granted by the Group, including performance-based options which the Group
considers to have been earned.
When a loss is recognised during a financial period, a basic loss per share rather than a basic earnings per
share will be recognised. The dilutive effects will not be considered in calculating the diluted loss per share as
this would reduce the loss per share.
The weighted average number of shares used to determine earnings per share have been calculated in
accordance with the principle of reverse acquisition accounting.
Underlying basic and diluted earnings per share are included as the Directors believe this provides a better
reflection of the Group’s performance.

38
Note 7 (continued)
Year ended 31 December
Pro forma Year ended 31
December
One month ended
31 December
2015 2014 2014
Profit/(loss) (£m)
Underlying results 138.4 91.7 24.1
Total (loss)/ profit for the period (29.8) (50.0) 10.4
Weighted average number of shares for (millions): Basic 1,690.5 1,605.1 1,605.1 Diluted 1,691.0 1,605.1 1,605.1 Basic earnings/(loss) per share (pence) Underlying basic earnings per share 8.2 5.7 1.5 Total basic loss per share (1.8) (3.1) 0.6 Diluted earnings/ (loss) per share (pence) Underlying diluted earnings per share 8.2 5.7 1.5 Total diluted loss per share (1.8) (3.1) 0.6
During 2015, the Company’s 50,000,000 ordinary shares were split into 1,605,083,333 ordinary shares without a corresponding change in share capital. As a result, the weighted average numbers of shares for comparative periods have been adjusted for in accordance to IAS 33.

39
Note 8
Note to cash flow statement
Cash and cash equivalents comprises cash and demand deposits with banks, together with short-term highly
liquid investments that are readily convertible to known amounts of cash and subject to insignificant risk of
change in value. Merchant float is excluded from the cash flow statement.
The table below reconciles the profit/(loss) for the period before tax to cash generated by operations:
Year ended 31 December
Pro forma Year ended 31
December
One month ended
31 December
2015 2014 2014
£m £m £m Operating activities
Profit/(loss) before tax 19.1 (47.1) 11.7 Adjustments for : Depreciation and impairment of property, plant and equipment 34.6 39.7 3.0 Amortisation and impairment of intangible assets 100.9 121.4 15.0 Foreign exchange gains (10.1) (7.3) (2.2) (Profit)/loss on sale of assets (0.8) 2.8 - Share of results of joint venture and associate 1.2 0.3 -
Finance costs 146.6 171.8 16.0
Net cash inflow from operating activities 291.5 281.6 43.5
Increase in trade and other receivables (9.5) (74.1) (94.1) Increase in trade and other payables 63.2 54.9 8.4
Increase/(decrease) in provisions 0.5 (11.3) (1.2)
Net cash inflow/(outflow) from operating activities before tax 345.7 251.1 (43.4)
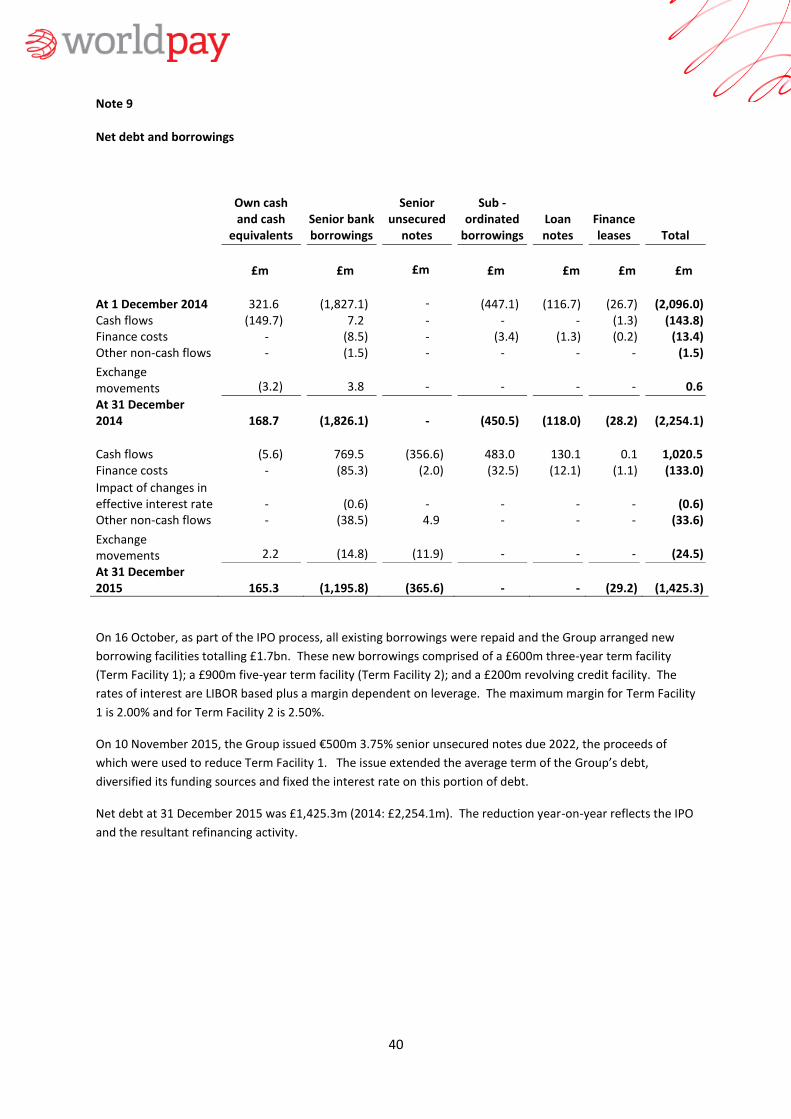
40
Note 9
Net debt and borrowings
Own cash and cash
equivalents Senior bank borrowings
Senior unsecured
notes
Sub -ordinated
borrowings Loan notes
Finance leases Total
£m £m
£m £m £m £m £m
At 1 December 2014 321.6 (1,827.1)
- (447.1) (116.7) (26.7) (2,096.0)
Cash flows (149.7) 7.2 - - - (1.3) (143.8) Finance costs - (8.5) - (3.4) (1.3) (0.2) (13.4) Other non-cash flows - (1.5) - - - - (1.5)
Exchange movements (3.2) 3.8
- - - - 0.6
At 31 December 2014 168.7 (1,826.1)
- (450.5) (118.0) (28.2) (2,254.1)
Cash flows (5.6) 769.5 (356.6) 483.0 130.1 0.1 1,020.5 Finance costs - (85.3) (2.0) (32.5) (12.1) (1.1) (133.0)
Impact of changes in effective interest rate - (0.6) - - - - (0.6) Other non-cash flows - (38.5) 4.9 - - - (33.6)
Exchange movements 2.2 (14.8) (11.9) - - - (24.5)
At 31 December 2015 165.3 (1,195.8) (365.6) - - (29.2) (1,425.3)
On 16 October, as part of the IPO process, all existing borrowings were repaid and the Group arranged new
borrowing facilities totalling £1.7bn. These new borrowings comprised of a £600m three-year term facility
(Term Facility 1); a £900m five-year term facility (Term Facility 2); and a £200m revolving credit facility. The
rates of interest are LIBOR based plus a margin dependent on leverage. The maximum margin for Term Facility
1 is 2.00% and for Term Facility 2 is 2.50%.
On 10 November 2015, the Group issued €500m 3.75% senior unsecured notes due 2022, the proceeds of
which were used to reduce Term Facility 1. The issue extended the average term of the Group’s debt,
diversified its funding sources and fixed the interest rate on this portion of debt.
Net debt at 31 December 2015 was £1,425.3m (2014: £2,254.1m). The reduction year-on-year reflects the IPO
and the resultant refinancing activity.

41
Note 9 (continued) The key terms on the Group’s senior bank borrowings are as follows:
Facility GBP CCY Repayment
type Coupon Rate
£m
Facility 1 247.1 GBP Bullet LIBOR + 1.75% Facility 2 572.3 GBP Bullet LIBOR + 2.25% Facility 2 338.0 USD Bullet LIBOR + 2.25% Revolving credit facility 38.4 GBP Revolver LIBOR + 2.25% Senior unsecured notes 365.6 EUR Bullet 3.75%
TOTAL 1,561.4
Note 10
Subsequent events
There were no events between the balance sheet date and the date of release of this consolidated financial
information that required disclosure.