worst case housing needs 2011 - hud user case housing needs 2011 ... income lossrental assistance...
TRANSCRIPT

WORST CASE HOUSING NEEDS 2011
REPORT TO CONGRESS
SUMMARY
U.S. Department of Housing and Urban Development | Office of Policy Development and Research
1 WORST CASE HOUSING NEEDS 2011 REPORT TO CONGRESS
SUMMARY
0
1,000
2,000
3,000
4,000
5,000
6,000
7,000
8,000
9,000
2001 2003 2005 2007 2009 2011
5,014 5,1765,992 5,905
7,095
8,475
Rent
ers
with
Wor
st C
ase
Nee
ds (1
,000
)
Source: HUD-PD&R tabulations of American Housing Survey
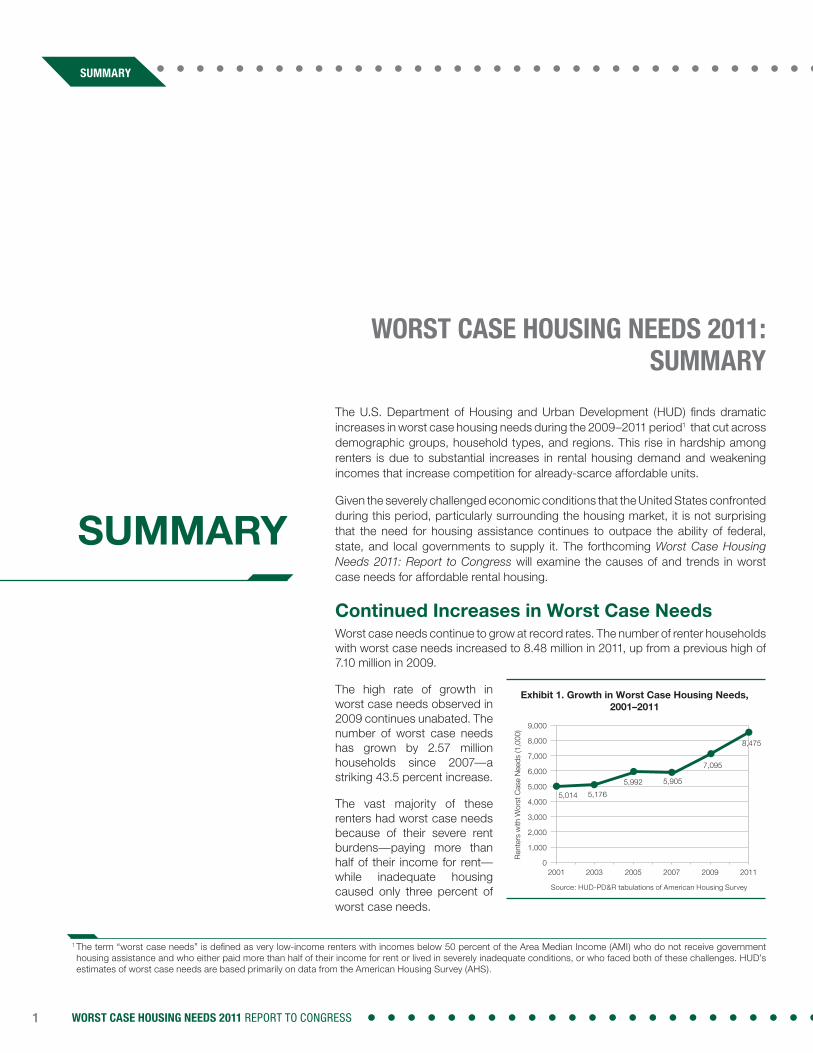
Exhibit 1. Growth in Worst Case Housing Needs,2001–2011
Source: HUD-PD&R tabulations of American Housing Survey
SUMMARY
WORST CASE HOUSING NEEDS 2011: SUMMARY
The U.S. Department of Housing and Urban Development (HUD) finds dramatic increases in worst case housing needs during the 2009–2011 period1 that cut across demographic groups, household types, and regions. This rise in hardship among renters is due to substantial increases in rental housing demand and weakening incomes that increase competition for already-scarce affordable units.
Given the severely challenged economic conditions that the United States confronted during this period, particularly surrounding the housing market, it is not surprising that the need for housing assistance continues to outpace the ability of federal, state, and local governments to supply it. The forthcoming Worst Case Housing Needs 2011: Report to Congress will examine the causes of and trends in worst case needs for affordable rental housing.
Continued Increases in Worst Case Needs Worst case needs continue to grow at record rates. The number of renter households with worst case needs increased to 8.48 million in 2011, up from a previous high of 7.10 million in 2009.
The high rate of growth in worst case needs observed in 2009 continues unabated. The number of worst case needs has grown by 2.57 million households since 2007—a striking 43.5 percent increase.
The vast majority of these renters had worst case needs because of their severe rent burdens—paying more than half of their income for rent—while inadequate housing caused only three percent of worst case needs.
0
1,000
2,000
3,000
4,000
5,000
6,000
7,000
8,000
9,000
2001 2003 2005 2007 2009 2011
5,014 5,1765,992 5,905
7,095
8,475
Rent
ers
with
Wor
st C
ase
Nee
ds (1
,000
)
Source: HUD-PD&R tabulations of American Housing Survey
Exhibit 1. Growth in Worst Case Housing Needs,2001–2011
1 The term “worst case needs” is defined as very low-income renters with incomes below 50 percent of the Area Median Income (AMI) who do not receive government housing assistance and who either paid more than half of their income for rent or lived in severely inadequate conditions, or who faced both of these challenges. HUD’s estimates of worst case needs are based primarily on data from the American Housing Survey (AHS).

2WORST CASE HOUSING NEEDS 2011 REPORT TO CONGRESS
SUMMARY
1,500
1,000
500
increases
decreases
net result
+213
+513
+203+127
+323 1,380
0
hous
ehold
form
ation
rent
er sh
are
rent
er in
com
e los
s
rent
al as
sistan
ce g
ap
affor
dable
unit c
ompe
tition
net c
hang
e in w
orst
case
need
s
Add
ed W
orst
Cas
e N
eeds
(1,0
00)
Source: HUD-PD&R tabulations of American Housing Survey
Exhibit 2. Demographic and Economic Causes of Increasing Worst Case Needs, 2009–2011
Source: HUD-PD&R tabulations of American Housing Survey
Worst Case Needs Affect All Demographic Groups and Household TypesWorst case needs affect all major racial and ethnic groups. Hispanic and non-Hispanic white households experienced the largest increases in the number of both very low-income renters and worst case needs since 2009. As a result, 48 percent of new cases of worst case needs were found among white, 28 percent among Hispanic, and 13 percent from black households.
Most household types experienced increases in worst case needs from 2009–2011.2 In 2011, worst case needs affected 3.24 million families with children, 1.47 million elderly households, 2.97 million other “nonfamily” households (unrelated people sharing housing), and 0.80 million “other family” households.
Regardless of household type, one-third to one-half of very low-income renters of each type experienced worst case needs in 2011.
Almost one in six renters with worst case needs included a nonelderly person with disabilities. The number of households with worst case needs having at least one nonelderly person with disabilities increased from 990,000 in 2009 to 1.31 million households in 2011, an increase of 320,000 households.
Context and DiscussionEstimates of worst case needs are based on the biennial American Housing Survey (AHS). Because the 2011 data were collected from May through September 2011, they do not capture changes arising since then. Nevertheless, the data show that while the economy has been slowly recovering from the 2007–2009 recession, the economic benefits of recovery had not yet reached millions of very low-income renters in 2011.
The likelihood that a very low-income renter household had worst case needs increased from 41.4 percent in 2009 to 43.9 percent in 2011. However, this higher prevalence rate did not account for all of the increase in worst case needs. An increase in the number of renters had a greater effect (Exhibit 2).
The number of renter households increased primarily because a substantial number of homeowners became renters as a result of the nation’s economic and housing market problems—unemployment and foreclosures—and also because of new household formation. Household formation and increasing renter share account for 210,000 and 510,000 new cases of worst case needs, or 53 percent of the total increase of 1.38 million.
The rest of the increase in worst case needs during 2009–2011 can be attributed to falling incomes among renters, a continuing shortage of housing assistance, and increased scarcity of affordable housing. The income of the median renter declined by 1.5 percent during this period, even as the median rent increased by 4.1 percent.
Even when households that change tenure from owning to renting have incomes that keep them from having worst case needs, they nevertheless occupy rental units. As a result, they increase the demand for such units and cause rents to rise for more vulnerable renters.
Conversion of numerous owner-occupied units to rental units following foreclosure helped offset some of the sharp increase in rental demand from the former occupants of those units. The stock of owner-occupied housing decreased by almost 760,000 units during 2009–2011,3 while the rental stock increased by 3.33 million units (8.4 percent). The 3.47 million new renter households absorbed all the net increase of rental units while also occupying 140,000 previously vacant units.
The national scarcity of affordable units available for the renters who need them most4 continued to worsen (Exhibit 3), despite these substantial shifts in supply. The number of affordable and available rental units decreased to 65 units per 100 very low-income renters and 36 units per 100 extremely low-income renters.
1,500
1,000
500
increases
decreases
net result
+213
+513
+203+127
+323 1,380
0
hous
ehold
form
ation
rent
er sh
are
rent
er in
com
e los
s
rent
al as
sistan
ce g
ap
affor
dable
unit c
ompe
tition
net c
hang
e in w
orst
case
need
s
Add
ed W
orst
Cas
e N
eeds
(1,0
00)
Source: HUD-PD&R tabulations of American Housing Survey
Exhibit 2. Demographic and Economic Causes of Increasing Worst Case Needs, 2009–2011
0
20
40
60
80
100
2003 2005 2007 2009 2011
Ren
tal U
nits
per
100
Ren
ter
Hou
seho
lds
Source: HUD-PD&R tabulations of American Housing Survey
Extremely Low Income (<30% AMI) Very Low Income (<50% AMI)
Exhibit 3. Shrinking Supply of Affordable Rental UnitsAvailable for Occupancy by Lower-Income Renters
Source: HUD-PD&R tabulations of American Housing Survey
2 The estimated increase in worst case needs among elderly households is not statistically significant.3 The net loss of owner-occupied units reflects changes from new construction, demolition, and conversion. Construction was completed on 943,000 new single-family detached homes during 2010 and 2011. See U.S. Housing Market Conditions, table 4, http://www.huduser.org/portal/periodicals/ushmc/fall12/USHMC_3q12_historical.pdf.
4 Rental units that are affordable at a specific income level are considered available if they are either currently vacant or already occupied by households whose incomes do not exceed that income level.

Conclusion The worsening situation for the nation’s 19.3 million very low-income renters clearly reflects the severe economic dislocation of the recession and the associated collapse of the housing market, which reduced homeownership through foreclosures and increased demand for rental housing. The scale of the problem requires major strategic decisions. As worst case housing needs continue to increase and the level of housing assistance remains relatively flat, the gap between the number of assisted units and the number of households with severe housing needs has never been wider. There are approximately two very low-income households with worst case needs for every very low-income household with rental assistance. A broad strategy is to continue to rebuild the economy and provide assistance to those families most in need. While the nation’s economic woes affected everyone, those with very low incomes were least able to weather its effects.
U.S. Department of Housing and Urban Development
Office of Policy Development and Research
Washington, DC 20410-6000
February 2013
Visit PD&R’s website www.hud.gov/policy or www.huduser.org to
find this report and others sponsored by HUD’s Office of Policy
Development and Research (PD&R). Other services of HUD USER,
PD&R’s Research and Information Service, include listservs, spe-
cial interest and bimonthly publications (best practices, significant
studies from other sources), access to public use databases, and
a hotline (1–800–245–2691) for help with accessing the information
you need.