wp 10-17: trade disputes between china and the … relations, this paper examines in detail the...
TRANSCRIPT
W P 1 0 - 1 7 D e c e m b e r 2 0 1 0
Working Paper S e r i e s
1750 Massachusetts Avenue, NW Washington, DC 20036-1903 Tel: (202) 328-9000 Fax: (202) 659-3225 www.piie.com
Trade Disputes Between China and the United States: Growing Pains so Far, Worse Ahead?Gary Clyde Hufbauer and Jared C. Woollacott
Abstract
This study covers the history of Sino-US trade relations with a particular focus on the past decade, during which time each has been a member of the World Trade Organization (WTO). Providing a brief history of 19th and 20th century economic relations, this paper examines in detail the trade disputes that have arisen between China and the United States over the past decade, giving dollar estimates for the trade flows at issue. Each country has partaken in their share of protectionist measures, however, US measures have been characteristically defensive, protecting declining industries, while Chinese measures have been characteristically offensive, promoting nascent industries. We also cover adminis-trative and legislation actions within each country that have yet to be the subject of formal complaint at the WTO. This includes an original and comprehensive quantitative summary of US Section 337 intellectual property rights cases. While we view the frictions in Sino-US trade a logical consequence of the rapid increase in flows between the two countries, we caution that each country work within the WTO framework and respect any adverse decisions it delivers so that a protracted protectionist conflict does not emerge. We see the current currency battle as one potential catalyst for such conflict if US and Chinese policymakers fail to manage it judiciously.
JEL Codes: F130, F530, N710, N720, N750Keywords: Agreement, Anti Dumping, Antidumping, Commodity Agreements, Dumping, Duty, Export Promoting,
Export Restrictions, Exports, Free Trade, GATT, GATT WTO, General Agreement on Tariffs and Trade, Import, Import Restricted, Import Subsidies, Import Subsidy, Intellectual Property Rights, International Agreement, International Trade
Agreements, International Trade Organizations, Liberalization, MFN, Multilateralism, Non Tariff, Nontariff Barrier, Openness, Optimal Trade Policy, Protectionism, Protectionist, Quotas, Sanctions, Services, Smoot Hawley, Subsidies,
Tariff, Trade, Trade Agreements, International Trade.
Gary Clyde Hufbauer has been the Reginald Jones Senior Fellow since 1992, was the Maurice Greenberg Chair and Director of Studies at the Council on Foreign Relations (1996–98), the Marcus Wallenberg Professor of International Finance Diplomacy at Georgetown University (1985–92), senior fellow at the Institute (1981–85), deputy director of the International Law Institute at Georgetown University (1979–81), deputy assistant secretary for international trade and investment policy of the US Treasury (1977–79), and director of the international tax staff at the Treasury (1974–76). Hufbauer has written numerous books on international trade, investment, and tax issues, including Figuring Out the Doha Round (2010) and US Taxation of Foreign Income (2007). Jared C. Woollacott is a candidate for the Master of Public Policy and Master of Environmental Management degrees at Duke University. He spent four years as a research analyst at the private economic consulting firm Analysis Group and has since worked at the World Trade Organization and the Peterson Institute.
Note: To be published in Springer International’s 2012 European Yearbook of International Economic Law 3 edited by Christoph Herrmann and Jorg Philipp Terhechte. Views expressed are the opinions of the authors and not their affiliated institutions.

2
IntroductIon
Sino-US trade flows have exploded in the years since the Peoples’ Republic of China (PRC or China)
made its first bid for General Agreement on Tariffs and Trade (GATT)/WTO accession in 1986. In
1985, one year before China’s accession bid, US merchandise imports and exports with the PRC were
nearly equal ($4.2 billion imported by the United States and $3.8 billion exported). As of 2009, both the
volume and imbalance of US merchandise trade with China had increased dramatically. The United States
imported $310 billion and exported $70 billion, a ratio of $4.50 of merchandise imports from China for
every dollar of exports to China. However, expressed in ratio terms, the imbalance peaked in 1999: that
year the US import-export ratio reached $6.70 of imports for every dollar of exports. Since 1999, the
ratio has declined, while the absolute dollar gap between merchandise imports and exports has widened
from $74.7 billion in 1999 to $240.0 billion in 2009 (see figure 1). Trade in services has followed a
similar pattern, but on a much smaller scale. Services trade between the countries has increased substan-
tially over the past several years and the US trade deficit has continued to widen; however, US exports and
imports of services to and from China account for only 3.6 percent of the total two-way US services trade
(see table 1).1
Each country has grown to occupy a greater portion of the other’s trade portfolio. In 2003, China
overtook Mexico as the second largest provider of US imports. Four years later, it overtook Canada as the
largest provider. The United States was China’s number one export destination through 2007, when it
was overtaken by the European Union (according to PRC-reported data).2 However, the United States is
still by far the largest single-country destination for PRC merchandise. In 2009, the United States relied
on China to supply approximately 19.3 percent of its merchandise imports, and China relied on the
United States to purchase 18.4 percent of its merchandise exports (see figure 2). In the same year, China
purchased 6.6 percent of US exports, while 7.7 percent of Chinese imports came from the United States.3
The growth in Sino-US trade has been rapid. Expressed in percentage growth terms, US
merchandise imports from China since 1984 have been impressive (21.0 percent average annual growth).
Each year over the past quarter century, China has supplied an additional $11.8 billion of imports to the
US economy on average, some 23.1 percent of US import growth over the period 1984–2009. Canada
has supplied the second largest share of import growth over this period, with an average of $6.7 billion
additional imports per year, some 13.1 percent of US import growth.4 PRC figures differ somewhat from
1. Note that the total services trade share occupied by China is not presented in table 1 for economy.
2. UN Comtrade. According to US-reported data, PRC exports to the United States were $310 billion (19.3 percent) in 2009, versus $287 billion (17.9 percent) for the EU-27.
3. UN Comtrade.
4. UN Comtrade.

3
US statistics, which is not surprising. According to PRC reported data, the United States has purchased
an annual average of $9.1 billion in additional exports from China over the 1984–2009 period, not $11.8
billion. This has supported an overall average annual growth of 18.3 percent in PRC export volume (see
table 2).
During this remarkable growth in two-way trade, the United States and China have also invested
directly in each other’s economies. This is particularly true for US investment in China. Between 2003
and 2009 US capital provided 29.0 percent of foreign direct investment (FDI) in China. However,
PRC investment in the United States has been substantially smaller: over the same period, PRC capital
supported less than one percent of US FDI inflows. Total foreign investment in each country has been,
on average, comparable: $84 billion per year in the United States and $91 billion per year in China.
Despite comparable average annual levels of FDI, the trends differ considerably. FDI into the United
States remained steady at approximately $30 billion per year over the period 2003–06, then increased
dramatically in 2007 and 2008 to $177 billion, with a slight reduction of total inflows in 2009. While
FDI entering the United States increased in a dramatic stepwise fashion, FDI entering China has declined
somewhat between 2003–04 and 2008–09 (see table 3).
The ripple effect of rapid shifts in the intensity of the economic relationship, particularly with
respect to trade flows between a developed and developing country, can create political friction. Rising
US imports from China have been much debated over the past two decades. The US trade deficit with
China was often mentioned in the United States by major news and business press during the years of the
East Asian Financial crisis (1997–99) and the years just prior to the Great Recession (2005–07). The year
2010 is shaping up as a year of considerable coverage, with the estimated number of articles mentioning
the deficit nearly as large as in 2006 and 2007, the high–water mark years (see figure 3). Meanwhile,
US public opinion has remained largely steady, with approximately half of US residents holding an
unfavorable opinion of China (see figure 4).
While deepening its bilateral trade and investment relationship with the United States over the past
25 years, China has also integrated itself more fully into the world economy and multilateral institutions.
Of the cumulated historical trade flows between China and the United States, the great majority have
been governed by the terms of the WTO legal framework. The increasing interdependence between
the United States and China, and the conflicts interdependence has sparked, make the history of the
relationship an interesting object of study. This paper pays particular attention to the 10 years of China’s
WTO membership and the bilateral trade conflicts that have occurred or are likely to occur.
We begin with a brief account of modern Sino-US economic relations in three sub-periods:
pre-GATT, GATT to PRC accession process, and the PRC accession process. We then address the trade
disputes between the United States and China that have been mediated through the WTO since China’s

4
accession in late 2001. Section 3 identifies current protectionist measures that could lead to future
conflicts and examines patterns of past conflicts that may color future Sino-US trade relations. Section 4
concludes with recommendations for how the trading partners can best cope with future conflicts.
Sketch of commercIAl hIStoryPre-GAtt
The beginning of Sino-US trade relations coincided approximately with US independence in 1783. The
opening of trade was marked by the arrival of the US ship “Empress of China” in Canton (Guangzhou)
China in 1784.5 The following 60 years, known as “The Old China Trade,” saw a substantial expansion
in Sino-US commerce. In 1839, however, Sino-US trade suffered setbacks during the First Opium War
(1839–42), which pitted China against Britain, France, and the United States. Sino-US relations were
restored by the Treaty of Wangxia in 1844, which opened several additional ports, granted the United
States most favored nation status, and established official Sino-US diplomatic relations. Trading ports
(e.g., Shanghai) and privileges (notably legalization of the opium trade) were further expanded by the
Treaty of Tianjin in 1858 following the Second Opium War (1856–60).
Fearing political obstacles that would hinder US access to the Chinese economy, Secretary
of State John Hay issued the “Open Door Notes” at the turn of the 20th century, advocating the US
position of “perfect equality of treatment” among foreign economic interests in China. A wave of Chinese
nationalism erupted shortly after, threatening all foreign economic interests in China. In 1915, Japan
encroached severely on Chinese economic sovereignty with its “21 demands” for trade and territorial
privileges. The most intrusive of these demands were resisted by China with the encouragement of the
US government. The United States supported China against Japanese aggression some years later in the
prelude to the Second World War, principally by lending money for military supplies. US aid to China,
which expanded throughout the war and the immediate postwar period, ended with the Communist
victory and founding of the Peoples’ Republic of China in 1949. Sino-US relations then deteriorated as a
casualty of the Cold War.6
GAtt to Prc Accession Process
In 1947, China and the United States signed the GATT along with 21 other countries. Three years later,
the Kuomintang nationalist government, from its perch on the island of Taiwan, withdrew China from
5. A Guide to the United States' History of Recognition, Diplomatic, and Consular Relations, by Country, since 1776: China. Retrieved May 24, 2010, from http://history.state.gov/countries/china.
6. Chronology of US-China Relations, 1784–2000. Retrieved May 24, 2010, from http://history.state.gov/countries/china/china-us-relations.
5
the GATT. In the same year, the US Congress refused to ratify the International Trade Organization,
leaving the provisional GATT to govern world trade for the following 44 years. After 1950, the Peoples’
Republic of China, under Mao Zedong, had minimal relations with the world economic system and the
United States. For its part, the United States enforced broad trade restrictions through the Coordinating
Committee for Multilateral Export Controls (CoCom), a multilateral agreement between North
Atlantic Treaty Organization (NATO) members, Australia, and Japan to control exports to China. The
CoCom embargo quashed Sino-US trade flows for nearly 30 years. The embargo started to erode in
1972 following President Nixon’s landmark visit to mainland China. The visit yielded the Shanghai
Communiqué, which vaguely committed both countries to the normalization of relations. Economic
relations began to warm thereafter, furthered by President Ford’s visit in 1975.
In 1978, Deng Xiaoping assumed leadership of a massive and remarkably successful economic
transformation, leading to a market-oriented and capitalist-flavored PRC economy. China and the
United States signed a trade relations agreement the following year, according each other most favored
nation status. The Deng leadership ushered in a period of PRC rapprochement with the international
economic community. In 1980, China occupied the erstwhile Taiwanese seat within the IMF and the
World Bank, and requested observer status within the GATT (granted in 1982). In 1983, China signed
the Multi-Fiber Agreement and in 1986 it asked to rejoin the GATT, starting a 15 year long process
toward WTO accession.7
Prc Accession Process
Chinese diplomatic efforts toward GATT membership were frustrated early on by the PRC government’s
response to the Tiananmen Square protests of 1989, which roused political resistance to China among
many WTO member states. At the time, China’s most favored nation (MFN) status with the United
States was subject to annual congressional review and approval under the Jackson-Vanik Amendment.8
This gave critics of China in the United States a regular forum to air grievances, both political (primarily
human rights and environment) and economic (notably, US job displacement). There were broader
challenges to integrating China’s external trade into the WTO legal framework as well. China’s strict
quotas, high tariffs, poor intellectual property rights, restrictions on foreign investment, and other forms
7. The Chinese Nationalist Party government in Taiwan rejoined the GATT with observer status in 1965, after withdrawing in 1950. In 1971, the China seat in the United Nations was transferred from Taiwan to the PRC government and Taiwanese observer status in the GATT was subsequently revoked. Taiwan applied to rejoin the GATT/WTO in 1990. It acceded immediately following the PRC accession under the label of the Separate Customs Territory of Taiwan, Penghu, Kinmen, and Matsu (the TPKM customs territory).
8. The Jackson-Vanik Amendment prohibited normal trade relations with nonmarket economies that restricted emigration or otherwise infringed on human rights; however, it did allow for an annual presidential waiver.
6
of market intervention all had to be reconciled with the interests of WTO members. Setting parameters
for China’s transition to WTO membership was a central challenge of the accession process, and this
challenge proved even greater since China was not granted special and differential treatment, which was
the norm for other developing country members.
China’s willingness to expose its domestic industries to foreign competition faltered during the
East Asian financial crisis of 1997–98. In 1999, however, Chinese premier Zhu Rongji emerged from
the crisis with an appealing, though domestically controversial, set of liberalization offers to the United
States and other WTO members. However, the Clinton administration, beset by scandals and unified
Republican opposition, was not then in a position to accept the Chinese offers.
Sino-US relations deteriorated in the late spring and summer of 1999. The concessions China
offered in April were summarized and published electronically by the United States Trade Representative
(USTR) without China’s consent; the summary was vehemently denied by Chinese officials, who then
proceeded to back away from prior commitments. In early May 1999, a NATO plane with an American
pilot accidentally bombed the PRC embassy in Belgrade, inciting anti-US protests and boycotts in China.
Sino-US trade negotiations recovered, however, culminating in an agreement in November 1999, just
before the controversial Seattle ministerial. A Sino-EU agreement followed six months later in May 2000.9
China had already reached agreement with many other WTO members, but the US and the EU bilateral
pacts were the most comprehensive and most difficult to conclude. After 15 years of negotiation, China
acceded to the WTO on December 11, 2001.
SIno-uS dISPuteS AdjudIcAted WIthIn the Wto frAmeWorkIntroduction
China and the United States have filed a combined total of 13 disputes against each other through the
WTO Dispute Settlement Body (DSB): eight filed by the United States and five filed by China. Ten
of the 13 cases have been filed since 2007 (table 4 summarizes the disputes). Since China’s accession in
2001, it has filed a total of seven disputes against all WTO members and the United States has filed 25.
The majority of PRC complaints have therefore been filed against the United States and a third of US
disputes (since China’s accession) have been filed against China.
This section provides an overview of the WTO disputes between China and the United States.
We then summarize the 13 Sino-US disputes, explaining the measures in question, the alleged violations
of WTO rules, and how, if at all, the disputes have been resolved.
9. See Bhala (2000) for a comprehensive review of China’s “accession saga.”

7
dispute historyOverview
Since 2002, the United States has requested consultations on eight occasions with China, the most with
any WTO member. In fact, the United States has requested consultations on more than one occasion
with only four WTO members since 2002: Canada, China, the European Communities, 10 and Mexico.
Relative to two-way merchandise trade, US requests for consultations with China were the highest among
these four members (see table 4 for a summary of all disputes involving the United States). 11 Over the
period 2002 to 2009, the United States requested 3.2 consultations for every trillion dollars of two-way
merchandise trade flow with China. By contrast, over this same period, the United States requested just
1.2 consultations for every trillion dollars of merchandise trade flow with the world.12
Since 2002, the United States has requested 25 consultations with 10 WTO members, an average of
2.5 consultations per respondent. In the same period, 18 WTO members requested 54 consultations with
the United States, an average of 3.0 consultations per complainant. China’s complaint intensity, relative
to merchandise trade with the United States, is below average for all members that lodged complaints (2.0
PRC complaints against the United States per trillion dollars of cumulative trade flow, versus an average
of 2.6 complaints).
China has only requested consultations with two WTO members: the United States (on five
occasions) and the European Communities (on two occasions). On the basis of PRC-reported merchandise
trade data, China requested 2.7 consultations for every trillion dollars of two-way merchandise trade flow
with the United States and 0.5 consultations for every trillion dollars of two-way merchandise trade flow
with the world (less than half the US complaint intensity for trade with the world; see table 5).13
Among WTO members requesting consultations with China on more than one occasion, Mexico,
with three complaints, had the highest dispute intensity of trade (36.3 complaints for every trillion dollars
in two-way merchandise trade flow). The European Communities (EC) lodged four complaints against
China, half the number lodged by the United States. With slightly higher merchandise trade flows, the
10. Prior to December 2009, the legal name of the European Union in the WTO was the European Communities.
11. The United States has a dispute resolution alternative with Canada and Mexico, the North American Free Trade Agreement (NAFTA). The NAFTA alternative biases downward the overall intensity of US trade disputes within the WTO for these two countries.
12. For the majority of WTO members with which the United States requested consultations, it did so on only one occasion. Among these members, Egypt, Turkey, the Philippines, and India had higher dispute intensities than China, calculated relative to trade. Trade flows of these countries are significantly smaller than the bilateral trade flow between the United States and the four members with multiple consultations (see table 4).
13. Merchandise trade flow data in table 4 are as reported by the United States, whereas data in table 5 are as reported by China. US and PRC trade data differ, giving different dispute intensities in table 4 and table 5.
8
EC complaint intensity with China was much lower than the US complaint intensity (1.9 versus 4.4 for
the United States using trade flows reported by China).14
The following paragraphs cover the 13 complaints lodged between the United States and China (see
table 6). Six of the eight consultations requested by the United States have been concluded. Only one of
the five consultations requested by China has been concluded. Four of the five consultations requested by
China are related to antidumping and countervailing duties measures (these measures are covered in the
next section). Where feasible, we have approximated the dollar value of the import or export flows at issue
and the share of total exports or imports connected with the partner country in the year of the dispute.
With respect to these calculations, it is worth noting that trade in 2009 was significantly dampened by the
Great Recession.
uS complaints1. Value-Added Tax on Integrated Circuits: March 2004
The United States alleged that China had been offering a partial rebate on the value-added tax (VAT) for
integrated circuits (ICs) produced or designed domestically, but discriminated against ICs designed abroad
and most ICs produced abroad.15 According to the US complaint, this not only violated national treatment
for both goods and services, but afforded preferential treatment to certain imports (i.e., those ICs designed
domestically but produced abroad), thereby violating the MFN principle.16 China and the United States
notified the WTO DSB of a settlement, in July 2004, under which China agreed to revoke the preferential
VAT treatment. In October 2004, the United States and China notified the DSB that China had complied
with the terms of the settlement and that both parties considered the dispute resolved.17
In 2004, the United States exported $2.6 billion in integrated circuits to China, 6.2 percent of the
$43.0 billion total IC exports by the United States.18
2. Measures Affecting Imports of Automobile Parts: March 2006
The United States, the European Communities, and Canada requested consultations on certain PRC
measures targeting the automobile sector in 2004 and 2005.19 The EC and US requests were lodged
14. The intensities are calculated on the basis of PRC-reported trade flows.
15. Dispute settlement number 309.
16. The European Communities, Japan, Mexico, and the TPKM customs territory requested to join the consultations. China accepted only the requests of the European Communities, Japan, and Mexico.
17. Case summaries are available on the WTO website. See Dispute Settlement: The Disputes. Retrieved June 7, 2010, from http://www.wto.org/english/tratop_e/dispu_e/find_dispu_cases_e.htm#results.
18. Data are from UN Comtrade. Integrated circuits are covered under Harmonized System (HS, 2002) code 8542, “Electronic integrated circuits and microassemblies.”
19. Dispute settlement number 340.

9
simultaneously and alleged that imports of automobile parts were subject to higher completed-vehicle
tariffs if the imported parts exceeded a given threshold, or if the parts were incorporated in a completed
vehicle with domestic parts content below a given threshold.
Canada requested consultations two weeks later, adding that China’s measures adversely impacted
foreign investment and that the application of completed-vehicle tariffs to semi-knocked-down and
completely-knocked-down (SKD and CKD) vehicle kits was inconsistent with the Working Party
Report on the Accession of China. Canada also alleged that domestic PRC automobile manufacturers
were subsidized as a consequence of domestic content and export performance thresholds, violating the
Agreement on Subsidies and Countervailing Measures (ASCM).
All three complaining parties subsequently requested to join each other’s consultations and were
accepted by China.20 A single panel was composed in October 2006.21 The panel circulated its reports in
July 2008, largely finding in favor of the complainants. The panel held that the measures implemented
with respect to auto parts in general were inconsistent with GATT Article III (national treatment) and
were not justified under Article XX(d), the defense argued by China.22 The panel also held that the
measures were inconsistent with GATT Article II since treatment of the imports did not accord with the
appropriate entries in China’s Schedule of Concessions (i.e., bound tariffs). The panel exercised “judicial
economy” and did not rule on the consistency of the measures with the Agreement on Trade-Related
Investment Measures (TRIMs). With respect to the SKD and CKD kits, the panel held that the measures
in question were consistent with the general provisions of the GATT, but were inconsistent with the
specific commitments in paragraph 93 of China’s Working Party Report.23
China appealed the panel’s findings to the appellate body with limited success. In December 2008,
the appellate body overturned the finding of the panel with respect to the treatment of SKD and CKD
kits under paragraph 93 of the Working Party Report, but upheld all other findings and affirmed the
recommendation that China should bring its measures into conformity. China stated that it would do so
by September 2009; however, the United States has yet to agree that conformity with paragraph 93 has
been reached.
20. Australia, Japan, and Mexico also requested to join the consultations. China accepted all requests.
21. Argentina, Australia, Brazil, Japan, Mexico, the TPKM customs territory, and Thailand reserved third-party rights.
22. Article XX provides for exceptions to the general provisions of GATT. Article XX(d) provides exceptions for measures “necessary to secure compliance with laws or regulations which are not inconsistent with the provisions of this Agreement…”
23. Paragraph 93 of China’s Working Party Report stipulates that if China were to create tariff lines for CKD and SKD kits, that the “rates would be no more than 10 percent.”
10
In 2006, the United States exported $0.5 billion in auto parts to China, 1.6 percent of the $33.5
billion total auto parts exports by the United States.24
3. Measures Granting Refunds, Reductions, or Exemptions from Taxes and Other Payments: February 2007
The United States alleged that certain provisions of Chinese law allowed for preferential tax treatment to
Chinese enterprises that favor domestic over imported goods.25 Preferential treatment was alleged to be
conferred by reducing monies otherwise owed to the Chinese government, thereby violating the national
treatment principle. The United States requested supplemental consultations in April 2007 following
the passage of new Chinese income tax legislation.26 In December 2007, China and the United States
informed the DSB that they had agreed to a memorandum of understanding (MOU) on the dispute. In
the MOU, China agreed to apply its revised income tax legislation in a manner consistent with its obliga-
tions under the GATT. China confirmed that the measures in question with respect to refunds, reduc-
tions, or exemptions for monies owed the Chinese government were no longer in effect and could not be
used to confer preferential treatment. China further agreed to ensure that imported equipment receives no
less favorable treatment than domestically produced equipment.27
4. Measures Affecting Trading Rights and Distribution Services for Certain Publications and Audiovisual Entertainment Products: April 2007
The United States alleged that China had implemented measures that restrict distribution rights and
market access for various audiovisual and print media.28 The United States requested supplemental consul-
tations in July 2007. The European Communities requested to join both consultations and was accepted
by China. The panel was composed in March 2008.29 In August 2009, the panel held that many, but
24. Data are from UN Comtrade. Auto parts are covered under HS (2002) code 8708, “Parts and accessories of the motor vehicles of headings 87.01 to 87.05.”
25. Dispute settlement number 358. Australia, the European Communities, Japan, and Mexico asked to join the consultations. China accepted all requests.
26. Australia, the European Communities, Japan, Mexico and Canada requested the join the supplemental consultations. China accepted all requests but Canada’s. Australia, Canada, Chile, the European Communities, Japan, the TPKM customs territory, Turkey, and subsequently Argentina, Colombia, and Egypt reserved third-party rights.
27. We are unable to give an approximate dollar value of the trade flows affected by the PRC tax rebates.
28. Dispute settlement number 363. The affected media include films for theatrical release, audiovisual home entertainment products (e.g., video cassettes and DVDs), sound recordings and publications (e.g., books, magazines, newspapers, and electronic publications), and distribution services for publications and foreign suppliers of audiovisual services (including distribution services) for audiovisual home entertainment products. The European Communities requested to join the consultations. China accepted the request.
29. The European Communities and Japan and subsequently Australia, Korea, and the TPKM customs territory reserved third-party rights.
11
not all, of the measures at issue were inconsistent with China’s Accession Protocol in that they restricted
the trading rights of other WTO members. The panel held that there was at least one other reasonably
available alternative to the implemented measures and therefore did not rule whether the measures were
permissible under the Article XX(a) exception to the general provisions of the GATT (to “protect public
morals”). With respect to the distribution services at issue, the panel ruled that China’s measures were
inconsistent with national treatment under the General Agreement on Trade in Services (GATS) and
further that measures limiting foreign investment to Chinese majority–owned joint ventures were incon-
sistent with China’s obligations under Articles XVI and XVII of GATS. With respect to the content review
of hard-copy sound recordings and restrictions on the distribution of films, the panel concluded that the
United States failed to demonstrate that the measures violated China’s obligations under the GATT.
Both countries appealed the panel decision in fall 2009. The panel’s conclusions were largely upheld
by the appellate body. The appellate body clarified that China’s Article XX(a) defense was invalid in that
the measures at issue could not be characterized as “necessary to protect public morals.” The appellate body
report was adopted by the DSB in January 2010 with the recommendation that China bring its policies
into conformity. China has yet to notify the DSB that corrective policy measures have been implemented.
In 2007, the United States exported $0.1 billion of optical media and $0.1 billion of print media to
China, 3.3 percent of the $3.3 billion total optical media and 1.6 percent of the $5.9 billion print media
exports by the United States.30 In 2007, the United States exported $0.2 billion of audiovisual and related
services to China, 1.1 percent of the $15.1 billion total audiovisual and related services exports by the
United States.31
5. Measures Affecting the Protection and Enforcement of Intellectual Property Rights: April 2007
The United States alleged that Chinese measures to protect intellectual property rights were insufficient
relative to China’s obligations under the Trade-Related aspects of Intellectual Property Rights agreement
(TRIPS). Specifically, the United States challenged Chinese policy with respect to the minimum extent of
infringement necessary to initiate a prosecution, the manner of disposing confiscated goods, and the fact
30. Data are from UN Comtrade. Optical media are covered under HS (2007) code 8523.40, “Discs, tapes, solid-state non-volatile storage devices, ‘smart cards’ and other media for the recording of sound or of other phenomena, whether or not recorded, including matrices and masters for the production of discs, but excluding products of Chapter 37 : Optical media.” The 8523.40 code did not exist prior to HS 2007. Print media are covered under HS (2007) code 49, “Printed books, newspapers, pictures and other products of the printing industry; manuscripts, typescripts and plans.” Total US optical and print media exports were $3.59 and $6.17 billion in 2008, respectively.
31. Data are from UN Service Trade. Audiovisual and related services are covered under service code 288.
12
that copyright protection did not extend to works not authorized for publication or distribution.32 The
panel was composed in December 2007.33
In January 2009 the panel circulated its report finding that China’s copyright law was inconsistent
with Articles 9.1 and 41.1 of the TRIPS agreement.34 The panel held that the United States had not
demonstrated that the customs measures were inconsistent with sentence one of Article 46 of the TRIPS
agreement;35 however, the measures were inconsistent with sentence four of Article 46 (both sentences one
and four were incorporated by Article 59).36 It further held that the United States had not demonstrated
that the criminal thresholds were inconsistent with Article 61 of the TRIPS agreement.37 The panel’s
recommendation that China bring the offending measures into conformity was issued in March 2009.
China notified the DSB that it had achieved conformity as of March 2010, and the United States
concurred one month later.38
6. Measures Affecting Financial Information Services and Foreign Suppliers: March 2008
The United States requested consultations over measures allegedly restricting the ability of foreign firms
to solicit customers and supply financial information services.39 The United States alleged that foreign
firms were required to both supply and solicit through an entity designated by the Xinhua News Agency,
and that Chinese consumers were prohibited from contracting financial information services directly
32. Dispute settlement number 362. Canada, the European Communities, Japan, and Mexico requested to join the consultations. China accepted all requests.
33. Argentina, the European Communities, Japan, Mexico, and the TPKM customs territory and subsequently Australia, Brazil, Canada, India, Korea, Thailand, and Turkey reserved third-party rights.
34. Article 9.1 of the TRIPS agreement incorporates the rights and obligations of the Berne Convention for the Protection of Literary and Artistic Works (exclusive of Article 6bis). Article 41.1 of the TRIPS agreement requires “…enforcement procedures as specified in this Part are available under their law so as to permit effective action against any act of infringement of intellectual property rights….”
35. Sentence one of Article 46 stipulates that goods “…found to be infringing be, without compensation of any sort, disposed of outside the channels of commerce in such a manner as to avoid any harm caused to the right holder, or, unless this would be contrary to existing constitutional requirements, destroyed.”
36. Sentence four of Article 46 stipulates that “…the simple removal of the trademark unlawfully affixed shall not be sufficient, other than in exceptional cases, to permit release of the goods into the channels of commerce.”
37. Article 61 of the TRIPS agreement stipulates that “…members shall provide for criminal procedures and penalties to be applied at least in cases of willful trademark counterfeiting or copyright piracy on a commercial scale. Remedies available shall…[be] sufficient to provide a deterrent…”
38. We are unable to give an approximate dollar value of the trade flows affected by the PRC intellectual property (IP) system. For summary coverage of IP issues with coarse proxies of the overall magnitude of IP infringement in China, see the US section of “US Intellectual Property-Related ” under “Sino-US Trade Measures Outside the WTO Framework” below.
39. Dispute settlement number 373. The European Communities requested to join the consultations. China accepted the request.
13
from foreign suppliers. The United States claimed that Xinhua designated only one agent through which
foreign firms could do business, a subsidiary of Xinhua, and that foreign firms were required to provide
extensive information, including confidential customer information, to the Chinese Foreign Information
Administration Center, another entity within the Xinhua framework. Finally, the United States alleged
that the Chinese government was preventing foreign financial information services providers from estab-
lishing a substantive commercial presence within China.
Nine months after the US request for consultation, China and the United States reached agreement
under an MOU. The MOU included a Chinese commitment to establish a new regulator of financial
information services without a commercial interest on the part of Xinhua; in other words, a regulator
no longer within the Xinhua framework. The MOU stipulated that the new regulator could request
“only information that is relevant to matters under the license,” taking “all necessary steps to protect the
information provided” and to “only use such information for the specific regulatory purpose for which
it is provided.”40 China agreed to revise its licensing process to ensure conformity with paragraph 308
of its WTO Accession Protocol Working Party Report, which states “that China's licensing procedures
and conditions would not act as barriers to market access and would not be more trade restrictive than
necessary.” China further agreed not to impose any intermediation requirements on foreign suppliers and
to allow consumers to contract financial information services freely and directly.
In 2007, the United States exported $0.9 billion of financial services to China, 1.6 percent of the
$58.3 billion total financial services exports by the United States.41
7. Grants, Loans, and Other Incentives: December 2008
The United States alleged that grants, loans, and other incentives being offered to Chinese enterprises
that meet certain export criteria violated Article 3 of the ASCM.42 The United States also alleged that
the measures were potentially inconsistent with Articles 3, 9, and 10 of the Agreement on Agriculture,
40. The text of the MOU is available online. Retrieved July 23, 2010, from http://www.wto.org/english/tratop_e/dispu_e/cases_e/ds373_e.htm (follow the “all documents” link at right).
41. Data are from UN Service Trade. Financial services are covered under service code 260. Data on financial services exports to China are not available for 2008 from UN Service Trade.
42. Dispute settlement number 387. Article 3 of the ASCM prohibits subsidies contingent upon export performance and the use of domestic over imported goods. Canada, the European Communities, Mexico, and Turkey, subsequently Australia and Colombia, and subsequently Ecuador, Guatemala, and New Zealand requested to join the consultations. China accepted all requests.
14
with Article III of the GATT, and with sections 5, 8, and 11 of Part I of China’s Accession Protocol.43 No
further action has been taken on the case to date.44
8. Measures Related to the Exportation of Various Raw Materials: June 2009
The United States requested consultation over some 32 measures it identified as restricting Chinese
exports of raw materials.45 The United States also suggested that additional unpublished restrictive
measures might also be in force. The United States argued that such measures are inconsistent with
Articles VIII, X, and XI of the GATT and several paragraphs of Part I of China’s Accession Protocol.46 A
single panel was composed in March 2010.47
In 2008, the United States imported $1.7 billion of the raw materials at issue from China, 46.4
percent of the $3.6 billion total US imports of the raw materials at issue. However, in 2009 the United
States imported only $0.1 billion of the raw materials at issue from China.48
chinese complaints1. Safeguard Duties Imposed on Imports of Certain Steel Products: March 2002
China alleged that certain definitive safeguard measures taken by the United States that increased the
import duties on various steel products were unjustified.49 In all, eight WTO members submitted
43. Agreement on Agriculture Article 3, “Incorporation of Concessions and Commitments,” Article 9, “Export Subsidy Commitments,” and Article 10, “Prevention of Circumvention of Export Subsidy Commitments.” GATT Article III, “National Treatment on Internal Taxation and Regulation.” Part I of China’s Accession Protocol: Section 5, “Right to Trade,” Section 8, “Import and Export Licensing,” and Section 11, “Taxes and Charges Levied on Imports and Exports.” Canada, the European Communities, Mexico, and Turkey and subsequently Australia and Colombia and finally Ecuador, Guatemala, and New Zealand requested to join the consultations. China accepted all requests.
44. We are unable to give an approximate dollar value of trade flows affected by the PRC incentive system.
45. Dispute settlement number 394. The raw materials at issue were bauxite, coke, fluorspar, magnesium, manganese, silicon carbide, silicon metal, yellow phosphorus, and zinc.
46. GATT Article VIII, “Fees and Formalities connected with Importation and Exportation,” Article X, “Publication and Administration of Trade Regulations,” and Article XI, “General Elimination of Quantitative Restrictions.”
47. The European Communities and subsequently Canada, Mexico, and Turkey requested to join the consultations. China accepted all requests. Argentina, Brazil, Canada, Chile, Colombia, Ecuador, the European Union, India, Japan, Korea, Mexico, Norway, the TPKM customs territory, and Turkey and subsequently Saudi Arabia reserved third-party rights.
48. Trade in 2009 was adversely affected by the Great Recession, as well as PRC export restrictions. Data are from UN Comtrade. The identified raw materials are covered under HS (2007) codes: 2606, aluminum ores and concentrates; 2704, coke and semicoke of coal, of lignite, or of peat; 2529.21 fluorspar; 8104, magnesium and articles thereof, including waste and scrap; 2602, manganese ores and concentrates; 2849.20, carbides of silicon, whether or not chemically defined; 2804.61, silicon; 2804.70, phosphorus; 2608, zinc ores and concentrates.
49. Dispute settlement number 252. China identified the following steel products in its request for consultation: “flat steel, hot-rolled bar, cold-finished bar, rebar, certain welded tubular products, carbon and alloy fittings, stainless steel bar, stainless steel rod, tin mill products and stainless steel wire.” China’s request for consultation is available online. Retrieved

15
independent requests for consultation regarding these measures.50 The DSB composed a single panel for
all eight requests in July 2002.51
The panel published its reports in July 2003, holding that the United States had not justified
the measures at issue by showing the prerequisite conditions for the imposition of safeguards (namely,
unforeseen developments, increased imports, causation, and parallelism).52 The United States appealed
the decision one month later. In November 2003, the appellate body upheld the conclusions that the
10 measures at issue were inconsistent with US obligations under the GATT; however, for two of the
measures, it reversed the finding that the United States had not demonstrated a causal link. This reversal
did not, however, change the ultimate finding that the measures were inconsistent with US obligations
under the GATT. In December 2003, the United States informed the DSB that President Bush had
issued an order repealing all of the safeguard measures. During the period of the dispute, China imposed
a safeguard measure on US steel, which was abolished in December 2003 following President Bush’s
repeal order.
In 2002, the United States imported $0.3 billion of steel products from China, 2.2 percent of the
$12.4 billion total US steel imports, and 10.4 percent of total PRC steel products exports.53
2. Antidumping Duties Imposed on Coated Free-Sheet Paper from China: September 2007
China alleged that the International Trade Administration (ITA), a unit of the US Department of
Commerce, had wrongly entered a finding of dumping for Chinese, Korean (Republic of ), and Indonesian
manufacturers of coated, free-sheet paper.54 China alleged that the ITA finding was inconsistent with
July 23, 2010, from http://www.wto.org/english/tratop_e/dispu_e/cases_e/ds252_e.htm (follow the “all documents” link at right).
50. Brazil, China, the European Communities, Japan, Korea, New Zealand, Norway, and Switzerland filed independent requests. Japan and New Zealand also requested to join the consultations. The United States accepted all requests. Many of these members joined each other’s consultations. China joined the consultations of Brazil, the European Communities, and New Zealand.
51. Canada, the TPKM customs territory, Cuba, Malaysia, Mexico, Thailand, Turkey, and Venezuela reserved third-party rights.
52. Despite having a single panel, the United States requested that the panel issue eight individual reports so as not to jeopardize its right to settle the claims independently with each member. The panel complied, issuing “one document constituting eight Panel Reports,” each of which is particularized to the individual complainants in its conclusions and recommendations, but not in its findings.
53. Steel products are covered under HS (2002) code 72, “Iron and Steel.” Data are from UN Comtrade. US and PRC reports of steel trade flows nearly agree. In 2002, China reported $0.24 billion of steel exports to the United States, not $0.27 billion. The PRC amounts are used to calculate the percent of total PRC steel exports purchased by the United States.
54. Dispute settlement number 368.

16
US obligations under GATT Article VI, the ASCM Articles 1, 2, 10, 14, 17, and 32, and Antidumping
Agreement Articles 1, 2, 7, 9, and 18.55 No further action has been taken on this case to date.
In 2007, the United States imported $0.4 billion of coated, free-sheet paper from China, 10.7
percent of the $3.4 billion total US imports of coated, free-sheet paper, and 19.0 percent of the $1.5
billion total PRC coated, free-sheet paper exports.56
3. Antidumping Duties Imposed on Certain Products from China: September 2008
China challenged the US identification of several instances of dumping by the International Trade
Administration.57 The determinations were made with respect to steel, off-the-road tires, light-walled
rectangular pipe and tube, and laminated woven sacks. China alleged violations of GATT Articles I and
VI; ASCM Articles 1, 2, 10, 12, 13, 14, 19, and 32; Antidumping Agreement Articles 1, 2, 6, 9, and 18;
and Article 15 of China’s Accession Protocol.58 A panel was composed in March 2009.59 The panel has yet
to issue any findings. The trade flows of the four products are summarized in table 7.60
55. GATT Article VI, “Antidumping and Countervailing Duties;” ASCM Article 1,“Definition of a Subsidy,” Article 2, “Specificity,” Article 7, “Remedies,” Article 9, “Consultations and Authorized Remedies,” and Article 18, “Undertakings;” Antidumping Agreement Article 1, “Principles,” Article 2, “Determination of Dumping,” Article 7, “Provisional Measures,” Article 9 “Imposition and Collection of Antidumping Duties,” and Article 18 “Final Provisions.”
56. Coated, free-sheet paper is covered under HS (2007) code 4810, paper and paperboard, coated on one or both sides. US and PRC reports of free-sheet paper trade flows do not agree. In 2007, China reported $0.29 billion of free-sheet paper exports to the United States, lower than the US import figure of $0.36 billion. The PRC amounts are used to calculate the percent of total PRC free-sheet paper exports purchased by the United States.
57. Dispute settlement number 379.
58. GATT Article I, “General Most Favored Nation Treatment,” and Article VI, “Antidumping and Countervailing Duties;” ASCM Article 1, “Definition of a Subsidy,” Article 2, “Specificity,” Article 10, “Application of Article VI of GATT 1994,” Article 12, “Evidence,” Article 13, “Consultations,” Article 14, “Calculation of the Amount of a Subsidy in Terms of the Benefit to the Recipient,” Article 19 “Imposition and Collection of Countervailing Duties,” and Article 32 “Other Final Provisions;” China’s Accession Protocol Article 15, “Price Comparability in Determining Subsidies and Dumping.”
59. Argentina, Australia, Bahrain, Canada, the European Communities, Kuwait, Saudi Arabia, and Turkey reserved third-party rights.
60. The PRC complaint identified the following products: “Circular Welded Carbon Quality Steel Pipe,” covered under HS (2007) code 7306.19, “Other tubes, pipes and hollow profiles…of iron or steel: other;” “Off-the-Road Tires,” covered under HS (2007) code 4011, “New pneumatic tires, of rubber;” “Light-Walled Rectangular Pipe and Tube,” covered under HS (2007) code 7306.61, “Other tubes, pipes and hollow profiles of iron or steel...of square or rectangular cross section;” and “Laminated Woven Sacks,” covered under HS (2007) code 6305.33, “Sacks and bags, of a kind used for the packing of goods: other, of polyethylene or polypropylene strip.” Off-the-road tires were identified by the ITA report as falling under the US Harmonized Tariff System (HTS) headings: 4011.20.10.25, 4011.20.10.35, 4011.20.50.30, 4011.20.50.50, 4011.61.00.00, 4011.62.00.00, 4011.63.00.00, 4011.69.00.00, 4011.92.00.00, 4011.93.40.00, 4011.93.80.00, 4011.94.40.00, and 4011.94.80.00. See ITA Fact Sheet. Retrieved July 23, 2010, from http://ia.ita.doc.gov/download/factsheets/factsheet-prc-tires-prelim-020608.pdf. The PRC complaint is available online. Retrieved July 23, 2010, from http://www.wto.org/english/tratop_e/dispu_e/cases_e/ds379_e.htm (follow “all documents” link at right).

17
4. Measures Affecting Imports of Poultry from China: April 2009
China alleged that the effective ban on any imports of Chinese poultry by the Omnibus Appropriations
Act of 2009 (Public Law 111-8) was an unjustified sanitary and phytosanitary measure.61 The House of
Representatives’ Appropriations Committee cited concerns about contaminated foods from China when
writing the ban. China alleged that the measures in the Appropriations Act violated GATT Articles I and
XI and the Agriculture Agreement Article 4.62 China also alleged that the measures violate various provi-
sions of the Sanitary and Phytosanitary Standards (SPS) Agreement. Subsequently, the US Appropriations
Act for 2010 was revised so as not to include an outright ban on Chinese poultry; rather it provides funds
to establish sanitary and phytosanitary standards for imported Chinese poultry products. A panel was
composed in September 2009.63 The panel has yet to circulate its report.
Neither the United States nor China reported any US imports of chicken products from China in
2008 or 2009. In 2009, the United States imported $0.2 billion total and China exported $0.3 billion
total of chicken products.64
5. Safeguard Duties Imposed on Certain Tires from China: September 2009
China objected to the imposition of safeguard tariffs imposed by the Obama administration in September
2009.65 The tariffs followed the finding of a threat of “market disruption” in the US tire market by the
US International Trade Commission (ITC). The tire products identified in this case were fewer than, and
distinct from, those identified in the dispute China brought in September 2008 (case 3 above).66 The
safeguard was imposed as a three-year descending tariff. China argues that a safeguard is not justified by
the conditions of the US industry and that the measures imposed are both more restrictive and longer
lived than would be necessary to remedy any potential damage from increased Chinese imports. A panel
was composed in March 2010.67 It has yet to issue its report.
61. Dispute settlement number 392.
62. GATT Article I, “General Most Favored Nation Treatment,” and Article XI, “General Elimination of Quantitative Restrictions.” Agriculture Agreement Article 4, “Market Access.”
63. The European Communities, Guatemala, Korea, and Turkey and subsequently, Brazil and the TPKM customs territory reserved third-party rights.
64. Data are from UN Comtrade. Chicken products are covered under HS (2007) codes: 0207, “meat and edible offal, of the poultry heading 0105, fresh, chilled or frozen;” 0105.11, “Live poultry of the following kinds: Chickens.”
65. Dispute settlement number 399.
66. The US ITC identified the following US HTS codes in its finding: 4011.10.10, 4011.10.50, 4011.20.10, and 4011.20.50. The investigation (Number TA-421-7) report is available online. Retrieved July 23, 2010, from http://www.usitc.gov/publications/safeguards/pub4085.pdf
67. The European Union (formerly the European Communities), Japan, the TPKM customs territory, Turkey, and Vietnam reserved third-party rights in January 2010.
18
In 2009, the United States imported $1.9 billion of tires from China, 26.1 percent of the $7.3
billion total US tire imports and 27.7 percent of the $6.7 billion total PRC tire exports.68
Other Consultations Joined by China
In addition to requesting consultations with the United States on eight occasions, China has also joined
other members’ consultations with the United States. In 2004 and 2006, Thailand sought consulta-
tions with the United States the use of the controversial “zeroing” practice in determining whether
Thai exporters were dumping shrimp in the US market.69 (In antidumping investigations, the United
States maintains a practice of not counting, or zeroing, imports when prices are above fair value.) The
dispute panel upheld Thailand’s claims that the US practice of zeroing with respect to Thai shrimp was
inconsistent with the Antidumping Agreement. The decision was appealed by both parties; however,
the appellate body upheld the panel’s findings. Although the United States notified the DSB that it has
reached conformity in April 2009, Thailand has yet to agree.
In 2006, China also joined India’s consultations with the United States over the enhanced
bond requirements on US imports of shrimp from India as implemented under the Amended Bond
Directive (ABD).70 While the panel did not find the ABD itself in violation of US obligations under
the Antidumping Agreement, it did find that the US application of the law in the case of shrimp from
India was inconsistent with US obligations under the ASCM and Antidumping Agreement. Both parties
appealed the findings, but they were upheld by the appellate body. In April 2009, the United States
informed the DSB that it had reached conformity. India informed the DSB that it would need to wait to
observe how the modifications made by the United States would be practiced.
SIno-uS trAde meASureS outSIde the Wto frAmeWorkAdministrative law remediesOverview of WTO Codes
WTO law provides for several administrative law remedies that members can pursue independently when
they believe other WTO members are maintaining trade practices that are inconsistent with the obliga-
68. US and PRC reports of tire trade flows nearly agree. In 2009, China reported $1.86 billion of tire exports to the United States, not $1.89 billion. The PRC amounts are used to calculate the percent of total PRC tire exports purchased by the United States. Data are from UN Comtrade. Tires are covered under HS (2007) codes 4011.10, “New pneumatic tires, of rubber: of a kind used on motor cars,” and 4011.20, “New pneumatic tires, of rubber: of a kind used on buses or trucks.”
69. Japan and Brazil, subsequently the European Communities, and subsequently, with China, India requested to join the consultations with the United States in the 2004 episode (dispute number 324). No requests were accepted. In the 2006 consultations (dispute number 343), India, subsequently Japan, and subsequently Brazil requested to join the consultations. The United States accepted all requests but Japan’s.
70. Brazil and Thailand also requested to join India’s consultations (dispute number 345). The United States accepted all requests.
19
tions of WTO law. The sections below will discuss how the United States and China have utilized their
rights and obligations under the various agreements to implement trade remedies. Of course, the trade
remedies taken under these agreements have often been contested by other members. First we provide
some background on the agreements.
The Agreement on Subsidies and Countervailing Measures (ASCM) provides a framework by which
members can identify subsidies of various types provided by other members that are inconsistent with
WTO obligations. The agreement provides substantive and procedural requirements that must be met by
a member in order to implement a countervailing measure on an identified subsidy. In addition to finding
a subsidy, the member must show that the imports in question are causing, or threaten to cause, material
injury to a domestic industry. Countervailing duties (CVDs) can be implemented for a maximum initial
term of five years; after that, the CVDs must be reviewed. The ASCM provides for special and differential
treatment for developing countries.
The Antidumping Agreement (ADA) provides another mechanism through which countries may
seek relief from unfair trade practices of foreign firms. Dumping occurs when firms sell products at prices
below their “normal value” in an attempt to capture a larger market share in the importing country. To
justify the implementation of an antidumping duty, members must both show that a product is being
sold below its normal value and that these sales are causing material injury to a domestic industry.
Antidumping duties, like CVDs, can be implemented for a maximum initial term of five years before they
must be reviewed.
Safeguard measures allow for the implementation of duties in circumstances where, without any
behavior inconsistent with WTO obligations by members, another member determines that imports are
rising so rapidly, relatively or absolutely, as to cause or threaten to cause serious injury to the domestic
industry. The Agreement on Safeguards also prohibits “grey area” measures, such as voluntary export
restraints. As with the ASCM and ADA, the Agreement on Safeguards sets out procedures by which a
government many authorize a safeguard measure. Unlike the ASCM and ADA, safeguard measures are
to be implemented for an initial period of only four years, with the possibility of extension. Safeguard
measures are, in principle, general measures, although some allowance for differential trade restrictions
against other members is allowed. Another key difference is that the exporting country has the right
to seek compensation for the safeguard measure implemented against it. Barring an agreement on
compensation, the affected member may retaliate.
The Agreement on Trade-Related Aspects of Intellectual Property Rights (TRIPS) establishes a
minimum standard of intellectual property rights (IPRs) protections that members must uphold. The
agreement covers seven substantive areas: copyright and related rights; trademarks and service marks;
geographical indications and appellations of origin; industrial designs; patents, including genetically
modified organisms; the layout designs of integrated circuits; and trade secrets and test data. The
20
agreement incorporates the standards set out by the Paris and Berne conventions, which are administered
by the World Intellectual Property Organization (WIPO). While the TRIPS Agreement does not
specifically authorize retaliatory measures by member countries, the United States engages in “self-help,”
under section 337, to confiscate counterfeit imports and address other intellectual property violations.
Many of these cases are against China, as detailed below.
uS measures
Four types of US trade remedy measures are intended to offset foreign trade practices that are determined
by national authorities to harm domestic firms. While the WTO framework contemplates remedial
action, the remedies are applied by national trade authorities. The manner of application may be later
deemed by the WTO Dispute Settlement Body to be inconsistent with WTO law. The four measures
discussed below relate to: dumping; subsidies and other government support; rapid rises in import
volumes; and intellectual property rights.
Antidumping (AD) and countervailing duty determinations under US law follow proceedings
outlined by section 731 of the Tariff Act of 1930, as amended. The imposition of duties is authorized
either by section 701 (AD) or section 303 (CVDs) of the Tariff Act of 1930 (the Smoot-Hawley Tariff
Act) or section 753 of the act, so-called “black hole” cases where no prior injury determination has
been made. Cases begin with petitions by domestic firms that believe they are being injured by foreign
subsidies or dumping activity. The petitioner decides whether to seek a trade remedy in the form of
antidumping duty (ADD) or countervailing duty (CVD) remedies, or perhaps both. The International
Trade Administration (ITA), a division of the Department of Commerce, and the International Trade
Commission (ITC), an independent body, investigate different aspects of the case. The ITA examines
trade and production data to determine whether export sales are made at “less than fair value” in a
dumping case (“normal value” in WTO parlance), or whether they are subsidized in a countervailing
duty case. The ITC determines whether the exports sales in question cause or threaten material injury to
the domestic industry. If the ITA and the ITC both make affirmative findings, then penalty duties are
imposed. Duties are typically imposed for a period of five years followed by a sunset review to determine
whether to continue the duty for a further period. Both countervailing and antidumping duties are
recognized as valid trade remedies under the GATT. However, the investigations leading to the duties are
often challenged.
WTO members may also impose safeguard measures when imports of a certain product are rising so
rapidly (absolutely or relatively) as to cause or threaten to cause serious injury to the member’s domestic
industry. In the United States, safeguard cases are investigated by the ITC pursuant to section 201 of the
Trade Act of 1974 (section 203 for safeguard review cases). If it makes a positive finding, the ITC issues a
recommendation to the president, who must then decide whether to take action.
21
Under section 421 of the Trade Act of 1974, the ITC can also recommend China-specific safeguards
if imports cause or threaten material injury. These investigations follow slightly different procedures.
China’s Protocol of Accession to the WTO allows section 421 safeguard actions until 2013.
Under US law, trade remedies related to IPR violations are sought through proceedings authorized
by section 337 of the Tariff Act of 1930. Section 337 cases are investigated by the ITC.
US Antidumping Actions Against China
Since China joined the WTO, the United States has conducted 71 AD investigations against PRC
exporters, covering 83 product sectors.71 The United States has imposed antidumping duties in 86
percent, or 61 of the 71 AD investigations. Among targets outside of China, 77 percent of investiga-
tions led to the imposition of duties. China is by far the most frequent target of AD investigations, and
Korea (Republic of ) is second, with just 9 cases. In fact, PRC firms were the target in 40 percent of US
cases leading to AD duties (see table 8). Sectors that are prominently subject to AD investigations are oil
country tubular goods and paper and paperboard.72 China has challenged just three of the antidumping
duties through WTO proceedings (discussed above).
US antidumping remedies have been applied to a significant volume of Sino-US trade.
Antidumping measures covered an average of 6.5 percent of US imports from China by dollar volume
(see table 9). The highest antidumping duty import coverage during the period 2002 to 2009 (16.5
percent average) is in the stone, glass, and metals categories (HS categories 68 through 83), followed by
chemicals and mineral products (12.4 percent; HS categories 25 through 38).
US Countervailing Duty Actions Against China
Countervailing duty investigations have been less frequent than AD cases over the past decade. The
United States has investigated 50 CVD cases and 192 AD cases worldwide in the years since China’s
WTO accession. Of the 50 CVD cases, the United States imposed duties in 35 instances. Again, the
United States has imposed countervailing duties most frequently by far on PRC exporters (21 instances
out of 25 investigations). India is a distant second with five instances of imposed duties out of nine inves-
tigations (see table 10).
71. Data are from Bown (2010b). Sectors are counted at the four-digit HS code level. Note that goods are cited in AD investigations at the six and eight digit level. Where multiple sub-classified products within a four-digit code are cited by a given case, the 4-digit parent code is counted only once.
72. The HS (2007) four-digit codes were 7306, 7304 (oil country tubular goods), and 4811 (paper and paperboard). Code 7306 was cited by seven cases, codes 7304 and 4811 were cited by four cases. China disputed one of the paper cases through the WTO DSB in September 2007.
22
US countervailing duties have covered an average of 1.5 percent of imports from China by dollar
volume over the period 2002–09 (see table 11). Countervailing duties have impacted the stone, glass, and
metals industries (HS codes 68 through 83) to the greatest extent (6.4 percent), followed by the plastics,
rubbers, and wood industries (4.2 percent; HS codes 39 through 49).
US Safeguard Actions Against China
Since 2001, the United States has implemented only one global safeguard. The Bush administration
implemented the safeguard following the ITC’s affirmative finding of injury to US steel manufacturers
in 2002. The measure was subsequently challenged in the WTO by several WTO members, including
China, and ruled inconsistent (see case 1 under Chinese Complaints above). The United States subse-
quently dropped the safeguard measures.
In the same time period, the ITC has conducted seven China-specific safeguard investigations under
section 421, finding affirmatively in five instances. In only one case, PRC tire imports, was action taken
by the president, under the Obama administration in 2009. China subsequently brought the case to the
WTO DSB where it remains open (see Chinese Complaints, number 5 above).
US Intellectual Property-Related Actions Against China
Between January 2002 and June 2010, 255 investigations were initiated, 43 of which remain pending.
China was by far the most frequently cited respondent in these investigations (104 investigations),
followed by Taiwan (60), Japan (48), and the Republic of Korea (36). PRC respondents were cited in
40.8 percent of the investigations initiated since 2002. Of these 104 investigations of PRC respondents,
21 remain pending. Of the 83 completed investigations involving a PRC respondent, in 26 cases (31.3
percent) the ITC issued a finding of violation or a cease and desist order (see table 12).
These investigations address only a small fraction of losses allegedly caused by IP infringement.
As discussed above (case 5 under US Complaints), the United States has also attempted to redress IP
violations through the WTO DSB. However, the total losses from intellectual property violations faced
by US firms are extremely difficult to measure. Guesstimates are plagued by poor data, and rely on
dicey assumptions. A recent US Government Accountability Office (GAO) report indicated that many
unsubstantiated estimates of the cost of IPR violations are widely cited even though it is “difficult, if not
impossible, to quantify the net effect of counterfeiting and piracy on the economy as a whole.”73 However,
some proxy measures indicate the relative magnitude of IPR offenses in China, relative to other countries.
For example, in 2009, 79 percent ($205 million) of the total dollar value of goods seized by US Customs
73. Government Accountability Office Washington, DC. (April 2010). Intellectual Property—Observations on Efforts to Quantify the Economic Effects of Counterfeit and Pirated Goods (GAO-10-423), p. 16.

23
and Border Protection (CBP) for IPR violations were from China. Another 10 percent ($27 million) were
from Hong Kong and 1 percent ($3 million) from India.74 Seizures of PRC goods were disproportionate
to its share of US merchandise imports (19.3 percent) by a factor of four.75 The US CBP seized $1 in
goods for every $1,874 worth of goods imported from China and $1 of goods for every $1,174 imported
from Hong Kong. In a recent study by the Organization for Economic Cooperation and Development
(OECD), Hong Kong was identified as the leading source of global counterfeited goods trade relative
to the volume of exports.76 The study placed China as the 15th highest source of counterfeited goods
relative to the volume of exports. The OECD also estimated that the maximum amount of global trade
in counterfeited and pirated goods was $250 billion in 2007. This amount, however, does not include
IP-infringing goods that do not cross borders.
The PRC government has handled an increasing number of IPR infringement disputes over the past
15 years. IPR holders that suspect violations in China typically seek recourse through an administrative
process that is not used in other countries. The process does not award damages to the plaintiff, but
can fine the defendant. Although the great majority of IP infringement complainants are pursued via
administrative procedures, IPR violations are also litigated in the PRC courts, and the number of cases
has grown considerably over the past 15 years. The number of cases filed in PRC courts in 2006 was four
times the average annual number of cases filed in the mid-1990s.77 According to sampling conducted
by Sepetys and Cox (2009), the vast majority of cases are filed in lower-level courts and more cases are
filed by China-based plaintiffs (38 percent) than US plaintiffs (26 percent). Japan and France filed 9
percent of the sampled cases each. However, the share of cases filed is not proportionate to the number
of patents held by firms in these countries. While US firms held 18.7 percent of valid foreign-origin
patents in China in 2008, Japanese firms held 43.0 percent, and French firms held 3.7 percent.78 The
highest damage awards for these cases, based on the Sepetys and Cox (2009) sample, were for plaintiffs
headquartered in China (top 3 awards) and Japan (fourth and fifth largest awards). Ninety percent of the
awards were for $100,000 or less and most awards were a small fraction of the damages claimed.79
74. US Customs and Border Protection “Top IPR Seizures 2009.” Retrieved July 26, 2010, from http://www.cbp.gov/linkhandler/cgov/trade/priority_trade/ipr/pubs/seizure/fy09_stats.ctt/fy09_stats.pdf.
75. UN Comtrade.
76. OECD (2009), Magnitude of Counterfeiting and Piracy of Tangible Products: An Update, OECD, Paris. Retrieved July 26, 2010, from http://www.oecd.org/dataoecd/57/27/44088872.pdf.
77. Sepetys, K., and Cox, A. (2009). Intellectual Property Rights Protection in China: Trends in Litigation and Economic Damages: National Economic Research Association, Inc., p. 8.
78. State Intellectual Property Organization (SIPO) of the People’s Republic of China, 2008 Annual Report. Available online at: http://www.sipo.gov.cn/sipo_English/laws/annualreports/.
79. Sepetys and Cox (2009), pp. 8, 11 (table 6), and 13 (table 10).

24
Prc measures
Trade remedies under PRC law are governed chiefly by the Foreign Trade Law of the PRC. Foreign
Trade Remedies, an article within this law, deals specifically with countervailing duties and antidumping
duties. PRC trade remedy law was further articulated in 1997 with the Antidumping and Antisubsidy
Regulations. To comply with its WTO accession protocol, China revised its trade remedy rules effective
January 2002 by separating antidumping and antisubsidy measures, giving each distinct regulations. Until
2003, PRC trade remedy proceedings were administered by the Ministry of Foreign Trade and Economic
Cooperation (MOFTEC) and the State Economics and Trade Commission (SETC). China’s Ministry of
Commerce (MOFCOM) subsumed both MOFTEC and the SETC in March 2003, and antidumping
and antisubsidy measures were revised once more in mid-2004. MOFCOM generally initiates inves-
tigations in response to a petition from the domestic industry; however, in exceptional circumstances
MOFCOM may initiate its own investigation. Antidumping and antisubsidy duties are initially imposed
for a period of five years; a sunset review then determines whether they should be extended.80
MOFCOM also administers proceedings for safeguard measures under Decree Number 330.
The decree initially promulgated the regulations in November 2001, just prior to PRC accession to the
WTO. It was subsequently revised in 2004, placing safeguards under the newly created MOFCOM and
modifying some of the language in the decree. Similar to antidumping and antisubsidy investigations,
MOFCOM may initiate safeguard investigations independently.81
PRC Antidumping Duty Actions Against the United States
In the period since its accession to the WTO, China initiated 24 AD investigations against the United
States covering 24 product sectors.82 China imposed AD duties in 22 of these cases. China imposed a
similar number of AD duties on Japan (22) and the Republic of Korea (20); however, the investigations
of US exporters had the highest yield (92 percent of investigations led to imposed duties). Among targets
not including the United States, 83 percent of PRC AD investigations led to the imposition of AD duties
(see table 13; for duty coverage, see table 14). The sectors cited by the most PRC cases were those related
80. Choi and Gao (2006).
81. China Safeguard Measures Regulations (Revised). Retrieved September 27, 2010, from http://tradeinservices.mofcom.gov.cn/en/b/2004-03-31/27907.shtml.
82. Data are from Bown (2010b). Sectors are counted at the four-digit HS code level. Note that goods are cited in AD investigations at the six- and eight-digit level. Where multiple subclassified products within a four-digit code are cited by a given case, the four-digit parent code is counted only once.
25
to hydrocarbons, phenols, polyamides, synthetic rubber, and uncoated paper.83 The United States has not
challenged any of the AD duties imposed by China in WTO proceedings.
PRC Countervailing Duty Actions Against the United States
China has used almost exclusively AD actions to protect its industries from foreign competition. In the
period since it acceded to the WTO, China has investigated only three CVD cases and imposed duties in
two. All three cases were launched in 2009. China investigated US exports of steel and chicken products,
both of which led to the imposition of duties. China also investigated certain cars, but MOFCOM has
yet to issue a final determination.
PRC Safeguard Actions Against the United States
China has imposed only one safeguard measure, on steel in 2002, following the US steel safeguard
(disputed in the WTO, see the first case under Chinese Complaints above). The China safeguard was
revoked in December 2003 when the United States removed its own steel safeguard duties.
legislative measures
This section covers instances of protectionism embedded within recent PRC and US proposed or imple-
mented legislation. None of the measures has yet landed on the doorstep of the WTO. The measures
discussed here are identified primarily from the Global Trade Alert (GTA) project, supplemented with
additional research.84 We cover six US measures and five PRC measures (see table 15). All these measures
have been proposed or implemented within the past two years. The majority of the US measures arose
in response to the Great Recession of 2008–09, whereas the PRC measures appear to be more broadly
motivated. Where possible, we approximate the dollar value of the affected import or export market and
the share of the total export or import market occupied by the trading partner in the year of the dispute.
Again, it is important to note that trade in 2009 was significantly impacted by the Great Recession, so the
reported trade values are depressed.
uS legislative measures1. Support for GMAC, General Motors and Chrysler: December 2008–December 2009
In November 2008, US auto industry executives appeared before a congressional hearing and requested
$25 billion in public aid. Just prior to this hearing, European Commission President Barroso warned
83. The HS (2007) four-digit codes were 2903 (hydrocarbons), 2907 (phenols), 3908 (polyamides), 4002 (synthetic rubber), and 4804 (uncoated paper). Each was cited in two AD investigations.
84. See www.globaltradealert.org. Measures addressed in this paper are those that, according to the GTA, have been proposed or implemented and, if enacted, “almost certainly” discriminate against foreign commercial interests.
26
of potential WTO action against US subsidies to domestic automakers. However, in mid-December
2008, President Bush authorized $17.4 billion in loans to GM and Chrysler, half of what the industry
ultimately requested, but on terms far more favorable than commercially available at the time. The
stimulus package offered automakers additional support with electric-drive vehicle and battery technology
provisions that contained “Buy American” requirements.
In May 2009, the Treasury Department purchased a $7.5 billion stake in GMAC, LLC (formerly
known as, General Motors Acceptance Corp.). In its May 21 press release, the Treasury Department
indicated that $4 billion of the investment was intended to “support GMAC’s ability to originate
new loans to Chrysler dealers and consumers and help address GMAC’s capital needs.”85 The Treasury
Department also declared its intention to convert $884 million in convertible GM securities to GMAC
common equity, giving it a 35.4 percent stake in GMAC common equity. In December 2009, the
Treasury Department expanded its investment in GMAC, adding an additional $3.8 billion in total
capital. Following the December transactions, the Treasury had $14.1 billion in capital invested in
GMAC, holding 56 percent of its common equity.86
Following the 2009 bankruptcy filings by Chrysler (April) and GM (June), coupled with additional
government financing in the context of both proceedings, the US House of Representatives passed a
provision that would have limited new cars eligible for purchase incentives to those produced by the “big
three” US auto firms. However, this provision was eliminated in the September 2009 reconciliation with
the Senate.
In March 2009, the US and Canadian governments invested nearly $40 billion in General Motors
in exchange for debt, preferred stock, and 72 percent of GM’s common equity. While no explicit border
measures were enacted to favor GM or Chrysler, government control of GM and GMAC, and the absence
of similar support for the operations of competing foreign auto and auto financing firms, almost certainly
affected trade and investment patterns in the auto industry.
In 2009, China exported $5.2 billion of vehicles and vehicle parts to the United States, some 18.7
percent of China’s total $27.9 billion exports in the categories and 4.0 percent of total US imports of
vehicles and vehicle parts.87
85. See Treasury Department May 21, 2009, Press Release TG-154. Retrieved July 23, 2010, from http://www.treas.gov/press/releases/tg154.htm.
86. See Treasury Department December 30, 2009 Press Release TG-501. Retrieved July 23, 2010, from http://www.treas.gov/press/releases/tg501.htm.
87. Data are from UN Comtrade. Vehicles are covered under HS (2007) code 87, “Vehicles other than railway or tramway rolling stock, and parts and accessories thereof.” Note that US and PRC reports of US imports are slightly different. The United States reported $5,336 million in vehicle and vehicle parts imports from China in 2009, not $5,235.
27
2. Solar Panel Tariff Schedule Reclassification: January 2009
In January 2009, the US Customs and Border Protection agency ruled that certain solar panels equipped
with a particular diode fall under the US Harmonized Tariff Schedule classification of “electric motors and
generators” (HTS 8501.31), rather than “Diodes, transistors, and similar semiconductor devices” (HTS
8541.40). Reclassification subjected the panels to a 2.5 percent tariff as opposed to zero under the former
classification. This decision cuts against US calls within Doha Round talks for free trade in environmental
goods and services.
In 2009, the United States imported $0.1 billion of electric motors and generators (HTS 8501.31)
from China, 17.9 percent of the $0.8 billion total US electric motors and generators imports and 21.1
percent of the $0.7 billion PRC exports of electric motors and generators.88
3. American Recovery and Reinvestment Act and Buy American Provisions: February 2009
By far the leading piece of US protectionist legislation was the Buy American amendment inserted in
the American Reinvestment and Recovery Act (ARRA).89 Following the original $787 billion stimulus
bill that was enacted in February 2009 (Public Law 111-5), several additional applications of the Buy
American provision have been proposed and some have been enacted. The ARRA requires domestic
procurement in two sections. First, with certain exceptions, all covered items90 procured by the
Department of Homeland Security (DHS) with stimulus funds must be “grown, reprocessed, reused, or
produced in the United States.”91 Next, and much bigger, the ARRA requires that “all of the iron, steel,
and manufactured goods used in [an ARRA] project [must be] produced in the United States.”92 A minor
exception is allowed when the cost of the overall project would be increased by more than 25 percent to
meet the Buy American provision.93 After strong objections were voiced both domestically and interna-
tionally, the Buy American amendment was further amended to stipulate that the provisions “shall be
applied in a manner consistent with United States obligations under international agreements.”94 The
term “international agreements” most notably includes the WTO Government Procurement Agreement
(GPA) and bilateral free trade agreements (FTAs). A certain amount of compliance guidance has been
88. Data are from UN Comtrade. PRC and US reports of electric motors and generators trade flows are in close agreement for 2009, within half a percent.
89. Note that not all Buy American measures discussed have been implemented or are clearly trade distortive.
90. Covered items include, e.g., clothing, tents, tarps and other utility goods, and fabrics.
91. ARRA § 604 (2009). Note that certain DHS purchases may be exempted under the Government Procurement Agreement.
92. ARRA § 1605 (2009).
93. ARRA § 1605(b.3) (2009).
94. ARRA § 604, 1605(d) (2009).
28
issued by federal agencies (e.g., Office of Management and Budget [OMB], DHS, Federal Housing
Administration [FHA]), but rather little has been said about the key phrase, “in a manner consistent with
international agreements.”95
Since the ARRA was enacted, additional legislation has incorporated Buy American provisions
in funding for: construction, renovation and maintenance projects; Amtrak assistance; electric car and
battery manufacturing incentives; school construction; and defense appropriations.
The Hiring Incentives to Restore Employment (HIRE) Act (Public Law 111-147) was enacted in
March 2010. The HIRE Act carries a House amendment, H.Res. 947, which includes a general Buy
American provision under the “Jobs for Main Street Act.” The provision cites section 1605 of the ARRA
(the Buy American provision). The Jobs for Main Street Act redirects $75 billion dollars under the
Troubled Asset Relief Program (TARP) program. Of the redirected funds, $45 billion is allocated for
construction and renovation projects: highway infrastructure ($27.5 billion), public transit and Amtrak
($9.2 billion), school renovation ($4.1 billion), drinking water provision ($2.1 billion), public housing
($1.0 billion), Corps of Engineers ($0.7 billion).96 The Buy American provision subjects the allocated
funds to the requirement that all “construction, alteration, maintenance, or repair” ensure that “all of
the iron, steel, and manufactured goods used in the project are produced in the United States.” The Jobs
for Main Street Act imposes additional requirements on the procedure for waiving the Buy American
obligations. In particular, senior officials responsible for highway and public transportation projects must
analyze the impact on domestic employment before issuing a waiver and give advance public notice of the
waiver.97
The ARRA’s Buy American provision was expanded with the Appropriations Act of 2010 (Public
Law 111-117), which forbids Amtrak from issuing “contracts [for] . . . services provided at or from any
location outside the United States.”98 The penalty for violating this provision is a complete loss of the
funding, which totals $563 million.99
95. See Global Trade Alert pages: http://www.globaltradealert.org/measure/united-states-america-buy-american-provisions-stimulus-package, and http://www.globaltradealert.org/measure/united-states-america-expanded-buy-american-provisions-public-projects
96. See Jobs for Main Street Act of 2010 summary. Retrieved July 29, 2010, from http://www.speaker.gov/newsroom/legislation?id=0351.
97. Dow Jones Reuters Business Interactive, L. L. C., & LexisNexis. 2009. Buy American Provisions in Jobs Bill Could Complicate Canada Talks. Inside US trade, 27(50). See also Global Trade Alert page. Retrieved July 29, 2010, from http://www.globaltradealert.org/measure/united-states-america-expanded-buy-american-provisions-public-projects.
98. See Global Trade Alert page. Retrieved July 29, 2010, from http://www.globaltradealert.org/measure/united-states-america-buy-american-provisions-amtrak.
99. Appropriations Act of 2010 § 149 (2010).

29
The 21st Century Green High-Performing Public School Facilities Act (H.R. 2187) has passed the
House and awaits Senate approval.100 The bill would authorize $6.4 billion for school renovation, subject
to the same Buy American provisions set forth in the ARRA.101
The National Defense Authorization Act for Fiscal Year 2010 (Public Law 111-84) initially required
components of military uniforms to be produced within the United States. Exceptions could only be
made by the Secretary of Defense. The explicit Buy American provisions were struck from the enacted
legislation; however, the Act does expand the definition of small arms and gives the Secretary of Defense
the authority to redefine the list of firms in the small arms production industrial base. Finally, the Act
restricts the amount of work that can be done on certain construction projects in Guam by persons
holding temporary H-2B work visas.102
The American Clean Energy and Security Act (H.R. 2454), better known as the Waxman-Markey
climate and energy bill, barely passed the House in 2009 during the 111th Congress, and awaits a
doubtful future in the 112th Congress which meets in January 2011. While the central disputes are
far removed from Buy American provisions, the bill would enable the Secretary of Energy to “provide
financial assistance to automobile manufacturers [in the United States] to facilitate the manufacture of
plug-in electric drive vehicles” (§123). Financial assistance is also available for manufacturers investing
capital toward “qualifying advanced technology vehicles… [or] components.” This includes manufacturers
of new technology batteries for such vehicles. No explicit appropriations are made for financial assistance;
rather funding is at the discretion of the secretary of energy. The bill offers a competitive grant process
similar to the Energy Independence and Security Act of 2007 (Public Law 110-140).103
4. Employ American Workers Act (EAWA): February 2009
The EAWA restricted TARP fund recipients from hiring certain foreign workers. The EAWA became
section 1611 of the ARRA (Public Law 111-5) and was scheduled to sunset two years from enactment
(February 17, 2011). While EAWA was in force, TARP fund recipients were prohibited from hiring
H-1B workers unless the firm first tried to recruit US workers. This procedure was originally reserved for
firms employing a large number of H-1B workers; however, the EAWA applied the requirement to all
100. See Library of Congress Bill Summary & Status. Retrieved July 29, 2010, from http://thomas.loc.gov/cgi-bin/bdquery/z?d111:HR02187:
101. 21st Century Green High-Performing Public School Facilities Act § 306.
102. National Defense Authorization Act of 2010 § 2834(a)(6)(F) (2010).
103. United States of America: Subsidies and Buy American provisions for electric cars and batteries. Retrieved June 8, 2010, from http://www.globaltradealert.org/measure/united-states-america-subsidies-and-buy-american-provisions-electric-cars-and-batteries.
30
TARP fund recipients.104 The New York Times identified more than 650 firms that received $400 billion
in TARP funds; these firms clearly had to observe the EAWA restrictions.105 The provision is mainly
symbolic, and probably affects very few Chinese H-1B workers.
5. Dairy Export Incentive Program: May 2009
The Dairy Export Incentive Program (DEIP) was revived by Secretary of Agriculture Vilsack in May
2009. The program itself is over 20 years old, but has not been utilized to the extent permitted under the
Uruguay Round accord. Revival of the DEIP was triggered by higher European dairy subsidies imple-
mented in January 2009. The new DEIP allocations provide export support for “68,201 metric tons of
non-fat dry milk; 21,097 metric tons of butterfat; 3,030 metric tons of various cheeses and 34 metric
tons of other dairy products, as well as individual product and country allocations.”106 The ultimate DEIP
program allocations are determined by the USDA in a bidding process, the results of which are posted
on its website. As of February 2010, the DEIP program had approved 99 submitted bids.107 The program
subsidies are not expected to exceed 1 percent of the US dairy market according to the Congressional
Research Service. Despite being within the WTO subsidy limits and its negligible impact, the program
attracted an international backlash given its dissonance from the commitment to restrain protectionist
measures pledged at the London G-20 summit just two months prior.108
In 2009, the United States exported $95 million of dairy products to China, 4.9 percent of the
$1,949 million total US exports of dairy products and 9.9 percent of the $1,046 million total PRC
imports of dairy products.109
6. Legislation Targeting Currency Manipulation: 2010
Senator Charles Schumer (D-NY) introduced a bill (S.3134) in March 2010 to counter currency manipu-
lation by foreign governments. The bill would authorize the deployment of several countermeasures.
104. United States of America: Employ American Workers Act. Retrieved June 8, 2010, from http://www.globaltradealert.org/measure/united-states-america-employ-american-workers-act.
105. Ericson, Matthew, Elaine He, and Amy Schoenfeld. “Tracking the $700 Billion Bailout”. New York Times. Retrieved February 11, 2010, from http://projects.nytimes.com/creditcrisis/recipients/table.
106. USDA 2008–09 DEIP allocations announcement. Retrieved July 26, 2010, from http://www.fas.usda.gov/scriptsw/PressRelease/pressrel_dout.asp?Entry=valid&PrNum=0081-09
107. US Department of Agriculture DEIP website. Retrieved July 23, 2010, from http://www.fas.usda.gov/excredits/deip/deip-new.asp
108. Dow Jones Reuters Business Interactive, L. L. C., and LexisNexis. (2009). US Revival of Dairy Subsidies Sparks Global Outrage, but Effect Minimal. Inside US Trade, 27(21).
109. Data are from UN Comtrade. Dairy products are as covered under HS (2007) code 04, “Dairy Produce.” US and PRC reports of US dairy products exports to China in 2009 are close. China reported $103 million of dairy products imports from the United States, not $95 million.

31
Notably, it would require that the Department of Commerce consider currency undervaluation in its
antidumping investigations and it would disqualify suppliers from currency manipulating countries from
US government procurement. The measures authorized by the bill would be contingent on the biannual
“International Economic and Exchange Rate Policies” (IEERP) Report of the Treasury Department,
which identifies countries it determines are manipulating their currency regimes in such a fashion as to
prevent balance of payments adjustments. No edition of the IEERP report has yet identified China as a
country that engages in exchange rate manipulation; however, recent issues of the report have expressed
concern over undervaluation. In June 2010, China announced that it would allow some degree of
exchange rate flexibility. However, the renminbi appreciation has so far been quite limited and is not
viewed as adequate by most members of Congress.
In addition to authorizing countermeasures following the finding of currency manipulation by the
Treasury Department, the bill would limit Treasury Department discretion in identifying manipulation
and limit executive discretion in responding to an affirmative finding of manipulation. The Treasury
Secretary would be further constrained by a requirement to oppose any governance changes in the
international financial institutions (the IMF, World Bank, and others) that would increase the voting
share of identified currency manipulators. This is particularly relevant given recently proposed changes in
IMF voting shares.110
Despite China’s decision to allow a degree of exchange rate flexibility, the core concepts of the
Schumer bill remain popular in the Senate and have gained overwhelming support in the House. In
March 2010, 130 representatives signed a letter to the Secretary of the Department of Commerce, Gary
Locke, calling for countervailing duties in response to PRC currency manipulation. As of November
2010, the bill had yet to reach the floor of the Senate.111
At the end of September 2010, the House passed the Currency Reform for Fair Trade Act (CRFTA;
HR 2378) by a bipartisan margin of 348-79. CRFTA permits, but does not require, the Commerce
Department to identify unfair subsidies resulting from currency manipulation. CRFTA differs from the
Schumer bill (S.3134), which offers a range of sanctions, in that CRFTA only specifies countervailing
duties as a possible retaliatory measure. Under the bill, a currency will be considered “fundamentally
undervalued” if the currency and the country meet four criteria during an 18-month period: substantial
government intervention in the exchange market; undervaluation by an average of 5 percent for 18
110. Bill Summary and Status: 111th Congress (2009–10), S.3134. Retrieved July 14, 2010, from http://thomas.loc.gov/cgi-bin/bdquery/z?d111:SN03134:@@@D&summ2=m&.
111. Sino-US relations have been strained in the past over the renminbi. One year after failed diplomatic attempts by the Bush administration in 2004–05, Treasury Secretary John Snow criticized the lack of progress China had made with respect to renminbi exchange rate flexibility. Several bills were tabled in Congress to address the issue, but none passed.

32
months; large and persistent current account surpluses; foreign asset reserves beyond certain thresholds.112
The bill is expected to be taken up in the Senate by the 112th Congress (January 2011–January 2013).
Any currency bill imposing trade sanctions would face a difficult test within the WTO if China
brought a case. While CRFTA is limited to authorizing CVDs, it is not clear how the WTO appellate
body would rule on their legality. The precise language of the ASCM would be parsed to argue for
and against the concept of a currency subsidy CVD.113 However, other provisions of the GATT cede
preeminence to the IMF in the realm of exchange rate relations. For example, GATT Article XV(9)(a)
allows members the explicit right to utilize “exchange controls or exchange restrictions in accordance
with the Articles of Agreement of the [IMF].” Clearly the IMF has primary responsibility for establishing
currency norms, which explains past efforts by Congress to pressure the IMF (using the Treasury
Department as the messenger) to voice strong disapproval of the Chinese renminbi regime. The CRFTA
bill, however, makes no mention of Treasury Department communication with the IMF on currency
issues. This twist reflects Congressional frustration with the tepid pace and force of IMF action.
Prc legislative measures1. Export Tax Rebates: April 2009
In April 2009, the PRC Ministry of Finance announced an increased rebate on VAT for exporters of
various products.114 China notified the WTO Trade Policy Review Body (TPRB) in March of its intention
to increase the VAT rebates. It simultaneously notified the TPRB that it had or would soon reduce or
eliminate export duties on over 100 products and increase export duties on five products.115
Due to the broad and general nature of the products identified by the PRC government in its
communication to the WTO Trade Policy Review Body, the estimated coverage of the program is quite
extensive.116 Under the proposed export tax rebate program, 72.4 percent of US imported products, or
$224 billion worth, would have been eligible for larger tax rebates in 2009.
112. The thresholds include any of the following three: the amount necessary to repay all debt obligations of the government due within 12 months; 20 percent of the country’s M2 money supply; or the value of the country’s imports during the previous four months.
113. See Hufbauer, Wong and Sheth (2006) and Staiger and Sykes (2010) for expositions of the potential legal debate over the application of the ASCM to an alleged currency subsidy.
114. China identified the following products in its communication with the WTO Trade Policy Review Body in March 2009: “textiles and clothing; ceramic; plastic; furniture; pharmaceutical; household appliances; books; rubber; molds; dies; glassware; suitcases; bags; footwear; watches; chemicals; machinery; and electrical products.”
115. WTO document JOB(09)/62.
116. China identified the following products in its communication with the WTO TPRB: “textiles and clothing; ceramic; plastic; furniture; pharmaceutical; household appliances; books; rubber; molds; dies; glassware; suitcases; bags; footwear; watches; chemicals; machinery; and electrical products.” See WTO document JOB(09)/62 p. 29.

33
2. Ban on Foreign Investment in Express Postal Services: April 2009
China Post issued a law in April 2009 banning foreign investment in business express postal services,
effective October 2009. The law bans foreign firms from providing domestic delivery of express letters by
foreign firms, but allows foreign delivery. The law bans foreign firms from providing international delivery
of packages, but allows domestic delivery. The law also introduces a new licensing system for express
delivery services.
Service trade data are not sufficiently disaggregated to identify trade in postal services; however,
China State Post Bureau data indicate that express postal services revenue was $1.46 billion in the first
quarter of 2009 alone, nearly 40 percent of total Post Bureau revenue in that period.117 As a conservative
guess, perhaps one-third of the annualized Post Bureau express revenue represents the services of US
express post firms adversely impacted, around $2 billion annually.
3. Adjustment of Import Tariffs Policy on Key Technical Equipment: September 2009
Several PRC ministries jointly issued a policy revision exempting imports by domestic enterprises of key
components of “major technical equipment” and select other products from import duties and import-
related value-added taxes. The policy revision simultaneously abolished a duty exemption on imports of
whole machines. Enterprises must apply for accreditation annually in order to receive the VAT exemption
on their imports. Duty exemptions are subject to quotas for the eligible enterprises.118
4. National Indigenous Innovation Products Accreditation Program: November 2009
In November 2009, China’s Ministry of Science and Technology, National Development and Reform
Commission, and Ministry of Finance jointly issued Directive 618, known as the National Indigenous
Innovation Products Accreditation Program (NIIPA). NIIPA establishes a subscribed directory of
products whose manufacturers are screened based on several criteria: general legality and approved
product licensing (when applicable); possession of undisputed intellectual property rights;119 advanced
technology, especially those improving resource efficiency; reliable quality; existing sales or “potential
117. Li, L. (2009, April 24). 2nd UPDATE: China Bans Foreign Invest In Local Express Mail Op, Dow Jones Newswires. Revenue amount of CNY10 billion converted to USD as of the March 31, 2009 rate of 6.8329 Yuan per USD reported by the Federal Reserve Statistical Release H.10, Historical Rates for China. Retrieved July 26, 2010, from http://www.federalreserve.gov/releases/h10/Hist/dat00_ch.htm.
118. Six Government Authorities Jointly Adjust Import Duties on Major Technical Equipment. (2009). Retrieved July 26, 2010, from http://www.chinatax.gov.cn/n6669073/n6669118/9291788.html. We are unable to give an estimate of the approximate dollar value of imports affected.
119. The applicant may also license the IP. The NIIPA program conditions for IP require that “the applying unit owns the IP rights in China or licensed IP usage rights in China of products it has researched and developed, by means of either technological innovation or transfer, and the IP does not have any disputes or controversies with other products’ IP.”

34
economic benefits and bright market prospects.”120 NIIPA is part of China’s Medium- and Long-Term
National Plan for Science and Technology Development, which aims to promote indigenous innovation
by facilitating government purchase of indigenous innovation products.121 China’s Evaluation Measures
on Indigenous Innovation Products, issued in 2007, offers explicit preferential treatment in government
procurement, allowing for preference at a margin of 5 to 10 percent if price is the sole determinant, a
preference of 4 to 8 percent for technical and price metrics in comprehensive evaluations, and support for
initial purchases of new-to-market domestic innovation products.122
The accreditation program follows the announcement of explicit preference for local content in
procurement decisions by the PRC National Development and Reform Commission (NDRC) in May
2009. The NDRC announced the preferential procurement policy jointly with several other government
ministries including Industry and Information Technology, Commerce, and Housing and Urban-Rural
Development. Exceptions to local procurement must be approved by the appropriate ministry.
While it is unclear to what extent foreign suppliers will be disadvantaged by the new procurement
policy, the market for sales to the PRC government is quite large and much is at stake. One estimate
puts PRC government procurement at $70 billion to $130 billion per year.123 Based on this figure, a
conservative impact on the potential US exporters might be $10 billion per year.
5. Temporary Increase of Fuel and Jet Oil Import Tariffs: February 2010
In February 2010, China notified the WTO that it was increasing its tariffs on fuel oil and jet fuel to 3
percent and 6 percent, respectively. Both tariffs had previously been set at 1 percent. Neither tariff exceeds
its bound rate.
In 2009, the United States exported $156 million of petroleum oils to China, 0.4 percent of total
US exports of petroleum oil.124
120. PRC Notice Regarding the Launch of the National Indigenous Innovation Product Accreditation Work for 2010. (2010). Draft for Public Comment (Unofficial translation by the US-China Business Council), Retrieved July 26, 2010, from http://www.uschina.org/public/documents/2010/04/ii_asccreditation_translation.pdf.
121. The Plan specifically targets certain innovation sectors, including the following identified by Global Trade Alert: “Computers and application equipment; Communications products; Modern Office Equipment; Software; New Energy and new energy devices; and High-efficiency and energy-saving products.” Retrieved July 26, 2010, from http://www.globaltradealert.org/measure/china-accreditation-suppliers-certain-high-tech-products.
122. Issue Brief: New Developments in China's Domestic Innovation and Procurement Policies. (2010, January 2010), Retrieved July 29, 2010, from http://www.uschina.org/public/documents/2010/domestic_innovation_policies.pdf.
123. Grams, R., and Epstein, E. J. (2010). China Advisory: What Next in China’s Indigenous Innovation Program? Retrieved July 29, 2010, from http://www.troutmansanders.com/chinaadvisory07122010/.
124. Data are from UN Comtrade. Petroleum oil is covered under HS (2007) code 2710, “Petroleum oils and oils obtained from bituminous minerals, other than crude; preparations not elsewhere specified or included.”
35
Protective themes and future disputesProtective Themes
US and PRC complaints within the WTO differ in several respects. While US complaints have focused
entirely on “behind the border” measures, PRC complaints have been entirely lodged against US border
measures. The broad scope of PRC measures targeted by US complaints has attracted support from many
other WTO members. All eight US consultations with China engendered requests from other members
to join the consultations. Four of the five US measures targeted by PRC complaints have been China
specific, and PRC consultations with the US have been joined by other members only in the US steel
safeguards case.
PRC measures challenged by the United States are best characterized as offensively protectionist in
that they reflect legislation designed to selectively support the development of domestic industries using
behind the border measures (see table 14 ). Nearly all the cases brought against China through the DSB
have questioned legislation, particularly with respect to high value-added industries in which the United
States, and other advanced WTO members, have specialized and China has yet to fully develop (e.g.,
financial services, integrated circuit design).
US measures challenged by China are best characterized as defensively protectionist. They are
generally motivated by a desire to guard mature domestic industries (e.g., steel, tires) from further erosion
than to support the growth of nascent industries. This is evident in the heavy reliance of the United States
on border protection. Well over half of the 111 consultations sought with the United States by China
and other WTO members through the DSB have questioned classic border measures—antidumping and
countervailing duties and safeguards.
These patterns are broadly consistent with the nature of each country’s economy, but in common,
each country is protecting its domestic industries from foreign competition: China is sheltering space for
high value-added industries, while the United States is guarding the sunset sectors of its economy.
Future Disputes
Since PRC protective measures implement a broader economic development strategy, fresh examples
are likely to spark future disputes. While PRC growth has been remarkable, the share of high value-add
industry in the economy remains low, and this ensures considerable scope for intensive development
efforts. The NIIPA program in particular illustrates future prospects. The same can be said of inadequate
PRC efforts (from a US perspective) to enforce intellectual property rights.
Similarly, as the US economy continues to grow and mature, additional industries will lose their
competitive edge and seek shelter from imports. PRC exporters will thus continue to face numerous
antidumping investigations in the US market (see table 9). From time to time, these will be accompanied
36
by market disruption, countervailing duty and safeguard actions, and occasional administrative law
measures, such as the solar panel reclassification decision. Even the Buy American legislation can be
interpreted as a defense of mature sectors of the US economy.
The pending currency bill, if enacted in the 112th Congress, could place considerable strain on
the Sino-US relationship. Perhaps the bill passed by the House, in September 2010, will serve as the
warning shot that prompts Beijing to allow the renminbi to appreciate. However, if China stands fast at
an exchange rate near 6.83 renminbi to the dollar, and if several US industries then seek CVD protection
under the new law, the stage will be set for a trade war with significant political and legal ramifications.
The PRC would very likely challenge the CVDs within the WTO. Beyond that, the PRC might well
engage in retaliatory self-help that could span across both finance and trade. The dispute could easily
become the centerpiece of Sino-US relations for a protracted period.
concluSIon
The Sino-US economic relationship has grown in intensity over the past two decades and has now become
much more contentious. It is not surprising that the sheer magnitude of the increased flow of goods
and services between the economies has generated political friction. The way leaders and their officials
in China and the United States manage that friction has been the story in this paper. Trade frictions are
unlikely to subside in the near future, particularly as the United States tries to double exports as part of
its exit strategy from the Great Recession. Unless China allows the renminbi to appreciate by a substantial
amount against the dollar and other currencies, the exchange rate will be a flash point in the bilateral
relationship.
Global economic imbalances require huge adjustments in the trajectories of the PRC and US
economies. The world economic community is looking to the United States and China for specific
structural changes that will narrow both the US current account deficit and the Chinese current account
surplus. In the United States this means reducing consumption and increasing savings. The converse is
true for China. Small and tentative steps have been taken in each country. President Obama set the goal
of doubling US exports by 2015, and China announced it will allow its currency to appreciate. Much
needs to be done to implement these aspirations.
If cooperative approaches are not sufficiently bold, the United States may reach for protectionist
measures to narrow its trade deficit. The PRC could respond by building a trade bloc with exclusionary
walls in Asia and by taking measures to undermine the role of the dollar as the world’s reserve currency.
A path of destructive responses would not only damage the Sino-US relationship, but would also disrupt
commerce on a global scale.
37
In our view, the run of cases illustrated in our account by WTO disputes and national
administrative law decisions (antidumping, market disruption, and similar trade remedies) are a normal
part of rapidly growing commerce between the United States and China. Frictions must be expected.
Adding the potential trade coverage of all the cases enumerated in tables 6, 9, 11, 14, and 15, the figure is
only $45.7 billion, around 12 percent of two-way trade in 2009.125
Trade disputes of this sort can be managed if each country respects adverse decisions handed down
by the WTO, whether the decisions entail zeroing, intellectual property rights, or other targeted measures.
More troublesome are broad-gauged measures that threaten to isolate whole swaths of the economy
from foreign competition. Leading examples are the NIIPA, Buy American, and the currency legislation
now debated in Congress. In our view, the challenge facing US and PRC political leaders is two-fold: first,
to implement the broad macroeconomic policies necessary to reduce their current account imbalances;
second, to channel broad-gauged measures into targeted policies that can be reversed if they are judged to
violate WTO norms.
referenceSofficial documents and data Sources
Agreement on Agriculture, Annex 1A to the Marrakesh Agreement Establishing the World Trade Organization, April 15, 1994. Retrieved July 29, 2010, from http://www.wto.org/english/docs_e/legal_e/14-ag.pdf.
Agreement on the Implementation of Article IV of the General Agreement on Tariffs and Trade 1994 (Anti-Dumping), Annex 1A to the Marrakesh Agreement Establishing the World Trade Organization, April 15, 1994. Retrieved July 29, 2010, from http://www.wto.org/english/docs_e/legal_e/19-adp.pdf.
Agreement on Subsidies and Countervailing Measures (ASCM), Annex 1A to the Marrakesh Agreement Establishing the World Trade Organization, April 15, 1994. Retrieved July 29, 2010, from http://www.wto.org/english/docs_e/legal_e/24-scm.pdf.
Agreement on Trade-Related Aspects of Intellectual Property Rights (TRIPS), Annex 1C to the Marrakesh Agreement Establishing the World Trade Organization, April 15, 1994. Retrieved July 29, 2010, from http://www.wto.org/english/docs_e/legal_e/27-trips.pdf.
All 337 Investigations. Office of Unfair Import Investigation, United States International Trade Commission. Retrieved June 30, 2010, from http://info.usitc.gov/ouii/public/337inv.nsf/All?OpenView.
Certain Passenger Vehicle and Light Truck Tires From China (Investigation No. TA-421-7). (July 2009). (4085). United States International Trade Commission. Retrieved July 29, 2010, from http://www.usitc.gov/publications/safeguards/pub4085.pdf.
125. Table 6: WTO Disputes between China and the United States; table 9: Summary of US Antidumping Duty Trade Coverage; table 11: Summary of US Countervailing Duty Trade Coverage; table 14: PRC Antidumping Duty Coverage of US Imports; and table 15: Protectionist Measures that Affect Sino-US Trade. Note that trade in 2009 was significantly dampened by the Great Recession. Total two-way trade in 2009 was $379.1 billion. The $45.7 billion coverage figure gives a coarse approximation as the amounts summed come from the years of dispute, not 2009. The $45.7 billion figure excludes the $224 billion of PRC exports covered under the China’s 2009 export tax rebate plan.
38
China, Regional Issues Poll. Americans and the World Digest, World Public Opinion.org. Retrieved July 29, 2010, from http://www.americans-world.org/PDF/china_data_update-8_2008.pdf.
Consolidated Appropriations Act, 2010: public law 111-117, official text § 152 (2010).
Direction of Trade Statistics (DOTS). (2009). From International Monetary Fund (IMF).
Fact Sheet: Commerce Preliminarily Finds Unfair Dumping of New Pneumatic Off-The-Road Tires from the People’s Republic of China. International Trade Administration, United States Department of Commerce. Retrieved July 29, 2010, from http://ia.ita.doc.gov/download/factsheets/factsheet-prc-tires-prelim-020608.pdf.
Factiva [New York]: Dow Jones Reuters Business Interactive LLC.
FDI Markets Crossborder Investment Monitor (2010). Available from The Financial Times Ltd., from http://www.fdimarkets.com/.
Federal Reserve Statistical Release H.10, Foreign Exchange Rates (Weekly). Federal Reserve (2010). Retrieved July 29, 2010, from http://www.federalreserve.gov/releases/h10/Hist/dat00_ch.htm.
National Defense Authorization Act, 2010 : public law 111-84, official text § 2834(a)(6)(F) (2010).
Report of the Working Party on the Accession of China. October 1, 2001. World Trade Organization (WT/ACC/CHN/49). Retrieved July 29, 2010, from http://unpan1.un.org/intradoc/groups/public/documents/apcity/unpan002144.pdf.
Report to Congress on International Economic and Exchange Rate Policies. (2006): US Department of the Treasury. Retrieved July 29, 2010, from http://www.ustreas.gov/offices/international-affairs/economic-exchange-rates/pdf/international_econ_exchange_rate.pdf.
Report to the TPRB From the Director-General on the Financial and Economic Crisis and Trade-Related Developments. (2009). (JOB(09)/62). WTO. Retrieved July 29, 2010, from http://www.wto.org/english/news_e/news09_e/trdev_dg_report_14apr09_e.doc.
Stimulus: American Recovery and Reinvestment Act of 2009 : public law 111-5, official text (2009).
The General Agreement on Tariffs and Trade, 1947 and as incorporated in Annex 1A to the Marrakesh Agreement Establishing the World Trade Organization, April 15, 1994. Retrieved July 29, 2010, from http://www.wto.org/english/docs_e/legal_e/legal_e.htm#gatt47.
UN Comtrade. (2010). Available from United Nations Statistics Division United Nations Commodity Trade Statistics Database, from United Nations http://comtrade.un.org/db/.
UN Service Trade. (2010). Available from United Nations Statistics Division United Nations Commodity Trade Statistics Database, from United Nations http://comtrade.un.org/db/.
US Department of Commerce, Bureau of Economic Analysis. Gross Domestic Product: Implicit Price Deflator. Retrieved June 30, 2010, from Federal Reserve Bank of St. Louis, Economic Research http://research.stlouisfed.org/fred2/series/GDPDEF/downloaddata?cid=21.
Articles, Books and reports
Abbott, F. M. (1998). China in the world trading system: defining the principles of engagement, The Hague; Boston.
Bhala, R. (2000). Enter the Dragon: An Essay on China's WTO Accession Saga. American University International Law Review, 15, 1469–1538.

39
Bown, C. P. (2010a). China-Specific Safeguards Database. from The World Bank http://econ.worldbank.org/ttbd/csgd/.
Bown, C. P. (2010b). Global Antidumping Database. from The World Bank http://econ.worldbank.org/ttbd/gad/.
Bown, C. P. (2010c). Global Countervailing Duties Database. from The World Bank http://econ.worldbank.org/ttbd/gcvd/.
Choi, W.-M., and Gao, H. S. (2006). Procedural Issues in the Anti-Dumping Regulations of China: A Critical Review under the WTO Rules. Chinese Journal of International Law, 5(3), 663-682.
Dow Jones Reuters Business Interactive, L. L. C., and LexisNexis. (2009). Buy American Provisions In Jobs Bill Could Complicate Canada Talks. Inside US trade, 27 (50).
Dow Jones Reuters Business Interactive, L. L. C., and LexisNexis. (2009). US Revival of Dairy Subsidies Sparks Global Outrage, but Effect Minimal. Inside US trade, 27 (21).
Ericson, Matthew, Elaine He, and Amy Schoenfeld. “Tracking the $700 Billion Bailout”. New York Times. Retrieved June 8, 2010, from http://projects.nytimes.com/creditcrisis/recipients/table.
Government Accountability Office Washington, DC. (April 2010). Intellectual Property—Observations on Efforts to Quantify the Economic Effects of Counterfeit and Pirated Goods (GAO-10-423).
Grams, R., and Epstein, E. J. (2010). China Advisory: What Next in China’s Indigenous Innovation Program? Retrieved July 29, 2010, from http://www.troutmansanders.com/chinaadvisory07122010/.
Hufbauer, G. C., Wong, Y., and Sheth, K. (2006). US-China trade disputes : rising tide, rising stakes. Washington, DC: Institute for International Economics.
Import Injury Investigations Case Statistics (FY 1980–2008). (February 2010). United States International Trade Commission. Retrieved July 29, 2010, from http://www.usitc.gov/trade_remedy/documents/historical_case_stats.pdf.
Issue Brief: New Developments in China's Domestic Innovation and Procurement Policies. (2010, January 2010), Retrieved July 29, 2010, from http://www.uschina.org/public/documents/2010/domestic_innovation_policies.pdf.
Li, L. China Bans Foreign Invest In Local Express Mail Operating. (2009, April 25). European Union Chamber of Commerce in China. Retrieved from http://www.euccc.com.cn/index2.php?do_pdf=1&cid=4239.
Number of Section 337 Investigations Instituted By Calendar Year. Retrieved July 29, 2010, from http://www.usitc.gov/intellectual_property/documents/cy_337_institutions.pdf.
OECD (2009), Magnitude of Counterfeiting and Piracy of Tangible Products: An Update, OECD, Paris. Retrieved July 29, 2010, from http://www.oecd.org/dataoecd/57/27/44088872.pdf.
PRC Notice Regarding the Launch of the National Indigenous Innovation Product Accreditation Work for 2010. (2010). Draft for Public Comment (Unofficial translation by the US-China Business Council), Retrieved July 29, 2010, from http://www.uschina.org/public/documents/2010/04/ii_accreditation_translation.pdf.
Sepetys, K., and Cox, A. (2009). Intellectual Property Rights Protection in China: Trends in Litigation and Economic Damages: National Economic Research Association, Inc.
Six Government Authorities Jointly Adjust Import Duties on Major Technical Equipment. (2009). Retrieved July 26, 2010, from http://www.chinatax.gov.cn/n6669073/n6669118/9291788.html.

40
Staiger, Robert W. and Sykes, Alan O. (2010). Currency Manipulation and World Trade. World Trade Review 9, 583-627.
State Intellectual Property Organisation (SIPO) of the People’s Republic of China, 2008 Annual Report. Retrieved July 29, 2010, from http://www.sipo.gov.cn/sipo_English/laws/annualreports/.
Treasury Announces Additional Investment in GMAC LLC, TG-154 (May 21, 2009). Retrieved July 29, 2010, from http://www.treas.gov/press/releases/tg154.htm.
Treasury Announces Restructuring of Commitment to GMAC, TG-501 (December 30, 2009). Retrieved July 29, 2010, from http://www.treas.gov/press/releases/tg501.htm.
Websites
A Guide to the United States' History of Recognition, Diplomatic, and Consular Relations, by Country, since 1776: China. Retrieved May 24, 2010, from http://history.state.gov/countries/china.
Archive Pages of the Harmonized Tariff Schedule. Retrieved June 18, 2010, from http://www.usitc.gov/tata/hts/archive/index.htm.
Bill Summary and Status 111th Congress (2009– 2010) H.R.2187. Retrieved June 17, 2010, from http://thomas.loc.gov/cgi-bin/bdquery/z?d111:HR02187:.
Bill Summary and Status: 111th Congress (2009– 2010), S.3134. Retrieved July 14, 2010, 2010, from http://thomas.loc.gov/cgi-bin/bdquery/z?d111:SN03134:@@@D&summ2=m&.
China: Accreditation of suppliers of certain high-tech products. Retrieved July 26, 2010, from http://www.globaltradealert.org/measure/china-accreditation-suppliers-certain-high-tech-products.
China: Adjustment of import tariffs policy on key technical equipments. Retrieved July 29, 2010, from http://www.globaltradealert.org/measure/china-adjustment-import-tariffs-policy-key-technical-equipments.
China: Antidumping investigation concerning imports of polyvinyl chloride. Retrieved July 29, 2010, from http://www.globaltradealert.org/measure/china-antidumping-investigation-concerning-imports-polyvinyl-chloride.
China: Ban on foreign investment in express postal services. Retrieved July 29, 2010, from http://www.globaltradealert.org/measure/china-ban-foreign-investment-express-postal-services.
China—Certain Measures Granting Refunds, Reductions or Exemptions from Taxes and Other Payments. Retrieved July 30, 2010, from http://www.wto.org/english/tratop_e/dispu_e/cases_e/ds358_e.htm.
China: Definitive antidumping duty established on imports of Polyamide 6.6 originating in USA, Italy, UK, France and Chinese Taipei. Retrieved July 29, 2010, from http://www.globaltradealert.org/measure/china-definitive-antidumping-duty-established-imports-polyamide-66-originating-usa-italy-uk-.
China: Export tax rebates. Retrieved July 29, 2010, from http://www.globaltradealert.org/measure/china-export-tax-rebates.
China: Final determination of antidumping duty on Polyamide-6 originating from the United States, the EC, Russia and Chinese Taipei. Retrieved July 29, 2010, from http://www.globaltradealert.org/measure/china-final-determination-antidumping-duty-polyamide-6-originating-united-states-ec-russia-a.
China—Grants, Loans and Other Incentives. Retrieved July 30, 2010, from http://www.wto.org/english/tratop_e/dispu_e/cases_e/ds387_e.htm.

41
China: Implementation of State Council Opinions on imported goods. Retrieved July 29, 2010, from http://www.globaltradealert.org/measure/china-implementation-state-council-opinions-imported-goods.
China: Initiation of antidumping investigation on grain oriented flat-rolled electrical steel from United States and Russian Federation. Retrieved July 29, 2010, from http://www.globaltradealert.org/measure/china-initiation-antidumping-investigation-grain-oriented-flat-rolled-electrical-steel-unite.
China—Measures Affecting Financial Information Services and Foreign Financial Information Suppliers. Retrieved July 30, 2010, from http://www.wto.org/english/tratop_e/dispu_e/cases_e/ds373_e.htm.
China—Measures Affecting Imports of Automobile Parts. Retrieved July 30, 2010, from http://www.wto.org/english/tratop_e/dispu_e/cases_e/ds340_e.htm.
China—Measures Affecting the Protection and Enforcement of Intellectual Property Rights. Retrieved July 30, 2010, from http://www.wto.org/english/tratop_e/dispu_e/cases_e/ds362_e.htm.
China—Measures Affecting Trading Rights and Distribution Services for Certain Publications and Audiovisual Entertainment Products. Retrieved July 30, 2010, from http://www.wto.org/english/tratop_e/dispu_e/cases_e/ds363_e.htm.
China—Measures Related to the Exportation of Various Raw Materials. Retrieved July 30, 2010, from http://www.wto.org/english/tratop_e/dispu_e/cases_e/ds394_e.htm.
China: Preliminary antidumping duty and preliminary CVD determination on imported chicken products originated from the US. Retrieved July 29, 2010, from http://www.globaltradealert.org/measure/china-preliminary-antidumping-duty-and-preliminary-cvd-determination-imported-chicken-produc.
China Safeguard Measures Regulations (Revised). Retrieved September 27, 2010, from http://tradeinservices.mofcom.gov.cn/en/b/2004-03-31/27907.shtml.
China: Temporary increase of import tariffs on fuel. Retrieved July 29, 2010, from http://www.globaltradealert.org/measure/china-temporary-increase-import-tariffs-fuel
China—Value-Added Tax on Integrated Circuits. Retrieved June 2, 2010, from http://www.wto.org/english/tratop_e/dispu_e/cases_e/ds309_e.htm.
Chronology of US-China Relations, 1784-2000. Retrieved May 24, 2010, from http://history.state.gov/countries/china/china-us-relations.
Current Legislation: Jobs for Main Street Act of 2010. (2010) Retrieved June 17, 2010, from http://www.speaker.gov/newsroom/legislation?id=0351.
Dispute Settlement: Dispute DS252. Retrieved June 18, 2010, from http://www.wto.org/english/tratop_e/dispu_e/cases_e/ds252_e.htm.
Dispute Settlement: Dispute DS373. Retrieved June 18, 2010, from http://www.wto.org/english/tratop_e/dispu_e/cases_e/ds373_e.htm.
Dispute Settlement: Dispute DS379. Retrieved June 18, 2010, from http://www.wto.org/english/tratop_e/dispu_e/cases_e/ds379_e.htm.
Dispute Settlement: The Disputes. Retrieved June 2, 2010, from http://www.wto.org/english/tratop_e/dispu_e/find_dispu_cases_e.htm#results.
Global Trade Alert. Retrieved June 8, 2010, from www.globaltradealert.org.
UN Comtrade. (2010). Available from United Nations Statistics Division United Nations Commodity Trade Statistics Database, from United Nations http://comtrade.un.org/db/.
42
United States—Certain Measures Affecting Imports of Poultry from China. Retrieved July 30, 2010, from http://www.wto.org/english/tratop_e/dispu_e/cases_e/ds392_e.htm.
United States—Customs Bond Directive for Merchandise Subject to Anti-Dumping/Countervailing Duties. Retrieved July 30, 2010, from http://www.wto.org/english/tratop_e/dispu_e/cases_e/ds345_e.htm.
United States—Definitive Anti-Dumping and Countervailing Duties on Certain Products from China. Retrieved July 30, 2010, from http://www.wto.org/english/tratop_e/dispu_e/cases_e/ds379_e.htm.
United States—Definitive Safeguard Measures on Imports of Certain Steel Products. Retrieved July 30, 2010, from http://www.wto.org/english/tratop_e/dispu_e/cases_e/ds252_e.htm.
United States Department of Agriculture, Foreign Agricultural Service. Dairy Export Incentive Program (DEIP). Retrieved July 23, 2010, from http://www.fas.usda.gov/excredits/deip/deip-new.asp.
United States Department of Agriculture, Foreign Agricultural Service. USDA announces 2008–2009 allocations for Dairy Export Incentive Program. Retrieved July 26, 2010, from http://www.fas.usda.gov/scriptsw/PressRelease/pressrel_dout.asp?Entry=valid&PrNum=0081-09
United States—Measures Affecting Imports of Certain Passenger Vehicle and Light Truck Tyres from China. Retrieved July 30, 2010, from http://www.wto.org/english/tratop_e/dispu_e/cases_e/ds399_e.htm
United States—Measures Relating to Shrimp from Thailand. Retrieved July 30, 2010, from http://www.wto.org/english/tratop_e/dispu_e/cases_e/ds343_e.htm.
United States of America: Buy American provisions and set-asides in the Fiscal Year 2010 defense appropriations bill. Retrieved June 8, 2010, from http://www.globaltradealert.org/measure/united-states-america-buy-american-provisions-and-set-asides-fiscal-year-2010-defense-approp.
United States of America: Buy American provisions for Amtrak. Retrieved June 8, 2010, from http://www.globaltradealert.org/measure/united-states-america-buy-american-provisions-amtrak.
United States of America: Buy American provisions in school construction bill. Retrieved June 8, 2010, from http://www.globaltradealert.org/measure/united-states-america-buy-american-provisions-school-construction-bill.
United States of America: Buy American provisions in stimulus package. Retrieved June 8, 2010, from http://www.globaltradealert.org/measure/united-states-america-buy-american-provisions-stimulus-package.
United States of America: Dairy Export Incentive Program. Retrieved June 8, 2010, from http://www.globaltradealert.org/measure/united-states-america-dairy-export-incentive-program.
United States of America: Employ American Workers Act. Retrieved June 8, 2010, from http://www.globaltradealert.org/measure/united-states-america-employ-american-workers-act.
United States of America: Expanded Buy American Provisions for Public Projects. Retrieved June 8, 2010, from http://www.globaltradealert.org/measure/united-states-america-expanded-buy-american-provisions-public-projects.
United States of America: Subsidies and Buy American provisions for electric cars and batteries. Retrieved June 8, 2010, from http://www.globaltradealert.org/measure/united-states-america-subsidies-and-buy-american-provisions-electric-cars-and-batteries.
United States of America: Support for General Motors and Chrysler. Retrieved June 8, 2010, from http://www.globaltradealert.org/measure/united-states-america-support-general-motors-and-chrysler.
43
United States—Preliminary Anti-Dumping and Countervailing Duty Determinations on Coated Free Sheet Paper from China. Retrieved July 30, 2010, from http://www.wto.org/english/tratop_e/dispu_e/cases_e/ds368_e.htm.
United States—Provisional Anti-Dumping Measures on Shrimp from Thailand. Retrieved July 30, 2010, from http://www.wto.org/english/tratop_e/dispu_e/cases_e/ds324_e.htm.
US Customs and Border Protection “Top IPR Seizures 2009.” Retrieved July 26, 2010, from
http://www.cbp.gov/linkhandler/cgov/trade/priority_trade/ipr/pubs/seizure/fy09_stats.ctt/fy09_stats.pdf.
Copyright © 2010 by the Peterson Institute for International Economics. All rights reserved. No part of this working paper may be reproduced or utilized in any form or by any means, electronic or mechanical, including
photocopying, recording, or by information storage or retrieval system, without permission from the Institute.

44
figure 1 30 years of uS merchandise trade with china, 1979–2009
-
$ 50,000
$ 100,000
$ 150,000
$ 200,000
$ 250,000
$ 300,000
$ 350,000
1979 1984 1989 1994 1999 2004 2009
Mill
ions
US ExportsUS Imports
Source: UN Comtrade.
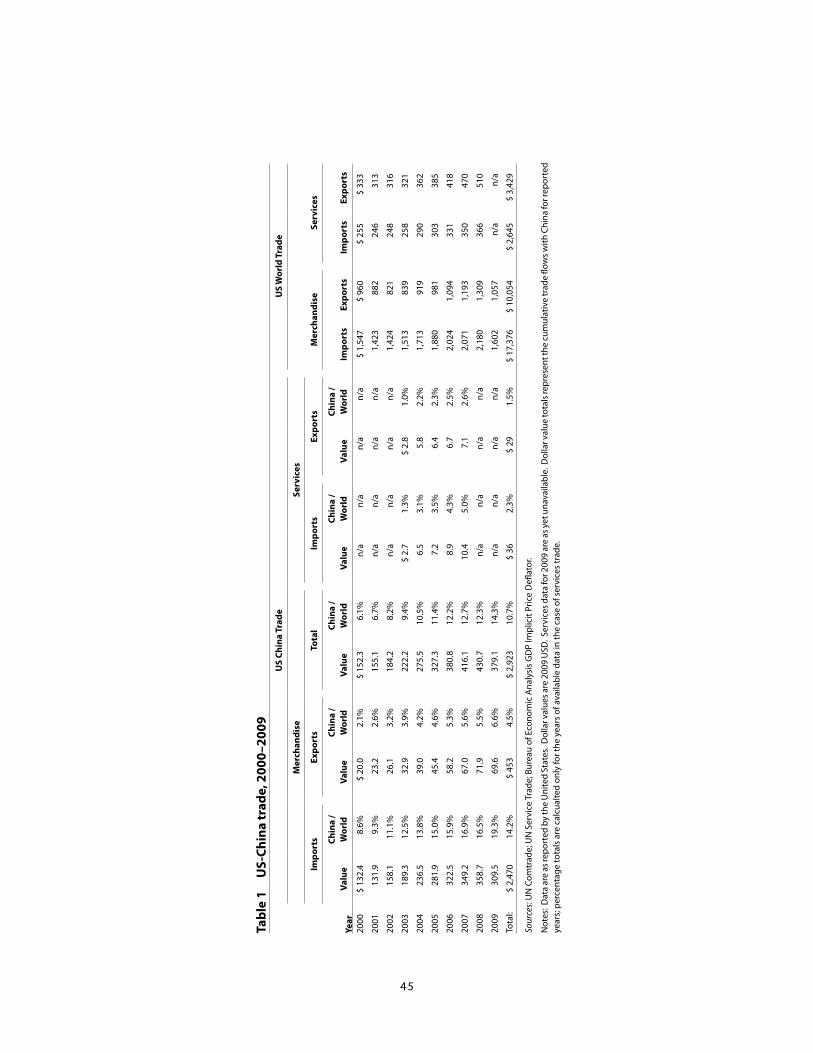
45
tabl
e 1
u
S-ch
ina
trad
e, 2
000–
2009
uS
chin
a tr
ade
u
S W
orld
tra
de
mer
chan
dise
Ser v
ices
mer
chan
dise
Serv
ices
Im
port
sex
port
sto
tal
Impo
rts
expo
rts
year
Valu
ech
ina
/ W
orld
Valu
ech
ina
/ W
orld
Valu
ech
ina
/ W
orld
Valu
ech
ina
/ W
orld
Valu
ech
ina
/ W
orld
Impo
rts
expo
rts
Impo
rts
expo
rts
2000
$ 13
2.4
8.6%
$ 20
.0
2.1%
$ 15
2.3
6.1%
n/a
n
/a
n/a
n
/a
$ 1,
547
$ 96
0 $
255
$ 33
3
2001
131
.9
9.3%
23.
2 2.
6% 1
55.1
6.
7% n
/a
n/a
n
/a
n/a
1
,423
8
82
246
3
13
2002
158
.1
11.1
% 2
6.1
3.2%
184
.2
8.2%
n/a
n
/a
n/a
n
/a
1,4
24
821
2
48
316
2003
189
.3
12.5
% 3
2.9
3.9%
222
.2
9.4%
$ 2.
7 1.
3%$
2.8
1.0%
1,5
13
839
2
58
321
2004
236
.5
13.8
% 3
9.0
4.2%
275
.5
10.5
% 6
.5
3.1%
5.8
2.
2% 1
,713
9
19
290
3
62
2005
281
.9
15.0
% 4
5.4
4.6%
327
.3
11.4
% 7
.2
3.5%
6.4
2.
3% 1
,880
9
81
303
3
85
2006
322
.5
15.9
% 5
8.2
5.3%
380
.8
12.2
% 8
.9
4.3%
6.7
2.
5% 2
,024
1
,094
3
31
418
2007
349
.2
16.9
% 6
7.0
5.6%
416
.1
12.7
% 1
0.4
5.0%
7.1
2.
6% 2
,071
1
,193
3
50
470
2008
358
.7
16.5
% 7
1.9
5.5%
430
.7
12.3
% n
/a
n/a
n
/a
n/a
2
,180
1
,309
3
66
510
2009
309
.5
19.3
% 6
9.6
6.6%
379
.1
14.3
% n
/a
n/a
n
/a
n/a
1
,602
1
,057
n
/a
n/a
Tota
l:$
2,47
0 14
.2%
$ 45
3 4.
5%$
2,92
3 10
.7%
$ 36
2.
3%$
29
1.5%
$ 17
,376
$
10,0
54
$ 2,
645
$ 3,
429
Sour
ces:
UN
Com
trad
e; U
N S
ervi
ce T
rade
; Bur
eau
of E
cono
mic
Ana
lysi
s G
DP
Impl
icit
Pric
e D
eflat
or.
Not
es: D
ata
are
as re
port
ed b
y th
e U
nite
d St
ates
. Dol
lar v
alue
s are
200
9 U
SD. S
ervi
ces d
ata
for 2
009
are
as y
et u
nava
ilabl
e. D
olla
r val
ue to
tals
repr
esen
t the
cum
ulat
ive
trad
e flo
ws w
ith C
hina
for r
epor
ted
year
s; p
erce
ntag
e to
tals
are
cal
cual
ted
only
for t
he y
ears
of a
vaila
ble
data
in th
e ca
se o
f ser
vice
s tr
ade.
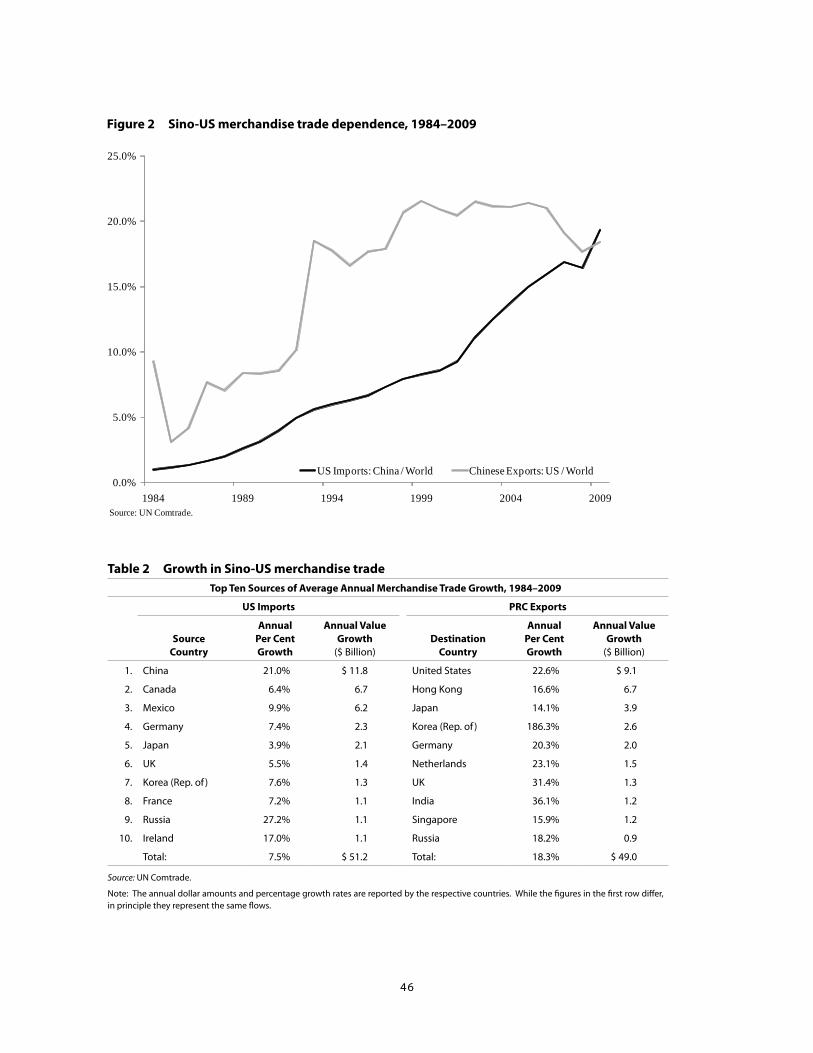
46
figure 2 Sino-uS merchandise trade dependence, 1984–2009
0.0%
5.0%
10.0%
15.0%
20.0%
25.0%
1984 1989 1994 1999 2004 2009
US Imports: China / World Chinese Exports: US / World
Source: UN Comtrade.
table 2 Growth in Sino-uS merchandise tradetop ten Sources of Average Annual merchandise trade Growth, 1984–2009
uS Imports Prc exports
Source country
Annual Per cent Growth
Annual Value Growth
($ Billion)destination
country
Annual Per cent Growth
Annual Value Growth
($ Billion)
1. China 21.0% $ 11.8 United States 22.6% $ 9.1
2. Canada 6.4% 6.7 Hong Kong 16.6% 6.7
3. Mexico 9.9% 6.2 Japan 14.1% 3.9
4. Germany 7.4% 2.3 Korea (Rep. of ) 186.3% 2.6
5. Japan 3.9% 2.1 Germany 20.3% 2.0
6. UK 5.5% 1.4 Netherlands 23.1% 1.5
7. Korea (Rep. of ) 7.6% 1.3 UK 31.4% 1.3
8. France 7.2% 1.1 India 36.1% 1.2
9. Russia 27.2% 1.1 Singapore 15.9% 1.2
10. Ireland 17.0% 1.1 Russia 18.2% 0.9
Total: 7.5% $ 51.2 Total: 18.3% $ 49.0
Source: UN Comtrade.
Note: The annual dollar amounts and percentage growth rates are reported by the respective countries. While the figures in the first row differ, in principle they represent the same flows.
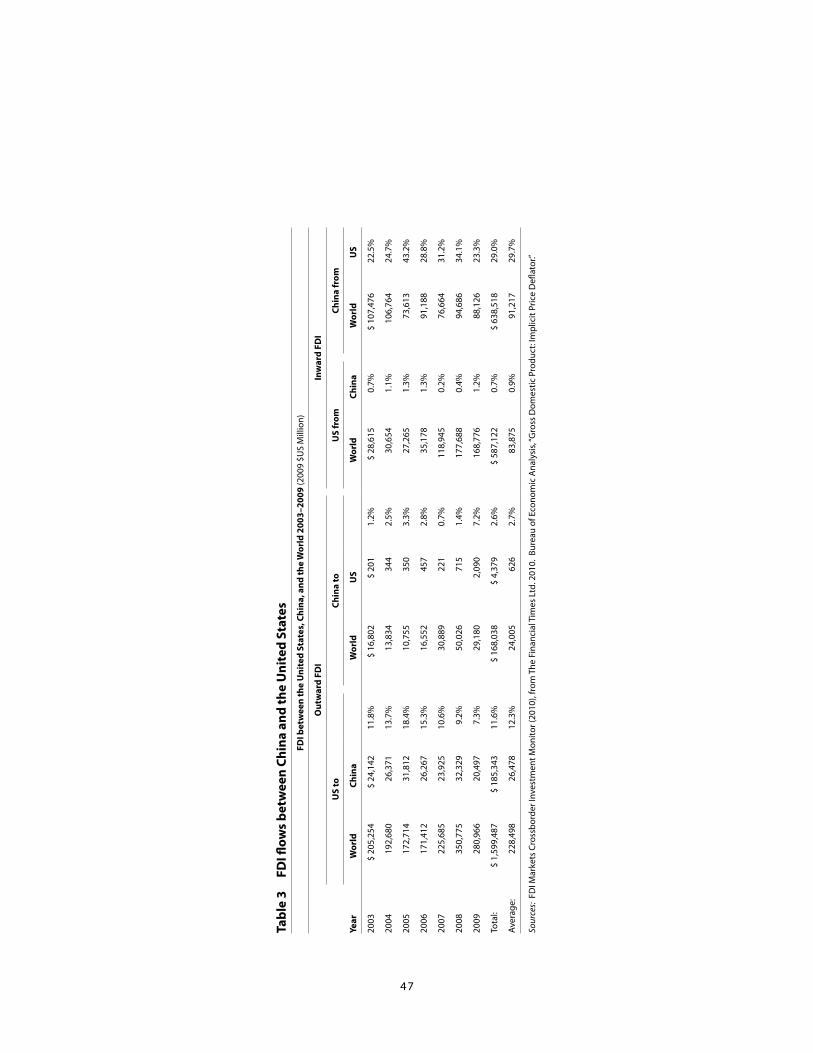
47
tabl
e 3
fd
I flow
s be
twee
n ch
ina
and
the
uni
ted
Stat
esfd
I bet
wee
n th
e u
nite
d St
ates
, chi
na, a
nd th
e W
orld
200
3–20
09 (2
009
$US
Mill
ion)
out
war
d fd
I
Inw
ard
fdI
uS
toch
ina
to
uS
from
chin
a fr
om
year
Wor
ldch
ina
Wor
ldu
S
Wor
ldch
ina
Wor
ldu
S
2003
$ 20
5,25
4 $
24,1
42
11.8
%$
16,8
02
$ 20
1 1.
2%$
28,6
15
0.7%
$ 10
7,47
6 22
.5%
2004
192
,680
2
6,37
1 13
.7%
13,
834
344
2.
5% 3
0,65
4 1.
1% 1
06,7
64
24.7
%
2005
172
,714
3
1,81
2 18
.4%
10,
755
350
3.
3% 2
7,26
5 1.
3% 7
3,61
3 43
.2%
2006
171
,412
2
6,26
7 15
.3%
16,
552
457
2.
8% 3
5,17
8 1.
3% 9
1,18
8 28
.8%
2007
225
,685
2
3,92
5 10
.6%
30,
889
221
0.
7% 1
18,9
45
0.2%
76,
664
31.2
%
2008
350
,775
3
2,32
9 9.
2% 5
0,02
6 7
15
1.4%
177
,688
0.
4% 9
4,68
6 34
.1%
2009
280
,966
2
0,49
7 7.
3% 2
9,18
0 2
,090
7.
2% 1
68,7
76
1.2%
88,
126
23.3
%
Tota
l:$
1,59
9,48
7 $
185,
343
11.6
%$
168,
038
$ 4,
379
2.6%
$ 58
7,12
2 0.
7%$
638,
518
29.0
%
Aver
age:
228
,498
2
6,47
8 12
.3%
24,
005
626
2.
7% 8
3,87
5 0.
9% 9
1,21
7 29
.7%
Sour
ces:
FD
I Mar
kets
Cro
ssbo
rder
Inve
stm
ent M
onito
r (20
10),
from
The
Fin
anci
al T
imes
Ltd
. 201
0. B
urea
u of
Eco
nom
ic A
naly
sis,
“Gro
ss D
omes
tic P
rodu
ct: I
mpl
icit
Pric
e D
eflat
or.”

48
figure 3 uS major news articles on the uS trade deficit with china, 1987–2010
0
10
20
30
40
50
60
Source: Dow Jones Factiva.Note: Count for 2010 is estimated by doubling the figure through June 30, 2010.
figure 4 Percent of uS public with an unfavorable opinion of china
-
10.0
20.0
30.0
40.0
50.0
60.0
1991 1992 1993 1994 1995 1996 1997 1998 1999 2000 2001 2002 2003 2004 2005 2006 2007 2008
Very Unfavourable Mostly Unfavourable
Source: Gallup opinion polls provided by www.WorldPublicOpinion.org

49
tabl
e 4
W
to d
SB c
onsu
ltat
ions
invo
lvin
g th
e u
nite
d St
ates
, 200
2–10
cons
ulta
tion
s re
ques
ted
by t
he u
nite
d St
ates
resp
onde
nt20
0220
0320
0420
0520
0620
0720
0820
0920
10A
ll
cum
ulat
ive
two-
way
tr
ade
flow
($
US
Billi
on)
dis
pute
s Pe
r $u
S tr
illio
n tr
ade
flow
1.Ch
ina
11
32
18
2,4
67
3.2
2.Eu
rope
an C
omm
uniti
es1
12
11
17
4,1
06
1.7
3.M
exic
o1
12
2,3
93
0.8
4.Ca
nada
11
2 3
,861
0
.5
5.Ph
ilipp
ines
11
136
7
.4
6.Ve
nezu
ela
11
316
3
.2
7.Tu
rkey
11
82
12.
2
8.Ja
pan
11
1,5
18
0.7
9.Eg
ypt
11
49
20.
6
10.
Indi
a1
1 2
46
4.1
ALL
:4
34
13
43
21
25 2
1,16
8 1
.2
cons
ulta
tion
s re
ques
ted
wit
h th
e u
nite
d St
ates
com
plai
nant
2002
2003
2004
2005
2006
2007
2008
2009
2010
All
c um
ulat
ive
two-
way
tr
ade
flow
($
US
Billi
on)
dis
pute
s Pe
r $u
S tr
illio
n tr
ade
flow
1.Eu
rope
an C
omm
uniti
es2
13
11
8 4
,106
1
.9
2.Ca
nada
42
11
8 3
,861
2
.1
3.M
exic
o3
11
27
2,3
93
2.9
4.Br
azil
31
15
349
1
4.3
5.Ch
ina
11
12
5 2
,467
2
.0
6.Ko
rea
(Rep
ublic
of)
11
13
587
5
.1
7.Th
aila
nd1
11
3 2
20
13.
6
8.Ja
pan
21
3 1
,518
2
.0
9.A
rgen
tina
11
2 7
1 2
8.4
10.
Indi
a1
12
246
8
.1
11.
Viet
Nam
11
81
12.
3
12.
Switz
erla
nd1
1 2
19
4.6
13.
Nor
way
11
72
13.
9
14.
Chin
ese
Taip
ei1
1 N
/A
N/A
15.
Indo
nesi
a1
1 1
34
7.4
16.
Ant
igua
and
Bar
buda
11
1
738
.4
17.
Ecua
dor
11
65
15.
3
18.
New
Zea
land
11
43
23.
2
ALL
:19
67
35
36
32
54 2
1,16
8 2
.6
Sour
ce: W
TO S
ecre
taria
t (di
sput
es),
IMF
DO
TS (t
rade
flow
s).
Not
es: C
ases
with
mor
e th
an o
ne c
ompl
aina
nt a
re c
ount
ed m
ultip
le ti
mes
(onc
e fo
r eac
h co
mpl
aina
nt).
Dis
pute
dat
a ar
e cu
rren
t to
May
31,
201
0. T
rade
flow
s ar
e as
repo
rted
by
the
Uni
ted
Stat
es fo
r m
erch
andi
se tr
ade
only
and
repr
esen
t the
cum
ulat
ive
two-
way
flow
s bet
wee
n th
e U
nite
d St
ates
and
the
resp
onde
nt/c
ompl
aina
nt fo
r the
yea
rs 2
002-
2009
. N
o co
nsul
tatio
ns w
ere
soug
ht in
volv
ing
Chin
a in
200
1 (it
acc
eded
Dec
embe
r 11,
200
1). I
MF
DO
TS tr
ade
data
are
una
vaila
ble
for C
hine
se Ta
ipei
. Tra
de fl
ows i
n th
e “A
LL” r
ow a
re c
umul
ativ
e flo
ws w
ith th
e w
orld
. Tra
de fl
ows a
re a
s rep
orte
d by
the
Uni
ted
Stat
es.
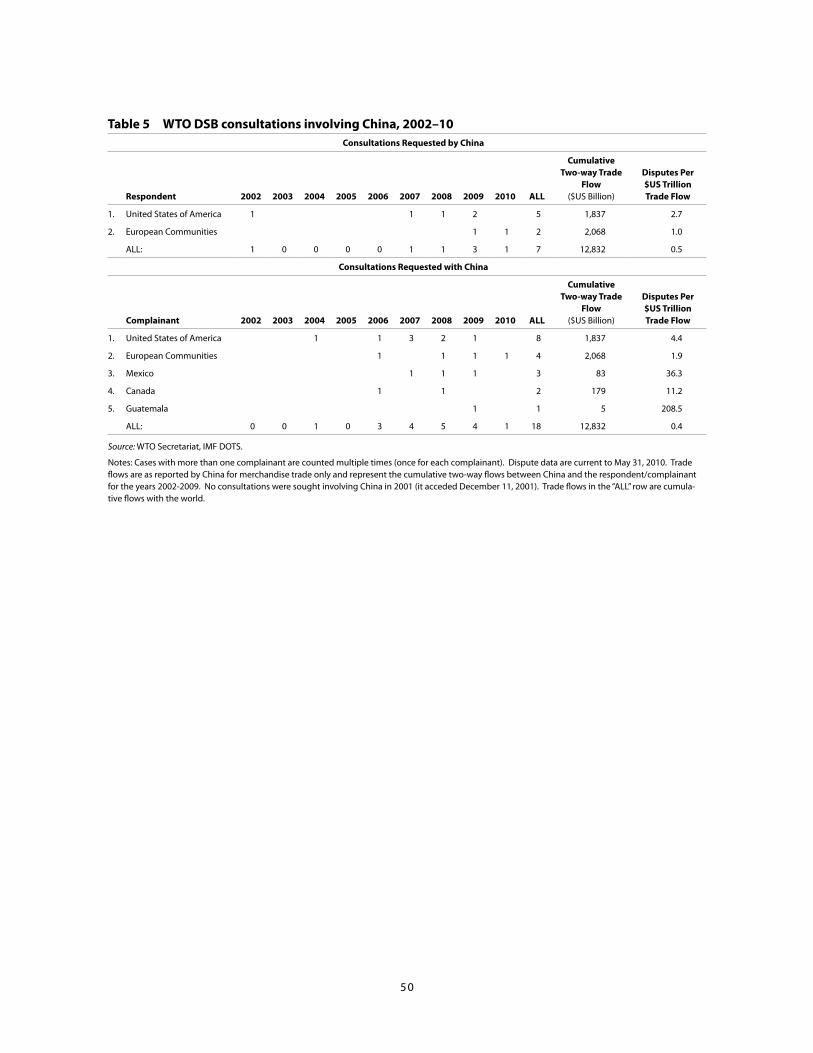
50
table 5 Wto dSB consultations involving china, 2002–10 consultations requested by china
respondent 2002 2003 2004 2005 2006 2007 2008 2009 2010 All
cumulative two-way trade
flow ($US Billion)
disputes Per $uS trillion trade flow
1. United States of America 1 1 1 2 5 1,837 2.7
2. European Communities 1 1 2 2,068 1.0
ALL: 1 0 0 0 0 1 1 3 1 7 12,832 0.5
consultations requested with china
complainant 2002 2003 2004 2005 2006 2007 2008 2009 2010 All
cumulative two-way trade
flow ($US Billion)
disputes Per $uS trillion trade flow
1. United States of America 1 1 3 2 1 8 1,837 4.4
2. European Communities 1 1 1 1 4 2,068 1.9
3. Mexico 1 1 1 3 83 36.3
4. Canada 1 1 2 179 11.2
5. Guatemala 1 1 5 208.5
ALL: 0 0 1 0 3 4 5 4 1 18 12,832 0.4
Source: WTO Secretariat, IMF DOTS.
Notes: Cases with more than one complainant are counted multiple times (once for each complainant). Dispute data are current to May 31, 2010. Trade flows are as reported by China for merchandise trade only and represent the cumulative two-way flows between China and the respondent/complainant for the years 2002-2009. No consultations were sought involving China in 2001 (it acceded December 11, 2001). Trade flows in the “ALL” row are cumula-tive flows with the world.
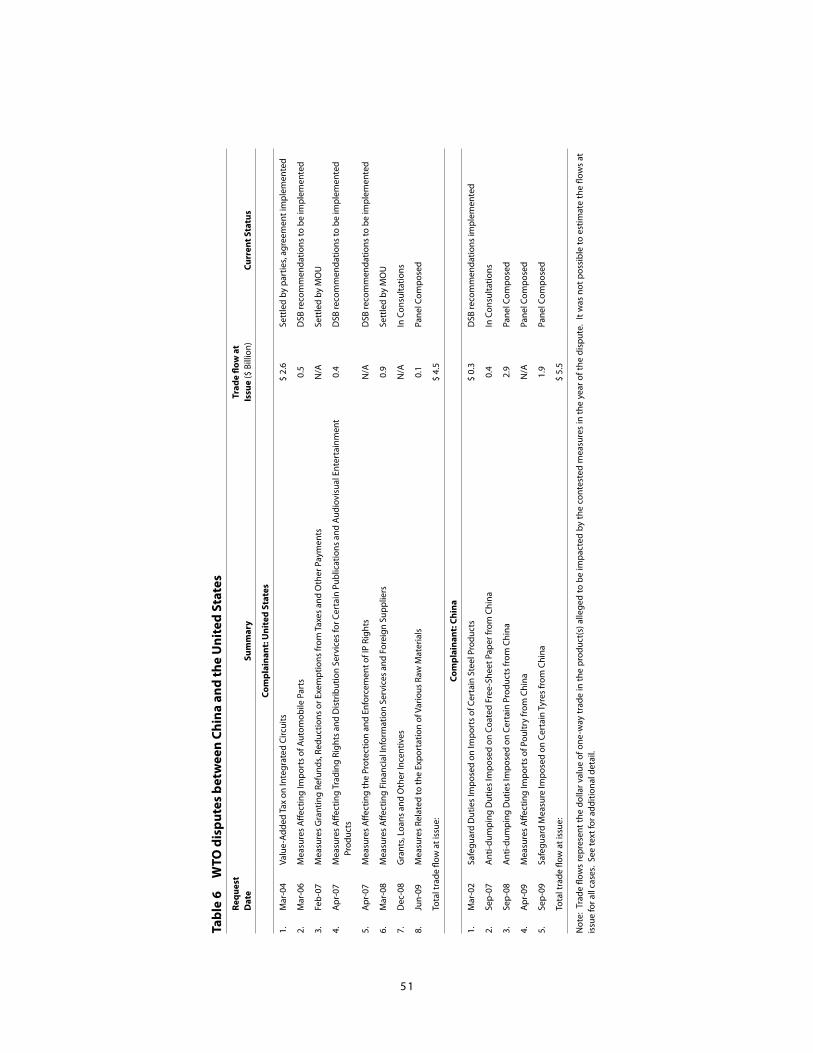
51
tabl
e 6
W
to d
ispu
tes
betw
een
chin
a an
d th
e u
nite
d St
ates
requ
est
dat
eSu
mm
ary
trad
e flo
w a
t Is
sue
($ B
illio
n)cu
rren
t Sta
tus
com
plai
nant
: uni
ted
Stat
es
1.M
ar-0
4Va
lue-
Adde
d Ta
x on
Inte
grat
ed C
ircui
ts
$ 2.
6Se
ttle
d by
par
ties,
agre
emen
t im
plem
ente
d
2.M
ar-0
6M
easu
res
Affe
ctin
g Im
port
s of
Aut
omob
ile P
arts
0.
5D
SB re
com
men
datio
ns to
be
impl
emen
ted
3.Fe
b-07
Mea
sure
s G
rant
ing
Refu
nds,
Redu
ctio
ns o
r Exe
mpt
ions
from
Tax
es a
nd O
ther
Pay
men
ts
N/A
Sett
led
by M
OU
4.A
pr-0
7M
easu
res
Affe
ctin
g Tr
adin
g Ri
ghts
and
Dis
trib
utio
n Se
rvic
es fo
r Cer
tain
Pub
licat
ions
and
Aud
iovi
sual
Ent
erta
inm
ent
Prod
ucts
0.
4D
SB re
com
men
datio
ns to
be
impl
emen
ted
5.A
pr-0
7M
easu
res
Affe
ctin
g th
e Pr
otec
tion
and
Enfo
rcem
ent o
f IP
Righ
ts
N/A
DSB
reco
mm
enda
tions
to b
e im
plem
ente
d
6.M
ar-0
8M
easu
res
Affe
ctin
g Fi
nanc
ial I
nfor
mat
ion
Serv
ices
and
For
eign
Sup
plie
rs0.
9Se
ttle
d by
MO
U
7.D
ec-0
8G
rant
s, Lo
ans
and
Oth
er In
cent
ives
N
/AIn
Con
sulta
tions
8.Ju
n-09
Mea
sure
s Re
late
d to
the
Expo
rtat
ion
of V
ario
us R
aw M
ater
ials
0.
1Pa
nel C
ompo
sed
Tota
l tra
de fl
ow a
t iss
ue:
$ 4.
5
com
plai
nant
: chi
na
1.M
ar-0
2Sa
fegu
ard
Dut
ies
Impo
sed
on Im
port
s of
Cer
tain
Ste
el P
rodu
cts
$ 0.
3D
SB re
com
men
datio
ns im
plem
ente
d
2.Se
p-07
Ant
i-dum
ping
Dut
ies
Impo
sed
on C
oate
d Fr
ee-S
heet
Pap
er fr
om C
hina
0.4
In C
onsu
ltatio
ns
3.Se
p-08
Ant
i-dum
ping
Dut
ies
Impo
sed
on C
erta
in P
rodu
cts
from
Chi
na2.
9Pa
nel C
ompo
sed
4.A
pr-0
9M
easu
res
Affe
ctin
g Im
port
s of
Pou
ltry
from
Chi
naN
/APa
nel C
ompo
sed
5.Se
p-09
Safe
guar
d M
easu
re Im
pose
d on
Cer
tain
Tyr
es fr
om C
hina
1.9
Pane
l Com
pose
d
Tota
l tra
de fl
ow a
t iss
ue:
$ 5.
5
Not
e: T
rade
flow
s re
pres
ent t
he d
olla
r val
ue o
f one
-way
trad
e in
the
prod
uct(
s) a
llege
d to
be
impa
cted
by
the
cont
este
d m
easu
res
in th
e ye
ar o
f the
dis
pute
. It
was
not
pos
sibl
e to
est
imat
e th
e flo
ws
at
issu
e fo
r all
case
s. S
ee te
xt fo
r add
ition
al d
etai
l.

52
table 7 Sino-uS trade flows in certain productsSummary of Sino-uS trade flows in Steel, tyres, Pipe and
Woven Sacks in 2008 ($US Million)
uS Imports Prc exports
Product china World Share uS World Share
Steel Pipe $ 103 $ 722 14.3% $ 107 $ 594 18.0%
Off-The-Road Tyres 2,728 9,974 27.4% 2,468 8,060 30.6%
Rectangular Pipe and Tube 5 724 0.7% 3 317 1.0%
Woven Sacks 84 206 40.7% 117 813 14.4%
Total: $ 2,920 $ 11,626 25.1% $ 2,694 $ 9,784 27.5%
Source: UN Comtrade.
Notes: US imports are as reported by the United States. PRC exports are as reported by China. China and US columns do not agree, but in principle represent the same trade flows.
table 8 uS antidumping casesuS Anti-dumping Investigations resulting in Imposed duties, 2002–2010
Annual overall
respondent location 2002 2003 2004 2005 2006 2007 2008 2009 2010 2002–2010Per cent of All Investigations
China 8 7 6 3 3 12 10 11 1 61 85.9%
Korea (Rep. of ) 1 2 1 1 1 2 1 - - 9 90.0%
India - 2 2 1 - 1 2 - - 8 57.1%
Japan 1 3 1 2 - 1 - - - 8 88.9%
Mexico - 2 2 - 1 1 - 2 - 8 100.0%
All Other 7 13 13 2 2 10 3 5 - 55 74.3%
Total: 17 29 25 9 7 27 16 18 1 149 77.6%
Total (Ex. China): 9 22 19 6 4 15 6 7 - 88 76.5%
Source: Bown, Chad P. (2010) "Global Antidumping Database,” available at http://econ.worldbank.org/ttbd/gad/

53
table 9 Summary of uS antidumping duty trade coverageuS Anti-dumping duty coverage of Imports from china ($US Million and percent of trade flow)
code description 2002 2003 2004 2005 2006 2007 2008 2009 Average
01-24 Agricultural Products $ 352 $ 556 $ 461 $ 267 $ 415 $ 247 $ 267 $ 245 $ 351
17.2% 20.9% 14.6% 7.3% 8.9% 4.6% 4.4% 4.7% 10.4%
25-38 Chemical and Mineral Products
349 409 1,092 925 1,011 734 2,022 769 914
10.8% 10.3% 19.7% 13.5% 12.3% 8.7% 15.2% 8.9% 12.4%
39-49 Plastics, Rubbers, Wood 977 1,285 1,704 2,319 2,670 2,919 2,489 1,930 2,037
7.6% 8.5% 9.1% 10.2% 10.3% 10.2% 8.4% 7.7% 9.0%
50-67 Textiles, Footwear, and Headgear
25 50 78 176 210 195 263 172 146
0.1% 0.2% 0.3% 0.4% 0.5% 0.4% 0.5% 0.4% 0.3%
68-83 Stone, Glass, and Metals 1,555 1,908 2,632 3,701 4,768 5,703 7,154 2,704 3,766
14.8% 15.2% 15.5% 17.4% 17.3% 18.7% 21.3% 11.9% 16.5%
84-85 Machinery and/or Electrical 1,372 1,828 2,531 4,239 6,606 3,086 3,434 2,735 3,229
3.0% 3.0% 2.9% 3.9% 5.0% 2.1% 2.3% 2.0% 3.0%
86-89 Transportation 154 217 309 407 477 495 515 392 371
6.8% 7.3% 7.6% 8.0% 7.7% 6.8% 6.8% 6.6% 7.2%
90-97 Miscellaneous 3,955 4,923 5,805 6,736 7,404 7,813 5,207 3,959 5,725
12.4% 13.3% 13.7% 14.0% 14.0% 13.0% 8.6% 7.8% 12.1%
Total: $ 8,740 $ 11,177 $ 14,612 $ 18,770 $ 23,562 $ 21,193 $ 21,350 $ 12,905 $ 16,539
6.5% 6.8% 6.9% 7.2% 7.7% 6.2% 6.0% 4.2% 6.5%
Sources: Bown, Chad P. (2010) “Global Antidumping Database,” available at http://econ.worldbank.org/ttbd/gad/; UN Comtrade.
Notes: Code ranges refer to all 2-digit SITC codes within the indicated range. For example, 01-24 (agricultural products) refers to goods in 2-digit SITC codes starting with 01 and including all subsequent 2-digit codes to 24. Dollar amounts represent the US import trade flows from China for the given trade category covered by an anti-dumping duty in the given year. Anti-dumping duties are assumed to be initially implemented and renewed for five year periods. Categories are analyzed at the 6-digit HS code level and summarized at the 2-digit level. Only categories with AD duties are shown. Per cents represent the fraction of US import trade flow from China in the given category covered by an anti-dumping duty in the given period. Totals are the sum of all import trade flows from China covered by an anti-dumping duty. Total per cents are total import trade flow from China covered by a duty divided by the total import trade flow from China of all goods.

54
table 10 uS countervailing duty cases uS countervailing duty casesuS countervailing duty Investigations resulting in Imposed duties, 2002–2010
Annual overall
respondent location 2002 2003 2004 2005 2006 2007 2008 2009 2010 2002–2010
Per cent of All Investigations
total no. of Investigations
China - - - - 1 7 5 8 - 21 84.0% 25
India - 2 1 1 - - 1 - - 5 55.6% 9
Indonesia - - - 1 1 - - 1 - 3 100.0% 3
All Other 3 - - - 1 - - 2 - 6 46.2%
Canada 2 - - - - - - - - 2 40.0% 5
Korea (Rep. of ) 1 - - - 1 - - - - 2 66.7% 3
Argentina - - - - - - - 1 - 1 100.0% 1
Vietnam - - - - - - - 1 - 1 100.0% 1
Austria - - - - - - - - - - 0.0% 1
Brazil - - - - - - - - - - 0.0% 1
Thailand - - - - - - - - - - 0.0% 1
Total: 3 2 1 2 3 7 6 11 - 35 70.0%
Total (Ex. China):
3 2 1 2 2 - 1 3 - 14 56.0%
Source: Bown, Chad P. (2010) "Global Antidumping Database,” available at http://econ.worldbank.org/ttbd/gad/
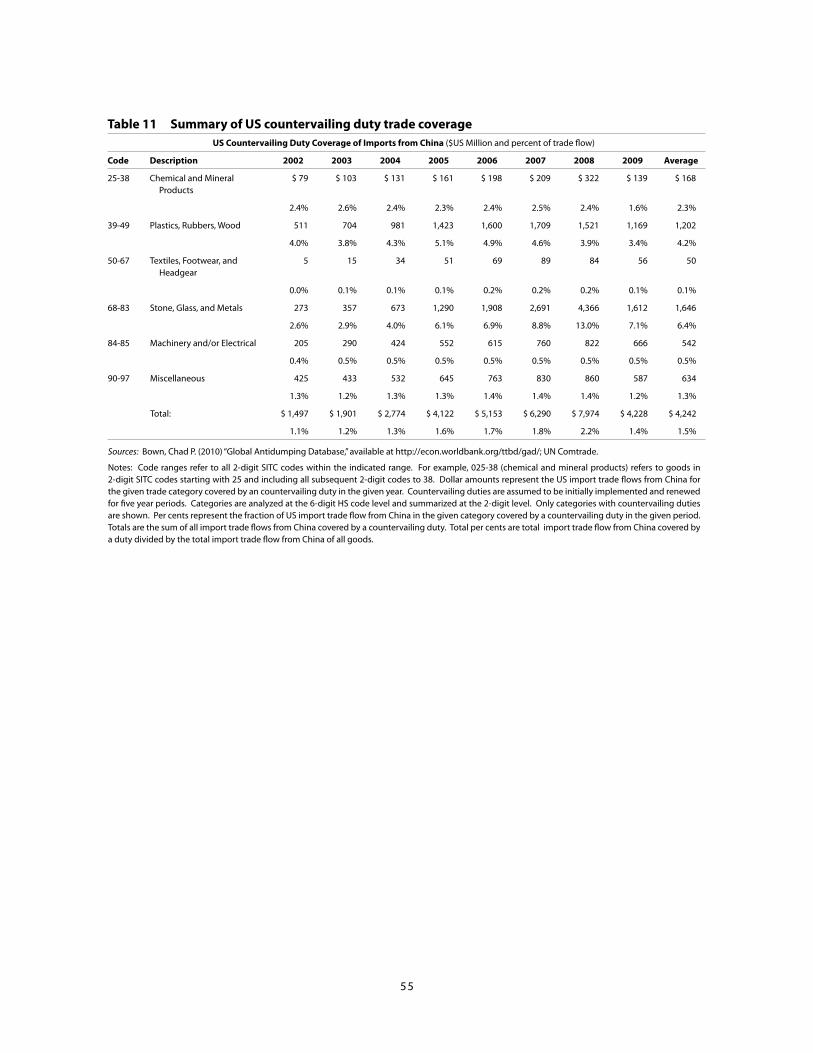
55
table 11 Summary of uS countervailing duty trade coverageuS countervailing duty coverage of Imports from china ($US Million and percent of trade flow)
code description 2002 2003 2004 2005 2006 2007 2008 2009 Average
25-38 Chemical and Mineral Products
$ 79 $ 103 $ 131 $ 161 $ 198 $ 209 $ 322 $ 139 $ 168
2.4% 2.6% 2.4% 2.3% 2.4% 2.5% 2.4% 1.6% 2.3%
39-49 Plastics, Rubbers, Wood 511 704 981 1,423 1,600 1,709 1,521 1,169 1,202
4.0% 3.8% 4.3% 5.1% 4.9% 4.6% 3.9% 3.4% 4.2%
50-67 Textiles, Footwear, and Headgear
5 15 34 51 69 89 84 56 50
0.0% 0.1% 0.1% 0.1% 0.2% 0.2% 0.2% 0.1% 0.1%
68-83 Stone, Glass, and Metals 273 357 673 1,290 1,908 2,691 4,366 1,612 1,646
2.6% 2.9% 4.0% 6.1% 6.9% 8.8% 13.0% 7.1% 6.4%
84-85 Machinery and/or Electrical 205 290 424 552 615 760 822 666 542
0.4% 0.5% 0.5% 0.5% 0.5% 0.5% 0.5% 0.5% 0.5%
90-97 Miscellaneous 425 433 532 645 763 830 860 587 634
1.3% 1.2% 1.3% 1.3% 1.4% 1.4% 1.4% 1.2% 1.3%
Total: $ 1,497 $ 1,901 $ 2,774 $ 4,122 $ 5,153 $ 6,290 $ 7,974 $ 4,228 $ 4,242
1.1% 1.2% 1.3% 1.6% 1.7% 1.8% 2.2% 1.4% 1.5%
Sources: Bown, Chad P. (2010) “Global Antidumping Database,” available at http://econ.worldbank.org/ttbd/gad/; UN Comtrade.
Notes: Code ranges refer to all 2-digit SITC codes within the indicated range. For example, 025-38 (chemical and mineral products) refers to goods in 2-digit SITC codes starting with 25 and including all subsequent 2-digit codes to 38. Dollar amounts represent the US import trade flows from China for the given trade category covered by an countervailing duty in the given year. Countervailing duties are assumed to be initially implemented and renewed for five year periods. Categories are analyzed at the 6-digit HS code level and summarized at the 2-digit level. Only categories with countervailing duties are shown. Per cents represent the fraction of US import trade flow from China in the given category covered by a countervailing duty in the given period. Totals are the sum of all import trade flows from China covered by a countervailing duty. Total per cents are total import trade flow from China covered by a duty divided by the total import trade flow from China of all goods.

56
tabl
e 12
u
S in
telle
ctua
l pro
pert
y–re
late
d un
fair
impo
rt in
vest
igat
ions
Sect
ion
337
Inte
llect
ual P
rope
rty
Inve
stig
atio
ns b
y re
spon
dent
cou
ntry
and
yea
r
Vi
olat
ions
resp
onde
nt
loca
tion
2002
2003
2004
2005
2006
2007
2008
2009
2010
tota
l
Per c
ent
of t
otal
In
vest
igat
ions
cite
d in
co
untr
y -ca
ses
Per n
umbe
r of
com
plet
ed
Inve
stig
atio
ns
1.Ch
ina
5
8
10
8
13
20
14
15
11
104
40
.8%
26
31.3
%
2.Ta
iwan
4
3
7
7
4
5
13
8
9
60
23.5
% 1
3 29
.5%
3.Ja
pan
2
2
4
3
5
6
10
10
6
48
18.8
% 4
11
.1%
4.Ko
rea
(Rep
. of)
1
1
3
5
4
7
9
4
2
36
14.1
% 5
16
.1%
5.H
ong
Kong
5
3
2
1
4
4
5
4
4
32
12.5
% 5
20
.8%
6.Ca
nada
1
4
1
4
2
1
4
5
4
26
10.2
% 5
25
.0%
7.G
erm
any
1
2
2
3
6
3
1
2
- 2
0 7.
8% 5
27
.8%
8.M
exic
o 2
-
2
4
1
1
1
3
2
16
6.3%
1
8.3%
9.Si
ngap
ore
- 2
2
1
1
1
6
1
2
1
6 6.
3% 5
38
.5%
10.
Mal
aysi
a -
2
2
1
1
3
3
- 3
1
5 5.
9% 4
44
.4%
All
Oth
er 4
1
1 1
1 1
0 1
0 1
1 1
7 1
0 4
8
8 34
.5%
26
29.5
%
Tota
l: 1
7 1
8 2
6 2
9 3
3 3
5 4
1 3
1 2
5 2
55
100.
0%
Pend
ing
- 1
-
- 3
1
3
1
4 2
1 4
3 16
.9%
Com
plet
e 1
7 1
7 2
6 2
9 3
0 3
4 3
8 1
7 4
2
12
83.1
% 4
4 20
.8%
Sour
ce: U
S In
tern
atio
nal T
rade
Com
mis
sion
, Offi
ce o
f Unf
air I
mpo
rt In
vest
igat
ions
.
Not
es: C
ount
s by
coun
try
do n
ot su
m to
tota
l. A
sing
le in
vest
igat
ion
will
be
iden
tified
mor
e th
an o
nce
(abo
ve th
e to
tal r
ow) i
f it i
dent
ifies
mul
tiple
resp
onde
nt c
ount
ries.
Onl
y co
untr
ies w
ho a
re re
spon
dent
s in
ten
or m
ore
inve
stig
atio
ns a
re sh
own.
The
row
cou
nts i
n th
e "T
otal
," "P
endi
ng,"
and
"Com
plet
e" ro
ws r
epre
sent
the
num
ber o
f inv
estig
atio
ns
for a
ll co
untr
ies
(sho
wn
and
not
show
n) w
ithou
t do
uble
cou
ntin
g in
vest
igat
ions
that
iden
tify
mor
e th
an o
ne re
spon
dent
cou
ntry
. Vi
olat
ions
are
term
inat
ed in
vest
igat
ions
w
here
a v
iola
tion
was
foun
d an
d/or
a c
ease
and
des
ist o
rder
was
issu
ed a
gain
st th
e re
spon
dent
or a
co-
resp
onde
nt.
The
final
col
umn
indi
cate
s th
e pe
r cen
t of c
ompl
eted
in
vest
igat
ions
aga
inst
the
give
n co
untr
y w
here
a v
iola
tion
was
cite
d. F
or e
xam
ple,
in 2
6 ca
ses a
gain
st C
hina
a v
iola
tion
was
cite
d, th
is is
31.
3 pe
r cen
t of t
he 8
3 ca
ses t
hat h
ave
been
com
plet
ed a
gain
st C
hina
. Ch
ina
has
had
104
inve
stig
atio
ns in
itiat
ed a
gain
st it
, ind
icat
ing
that
(104
- 83
=) 2
1 in
vest
igat
ions
aga
inst
Chi
na a
re p
endi
ng, a
ppro
xim
atel
y ha
lf of
all
pend
ing
inve
stig
atio
ns.
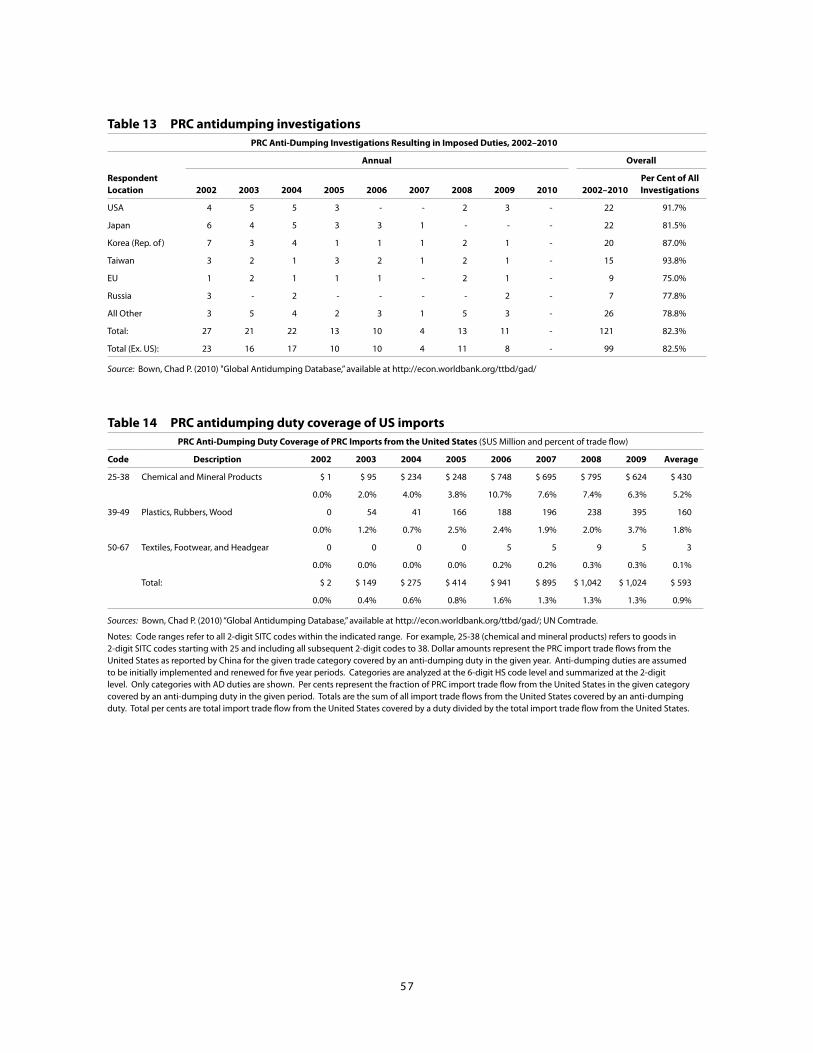
57
table 13 Prc antidumping investigationsPrc Anti-dumping Investigations resulting in Imposed duties, 2002–2010
Annual overall
respondent location 2002 2003 2004 2005 2006 2007 2008 2009 2010 2002–2010
Per cent of All Investigations
USA 4 5 5 3 - - 2 3 - 22 91.7%
Japan 6 4 5 3 3 1 - - - 22 81.5%
Korea (Rep. of ) 7 3 4 1 1 1 2 1 - 20 87.0%
Taiwan 3 2 1 3 2 1 2 1 - 15 93.8%
EU 1 2 1 1 1 - 2 1 - 9 75.0%
Russia 3 - 2 - - - - 2 - 7 77.8%
All Other 3 5 4 2 3 1 5 3 - 26 78.8%
Total: 27 21 22 13 10 4 13 11 - 121 82.3%
Total (Ex. US): 23 16 17 10 10 4 11 8 - 99 82.5%
Source: Bown, Chad P. (2010) "Global Antidumping Database,” available at http://econ.worldbank.org/ttbd/gad/
table 14 Prc antidumping duty coverage of uS importsPrc Anti-dumping duty coverage of Prc Imports from the united States ($US Million and percent of trade flow)
code description 2002 2003 2004 2005 2006 2007 2008 2009 Average
25-38 Chemical and Mineral Products $ 1 $ 95 $ 234 $ 248 $ 748 $ 695 $ 795 $ 624 $ 430
0.0% 2.0% 4.0% 3.8% 10.7% 7.6% 7.4% 6.3% 5.2%
39-49 Plastics, Rubbers, Wood 0 54 41 166 188 196 238 395 160
0.0% 1.2% 0.7% 2.5% 2.4% 1.9% 2.0% 3.7% 1.8%
50-67 Textiles, Footwear, and Headgear 0 0 0 0 5 5 9 5 3
0.0% 0.0% 0.0% 0.0% 0.2% 0.2% 0.3% 0.3% 0.1%
Total: $ 2 $ 149 $ 275 $ 414 $ 941 $ 895 $ 1,042 $ 1,024 $ 593
0.0% 0.4% 0.6% 0.8% 1.6% 1.3% 1.3% 1.3% 0.9%
Sources: Bown, Chad P. (2010) “Global Antidumping Database,” available at http://econ.worldbank.org/ttbd/gad/; UN Comtrade.
Notes: Code ranges refer to all 2-digit SITC codes within the indicated range. For example, 25-38 (chemical and mineral products) refers to goods in 2-digit SITC codes starting with 25 and including all subsequent 2-digit codes to 38. Dollar amounts represent the PRC import trade flows from the United States as reported by China for the given trade category covered by an anti-dumping duty in the given year. Anti-dumping duties are assumed to be initially implemented and renewed for five year periods. Categories are analyzed at the 6-digit HS code level and summarized at the 2-digit level. Only categories with AD duties are shown. Per cents represent the fraction of PRC import trade flow from the United States in the given category covered by an anti-dumping duty in the given period. Totals are the sum of all import trade flows from the United States covered by an anti-dumping duty. Total per cents are total import trade flow from the United States covered by a duty divided by the total import trade flow from the United States.
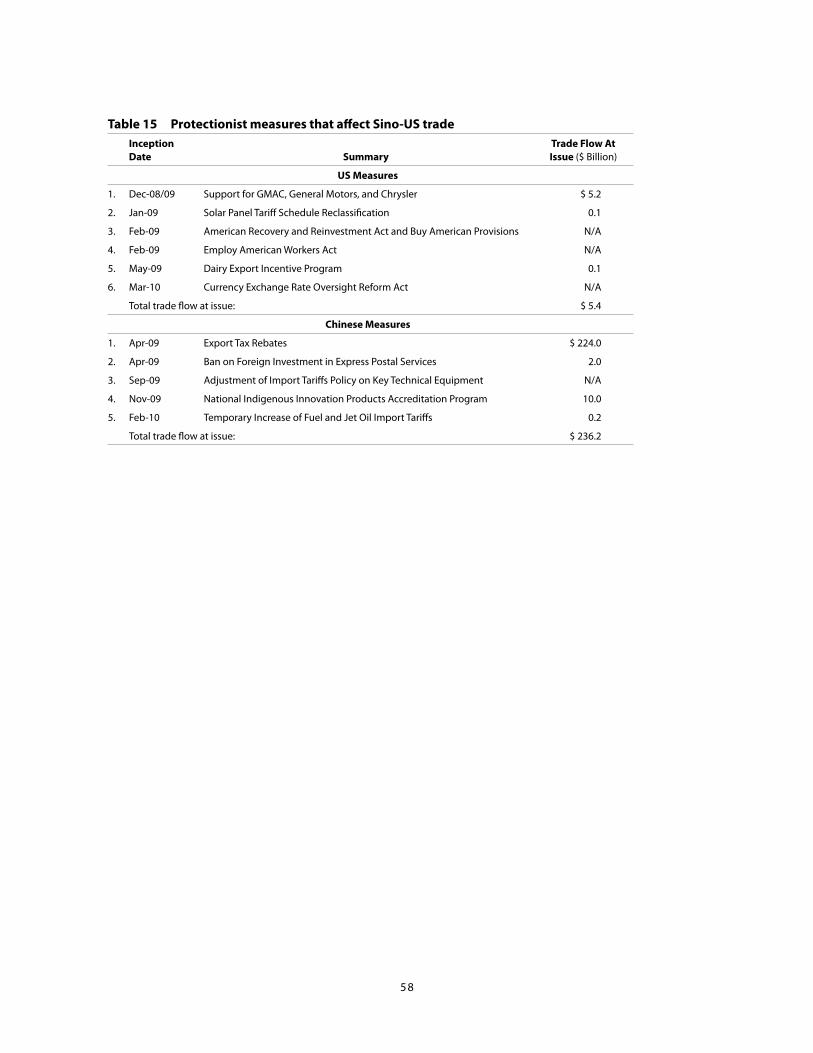
58
table 15 Protectionist measures that affect Sino-uS tradeInception date Summary
trade flow At Issue ($ Billion)
uS measures
1. Dec-08/09 Support for GMAC, General Motors, and Chrysler $ 5.2
2. Jan-09 Solar Panel Tariff Schedule Reclassification 0.1
3. Feb-09 American Recovery and Reinvestment Act and Buy American Provisions N/A
4. Feb-09 Employ American Workers Act N/A
5. May-09 Dairy Export Incentive Program 0.1
6. Mar-10 Currency Exchange Rate Oversight Reform Act N/A
Total trade flow at issue: $ 5.4
chinese measures
1. Apr-09 Export Tax Rebates $ 224.0
2. Apr-09 Ban on Foreign Investment in Express Postal Services 2.0
3. Sep-09 Adjustment of Import Tariffs Policy on Key Technical Equipment N/A
4. Nov-09 National Indigenous Innovation Products Accreditation Program 10.0
5. Feb-10 Temporary Increase of Fuel and Jet Oil Import Tariffs 0.2
Total trade flow at issue: $ 236.2